Embed Size (px)
Citation preview

DEPARTMENT OF POLITICAL SCIENCEUNIVERSITY OF GHANA, LEGON
ANALYSIS OF THE PRE-2020 GENERAL ELECTIONS SURVEY

PRESENTATION OUTLINE
• ELECTORAL BACKGROUND OF RESPONDENTS
• ELECTION 2016 REVISITED
• TOWARDS ELECTION 2020 – VOTER INTENTION
• TOWARDS ELECTION 2020 – POLICY ASSESSMENT
• TOWARDS ELECTION 2020 – MANIFESTOS
• TOWARDS ELECTION 2020 – ELECTION MANAGEMENT
• TOWARDS ELECTION 2020 – ON PEACEFUL ELECTIONS
• TOWARDS ELECTION 2020 – COVID-19 MANAGEMENT
• TOWARDS ELECTION 2020 – PARLIAMENTARY ELECTIONS
• TOWARDS ELECTION 2020 – PRESIDENTIAL ELECTIONS

VOTING HISTORY OF RESPONDENTS

Voting History of Respondents
• All the respondents are registered Ghanaian voters
• Since returning to democracy in 1992, Ghanaians have showed keen interest in the elections.
• Many of the citizens have become regular voters and have visited the polls in all the elections.
• For instance 73.8% have voted in the elections organized by the EC since 2012. Only a minority 26.2% have registered but refused to visit the polls to cast their ballots.

Voting History of Respondents (Cont’d)
• A majority of these voters who cast their ballots in the 2012 general elections endorsed the NDC presidential and parliamentary candidates (See Table 3).
• A little over half (51.3%) cast their ballots for the NDC while a minority 47.1% backed the NPP in the election.

Voting History of Respondents (Cont’d)
• However, there was a dramatic change of minds in the 2016 general elections.
• Of the 81.5% that voted in the elections, 54.2% cast their ballots in favour of the NPP.
• In other words, the NPP presidential candidate in the 2016 elections received 55.1% of popular support while that of the NDC obtained 43.1%

Voting History of Respondents (Cont’d)
• Having attachments to parties are a good signal for democratic development – it facilitates voter mobilization and therefore increase voter turnouts – and the assurance that voters will fan the democratic flame every four years.
• It is therefore assuring that a majority of Ghanaians (56%) have developed strong attachments to political parties in the country since 1992 (See Table 1)

Table 1. Do you feel strongly attached to a political party?
Frequency Percent Valid Percent
Cumulative Percent
Valid
Yes 6695 56.0 56.0 56.0
No 4066 34.0 34.0 90.1
Somehow 1188 9.9 9.9 100.0
Total 11949 100.0 100.0

• Most voters have been attracted to the NPP and the NDC. But not all of them have stayed with the party in all the elections – some, a minority have detached from their parties in some of the elections .
• Nevertheless, for those who have been clued to their parties, a whopping 89.7% are ready to vote for their daring parties (see Table 2)

Table2: Will you continue to to vote for the party you are affiliated
Frequency Percent Valid Percent Cumulative Percent
Valid
Yes 6008 50.3 89.7 89.7
No 224 1.9 3.3 93.1
May be 465 3.9 6.9 100.0
Total 6697 56.0 100.0
Missing System 5252 44.0
Total 11949 100.0

2016 ELECTIONS REVISITED
2016 Elections Revisited
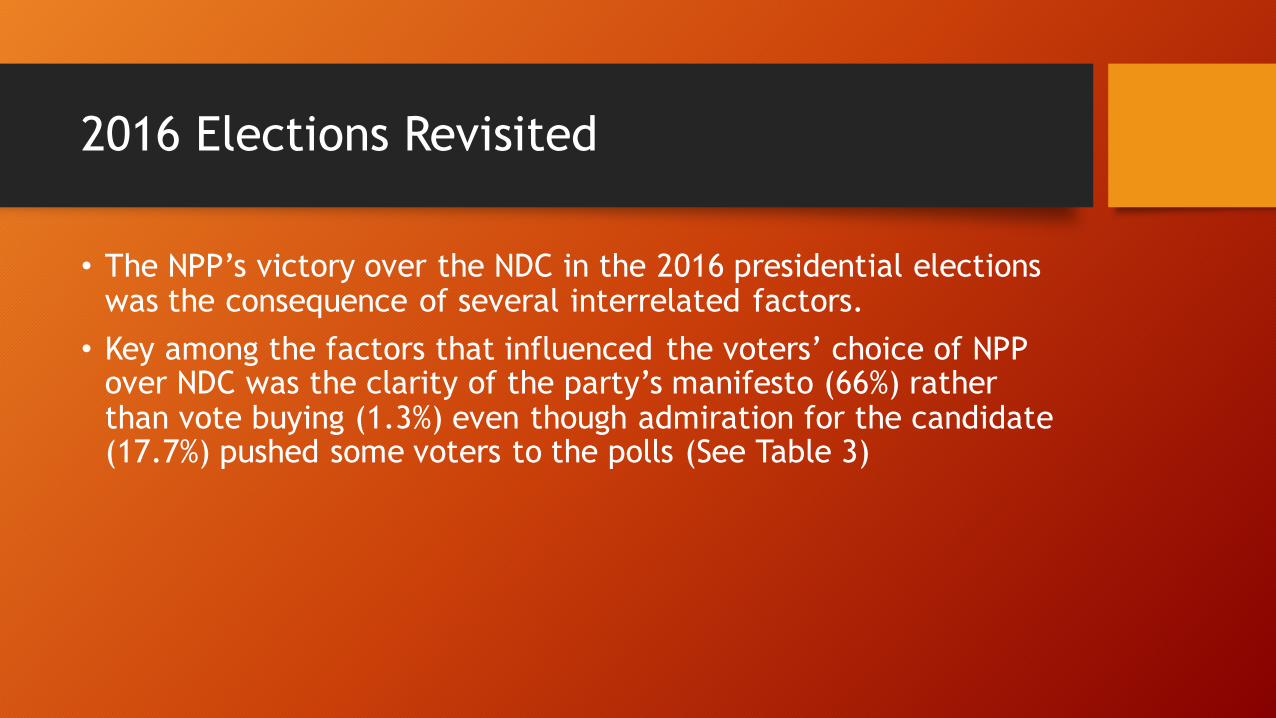
• The NPP’s victory over the NDC in the 2016 presidential elections was the consequence of several interrelated factors.
• Key among the factors that influenced the voters’ choice of NPP over NDC was the clarity of the party’s manifesto (66%) rather than vote buying (1.3%) even though admiration for the candidate (17.7%) pushed some voters to the polls (See Table 3)

Table3: Why did you vote for the party in 2016?
Frequency Percent Valid Percent Cumulative Percent
Valid
Admired the presidential
candidate1727 14.5 17.7 17.7
Liked the party
program/manifesto6444 53.9 66.0 83.7
I received financial inducement 130 1.1 1.3 85.0
I just voted 424 3.5 4.3 89.4
It is the party of my
tribesmen/women805 6.7 8.2 97.6
Others 234 2.0 2.4 100.0
Total 9764 81.7 100.0
Missing System 2185 18.3
Total 11949 100.0

• These voters may withdraw their support for the party they voted for in previous elections if they feel regretted due to changing circumstances.
• However, for those who voted for the NPP in the 2016 election, a majority (77.6%) have not regretted even though 19.4% seem to have regretted making the decision to choose him as President (See Table 4).

Frequency Percent Valid Percent Cumulative Percent
Valid
Yes 1043 8.7 19.4 19.4
No 4180 35.0 77.6 97.0
I don't know 164 1.4 3.0 100.0
Total 5387 45.1 100.0
Missing System 6562 54.9
Total 11949 100.0

TOWARDS ELECTIONS 2020: VOTER INTENTION

Towards 2020: Voter Intention
• The decision to vote in the 2020 elections has been made by the voters already. When asked to unveil their decisions about whether they would vote or not, an overwhelming 81.6% declared that their decision is definite.
• Only 14% said they would probably vote, 2.2% have not decided and 1.5% declared not to vote at all

TOWARDS ELECTIONS 2020: POLICY ASSESSMENT

Towards 2020: Policy Assessment
• For voters, voting in elections is determined by the issues candidates present to them during the campaigns. In this particular election, policies that the future government is likely to implement (35.8%), content of campaign messages candidates put across (23.8%) more than management of the COVID-19 (8.2%) more than corruption (4.0%) would shape their voting decision.
• It must be pointed out that while voters voting decision revolves around campaign messages and policies of the future government, these are issues that bother on the economy – such as employment and improvement in living standards. Unlike in previous elections when voters were keen on issues about corruption and dumsor, in this election, corruption is not a critical issue that will influence voters’ choices at the polls (See Table 5).

Table 5: Mention ONE key issue that will affect and determine your vote in the December Elections
Frequency Percent Valid Percent Cumulative Percent
Valid
Management of COVID-19 974 8.2 8.2 8.2
My Party Affiliation 2163 18.1 18.1 26.3
Government Policies 4275 35.8 35.8 62.0
Campaign Messages and Promises
2843 23.8 23.8 85.8
Corruption 483 4.0 4.0 89.9
The strength of the Opposition and Alternatives provided
310 2.6 2.6 92.5
The Management of the Economy
700 5.9 5.9 98.3
The American Elections 30 .3 .3 98.6
Other 171 1.4 1.4 100.0
Total 11949 100.0 100.0

Towards 2020: Policy Assessment cont’d
• Therefore, it can be argued that this election is solely contested on policy-based issues. In this election, the economic issues have been framed around tangible and implementable policies. For the Ghanaians voter, their choice is for the candidate who has the capacity to carry through with transformational policies. Therefore, it did not come as a surprise when 62.2% of voters said the Free Senior High School program offers hope to their future aspirations.
• It is interesting from voters’ respondents captured in Table 5 that the banking restructuring exercise that was greeted with cynicism and lamentations by the affected customers and business owners would have no effect on voters’ choices at the polls (. 7%) (See table 6).
• The voters have confirmed the policy-driven voting paradigm in contemporary elections. A majority of Ghanaian voters said they believe in the policies and programs being implemented by the incumbent government ( 61.7%). Only a minority 26.8% expressed lack of faith in the incumbent’s policies and 11.5% declined to make a response.

Table 6: Which of these Government Policies resonates well with you and may determine your vote in the 2020 Elections
Frequency Percent Valid Percent Cumulative
Percent
Valid
Free Senior High School
program7429 62.2 62.2 62.2
One District One Factory 466 3.9 3.9 66.1
Planting for food and jobs 593 5.0 5.0 71.0
NABCO 503 4.2 4.2 75.2
Anti-Galamsay 147 1.2 1.2 76.5
One Village One Dam 104 .9 .9 77.3
One Million per Constituency 70 .6 .6 77.9
Banking Restructuring 83 .7 .7 78.6
Banking Restructuring
?Negative181 1.5 1.5 80.1
Management of the economy 298 2.5 2.5 82.6
No important initiative 2075 17.4 17.4 100.0
Total 11949 100.0 100.0
Towards 2020: Policy Assessment cont’d
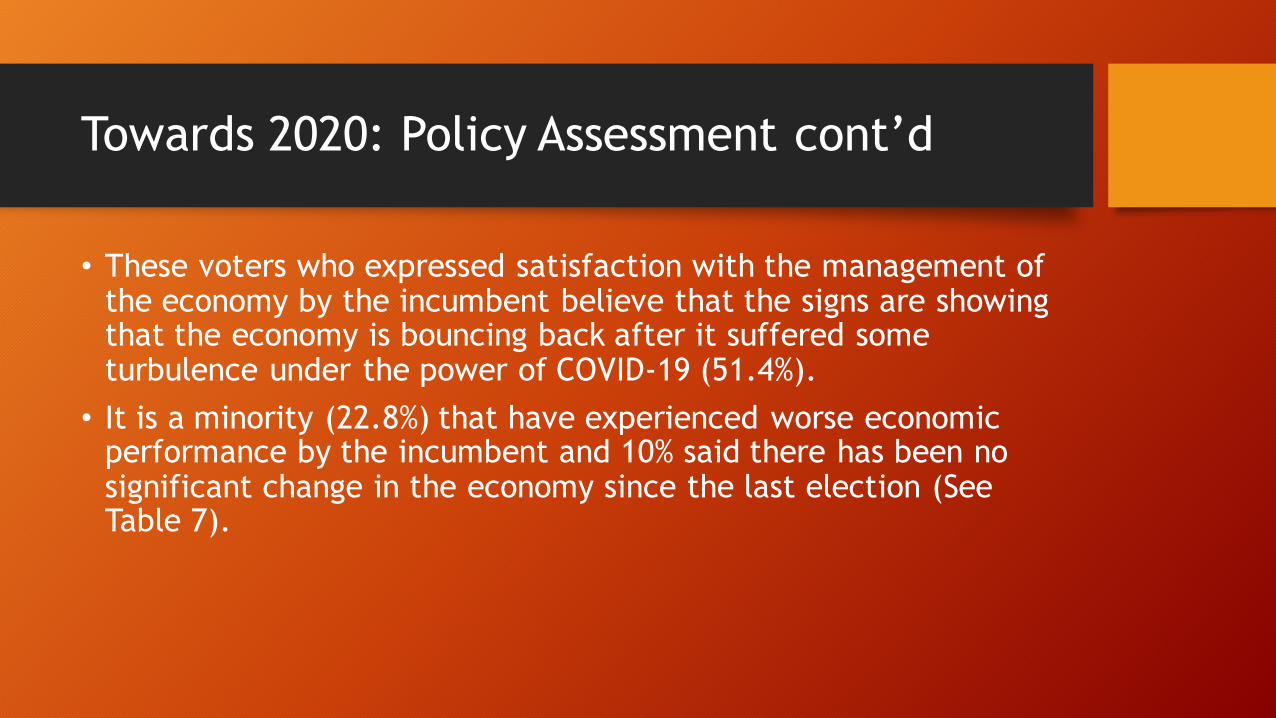
• These voters who expressed satisfaction with the management of the economy by the incumbent believe that the signs are showing that the economy is bouncing back after it suffered some turbulence under the power of COVID-19 (51.4%).
• It is a minority (22.8%) that have experienced worse economic performance by the incumbent and 10% said there has been no significant change in the economy since the last election (See Table 7).

Table 7: What is your perspective on the Ghanaian economy?
Frequency Percent Valid Percent
Cumulative Percent
Valid
The economy is picking up gradually 6146 51.4 51.4 51.4
No new policy has been introduced 776 6.5 6.5 57.9
The economy is worse than last year 2723 22.8 22.8 80.7
The economy is same as last year 1305 10.9 10.9 91.6
The future of the economy is bleak 999 8.4 8.4 100.0
Total 11949 100.0 100.0

Towards 2020: Policy Assessment cont’d
• As it was in previous elections, voters have been following the management of the economic. They are able to examine the changes that have occurred since the last elections (since 4 years ago). Their assessment of government performance over the management of the economy has a considerable influence on their voting decision.
• Overall, 65.1% of the voters rated the government’s management of the economic above the mean score – for instance, (19.3%), (24.1%) and (21.7%) of the voters said that the performance of the government with respect to the economy is excellent. very good and good respectively (See Table 8).

Table 8: How will you rate the performance of NPP in the four years?
Frequency Percent Valid Percent Cumulative Percent
Valid
Excellent 2304 19.3 19.3 19.3
Very good 2885 24.1 24.1 43.4
Good 2594 21.7 21.7 65.1
Neither good nor bad 1308 10.9 10.9 76.1
bad 1911 16.0 16.0 92.1
very bad 785 6.6 6.6 98.6
I don't know 162 1.4 1.4 100.0
Total 11949 100.0 100.0

TOWARDS ELECTIONS 2020: MANIFESTOS

Towards 2020: Manifestos
• Active voters that have followed the performance of the incumbent since its inauguration into office have little or no difficulty making their judgements on whether it has delivered the campaign promises or not.
• For majority of voters (53.5%) said they are confident that the incumbent has delivered on its campaign promises (of these, 22.9% said they are very confident 30.6% indicated they are confident) and a minority 27.5%) are not confident the government has fulfilled its campaign promises to the electorate (See Table 9).

Table 9: How confident are you that the NPP has delivered on its promises?
Frequency Percent Valid Percent Cumulative Percent
Valid
Very Confident 2732 22.9 22.9 22.9
Confident 3661 30.6 30.6 53.5
Somehow confident 1836 15.4 15.4 68.9
Not confident 3290 27.5 27.5 96.4
I can't tell 430 3.6 3.6 100.0
Total 11949 100.0 100.0

Towards 2020: Manifestos cont’d
• If the incumbent has fulfilled its previous campaign promise to the people, then there is the likelihood that the voters will express confidence in its ability to deliver the contents of the 2020 campaign manifesto.
• Thus, more than half (55.5%) said they are hopeful that the NPP would fulfill its 2020 campaign promise (these comprising great confidence 24.7% and confidence 30.8%). Those who doubted that the NPP would fulfill its 2020 manifesto constitute 39.7% and are made up low confidence 16.6% and np confidence 23.1%. (See table 10)

Table 10: How much confidence do you have in the NPP to deliver on its 2020 Manifesto
Frequency Percent Valid Percent Cumulative Percent
Valid
Great confidence 2951 24.7 24.7 24.7
Confidence 3686 30.8 30.8 55.5
Low confidence 1985 16.6 16.6 72.2
No confidence 2759 23.1 23.1 95.2
I can't tell/I don't know
568 4.8 4.8 100.0
Total 11949 100.0 100.0

Towards 2020: Manifestos cont’d
• Like the NPP, the NDC has launched its campaign manifesto which has outlined salient programmes aimed to bring benefits to the people. Voters (37.3%) have firm believe that the programs in the manifesto are realistic to be implemented and 32.8% said they are only meant to win votes while 15.3% think that some, not all of them are implementable (See table 11).

Table 11: The NDC has launched its manifesto a few weeks ago; do you think their promises are realistic?
Frequency Percent Valid Percent Cumulative Percent
Valid
Yes, they are realistic and achievable
4455 37.3 37.3 37.3
No, just to win votes 3914 32.8 32.8 70.0
Some are realistic and well implementable
1833 15.3 15.3 85.4
I can't tell 1747 14.6 14.6 100.0
Total 11949 100.0 100.0

Towards 2020: Manifestos cont’d
• The two most prominent parties, namely the NPP and NDC have used campaign manifestoes to engage the voters to indicate that the election is not about personalities nor ethnic affinity and morality but rather, critical issues/programs/future policies that have the capacity to bring changes in voters’ living conditions.
• To this end, the voters examined the contents of the manifestos of the two parties. For 36.9% of the voters, the NDC can bring about the needed change in the lives of the Ghanaian while 49.4% believed that it is the NPP manifesto that has the transforming capacity

Table 12: Comparing the NPP Manifesto and NDC Manifesto, which of the two parties have…
Frequency Percent Valid Percent Cumulative Percent
Valid
NDC 4405 36.9 36.9 36.9
NPP 5903 49.4 49.4 86.3
They are the same 1091 9.1 9.1 95.4
None is realistic enough
205 1.7 1.7 97.1
Don't know 345 2.9 2.9 100.0
Total 11949 100.0 100.0

TOWARDS ELECTIONS 2020: ELECTION MANAGEMENT

Towards 2020: Election Management
• It has been argued that election management is the thin line that separates the success and failure of elections and that the character and competence of the election management body can determine whether an election becomes a source of peaceful change or cause of serious instability.
• Particularly towards 2020, the activities of the EC have induced debate among various groups. Against this background, the study sought to ascertain from respondents their impressions about activities of the EC.

Table 13: How satisfied are you with the EC’s handling of the new voters’ register?
Response Frequency Percent Cumulative Percent
Very Satisfied 2700 22.6 22.6
Satisfied 6495 54.4 77.0
Neither satisfied nor
dissatisfied
1439 12.0 89.0
Dissatisfied 1082 9.1 98.1
Very dissatisfied 233 1.9 100.0
Total 11949 100.0

Table 14: To what extent do you agree with the statement that the EC has managed the processes leading to the general elections well?
Response Frequency Percent Cumulative Percent
Strongly agree 2872 24.0 24.0
Agree 6265 52.4 76.4
Neither Agree or
Disagree
1653 13.1 89.5
Disagree 1029 8.6 98.1
Strongly disagree 220 1.9 1.9
Total 11949 100.0 100.0

Table 15: Overall how would you rate the preparedness of the Electoral Commission?
Response Frequency Percent Cumulative Percent
Excellent 2428 20.3 20.3
Good 5203 43.5 63.8
Average 2844 23.8 87.6
Poor 833 7.0 94.6
Very poor 238 2.0 96.6
Don’t know 403 3.4 100.0
Total 11949 100.0

TOWARDS ELECTIONS 2020: ON PEACEFUL ELECTIONS

Towards 2020: On Peaceful Elections
• One of the tenets of democratic elections is that they must be peaceful. However it is increasing becoming a four-year ritual that Ghanaians stay on tenterhooks ahead of elections. The study therefore sought the views of respondents the preparedness of various institutions in ensuring peaceful elections

Table 16: How will you rate the preparedness of the various security agencies towards ensuring peaceful elections?
Agency Excellent Good Average Poor Very poor Don’t know Remarks
Ghana Police
Service
22.3% 45.6% 22.8% 4.4% 1.3% 3.6% 67.9%
favourable
Ghana Armed
Forces
23.0% 45.2% 22.2% 3.9% 1.0% 4.7% 68.2%
favourable
Ghana Fire
Service
18.7% 39.1% 24.8% 5.1% 1.8% 10.5% 57.8%
favourable
Ghana
Immigration
Service
18.3% 39.5% 25.3% 5.5% 1.7% 9.7% 57.8%
favourable
Ghana Prisons
Service
18.6% 39.5% 24.5% 5.0% 1.6% 10.8% 58.1%
favourable
National
Security
20.0 41.3% 23.7% 5.2% 1.9% 9.7% 61.3%
favourable

Table 17: Do you think political parties have disbanded their vigilante groups?
Response Frequency Percent Cumulative Percent
Yes 3500 29.3 29.3
No 3011 25.2 54.5
I don’t know 5438 45.5 100.0
Total 11949 100.0

Table 18: Will you like the military to be directly involved in the election as a measure …
• Against the background of the continued fear of the existence of the vigilante groups, it was not surprising that nearly 55% wanted the military to be directly involved as
Response Frequency Percent Cumulative Percent
Yes 6483 54.3 54.3
No 4399 36.8 91.1
I don’t know 1067 8.9 100.0
Total 11949 100.0

Towards 2020: On Peaceful Elections
• As illustrated in the below respondents also rated favourably the preparedness of the National Peace Council, Traditional Authorities and Religious Organizations in ensuring peaceful elections (Table 19)
Agency Excellent Good Average Poor Very poor Don’t
know
Remarks
National
Peace Council
22.3% 45.6% 22.8% 4.4% 1.3% 3.6% 67.9%
Traditional
Authorities
20.4% 41.0% 26.8% 5.4% 1.4% 4.9% 61.4%
favourabl
e
Religious
Organizations
19.8% 43.4% 25.8% 5.2% 1.3% 4.6% 63.2%
favourabl
e

Table 20: Do you think the 2020 general elections will be peaceful?
Response Frequency Percent Cumulative Percent
Yes 10299 86.2 86.2
No 701 5.9 92.1
949 7.9 100.0
Total 11949 100.0

TOWARDS ELECTIONS 2020: COVID-19 MANAGEMENT

Towards 2020: COVID-19 Management
• In late 2019, the world was plagued by the deadly Corrona Virus and it was not until in March 2020 that Ghana recorded its face case. The fear and panic it caused to the population was of a magnitude that remains unprecedented since the birth of the nation, Ghana.
• Yet, it was time, the population looked up to the government to address or mitigate the dangers posed by the pandemic. How well a government is able to manage the COVID-19 has determines its popular rating.
• Elsewhere in USA, the Trump’s fall in the election has been attributed to his handling of the pandemic that has claimed thousands of lives of the Americans.

Towards 2020: COVID-19 Management cont’d
• It seems the measures put in place by the Akufo-Addo’sgovernment has received popular recognition. In all, 87.3% expressed satisfaction with the performance of the president’s handing of the pandemic (these comprise excellent 22.2%, very good 29.2% and good 35%) (See Table 21).
• Nevertheless, the majority of Ghanaians (66.5%) who praised the government’s management of the COVID-19 pandemic would not be influenced by it in choosing their candidate in the upcoming elections. Only a minority (24.4%) would add the management of the pandemic to the list of their voting determinants. (See Table 22)

Table 21: How will you rate the performance of Government in the management of COVID-19
Frequency Percent Valid Percent Cumulative Percent
Valid
Excellent 2649 22.2 22.2 22.2
Very Good 3506 29.3 29.3 51.5
Good 4276 35.8 35.8 87.3
Bad 865 7.2 7.2 94.5
Very Bad 314 2.6 2.6 97.2
Not sure 339 2.8 2.8 100.0
Total 11949 100.0 100.0

Table 22: Will the management of COVID-19 affect your choice of voting in the December 2020?
Frequency Percent Valid Percent Cumulative Percent
Valid
Yes 2912 24.4 24.4 24.4
No 7945 66.5 66.5 90.9
I can't tell 1092 9.1 9.1 100.0
Total 11949 100.0 100.0

TOWARDS ELECTIONS 2020: PARLIAMENTARY ELECTIONS

Towards 2020: Parliamentary Elections
• How would you rate the performance of your MP?
• Of the 11,949 respondents, a cumulative 60.2% positively rated their MPs (Excellent-14.9%, Very Good-21.0% & Good-24.3%), 29.7% rated them negatively (Bad-20.6% & 9.1% - Very Bad). A significant 10.2% indicated they had no basis for judgement. (See Table 23)

Towards 2020: Parliamentary Elections cont’d(Table 23)

Towards 2020: Parliamentary Elections cont’d
• Will your MP’s performance affect your vote in the 2020 election?
• Respondents were equally divided on whether or not the performance of their MPs would affect their vote in the 2020 elections. While 46.2% were insistent that it would affect their vote, 44.2% were emphatic that it would not, while nearly 10% (9.2%) were undecided on the matter. (See Table 24)

Towards 2020: Parliamentary Elections cont’d(Table 24)

Towards 2020: Parliamentary Elections cont’d
• Which party is the incumbent holder of the seat?
• 62.4% of the respondents indicated that the incumbent MPs were NPP and the other 37.6% were NDC. This tallies with the fact that of the 100 seats surveyed, 63 are held by the NPP and the other 37 by NDC. (See Table 25)

Towards 2020: Parliamentary Elections cont’d(Table 25)
Response Frequency Percent Cumulative
Percent
NPP 7456 62.4 62.4
NDC 4493 37.6 37.6
Total 11949 100.0 100.0

Towards 2020: Parliamentary Elections cont’d
• Do you think the incumbent MP/party candidate of the incumbent MP lose?
• A little over half of the respondents (52.6%) felt the incumbent party (either the incumbent MP or the party’s candidate) would retained the respective seats. At the same time a significant 47.6% felt the incumbent party would lose the seat. This is not surprising given that several of the seats are historically swing seats while others have incumbent party protesters contesting as independents. (See Table 26)

Towards 2020: Parliamentary Elections cont’d(Table 26)
No. Percentage Cumulative %
Yes 5661 47.4 47.4
No 6288 52.6 100.0
Total 11949 100.0

Towards 2020: Parliamentary Elections cont’d
• Which party’s parliamentary candidate would you vote for if the election were held today?
• Like in 2016, third parties and independents have very little or no chance of winning any of the 100 seats surveyed. More than 9 out of every 10 respondents would vote for either NPP (50.2%) or NDC (41.3%). While a cumulative 2.8% would vote for one third party or another, 1.6% were rooting for independents. A higher 3.6% were still undecided while less than 1% (0.9%) were emphatic that they would not vote. (See Table 27)

Towards 2020: Parliamentary Elections cont’d(Table 27)
Party No. Percentage Cumulative %
NPP 5594 50.2 50.2
NDC 4934 41.3 91.5
GUM 124 1.0 92.5
CPP 96 0.8 93.3
GFP 15 0.1 93.4
GCPP 11 0.1 93.5
APC 6 0.1 93.6
LPG 7 0.1 93.7
PNC 6 0.1 93.7
PPP 18 0.2 93.9
NDP 21 0.2 94.1
Independent 192 1.6 95.7
1 am firmly undecided 434 3.6 99.2
I will not vote 91 0.9 100.0
Total

Towards 2020: Parliamentary Elections cont’d
• Further analysis of the data reveals that a little more than half (51%) are most likely to be retained by the respective incumbent party, 35 (35%) are up for grabs and could go either way and the 13% are most likely to change parties.

TOWARDS ELECTIONS 2020: PRESIDENTIAL ELECTIONS

Towards 2020: Presidential Elections
• In elections, voters’ choices at the polls are shaped by many pertinent considerations. In this year’s elections, the most salient issue voters would consider before casting their votes for a presidential candidate, is the kind of campaign message he/she carries across to the electorate (53.8%). Only a minority is prepared to vote based on partisan consideration (27.2%) and trust worthiness (11.1%)

Table 28: When considering which presidential candidate to vote for, what is the most important factor you would consider?
Frequency Percent Valid Percent Cumulative Percent
Valid
I will decide based on the campaign messages
6434 53.8 53.8 53.8
I am a party faithful so I will vote for my party
3248 27.2 27.2 81.0
I will vote for the candidate who has more energy
217 1.8 1.8 82.8
I will vote for the candidate I trust more
1324 11.1 11.1 93.9
I will vote for the candidate who looks better
87 .7 .7 94.7
I will vote against a candidate I dislike
86 .7 .7 95.4
I will vote to give another person a chance
214 1.8 1.8 97.2
Other (please specify) 117 1.0 1.0 98.1
Don't Know/Refused to answer (DO NOT READ)
222 1.9 1.9 100.0
Total 11949 100.0 100.0

Towards 2020: Presidential Elections cont’d
• For those whose votes for a candidate would be based on sound campaign message, their preferred choice of presidential candidate is the NPP’s Nana Akufo-Addo (52.5%) followed by NDC’s John Mahama 40.9% then GUM’s Christian Kwabena Andrew (1.3%), but 3.7% have not decided on any of the candidates yet (See Table 28).
• When respondents were stretched to indicate the presidential candidate they would vote for in the December 7 elections, 51.7% declared for Akufo-Addo, 40.4% favour John Mahama and 1.4% would vote for Christian Kwabena Andrews, and 1.4 and the undecided are 3.7% (See Table 29).
• These voters have taken a firm decision to vote for these candidates in the election. When pushed to indicate how sure they are with the decision to vote for the candidates, a whopping 80.9% said they are extremely/very sure while 11.9% are relatively (somewhat sure) of voting for their candidate (See Table 31)
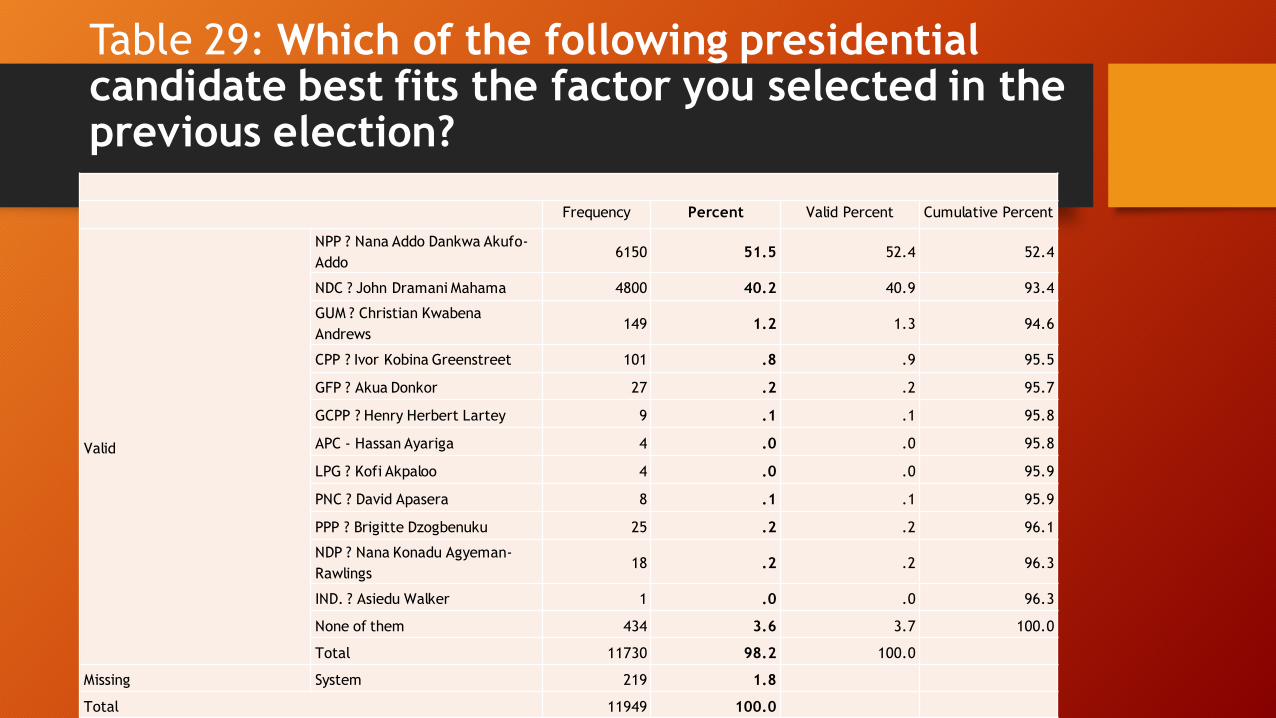
Table 29: Which of the following presidential candidate best fits the factor you selected in the previous election?
Frequency Percent Valid Percent Cumulative Percent
Valid
NPP ? Nana Addo Dankwa Akufo-
Addo6150 51.5 52.4 52.4
NDC ? John Dramani Mahama 4800 40.2 40.9 93.4
GUM ? Christian Kwabena
Andrews149 1.2 1.3 94.6
CPP ? Ivor Kobina Greenstreet 101 .8 .9 95.5
GFP ? Akua Donkor 27 .2 .2 95.7
GCPP ? Henry Herbert Lartey 9 .1 .1 95.8
APC - Hassan Ayariga 4 .0 .0 95.8
LPG ? Kofi Akpaloo 4 .0 .0 95.9
PNC ? David Apasera 8 .1 .1 95.9
PPP ? Brigitte Dzogbenuku 25 .2 .2 96.1
NDP ? Nana Konadu Agyeman-
Rawlings18 .2 .2 96.3
IND. ? Asiedu Walker 1 .0 .0 96.3
None of them 434 3.6 3.7 100.0
Total 11730 98.2 100.0
Missing System 219 1.8
Total 11949 100.0

Table 30: Which presidential candidate would you vote for if general elections were held today?
Frequency Percent Valid Percent Cumulative
Percent
Valid
NPP ? Nana Addo Dankwa
Akufo-Addo6179 51.7 51.7 51.7
NDC ? John Dramani Mahama 4832 40.4 40.4 92.1
GUM ? Christian Kwabena
Andrews167 1.4 1.4 93.5
CPP ? Ivor Kobina Greenstreet 98 .8 .8 94.4
GFP ? Akua Donkor 27 .2 .2 94.6
GCPP ? Henry Herbert Lartey 6 .1 .1 94.6
APC - Hassan Ayariga 10 .1 .1 94.7
LPG ? Kofi Akpaloo 7 .1 .1 94.8
PNC ? David Apasera 11 .1 .1 94.9
PPP ? Brigitte Dzogbenuku 26 .2 .2 95.1
NDP ? Nana Konadu Agyeman-
Rawlings23 .2 .2 95.3
IND. ? Asiedu Walker 2 .0 .0 95.3
Undecided 561 4.7 4.7 100.0
Total 11949 100.0 100.0

Table 31: How sure are you about voting for this candidate in your preceding answer?
Frequency Percent Valid Percent Cumulative Percent
Valid
I am very sure 9666 80.9 80.9 80.9
I am somewhat sure 1420 11.9 11.9 92.8
I am somewhat unsure 156 1.3 1.3 94.1
I am very unsure 52 .4 .4 94.5
Don't know/refused to answer (DO NOT READ)
55 .5 .5 95.0
Undecided 600 5.0 5.0 100.0
Total 11949 100.0 100.0

THANK YOU