Embed Size (px)
Citation preview

i
2017/18ANNUAL REPORT
mineral resourcesDepartment:Mineral ResourcesREPUBLIC OF SOUTH AFRICA

Dep
artm
ent o
f Min
eral
Reso
urce
sA
NN
UA
L R
EPO
RT
201
7/18
ii

DEPARTMENT OF MINERAL RESOURCES
VOTE NO. 29
ANNUAL REPORT2017/18

1
CONTENTSPART A: GENERAL INFORMATION 31. DEPARTMENT GENERAL INFORMATION 4
2. LIST OF ABBREVIATIONS/ACRONYMS 5
3. FOREWORD BY THE MINISTER 7
4. DEPUTY MINISTER STATEMENT 9
5. REPORT OF THE DIRECTOR-GENERAL 11
6. STATEMENT OF RESPONSIBILITY AND CONFIRMATION OF
ACCURACY FOR THE ANNUAL REPORT 16
7. STRATEGIC OVERVIEW 17
7.1. Vision 17
7.2. Mission 17
7.3. Values 17
8. LEGISLATIVE AND OTHER MANDATES 17
8.1. Constitutional mandate 17
8.2. Legislative mandate 17
8.3. Policy mandate 17
9. ORGANISATIONAL STRUCTURE 18
10. ENTITIES REPORTING TO THE MINISTER 19
PART B: PERFORMANCE INFORMATION 201. AUDITOR GENERAL’S REPORT: PREDETERMINED OBJECTIVES 21
2. OVERVIEW OF DEPARTMENTAL PERFORMANCE 21
2.1 Service Delivery Environment 21
2.2 Service Delivery Improvement Plan 22
2.3 Organisational environment 25
2.4 Key policy developments and legislative changes 25
3. STRATEGIC OUTCOME-ORIENTED GOALS 26
4. PERFORMANCE INFORMATION BY PROGRAMME 27
4.1 Programme 1: Corporate Sercices 27
4.2 Programme 1.1: Financial Administration 34
4.3 Programme 2: Mine Health and Safety 38
4.4 Programme 3: Mineral Regulation 43
4.5 Programme 4: Mineral Policy and Promotion 50
5. TRANSFER PAYMENTS 56
5.1. Transfer payments to public entities 56
5.2. Achievements of the public entities 57
5.3 Transfer payments to all organisations other than public entities 64
5.4 Capital investment, maintenance and asset management plan 64
PART C: GOVERNANCE 651. INTRODUCTION 66
2. RISK MANAGEMENT 66
3. FRAUD AND CORRUPTION 66
4. MINIMISING CONFLICT OF INTEREST 66
5. CODE OF CONDUCT 67
6. HEALTH, SAFETY AND ENVIRONMENTAL ISSUES 67
7. PORTFOLIO COMMITTEES 67
8. SCOPA RESOLUTIONS 67
9. PRIOR MODIFICATIONS TO AUDIT REPORTS 67
10. INTERNAL CONTROL UNIT 68
11. INTERNAL AUDIT AND AUDIT COMMITTEES 68
12. AUDIT COMMITTEE REPORT 69

2
PART D: HUMAN RESOURCE MANAGEMENT 711. INTRODUCTION 722. OVERVIEW OF HUMAN RESOURCES 72 2.1 Overview of human resources in the Department 72 2.2 The status of human resources in the Department 72 2.3 HR priorities for the year under review and their impact 72
2.4 Workforce planning and key strategies to recruit a skilled and capable workforce 73
2.5 Employee performance management 73 2.6 Employee Wellness Programme 733. HUMAN RESOURCES OVERSIGHT STATISTICS 74
3.1 Personnel-related expenditure 74 3.2 Employment and vacancies 75 3.3 Filling of SMS posts 78 3.4 Job evaluation 80 3.5 Employment changes 81 3.6 Employment equity 85 3.7 Signing of performance agreements by SMS members 90 3.8 Performance rewards 91 3.9 Foreign workers 94 3.10 Leave utilisation 94 3.11 HIV/Aids and health promotion programmes 97 3.12 Labour relations 98 3.13 Skills development 99 3.14 Injury on duty 101 3.15 Utilisation of consultants 101 3.16 Severance packages 102
PART E: FINANCIAL INFORMATION 1031. REPORT OF THE AUDITOR GENERAL 1042. ANNUAL FINANCIAL STATEMENTS 108
Dep
artm
ent o
f Min
eral
Reso
urce
sA
NN
UA
L R
EPO
RT
201
7/18
3
PART AGENERALINFORMATION

Departm
ent of Mineral Resources
AN
NU
AL R
EPORT
2017/18
4
1. DEPARTMENT GENERAL INFORMATION Physical address: Building 2 Band 2C Trevenna Campus, Corner of Meintjies Street and Francis Baard Street Sunnyside Pretoria
Postal address: Private Bag X59 Arcadia 0007
Telephone number/s: +27 12 444 3000Email address: [email protected] address: www.dmr.gov.za

Dep
artm
ent o
f Min
eral
Reso
urce
sA
NN
UA
L R
EPO
RT
201
7/18
5
2. LIST OF ABBREVIATIONS/ACRONYMS
AAPG American Association of Petroleum Geologists
AEMFC African Exploration Mining and Finance Corporation
AGSA Auditor-General South Africa
Aids Acquired Immune Deficiency Syndrome
BAS Basic Accounting System
BEE Black Economic Empowerment
CAR Central African Republic
CEF Central Energy Fund
CEO Chief Executive Officer
CTF Culture Transformation Framework
CGS Council for Geoscience
CIOM Chief Inspector of Mines
CoE Centre of Excellence
CoP Code of Practice
CSIR Council for Scientific and Industrial Research
DAC Development Assessment Centre
DDG Deputy Director-General
DMR Department of Mineral Resources
DPSA Department of Public Service and Administration
EAP Employee Assistance Programme
ECOWAS Economic Community of West African States
EDP Executive Development Programme
ESEIDEconomic Sectors Employment and Infrastructure Development
GCC Government Certificate of Competency
GDP Gross Domestic Product
HATOLD HIV, Aids, TB and Occupational Lung Disease
HDSA Historically Disadvantaged South Africans
HFMC Hydraulic Fracturing Monitoring Committee
HIV Human Immunodeficiency Virus
HOA Home Owners’ Allowance
HR Human Resources
HRD Human Resource Development
HySA Hydrogen South Africa
IAA Internal Audit Activity
ICT Information and Communication Technology
IESBA Code International Ethics Standards Board for Accountants’ Code
IMF International Monetary Fund
ISA International Standards on Auditing
ISBN International Standard Book Number
KDD Karoo Deep Drilling
KPCS Kimberley Process Certification Scheme
LED Local Economic Development
MANCO Management Committee
MCS Modified Cash Standard
MHSA Mine Health and Safety Act
MHSC Mine Health and Safety Council
MIG-DETTMining Industry Growth, Development and EmploymentTask Team
MincoSA Mining Company of South Africa
Mintek Council for Mineral Technology Research
MMCC Mine Manager’s Certificates of Competency
MoU Memorandum of Understanding
MPAT Management Performance Assessment Tool
MPRDA Mineral and Petroleum Resources Development Act
MPSA Minister of Public Service and Administration

Departm
ent of Mineral Resources
AN
NU
AL R
EPORT
2017/18
6
MQA Mining Qualifications Authority
MSCC Mine Surveyor’s Certificate of Competency
MSP Master Systems Plan
MTEF Medium-term Expenditure Framework
MTSF Medium-term Strategic Framework
N/A Not applicable
NCOP National Council of Provinces
NDP National Development Plan
NEMA National Environmental Management Act
NIOH National Institute of Occupational Health
NRF National Revenue Fund
NSDS National Skills Development Strategy
OFA Organisational Functional Assessment
OHS Occupational Health and Safety
PAA Public Audit Act
PARS Project Archive Records System
PASA Petroleum Agency South Africa
PFMA Public Finance Management Act
PGM Platinum Group Metals
PPC Parliamentary Portfolio Committee
PPPFA Preferential Procurement Policy Framework Act
PSETA Public Service Sector Education and Training Authority
PSCBC Public Service Coordinating Bargaining Council
SAASTA South African Agency for Science and Technology
SACREF REE Southern African Centralised Refinery Rare Earth Elements
SADC Southern African Development Community
SADPMR South African Diamond and Precious Metals Regulator
SAMI South African Mining Industry
SAPS South African Police Service
SCOPA Standing Committee on Public Accounts
SCSR Self-contained Self-rescuers
SDT State Diamond Trader
SITA State Information Technology Agency
SLA Service-level Agreement
SLP Social and Labour Plan
SME Small and Medium Enterprises
SMME Small, Medium and Micro Enterprise
SMS Senior Management Service
SOE State-owned Entity
SOP Standard Operating Precedure
SSA State Security Agency
STI Sexually Transmitted Infection
TB Tuberculosis
Unisa University of South Africa
VCT Voluntary Counselling and Testing
WSP Workplace Skills Plan

Dep
artm
ent o
f Min
eral
Reso
urce
sA
NN
UA
L R
EPO
RT
201
7/18
7
3. FOREWORD BY THE MINISTER
Mr SG MantasheMinister of Mineral Resources
The mining industry remains a key contributor to the South African. economy. Estimates further indicate that the country accounts for 94% of known global reserves of the platinum group metals (PGMs), 73.7% of chrome, 29% of manganese, 18.4% of vanadium and 10.5% of gold reserves. This indicates that the country will remain a critical investment destination for mining for the foreseeable future.
As a country, we are mindful of the importance of a stable and predictable policy and regulatory environment as a prerequisite to attract and retain investment, given that we compete with other mining jurisdictions for investment. As such, we have prioritised the finalisation of the key policy and legislative instruments regulating the sector.
In this regard, the Department is hard at work and significant progress has been made in the finalisation of the Mineral and Petroleum Resources Development Act, which is in Parliament’s National Council of Provinces for processing. On the Mining Charter, following last year’s gazetting of the Charter and subsequent legal challenges, we have, at the direction of President Cyril Ramaphosa, reopened consultation on the Charter with social partners and stakeholders.
The Charter is a tool for transformation, and a powerful pact between stakeholders to contribute towards the achievement of an equal, non-racial and non-sexist society envisioned in our Constitution. We look forward to the conclusion of the consultation process and implementation of the final Charter during the 2018/19 financial year.
It is imperative that this is done, so that the industry can get back to the business of mining, and we, as the Regulator, can enforce compliance of the legislation in order to realise our Vision 2019 to build “a globally competitive, sustainable and meaningfully transformed mining and mineral sector”, in line with the Department’s 2014–2019 Strategic Plan.
The industry has experienced relative stability in recent years, in particular relating to employer-employee relations, with no protracted strikes in the past few years. This is to be welcomed. An area where companies are urged to pay special focus, however, is that of building trust with communities in which mining takes place. This will improve the environment and make it more conducive for mining to take place sustainably.
In the latter part of 2017/18, we began with an assessment into the backlog in the processing of licenses, and will be able to provide an update and findings on this matter in the 2018/19 financial year. Furthermore, the ethical conduct of our officials is critical if we are to carry out our work as the Regulator with integrity and transparency, and further strengthen the levels of trust with our stakeholders.

Departm
ent of Mineral Resources
AN
NU
AL R
EPORT
2017/18
8
Following complaints received, we initiated an investigation into administrative processes, starting in our regional offices in Mpumalanga, Limpopo and North West. This is being extended to other offices across the country.
Health and safety remains an area of concern for the Department. In 2017 the industry experienced the first increase in the number of fatalities reported in ten years. Already in 2018 we are seeing a continuing trend of increasing fatalities.
We are paying close attention to this issue, and should be able to indicate a concrete plan of action in due course to arrest this increase and ensure that our goal of zero harm is realised.
The filling of critical positions at senior management, which was initiated during the latter part of the financial year, has now been concluded, with the appointments of the DDG: Mineral Regulation and the DDG: Mineral Policy and Promotion now concluded. Stability at this level of the organisation bodes well for the overall improvement in performance of the Department.
The year under review marks the penultimate year of the current Medium-term Strategic Framework. We have our work cut out for us as we continue to accelerate our pace of delivering on our mandate to regulate and promote the minerals and mining sector for transformation, growth and development. By doing so, we will ensure that we move this key sector of our economy forward.
Mr SG MantasheMinister of Mineral Resources20 September 2018

Dep
artm
ent o
f Min
eral
Reso
urce
sA
NN
UA
L R
EPO
RT
201
7/18
9
4. DEPUTY MINISTER STATEMENT
Mr G Oliphant, MPDeputy Minister of Mineral Resources
The South African mining industry remains a significant contributor to the country’s inclusive economic growth, transformation and skills development. This is despite the prevailing weak economic growth, and unfavourable commodity prices of metals such as platinum. During 2018, the sector also registered regrettable fatalities.
to achieve the objectives of zero harm and the 2024 milestones on occupational health and safety. The sector has seen a regrettable increase in fatalities related to fall of ground, especially in the last quarter of the 2017/18 financial year. We are sad to report this increase, and would like to convey our deepest condolences to the families and friends of all mineworkers who lost their lives during this period.
Illegal mines, or zama-zamas, is another area of concern to us, and in recent years, there has been a spate of fatalities relating to such mining activities. DMR continues in its efforts to eradicate illegal mining activities by engaging communities. We will continue to engage with interested and affected parties in this matter, with the objective to encourage them to follow the proper processes of obtaining mining permits.
I am pleased to report that this process resulted in the successful negotiation facilitated by the Northern Cape Office of the Premier. Other participants included Sol Plaatjie Municipality, the Swedish Housing Company, the South African Police Service (SAPS), Ekapa Mining and
The industry has performed well in ensuring the delivery of primary health care and occupational health services. We, as the Department of Mineral Resources (DMR), have put systems in place such as the DMR 164 forms to monitor, assess the quality, effectiveness, coverage and delivery of collaborative tuberculosis (TB) and human immunodeficiency virus (HIV) activities with a view of compiling an annual report on the TB and HIV disease burden and prevalence. It is worth noting that the intervention yielded positive results in that, in 2017, 687 mines with 473 972 employees complied with the reporting requirements, compared to 663 mines, representing 455 681 employees, in 2016. Compliance with the integrated TB and HIV policy was 93.0% in 2017, and compliance with the integrated TB and HIV programme was 78.6%. We will continue to engage with the sector to review their policies and align them with the current National Strategic Plan for HIV, TB and Sexually Transmitted Infections (STIs) 2017–2022.
Safety at the mines is of paramount importance and of great concern for us. In this regard, we call on all industry stakeholders to work together

Departm
ent of Mineral Resources
AN
NU
AL R
EPORT
2017/18
10
former zama-zamas, now proudly called the Kimberley Artisanal Miners. The negotiations related to access to the Tailings Mining Resource and 500 ha of diamondiferous ground known as floors.
I am particularly delighted to mention that a reliable database of over a million qualifying claimants, both current and former mineworkers, are constantly tracked and traced to be paid out on a weekly basis. To date, over 10 000 have been paid to the value of over R250 million. We also wish to commend the Silicosis Class Action participants for their successful settlement of over R5 billion for affected gold mineworkers. All in all, there is now over R20 billion available to qualifying current and former mineworkers in the form of medical compensation, pensions and provident funds.
Notably, four special clinics for mineworkers have been completed in four provinces (Eastern Cape, Gauteng, Limpopo and Northern Cape) to attend to their free medical benefit examinations. In addition, seven special clinics were completed in the Southern African Development Community (SADC) labour sending areas: one in Botswana and two each in Lesotho,
Mozambique and Swaziland. I wish to convey my appreciation to the Global Fund for these one-stop service centres.
Lastly, I would like to acknowledge the efforts undertaken by Minister Gwede Mantashe and Team DMR, as led by Director-General Thabo Mokoena, in ensuring that the DMR achieves its mandate, including the finalisation of the Mineral and Petroleum Resources Development Act and reviewed Mining Charter III.
Mr G Oliphant, MPDeputy Minister of Mineral Resources20 September 2018

Dep
artm
ent o
f Min
eral
Reso
urce
sA
NN
UA
L R
EPO
RT
201
7/18
11
5. REPORT OF THE DIRECTOR-GENERAL
Adv. T MokoenaDirector-General Department of Mineral Resources
It is my pleasure to present the 2017/18 Annual Report of the Department of Mineral Resources. The Department continued to be focused on delivering on its mandate as outlined in its Annual Performance Plan.
As highlighted in Part B of this Annual Report, there were a number of successes and challenges, but I remain confident and optimistic about the future of this department and the mining industry in general.
The financial year under review indeed proved to be a challenging one for me as incoming Accounting Officer, as it coincided with the departure of two deputy directors-general. This had the potential to affect service delivery. I am, however, pleased to report that the remaining team kept focused and tirelessly worked towards the delivery of our service contract, as contained in the Annual Performance Plan.
The team showed their motivation as members operated under trying times with some of the key vacancies remaining vacant due to a lack of funding. This shortcoming was noted, and the Department reprioritised its spending and positions. Those positions deemed critical are in the process of being filled to ensure that the Department remains a focused, motivated and impactful team.
As a regulating organisation, the Department noted the importance of integrity, its value system and its ethical principles. As such, I have ensured that the management team commits to the ethical pledge and values that have since been distributed across all the regional offices of the Department.
In pursuit of transparency, all senior managers have declared their financial interests, and at the beginning of the financial year, all managers signed performance contracts that are aligned to the Annual Performance Plan.
Mine health and safety
The year under review has been a challenging one, which saw an upsurge in the number of reported fatalities. The sector recorded a 20.5% increase in fatalities, where 88 incidents were recorded at the end of 2017, compared to 73 in the preceding year. While fatalities were on the increase, the efforts of our inspectors on the ground were bearing fruit with a notable

Departm
ent of Mineral Resources
AN
NU
AL R
EPORT
2017/18
12
improvement in occupational injuries and diseases. Occupational injuries were reduced by 10.99% from 2 847 reported cases in the previous year to 2 534 in the current year. Occupational diseases followed a positive trend, being reduced by 13.5% from 3 531 in 2016 to 3 056 in 2017.
In an attempt to ensure that we continue to strive towards our goal of zero harm to employees in the mining sector, we have continued to strive to meet our targeted inspections of high-risk operations and ensure that we do diagnostic inspections where incidents are reported and further ensure that sustainable preventative measures are in place.
Plans are underway for the second quarter of 2018 where the Department will be meeting with industry stakeholders to continue initiatives to assess and self-correct in order meet industry milestones on health and safety. Mineral regulations
Illegal mining has proved to be among the challenges the Department has had to deal with in a decisive manner. As part of monitoring and enforcement activities, one of the units within the Regulation Branch now forms part of Operation Phakisa: Oceans Economy, with an emphasis on curbing illegal sand mining along the West Coast.
As part of cooperative governance, the Department forms a key part of the joint operations with the Department of Environmental Affairs, the South African Police Service and the Department of Agriculture, Forestry and Fisheries, where it is striving to prevent mining in protected areas.
The Department takes a dim view of illegal mining, but it is worth noting that where illegal operations are found and the operators are willing to take guidance and regularise their operations, the Department’s teams support them. A case in point is the process of illegal miners in the Northern Cape being assisted to form the Kimberley Artisanal Miners and Ekapa Mining.
On the other hand, the much talked about illegal mining activities alongside the Umdloti River in KwaZulu-Natal have been closed off and cases handed over to the prosecuting authorities.
While the mining sector has been shedding jobs for various reasons, as part of the new licensing regime, new mines with a life of mine of 30 years have been opened in Mpumalanga. These have created 1 190 new jobs (notably for Shondoni Colliery and Sasol Mining). An additional 654 jobs were created between Black Royalty in Bronkhorstpruit and Nokeng Flouspar in Cullinan.
The Department continues to monitor the compliance of right holders with their contracts, as espoused in the Social and Labour Plans. During the year under review, the following sustainable commitments were implemented for the communities:
• Sunrise View Secondary School and Platinum Village Primary School in North West
• Maseven Clinic in Sekhukhune and Sekuruwe Clinic in Mokopane• The construction of an administration block at Maremele Primary
School in Sekhukhune• A science laboratory in Sekhukhune• The construction of a community access bridge in Sekhukhune
Policy and promotion
South Africa is richly endowed with mineral resources. It produces more than 30 metal and mineral products, and has huge potential with respect to mineral reserves, exploration and production. The country ranks first in the quantity of world reserves of chrome ore, fluorspar, manganese ore, platinum group metals and zirconium.
Despite major improvements and recent developments in the South African economy subsequent to the strengthening of the rand and the positive mood following the national election, structural reforms, unconcluded mining regulatory policies (the Mineral and Petroleum Resources Development Act and the Mining Charter) and the recent credit downgrades are hampering South Africa’s economy from reaching its full potential.
In the past few years, the financial performance of the South African mining industry has been declining. A slump in commodity prices and increased cost pressures have had an impact on this. Local cost pressures, labour action and a continuing downswing in commodity prices have resulted in shrinking margins and impairment provisions. However, improving commodity prices since the beginning of 2017 and upward trends in global demand, especially in those of South Africa’s major trading partners, are expected to reinvigorate the mining industry to perform relatively well throughout 2018 and beyond.
Although, the global economy is still fragile, recovery in industrial activity has coincided with a pickup in global trade after two years of marked weakness, which bodes well for the mining industry in South Africa. The economic outlook of the mining industry remains positive, underpinned by growth in recent quarters of production in the mining industry. By the third quarter of 2017, the mining and quarrying industry increased by 6.6% and

Dep
artm
ent o
f Min
eral
Reso
urce
sA
NN
UA
L R
EPO
RT
201
7/18
13
contributed 0.5 of a percentage point to the GDP. The South African economy experienced its worse performance in over nine years by recording a decline of 2.2% in the first quarter of 2018, following an expansion of 3.1% in the last quarter of 2017. Mining production in South Africa decreased by 2.6% in the three months ended in May 2018, despite a recovery in most of the commodity prices in the first half of 2018.
Global and local economic outlook
The acceleration of the world economy so far this year has been stronger than earlier estimates and expectations, mainly due to an upswing that is under way across nearly all the world’s major economies. Although the global economic growth outlook has improved, it is clouded by policy uncertainty as the world trading system comes under mounting pressure. According to the World Economic Outlook Report published by the International Monetary Fund (IMF), the IMF has raised its forecast for growth to 3.6% for 2017 and 3.7% for 2018. This is an acceleration from the 3.2% growth recorded in 2016. The high levels of growth resulted from real output growth from emerging market economies, which improved from 5.5% in the fourth quarter of 2017 to 6.6% in the first quarter of 2018.
On the local front, the South African economy grew by an estimated 0.5% in 2016 and was expected to grow by 1.3% in 2017 and 2% in 2018 as economic conditions strengthen. This bodes well for the future of the industry, which has continued to perform well on the back of growth during the third quarter of 2017, where mining and quarrying production grew by 6.6% and contributed 0.5 of a percentage point to the GDP growth rate of 2%. Expectation of growth in our major commodities’ trading partners, such as China and India, would therefore result in increased demand for commodities. This augurs well for our mining industry. The South African mining sector’s prospects in the coming years seem positive. However, the speed and extent of the recovery is still uncertain, given the existing industry challenges.
The South African mining industry continues to offer unparalleled opportunities for both local and international investors, and has provided impetus for the development of infrastructure. It also contributes greatly to the country’s secondary industries, although, in forthcoming years, the rise of electric vehicles will have major implications for the platinum industry, of which South Africa has the largest globally proven reserves.
The outlook for greener transportation is gaining momentum as countries like the United Kingdom join France and Norway in saying that it would ban fossil fuel car sales in coming decades. Vehicle manufacturers in these countries are gearing up to announce plans to abandon the combustion engine in favour of electric cars.
These developments in the platinum industry require urgent intervention from industry stakeholders and a shift in focus to ensure a sustainable platinum mining industry into the future.
Equitable and sustainable benefit from mineral resources
Research highlights during the last quarter of the 2017/18 financial year, as a derivative of the continued studies in the Karoo area of the Northern Cape by the Council for Geoscience (CGS), include the boreholes that CGS drilled during the execution of a five-year geo-environmental baseline study in the Karoo as part of a shale gas research project that the Department is leading in partnership with CGS and the Petroleum Agency South Africa (PASA).
One borehole was found to have the capacity to produce 691 200 litres of water per day, or 20 736 000 litres per month being made available to the municipality. On 13 February 2018, I was honoured to hand over the two boreholes to the Beaufort West Municipality on behalf of the Department at a time when the Western Cape was facing its worst drought in years.
Overview of the financial results of the Department
The Department is tasked with ensuring that its limited allocated resources are used efficiently and effectively. The financial statements of the Department are presented in Section E of this Annual Report. The budget allocated per programme was utilised effectively to deliver on the mandate of the Department. The summary of key financial performance is outlined on the following page.
Departmental receipts
The main source of revenue for the Department is the prospecting fees that are levied in terms of the Mineral and Petroleum Resources Development Act. The Tariff policy remained the same during the period under review. The prospecting fee revenue is classified as rent in land.

Departm
ent of Mineral Resources
AN
NU
AL R
EPORT
2017/18
14
Departmental receipts
2017/18 2016/17
EstimateActualamount
collected
(Over-)/under- collection Estimate
Actualamount
collected
(Over-)/under- collection
R’000 R’000 R’000 R’000 R’000 R’000
Sales of scrap, waste, arms and other used current goods
1 1 – 1 1 –
Sale of goods and services other than capital assets 11 355 11 642 (287) 9 289 10 147 (858)
Fines, penalties and forfeits 859 1,294 (435) 424 990 (566)
Interest, dividends and rent on land 25 580 23 575 2,005 18 014 23 883 (5 869)
Financial transactions in assets and liabilities 2 457 2 400 57 2 430 3 052 (622)
Total 40 252 38 912 1 340 30 157 38 072 (7 915)
The departmental revenue for the 2017/18 financial year was estimated at R40.3 million, with prospecting fees and environmental application fees representing 63.4% and 19.5% respectively. Collection up to 31 March 2018 amounted to R38.9 million, which was below the projected revenue of R40.3 million by R1.2 million or 3.1%. This was mainly due to a decrease in the collection of prospecting fees and interest income. The Department intends to implement a more aggressive approach in the collection of revenue owed to the state and to improve the revenue management of the Department, particularly focusing on the debt collection period.
Virements
As reflected in the Appropriation Statement, virements amounting to R32.516 million were applied in terms of section 43(1) of the Public Finance Management Act, 1999 (Act 1 of 1999) (PFMA).
The funds shifted from programmes were used mainly to fund the shortfall on office accommodation. The details of the shifted funds and the reasons for these shifts are outlined below:
Virements for 2017/18
Shifted from R’000 Reasons
Programme 3: Mineral Regulation (8 868) Delays in implementing activities planned for the 2017/18 financial year
Programme 4: Mineral Policy and Promotion (23 648) Delays in implementing activities planned for the 2017/18 financial year
Shifted to R’000 Reasons
Programme 1: Administration 22 975 To augment shortfall under office accommodation and legal costs
Programme 2: Mine Health and Safety 9 541 To augment shortfall on compensation of employees and capital payments

Dep
artm
ent o
f Min
eral
Reso
urce
sA
NN
UA
L R
EPO
RT
201
7/18
15
Irregular, fruitless and wasteful expenditure
The irregular expenditure disclosed relates to lease payments in the 2014/15 financial year that did not follow due process. The incident on fruitless and wasteful expenditure is regarded as criminal conduct and will be reported to the enforcement agency once the investigation has been completed. The Department is currently investigating all matters relating to irregular, fruitless and wasteful expenditure, and appropriate action will be taken on conclusion of the investigations.
Supply chain management
The Department’s expenditure management is commendable as it has significantly improved its creditor payment period, ensuring compliance with the PFMA. The supply chain management process has been streamlined. On average, suppliers are paid within nine days.
The Department is committed to creating, maintaining and continually improving its supply chain management system so that it is fair, equitable, transparent, competitive and cost effective, and reducing the likelihood of fraud, corruption, favouritism, and unfair and other irregular practices.
The irregular, fruitless and wasteful expenditure that was disclosed was an unfortunate incident that occurred in 2014/15, and the Department is investigating all matters related to this incident. Consequence management will be applied upon conclusion of the investigation.
The future of the Department
The year 2018/19 marks the final year of the 2014–2019 MTSF. During the last strategic planning session, the Department reflected deeply on the goals it had set itself at the beginning of the period and committed itself to expediting those that were lagging behind. Not only did the Department
take stock of the goals that are behind, it also skimmed through the operating environment and noted immediate challenges like the increase in mining fatalities and upsurge in illegal mining, as well as perceived non-compliance by certain sections of the mining industry. It has since made sure that compliance monitoring instruments are sharpened, and has planned to engage the industry on health and safety milestones during the second quarter of the year.
The Department strives for an ethical and corruption-free Department of Mineral Resources. With the support and wisdom of the honourable Minister Mantashe, it has launched investigations at its regional offices that are aimed to eliminate undesirable elements. To date, one region has been covered, and the outcomes have been encouraging. The team will be increasing its scope to cover the other outstanding regions.
I would like to thank the officials of the Department for their efforts and support throughout the year. The oversight bodies have been a constant source of support and guidance for the implementation of internal control systems and service delivery commitments. To our stakeholders, thank you for the professional and amicable working relationship you have fostered with the Department.
Lastly, I would like to acknowledge the guidance and leadership provided by the Minister and the Deputy Minister during the year under review.
Adv. T MokoenaDirector-General Department of Mineral Resources20 September 2018

Departm
ent of Mineral Resources
AN
NU
AL R
EPORT
2017/18
16
6. STATEMENT OF RESPONSIBILITY AND CONFIRMATION OF ACCURACY FOR THE ANNUAL REPORT
To the best of my knowledge and belief, I confirm the following:
• All information and amounts disclosed throughout the Annual Report are consistent. • The Annual Report is complete, accurate and free from any omissions.• The Annual Report has been prepared in accordance with the guidelines on annual reports as issued by National Treasury.• The Annual Financial Statements (Part E) have been prepared in accordance with the Modified Cash Standard and the relevant frameworks and
guidelines issued by National Treasury.
The Accounting Officer is responsible for the preparation of the Annual Financial Statements and for the judgements made in this information.
The Accounting Officer is responsible for establishing and implementing a system of internal control that has been designed to provide reasonable assurance as to the integrity and reliability of the performance information, the human resources information and the Annual Financial Statements.
The external auditors are engaged to express an independent opinion on the Annual Financial Statements.
In my opinion, the Annual Report fairly reflects the operations, performance information, human resources information and financial affairs of the Department for the financial year ended 31 March 2018.
Yours faithfully
Accounting OfficerAdv. T Mokoena20 September 2018

Dep
artm
ent o
f Min
eral
Reso
urce
sA
NN
UA
L R
EPO
RT
201
7/18
17
7. STRATEGIC OVERVIEW7.1. Vision
A globally competitive, sustainable and meaningfully transformed mining and minerals sector.
7.2. Vision 2030
A leader in the transformation of South Africa through economic growth and sustainable development.
7.3. Mission
Promote and regulate the minerals and mining sector for transformation, growth and development, and ensure that all South Africans derive sustainable benefit from the country’s mineral wealth.
7.4. Values
• Accountability • Batho Pele (putting people first)• Ethics• Honesty• Integrity • Professionalism• Ubuntu
8. LEGISLATIVE AND OTHER MANDATES8.1. Constitutional mandate
The Department of Mineral Resources derives its mandate from section 24 of the Constitution of South Africa, Act No. 108 of 1996.
8.2. Legislative mandate
The principal acts driving the work of the Department are the Mineral and Petroleum Resources Development Act (Act No. 28 of 2002) and the Mine Health and Safety Act (Act No. 29 of 1996) (MHSA). The two acts provide the regulatory framework for the promotion and regulation
of the mining, minerals and petroleum industry. They also provide the regulatory framework for ensuring equitable access to and the sustainable development of the nation’s mineral resources and related matters.
8.3. Policy mandate
The Minerals and Mining Policy for South Africa (White Paper, 1998) ensures the transparent and efficient regulation of the development of South Africa’s mineral resources and mineral industry to meet national objectives and bring optimum benefit to the nation.

Departm
ent of Mineral Resources
AN
NU
AL R
EPORT
2017/18
18
9. ORGANISATIONAL STRUCTURE
Minister: Mr SG Mantashe
Deputy Minister: Mr G Oliphant
Accounting Officer: Adv. T Mokoena
Chief Financial Officer: Ms RI Singo
Chief Inspector of Mines: Mr D Msiza
DDG: Mineral Regulation: Adv. S Malebe
DDG: Mineral Policy and Promotion:
Ms N Ngcwabe
DDG: Corporate Services Ms P Gamede

Dep
artm
ent o
f Min
eral
Reso
urce
sA
NN
UA
L R
EPO
RT
201
7/18
19
10. ENTITIES REPORTING TO THE MINISTERThe table below indicates the entities that report to the Minister.
Name of entity Legislative mandate Financial relationship Nature of operations
Mine Health and Safety Council (MHSC)
Established in terms of section 42(1) of the Mine Health and Safety Act, Act No. 29 of 1996
Co-funding in terms of the establishment Act
Research and advisory function to the Minister in terms of mine health and safety, as well as promoting a culture of health and safety in the mining industry
Council for Mineral Technology Research (Mintek)
Established in terms of the Mineral Technology Act, Act No. 30 of 1989
Co-funding in terms of the establishment Act
Provides research, development and technology that fosters the development of business in the mineral and mineral products industries
Council for Geoscience (CGS) Established in terms of the Geoscience Act, Act No. 100 of 1993
Co-funding in terms of the establishment Act
Development and maintenance of the national geosciences knowledge infrastructure for both the onshore (land) and offshore (oceans) environments of South Africa
South African State Diamond and Precious Minerals Regulator (SADPMR)
Established in terms of the Diamond Act, 1986, as amended, and the Precious Metals Act, Act No. 37 of 2005
Co-funding in terms of the establishment Act
Regulation of the diamond, platinum and gold sectors
State Diamond Trader (SDT) Established in terms of the Diamond Act, Act No. 56 of 1986
Co-funding in terms of the establishment Act
Promotes equitable access to and beneficiation of diamond resources, addresses distortions in the diamond industry and corrects historical market failures to develop and grow South Africa’s diamond-cutting and polishing industry

20
Departm
ent of Mineral Resources
AN
NU
AL R
EPORT
2017/18
PART BPERFORMANCE INFORMATION
21
Dep
artm
ent o
f Min
eral
Reso
urce
sA
NN
UA
L R
EPO
RT
201
7/18
1. AUDITOR-GENERAL’S REPORT: PREDETERMINED OBJECTIVES
The Auditor-General South Africa (AGSA) currently performs certain audit procedures on the performance information to provide reasonable assurance in the form of an audit conclusion. The audit conclusion on the performance against predetermined objectives is included in the report to management, with material findings being reported under the
“Predetermined objectives” heading in the report on other legal and regulatory requirements section of the Auditor’s Report.
Refer to page 104 for the Report of the Auditor-General, published in Part E: Financial Information of this annual report.
2. OVERVIEW OF DEPARTMENTAL PERFORMANCE
2.1 Service delivery environment
2.1.1 Mine Health and Safety Inspectorate
Skills development
Skills development and education are crucial in resolving the triple challenges of unemployment, inequality and poverty. It is against this background that the Branch continues with the implementation of its sustainable, integrated and comprehensively aligned human capital development strategies. These strategies are aimed at achieving sufficient and relevant skills in the mining sector. During the period under review, the Branch successfully implemented the Certificate of Competency model and issued 25 Mine Manager’s Certificates of Competency (MMCC).
Current health and safety performance
The Department is concerned about the fatalities it has been seeing at the mines. In 2017, the mining and minerals sector recorded an increase in fatalities for the first time since 2007. Some 88 fatalities were recorded in 2017, compared to 73 in 2016. Furthermore it is worth noting that the number of occupational injuries decreased from 2 847 in 2016 to 2 534 in 2017, while occupational diseases decreased from 3 531 in 2016 to 3 056 in 2017.
Health and safety is everyone’s responsibility – mine management, labour and the Regulator. Profits cannot be prioritised at the expense of workers’
lives. Unions also have a responsibility to encourage their members to remain vigilant at all times. The Department will continue to enforce the Mine Health and Safety Act.
The ultimate goal, to which members of the Department have committed as stakeholders in the industry, remains that of ensuring that every worker returns home unharmed every day. Meetings will be held with stakeholders during the second quarter of 2018 to look at where the Department is going wrong in terms of reaching its milestone targets on health and safety. 2.1.2 Mineral Regulation
Most of the targets concerning the Mineral Regulation Branch were achieved except for the number of jobs created through mining. This is because of the poor performance of the mining sector, which is on a declining slope due to decreases in commodity prices, the percentage turnaround adherence to prescribed timeframes due to submissions served before the licensing committee, which are outside the 90-day time frame, the percentage implementation of the management action plan (internal audit) due to some management action plans being carried over to the second quarter of the 2018/19 financial year, the number of Social and Labour Plan (SLP) development projects being completed due to some local economic development (LED) projects being put on hold due to mining companies requesting deviations from the approved projects in terms of Regulation 44, the percentage of statutory notices or directives issued, as well as the percentage of complaints closed versus those received due to the method of

22
Departm
ent of Mineral Resources
AN
NU
AL R
EPORT
2017/18
calculation on the technical description measure being misaligned with the measure definition, and the number of industry workshops due to financial constraints as the budget was diverted to address conflicts between mining companies and communities. Procurement is a critical pillar of the Mining Charter. The Department is concerned about the way in which procurement is managed in the mining industry. It is worrying that procurement opportunities for black economic empowerment (BEE) companies are mostly limited to catering, cleaning, gardening and transport, and not enough procurement opportunities are being provided in capital goods and services.
2.1.3 Mineral Policy and Promotion
The Branch was able to achieve most of its targets, but factors such as, vacant posts for key management positions, for instance, that of Deputy Director-General hampered performance. The main challenges have been with regard to performance on the legislative mandate of the Department where the MPRDA, as the principal Act of the mining and minerals industry, has not been finalised since it was first introduced to the National Assembly in 2016. The National Assembly referred the Bill to the National Council of
Provinces to consider the issues that were raised by the former President relating to the public consultation process undertaken by provincial legislatures. The Department, as the custodian of the Bill, had to brief all provincial committees in the provincial legislatures on the MPRDA Bill, as well as be available throughout this process to provide support to the NCOP and provincial legislatures in their processes to facilitate meaningful public participation on the MPRDA Bill, as directed by the President.
Subsequent to extensive consultation with communities throughout the country, the Mining Charter, 2017, was gazetted and published on 15 June 2017 for implementation, but could not be implemented due to the Chamber of Mines instituting legal action against the Department on the Charter, as well as complaints received from stakeholders and communities. In early 2018, with the appointment of the new President, the Department was directed to reopen stakeholder engagements on the Charter, which were aimed at resolving the impasse, thereby nullifying the Mining Charter, 2017, document.
Both the MPRDA and the Mining Charter consultation processes required a lot of resources, human, financial and otherwise, stretching the little resources that were there to ensure a smooth process. This meant that service delivery on other fronts was compromised.
2.2 Service Delivery Improvement Plan
Main services and standards
Main services Beneficiaries Current/actual standard of service Desired standard of service Actual achievement
Publishing of the South African Mining Industry (SAMI) as part of investment promotion
• Investors• Mining industry• Institutions of higher
learning
Annual publication in March Annual publication in November/December
• Published by end of March
• Beneficiaries’ list continues to increase
• Published annually in March
• Intention to publish in November
Government Competency Certificate
• Department of Mineral Resources
• Mining Qualifications Authority
• Mining industry• Mining professionals
Issuing certificates of competency to qualifying candidates
Candidates issued with certificates after meeting qualifying requirements
• Examination results published in May and October for MMCC and Mine Surveyor’s Certificate of Competency (MSCC)
• Examination results published in June and November for engineers

23
Dep
artm
ent o
f Min
eral
Reso
urce
sA
NN
UA
L R
EPO
RT
201
7/18
Batho Pele arrangements with beneficiaries (consultation, access, etc.)
Current/actual arrangements Desired arrangements Actual achievements
Publishing of SAMI as part of investment promotion
Quality Compliance with the International Standard Book Number (ISBN) and the South African Statistics Act.
• Compliant with ISBN regulations and adequately researched information, using statistical information.
Consultation Any communication with the users of SAMI is communicated through the Department’s website (www.dmr.gov.za). SAMI contains a telephone number that users can call to communicate with the Department regarding SAMI.
• Consultation platform provided by publishing the Department’s website address, and telephone and fax numbers to allow for feedback and inputs.
Courtesy The information contained in SAMI provides users with the current and past performance of the minerals and metals sector in order to inform their investment decisions where applicable. Whereas the greatest care has been taken in the compilation of the contents of SAMI, the Mineral Economics Directorate and the Department does not hold itself responsible for any errors and omissions.
• The information is adequately researched, and quality edited by professionals before approval. While there is a disclaimer for omission and errors, there has not been any negative feedback.
Access SAMI is distributed to the list of users included in the database. SAMI is also posted on the Department’s website after it has been printed and published. It is also available on hard copy and on CD for any user of SAMI at the DMR.
• Achieved through formal and systematised distribution. However, there are more distribution platforms such as giving the publication to one-on-one client meeting with managers.
Information The information contained in SAMI is collected from different mineral resources companies, mines and other institutions that hold such information. The information is reviewed, edited and approved by qualified staff, which results in the final information being accurate and reliable. While the greatest care has been taken in compiling the contents of SAMI, the Mineral Economics Directorate and the Department do not hold themselves responsible for any errors and omissions.
• The information is adequately researched from a huge pool of subscriptions, research material, and other professional and reliable sources, and is quality edited by professionals before approval by the Director: Mineral Economics.
Openness and transparency
The information contained in SAMI is a true reflection of the past performance of the South African mineral industry and the performance of the global mineral industry. The Department’s contact details are included in SAMI for the public to use if they require further clarity on the information contained in the publication.
• Achieved and the information is for national and international public consumption and use.
Redress The Minister of Mineral Resources may withdraw or amend any information contained in SAMI if the amendment or withdrawal is necessary or will result in accurate and reliable information being presented.
• The Minister reserves the right to withdraw the publication.
Value for money
SAMI contains valuable information regarding the performance of the global minerals and metals industry, including South Africa. It also gives market trends of the minerals and metals sector. The information contained in SAMI gives users insights into the country’s mineral sector. The trends can be used for investment decisions.
• The information provides true value for money.
Government Competency Certificate
Consultation Information relating to the Government Certificate of Competency (GCC) is available on the Department’s website.
• Examination information is available on the Department’s website, via email or telephone, and walk-ins are attended to at the secretaries of the respective commissions.
Courtesy Candidates are primarily notified by mail of the acceptance or rejection of their applications. If the application has been rejected, the reasons for non-acceptance are stated in the rejection letter. Complaints are received from candidates mainly through email and are attended to speedily.
• Each applying candidate receives the outcome of their application and areas for attention if the application is unsuccessful.
• Candidates can submit further correspondence for clarity, where necessary.

24
Departm
ent of Mineral Resources
AN
NU
AL R
EPORT
2017/18
Current/actual arrangements Desired arrangements Actual achievements
Access All the information relating to the GCC is available on the Department’s website.
• Candidates can obtain the relevant examination information on the Department’s website.
• Secretaries are available for consultation, where necessary.Information The information about the programme is available on the Department’s website
with the contact details of the relevant officials.• Information on the website directs candidates to the relevant
official(s).• A list with the contact names of the officials involved with
examination is available for perusal and use.Openness and transparency
The results of all candidates are made available. Candidates are at liberty to apply for a remark. Appeals of the remark outcomes are explained to their supervisors with proof of the examination paper written by the candidate.
• All examination results are made available, ensuring respect for privacy.
• Candidates can apply for a remark when unsatisfied with the outcome of the examination.
Redress A remark is performed upon receiving the request for remarking from the candidate. The candidate may appeal to the Chief Inspector of Mines for leniency on any requirement relating to the GCC.
• Candidates who had applied for a remark can appeal if they are not happy with the subsequent outcome of the remark.
Value for money
After the candidate has obtained the GCC, they will have the knowledge that will assist them in performing their duties effectively and efficiently, and they will earn more money for their own account.
• The knowledgeable candidate will have better life prospects (socially, economically, etc.).
• The mining industry will benefit with competent individuals who will contribute in ensuring that mining takes place under health and safety conditions.
Service delivery information tool
Current/actual information tools Desired information tools Actual achievements
Publishing SAMI as part of investment promotion
SAMI can be used as a critical part of investment attraction and decisions made by investors.
• SAMI continues to form a key tool in investment promotion and will remain a key component investment tool.
Government Competency Certificate
Examination results can be used as a measure of the supply vs demand of competent individuals within the mining and minerals sector.
• Reduction of accidents and fatalities through the employment of competent individuals.
• Mining takes place under health and safety conditions.
Complaints mechanism
Current/actual information tools Desired information tools Actual achievements
Publishing SAMI as part of investment promotion
The publication indicates that complaints must be directed to a responsible official, the Director: Mineral Economics, with a telephone number, fax number and the Department’s website that contains up-to-date key contact numbers.
• A mechanism is in place and functional. • The next SAMI will be revised to include the official responsible, the contact
numbers of the official (including contact numbers of the Office of the Director-General), an email address and the Department’s website address.
Government Competency Certificate
Complaints that are in writing are directed to the supervisors of the unit.
• The manager attends to complaints with assistance from the affected officials.• A candidate who is still unhappy is directed to lay a complaint with the senior
management of the Branch.

25
Dep
artm
ent o
f Min
eral
Reso
urce
sA
NN
UA
L R
EPO
RT
201
7/18
2.3 Organisational environment
During the 2017/18 financial year, the position of Director-General was filled. This brought direction in the Department as the post had been vacant for two years. For the first time, managers signed a pledge of ethical conduct, in which they committed to disclosing their financial interests and ensuring that designated employees under their control also disclose their financial interests. The Director-General also signed values for DMR to be distributed to all offices. These core values stressed the importance of ethics in achieving the strategic objectives of the Department.
On the other hand, service delivery was negatively impacted on by the departure of the DDG: Mineral Regulation and the DDG: Mineral Policy and Promotion. Further to this, a number of critical posts in the Department could not be filled due to a lack of funding, which impacted on the staff morale of employees who shouldered the additional workload. The prioritisation of funds was, however, conducted at an executive level and the Department is in the process of filling some critical positions that were identified.
2.4 Key policy developments and legislative changes
2.4.1 Mineral Resources Development Amendment Bill
The Mineral and Petroleum Resources Development Amendment Bill, 2013 is serving before NCOP’s Select Committee on Land and Mineral Resources. Eight of the nine provincial legislatures supported the Bill in the negotiating mandates process. The Department has provided responses to the provincial legislature’s negotiating mandates and the Committee has, to date, finalised voting on negotiating mandates. The Select Committee is still to engage on the final mandates’ voting process and to compile a report with recommendations to the National Assembly for the further processing of the Bill by Parliament. The Department has supported and will continue to support Parliament to ensure the imminent finalisation of the MPRDA Bill so as to improve investment in the industry, which will lead to sustainable development, transformation and growth in the sector
2.4.2 The Mining Company of South Africa Bill
The Department has developed the Mining Company of South Africa (MincoSA) Draft Bill, which proposes establishing the African Exploration Mining and Finance Corporation (AEMFC) as an independent state-owned entity (SOE). Establishing AEMFC through legislation will assist government to define the mandate and strategic objectives of the entity and ensure that its corporate planning is aligned with the broader national
priorities of government as outlined in the National Development Plan (NDP). In addition to defining and clarifying the legislative mandate and government’s expectations, the Draft Bill provides for its legal status, and locating AEMFC within the appropriate level of governance in order to comply with the requirements of PFMA and related regulations.
The Bill was published in 2016 for public comment, and all submissions received were considered and revised accordingly. The revised Bill has since been presented to the Directors-General Economic Sectors Employment and Infrastructure Development (ESEID) Cluster, where concerns were raised. These have been addressed.
An Interdepartmental Task Team was established to identify modalities to ensure the efficient hiving off of AEMFC from the Central Energy Fund (CEF). The Interdepartmental Task Team has been meeting frequently to work on the modalities for an efficient hiving off. The Bill will be processed further as soon as the task team has finalised its work.
2.4.3 Mining Charter
The Department has reopened engagements with mining industry stakeholders on the Mining Charter, 2017, as directed by the President during the State of the Nation Address, following its gazetting in June 2017. These engagements are aimed at resolving the impasse on the Mining Charter, 2017, to produce a Mining Charter that is supported by relevant stakeholders.
The consultation process on the Mining Charter was launched in March 2018 by a meeting of social partners that established two task teams; one focusing on the transformation of the mining industry, and the other on competitiveness and growth. Parallel to the work of the task teams, mine community consultations, aimed at involving members of the mining communities in making inputs to the Mining Charter before it is finalised, also commenced. The mine community consultations were held in all nine provinces. The work of the Stakeholder Task Teams and the community consultations culminated in the draft Mining Charter, 2018, which was published for public comment on 15 June 2018 for a period of 30 days.
On 7 and 8 July 2018, a Mining Charter Summit was held with mining industry stakeholders, including communities, organised labour and organised business for further consultation. Inputs received from the task teams, community consultations and the Summit will be duly considered in the final Mining Charter. The due date for the submission of written submissions has been extended to 31 August 2018.

26
Departm
ent of Mineral Resources
AN
NU
AL R
EPORT
2017/18
3. STRATEGIC OUTCOME-ORIENTED GOALS
Outcome 10: Protect and enhance our environmental assets and natural resources
The Department of Mineral Resources has been reporting on Outcome 10 on a quarterly basis with regard to the number of derelict and ownerless mine sites that have been rehabilitated. The rehabilitation programme is inclusive of mine dumps and dangerous mine openings (shafts). The MTSF target is 235.
To this end, the Department managed to rehabilitate 184 derelict and ownerless mines by the end of the 2017/18 financial year. In the current financial year, the Department planned to rehabilitate 45 derelict and ownerless mines. The annual target will be achieved by the end of the 2018/19 financial year.
The Department has ensured that, consistent with its strategic outcomes, its key environmental goals are attained by ensuring that all prospecting and mining activities are undertaken in an environmentally sustainable manner. Further to that, the Department is ensuring that the state does not inherit any environmental liability caused by the holders of rights and permits, thereby also preventing any possibility of creating future derelict and ownerless mines.
The Branch’s significant achievements and contribution to the strategic outcomes during the period under review include consultation or engagements with communities as an intervention between mining communities and mining companies and other stakeholders. This is to improve healthy relations between all parties concerned and ensure stability.
Outcome 4: Decent employment through inclusive growth
The Department has, through the SLP development projects, facilitated the creation of 5 372 jobs, and through the licensing regime, granted a number of licenses to mining companies across the country, which will contribute to socio-economic development and increase employment opportunities within the country. The Minerals Board has held 34 Section 52 meetings with mining companies, where the intention is to ameliorate job losses within the industry. The Minister has implored the mining industry to follow section 52 of the MPRDA by engaging the Minerals Board and delaying section 189 of the Labour Relations Act until the section 52 process has been exhausted, as part implementing the declaration on job saving.
Outcome 6: An efficient, competitive and responsive economic infrastructure network
Government, through the NDP and the MTSF process, has emphasised the importance of ensuring a sustainable local coal supply for the country’s energy requirements. This commodity currently plays a vital role in meeting South Africa’s primary energy needs, as well as in the economy in general. It is recognised that coal contributes to the economy, not only to supply energy, but through the generation of export revenue, contributing to GDP and employment. The Department is currently engaged with the completion of the Mining Charter and is eager for the Select Committee to finalise the MPRDA. The conclusion of these two legislative instruments, as the foundation of mining legislation, will enable completion of the coal policy.

27
Dep
artm
ent o
f Min
eral
Reso
urce
sA
NN
UA
L R
EPO
RT
201
7/18
4. PERFORMANCE INFORMATION BY PROGRAMME
During the 2017/18 financial year, the activities implemented by the Department were in the following programmes:
Programme 1: Administration (Corporate Services and Financial Administration)
Programme 2: Mine Health and Safety InspectorateProgramme 3: Mineral RegulationProgramme 4: Mineral Policy and Promotion
4.1 Programme 1: Corporate Services
Purpose
To enable the Department to deliver on its mandate by providing strategic support, management services and administrative support to the Department and Ministry.
Sub-programmes
• Human Resource Administration and Practices• Human Resource Planning• Organisational Development• Human Resource Development• Employment Relations Management• Legal Services• Communication• Special Projects • Auxiliary Support Services
Strategic objectives
• Contribution to skills development• Sustainable development of vulnerable groups• Communication of the Department’s programmes with internal and
external stakeholders
• Provision of adequate facilities for effective service delivery• Development, review and improvement of internal processes and
procedures• Provision of professional legal support and advisory services to the
Ministry• Improvement of turnaround times• Ensuring the implementation of national strategies• Compliance with legislation• Attraction, development and retention of skills • Promotion of corporate governance.
Strategic objectives, performance indicators, planned targets and actual achievements
Contribution to skills development
The Department conducted career exhibitions at 12 institutions of higher learning: University of Venda, University of Western Cape, Central University of Technology, Northwest University, Mangosuthu University of Technology, University of South Africa (Unisa) (Main Campus), Nelson Mandela University, Unisa (Pietermaritzburg Campus), Unisa (Durban Campus), Durban University of Technology, Sol Plaatjie University and Unisa (Middelburg Campus). Through these exhibitions, 1 768 youth were reached and obtained mining-related career information. This initiative has also made the mining industry attractive to youth. Moreover, students were made aware of subjects for which they need to enroll for the GCC and MMCC.
Development, review and improvement of internal processes and procedures
Nineteen departmental processes were improved or re-engineered, allowing for optimal performance and ensuring that such processes are understood and consistently followed and applied. The improvement of business processes maximises process efficiency, thereby ensuring higher productivity and output.
28
Departm
ent of Mineral Resources
AN
NU
AL R
EPORT
2017/18
Ensuring the implementation of national strategies
The continuous screening of prospective candidates and vetting of employees gave rise to a workforce with integrity. The benefits were not only to acquire a skilled workforce, but also candidates who can deliver the mandate of the Department with integrity.
Procuring services from service providers that are involved in illicit activities will damage the image of the Department, which may result in business and the public losing confidence in the Department. Despite the fraudulent activities that have been taking place in the Department’s jurisdiction, the screening of companies minimised the risk of reputational damage against the Department.
Compliance with legislation
All departmental senior managers adhered to the call to disclose their financial interests for the previous financial year, as required by the Public Service Regulations, the action of which contributes positively to ethical conduct in the Department.
Attraction, development and retention of skills
In accordance with the Workplace Skills Plan submitted to the Mining Qualifications Authority (MQA) and Public Service Sector Education and Training Authority (PSETA), the Department trained 464 employees during the 2017/18 financial year. Of these employees, 270 are female and 194 are male. Employees were trained in various training programmes, from generic to technical courses, including ISO 14001, Environmental Law, Geographic Information Systems, SAMTRAC for Mining, Project Management, Monitoring and Evaluation, Records Management, Management Development Programme, and Project Khaedu. Through the abovementioned programmes, employees gained the knowledge and skills that were needed to execute their tasks efficiently, thereby ultimately
maximising organisational performance. Moreover, a pool to promote candidates from within the Department has been widened, especially among women.
The Department appointed 53 interns during the financial year. Of these, 27 are female and 26 male. Six of the interns were employed permanently within the public service and private sector.
Twenty-six managers have undergone development assessment through the Department’s Development Assessment Centre (DAC). This centre identifies individual strengths and development areas on different managerial levels in order to diagnose development needs that will enhance more effective job performance and/or career development and advancement, which, in turn, contributes to the attainment of greater organisational success.
The Department awarded 58 internal bursaries to enroll for programmes in the following fields: community development, environmental health, science and management, law, economics, mining engineering and safety management. Furthermore, 18 bursary holders completed their studies in the following programmes: Bachelor of Administration, Bachelor of Arts (Administration), Bachelor of Law, BTech: Forensic Investigation, BTech: Human Resource Management, BTech: Logistics, BTech: Mining Engineering, National Diploma: Economic Management, National Diploma: Management Services, National Diploma: Public Relations, Environmental Management Honours, Public Administration Honours, Public Management Honours, Masters in Business Administration, Postgraduate Diploma: Mining and Policy Environment.
By obtaining the abovementioned qualifications, employees gained the knowledge and skills needed to execute their tasks efficiently, which ultimately maximises performance and creates a pool from which to promote, not only the Department, but the public service in general.

29
Dep
artm
ent o
f Min
eral
Reso
urce
sA
NN
UA
L R
EPO
RT
201
7/18
PROGRAMME 1: ADMINISTRATION
Branch: Corporate Services
Strategic objective Performance indicator
Actual achieve-
ment 2014/15
Actual achieve-
ment 2015/16
Actual achieve-
ment 2016/17
Planned target
2017/18
Actual achieve-
ment 2017/18
Deviation from planned
target to actual
achievement for 2017/18
Comment on deviations
Contribution to skills development
Number of mining career awareness initiatives – Human Resource Development (HRD)
19 21 20 9 9 –
Number of mining career awareness initiatives –Special Projects
– – – 10 12 2
The over-achievement is due to an invitation by Unisa to other Unisa campuses that were not in the plan.
Number of bursaries acquired and recipients identified to study towards mining-related qualifications.
23 21 25 20 45 25
Over-achievement is due to the Department soliciting the MQA to support private-sector bursaries.
Sustainable development of vulnerable groups
Number of identified projects facilitated for vulnerable groups (cumulative)
6 7 7 6 7 1
The Branch had planned to initiate six projects as per the target for 2017/18. However, the Branch over-achieved as a result of the Bophelong Stimulation Centre in Balfour, Mpumalanga, which was not on the pipeline due to companies experiencing an economic downturn. This project was then implemented during 2017/18.

30
Departm
ent of Mineral Resources
AN
NU
AL R
EPORT
2017/18
Branch: Corporate Services
Strategic objective Performance indicator
Actual achieve-
ment 2014/15
Actual achieve-
ment 2015/16
Actual achieve-
ment 2016/17
Planned target
2017/18
Actual achieve-
ment 2017/18
Deviation from planned
target to actual
achievement for 2017/18
Comment on deviations
Communication of DMR programmes with internal and external stakeholders
Review and implement DMR communication strategy
N/A N/A N/A 100% 100% 0%
Provision of adequate facilities for effective service delivery
Percentage of facilities aligned with business needs
94% 95% 95% 95% 95% 0%
Development of Facilities Management Strategy
N/A N/A N/A 1 1 0
Development, review and improvement of internal processes, guidelines and procedures
Number of policies or guidelines developed and/or reviewed
10 6 5 10 14 4
Over-achievement is due to urgent need to review Acting Policy, Policy on Management of Leave, Transport Policy and Security Policy.
Number of improved of re-engineered processes 15 17 17 15 19 4
Over-achievement is due to a project in mapping or improving all business process e.g Acceptance of Gifts, Performance Management and Development Systems.
Number of standard operating precedures (SOPs) developed
N/A N/A N/A 10 19 9
Over-achievement is due to a project to develop SOPs for all business processes within the Branch.

31
Dep
artm
ent o
f Min
eral
Reso
urce
sA
NN
UA
L R
EPO
RT
201
7/18
Branch: Corporate Services
Strategic objective Performance indicator
Actual achieve-
ment 2014/15
Actual achieve-
ment 2015/16
Actual achieve-
ment 2016/17
Planned target
2017/18
Actual achieve-
ment 2017/18
Deviation from planned
target to actual
achievement for 2017/18
Comment on deviations
Provision of professional legal support and advisory service to the Ministry and the Department
Percentage of timeous responses to opinions, appeals, enquiries, agreements and litigations
84% 86% 83% 80% 81% 1%
Over-achievement is due to the Branch receiving more appeals in the current cycle than in the previous cycle, but the Branch managed to finalise them on time.
Improvement of turnaround times
Percentage adherence to defined turnaround times
100% 100% 100% 100% 100% 0%
Percentage adherence to service-level agreements (SLAs)
100% 100% 100% 100% 100% 0%
Ensuring implementation of national strategies
Number of vetting files completed and submitted to the State Security Agency (SSA)
120 120 120 100 100 –
Percentage of pre-employment screening requests processed
100% 100% 100% 100% 100% 0%
Percentage of service providers' and contractors' screening requests processed
100% 100% 100% 100% 100% 0%
Number of gender equality strategic plans implemented
N/A 9 10 8 8 –

32
Departm
ent of Mineral Resources
AN
NU
AL R
EPORT
2017/18
Branch: Corporate Services
Strategic objective Performance indicator
Actual achieve-
ment 2014/15
Actual achieve-
ment 2015/16
Actual achieve-
ment 2016/17
Planned target
2017/18
Actual achieve-
ment 2017/18
Deviation from planned
target to actual
achievement for 2017/18
Comment on deviations
Ensuring implementation of national strategies
Number of health, safety and wellness programmes implemented
20 8 8 8 8 –
Compliance with legislation (Human Resources (HR) and Occupational Health and Safety (OHS))
Number of actions implemented to ensure the submission of financial disclosures
N/A N/A 5 5 5 –
Percentage of HRD Plan or Workplace Skills Plan (WSP) submitted to the Department of Public Service and Administration (DPSA), PSETA and MQA within the prescribed time frames
100% 100% 100% 100% 100% 0%
Number of actions implemented to ensure submission of performance agreements
N/A N/A 4 4 4 –
Number of HRD initiatives aligned to the goals of the National Skills Development Strategy (NSDS) implemented
14 17 18 17 17 –

33
Dep
artm
ent o
f Min
eral
Reso
urce
sA
NN
UA
L R
EPO
RT
201
7/18
Branch: Corporate Services
Strategic objective Performance indicator
Actual achieve-
ment 2014/15
Actual achieve-
ment 2015/16
Actual achieve-
ment 2016/17
Planned target
2017/18
Actual achieve-
ment 2017/18
Deviation from planned
target to actual
achievement for 2017/18
Comment on deviations
Compliance with legislation (HR and OHS)
Maintain the vacancy rate at an acceptable level (10%)
14% 14% 6.4% 10% 10.29% 0.29%
The process of filling positions is already underway and should be completed by the end of August 2018.
Number of change management initiatives implemented
N/A N/A N/A 3 3 –
Promotion of corporate governance
Percentage implementation of management action plan (internal audit)
100% 100% 100% 100% 100% 0%
Percentage implementation of management action plan (external audit)
100% 67% 100% 100% 50% -50%
Critical positions were identified and advertised by the Department. The interviews and filling of the posts will be completed in the 2018/19 financial year. The Branch is currently in the process of filling posts, and will report in the first quarter on 30 June 2018.
Percentage adherence to compliance framework
100% 100% 100% 100% 100% 0%
Percentage implementation of risk management plans 97% 89% 94% 100% 78% -22%
Partially achieved due to Legal Services awaiting approval of the Manual for Inspectors of Mine Health and Safety. To be implemented once the manual for inspectors is approved.

34
Departm
ent of Mineral Resources
AN
NU
AL R
EPORT
2017/18
Strategy to overcome areas of underperformance
• Maintain the vacancy rate at an acceptable level (10%):
Target : 10%.
Achieved: 10.29%.
Not achieved.
Given the current financial constraints of employees, the Department was in the process of rationalisation. Out of that process, 14 positions were identified as critical and subsequently funded.
• Percentage implementation of management action plan (external audit):
Target: 100%.
Achieved: 50%.
Partially achieved due to critical positions being identified and advertised by the Department. The interviews and filling of the posts will be completed in the 2018/19 financial year.
• Percentage implementation of risk management plans:
Target: 100%.
Achieved: 78%.
Partially achieved due to Legal Services awaiting approval of the Manual for Inspectors of Mine Health and Safety. Senior Management Service (SMS) unavailability to form Committee. Lack of training course for moderation of performance.
4.2 Programme 1.1: Financial Administration
Purpose
To enable the Department to deliver on its mandate by providing strategic support management services and administrative support to it and the Ministry.
Sub-programmes
• Finance (Financial Planning and Management Accounting, Expenditure Management, Supply Chain Management)
• Information Management (Information Technology and Systems Development and Maintenance)
Strategic objectives
• Provision of efficient services to internal and external stakeholders• Implementation of processes and systems• Management of financial resources• Promotion of corporate governance
Strategic objectives, performance indicators, planned targets and actual achievements
The Branch provided efficient services to internal and external customers by ensuring that financial reports are delivered on schedule, suppliers are paid within 30 days and systems are above 95% available. The Branch further implemented processes and systems through the Master Systems Plan (MSP) that was fully implemented. Despite the one irregular expenditure incident that occurred, the Branch continued to ensure the management of financial resources and fully implemented the asset management plan and budget integrated plan, and spent within the allocated budget.

35
Dep
artm
ent o
f Min
eral
Reso
urce
sA
NN
UA
L R
EPO
RT
201
7/18
Branch: Financial Administration
Strategic objective Performance indicator
Actual achieve-
ment 2014/15
Actual achieve-
ment 2015/16
Actual achieve-
ment 2016/17
Planned target
2017/18
Actual achieve-
ment 2017/18
Deviation from planned
target to actual
achievement for 2017/18
Comment on deviations
Provision of efficient services to internal and external customers
Percentage system availability 99.50% 99.99% 99.00% 95% 99.67% 4.67%
The reason for the deviation on percentage system availability is that the target had taken into account system downtime, but none was experienced during the financial year.
Percentage achievement of SLA
98.46% 86.11% 97.00% 95% 93.2% -1.8%
Partially achieved due to calls not attended to within the agreed standard turnaround times. This is a regression compared to the previous year when the target was achieved at 97.62%.
Customer satisfaction index (1–5)
3.40 3.20 2.07 3 2.38 -0.62
Partially achieved due to a delay in the delivery of cellphones, network down and challenges in printing.
Percentage of financial reports delivered on schedule
100% 100% 100% 100% 100% 0%
Percentage of suppliers paid within 30 days
99.57% 92.50% 100.00% 100% 99.12% -0.88%
Partially achieved. Quarter 4 target was achieved. This is consistent with the same period in the previous financial year. Due to the target not being achieved in Quarter 1, the cumulative target was partially achieved.
Implementation of processes and systems
Percentage implementation of the MSP
100% 100% 100% 100% 100% 0%

36
Departm
ent of Mineral Resources
AN
NU
AL R
EPORT
2017/18
Branch: Financial Administration
Strategic objective Performance indicator
Actual achieve-
ment 2014/15
Actual achieve-
ment 2015/16
Actual achieve-
ment 2016/17
Planned target
2017/18
Actual achieve-
ment 2017/18
Deviation from planned
target to actual
achievement for 2017/18
Comment on deviations
Management of financial resources
Percentage variance on allocated budget
0.02% 0.00% 0.50% 2.00% 0.2% -1.8%
Percentage implementation of the integrated budget plan
N/A N/A N/A 100% 100% 0%
Number of incidents of irregular expenditure
1 0 0 – 1 1
Partially achieved due to non-compliance with the Preferential Procurement Policy Framework Act (PPPFA) on 80/20 principles. Stationery tender was evaluated on 80/20 principle instead of 90/10 principle. The incident occurred in Quarter 2 and was only realised in Quarter 3. No irregular expenditure was incurred in the previous financial year compared to the one case of irregular expenditure incurred in the year under review.
Percentage implementation of asset management plan
N/A N/A 100% 100% 100% 0%
Promotion of corporate governance
Percentage implementation of management action plan (internal audit)
100% 100% 100% 100% 100% 0%
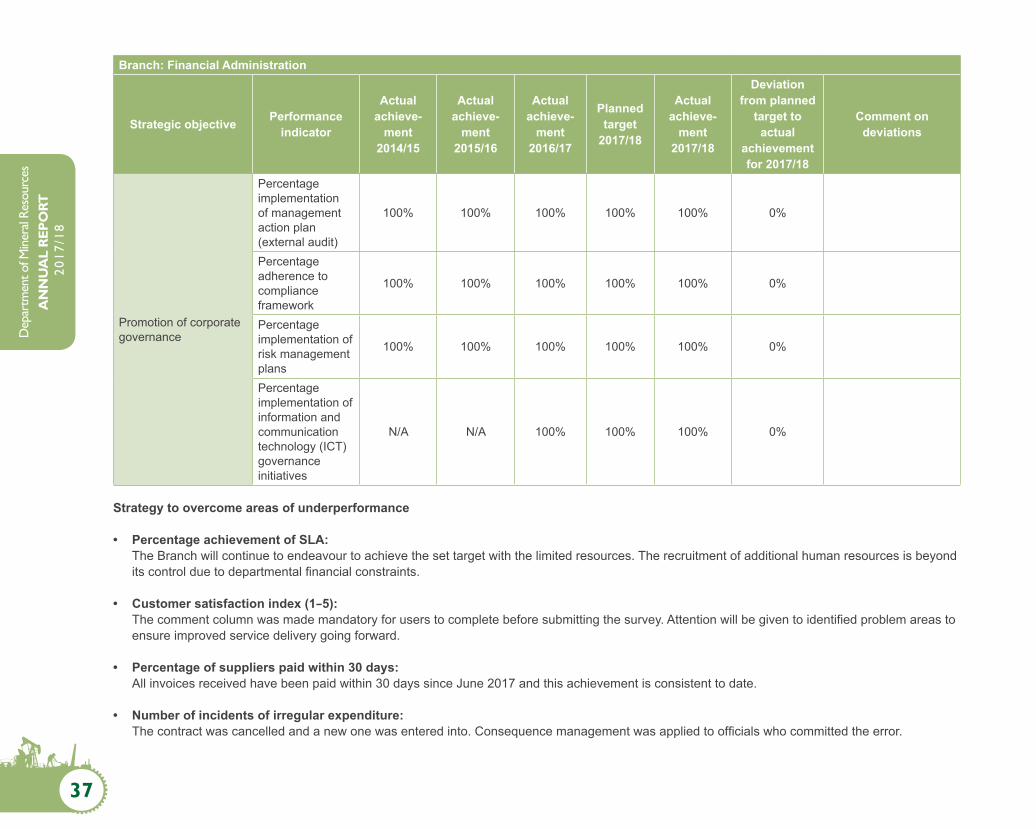
37
Dep
artm
ent o
f Min
eral
Reso
urce
sA
NN
UA
L R
EPO
RT
201
7/18
Branch: Financial Administration
Strategic objective Performance indicator
Actual achieve-
ment 2014/15
Actual achieve-
ment 2015/16
Actual achieve-
ment 2016/17
Planned target
2017/18
Actual achieve-
ment 2017/18
Deviation from planned
target to actual
achievement for 2017/18
Comment on deviations
Promotion of corporate governance
Percentage implementation of management action plan (external audit)
100% 100% 100% 100% 100% 0%
Percentage adherence to compliance framework
100% 100% 100% 100% 100% 0%
Percentage implementation of risk management plans
100% 100% 100% 100% 100% 0%
Percentage implementation of information and communication technology (ICT) governance initiatives
N/A N/A 100% 100% 100% 0%
Strategy to overcome areas of underperformance
• Percentage achievement of SLA: The Branch will continue to endeavour to achieve the set target with the limited resources. The recruitment of additional human resources is beyond its control due to departmental financial constraints.
• Customer satisfaction index (1–5): The comment column was made mandatory for users to complete before submitting the survey. Attention will be given to identified problem areas to ensure improved service delivery going forward.
• Percentage of suppliers paid within 30 days: All invoices received have been paid within 30 days since June 2017 and this achievement is consistent to date.
• Number of incidents of irregular expenditure: The contract was cancelled and a new one was entered into. Consequence management was applied to officials who committed the error.

38
Departm
ent of Mineral Resources
AN
NU
AL R
EPORT
2017/18
Linking performance with budgets
Sub-programme expenditure
Programme 1 - Administration
2017/18 2016/17Final
appropriationActual
expenditure(Over-)/under- expenditure
Finalappropriation
Actualexpenditure
(Over)-/under- expenditure
R'000 R’000 R'000 R'000 R'000 R’000Ministry 34 437 34 437 33 822 35 123 (1 301)Corporate Services 181 999 181 823 176 186 177 187 841 (1 664)Departmental Management 15 541 15 541 16 707 12 457 4 250Financial Administration 97 901 97 641 260 93 704 93 536 168Internal Audit 10 114 10 114 10 901 10 609 292Office Accommodation 22 914 22 914 21 485 21 484 1Total 362 906 362 470 436 362 796 361 050 1 746
4.3 Programme 2: Mine Health and Safety
Purpose
To ensure the safe mining of minerals under healthy working conditions.
Sub-programmes
• Mine Health and Safety (regions) • Governance Policy and Oversight
Strategic objectives • Promotion of health and safety• Contribution to skills development• Implementation of SLAs• Development and review of internal processes• Improvement of turnaround time• Promotion of corporate governance
Strategic objectives, performance indicators, planned targets and actual achievements
The Branch’s significant achievements and contribution to the strategic outcomes-orientated goals of government during the period under review include a 13% reduction in the number of occupational diseases reported by the mining sector, a 13% reduction in the number of injuries, covering 98% of investigations completed, 84% inquiries completed and 100% adherence to the prescribed timeframes for Chief Inspector of Mines appeals.
Furthermore, the Department has contributed to skills development by issuing 25 MMCCs.

39
Dep
artm
ent o
f Min
eral
Reso
urce
sA
NN
UA
L R
EPO
RT
201
7/18
PROGRAMME 2: MINE HEALTH AND SAFETY INSPECTORATE
Branch: Mine Health and Safety
Strategic objective Performance indicator
Actual achieve-
ment 2014/15
Actual achieve-
ment 2015/16
Actual achieve-
ment 2016/17
Planned target
2017/18
Actual achieve-
ment 2017/18
Deviation from planned
target to actual
achievement for 2017/18
Comment on deviations
Promotion of health and safety
Percentage reduction in occupational fatalities
26% 11% 3% 20% 1% -19%
The Inspectorate will continue to monitor compliance and ensure that effective safety management systems are implemented. Engagements will also be held with the chief executive officers (CEOs) of mining companies to ensure that appropriate measures are implemented to prevent harm to the mineworkers in the mining industry.
Percentage reduction in occupational injuries
14% 13% 6% 20% 13% -7%
The reason for the partial achievement is due to the increase of fall-of-ground accidents and transportation in mining accidents.There were 2 874 injuries reported between April 2016 and March 2017, and 2 499 injuries were reported between April 2017 and March 2018. The Inspectorate will continue to monitor compliance and ensure that effective safety management systems are implemented in the mining industry. Engagements will also be held with the CEOs of mining companies to ensure that appropriate measures are implemented to prevent harm to mineworkers.

40
Departm
ent of Mineral Resources
AN
NU
AL R
EPORT
2017/18
Branch: Mine Health and Safety
Strategic objective Performance indicator
Actual achieve-
ment 2014/15
Actual achieve-
ment 2015/16
Actual achieve-
ment 2016/17
Planned target
2017/18
Actual achieve-
ment 2017/18
Deviation from planned
target to actual
achievement for 2017/18
Comment on deviations
Promotion of health and safety
Percentage reduction in occupational diseases (including TB)
3% 1% 25% 10% 13% 3%
Reasons for over-achievement is that not all mines have been accurately reporting, and the previous error has been corrected. Issues of reporting correctly are emphasised, as is avoiding double reporting by the mines during occupational health workshops and other forums.
The mines hold occupational health awareness campaigns for employees to promote health. Guidelines are developed and revised.
Percentage of investigations completed (initiated vs completed)
90% 85% 85% 80% 97.88% 18%
The reason for the over-achievement was that the availability of witnesses improved during this quarter.
Percentage of inquiries completed (initiated vs completed)
67% 100% 78% 80% 84% 4%The reason for the over-achievement was the availability of witnesses.
Number of inspections conducted (cumulative)
8 555 7 539 9 363 8 000 9 425 1 425
The reason for the over-achievement was that extra audits were carried out in an attempt to reduce fall-of-ground accidents.
Number of audits conducted (cumulative), individual audits included
523 466 506 396 527 131
The reason for the over-achievement was that extra inspections were conducted in an attempt to reduce accidents.

41
Dep
artm
ent o
f Min
eral
Reso
urce
sA
NN
UA
L R
EPO
RT
201
7/18
Branch: Mine Health and Safety
Strategic objective Performance indicator
Actual achieve-
ment 2014/15
Actual achieve-
ment 2015/16
Actual achieve-
ment 2016/17
Planned target
2017/18
Actual achieve-
ment 2017/18
Deviation from planned
target to actual
achievement for 2017/18
Comment on deviations
Promotion of health and safety
Mine Health and Safety Annual Report submitted
1 1 1 1 1 –
Number of tripartite workshops conducted 62 71 67 40 76 36
The reason for the over-achievement under this measure was the request from stakeholders (unions and employers) to conduct additional tripartite workshops.
Contribution to skills development
Administration of GCC examination policy 100% 100% 100% 100% 100% 0%
Implementation of SLAs
Percentage adherence to existing SLAs
100% 100% 100% 100% 100% 0%
Development and review of internal processes
Percentage of identified internal processes developed and/or reviewed
100% 100% 100% 100% 100% 0%
Improvement of turnaround time
Percentage adherence to prescribed timeframes for medical appeals.
127% 95% 81% 80% 80% 0%
Percentage adherence to prescribed timeframes for Chief Inspector of Mines (CIOM) appeals
100% 100% 100% 100% 100% 0%
Percentage adherence to prescribed timeframes for MPRDA applications
103% 100% 72% 100% 99.87% -0.13%
Percentage adherence to prescribed timeframes for administrative tasks
88% 98% 80% 80% 90.78% 10.78%
There were 1 453 applications completed and processed within 30 days and 1 319 received.

42
Departm
ent of Mineral Resources
AN
NU
AL R
EPORT
2017/18
Branch: Mine Health and Safety
Strategic objective Performance indicator
Actual achieve-
ment 2014/15
Actual achieve-
ment 2015/16
Actual achieve-
ment 2016/17
Planned target
2017/18
Actual achieve-
ment 2017/18
Deviation from planned
target to actual
achievement for 2017/18
Comment on deviations
Promotion of corporate governance
Percentage implementation of Management Action Plan (internal audit)
100% 100% 55% 100% 100% 0%
Percentage implementation of Management Action Plan (external audit)
100% 100% 100% 100% 100% 0%
Percentage adherence to compliance framework
100% 100% 100% 100% 100% 0%
Percentage Implementation of risk management plans
100% 100% 75% 100% 100% 0%
Strategy to overcome areas of underperformance
The Mine Health and Safety Branch underachieved on two measures: percentage reduction in occupational fatalities and injuries. The Inspectorate will continue to monitor compliance and ensure that effective safety management systems are implemented. Engagements will also be held with the CEOs of mining companies to ensure that appropriate measures are implemented to prevent harm to the mineworkers in the mining industry. The Department will host the tripartite leadership summit to analyse and discuss accidents, and come up with recommendations to eliminate repeat accidents.
The Department established a Task Team that will consists of the DMR, the Mine Health and Safety Council, the Council for Geoscience, as well as labour and mining companies to develop strategies to mitigate seismic and fall-of-ground accidents. Secondly, to ensure a sustained reduction of fatalities, the Department will be embarking on group audits and inspections to ensure compliance with the legal provisions. The Department, in collaboration with MQA, will train rock engineers and seismologists to capacitate the mining and mineral sector to address rockbursts and fall-of-ground-related accidents.
Linking performance with budgets
Sub-programme expenditure
Mine Health and Safety
2017/2018 2016/2017Final
appropriationActual
expenditure(Over-)/under-expenditure
Finalappropriation
Actualexpenditure
(Over-)/under- expenditure
R'000 R’000 R'000 R'000 R'000 R’000Governance Policy and Oversight 45 027 45 013 14 47 395 46 430 965Mine Health and Safety (regions) 152 498 152 482 16 143 045 143 127 (82)Mine Health and Safety Council 6 162 6 162 – – – 0Total 203 687 203 657 30 190 440 189 557 883

43
Dep
artm
ent o
f Min
eral
Reso
urce
sA
NN
UA
L R
EPO
RT
201
7/18
4.4 Programme 3: Mineral Regulation
Purpose
To regulate the minerals and mining sector to promote economic growth, employment, transformation and sustainable development. It is also responsible for the administration of prospecting and mining rights licensing and compliance with the MPRDA, including environmental management compliance by mines.
Sub-programmes
• Mineral Regulation and Administration • Management Mineral Regulation
Strategic objectives
• Job creation• Promotion of sustainable resources use and management• Reduction of state environment liability and financial risk• Implementation of transformation policies and legislation• Improvement of turnaround time • Monitoring and enforcement of compliance• Promotion of corporate governance
Strategic objectives, performance indicators, planned targets and actual achievements
To ensure sustainable development, targets set for monitoring compliance have been exceeded. Where non-compliance was detected, it has been addressed with the relevant statutory notices. There has been significant improvement in correcting or remedying the situation.
There has been a significant number of community consultations to ensure that concerns raised by communities are addressed. This process involves the participation of other affected government departments. These engagements also build cooperation between government entities.
Industry workshops remained key and there was a need in some areas to implement more owing to the challenges faced.
Adherence to the prescribed turnaround times remains a key challenge as the Branch strives to adhere to the process, taking into consideration the other objectives of the Act, such as the participation of historically disadvantaged South Africans (HDSA). At times, it becomes necessary to assist and be outside the timeline. However, there are instances when the delays are administrative and there are backlogs that can be avoided if one revisits how the processes are applied.
Monitoring and enforcement of compliance
As part of monitoring and enforcement, the Chief Directorate: Enforcement has become part of Operation Phakisa, related to the Oceans Economy, with an emphasis on curtailing illegal sand mining along the West Coast. The Chief Directorate: Enforcement is part of the joint operations with the national departments of Environmental Affairs, and Agriculture, Forestry and Fisheries, as well as the South African Police Service (SAPS).
Illegal sand-mining operations along the Umdloti River in KwaZulu-Natal have been completely closed and cases have been handed over to the prosecuting authority.
Job creation
As part of the licensing regime, a new mine (Shondoni Colliery, Sasol Mining) has been opened in Mpumalanga, which will create 1 190 jobs, and will have a life of mine of 30 years.

44
Departm
ent of Mineral Resources
AN
NU
AL R
EPORT
2017/18
PROGRAMME 3: MINERAL REGULATION
Branch: Mineral Regulation
Strategic objective Performance indicator
Actual achieve-
ment 2014/15
Actual achieve-
ment 2015/16
Actual achieve-
ment 2016/17
Planned target
2017/18
Actual achieve-
ment 2017/18
Deviation from planned
target to actual
achievement for 2017/2018
Comment on deviations
Job creation
Number of SLP development projects completed
133 120 162 120 106 -14
Number of approved SLPs published
– – – 100% 0 -100%
The Branch has finalised the modalities on how approved SLPs will be published and is awaiting the promulgation of the regulations. Once the regulations are promulgated, the Branch will implement this measure.
Number of black industrialists created through procurement
N/A 5 5 10 10 0
Number of jobs created through mining
5 338 6 528 5 740 7 000 5 372 -1 628
Not achieved due to the current economic situation in the mining industry, which is affecting the creation of jobs within the mining industry.
Promotion of sustainable resource use and management
Percentage of evaluated work programmes relative to rights issued considering the elements of sustainable development
100% 100% N/A 100% 100% 0%

45
Dep
artm
ent o
f Min
eral
Reso
urce
sA
NN
UA
L R
EPO
RT
201
7/18
Branch: Mineral Regulation
Strategic objective Performance indicator
Actual achieve-
ment 2014/15
Actual achieve-
ment 2015/16
Actual achieve-
ment 2016/17
Planned target
2017/18
Actual achieve-
ment 2017/18
Deviation from planned
target to actual
achievement for 2017/2018
Comment on deviations
Reduction of state environmental liability and financial risk
Percentage of statutory notices or orders issued to remedy inadequate financial provision
100% 100% 100% 100% 100% 0%
Percentate of statutory notices or orders issued to remedy environmental non-compliance
N/A N/A 100% 100% 100% 0%
Percentage of closure certificates issued in line with the regulatory framework
100% 100% 100% 100% 100% 0%
Percentage of complaints received vs inspected
N/A N/A N/A 50% 100% 50%Not achieved due to attending to the backlog of complaints received.
Percentage of cases opened N/A N/A N/A 100% 100% 0%
Percentage of statutory notices or directives issued
N/A N/A N/A 100% 33% -67%
Not achieved due to the method of calculation on the technical description measure being misaligned with the measure definition.
Percentage of administrative fines issued
N/A N/A N/A 100% 0% -100%
The Chief Director has engaged with the Department of Environmental Affairs and the new updated calculator (section 24G) has been made available to the Department.

46
Departm
ent of Mineral Resources
AN
NU
AL R
EPORT
2017/18
Branch: Mineral Regulation
Strategic objective Performance indicator
Actual achieve-
ment 2014/15
Actual achieve-
ment 2015/16
Actual achieve-
ment 2016/17
Planned target
2017/18
Actual achieve-
ment 2017/18
Deviation from planned
target to actual
achievement for 2017/2018
Comment on deviations
Reduction of state environmental liability and financial risk
Percentage of complaints closed vs received
N/A N/A N/A 100% 25% -75%
Not achieved due to the method of calculation on the technical description measure being misaligned with the measure definition.
Implementation of transformation policies and legislation
Number of rights and permits granted and/or issued to HDSA-controlled entities
203 204 175 120 178 58
This is due to more attention being given to HDSA applications to comply with the requirements of the National Environmental Management Act (NEMA).
Number of consultations or engagements and conflict management with communities and stakeholders, as well as the mining industry
263 341 342 150 306 156
More consultation and engagement were done due to increased complaints from communities and due to continued engagements with stakeholders.
Percentage compliance by the mining industry
– – – 100% 0% -100%The Branch is in the process of procuring a measuring tool.
Number of industry workshops conducted
16 15 14 9 8 -1
Not achieved due to financial constraints as the budget was diverted to address conflicts between mining companies and communities.
Number of SLP verification inspections conducted
268 270 275 212 306 94
More legal compliance inspections were conducted to enforce legal compliance with terms and conditions of the rights issued and due to more verification inspections being done on the implementation of projects.

47
Dep
artm
ent o
f Min
eral
Reso
urce
sA
NN
UA
L R
EPO
RT
201
7/18
Branch: Mineral Regulation
Strategic objective Performance indicator
Actual achieve-
ment 2014/15
Actual achieve-
ment 2015/16
Actual achieve-
ment 2016/17
Planned target
2017/18
Actual achieve-
ment 2017/18
Deviation from planned
target to actual
achievement for 2017/2018
Comment on deviations
Implementation of transformation policies and legislation
Number of legal compliance (mineral laws and SLP) verification inspections conducted
253 502 264 150 212 62
More inspections were conducted to enforce legal compliance with terms and conditions of the mining rights issued.
Monitoring and enforcement of compliance
Number of mine work programme (MWP)/prospecting work programme (PWP) inspections (cumulative)
– 595 501 425 487 62
Numerous renewal applications warranted inspections before recommending them for renewal in order to establish the level of compliance. Furthermore, some of the rights and permits were found to be in the same vicinity, and an audit was deemed necessary as a way of saving resources. The inspections were conducted in such a way that they could be combined to avoid travelling to the same areas time and again, which would have had negative implications towards the end of the financial year. By so doing, it minimised regular travels to the same areas on the one hand and saved on the budget on the other.
Percentage implementation of enforcement procedures to collect arrear prospecting fees
N/A 100% 23% 100% 100% 0%

48
Departm
ent of Mineral Resources
AN
NU
AL R
EPORT
2017/18
Branch: Mineral Regulation
Strategic objective Performance indicator
Actual achieve-
ment 2014/15
Actual achieve-
ment 2015/16
Actual achieve-
ment 2016/17
Planned target
2017/18
Actual achieve-
ment 2017/18
Deviation from planned
target to actual
achievement for 2017/2018
Comment on deviations
Monitoring and enforcement of compliance
Number of environmental compliance inspections conducted
1 856 1 889 1 465 1 275 1 583 308
There were a number of applications for closure certificates and they warranted inspections before recommending closure in order to check whether the area(s) were rehabilitated to the satisfaction of the Department.
Improvement of turnaround time
Percentage adherence to prescribed timeframes
70.4% 71.8% 49.0% 70% 23% -47% The Branch is addressing a backlog of applications.
Promotion of corporate governance
Percentage implementation of Management Action Plan (internal audit)
100% 198% 50% 100% 50% -50%
Implemented three out of six action plans, of which the implementation date of the other three were revised to the end of Quarter 2 of the 2018/19 financial year, so the implementation percentage is 50%.
Percentage implementation of Management Action Plan (external audit)
100% 100% 100% 100% 100% 0%
Percentage adherence to compliance framework
100% 100% 100% 100% 100% 0%
Percentage implementation of risk management plans
94% 100% 100% 100% 88% -12%
Not achieved due to updating of revenue system interest calculator being unavailable during Quarter 2.

49
Dep
artm
ent o
f Min
eral
Reso
urce
sA
NN
UA
L R
EPO
RT
201
7/18
Strategy to overcome areas of underperformance
• Number of jobs created through mining: Due to the current economic situation, the creation of jobs has been affected in the mining industry. The Department has no control over job creation.
• Number of SLP development projects implemented: The branch is awaiting the approval of a delegation for amendments of SLPs in terms of Regulation 44.
• Percentage of approved SLPs published: The Branch has finalised modalities on how approved SLPs will be published and made available to the communities and the public, and is awaiting the finalisation of the MPRDA regulations to be able to implement this measure.
• Percentage of compliance by the mining industry: The Branch is in the process of procuring a measuring tool that will measure the compliance of the mining industry.
• Percentage of administrative fines issued: The Chief Director: Enforcement and Compliance has engaged the Department of Environmental Affairs and the updated Regulation 24(G) calculator has been made available.
• Percentage adherence to prescribed timeframe: The Branch has developed a project plan to ensure the timeous processing of applications as this will improve turnaround times.
• Percentage implementation of Management Action Plan (internal audit): Management will improve timeously to respond to all findings and ensure that all management actions are attended to and finalised.
Linking performance with budgets
Sub-programme expenditure
Mineral Regulation
2017/18 2016/17Final
appropriationActual
expenditure(Over-)/under- expenditure
Finalappropriation
Actualexpenditure
(Over-)/under- expenditure
R'000 R’000 R'000 R'000 R'000 R’000Mineral Regulation and Administration 202 270 202 178 92 189 809 189 778 31Management Mineral Regulation 15 119 14 923 196 17 163 15 775 1 388South African Diamond and Precious Metals Regulator 65 865 65 865 – 53 205 53 205 0
Petroleum Agency South Africa 87 138 87 138 – –
Total 370 392 370 104 288 260 177 258 758 1 419

50
Departm
ent of Mineral Resources
AN
NU
AL R
EPORT
2017/18
4.5 Programme 4: Mineral Policy and Promotion
Purpose
To develop mining, minerals and upstream petroleum industries’ policies and promote the investment and development of these industries.
Sub-programmes
• Mining and Mineral Policy: Develops new policies, reviews existing policies and amends legislation to promote investment growth and achieve transformation in the minerals and mining industry
• Mineral Promotion and International Coordination: Promotes mineral development and advises on trends in the mining industry to attract additional investment locally and internationally through global and regional relationships
• Economic Advisory Services: Undertakes macroeconomic research and analysis to inform the executive management of the Department, as well as to support political principals in their engagements with industry stakeholders
• Mine Environmental Management: Provides strategic guidance on mine environmental management and mine closure issues, including the management of derelict and ownerless mines
Strategic objectives
• Facilitation of transformation in the mining and minerals sector• Promotion of investment in the mining sector• Management and implementation of mineral resources diplomacy with
other countries and institutions• Promotion of sustainable resources use and management• Development and review of internal processes• Improvement of turnaround times• Promotion of corporate governance
Strategic objectives, performance indicators, planned targets and actual achievements
Shale gas
Through its state-owned agencies, CGS and PASA, DMR has been conducting the Karoo Deep Drilling (KDD) and Geo-Environmental Baseline programme. This programme is based in Beaufort West and seeks to better understand the potential impact of geo-resource exploration activities (minerals, gas, deep groundwater, and geothermal)
on the Karoo geo-environment. It is anticipated that the information and data gathered through this study will further inform the augmentation of regulatory instruments and the monitoring of shale gas operations.
The research project aims to cover various environmental impacts that are of public concern and measure the gas content from the deep borehole. The research commenced with a baseline study being conducted. The next phase, the drilling of boreholes, has commenced with the drill site being identified and secured. The drilling process for monitoring wells and drilling a deep borehole well for the environmental baseline is underway. Five boreholes have been drilled, all of which resulted in the uncovering of a substantial amount of fresh water resources contained in aquifers that lie deeper underground than normal. The water was tested and found to be of good quality. The highest-yielding borehole has been pump-tested and handed over to the municipality of Beaufort West, which was in urgent need of water resources due to the drought in the area. Recommendations have been made from the results of the pump tests conducted, in which it was discovered that 691 200 lites of water can be made available to the municipality per day, and 20 736 000 litres of water per month from one borehole. Pump tests are being conducted on the other boreholes as well.
As part of the Hydraulic Fracturing Monitoring Committee (HFMC), an interdepartmental committee led by DMR, the Department of Science and Technology commissioned a study to conduct an assessment of the technical readiness of South Africa to support the shale gas industry. This study was concluded, and one of the recommendations was the hosting of a shale gas conference. This conference was held at the Boardwalk Conference Centre in Port Elizabeth from 31 August to 1 September 2017. The final report and recommendations from the conference are being consolidated for presentation to the HFMC to take the matters forward, particularly the implementation plan of the recommendations made.
Small-scale mining
Small firms and entrepreneurs are of vital importance for the economic development of South Africa. This is evident in the focus on government’s attention to small firms and entrepreneurs. Small and medium enterprises (SMEs) have been identified as productive drivers of inclusive economic growth and development in South Africa and around the world. Through the small, medium and micro enterprise (SMME) support programme, the DMR has undertaken to identify policy bottlenecks encountered by SMEs and to suggest possible solutions to overcome the identified limitations.

51
Dep
artm
ent o
f Min
eral
Reso
urce
sA
NN
UA
L R
EPO
RT
201
7/18
For the 2017/18 financial year, the performance of the Small-scale Mining Directorate included the provision of assistance to 133 start-up prospects in relation to an annual target of 80 SMMEs. The demand for support from SMEs remains high as small and junior mining is the preferred entry point into the sector. The challenges for the small-scale miners include meeting regulatory requirements, access to finance, access to market and skills development.
Beneficiation
The beneficiation strategy identified the need to strengthen the provisions of the MPRDA for beneficiation to ensure the security of mineral supply
and also the need to leverage the procurement capacity of the domestic mining sector to drive demand for locally manufactured mining goods.
To this end, the Branch has begun work in anticipation of implementing the strengthened provisions of beneficiation of the MPRDA Bill by identifying minerals critical for national developmental imperatives and the qualities and quantities that would be required of these minerals. It is expected that undertaking this work will accelerate implementation of the beneficiation provisions of the MPRDA Bill, thus implementing one of the key beneficiation strategy interventions intended to drive security of mineral supply, and ultimately contribute to job creation.
PROGRAMME 4: MINERAL POLICY AND PROMOTION
Branch: Mineral Policy and Promotion
Strategic objective Performance indicator
Actual achieve-
ment 2014/15
Actual achieve-
ment 2015/16
Actual achieve-
ment 2016/17
Planned target
2017/18
Actual achieve-
ment 2017/18
Deviation from planned
target to actual
achievement for 2017/2018
Comment on deviations
Promote investment in the mining sector and upstream petroleum sectors
Number of publications (cumulative)
15 14 23 12 14 2
Achieved: 14 documents have been completed. The consistent trend is due to the commitment of the team and innovation, where possible, to make up for shortfalls. The plan to meet targets is regular evaluation of progress, reprioritisation and hard work.
Number of investment promotion events, forums and workshops(cumulative)
N/A N/A 60 55 56 1
Overachieved due to an increased need for advocacy and information-sharing with communities.
Percentage implementation of Operation Phakisa’s Plan for the Ocean Economy
N/A 100% 100% 100% 80% -20%
The Department will continue working with PASA to achieve its intended objective.

52
Departm
ent of Mineral Resources
AN
NU
AL R
EPORT
2017/18
Branch: Mineral Policy and Promotion
Strategic objective Performance indicator
Actual achieve-
ment 2014/15
Actual achieve-
ment 2015/16
Actual achieve-
ment 2016/17
Planned target
2017/18
Actual achieve-
ment 2017/18
Deviation from planned
target to actual
achievement for 2017/2018
Comment on deviations
Promote investment in the mining sector and upstream petroleum sectors
Number of SMMEs supported (cumulative)
87 125 103 80 96 16Over-achieved due to requests from the public for support.
Number of social dialogues with stakeholders (including the President-led Framework and Mining Industry Growth, Development and Employment Task Team (MIG-DETT)) (cumulative)
8 9 8 4 4 –
Percentage implementation of shale gas action plan instruments
N/A N/A 100% 100% 100% 0%
Development of a minerals and petroleum investment promotion strategy
N/A N/A N/A 1 1 –
A report identifying minerals as critical for national developmental imperatives
N/A N/A N/A 1 1 –
A report detailing mineral input quantities and qualities that are required for prioritised value chains
N/A N/A N/A 1 1 –

53
Dep
artm
ent o
f Min
eral
Reso
urce
sA
NN
UA
L R
EPO
RT
201
7/18
Branch: Mineral Policy and Promotion
Strategic objective Performance indicator
Actual achieve-
ment 2014/15
Actual achieve-
ment 2015/16
Actual achieve-
ment 2016/17
Planned target
2017/18
Actual achieve-
ment 2017/18
Deviation from planned
target to actual
achievement for 2017/2018
Comment on deviations
Manage and implement minerals resources diplomacy
Number of international strategic partnerships implemented
N/A N/A 7 3 3 –
Number of technical partnerships implemented with SOEs and govermental organisations (cumulative)
3 5 5 5 5 –
Promote sustainable resource use and management
A review of Department Environmental Management Plan
N/A N/A 1 1 1 –
Number of reports developed on mine closure, and derelict and ownerless mines
N/A N/A 4 4 5 1
Over-achievement due to additional study carried out to augment the current knowledge and practises in mitigating the high risk posed by derelict and ownerless sites.
Number of derelict and ownerless mine sites rehabilitated
50 50 45 45 43 -2
Not-achieved: 43 derelict and ownerless sites were rehabilitated. The two outstanding sites had challenges. Balmora Shaft: A child fell in over a year ago and could not be recovered. The family has now been given permission by the municipality to perform their rituals before the closure process can proceed. Hyper Shaft: Rehabilitation: Work was stopped at this site due to unstable ground.

54
Departm
ent of Mineral Resources
AN
NU
AL R
EPORT
2017/18
Branch: Mineral Policy and Promotion
Strategic objective Performance indicator
Actual achieve-
ment 2014/15
Actual achieve-
ment 2015/16
Actual achieve-
ment 2016/17
Planned target
2017/18
Actual achieve-
ment 2017/18
Deviation from planned
target to actual
achievement for 2017/2018
Comment on deviations
Promote sustainable resource use and management
Number of mine environmental management tools developed
N/A N/A N/A 3 3 –
Integrated and aligned environmental efforts
Number of engagements with relevant departments
N/A N/A N/A 4 4 0
Facilitate transformation in the mining and minerals sector
Number of legislative instruments developed, reviewed and amended
4 2 4 5 1 -4
Not achieved: only one legislative instrument has been reviewed. The Branch did not perform as per the target as the finalisation of the other legislative document is dependent on the outcomes of the Mining Charter. The President of the country directed that the gazetted Charter be reworked.
Develop and review internal processes
Number of internal business processes developed or reviewed
2 1 1 1 1 0
Improvement of turnaround time
Percentage adherence to timeframes
100% 97% 100% 95% 100% 5%
Over-achieved due to the Branch paying more attention to ensuring that the timeframes are adhered to.
Promotion of corporate governance
Percentage implementation of Management Action Plan (internal audit)
100% 100% 100% 100% 100% 0%
Percentage of fully implemented, agreed upon management action plans (external audit)
100% 100% 100% 100% 100% 0%

55
Dep
artm
ent o
f Min
eral
Reso
urce
sA
NN
UA
L R
EPO
RT
201
7/18
Branch: Mineral Policy and Promotion
Strategic objective Performance indicator
Actual achieve-
ment 2014/15
Actual achieve-
ment 2015/16
Actual achieve-
ment 2016/17
Planned target
2017/18
Actual achieve-
ment 2017/18
Deviation from planned
target to actual
achievement for 2017/2018
Comment on deviations
Promotion of corporate governance
Percentage adherence to compliance framework
100% 100% 100% 100% 100% 0%
Percentage implementation of risk management plans
88% 100% 78% 100% 100% 0%
Strategy to overcome areas of underperformance
The Branch did not achieve on two of its measures: number of legislative instruments developed, reviewed and amended, and number of derelict and ownerless mines rehabilitated. There is currently no mitigation against this measure as the gazetted Mining Charter had to be withdrawn and redone on the President’s directive. None of the other documents can be concluded if the Mining Charter is still outstanding.
With regard to the number of derelict and ownerless mines rehabilitated, the Branch has to strengthen its management and monitoring of the SOEs who provide rehabilitation services.
Linking performance with budgets
Sub-programme expenditure
Mineral Policy and Promotion
2017/18 2016/17Final
appropriationActual
expenditure(Over-)/under- expenditure
Finalappropriation
Actualexpenditure
(Over-)/under- expenditure
R'000 R’000 R'000 R'000 R'000 R’000Management 25 121 23 934 1 186 26 546 26 409 137Mineral Policy 18 299 18 223 76 28 195 28 087 108Mineral Promotion and International Coordination 43 879 43 869 10 49 496 48 769 727
Assistance to Mines – – – – – –Council for Geoscience 366 988 366 988 378 598 378 598 –Mintek 367 256 367 256 356 416 356 416 –Economic Advisory Services 3 718 3 388 330 4 632 4 019 613Mine Environmental Management 17 203 17 203 408 11 781 9 438 2 343Total 842 464 840 454 2 010 855 664 851 736 3 928

56
Departm
ent of Mineral Resources
AN
NU
AL R
EPORT
2017/18
5. TRANSFER PAYMENTS5.1 Transfer payments to public entities
Name of public entity Services rendered by the public entity
Amount transferred to
the public entity R’000
Amount spent by the public entity
Mintek • Fundamental research and development in efficient mineral processing technologies and value-added products and services. R367 256 R367 256
South African Diamond and Precious Metals Regulator
• To ensure competitiveness, sustainable development and job creation in the diamond and precious metals industry
• To ensure the effective transformation of the diamond and precious metals sectors.
• To ensure equitable access to resources for local beneficiation• To ensure compliance with the legislative requirements• To improve organisational capacity for maximum execution for
excellence
R65 865 R65 865
Mine Health and Safety Council
Various services are provided by the entity. The major services are the following:
• Advising the Minister of Mineral Resources on occupational health and safety in the mines
• Promoting a culture of health and safety in the mining industry• Advising the mining industry through the Minister of Mineral
Resources
R6 162 R6 162
Council for Geoscience • To gather, compile, develop and publish world-class geoscience
data, knowledge and products, and to render geoscience-related services to the South African public and industry.
R366 988 R366 988
State Diamond Trader • To provide equitable access to the diamonds of the Republic and to promote the diamond beneficiation industry – –
Petroleum Agency South Africa
• Promote onshore and offshore exploration for, and production of petroleum
• Receive, evaluate and make recommendations to the Minister on applications for reconnaissance permits, technical cooperation permits and exploration and production rights for petroleum
• Monitor and report to the DMR in respect of compliance with such permits or rights
• Receive, maintain, store, interpret, evaluate, add value to and disseminate or deal in all geological or geophysical information relating to petroleum
R87 138 R87 138

57
Dep
artm
ent o
f Min
eral
Reso
urce
sA
NN
UA
L R
EPO
RT
201
7/18
5.2 Achievements of the public entities
5.2.1 Council for Geoscience
The strategy of the CGS focuses on an integrated and multidisciplinary geoscience mapping programme that is streamlined with all other activities coordinated around this programme.
The strategy aims to enhance the map coverage of South Africa’s land surface at a greater level of detail, not only geologically, but also geophysically, geochemically and geotechnically, to produce a new generation of more detailed maps to serve as a base to advise the state and various stakeholders, including the public. Marine geoscience mapping also features prominently, in line with the objectives of Operation Phakisa: Ocean Economy. The CGS attained an overall performance above 88% for the 2017/18 financial year.
In driving and delivering on its mandate, the CGS has performed very well in implementing several projects of strategic significance to South African society. The key benefit of undertaking the integrated and multidisciplinary approach in conducting research at the CGS was evident during the environmental baseline investigations conducted in the southern Karoo near Beaufort West. During this study, the CGS made a groundbreaking impact on South African society by discovering water in this Karoo town during research studies on the Shale Gas Project. Two boreholes gave high water yields of 8 litres per second and 5 litres per second respectively. The water was intersected at depths greater than 165 m, and the combined yield of the two boreholes is about 33 million litres per month of potable water supplied to over 45 000 people in Beaufort West. The discovered water was estimated to translate to a monthly value of R984 500 (about R11.81 million per year based on a rate of 29.8c per kilolitre for Level 6 water restrictions). On 13 February 2018, the CGS, together with the DMR, handed the two boreholes over to the Beaufort West Municipality.
The CGS also made significant progress with a number of technical projects, including the rehabilitation of derelict and ownerless mines, the assessment of uranium and thorium resources, strategic mine water management, and off-shore mapping that is supportive of Operation Phakisa and the Blue Economy Development programme.
The CGS continues to refocus on its mandate and continues to acquire new, multidisciplinary data. This has resulted in new external collaborations and partnerships and the development of additional world-class publications. More than 90 publications were produced during the 2017/18 financial year.
5.2.2 South African Diamond and Precious Metals Regulator
Establishment and approval of the SADPMR Beneficiation Strategy
The SADPMR is legislatively mandated to promote beneficiation in the downstream diamonds and precious metals industries. In implementing this mandate, the SADPMR has since produced a SADPMR Beneficiation Strategy with the following aims:
• Give effect to the beneficiation strategy for the South African minerals industry as far as it relates to the diamond and precious metals value chains.
• Strengthen the implementation of the provisions in the Diamonds Act, 1986, the Precious Metals Act, 2005, and the Diamond Export Levy Act, 2007, relating to the promotion of equitable access to and local beneficiation of South Africa’s diamonds and precious metals.
• Endeavour to coordinate and streamline beneficiation promotion efforts with that of the DMR, the Department of Trade and Industry, Mintek and the SDT.
• Develop and implement efficient and coordinated regulatory services that facilitate access to the industry to address past imbalances
Established beneficiation projects to address the decline in the ben-eficiation industry (diamond and precious metals) With a declining beneficiation industry, the SADPMR realised that, in promoting beneficiation, it was not enough to just issue beneficiation licenses, as the industry remains untransformed. The SADPMR then focused on establishing a project that would bring new HDSA entrants into the diamonds and precious metals beneficiation industry. A special focus was placed on targeting new entrants from mining communities, who, despite sharing their land with producers of diamonds and precious metals, remain poor and unemployed. The SADPMR therefore targeted the old mining town of Virginia in the Free State, The area falls within the Welkom Goldfields, which produced a remarkable amount of gold over a number of decades since the late 1950s. However, due to the large-scale closure of the mine, the situation is bleak and the area is becoming a “ghost town”.
HDSA companies that are specifically from the area were invited to apply and receive training in diamond beneficiation and jewellery making in Johannesburg, Gauteng. Once they had completed their course, the graduates could apply for diamond beneficiation licences and jewellery permits. The new license holders would then be placed in the Virginia Jewellery School and be part of the new Mass Production Factory that would
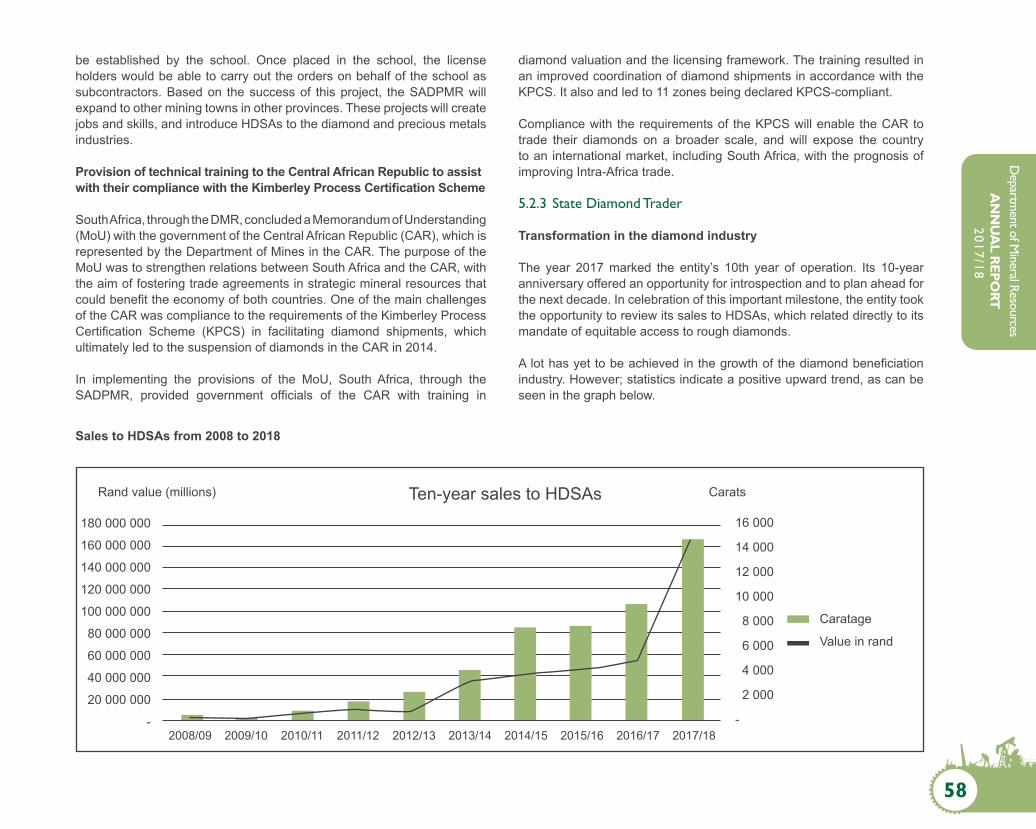
58
Departm
ent of Mineral Resources
AN
NU
AL R
EPORT
2017/18
Rand value (millions) Ten-year sales to HDSAs Carats
180 000 000
160 000 000
140 000 000
120 000 000
100 000 000
80 000 000
60 000 000
40 000 000
20 000 000
-
16 000
14 000
12 000
10 000
8 000
6 000
4 000
2 000
-2008/09 2009/10 2010/11 2011/12 2012/13 2013/14 2014/15 2015/16 2016/17 2017/18
Caratage
Value in rand
be established by the school. Once placed in the school, the license holders would be able to carry out the orders on behalf of the school as subcontractors. Based on the success of this project, the SADPMR will expand to other mining towns in other provinces. These projects will create jobs and skills, and introduce HDSAs to the diamond and precious metals industries.
Provision of technical training to the Central African Republic to assist with their compliance with the Kimberley Process Certification Scheme
South Africa, through the DMR, concluded a Memorandum of Understanding (MoU) with the government of the Central African Republic (CAR), which is represented by the Department of Mines in the CAR. The purpose of the MoU was to strengthen relations between South Africa and the CAR, with the aim of fostering trade agreements in strategic mineral resources that could benefit the economy of both countries. One of the main challenges of the CAR was compliance to the requirements of the Kimberley Process Certification Scheme (KPCS) in facilitating diamond shipments, which ultimately led to the suspension of diamonds in the CAR in 2014.
In implementing the provisions of the MoU, South Africa, through the SADPMR, provided government officials of the CAR with training in
diamond valuation and the licensing framework. The training resulted in an improved coordination of diamond shipments in accordance with the KPCS. It also and led to 11 zones being declared KPCS-compliant.
Compliance with the requirements of the KPCS will enable the CAR to trade their diamonds on a broader scale, and will expose the country to an international market, including South Africa, with the prognosis of improving Intra-Africa trade.
5.2.3 State Diamond Trader
Transformation in the diamond industry
The year 2017 marked the entity’s 10th year of operation. Its 10-year anniversary offered an opportunity for introspection and to plan ahead for the next decade. In celebration of this important milestone, the entity took the opportunity to review its sales to HDSAs, which related directly to its mandate of equitable access to rough diamonds.
A lot has yet to be achieved in the growth of the diamond beneficiation industry. However; statistics indicate a positive upward trend, as can be seen in the graph below.
Sales to HDSAs from 2008 to 2018

59
Dep
artm
ent o
f Min
eral
Reso
urce
sA
NN
UA
L R
EPO
RT
201
7/18
2017/18 2016/17 2015/16SDT inspection US$*(US$’000 000) 1 216 1 144 970Carats inspected 10 012 744 8 994 894 7 726 850US$ per carat 122 127 126Number of producers 16 12 14Number of inspections 126 117 136
SDT purchases ZAR (R’000 000) 742 694 450Percentage purchased 4 4% 3%Number of purchases 67 60 61
SDT sales ZAR (R’000 000) 769 722 460Cost of goods sold 741 698 447Gross margin 27 24 13Gross margin percentage 4% 3% 3%Carats 116 351 178 052 158 128Number of clients sold to 42 46 47
SDT stock ZAR (as of 31 March) 20 20 24Average of stock (days) ›300 ›300 ›300
Enterprise Development Programme
The SDT continues to facilitate the Enterprise Development Programme (EDP) in partnership with industry stakeholders. By the end of December 2017, the programme had seven groups with 27 trainees registered. In March 2018, the first group that had completed the three-year training with the entity and the participants were placed with clients for further training and development, while the entity operationalised its strategy, which was aimed at having the participants start their own diamond beneficiation businesses. At least eight participants were sent to India for diamond beneficiation training in partnership with KGK Diamonds (Pty) Ltd. One black female participant has started a diamond beneficiation business, while another has joined a mining business in Limpopo as a shareholder.
Hong Kong National Pavilion
The entity continued to fly the South African flag high through its facilitation of the National Pavilion at the Hong Kong Jewellery and Gem Fair. The entity attended the Hong Kong Fair for the first time in four years in 2017
together with its clients, without the assistance of the partners that had been its pillar of strength in this respect for at least four years.
The objective of attending the fair is to expose the STD’s clients to international markets for polished diamonds.
Participation in the fair was a great success. Clients reported to have significantly increased sales volumes at the show in 2017.
5.2.4 Mine Health and Safety Council
Mine Health and Safety Regulations During the 2017/18 financial year, regulations were recommended for the Minister’s approval and promulgation as outlined below.
(a) Explosives Chapter 4 of the MHSA Regulations: Recommendations were made on how to deal with the regulatory impact and unintended consequences, including possible amendments to the regulations and

60
Departm
ent of Mineral Resources
AN
NU
AL R
EPORT
2017/18
differing requirements in relation to different types of mining methods, types of mines, types of explosives, types of commodities and types of risk profiles.
(b) Vessels Under Pressure Chapter 8: The “Vessels Under Pressure” Regulations were developed to incorporate the prescriptive parts of Chapter 22 and Chapter 23 of the Minerals Act, 1991 (Act No. 50 of 1991).
(c) Regulations as a minimum standard: The manufacturers’ responsibilities were reviewed with regard to storage devices. Research conducted by the Department of Labour relating to vessels under pressure was considered.
Guidelines for the management of occupational health and safety on the mines The following mandatory guidelines for promulgation by the CIOM were recommended:
(a) Guideline for the Compilation of a Mandatory Code of Practice to Mitigate Geotechnical Risk in Mines: This guideline will contribute significantly to managing risks related to fall-of-ground accidents and seismicity. These types of risks have started to show an upward trend when analysing the safety performance of the past 10 years.
(b) Guideline for Compilation of a Mandatory Code of Practice for the Management of Self-contained Self-rescuers (SCSRs) in Mines: In the case where irrespirable atmospheres may occur in the aftermath of unwanted events, the use of SCSRs should be considered as a mitigating measure. Chapter 16.2 of the MHSA provides clear guidance as to which classes of mines or instances where the use of SCSRs are deemed mandatory. These guidelines provide practical guidance on the implementation of regulations relating to the management of emergencies in irrespirable underground atmospheres.
(c) Guidance Note on Medico-Legal Investigations of Mine Deaths: The Guidance Note originates from the need to provide clarity on the process that must be followed for deaths that require a medico-legal autopsy. It is intended to assist and give guidance to all stakeholders regarding their roles and responsibilities in case of an unnatural and/or uncertain mine death. This Guidance Note also sets out good practice and should be read in conjunction with the current and relevant regulatory framework on medico-legal postmortem investigations, and does not constitute a specific and/or separate protocol. Stakeholders are advised to make full use of this document, which represents the collective efforts of various stakeholders.
(d) Guideline for the Compilation of a Mandatory Code of Practice for Risk-based Emergency Care on a Mine: The numerous risks associated with
work at a mine may lead to various incidents, ranging from relatively minor to major injuries and disasters at a worksite. Injuries may lead to complications if the required emergency care is not rendered to the injured persons timeously. The aim of this guideline is to provide a framework to assist the employer of every mine to prepare a risk-based Code of Practice (CoP) on emergency care at the mine.
Policies and other advisory notes to the Minister of Mineral Resources
The MHSC advised the Minister on the following research outcomes:
(a) Advisory Note to the Minister minimising seismic risks in the Bushveld Complex Platinum mines.
(b) Advisory Note on developing methodologies for determining maximum bord widths applicable to platinum and chrome mines in the Bushveld Complex.
(c) Advisory Note on the development of a South African Minimum Standard on ground vibration, noise, air blast and fly rock near surface structures to be protected.
(d) Policy on the Integrated Management and Reporting for HIV, Aids, TB and Occupational Lung Disease (HATOLD).
(e) Advisory Note on the development of a comprehensive compensation system for the South African mining industry.
(f) Advisory Note on data analysis on the extension of mine health care services.
(g) Advisory Note on the rehabilitation of mineworkers injured in the line of duty.
Implementation of the Centre of Excellence to improve the efficiency and effectiveness of the MHSC
The Council approved the Centre of Excellence (CoE) Phase 1 implementation plan in November 2016. The business plan required the following initiatives be implemented for the CoE to be operational. The implementation plan included those activities that have been implemented by management.
(a) Organisational design: The MHSC organogram was revised to include the new positions within the CoE, which have since been filled. Capacitation plans are being developed and are currently being implemented.
(b) Governance: The terms of references for the MHSC advisory committees were revised and approved by Council and the Advisory Committee members were inducted into new processes and procedures in discharging their duties.
(c) Processes and systems: The research management and supply chain management processes were reviewed and implemented for

61
Dep
artm
ent o
f Min
eral
Reso
urce
sA
NN
UA
L R
EPO
RT
201
7/18
alignment with he CoE’s processes. A policy on Intellectual Property was also developed as part of the commercialisation and dissemination of research outcomes.
(d) Communication and change management: A communication strategy was developed and implemented targeting different stakeholders, both internal and external, to ensure the smooth operationalisation of the CoE within the MHSC.
(e) IT services and infrastructure: An IT gap analysis was conducted and the MHSC will procure the additional IT system that is required in the 2018/19 financial year.
Provision of seed funding to improve mining industry research infrastructure and testing facilities
The CoE is now operational and is providing its key responsibility of ensuring that research projects are delivered with maximum efficiency and the dissemination of the research outcomes to the mining industry is enhanced. This will contribute immensely to the envisaged positive impact in the mining industry.
Another leg of the CoE is the provision of seed funding to institutions partnering with the MHSC, such as the University of Pretoria, University of the Witwatersrand, National Institute of Occupational Health (NIOH) and the Council for Scientific and Industrial Research (CSIR).
These institutions will support the CoE by conducting high-impact research on occupational health and safety, and provide laboratory testing and relevant services required by the South African mining industry. In line with the service-level agreements and period of contracts, the CoE partners will submit quarterly reports to the MHSC to monitor implementation of the projects and allow for an assessment of return on investment.
Promotion of a health and safety culture in the mining industry
During the 2017/18 reporting period, the MHSC continued its efforts to facilitate the promotion of a health and safety culture in the mining industry through the completion of the following activities:
(a) Annual programme of campaigns developed and implemented to popularise the pillars of the MHSC Culture Transformation Framework (CTF).
(b) Developed and implemented a programme of campaigns to deal with women in mining.
(c) Developed and implemented a programme to deal with the right to refuse dangerous work at the regional tripartite forums in collaboration with DMR policy developers.
(d) Developed a fully inclusive modern information system to monitor summit milestones, initiatives and targets (milestones reporting system).
To address the scourge of HIV and TB in the industry, the MHSC annually hosts commemoration events to raise awareness on these diseases among mineworkers and surrounding communities. These events are further meant to foster a healthy lifestyle in the South African mining industry.
5.2.5 Council for Mineral Technology Research
Sustainable development and mine rehabilitation
Sustainable development remained a critical focus area for Mintek during the year. Mintek ran a successful demonstration in Randfontein showcasing the efficacy of a cocktail of Mintek’s home-grown technologies in the treatment of highly polluted waste water. The site was selected because of the high uranium content in the waste water that presents a major health and environmental hazard if left untreated.
The year under review saw Mintek’s research programme enter the final phase of optimising the recycling of reagents, with an intention to improve the economic viability of Mintek’s technologies. Mintek pilot-tested a different method at a coal mine in Mpumalanga, and continued the development of another method that uses nanotechnology to remove metals and bacteria in drinking water.
Mintek continued to operate as an implementing agent for the DMR’s Derelict and Ownerless Mine Rehabilitation Programme to reduce potential hazards for the communities that live around these mines.
Notable achievements related to the programme during the past year include the following:
• Commencement of work on four projects in the Streatham Valley in the Penge area of Limpopo, the biggest asbestos rehabilitation project conducted to date, creating work for more than 160 people.
• Completion of the designs and tender specifications for a further five projects, of which four are in Limpopo (Steelpoort, Penge Village, Lagerdraai and Uitkyk) and one is in Mpumalanga (Msauli). Two of these (Steelpoort and Msauli) commenced the tender processes.
• Completion of the field investigations and scoping reports for 61 medium-risk asbestos sites remaining on public land to enable future risk ranking and prioritisation.

62
Departm
ent of Mineral Resources
AN
NU
AL R
EPORT
2017/18
Small business development
Mintek’s mandate includes playing a key role in research, the development of technologies and the beneficiation of South Africa’s mineral resources. Throughout the year, Mintek remained mindful that it discharged this mandate in a way that makes a difference to the lives of ordinary South Africans. As a result, Mintek facilitated the creation of four new economically sustainable businesses and 42 new jobs during the period under review.
These are community members that would otherwise have remained unemployed. The principle that Mintek uses is to assist communities in order to create sustainable incomes where communities have organised themselves to exploit resources available in their environment. Mintek provided guidance and support in projects specialising in the manufacture of glass beads and created jobs for previously unemployed youth within the community. Mintek also assisted cooperatives that were established by like-minded members of a community to mine and beneficiate clay so that they could create saleable products. The small businesses are supported and assisted not only with training, but also to gain access to raw material, product development and marketing. It is in these types of interventions that Mintek intends to scale up its reach and impact. Mintek intends to increase its technical support to artisanal, and small- and medium-scale operations in the treatment of various ferrous metals, so that they can increase their productivity and generate more revenue.
People development
During the period under review, 82 students participated in different work- integrated learning programmes funded and supported by Mintek, the MQA, the National Research Foundation and the South African Agency for Science and Technology (SAASTA). Both the professional development programmes and the work-integrated learning programmes are examples of the success that can be attained if state entities collaborate for the benefit of the country, and for the beneficiaries of the programmes, which would otherwise not have obtained enriching experiential learning opportunities. Programme participants not only obtain an opportunity for practical learning experience, they also stand to be the first people to be considered for employment, should entry-level positions become vacant.
Mintek’s artisan learnership programme is a unique initiative that is both an employee development and a pipeline development programme. It emerged from a history where it was solely focusing on “growing our own timber”, but has since been extended to include external participants. The motivation for extending the reach of the programme was primarily to recruit females into a field that had previously been dominated by males.
During the year under review, the programme enrolled 14 learner-artisans. Of the 14 learners (eight internal and six external), six were female. Three internal learners completed their programme. Mintek also awarded 31 full-time bursaries. Some highlights included the increased number of female bursars to 68%, as well as 93% of the awarded bursaries being from the previously disadvantaged groups, and 18 undergraduate and 13 postgraduate students benefitting from the full-time bursary scheme.
Technology development
Nanotechnology
The Water Unit of the DST/Mintek Nanotechnology Innovation Centre at Mintek continues to develop novel membrane materials and adsorbent composites for water treatment and wastewater remediation. The Water Unit intensified its technology demonstration programme by conducting medium-term piloting of its technologies on the treatment of acid mine drainage or mining effluent and car wash effluent. These assessments showed an upgrade of the water quality to levels that show potential for reuse in various applications.
The Sensor Nanotechnology Unit at Mintek develops electrochemical sensors that are easy to use and do not necessarily require skilled personnel, and that are robust in that they can be used in remote areas where sophisticated storage equipment is not available, portable and affordable. The Unit has developed a glucose sensor that uses nanoparticles that are produced in-house instead of enzymes used in the traditional sensors, and in-house produced screen-printed electrodes that form the base of the sensors. The Unit is busy working on fine-tuning the sensor to function in the presence of other interfering biological species.
Physical metallurgy
Mintek’s Physical Metallurgy Group executed about 250 projects in the service of the South African metals-related industries. These ranged from small projects (~R10 000), usually provided to small- and medium-sized clients, to large projects (~R200 000), carried out on behalf of big clients, such as well-established mining houses. The large projects, in particular, emanate from the local industry, as well as large firms from SADC and Economic Community of West African States (ECOWAS) countries such as Ghana.
Other developments
A new discovery that was patented was the production of MgCO3 from the beneficiation of mining-related waste. The patent creates a potential

63
Dep
artm
ent o
f Min
eral
Reso
urce
sA
NN
UA
L R
EPO
RT
201
7/18
opportunity for Mintek to fill a niche gap in the market with the potential added advantage of being able to reuse waste CO2 and produce cleaner waste effluent due to the concomitant removal of contaminants through precipitation.
During the year, Mintek launched the electron microprobe that it had recently acquired. This is a state-of-the-art microscope designed primarily to measure the mineral compositions of the polished surfaces of samples such as rocks, concentrates, metals, alloys and waste. This technology allows Mintek to determine the distribution of both valuable and penalty elements that are crucial in mineral beneficiation. This new instrument will assist Mintek in addressing challenges that lead to the inefficient use of natural resources, as well as environmental waste.
Mintek concluded the development of an integrated financial model for the South African Centralised Refinery (SACREF) Rare Earth Elements (REE) concept. This model incorporates capital and operational financial provisions, off-take, as well as feed supply models and can be used to evaluate different concept configurations for a centralised REE refinery in South Africa.
Mintek continued its work in the fuel cell space under the Hydrogen South Africa (HySA) programme. During the year, a second catalyst, HySA-V40, was successfully scaled to 1 kg per batch and the material validated. In addition, the preparation of graphitised Vulcan carbon support was scaled to 1.2 kg per batch and a development batch of HySA-GV40 catalyst has been prepared to validate the support at this scale of production. These are major developments that will have a significant impact on South Africa’s HySA programme.
5.2.6 Petroleum Agency South Africa
During the year under review, PASA hosted a successful transformation colloquium that was informed by the imperative to advance substantial and meaningful participation by HDSAs in the upstream oil and gas sector, as required by section 2(d) of the MPRDA. The colloquium identified a lack of
financial resources by HDSAs as a significant barrier to entry. To that end, PASA intends to host a panel-based transformation colloquium during the next financial year, where innovative ideas will be canvassed from broad- based stakeholders to tackle access to financial resources by HDSAs. Technical work on offshore resources continued to focus on the long-term basin analysis projects being carried out. These projects are concerned with the geological and geophysical understanding of the geological basins of South Africa. Both the Gamtoos Basin Analysis Project and the East Coast Basin Analysis Project were completed during the period under review, with the production of externally reviewed, published electronic documents. Technical work resulting from these major projects was presented at the annual conference of the European Association of Geoscientists and Engineers, as well as at the conference of the South African Geophysical Association, where work from the Gamtoos Project was awarded best poster award. PASA’s project on unconventional resources produced a new technical poster on the assessment of the shale gas potential of the Karoo, and two new information atlases were completed. A map of the coal bed methane potential of the Tuli Basin was also published. Technical papers on shale gas and coal-bed methane were presented at the international conference of the American Association of Petroleum Geologists (AAPG), the AAPG Unconventional Gas Workshop and the Fossil Fuel Foundation‘s Sustainable Energy Conference.
Technical data and records management software applications and systems were monitored and upgraded to ensure that the data management infrastructure remained optimised for database capture, maintenance and data supply functionality. Disaster recovery procedures have been maintained, while the project archive records system (PARS) was upgraded and 354 interpretation projects were successfully archived. Other technical data received from stakeholders has also been catalogued and indexed, including interpretive results, monthly and quarterly reports from operators and license holders, seismic acquisition and processing reports, field and processed data for various geophysical surveys, gravity and magnetic processed data, reports received for various recently acquired surveys, and research reports from various students and academic institutions.

64
Departm
ent of Mineral Resources
AN
NU
AL R
EPORT
2017/18
5.3 Transfer payments to all organisations other than public entities
The table below reflects the transfer payments made for the period 1 April 2017 to 31 March 2018
Name of transferee Type of organisation
Purpose for which the funds were
used
Did the Department comply with section
38(1)(j) of PFMA
Amount transferred
(R’000)
Amount spent by the entity
Reasons for the funds unspent by
the entityNone
The table below reflects the transfer payments that were budgeted for in the period 1 April 2017 to 31 March 2018, but no transfer payments were made.
Name of transferee Purpose for which the funds were to be used
Amount budgeted for(R’000)
Amount transferred (R’000)
Reasons why funds were not transferred
None
5.4 Capital investment, maintenance and Asset Management Plan
The Department has managed to implement all the elements of the departmental Asset Management Plan. During the year under review, 65% of the total disposed assets were scrapped due to damages that were beyond repair; 35% were donated to educational institutions as prescribed by the departmental Asset Management Policy; and 3% was as a result of losses that were investigated and action taken where necessary.
The Department has control measures in place (monthly reconciliation, and quarterly and annual asset verification) to ensure that the asset register is kept up to date. The DMR maintains an asset register on which 48% of the assets are in good working condition, and continues to advance the strategic objectives of the Department; 45% is in a fair condition and can still be used to carry out the mandate of the Department; and 7% is declared to be in a poor condition and will be disposed of.
Infrastructure projects
2017/18 2016/17Final
appropriationActual
expenditure(Over-)/under- expenditure
Final appropriation
Actual expenditure
(Over-)/under- expenditure
R’000 R’000 R’000 R’000 R’000 R’000 New and replacement assets 11 614 11 614 – 10 868 9 766 (1 102)
Total 11 614 11 614 – 10 868 9 766 (1 102)

65
Dep
artm
ent o
f Min
eral
Reso
urce
sA
NN
UA
L R
EPO
RT
201
7/18
PART CGOVERNANCE

66
Departm
ent of Mineral Resources
AN
NU
AL R
EPORT
2017/18
1. INTRODUCTIONThe maintenance of an effective, efficient and transparent system of financial, risk management and internal control is the foundation of a well-governed and controlled organisation.
Good governance plays a critical role in ensuring accountability in the use and management of state resources. It also leads to better decisions, helps the Department to meet its legislative responsibilities and – importantly – promotes public confidence.
2. RISK MANAGEMENTThe Department has an approved risk management policy and risk management strategy in place. The purpose of this policy and strategy is as follows:
• Provide a useful framework that defines the essential tasks of risk management
• Describe the risk management process that the Department has adopted
• Obtain entity-wide consistency regarding the application of the process• Report risks consistently across the Department• Embed a common risk language across the Department’s business• Enable management to achieve their objectives with certainty and
efficiency• Allow management to evaluate, prioritise and address critical risks, and
channel resources to these risks in mitigating their potential negative impact.
To comply with the requirements of applicable laws and regulations, as well as to ensure that the Department fosters a culture of responsible risk taking, the Department annually conducts strategic and operational risk assessment to update the risk profiles and determine the effectiveness of the risk management strategy. The risk mitigation plans are monitored on a quarterly basis by the Directorate: Risk Management. Quarterly performance reports on risk management are discussed at Management Committee (MANCO) meetings.
Governance structures within the Department (the Risk Management Committee and the Audit Committee) continue to play an oversight role in the implementation of the risk management strategy and policy.
The management of risks within the Department has translated into improvements in overall internal control and internal processes, as well as improvements in the Department’s performance.
3. FRAUD AND CORRUPTION The Department has an approved anti-fraud and corruption strategy in place. The strategy was developed in response to government’s expressed commitment to combat fraud and corruption. The strategy seeks to create a culture within the Department that is intolerant to fraud and corruption or any form of unethical conduct, to strengthen the participation of employees in the fight against fraud and corruption, and to clarify the approach of the Department to fraud and corruption. The anti-fraud and corruption implementation plan includes, but is not limited to the following:
• Conducting fraud risk assessments annually to update the fraud risk register
• Conducting investigations by a special investigation unit within Audit Services
• Developing financial and procurement policies • Developing and implementing of human resources policies such as the
gift policy, employee vetting and employee declaration• Conducting awareness workshops to educate officials on these
policies, with the policies presented during the induction programme for new officials.
The approved departmental whistle-blowing policy is also part of the strategy’s implementation plan as the policy provides officials with avenues that are available to them to blow the whistle about suspected fraud and corruption in the Department. The policy also outlines the procedures once allegation of fraud and corruption have been reported. Officials are encouraged to use the fraud hotline number: 0800 701 701.
4. MINIMISING CONFLICT OF INTEREST
The Department is minimising conflict of interest by applying the Department’s policy and directives from the Department of Public Service

67
Dep
artm
ent o
f Min
eral
Reso
urce
sA
NN
UA
L R
EPO
RT
201
7/18
and Administration by not recommending requests for other remunerative work where this remunerative work conflicts with the official’s work in the Department or there is a potential conflict of interest
5. CODE OF CONDUCT The Senior Management Service, as well as other designated employees (employees on salary levels 12 and 11, as well as employees in Finance and Supply Chain Management, are required, on an annual basis, to disclose their financial interests.
• All designated employees who do not comply with prescribed deadlines as per the directive of the DPSA and the provisions of Chapter 2 of the new Public Regulations will be charged with misconduct, unless an acceptable reason can be provided for non-compliance.
• The Director-General signed a submission for the signing of a pledge of ethical conduct by all SMS members. Posters of the pledge will be placed at Head Office and at all the regional offices.
• The Director-General also signed a submission for the placement of the DMR’s core values at Head Office and all the regional offices.
• A policy on gifts and other remunerative work was approved.• The Department is also conducting regular workshops on the Code of
Conduct.
6. HEALTH, SAFETY AND ENVIRONMENTAL ISSUES
No. Issue Effects
1.Lack of support from management to implement health, safety and environmental strategies
Increase in injuries and diseases, and litigations against the Department
2. Unstable building slabsPossible fall-of-ground incidents causing injuries
3. Carpet odoursRespiratory diseases: asthma and others
4. Overcrowding of offices Communicable diseases
5.Poor positioning of work stations (lights above work station, work stations placed opposite light entering through windows)
Ergonomic challenges caused by glare
6. Poor or no cross-ventilation in officesAccumulation of odours causing diseases
No. Issue Effects
7.Absence of mechanical ventilation in offices with windows that cannot open
Stuffy offices
8. Tripping hazards Injuries from falling
9. Poor or no anti-slip tapes Fall from stairs
10. Non-compliant liftsEmployees getting stuck in lifts and often poor ventilation
7. PORTFOLIO COMMITTEESThe Department had a number of engagements with the Parliamentary Portfolio Committee (PPC) on Mineral Resources and the Select Committee on Land and Mineral Resources in line with the programmes of the two committees.
The two committees engaged the Department on a range of issues, ranging from the Annual Performance Plan and the Annual Report, to the Budget Vote and other specific areas relating to the operation of the Department.
The Department endeavoured to comprehensively respond to all questions posed to the Department, and beyond the specific meeting dates, efforts were made to follow up with the Committee Secretariat to ensure that all Committee resolutions are addressed fully or form part of ongoing departmental activities aimed at ensuring that matters are resolved.
8. SCOPA RESOLUTIONS
Resolution No. Subject Details
Response by the
DepartmentResolved (yes/no)
None None N/A N/A N/A
9. PRIOR MODIFICATIONS TO AUDIT REPORTS
Nature of qualification, disclaimer, adverse
opinion and matters of non-compliance
Financial year in which it first arose
Progress made in clearing or resolving the
matter
None

68
Departm
ent of Mineral Resources
AN
NU
AL R
EPORT
2017/18
10. INTERNAL CONTROL UNITDuring the year under review, the Internal Control Unit compiled the Annual Financial Statements, quarterly financial statements, interim financial statements and monthly compliance certificates. In addition, the Unit coordinated the activities of the Auditor-General, and monitored the clearance of suspense accounts to ensure that financial periods were closed on time and properly on the system.
The Unit also conducted compliance checks on the processes of financial documents (payments and journals) with the aim of ensuring the completeness of the information captured on the Basic Accounting System (BAS) and adherence to the Department’s financial delegations.
11. INTERNAL AUDIT AND AUDIT COMMITTEES
The purpose of Internal Audit is to provide independent, objective assurance and consulting services that are designed to add value and improve the Department’s operations. It helps the Department accomplish its objectives by bringing a systematic, disciplined approach to evaluate and improve the effectiveness of risk management, control and governance processes.
The Internal Audit Activity (IAA) intends to function in a manner that monitors that the following are in place:
• Risks are appropriately identified and managed.• Interaction with the various governance groups occurs as required.• Significant financial, managerial and operating information is accurate,
reliable and timely.• All the Department’s assets are appropriately safeguarded and the
existence of such assets, where applicable, can be verified.• Employees’ actions are in compliance with policies, standards,
procedures and applicable laws and regulations.• Resources are acquired economically, used efficiently and adequately
protected.• Programmes, plans and objectives are achieved.• Quality and continuous improvement are fostered in the Department’s
control process.• Significant legislative or regulatory issues that impact on the Department
are recognised and addressed appropriately.
The primary objective of Internal Audit is to assist the Accounting Officer and the Audit Committee in the effective discharge of their responsibilities. Internal Audit will provide them with independent analyses, appraisals, recommendations, counsel and information concerning the activities reviewed, with a view to improving accountability and performance.
The IAA provides the Department with the following benefits:
• The regular presence of internal auditors helps to protect the Department’s assets by deterring fraud, waste and abuse.
• Input from internal auditors helps employees improve their overall job performance and adherence to established controls.
• The IAA helps keep the Department accountable to the public by reviewing and reporting on adherence to established policies and procedures, laws, and the effectiveness, economy and efficiency of operations.
The IAA provides both oversight structures, such as the Audit Committee, and relevant parliamentary structures with the information they require to exercise their monitoring role.
Internal Audit performed the following audit work during the year under review:
• Financial audits: Chief Financial Officer Branch• Performance audits: all branches• Operational audits: all branches• ICT audit: Chief Financial Officer Branch.
Key activities and objectives of the Audit Committee
The Audit Committee is a non-executive committee in an advisory capacity to the Accounting Officer, which is primarily responsible for oversight over the Department’s governance, control and risk management processes.
The primary objective of the Audit Committee is to assist the senior management of the Department in fulfilling their responsibility relating to financial and operating reporting processes, the system of internal control, governance, risk management, audit processes and monitoring compliance with applicable laws, regulations, relevant prescripts and directives.
The following table discloses relevant information on the Audit Committee members and their attendance of Audit Committee meetings:

69
Dep
artm
ent o
f Min
eral
Reso
urce
sA
NN
UA
L R
EPO
RT
201
7/18
Name Qualifications Internal or external
If internal, position
in the Department
Date appointed Date resignedNumber of meetings attended
Ms Sakekile Baduza
• Chartered Accountant South Africa (CA(SA))
• MCom (South African and International Taxation)
• BCom (Accounting Sciences) Honours and Certificate in the Theory of Accounting
External N/A 1 November 2016 To date 4
Ms Zienzile Musamirapamwe
• MBA• Chartered Secretaries and Administrators
(CSA)• Portfolio Management I and II
External N/A 1 November 2016 To date 3
Ms Mpho Kgomongoe • BCom degree External N/A 1 March 2017 To date 4
12. AUDIT COMMITTEE REPORTWe are pleased to present our report for the financial year ended 31 March 2018.
Audit Committee responsibility
The Audit Committee reports that it has complied with its responsibilities arising from Section 38(1)(a)(ii) of the PFMA and Treasury Regulation 3.1.13. The Audit Committee also reports that it has adopted appropriate formal terms of reference as its Audit Committee Charter, has regulated its affairs in compliance with this charter and has discharged all
its responsibilities as contained therein, except that it has not reviewed changes in accounting policies and practices.
The effectiveness of internal control
Our review of the findings of the internal audit work, which was based on the risk assessments conducted in the Department, revealed certain weaknesses that were then raised with the Department.
The following internal audit work was completed during the year under review:

70
Departm
ent of Mineral Resources
AN
NU
AL R
EPORT
2017/18
Full audits
Information Security Management Review, ICT Service Continuity Review, ICT Change Management, Travel and Subsistence Allowance, Leave Management Audit, Procurement, Review of Inspection Process (Mineral Licenses), Rehabilitation of Derelict and Ownerless Mines, Review of Mine Safety Inspection Process, Review of the Annual Performance Plan, Quarterly Performance Information Review Quarter 1, Quarterly Performance Information Review Quarter 2, Quarterly Performance Information Review Quarter 3 and Management Performance Assessment Tool (MPAT) Review.
Follow-up audits
Auditor-General Management Letter, ICT Governance Review, ICT Incidents and Problems Management, Examinations, Quarterly Performance Information Review Quarter 1 Audit Report, Quarterly Performance Information Review Quarter 2 Audit Report.
Based on the Internal Audit Report, the following were areas of concern:
• The process for reporting standard, accurate, complete and valid performance information
• The absence of standard operating procedures and quality assurance processes
• The lack of documented IT security procedures• Absence of standard operating procedures for ranking and prioritising
sites for rehabilitation • Lack of formalised service-level agreements in respect of contracts for
the rehabilitation of derelict and ownerless mines.
In-year management and monthly or quarterly report
The Department has been reporting monthly and quarterly to National Treasury, as is required by the PFMA.
Evaluation of financial statements
We have reviewed the Annual Financial Statements prepared by the Department and provided our inputs.
Auditor-General’s Report
We have reviewed the Department’s implementation plan for audit issues raised in the previous year and we are satisfied that the matters have been adequately resolved, except for the lack of the monitoring and review of logon violations, activities and access rights to the various systems.
The Audit Committee concurs and accepts the conclusions of the Auditor-General on the Annual Financial Statements and is of the opinion that the audited Annual Financial Statements be accepted and read together with the Report of the Auditor-General.
Sakekile BaduzaChairperson of the Audit CommitteeDepartment of Mineral Resources31 July 2018

71
Dep
artm
ent o
f Min
eral
Reso
urce
sA
NN
UA
L R
EPO
RT
201
7/18 PART D
HUMAN RESOURCE MANAGEMENT

72
Departm
ent of Mineral Resources
AN
NU
AL R
EPORT
2017/18
1. INTRODUCTION The information contained in this part of the Annual Report has been prescribed by the Minister for Public Service and Administration for all departments in the public service.
2. OVERVIEW OF HUMAN RESOURCES
2.1 Overview of human resources in the Department
The Chief Directorate: Human Resources is responsible for rendering a management support service to the Department. It provides services relating to organisational development, HR planning and policy, HR administration and practices, HR development, employment relations, as well as security risk management. The Chief Directorate’s primary focus is on capacity building with a view to ensuring alignment between the departmental services.
2.2 The status of human resources in the Department
The filling of posts will be prioritised since a number of directorates are understaffed, which places an extra burden on other staff because of the additional workload that they must carry. Human capital is one of the most important resources any organisation can have, and if employees are happy with all or most of their working conditions, they become a valuable asset to an organisation. If they are dissatisfied, they become a huge liability. A high turnover rate results in additional costs to the Department because of advertisements and recruitment expenses, and also the loss of skilled and experienced employees. Furthermore, if a person is recruited from another province, the costs increase because of resettlement expenditure. Training costs may also escalate as new employees have to be trained. Moreover, the Department needs to show improvement as far as compliance with the Department’s Employment Equity Plan is concerned. 2.3 HR priorities for the year under review and their
impact
During the year under review the Chief Directorate: Human Resources committed itself to the following:
Organisational design
In order for the Department to achieve its strategic objectives, its organisational structure must be well designed and funded. Good organisational design also contributes to the success of other HR practices in the Department, such as job evaluation, training, recruitment and selection, retention and career pathing. It should be noted that, since the restructuring of the former Department of Minerals and Energy into DMR and the Department of Energy, no organisational review took place to determine the extent to which the existing structure adequately addressed the strategic and operational needs flowing from the legislative mandates. The outcome of the recent organisational functional assessment of the Department also showed a number of shortcomings that will have to be addressed over the medium to long term. The Department will continue to implement the recommendations in the organisational functional assessment, as well as the implementation of the Operations Management Framework and Methodology, as prescribed by the DPSA. To this end the Chief Director: Human Resources will assist the regional offices to standardise more of their processes to attain efficiency and effectiveness.
Organisational development
The restructuring of the Department of Minerals and Energy in 2010 brought about many changes. It must be admitted that inadequate attention to change management practices was given prior to, during and after the restructuring. Change management functions in the Department have been assigned to the Director: Organisational Development, who developed a change management strategy. It is, however, important to note that it is the responsibility of senior and executive management to change the way things are done in the Department, while the Directorate: Organisational Development provides the tools and technical support needed to bring about this change.
Employment equity
Compared to the economically active population group, progress has been slow in improving the representation of Coloured, Indian and white females in the Department. Another concern is with regard to the representation of women and people with disabilities in senior management positions in the Department. While the Department has recently re-established an Employment Equity Committee to assist it to address its employment equity gaps, affirmative action measures will have to be implemented to fast-track the representation of these designated groups in the Department.

73
Dep
artm
ent o
f Min
eral
Reso
urce
sA
NN
UA
L R
EPO
RT
201
7/18
Policy development and implementation
The Chief Directorate has contributed significantly towards policy development and implementation. Fourteen policies have been developed and implemented for the year under review.
Employee wellness
The realisation of DMR’s vision, as well as the NDP 2030 goal, hinges on healthy employees. It is on this basis that the Chief Director: Human Resources will intensify the implementation of integrated employee wellness. If possible, provision will be made for the re-allocation of funding to achieve this.
Ethics
Ethical conduct and leadership have been identified as among the expectations from the side of the DMR for the growth and competitiveness of the minerals and mining industry. The Chief Director: Human Resources will inculcate ethical conduct among its employees and managers through educational efforts and appropriate systems with the potential to yield positive results. Much progress has already been made in this regard through regular communiques, workshops, the signing of a pledge of ethical conduct and demonstrating the impact of the DMR’s core values on the achievement of the Department’s strategic objectives. 2.4 Workforce planning and key strategies to attract
and recruit a skilled and capable workforce
The filling of posts will be prioritised since a number of directorates are understaffed. This places an additional burden on other staff members because of the additional workload that they must carry. The Department will also review its HR Plan in 2018/19 to ensure that capacity is built in the Department. While a skills pipeline has been built and implemented in the Mine Health and Safety Inspectorate through learnerships and bursaries, this has to be extended to other branches as well. Internships in the line branches inadvertently focus on administrative support functions. The Chief Director: Human Resources intends to redirect the internship programme to focus on and grow the skills that are needed in line function branches.
2.5 Employee performance management The performance of employees is monitored and assessed through the performance management system that has been developed, and no major challenges have been experienced. A new policy on performance management and development was implemented during the period under review.
2.6 Employee wellness programmes The Department has a well-established Wellness Centre. HIV/AIDS testing and counselling, TB screening, diabetics, body mass index, hypertension and cholesterol testing were conducted, as well as training and awareness campaigns.
Achievements
The Department was 100% compliant in respect of the submission of financial disclosures for the period 2017/18. An Employment Equity Committee was established for the purpose of assisting the Department to comply with its Employment Equity Plan. An Ethics Committee was established for the purpose of assisting the Director-General to achieve his responsibilities in respect of ethics management as prescribed by the Public Service Regulations, 2016. A Policy on Gifts and Other Remunerative Work was developed.
Challenges
Budget constraints impede the filling of posts on the approved organisational structure. In the past years, the high cost of training and the inability to retain technical staff has resulted in a substantial loss of human capital investment. High levels of staff being “poached” by the industry for salaries far in excess of what government can offer were identified as a major challenge that could hamper service delivery.
Future HR Plan
The Department will continue to implement the recommendations contained in the Organisational Functional Assessment (OFA), as well as the implementation of the Operations Management Framework and Methodology as prescribed by the DPSA. Furthermore, the Department will implement a change management strategy and implementation plan upon endorsement by MANCO.
Internships in the line branches inadvertently focus on administrative support functions. The Chief Director: Human Resources intends to redirect the internship programme to focus on and grow the skills that are needed in line function branches.
An ethics strategy will be developed and implemented that is inclusive of ethics risks, as well as an action plan for the prevention of the risks identified. This strategy will ensure a high standard of professional ethics, and ensure that services are provided impartially, fairly, equitably and without bias.

74
Departm
ent of Mineral Resources
AN
NU
AL R
EPORT
2017/18
3. HUMAN RESOURCES OVERSIGHT STATISTICS3.1. Personnel-related expenditure
Table 3.1.1: Personnel expenditure by programme for the period 1 April 2017 to 31 March 2018
ProgrammeTotal
expenditure (R’000)
Compensation of employees expenditure
(R’000)
Training expenditure
(R’000)
Professional and special
services (R’000)
Compensation of employees
as a percentage of total
expenditure
Average compensation of employees
cost per employee
(R’000)Administration 336 225 170 045 4 057 1 596 51 505Mine Health and Safety 197 495 165 879 176 469 84 619Mineral Regulation 217 101 185 631 188 0 86 532Mineral Policy and Promotion 106 210 66 800 328 69 63 655Total (excluding transfers to public entities) 857 031 588 355 4 749 2 134 69 557Total (including transfers to public entities) 1 776 685 588 355 4 749 2 134 557
Note: Compensation of employees as a percentage of total expenditure is based on the total compensation of employees expenditure divided by the total voted expenditure, which excludes transfers.
Programme 1 to 4: Total voted expenditure excludes transfers to entities; Programme 1 (MQA and households, lease); Programme 2 (MHSC); Programme 3 (PASA, SADPMR); Programme 4 (Mintek and CGS) for normalisation. Table 3.1.2: Personnel costs by salary band for the period 1 April 2017 to 31 March 2018
Salary bands
Compensation of employees cost
including transfers (R’000)
Percentage of total personnel cost for
Department
Average compensation cost per employee (R)
Total personnel cost for
Department including goods
and services (R’000)
Number of employees
02 Skilled (levels 3–5) 49 859 6 250 548 857 031 19903 Highly skilled production (levels 6–8) 109 932 13 379 077 857 031 29004 Highly skilled supervision (levels 9–12) 316 933 37 720 302 857 031 44005 Senior management (levels ≥ 13) 77 602 9 1 193 883 857 031 6511 Contract (levels 3–5) 432 0 143 919 857 031 312 Contract (levels 6–8) 11 283 1 363 957 857 031 3113 Contract (levels 9–12) 14 933 2 785 927 857 031 1914 Contract (Levels ≥ 13) 9 099 1 1 010 987 857 031 9Total 590 073 69 558 781 857 031 1 056

75
Dep
artm
ent o
f Min
eral
Reso
urce
sA
NN
UA
L R
EPO
RT
201
7/18
Table 3.1.3: Salaries, overtime, home owners’ allowance (HOA) and medical aid by programme for the period 1 April 2017 to 31 March 2018
Programme Salaries (R'000)
Salaries as a percentage
of personnel cost
Overtime (R'000)
Overtime as a percentage of personnel
cost
HOA (R'000)
HOA as a percentage
of personnel cost
Medical aid
(R'000)
Medical aid as a percentage of personnel
cost
Total personnel cost per
programme (R'000)
Administration 148 063 87 3 036 2 4 069 2 7 121 4 170 045
Mine Health and Safety 146 397 88 8 0 2 466 2 4 750 3 165 879Mineral Regulation 159 498 86 56 0 4 811 3 9 227 5 185 631Mineral Policy and Promotion 58 617 88 265 0 1 465 2 2 160 3 66 800Total 512 575 87 3 365 1 12 811 2 23 258 4 588 355
Table 3.1.4: Salaries, overtime, HOA and medical aid by salary band for the period 1 April 2017 to 31 March 2018
Salary bands Salaries (R'000)
Salaries as a percentage
of personnel cost
Overtime (R'000)
Overtime as a percentage of personnel
cost
HOA (R'000)
HOA as a percentage
of personnel cost
Medical aid
(R'000)
Medical aid as a percentage of personnel
cost
Total personnel cost per
salary band (R'000)
02 Skilled (levels 3–5) 37 382 79 1 678 4 2 860 6 4 929 10 47 50903 Highly skilled production (levels 6–8)
89 949 86 971 1 4 092 4 7 451 7 104 935
04 Highly skilled supervision (levels 9–12)
281 131 88 716 0 4 508 1 9 316 3 319 810
05 Senior management (levels ≥ 13)
71 051 92 0 0 1 191 2 965 1 77 515
11 Contract (levels 3–5) 402 77 0 0 0 0 0 0 52312 Contract (levels 6–8) 10 010 74 0 0 61 1 387 3 13 50713 Contract (levels 9–12) 13 892 88 0 0 99 1 205 1 15 74514 Contract (levels ≥ 13) 8 757 99 0 0 0 0 5 0 8 810Total 512 575 87 3 365 1 12 811 2 23 258 4 588 355
3.2. Employment and vacancies
The following tables summarise the number of posts on the establishment, the number of employees, the vacancy rate, and whether there are any staff that are additional to the establishment. This information is presented in terms of three key variables: programme, salary band and critical occupations. Departments have identified critical occupations that need to be monitored. In terms of current regulations, it is possible to create a post on the establishment that can be occupied by more than one employee. Therefore, the vacancy rate reflects the percentage of posts that are not filled.

76
Departm
ent of Mineral Resources
AN
NU
AL R
EPORT
2017/18
Table 3.2.1: Employment and vacancies by programme as on 31 March 2018
Programme Number of posts Number of posts filled
Vacancy rate (Includes frozen
posts)
Number of posts filled additional to the establishment
Administration, permanent 382 337 12 11Mine Health and Safety, permanent 303 268 12 0Mineral Policy and Promotion, permanent 113 102 10 0Mineral Regulation, permanent 386 349 10 0Total 1 184 1 056 11 11
Table 3.2.2: Employment and vacancies by salary band as on 31 March 2018
Salary band Number of posts Number of posts filled
Vacancy rate (includes frozen
posts)
Number of posts filled additional to the establishment
02 Skilled (levels 3–5), permanent 211 199 6 003 Highly skilled production (levels 6–8), permanent 322 290 10 004 Highly skilled supervision (levels 9-–12), permanent 497 440 12 005 Senior management (levels >13), permanent 92 65 29 011 Contract (levels 3–5), permanent 3 3 0 112 Contract (levels 6–8), permanent 31 31 0 113 Contract (levels 9–12), permanent 19 19 0 514 Contract (levels >13), permanent 9 9 0 4Total 1 184 1 056 11 11
Table 3.2.3: Employment and vacancies by critical occupations as on 31 March 2018
Critical occupations Number of posts
Number of posts filled
Vacancy rate (includes
frozen posts)
Number of posts filled additional to the establishment
Administrative-related, permanent 124 113 9 5Agricultural, animal, oceanography, forestry and other sciences, permanent 1 1 0 0Biologists, botanists, zoologists and related professional, permanent 117 104 11 0Cartographers and surveyors, permanent 2 2 0 0Client information clerks (switchboard, receptionist, information clerks), permanent 12 11 8 0

77
Dep
artm
ent o
f Min
eral
Reso
urce
sA
NN
UA
L R
EPO
RT
201
7/18
Critical occupations Number of posts
Number of posts filled
Vacancy rate (includes
frozen posts)
Number of posts filled additional to the establishment
Communication and information-related, permanent 13 10 23 0Economists, permanent 46 42 9 0Engineering sciences-related, permanent 2 2 0 0Finance and economics-related, permanent 9 6 33 0Financial and related professionals, permanent 33 27 18 0Financial clerks and credit controllers, permanent 15 12 20 0General, legal, administration and related professionals, permanent 4 4 0 0Head of Department/Chief Executive Officer, permanent 1 1 0 0Human resources and organisational development and related professionals, permanent
30 28 7 0
Human resources clerks, permanent 15 14 7 0Human resources-related, permanent 1 1 0 0Information technology-related, permanent 9 8 11 0Language practitioners, interpreters and other communication, permanent 6 6 0 0Legal-related, permanent 5 5 0 0Librarians and related professionals, permanent 2 2 0 0Library, mail and related clerks, permanent 81 77 5 0Logistical support personnel, permanent 10 8 20 0Material-recording and transport clerks, permanent 29 27 7 0Messengers, porters and deliverers, permanent 6 5 17 1Other administrative and related clerks and organisers, permanent 91 84 8 0Other administrative, policy and related officers, permanent 56 50 11 0Other information technology personnel, permanent 26 24 8 0Other machine operators, permanent 1 1 0 0Other occupations, permanent 3 3 0 0Risk management and security services, permanent 8 7 13 0Safety health and quality inspectors, permanent 190 165 13 0Secretaries and other keyboard-operating clerks, permanent 82 77 6 1Security officers, permanent 50 49 2 0Senior managers, permanent 87 64 26 4Trade or industry advisers and other related professions, permanent 17 16 6 0Total 1 184 1 056 11 11

78
Departm
ent of Mineral Resources
AN
NU
AL R
EPORT
2017/18
Notes:
Critical occupations are defined as occupations or sub-categories within an occupation: • in which there is a scarcity of qualified and experienced persons currently or anticipated in the future, either because such skilled persons are not
available, or they are available, but do not meet the applicable employment criteria;• for which persons require advanced knowledge in a specified subject area or science or learning field and such knowledge is acquired by a prolonged
course or study and/or specialised instruction;• where the inherent nature of the occupation requires consistent exercise of discretion and is predominantly intellectual in nature; and• in respect of which a Department experiences a high degree of difficulty to recruit or retain the services of employees.
3.3. Filling of SMS posts
The tables in this section provide information on employment and vacancies as they relate to SMS members by salary level. It also provides information on the advertising and filling of SMS posts, reasons for not complying with prescribed timeframes and disciplinary steps taken.
Table 3.3.1: SMS post information as on 31 March 2018
SMS level Total number of funded SMS posts
Total number of SMS posts filled
Percentage of SMS posts filled
Total number of SMS posts vacant
Percentage of SMS posts vacant
Director-General/Head of Department 1 0 0 1 100Salary Level 16 0 0 0 0 0Salary Level 15 5 5 100 0 0Salary Level 14 20 14 70 6 30Salary Level 13 66 54 82 12 18Total 92 73 79 19 21
Table 3.3.2: SMS post information as on 30 September 2017
SMS level Total number of funded SMS posts
Total number of SMS posts filled
Percentage of SMS posts filled
Total number of SMS posts vacant
Percentage of SMS posts vacant
Director-General/Head of Department 1 1 100 0 0Salary Level 16 0 0 0 0 0Salary Level 15 5 4 80 1 20Salary Level 14 20 15 75 5 25Salary Level 13 65 50 77 15 23Total 91 70 77 21 23
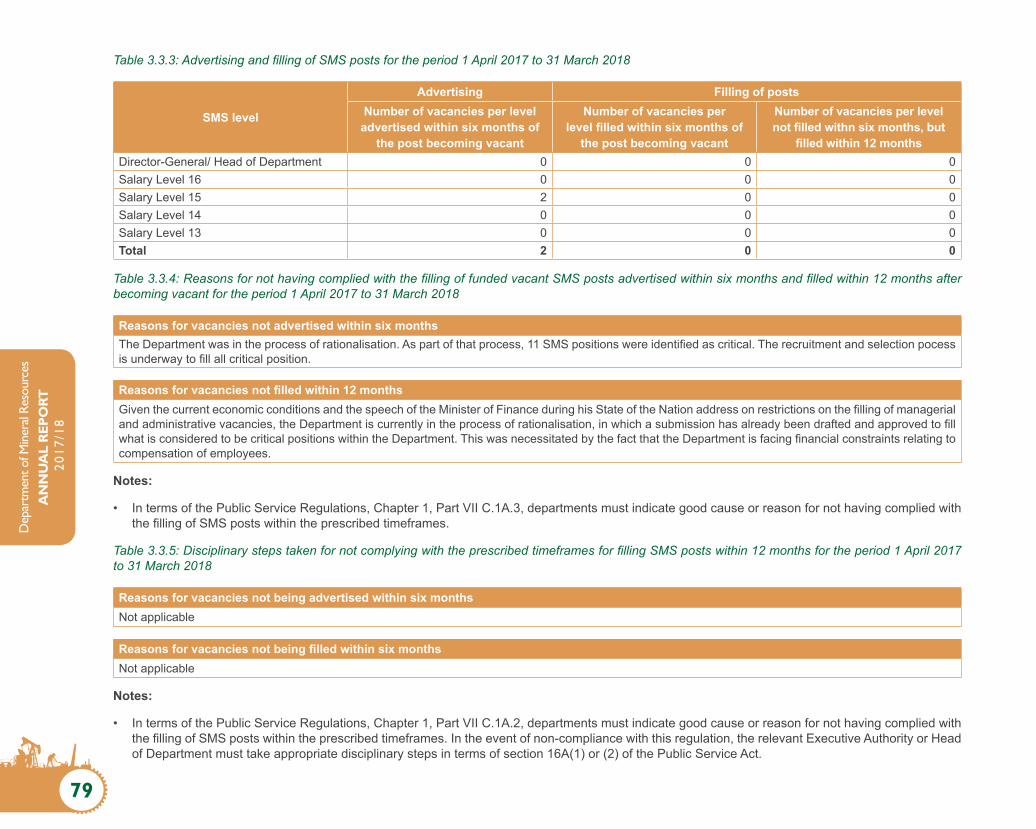
79
Dep
artm
ent o
f Min
eral
Reso
urce
sA
NN
UA
L R
EPO
RT
201
7/18
Table 3.3.3: Advertising and filling of SMS posts for the period 1 April 2017 to 31 March 2018
SMS level
Advertising Filling of postsNumber of vacancies per level advertised within six months of
the post becoming vacant
Number of vacancies per level filled within six months of
the post becoming vacant
Number of vacancies per level not filled withn six months, but
filled within 12 months Director-General/ Head of Department 0 0 0Salary Level 16 0 0 0Salary Level 15 2 0 0Salary Level 14 0 0 0Salary Level 13 0 0 0Total 2 0 0
Table 3.3.4: Reasons for not having complied with the filling of funded vacant SMS posts advertised within six months and filled within 12 months after becoming vacant for the period 1 April 2017 to 31 March 2018
Reasons for vacancies not advertised within six monthsThe Department was in the process of rationalisation. As part of that process, 11 SMS positions were identified as critical. The recruitment and selection pocess is underway to fill all critical position.
Reasons for vacancies not filled within 12 monthsGiven the current economic conditions and the speech of the Minister of Finance during his State of the Nation address on restrictions on the filling of managerial and administrative vacancies, the Department is currently in the process of rationalisation, in which a submission has already been drafted and approved to fill what is considered to be critical positions within the Department. This was necessitated by the fact that the Department is facing financial constraints relating to compensation of employees.
Notes:
• In terms of the Public Service Regulations, Chapter 1, Part VII C.1A.3, departments must indicate good cause or reason for not having complied with the filling of SMS posts within the prescribed timeframes.
Table 3.3.5: Disciplinary steps taken for not complying with the prescribed timeframes for filling SMS posts within 12 months for the period 1 April 2017 to 31 March 2018
Reasons for vacancies not being advertised within six monthsNot applicable
Reasons for vacancies not being filled within six monthsNot applicable
Notes:
• In terms of the Public Service Regulations, Chapter 1, Part VII C.1A.2, departments must indicate good cause or reason for not having complied with the filling of SMS posts within the prescribed timeframes. In the event of non-compliance with this regulation, the relevant Executive Authority or Head of Department must take appropriate disciplinary steps in terms of section 16A(1) or (2) of the Public Service Act.

80
Departm
ent of Mineral Resources
AN
NU
AL R
EPORT
2017/18
3.4. Job evaluation
Within a nationally determined framework, executing authorities may evaluate or re-evaluate any job in their organisation. In terms of the Regulations, all vacancies on salary levels 9 and higher must be evaluated before they are filled. The following table summarises the number of jobs that were evaluated during the year under review. The table also provides statistics on the number of posts that were upgraded or downgraded.
Table 3.4.1: Job evaluation by salary band for the period 1 April 2017 to 31 March 2018
Salary band Number of posts
Number of jobs
evaluated
Percentage of posts
evaluated
Number of posts
upgraded
Percentage of upgraded
posts evaluated
Number of posts
downgraded
Percentage of downgraded
posts evaluated
02 Skilled (levels 3–5) 211 0 0 0 0 0 003 Highly skilled production (levels 6–8) 322 26 8 2 8 0 004 Highly skilled supervision (levels 9–12) 497 35 7 9 26 0 005 SMS Band A 64 0 0 0 0 0 006 SMS Band B 19 0 0 0 0 0 007 SMS Band C 6 0 0 0 0 0 008 SMS Band D 3 0 0 0 0 0 011 Contract (levels 3–5) 3 0 0 0 0 0 012 Contract (levels 6–8) 31 0 0 0 0 0 013 Contract (evels 9–12) 19 0 0 0 0 0 014 Contract Band A 5 0 0 0 0 0 015 Contract Band B 2 0 0 0 0 0 017 Contract Band D 2 0 0 0 0 0 0Total 1 184 61 15 11 34 0 0
The following table provides a summary of the number of employees whose positions were upgraded due to their post being upgraded. The number of employees might differ from the number of posts upgraded since not all employees are automatically absorbed into the new posts and some of the posts that were upgraded could also be vacant.
Table 3.4.2: Profile of employees whose positions were upgraded due to their posts being upgraded for the period 1 April 2017 to 31 March 2018
Beneficiaries African Asian Coloured White TotalFemale 1 0 1 0 2Male 3 0 0 0 3Total 4 0 1 0 5Employees with a disability 0 0 0 0 0
The following table summarises the number of cases where remuneration bands exceeded the grade determined by job evaluation. Reasons for the deviation are provided in each case.
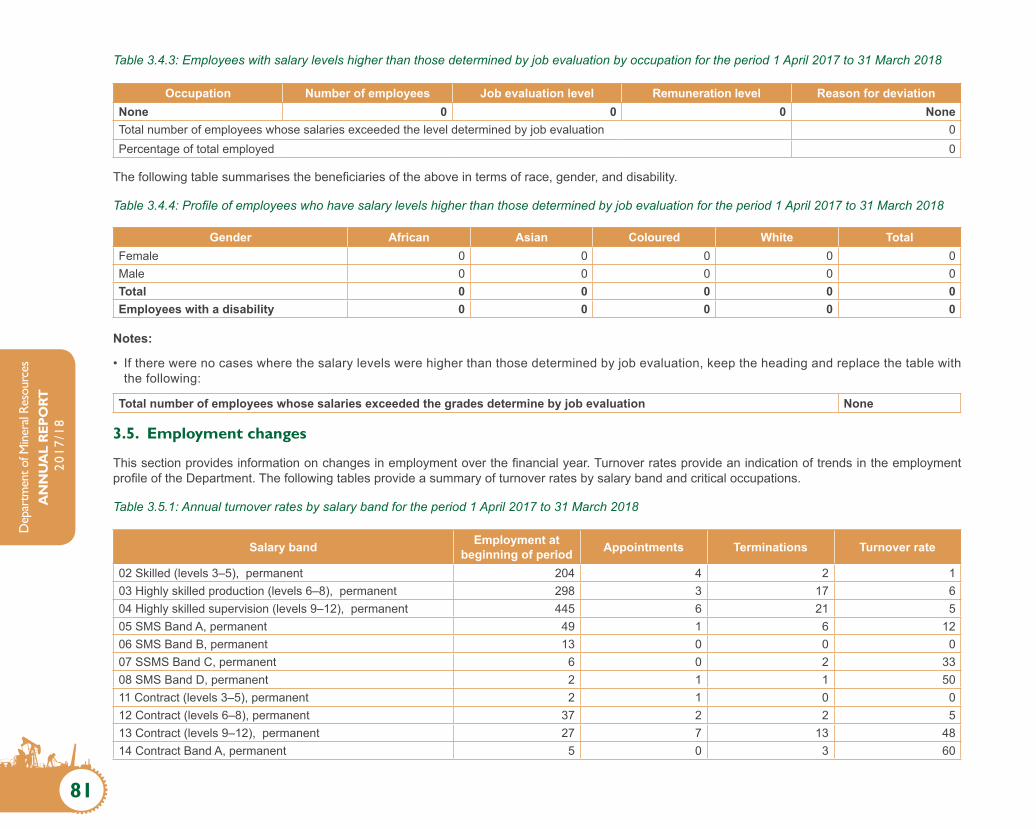
81
Dep
artm
ent o
f Min
eral
Reso
urce
sA
NN
UA
L R
EPO
RT
201
7/18
Table 3.4.3: Employees with salary levels higher than those determined by job evaluation by occupation for the period 1 April 2017 to 31 March 2018
Occupation Number of employees Job evaluation level Remuneration level Reason for deviationNone 0 0 0 NoneTotal number of employees whose salaries exceeded the level determined by job evaluation 0Percentage of total employed 0
The following table summarises the beneficiaries of the above in terms of race, gender, and disability.
Table 3.4.4: Profile of employees who have salary levels higher than those determined by job evaluation for the period 1 April 2017 to 31 March 2018
Gender African Asian Coloured White TotalFemale 0 0 0 0 0Male 0 0 0 0 0Total 0 0 0 0 0Employees with a disability 0 0 0 0 0
Notes:
• If there were no cases where the salary levels were higher than those determined by job evaluation, keep the heading and replace the table with the following:
Total number of employees whose salaries exceeded the grades determine by job evaluation None
3.5. Employment changes
This section provides information on changes in employment over the financial year. Turnover rates provide an indication of trends in the employment profile of the Department. The following tables provide a summary of turnover rates by salary band and critical occupations.
Table 3.5.1: Annual turnover rates by salary band for the period 1 April 2017 to 31 March 2018
Salary band Employment at beginning of period Appointments Terminations Turnover rate
02 Skilled (levels 3–5), permanent 204 4 2 103 Highly skilled production (levels 6–8), permanent 298 3 17 604 Highly skilled supervision (levels 9–12), permanent 445 6 21 505 SMS Band A, permanent 49 1 6 1206 SMS Band B, permanent 13 0 0 007 SSMS Band C, permanent 6 0 2 3308 SMS Band D, permanent 2 1 1 5011 Contract (levels 3–5), permanent 2 1 0 012 Contract (levels 6–8), permanent 37 2 2 513 Contract (levels 9–12), permanent 27 7 13 4814 Contract Band A, permanent 5 0 3 60

82
Departm
ent of Mineral Resources
AN
NU
AL R
EPORT
2017/18
Salary band Employment at beginning of period Appointments Terminations Turnover rate
15 Contract Band B, permanent 0 2 0 017 Contract Band D, permanent 2 1 1 50Total 1 090 28 68 6
Table 3.5.2: Annual turnover rates by critical occupation for the period 1 April 2017 to 31 March 2018
OccupationEmployment at beginning
of periodAppointments Terminations Turnover
rate
Administrative-related, permanent 110 8 8 7Agricultural, animal, oceanography, forestry and other science, permanent 1 0 0 0Biologists, botanists, zoologists and related professional, permanent 107 0 2 2Cartographers and surveyors, permanent 2 0 0 0Client information clerks (switchboard, reception, information clerks), permanent 11 1 1 9Communication and information-related, permanent 10 0 2 20Economists, permanent 43 0 0 0Engineering sciences-related, permanent 2 0 1 50Finance and economics-related, permanent 8 1 1 13Financial and related professionals, permanent 29 1 5 17Financial clerks and credit controllers, permanent 13 1 2 15General, legal administration and related professionals, permanent 4 0 0 0Head of Department/Chief Executive Officer, permanent 1 1 0 0Human resources and organisational development and related professionals, permanent 28 0 1 4Human resources clerks, permanent 15 1 2 13Human resources-related, permanent 1 0 0 0Information technology-related, permanent 8 0 0 0Language practitioners, interpreters and other communication, permanent 6 0 0 0Legal-related, permanent 4 1 0 0Librarians and related professionals, permanent 2 0 0 0Library, mail and related clerks, permanent 78 1 3 4Logistical support personnel, permanent 9 0 1 11Material-recording and transport clerks, permanent 28 0 1 4Messengers, porters and deliverers, permanent 4 1 0 0Other administration and related clerks and organisers, permanent 87 0 2 2Other administrative policy and related officers, permanent 50 0 2 4Other information technology personnel, permanent 24 2 2 8Other machine operators, permanent 1 0 0 0Other occupations, permanent 3 1 1 33

83
Dep
artm
ent o
f Min
eral
Reso
urce
sA
NN
UA
L R
EPO
RT
201
7/18
OccupationEmployment at beginning
of periodAppointments Terminations Turnover
rate
Risk management and security services, permanent 7 0 0 0Safety health and quality inspectors, permanent 181 3 20 11Secretaries and other keyboard-operating clerks, permanent 78 2 0 0Security officers, permanent 51 0 1 2Senior managers, permanent 67 3 9 13Trade/industry advisors and other related professionals, permanent 17 0 1 6Total 1 090 28 68 6
Notes:
Critical occupations are defined as occupations or sub-categories within an occupation:
(a) in which there is a scarcity of qualified and experienced persons currently or anticipated in the future, either because such skilled persons are not available or they are available, but do not meet the applicable employment criteria;
(b) for which persons require advanced knowledge in a specified subject area or science or learning field and such knowledge is acquired by a prolonged course or study and/or specialised instruction;
(c) where the inherent nature of the occupation requires consistent exercise of discretion and is predominantly intellectual in nature; and(d) in respect of which a Department experiences a high degree of difficulty to recruit or retain the services of employees. The table below identifies the major reasons why staff left the Department.
Table 3.5.3: Reasons why staff left the Department for the period 1 April 2017 to 31 March 2018
Termination type Number Percentage of total resignations
Percentage of total employment Total Total employment
01 Death, permanent 2 3 0 68 1 05602 Resignation, permanent 25 37 2 68 1 05603 Expiry of contract, permanent 18 27 2 68 1 05609 Retirement, permanent 7 10 1 68 1 056Transfer 16 24 2 68 1 056Total 68 100 7 68 1 056
Table 3.5.4: Promotions by critical occupation for the period 1 April 2017 to 31 March 2018
OccupationEmployment
at beginning of period
Promotions to another salary
level
Salary level promotions as a percentage of
employment
Progressions to another notch within salary
level
Notch progressions as a percentage of
employmentAdministrative-related 110 3 3 78 71Agricultural, animal, oceanography, forestry and other sciences 1 0 0 0 0

84
Departm
ent of Mineral Resources
AN
NU
AL R
EPORT
2017/18
OccupationEmployment
at beginning of period
Promotions to another salary
level
Salary level promotions as a percentage of
employment
Progressions to another notch within salary
level
Notch progressions as a percentage of
employmentBiologists, botanists, zoologists and related professionals 107 0 0 66 62
Cartographers and surveyors 2 0 0 1 50Client information clerks (switchboard, receptionist, information clerks) 11 0 0 9 82
Communication and information-related 10 0 0 4 40Economists 43 0 0 28 65Engineering sciences-related 2 0 0 2 100Finance and economics-related 8 0 0 3 38Financial and related professionals 29 1 3 20 69Financial clerks and credit controllers 13 0 0 8 62General, legal, administration and related professionals 4 0 0 4 100
Head of Department/Chief Executive Officer 1 0 0 0 0Human resources and organisational development and related professionals 28 0 0 24 86
Human resources clerks 15 0 0 11 73Human resources-related 1 0 0 1 100Information technology-related 8 0 0 6 75Language practitioners, interpreters and other communication 6 0 0 4 67
Legal-related 4 0 0 4 100Librarians and related professionals 2 0 0 2 100Library, mail and related clerks 78 0 0 61 78Logistical support personnel 9 0 0 7 78Material-recording and transport clerks 28 0 0 18 64Messengers, porters and deliverers 4 0 0 2 50Other administration and related clerks and organisers 87 0 0 58 67
Other administrative, policy and related officers 50 0 0 34 68Other information technology personnel 24 0 0 18 75Other machine operators 1 0 0 1 100Other occupations 3 0 0 1 33Risk management and security services 7 0 0 7 100Safety, health and quality inspectors 181 0 0 76 42Secretaries and other keyboard-operating clerks 78 0 0 50 64

85
Dep
artm
ent o
f Min
eral
Reso
urce
sA
NN
UA
L R
EPO
RT
201
7/18
OccupationEmployment
at beginning of period
Promotions to another salary
level
Salary level promotions as a percentage of
employment
Progressions to another notch within salary
level
Notch progressions as a percentage of
employmentSecurity officers 51 0 0 34 67Senior managers 67 1 2 47 70Trade/industry advisors and other related professionals 17 0 0 10 59
Total 1 090 5 1 699 64
Table 3.5.5: Promotions by salary band for the period 1 April 2017 to 31 March 2018
Salary bandEmployment
at beginning of period
Promotions to another salary
level
Salary level promotions as a percentage of
employment
Progressions to another notch within salary
level
Notch progressions as a percentage of
employment02 Skilled (levels 3–5), permanent 204 0 0 138 6803 Highly skilled production (levels 6–8), permanent 298 2 1 203 6804 Highly skilled supervision (levels 9–12), permanent 445 2 0 301 6805 Senior management (levels >13), permanent 70 1 1 53 7611 Contract (levels 3–5), permanent 2 0 0 0 012 Contract (levels 6–8), permanent 37 0 0 0 013 Contract (levels 9–12), permanent 27 0 0 4 1514 Contract (levels >13), permanent 7 0 0 0 0Total 1 090 5 1 699 64
3.6. Employment Equity
Table 3.6.1: Total number of employees (including employees with disabilities) in each of the following occupational categories as on 31 March 2018
Occupational band African Coloured Indian Male, total Black White African Coloured Indian Female,
total Black White Total
02 Professionals 125 1 2 128 6 144 2 3 149 5 28803 Technicians and associate professionals
161 2 0 163 21 143 4 1 148 4 336
09 Labourers and related workers 3 0 0 3 0 3 0 0 3 0 6
08 Plant and machine operators and assemblers
1 0 0 1 0 0 0 0 0 0 1
05 Service shop and market sales workers 33 3 0 36 4 15 1 0 16 0 56

86
Departm
ent of Mineral Resources
AN
NU
AL R
EPORT
2017/18
Occupational band African Coloured Indian Male, total Black White African Coloured Indian Female,
total Black White Total
04 Clerks 71 2 0 73 1 198 15 0 213 15 30201 Senior officials and managers 42 0 0 42 4 20 0 1 21 0 67
Total 436 8 2 446 36 523 22 5 550 24 1056Employees with disabilities 4 0 0 4 2 1 0 0 1 0 7
Table 3.6.2: Total number of employees (including employees with disabilities) in each of the following occupational bands as on 31 March 2018
Occupational band Male, African
Male, Coloured
Male, Indian
Male, total Black
Male, White
Female, African
Female, Coloured
Female, Indian
Female, total Black
Female, White Total
01 Top management, permanent 3 0 0 3 0 3 0 0 3 0 6
02 Senior management, permanent
34 0 0 34 4 21 0 0 21 0 59
03 Professionally qualified and experienced specialists and mid-management, permanent
211 4 2 217 26 183 2 4 189 8 440
04 Skilled technical and academically qualified workers, junior management, supervisors, foremen, permanent
74 1 0 75 5 181 14 0 195 15 290
05 Semi-skilled and discretionary decision making, permanent
75 3 0 78 1 114 5 0 119 1 199
08 Contract (top management), permanent
1 0 0 1 0 0 0 1 1 0 2
09 Contract (senior management), permanent
6 0 0 6 0 1 0 0 1 0 7
10 Contract (professionally qualified), permanent
10 0 0 10 0 8 1 0 9 0 19
11 Contract (skilled technical), permanent 20 0 0 20 0 11 0 0 11 0 31

87
Dep
artm
ent o
f Min
eral
Reso
urce
sA
NN
UA
L R
EPO
RT
201
7/18
Occupational band Male, African
Male, Coloured
Male, Indian
Male, total Black
Male, White
Female, African
Female, Coloured
Female, Indian
Female, total Black
Female, White Total
12 Contract (semi-skilled), permanent 2 0 0 2 0 1 0 0 1 0 3
Total 436 8 2 446 36 523 22 5 550 24 1 056
Table 3.6.3: Recruitment for the period 1 April 2017 to 31 March 2018
Occupational bands Male, African
Male, Coloured
Male, Indian
Male, total Black
Male, White
Female, African
Female, Coloured
Female, Indian
Female, total Black
Female, White Total
01 Top Management, permanent 1 0 0 1 0 0 0 0 0 0 1
02 Senior management, permanent
1 0 0 1 0 0 0 0 0 0 1
03 Professionally qualified and experienced specialists and mid-management, permanent
1 0 0 1 0 3 1 0 4 0 5
04 Skilled technical and academically qualified workers, junior management, supervisors, foremen, permanent
2 0 0 2 0 0 0 0 0 0 2
05 Semi-skilled and discretionary decision making, permanent
0 0 0 0 0 4 0 0 4 0 4
08 Contract (top management), permanent
1 0 0 1 0 0 0 0 0 0 1
09 Contract (senior management), permanent
4 0 0 4 0 0 0 0 0 0 4
10 Contract (professionally qualified), permanent
4 0 0 4 1 2 0 0 2 0 7
11 Contract (skilled technical), permanent 0 0 0 0 0 2 0 0 2 0 2
12 Contract (semi-skilled), permanent 1 0 0 1 0 0 0 0 0 0 1
Total 15 0 0 15 1 11 1 0 12 0 28Employees with disabilities 0 0 0 0 0 0 0 0 0 0 0

88
Departm
ent of Mineral Resources
AN
NU
AL R
EPORT
2017/18
Table 3.6.4: Promotions for the period 1 April 2017 to 31 March 2018
Occupational bands Male, African
Male, Coloured
Male, Indian
Male, total Black
Male, White
Female, African
Female, Coloured
Female, Indian
Female, total Black
Female, White Total
01 Top management, permanent 0 0 0 0 0 2 0 0 2 0 2
02 Senior management, permanent
30 0 0 30 2 20 0 0 20 0 52
03 Professionally qualified and experienced specialists and mid-management, permanent
150 2 0 152 15 129 1 3 133 3 303
04 Skilled technical and academically qualified workers, junior management, supervisors, foremen, permanent
51 1 0 52 4 126 10 0 136 13 205
05 Semi-skilled and discretionary decision making, permanent
52 3 0 55 1 77 4 0 81 1 138
10 Contract (professionally qualified), permanent
1 0 0 1 0 3 0 0 3 0 4
Total 284 6 0 290 22 357 15 3 375 17 704Employees with disabilities 4 0 0 4 2 1 0 0 1 0 7
Table 3.6.5: Terminations for the period 1 April 2017 to 31 March 2018
Occupational bands Male, African
Male, Coloured
Male, Indian
Male, total Black
Male, White
Female, African
Female, Coloured
Female, Indian
Female, total Black
Female, White Total
01 Top management, permanent 3 0 0 3 0 0 0 0 0 0 3
02 Senior management, permanent
3 0 0 3 1 2 0 0 2 0 6
03 Professionally qualified and experienced specialists and mid-management, permanent
11 0 0 11 4 5 0 0 5 0 20

89
Dep
artm
ent o
f Min
eral
Reso
urce
sA
NN
UA
L R
EPO
RT
201
7/18
Occupational bands Male, African
Male, Coloured
Male, Indian
Male, total Black
Male, White
Female, African
Female, Coloured
Female, Indian
Female, total Black
Female, White Total
04 Skilled technical and academically qualified workers, junior management, supervisors, foremen, permanent
6 0 0 6 0 4 2 0 6 1 13
05 Semi-skilled and discretionary decision making, permanent
3 0 0 3 0 4 0 0 4 0 7
08 Contract (top management), permanent
0 0 0 0 0 0 0 1 1 0 1
09 Contract (senior management), permanent
3 0 0 3 0 0 0 0 0 0 3
10 Contract (professionally qualified), permanent
2 0 0 2 8 3 0 0 3 0 13
11 Contract (skilled technical), permanent 2 0 0 2 0 0 0 0 0 0 2
Total 33 0 0 33 13 18 1 1 21 1 68
Table 3.6.6: Disciplinary action for the period 1 April 2017 to 31 March 2018
Disciplinary action Male, African
Male, Coloured
Male, Indian
Male, total Black
Male, White
Female, African
Female, Coloured
Female, Indian
Female, total Black
Female, White Total
12 employees 8 1 1 10 1 0 1 0 1 0 12
Table 3.6.7: Skills development for the period 1 April 2017 to 31 March 2018
Occupational categories
Male, African
Male, Coloured
Male, Indian
Male, total Black
Male, White
Female, African
Female, Coloured
Female, Indian
Female, total Black
Female, White Total
Legislators, senior officials and managers 10 0 0 10 0 11 0 0 11 0 21
Professionals 96 2 0 98 0 112 0 0 112 1 211
Technicians and associate professionals
33 0 0 33 6 52 1 0 53 0 92
Clerks 30 1 0 31 0 75 8 0 83 2 116

90
Departm
ent of Mineral Resources
AN
NU
AL R
EPORT
2017/18
Occupational categories
Male, African
Male, Coloured
Male, Indian
Male, total Black
Male, White
Female, African
Female, Coloured
Female, Indian
Female, total Black
Female, White Total
Service and sales workers 14 0 0 14 1 6 0 0 6 0 21
Skilled agriculture and fishery workers 0 0 0 0 0 0 0 0 0 0 0
Craft and related trades workers 0 0 0 0 0 0 0 0 0 0 0
Plant and machine operators and assemblers
1 0 0 1 0 2 0 0 2 0 3
Elementary occupations 0 0 0 0 0 0 0 0 0 0 0
Total 184 3 0 187 7 258 9 0 267 3 464
Employees with disability 1 0 0 1 0 0 0 0 0 0 0
3.7. Signing of performance agreements by SMS members
All members of the SMS must conclude and sign performance agreements within specific timeframes. Information regarding the signing of performance agreements by SMS members, the reasons for not complying within the prescribed timeframes and disciplinary steps taken are presented here.
Table 3.7.1: Signing of performance agreements by SMS members as on 31 May 2017
SMS level Total number of funded SMS posts
Total number of SMS members
Total number of signed performance
agreements
Signed performance agreements as a percentage
of total number of SMS members
Director-General/Head of Department 1 1 0 0%Salary Level 16 0 0 0 0%Salary Level 15 5 5 4 80%Salary Level 14 20 14 13 93%Salary Level 13 66 53 51 96%Total 92 73 68 93%
Notes:
In the event of a national or provincial election occurring within the first three months of a financial year, all members of the SMS must conclude and sign their performance agreements for that financial year within three months following the month in which the elections took place. For example, if elections took place in April, the reporting date in the heading of the table above should change to 31 July 2017.

91
Dep
artm
ent o
f Min
eral
Reso
urce
sA
NN
UA
L R
EPO
RT
201
7/18
Table 3.7.2: Reasons for not having concluded performance agreements for all SMS members as on 31 March 2018
Reasons Three officials at levels 15, 14 and 13 were seconded to state-owned entities, hence they could not comply and therefore affect the statistics.One official at Level 13 due to disagreement on the contents of the performance agreement.
Notes:
The reporting date in the heading of this table should be aligned with that of Table 3.7.1.
Table 3.7.3: Disciplinary steps taken against SMS members for not having concluded performance agreements as on 31 March 2018
Reasons One official at Level 13 was taken through the disciplinary process.
Notes
The reporting date in the heading of this table should be aligned with that of Table 3.7.1.
3.8. Performance rewards
To encourage good performance, the Department granted the following performance rewards during the year under review. The information is presented in terms of race, gender, disability, salary bands and critical occupations.
Table 3.8.1: Performance rewards by race, gender and disability for the period 1 April 2017 to 31 March 2018
Demographics Number of beneficiaries Total employment Percentage of
total employmentCost
(R'000)Average cost per
beneficiary (R)African, female 471 522 90 4 995 10 605
African, male 372 432 86 4 957 13 326
Asian, female 3 5 60 40 13 214
Asian, male 2 2 100 44 22 195
Coloured, female 19 22 86 131 6 920
Coloured, male 8 8 100 77 9 616
Total Black, female 493 549 90 5 166 10 479
Total Black, male 382 442 86 5 079 13 295
White, female 24 24 100 250 10 415
White, male 43 34 127 831 19 334
Total 949 1 056 90 11 436 12 051Employees with a disability 7 7 100 110 15 669

92
Departm
ent of Mineral Resources
AN
NU
AL R
EPORT
2017/18
Table 3.8.2: Performance rewards by salary band for personnel below SMS for the period 1 April 2017 to 31 March 2018
Salary band Number of beneficiaries Total employment Percentage of
total employment Cost (R'000) Average cost per beneficiary (R)
02 Skilled (levels 3–5) 191 199 96 785 4 108
03 Highly skilled production (levels 6–8) 269 290 93 1 784 6 632
04 Highly skilled supervision (levels 9–12) 405 440 92 6 289 15 530
11 Contract (levels 3–5) 1 3 33 4 4 166
12 Contract (levels 6–8) 19 31 61 129 6 804
13 Contract (levels 9–12) 16 19 84 263 16 466
Total 901 982 92 9 255 10 272
Table 3.8.3: Performance rewards by critical occupation for the period 1 April 2017 to 31 March 2018
Critical occupations Number of beneficiaries Total employment Percentage of
total employment Cost (R'000) Average cost per beneficiary (R)
Financial clerks and credit controllers 10 12 83 54 5 383
Human resources clerks 13 14 93 76 5 845
Security officers 48 49 98 208 4 336
Human resources and organisational development and related professions 27 28 96 359 13 278
Messengers, porters and deliverers 3 5 60 12 4 116
Risk management and security services 7 7 100 131 18 738
Safety, health and quality inspectors 150 165 91 2 664 17 758
Logistical support personnel 8 8 100 58 7 235
Finance and economics-related 4 6 67 75 18 855
Other administration and related clerks and organisers 80 84 95 443 5 540
Other occupations 1 3 33 4 4 354
Legal-related 4 5 80 97 24 366
Agricultural, animal, oceanography, forestry and other sciences 0 1 0 0 0
Financial and related professionals 26 27 96 228 8 752
Administrative-related 105 113 93 1 517 14 452
Biologists, botanists, zoologists and related professionals 82 104 79 1 053 12 842
Communication and information-related 9 10 90 136 15 130

93
Dep
artm
ent o
f Min
eral
Reso
urce
sA
NN
UA
L R
EPO
RT
201
7/18
Critical occupations Number of beneficiaries Total employment Percentage of
total employment Cost (R'000) Average cost per beneficiary (R)
Secretaries and other keyboard-operating clerks 74 77 96 479 6 477
Library, mail and related clerks 74 77 96 349 4 720Human resources-related 1 1 100 8 8015Trade/industry advisors and other related professions 15 16 94 209 13 953
Head of Department/Chief Executive Officer 0 1 0 0 0Language practitioners, interpreters and other communication 6 6 100 56 9 280
General, legal, administration and related professionals 4 4 100 63 15 679
Material-recording and transport clerks 27 27 100 135 4 990Other administrative policy and related officers 46 50 92 476 10 351Senior managers 42 64 66 1528 36 385Client information clerks (switchboard, reception, information clerks) 11 11 100 44 4 045
Economists 37 42 88 588 15 900Cartographers and surveyors 2 2 100 17 8 560Other information technology personnel 20 24 83 179 8 926Engineering sciences-related 2 2 100 44 22 195Other machine operators 1 1 100 4 3 641Information technology related 8 8 100 125 15 659Librarians and related professionals 2 2 100 15 7 378Total 949 1 056 90 11 436 12 051
Notes:
Critical occupations are defined as occupations or sub-categories within an occupation:
(a) in which there is a scarcity of qualified and experienced persons currently or anticipated in the future, either because such skilled persons are not available or they are available but do not meet the applicable employment criteria;
(b) for which persons require advanced knowledge in a specified subject area or science or learning field and such knowledge is acquired by a prolonged course or study and/or specialised instruction;
(c) where the inherent nature of the occupation requires consistent exercise of discretion and is predominantly intellectual in nature; and(d) in respect of which a department experiences a high degree of difficulty to recruit or retain the services of employees.

94
Departm
ent of Mineral Resources
AN
NU
AL R
EPORT
2017/18
Table 3.8.4 :Performance-related rewards (cash bonus), by salary band for SMS for the period 1 April 2017 to 31 March 2018
SMS band Number of beneficiaries
Total employees
Percentage of total
employmentCost (R'000)
Average cost per beneficiary
(R)
Percentageof SMS wage bill
Personnel cost SMS
(R'000)Band A 35 50 70 1 565 44 726 3 58 114Band B 11 16 69 497 45 180 3 17 630Band C 2 4 50 119 59 298 2 7 789Band D 0 4 0 0 0 0 8 260Total 48 74 189 2 181 45 438 2 91 794
3.9. Foreign workers
The tables below summarise the employment of foreign nationals in the Department in terms of salary band and major occupation.
Table 3.9.1: Foreign workers by salary band for the period 1 April 2017 to 31 March 2018
Salary bandEmployment at beginning
of period
Percentage of total at beginning of period
Employment at end of period
Percentage of total
at end of period
Change in employment
Percentage of total
Total employment at beginning
of period
Total employment
at end of period
Total change in
employment
Other 0 0 0 0 0 0 0 0 0Total 0 0 0 0 0 0 0 0 0
Table 3.9.2: Foreign workers by major occupation for the period 1 April 2017 to 31 March 2018
Major occupational
class
Employment at beginning
of period
Percentage of total at
beginning of period
Employment at end of period
Percentage of total
at end of period
Change in employment
Percentage of total
Total employment at beginning
of period
Total employment
at end of period
Total change in
employment
Other 0 0 0 0 0 0 0 0 0Total 0 0 0 0 0 0 0 0 0
3.10. Leave utilisation
The Public Service Commission identified the need for careful monitoring of sick leave within the public service. The following tables provide an indication of the use of sick leave and disability leave. In both cases, the estimated cost of the leave is also provided.

95
Dep
artm
ent o
f Min
eral
Reso
urce
sA
NN
UA
L R
EPO
RT
201
7/18
Table 3.10.1: Sick leave for the period 1 January 2017 to 31 December 2018
Salary band Total days
Percentage days with medical
certification
Number of employees
using sick leave
Percentage of total employees using sick leave
Average days per employee
Estimated cost
(R'000)
Total number of employees
using sick leave
Total number of days with
medical certification
Contract (levels 13–16) 10 100 1 0 10 34 849 10 Contract (levels 6–8) 99 96 18 2 6 137 849 95 Contract (levels 9–12) 116 98 16 2 7 272 849 114 Highly skilled production (levels 6–8) 2 232 79 263 31 8 2 983 849 1 771
Highly skilled supervision (levels 9–12) 2 614 81 336 40 8 6 685 849 2 116
Senior management (levels 13–16) 394 88 41 5 10 1 573 849 347
Skilled (levels 3–5) 1 545 82 174 21 9 1 269 849 1 266 Total 7 010 82 849 100 8 12 954 849 5 719
Table 3.10.2: Disability leave (temporary and permanent) for the period 1 January 2017 to 31 December 2018
Salary band Total days
Percentage days with medical
certification
Number of employees
using disability leave
Percentage of total employees using disability
leave
Average days per employee
Estimated cost
(R'000)
Total number of days with
medical certification
Total number of employees
using disability
leaveContract (levels 9–12) 1 100 1 3 1 2 1 32Highly skilled production (levels 6-8) 91 100 10 31 9 122 91 32
Highly skilled supervision (Levels 9–12) 76 100 8 25 10 198 76 32
Senior management (levels 13–16) 48 100 1 3 48 246 48 32
Skilled (levels 3–5) 448 100 12 38 37 379 448 32Total 664 100 32 100 21 948 664 32
The following table summarises the utilisation of annual leave. The wage agreement concluded with trade unions in the Public Service Coordinating Bargaining Council (PSCBC) in 2000 requires the management of annual leave to prevent high levels of accrued leave being paid at the time of termination of service.

96
Departm
ent of Mineral Resources
AN
NU
AL R
EPORT
2017/18
Table 3.10.3: Annual leave for the period 1 January 2017 to 31 December 2018
Salary band Total days taken
Average days per employee
Number of employees who took leave
Contract (levels 13–16) 60 9 7Contract (levels 3–5) 21 11 2Contract (levels 6–8) 549 14 39Contract (levels 9–12) 476 16 30Highly skilled production (levels 6–8) 6 968 23 305Highly skilled supervision (levels 9–12) 9 970 21 464Senior management (levels 13–16) 1 469 21 69Skilled (levels 3–5) 4 572 22 210Total 24 085 21 1 126
Table 3.10.4: Capped leave for the period 1 January 2017 to 31 March 2018
Salary bandTotal days of capped leave
taken
Average number of
days taken per employee
Average capped leave per
employee as at end of period
Number of employees who took
capped leave
Total number of capped leave
available at end of period
Number of employees as at end of
periodContract (levels 13–16) 0 0 0 0 0 0Contract (levels 3–5) 0 0 0 0 0 0Contract (levels 6–8) 0 0 0 0 0 0Contract (levels 9–12) 0 0 0 0 0 0Highly skilled production (levels 6–8) 10 3 18 4 988 55Highly skilled supervision (levels 9–12) 16 4 24 4 1 525 63Senior management (levels 13–16) 0 0 22 0 403 18Skilled (levels 3–5) 17 6 23 3 535 23Total 43 4 22 11 3 452 159
The following table summarise payments made to employees as a result of leave that was not taken.
Table 3.10.5: Leave payouts for the period 1 April 2017 to 31 March 2018
Reason Total amount (R'000)
Number of employees
Average payment per employee
(R)Capped leave pay-outs on termination of service for current financial year 1 448 33 43 879Current leave pay-out on termination of service for current financial year 318 16 19 875Total 1 766 49 36 041
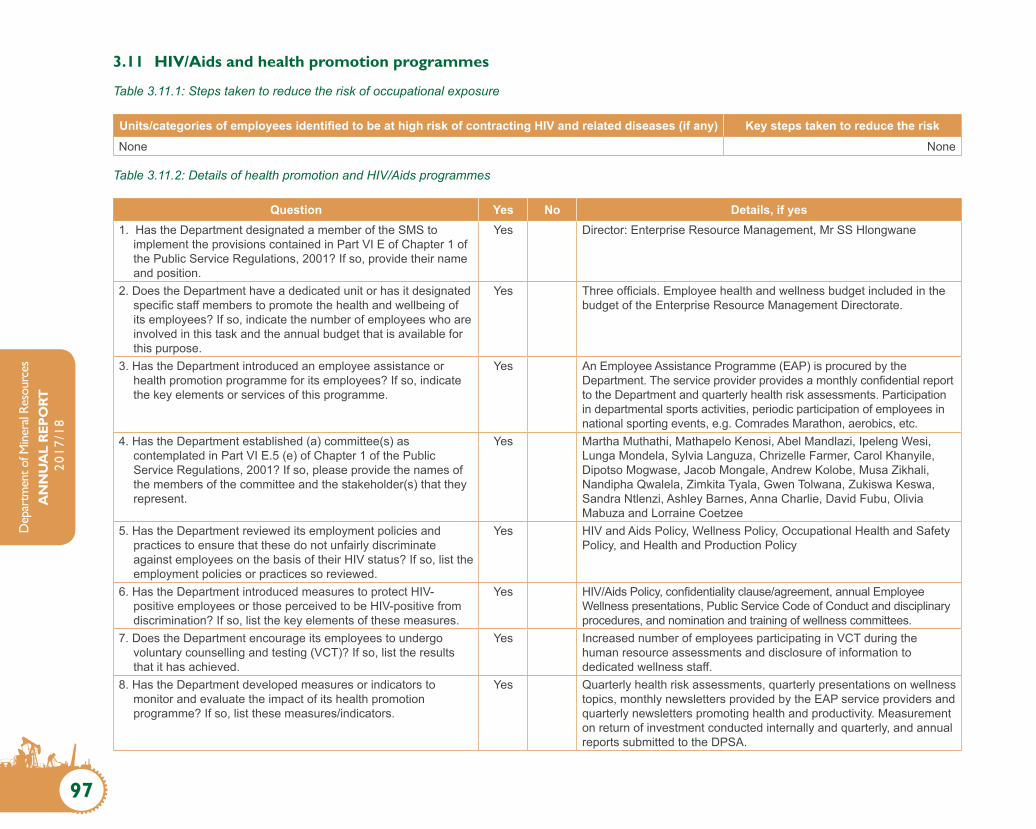
97
Dep
artm
ent o
f Min
eral
Reso
urce
sA
NN
UA
L R
EPO
RT
201
7/18
3.11 HIV/Aids and health promotion programmes
Table 3.11.1: Steps taken to reduce the risk of occupational exposure
Units/categories of employees identified to be at high risk of contracting HIV and related diseases (if any) Key steps taken to reduce the risk None None
Table 3.11.2: Details of health promotion and HIV/Aids programmes
Question Yes No Details, if yes1. Has the Department designated a member of the SMS to
implement the provisions contained in Part VI E of Chapter 1 of the Public Service Regulations, 2001? If so, provide their name and position.
Yes Director: Enterprise Resource Management, Mr SS Hlongwane
2. Does the Department have a dedicated unit or has it designated specific staff members to promote the health and wellbeing of its employees? If so, indicate the number of employees who are involved in this task and the annual budget that is available for this purpose.
Yes Three officials. Employee health and wellness budget included in the budget of the Enterprise Resource Management Directorate.
3. Has the Department introduced an employee assistance or health promotion programme for its employees? If so, indicate the key elements or services of this programme.
Yes An Employee Assistance Programme (EAP) is procured by the Department. The service provider provides a monthly confidential report to the Department and quarterly health risk assessments. Participation in departmental sports activities, periodic participation of employees in national sporting events, e.g. Comrades Marathon, aerobics, etc.
4. Has the Department established (a) committee(s) as contemplated in Part VI E.5 (e) of Chapter 1 of the Public Service Regulations, 2001? If so, please provide the names of the members of the committee and the stakeholder(s) that they represent.
Yes Martha Muthathi, Mathapelo Kenosi, Abel Mandlazi, Ipeleng Wesi, Lunga Mondela, Sylvia Languza, Chrizelle Farmer, Carol Khanyile, Dipotso Mogwase, Jacob Mongale, Andrew Kolobe, Musa Zikhali, Nandipha Qwalela, Zimkita Tyala, Gwen Tolwana, Zukiswa Keswa, Sandra Ntlenzi, Ashley Barnes, Anna Charlie, David Fubu, Olivia Mabuza and Lorraine Coetzee
5. Has the Department reviewed its employment policies and practices to ensure that these do not unfairly discriminate against employees on the basis of their HIV status? If so, list the employment policies or practices so reviewed.
Yes HIV and Aids Policy, Wellness Policy, Occupational Health and Safety Policy, and Health and Production Policy
6. Has the Department introduced measures to protect HIV-positive employees or those perceived to be HIV-positive from discrimination? If so, list the key elements of these measures.
Yes HIV/Aids Policy, confidentiality clause/agreement, annual Employee Wellness presentations, Public Service Code of Conduct and disciplinary procedures, and nomination and training of wellness committees.
7. Does the Department encourage its employees to undergo voluntary counselling and testing (VCT)? If so, list the results that it has achieved.
Yes Increased number of employees participating in VCT during the human resource assessments and disclosure of information to dedicated wellness staff.
8. Has the Department developed measures or indicators to monitor and evaluate the impact of its health promotion programme? If so, list these measures/indicators.
Yes Quarterly health risk assessments, quarterly presentations on wellness topics, monthly newsletters provided by the EAP service providers and quarterly newsletters promoting health and productivity. Measurement on return of investment conducted internally and quarterly, and annual reports submitted to the DPSA.
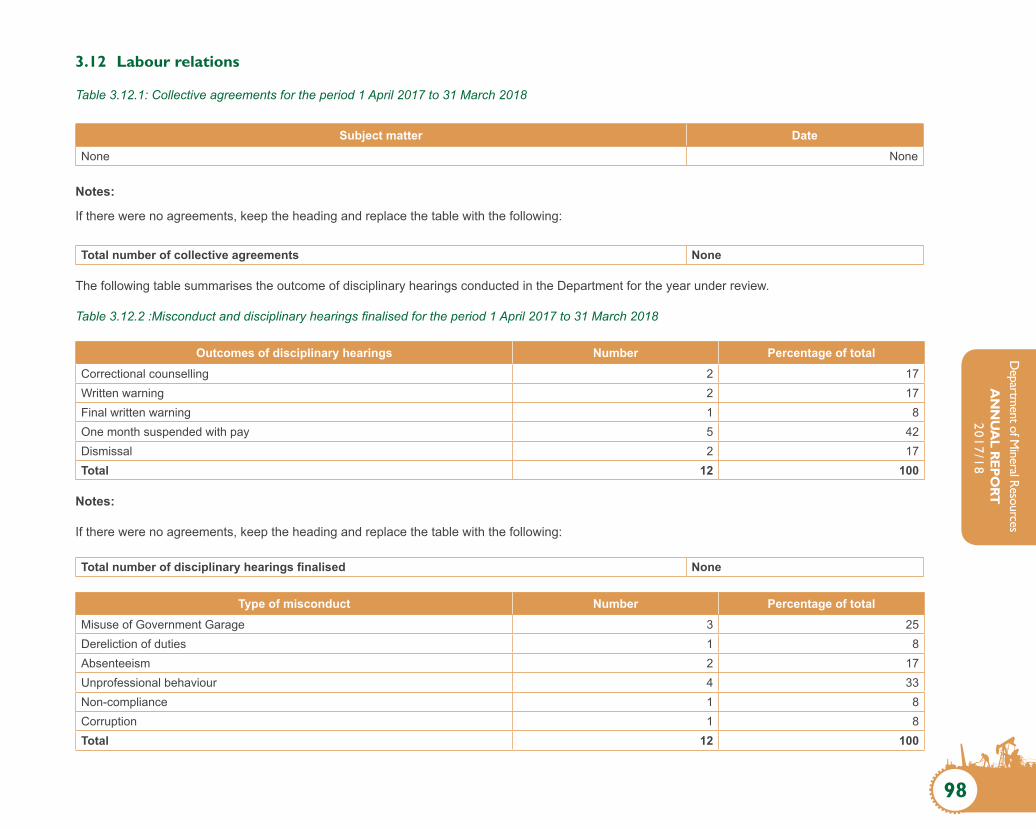
98
Departm
ent of Mineral Resources
AN
NU
AL R
EPORT
2017/18
3.12 Labour relations
Table 3.12.1: Collective agreements for the period 1 April 2017 to 31 March 2018
Subject matter DateNone None
Notes:
If there were no agreements, keep the heading and replace the table with the following:
Total number of collective agreements None
The following table summarises the outcome of disciplinary hearings conducted in the Department for the year under review.
Table 3.12.2 :Misconduct and disciplinary hearings finalised for the period 1 April 2017 to 31 March 2018
Outcomes of disciplinary hearings Number Percentage of totalCorrectional counselling 2 17Written warning 2 17Final written warning 1 8One month suspended with pay 5 42Dismissal 2 17Total 12 100
Notes:
If there were no agreements, keep the heading and replace the table with the following:
Total number of disciplinary hearings finalised None
Type of misconduct Number Percentage of totalMisuse of Government Garage 3 25Dereliction of duties 1 8Absenteeism 2 17Unprofessional behaviour 4 33Non-compliance 1 8Corruption 1 8Total 12 100

99
Dep
artm
ent o
f Min
eral
Reso
urce
sA
NN
UA
L R
EPO
RT
201
7/18
Table 3.12.4: Grievances logged for the period 1 April 2017 o 31 March 2018
Grievances Number Percentage of totalNumber of grievances resolved 4 33Number of grievances not resolved 8 67Total number of grievances lodged 12 100
Table 3.12.5: Disputes logged with councils for the period 1 April 2017 to 31 March 2018
Disputes Number Percentage of totalNumber of disputes upheld 4 67Number of disputes dismissed 2 33Total number of disputes lodged 6 100
Table 3.12.6: Strike actions for the period 1 April 2017 to 31 March 2018
Total number of person working days lost 0Total costs of working days lost 0Amount recovered as a result of no work, no pay (R’000) 0
Table 3.12.7: Precautionary suspensions for the period 1 April 2017 to 31 March 2018
Number of people suspended 3Number of people whose suspension exceeded 30 days 1Average number of days suspended 180Cost of suspension (R’000) 352
3.13. Skills development
This section highlights the efforts of the Department with regard to skills development.
Table 3.13.1: Training needs identified for the period 1 April 2017 to 31 March 2018
Occupational dategories Gender Employment Learnerships
Skills programmes
and other short courses
Other forms of training Total
Legislators, senior officials and managersFemale 26 0 11 0 11
Male 51 0 15 0 15
ProfessionalsFemale 223 0 170 0 170
Male 221 0 171 0 171
Technicians and associate professionalsFemale 143 0 117 0 117
Male 129 0 106 0 106

100
Departm
ent of Mineral Resources
AN
NU
AL R
EPORT
2017/18
Occupational dategories Gender Employment Learnerships
Skills programmes
and other short courses
Other forms of training Total
ClerksFemale 171 0 135 0 135
Male 74 0 53 0 53
Service and sales workersFemale 14 0 18 0 18
Male 35 0 33 0 33
Skilled agriculture and fishery workersFemale 0 0 0 0 0
Male 0 0 0 0 0
Craft and related trades workersFemale 0 0 0 0 0
Male 0 0 0 0 0
Plant and machine operators and assemblersFemale 0 0 0 0 0
Male 0 0 0 0 0
Elementary occupationsFemale 3 0 3 0 3
Male 2 0 2 0 2
Gender subtotalsFemale 580 0 454 0 454
Male 512 0 380 0 380
Total 1 092 0 834 0 834
Table 3.13.2: Training provided for the period 1 April 2017 to 31 March 2018
Occupational categories Gender Employment Learnerships
Skills programmes
and other short courses
Other forms of training Total
Legislators, senior officials and managersFemale 26 0 11 0 11
Male 51 0 10 1 11
ProfessionalsFemale 223 35 113 2 150
Male 221 21 98 5 124
Technicians and associate professionalsFemale 143 0 53 2 55
Male 129 0 39 0 39
ClerksFemale 171 0 85 2 87
Male 74 0 31 0 31
Service and sales workersFemale 14 0 6 0 6
Male 35 0 15 0 15
Skilled agriculture and fishery workersFemale 0 0 0 0 0
Male 0 0 0 0 0

101
Dep
artm
ent o
f Min
eral
Reso
urce
sA
NN
UA
L R
EPO
RT
201
7/18
Occupational categories Gender Employment Learnerships
Skills programmes
and other short courses
Other forms of training Total
Craft and related trades workersFemale 0 0 0 0 0
Male 0 0 0 0 0
Plant and machine operators and assemblersFemale 0 0 0 0 0
Male 2 0 0 0 0
Elementary occupationsFemale 3 0 2 0 2
Male 0 0 1 0 1
Gender subtotalsFemale 580 35 270 6 311
Male 512 21 194 6 221
Total 1 092 56 464 12 532
3.14 Injury on duty
The following tables provide basic information on injury on duty.
Table 3.14.1: Injury on duty for the period 1 April 2017 to 31 March 2018
Nature of injury on duty Number Percentage of total
Required basic medical attention only 251 99.2
Temporary total disablement 2 0.8
Permanent disablement 0 0
Fatal 0 0
Total 253 100
3.15 Utilisation of consultants
The following tables relates information on the utilisation of consultants in the Department. In terms of the Public Service Regulations, “consultant” means a natural or juristic person or a partnership who or which provides, in terms of a specific contract on an ad hoc basis, any of the following professional services to a Department against remuneration received from any source:
(a) The rendering of expert advice(b) The drafting of proposals for the execution of specific tasks(c) The execution of a specific task that is of a technical or intellectual nature, but excludes an employee of a department
Table 3.15.1: Report on consultant appointments using appropriated funds for the period 1 April 2018 to 31 March 2018
Project title Total number of consultants that worked on project
Duration(work days)
Contract value in rand
None – – –

102
Departm
ent of Mineral Resources
AN
NU
AL R
EPORT
2017/18
Table 3.15.2: Analysis of consultant appointments using appropriated funds, in terms of HDSAs for the period 1 April 2017 to 31 March 2018
Project title Percentage ownership by HDSA groups
Percentage management by HDSA groups
Number of consultants from HDSA groups that work on the project
None 0 0 0
Table 3.15.3: Report on consultant appointments using donor funds for the period 1 April 2017 to 31 March 2018
Project title Total number of consultants that worked on project
Duration(work days) Donor and contract value in rand
None 0 0 0
Total number of projects Total individual consultants Total duration(work days) Total contract value in rand
None 0 0 0
Table 3.15.4: Analysis of consultant appointments using donor funds, in terms of HDSAs for the period 1 April 2017 to 31 March 2018
Project title Percentage ownership by HDSA groups
Percentage management by HDSA groups
Number of consultants from HDSA groups that work on the project
None 0 0 0
3.16 Severance packages
Table 3.16.1: Granting of employee-initiated severance packages for the period 1 April 2017 to 31 March 2018
Salary bandNumber of
applications received
Number of applications referred to the Minister of Public Service
and Administration
Number of applications
supported by MPSA
Number of packages approved by the
Department02 Skilled (levels 3–5) 0 0 0 003 Highly skilled production (levels 6–8) 0 0 0 004 Highly skilled supervision (levels 9–12) 0 0 0 005 SMS Band A 0 0 0 006 SMS Band B 0 0 0 007 SMS Band C 0 0 0 008 SMS Band D 0 0 0 011 Contract (levels 3–5) 0 0 0 012 Contract (levels 6–8) 0 0 0 013 Contract (levels 9–12) 0 0 0 014 Contract Band A 0 0 0 015 Contract Band B 0 0 0 017 Contract Band D 0 0 0 0Total 0 0 0 0

103
Dep
artm
ent o
f Min
eral
Reso
urce
sA
NN
UA
L R
EPO
RT
201
7/18
PART EFINANCIAL INFORMATION

104
Departm
ent of Mineral Resources
AN
NU
AL R
EPORT
2017/18
1. REPORT OF THE AUDITOR-GENERALFor the year ended 31 March 2018
8. As disclosed in Note 24 to the Annual Financial Statements, the Department incurred fruitless and wasteful expenditure of R6 135 000 due to lease rentals paid for buildings that they did not occupy.
Other matters
9. I draw attention to the matter below. My opinion is not modified in respect of this matter.
Unaudited supplementary schedules
10. The supplementary information set out on pages 159 to 161 does not form part of the financial statements and is presented as additional information. I have not audited these schedules and, accordingly, I do not express an opinion on them.
Responsibilities of the Accounting Officer for the financial statements
11. The Accounting Officer is responsible for the preparation and fair presentation of the financial statements in accordance with the MCS and the requirements of PFMA, and for such internal control as the Accounting Officer determines is necessary to enable the preparation of financial statements that are free from material misstatement, whether due to fraud or error.
12. In preparing the financial statements, the Accounting Officer is responsible for assessing the Department of Mineral Resources’ ability to continue as a going concern, disclosing, as applicable, matters relating to a going concern and using the going-concern basis of accounting, unless the Accounting Officer either intends to liquidate the Department or to cease operations, or has no realistic alternative but to do so.
Auditor-General’s responsibilities for the audit of the financial statements
13. My objectives are to obtain reasonable assurance about whether the financial statements, as a whole, are free from material misstatement, whether due to fraud or error, and to issue an auditor’s report that includes my opinion. Reasonable assurance is a high level of assurance, but is not a guarantee that an audit conducted in accordance with the ISAs will always detect a material misstatement when it exists. Misstatements can arise from fraud or error and are considered material if, individually or in
REPORT ON THE AUDIT OF THE FINANCIAL STATEMENTS
Opinion
1. I have audited the financial statements of the Department of Mineral Resources set out on pages 109 to 158, which comprise the appropriation statement, the statement of financial position as at 31 March 2018, the statement of financial performance, statement of changes in net assets, and cash flow statement for the year then ended, as well as the notes to the financial statements, including a summary of significant accounting policies.
2. In my opinion, the financial statements present fairly, in all material respects, the financial position of the Department of Mineral Resources as at 31 March 2018, and its financial performance and cash flows for the year then ended in accordance with the Modified Cash Standard (MCS) prescribed by National Treasury and the requirements of the Public Finance Management Act of South Africa, 1999 (Act No. 1 of 1999) (PFMA).
Basis for opinion
3. I conducted my audit in accordance with the International Standards on Auditing (ISA). My responsibilities under those standards are further described in the Auditor-General’s responsibilities for the audit of the financial statements section of this auditor’s report.
4. I am independent of the Department in accordance with the International Ethics Standards Board for Accountants’ Code of Ethics for Professional Accountants (IESBA Code) and the ethical requirements that are relevant to my audit in South Africa. I have fulfilled my other ethical responsibilities in accordance with these requirements and the IESBA Code.
5. I believe that the audit evidence I have obtained is sufficient and appropriate to provide a basis for my opinion.
Emphasis of matters
6. I draw attention to the matters below. My opinion is not modified in respect of these matters.
Irregular expenditure and fruitless and wasteful expenditure
7. As disclosed in Note 23 to the Annual Financial Statements, the Department incurred irregular expenditure of R10 258 000 due to not following procurement processes.
DEPARTMENT OF MINERAL RESOURCES • VOTE 29REPORT OF THE AUDITOR-GENERAL for the year ended 31 March 2018

105
Dep
artm
ent o
f Min
eral
Reso
urce
sA
NN
UA
L R
EPO
RT
201
7/18
aggregate, they could reasonably be expected to influence the economic decisions of users taken on the basis of these financial statements.
14. A further description of my responsibilities for the audit of the financial statements is included in the annexure to this auditor’s report.
REPORT ON THE AUDIT OF THE ANNUAL PERFORMANCE REPORT
Introduction and scope
15. In accordance with the Public Audit Act of South Africa, 2004 (Act No. 25 of 2004) (PAA) and the general notice issued in terms thereof, I have a responsibility to report material findings on the reported performance information against predetermined objectives for selected programmes presented in the annual performance report. I performed procedures to identify findings, but not to gather evidence to express assurance.
16. I evaluated the usefulness and reliability of the reported performance information in accordance with the criteria developed from the performance management and reporting framework, as defined in the general notice, for the following selected programmes presented in the annual performance report of the Department for the year ended 31 March 2018:
Programmes Pages in the annual performance report
Programme 2 : Mine Health and Safety 38–42Programme 3: Mineral Regulation 43–49Programme 4: Mineral Policy and Promotion 50–55
17. I performed procedures to determine whether the reported performance information was properly presented and whether performance was consistent with the approved performance planning documents. I performed further procedures to determine whether the indicators and related targets were measurable and relevant, and assessed the reliability of the reported performance information to determine whether it was valid, accurate and complete.
18. I did not raise any material findings on the usefulness and reliability of the reported performance information for the following programmes
Programme 2: Mine Health and Safety Programme 3: Mineral RegulationsProgramme 4: Mineral Policy and Promotion
Other matters
19. I draw attention to the following matters.
Achievement of planned targets
20. Refer to the annual performance report on pages 27 to 55 for information on the achievement of planned targets for the year and explanations provided for the under- or overachievement of a significant number of targets.
Adjustment of material misstatements
21. I identified material misstatements in the annual performance report submitted for auditing. These material misstatements were on the reported performance information of Mine Health and Safety, Mineral Regulation, and Mineral Policy and Promotion. As management subsequently corrected the misstatements, I did not raise any material findings on the usefulness and reliability of the reported performance information.
REPORT ON THE AUDIT OF COMPLIANCE WITH LEGISLATION
Introduction and scope
22. In accordance with the PAA and the general notice issued in terms thereof, I have a responsibility to report material findings on the compliance of the Department with specific matters in key legislation. I performed procedures to identify findings but not to gather evidence to express assurance.
23. The material findings on compliance with specific matters in key legislations are as follows:
Expenditure management
24. Effective and appropriate steps were not taken to prevent irregular expenditure amounting to R10 258 000, as disclosed in Note 23 to the Annual Financial Statements, as required by section 38(1)(c)(ii) of PFMA and Treasury Regulation 9.1.1.
25. Effective and appropriate steps were not taken to prevent fruitless and wasteful expenditure amounting to R6 135 000, as disclosed in Note 24 to the Annual Financial Statements, as required by section 38(1)(c)(ii) of PFMA and Treasury Regulation 9.1.1.
Procurement and contract management
26. Some of the services of a transaction value above R500 000 were procured without inviting competitive bids as required by Treasury Regulation 16A6.1
DEPARTMENT OF MINERAL RESOURCES • VOTE 29REPORT OF THE AUDITOR-GENERAL for the year ended 31 March 2018

106
Departm
ent of Mineral Resources
AN
NU
AL R
EPORT
2017/18
DEPARTMENT OF MINERAL RESOURCES • VOTE 29REPORT OF THE AUDITOR-GENERAL for the year ended 31 March 2018
Other information
27. The Department of Mineral Resources’ Accounting Officer is responsible for the other information. The other information comprises the information included in the Annual Report. The other information does not include the financial statements, the Auditor’s Report thereon and those selected programmes presented in the Annual Performance Report that have been specifically reported on in the Auditor’s Report.
28. My opinion on the financial statements and findings on the reported performance information and compliance with legislation do not cover the other information and I do not express an audit opinion or any form of assurance conclusion thereon.
29. In connection with my audit, my responsibility is to read the other information and, in doing so, consider whether the other information is materially inconsistent with the financial statements and the selected programmes presented in the Annual Performance Report, or my knowledge obtained in the audit or otherwise appears to be materially misstated. If, based on the work I have performed on the other information obtained prior to the date of this Auditor’s Report, I conclude that there is a material misstatement of this other information, I am required to report that fact. I have nothing to report in this regard.
Internal control deficiencies
30. I considered internal control relevant to my audit of reported performance information and compliance with applicable legislation; however, my objective was not to express any form of assurance on it. The matters reported below are limited to the significant internal control deficiencies that resulted on material non-compliance with legislation included in this report.
Leadership
Oversight responsibility
31. The Accounting Officer and management exercised limited oversight over compliance with legislation. This resulted in material non-compliance with legislation.
Financial and performance management
32. Non-compliance with legislation could have been prevented had compliance been properly reviewed and monitored.
Other reports
33. I draw attention to the following engagements conducted by various parties that had, or could have, an impact on the matters reported in the Department’s financial statements, reported performance information, compliance with applicable legislation and other related matters. These reports did not form part of my opinion on the financial statements or my findings on the reported performance information or compliance with legislation.
34. Internal investigations conducted an internal audit on allegations of misappropriation of assets, financial misconduct and fraud, which covered the period 1 January 2008 to January 2018. Some of the investigations were concluded in the current financial year. From the completed investigations indications of fraud were identified and the Department is in the process of implementing the sanctions from the investigations and disciplinary processes.
35. Another internal investigation conducted an internal audit relating to the issuing of fraudulent mining rights and permits in the Mpumalanga region was concluded in the current year. The investigation covered the period 1 October 2016 to 30 June 2017 and confirmed that two mining permits were fraudulent and were not issued as approved by the Department. A case of fraud was reported to the South African Police Service.
Pretoria31 July 2018
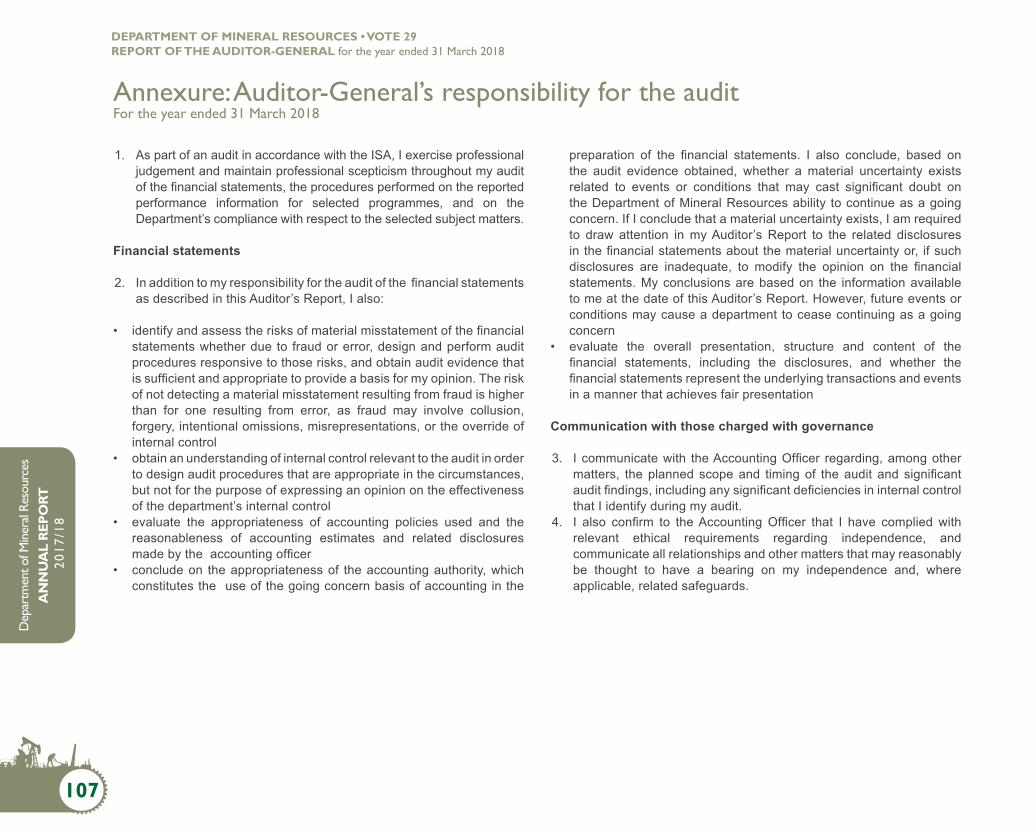
107
Dep
artm
ent o
f Min
eral
Reso
urce
sA
NN
UA
L R
EPO
RT
201
7/18
DEPARTMENT OF MINERAL RESOURCES • VOTE 29REPORT OF THE AUDITOR-GENERAL for the year ended 31 March 2018
Annexure: Auditor-General’s responsibility for the auditFor the year ended 31 March 2018
1. As part of an audit in accordance with the ISA, I exercise professional judgement and maintain professional scepticism throughout my audit of the financial statements, the procedures performed on the reported performance information for selected programmes, and on the Department’s compliance with respect to the selected subject matters.
Financial statements
2. In addition to my responsibility for the audit of the financial statements as described in this Auditor’s Report, I also:
• identify and assess the risks of material misstatement of the financial statements whether due to fraud or error, design and perform audit procedures responsive to those risks, and obtain audit evidence that is sufficient and appropriate to provide a basis for my opinion. The risk of not detecting a material misstatement resulting from fraud is higher than for one resulting from error, as fraud may involve collusion, forgery, intentional omissions, misrepresentations, or the override of internal control
• obtain an understanding of internal control relevant to the audit in order to design audit procedures that are appropriate in the circumstances, but not for the purpose of expressing an opinion on the effectiveness of the department’s internal control
• evaluate the appropriateness of accounting policies used and the reasonableness of accounting estimates and related disclosures made by the accounting officer
• conclude on the appropriateness of the accounting authority, which constitutes the use of the going concern basis of accounting in the
preparation of the financial statements. I also conclude, based on the audit evidence obtained, whether a material uncertainty exists related to events or conditions that may cast significant doubt on the Department of Mineral Resources ability to continue as a going concern. If I conclude that a material uncertainty exists, I am required to draw attention in my Auditor’s Report to the related disclosures in the financial statements about the material uncertainty or, if such disclosures are inadequate, to modify the opinion on the financial statements. My conclusions are based on the information available to me at the date of this Auditor’s Report. However, future events or conditions may cause a department to cease continuing as a going concern
• evaluate the overall presentation, structure and content of the financial statements, including the disclosures, and whether the financial statements represent the underlying transactions and events in a manner that achieves fair presentation
Communication with those charged with governance
3. I communicate with the Accounting Officer regarding, among other matters, the planned scope and timing of the audit and significant audit findings, including any significant deficiencies in internal control that I identify during my audit.
4. I also confirm to the Accounting Officer that I have complied with relevant ethical requirements regarding independence, and communicate all relationships and other matters that may reasonably be thought to have a bearing on my independence and, where applicable, related safeguards.

108
Departm
ent of Mineral Resources
AN
NU
AL R
EPORT
2017/18
DEPARTMENT OF MINERAL RESOURCES • VOTE 29ANNUAL FINANCIAL STATEMENTS for the year ended 31 March 2018
2. ANNUAL FINANCIAL STATEMENTS Contents
Appropriation Statement 109
Statement of Financial Performance 130
Statement of Financial Position 131
Statement of Changes in Net Assets 132
Cash Flow Statement 133
Notes to the Annual Financial Statements (including accounting policies) 134
Annexures 159

109
Dep
artm
ent o
f Min
eral
Reso
urce
sA
NN
UA
L R
EPO
RT
201
7/18
DEPARTMENT OF MINERAL RESOURCES • VOTE 29APPROPRIATION STATEMENT for the year ended 31 March 2018
Appropriation per programme
Voted funds and direct charges
2017/18 2016/17
Adjusted appropriation Virement Final
appropriation Actual
expenditure Variance
Expenditure as a
percentage of final
appropriation
Final appropriation
Actual expenditure
R’000 R’000 R’000 R’000 R’000 R’000 R’000 R’000Programme1. Administration 339 931 22 975 362 906 362 470 436 99.9% 362 796 361 0502. Mine Health and Safety 194 146 9 541 203 687 203 657 30 100.0% 190 440 189 5573. Mineral Regulation 379 260 -8 868 370 392 370 104 288 99.9% 260 177 258 758
4. Mineral Policy and Promotion 866 112 -23 648 842 464 840 454 2 010 99.8% 855 664 851 736
Total 1 779 449 – 1 779 449 1 776 685 2 764 99.8% 1 669 077 1 661 101
2017/18 2016/17
Reconciliation with Statement of Financial Performance
Departmental receipts 38 993 38 072Aid assistance – 13 265
Actual amounts per Statement of Financial Performance (total revenue) 1 818 442 1 720 414
AddAid assistance – 11 493
Actual amounts per Statement of Financial Performance expenditure 1 776 685 1 672 594

110
Departm
ent of Mineral Resources
AN
NU
AL R
EPORT
2017/18
DEPARTMENT OF MINERAL RESOURCES • VOTE 29APPROPRIATION STATEMENT for the year ended 31 March 2018
Appropriation per economic classification
Economic classification
2017/18 2016/17
Adjusted appropriation
Shifting of funds Virement Final
appropriationActual
expenditure Variance
Expenditure as a
percentage of final
appropriation
Final appropriation
Actual expenditure
R’000 R’000 R’000 R’000 R’000 R’000 Percentage R’000 R’000Current payments 871 021 -703 -400 869 918 867 276 2 642 99.7% 865 190 858 580Compensation of employees 590 760 -95 – 590 665 588 355 2 310 99.6% 564 368 558 799Salaries and wages 516 918 -4 228 1 475 514 165 512 575 1 590 99.7% 491 148 487 366Social contributions 73 842 4 133 -1 475 76 500 75 780 720 99.1% 73 220 71 433Goods and services 280 261 -608 -400 279 253 278 921 332 99.9% 300 822 299 781Administrative fees 5 346 -203 -2 659 2 484 2 484 – 100.0% 3 528 3 248Advertising 2 621 3 259 -67 5 813 5 813 – 100.0% 7 455 5 453Minor assets 5 157 -3 465 -183 1 509 1 482 27 98.2% 2 115 968Audit costs: External 4 987 2 026 – 7 013 7 013 – 100.0% 5 825 6 247Bursaries: Employees 1 553 -305 – 1 248 1 246 2 99.8% 1 266 1 234Catering: Departmental activities
3 765 -934 -1 349 1 482 1 432 50 96.6% 1 794 951
Communication (goods and services)
8 964 1 557 2 198 12 719 12 706 13 99.9% 11 903 17 281
Computer services 23 023 -480 1 307 23 850 23 850 – 100.0% 27 282 26 872Consultants: Business and advisory services
9 401 -5 267 -2 000 2 134 2 134 – 100.0% 7 349 8 237
Legal services 2 955 10 343 263 13 561 13 561 – 100.0% 10 237 11 213Contractors 21 102 -6 589 -9 951 4 562 4 481 81 98.2% 4 055 1 057Agency and support/ outsourced services
3 – – 3 – 3 – 5 –
Entertainment 159 -149 – 10 5 5 50.0% 4 –Fleet services (including government motor transport)
7 042 1 921 1 694 10 657 10 657 – 100.0% 9 586 10 518
Inventory: Clothing material and accessories
– – – – – – – 1 079 53
Inventory: Food and food supplies
– – – – – – – 67 19
Inventory: Materials and supplies
– – – – – – – 1 590 218
Inventory: Medical supplies – – – – – – – 16 2Consumable supplies 4 729 -1 791 -633 2 305 2 251 54 97.7% 3 128 2 063Consumable: Stationery, printing and office supplies
11 208 -4 785 -2 536 3 887 3 887 – 100.0% 8 358 4 673
Operating leases 52 647 12 310 23 681 88 638 88 614 24 100.0% 72 627 89 325

111
Dep
artm
ent o
f Min
eral
Reso
urce
sA
NN
UA
L R
EPO
RT
201
7/18
DEPARTMENT OF MINERAL RESOURCES • VOTE 29APPROPRIATION STATEMENT for the year ended 31 March 2018
Economic classification
2017/18 2016/17
Adjusted appropriation
Shifting of funds Virement Final
appropriationActual
expenditure Variance
Expenditure as a
percentage of final
appropriation
Final appropriation
Actual expenditure
R’000 R’000 R’000 R’000 R’000 R’000 Percentage R’000 R’000Property payments 7 132 80 -650 6 562 6 562 – 100.0% 5 878 6 259Travel and subsistence 67 849 2 994 -1 702 69 141 69 141 – 100.0% 72 740 68 383Training and development 10 148 -2 864 -2 535 4 749 4 749 – 100.0% 9 010 4 892Operating payments 14 246 -3 504 -1 018 9 724 9 654 70 99.3% 23 667 23 740Venues and facilities 10 410 -2 060 -2 266 6 084 6 081 3 100.0% 10 012 6 643Rental and hiring 5 814 -2 702 -1 994 1 118 1 118 – 100.0% 246 232Transfers and subsidies 896 767 95 – 896 862 896 740 122 100.0% 791 581 791 316Departmental agencies and accounts
440 855 – – 440 855 440 733 122 100.0% 433 519 433 519
Departmental agencies (non-business entities)
440 855 – – 440 855 440 733 122 100.0% 433 519 433 519
Public corporations and private enterprises
454 394 – – 454 394 454 394 – 100.0% 356 616 356 616
Public corporations 367 256 – – 367 256 367 256 – 100.0% 356 616 356 616Subsidies on products and production (pc)
367 256 – – 367 256 367 256 – 100.0% 356 616 356 616
Private enterprises 87 138 – – 87 138 87 138 – 100.0% – –Subsidies on products and production (pe)
87 138 – – 87 138 87 138 – 100.0% – –
Households 1 518 95 – 1 613 1 613 – 100.0% 1 446 1 181Social benefits 1 224 349 – 1 573 1 573 – 100.0% 1 166 1 059Other transfers to households 294 -254 – 40 40 – 100.0% 280 122Payments for capital assets 11 661 608 400 12 669 12 669 – 100.0% 11 021 9 919Buildings and other fixed structures
1 830 -869 -698 263 263 – 100.0% 153 153
Buildings 1 830 -869 -698 263 263 – 100.0% – –Other fixed structures – – – – – – – 153 153Machinery and equipment 9 831 685 1 098 11 614 11 614 – 100.0% 10 868 9 766Transport equipment – 1 595 – 1 595 1 595 – 100.0% 3 272 3 262Other machinery and equipment
9 831 -910 1 098 10 019 10 019 – 100.0% 7 596 6 504
Software and other intangible assets
– 792 – 792 792 – 100.0% – –
Payment for financial assets – – – – – – – 1 285 1 286Total 1 779 449 – – 1 779 449 1 776 685 2 764 99.8% 1 669 077 1 661 101

112
Departm
ent of Mineral Resources
AN
NU
AL R
EPORT
2017/18
DEPARTMENT OF MINERAL RESOURCES • VOTE 29APPROPRIATION STATEMENT for the year ended 31 March 2018
Programme 1: Administration
2017/18 2016/17
Adjusted appropriation
Shifting of funds Virement Final
appropriationActual
expenditure Variance
Expenditure as a percentage
of final appropriation
Final appropriation
Actual expenditure
R’000 R’000 R’000 R’000 R’000 R’000 Percentage R’000 R’000Sub-programme1. Ministry 28 050 2 205 4 182 34 437 34 437 – 100.0% 33 822 35 1232. Corporate Services 145 075 13 541 23 383 181 999 181 823 176 99.9% 186 177 187 8413. Department Management 21 776 -1 786 -4 449 15 541 15 541 – 100.0% 16 707 12 4574. Financial Administration 97 623 -1 050 1 328 97 901 97 641 260 99.7% 93 704 93 5365. Internal Audit 14 524 -2 941 -1 469 10 114 10 114 – 100.0% 10 901 10 6096. Office Accommodation 32 883 -9 969 – 22 914 22 914 – 100.0% 21 485 21 484
Total 339 931 – 22 975 362 906 362 470 436 99.9% 362 796 361 050
Economic classification
2017/18 2016/17
Adjusted appropriation
Shifting of funds Virement Final
appropriationActual
expenditure Variance
Expenditure as a
percentage of final
appropriation
Final appropriation
Actual expenditure
R’000 R’000 R’000 R’000 R’000 R’000 Percentage R’000 R’000Current payments 325 794 -703 25 016 350 107 349 800 307 99.9% 350 339 349 626Compensation of employees 179 726 -95 -9 567 170 064 170 045 19 100.0% 166 377 162 257Salaries and wages 157 200 -1 009 -8 092 148 099 148 063 36 100.0% 142 983 141 159Social contributions 22 526 914 -1 475 21 965 21 982 -17 100.1% 23 394 21 098Goods and services 146 068 -608 34 583 180 043 179 755 288 99.8% 183 962 187 369Administrative fees 734 369 – 1 103 1 196 -93 108.4% 1 258 1 219Advertising 771 -147 – 624 588 36 94.2% 2 148 2 701Minor assets 4 316 -2 855 – 1 461 1 439 22 98.5% 1 625 939Audit costs: External 4 987 2 026 – 7 013 7 013 – 100.0% 5 825 6 247Bursaries: Employees 1 553 -305 – 1 248 1 246 2 99.8% 1 200 1 234Catering: Departmental activities
876 -129 – 747 708 39 94.8% 949 642
Communication (goods and services)
3 661 3 167 1 828 8 656 8 606 50 99.4% 5 520 8 457
Computer services 17 768 416 4 907 23 091 23 091 – 100.0% 24 203 24 342Consultants: Business and advisory services
3 997 -2 382 – 1 615 1 596 19 98.8% 3 266 2 191

113
Dep
artm
ent o
f Min
eral
Reso
urce
sA
NN
UA
L R
EPO
RT
201
7/18
DEPARTMENT OF MINERAL RESOURCES • VOTE 29APPROPRIATION STATEMENT for the year ended 31 March 2018
Economic classification
2017/18 2016/17
Adjusted appropriation
Shifting of funds Virement Final
appropriationActual
expenditure Variance
Expenditure as a
percentage of final
appropriation
Final appropriation
Actual expenditure
R’000 R’000 R’000 R’000 R’000 R’000 Percentage R’000 R’000Legal services 564 -81 208 691 691 – 100.0% 5 380 5 207Contractors 3 007 -2 625 – 382 367 15 96.1% 1 908 837Agency and support/ outsourced services
3 – – 3 – 3 – 5 –
Entertainment 150 -145 – 5 5 – 100.0% – –Fleet services (including government motor transport)
3 792 594 1 759 6 145 6 168 -23 100.4% 6 598 6 397
Inventory: Clothing material and accessories
– – – – – – – 1 049 53
Inventory: Food and food supplies
– – – – – – – 67 19
Inventory: Materials and supplies
– – – – – – – 1 556 213
Inventory: Medical supplies – – – – – – – 15 2Consumable supplies 2 651 -1 487 – 1 164 1 150 14 98.8% 1 621 935Consumable: Stationery, printing and office supplies
4 448 -2 446 – 2 002 2 003 -1 100.0% 3 914 2 084
Operating leases 51 997 12 472 23 681 88 150 88 150 – 100.0% 71 809 88 798Property payments 6 173 389 – 6 562 6 562 – 100.0% 5 859 6 258Travel and subsistence 19 886 -1 434 2 200 20 652 20 467 185 99.1% 21 454 19 968Training and development 5 875 -1 809 – 4 066 4 057 9 99.8% 6 743 3 441Operating payments 5 151 -3 282 – 1 869 1 844 25 98.7% 5 058 2 397Venues and facilities 3 704 -1 112 – 2 592 2 595 -3 100.1% 4 886 2 585Rental and hiring 4 198 – 202 213 -11 105.4% 46 203Transfers and subsidies 3 358 95 – 3 453 3 331 122 96.5% 3 162 2 895Departmental agencies and accounts
1 840 – – 1 840 1 718 122 93.4% 1 716 1 716
Departmental agencies (non-business entities)
1 840 – – 1 840 1 718 122 93.4% 1 716 1 716
Households 1 518 95 – 1 613 1 613 – 100.0% 1 446 1 179Social benefits 1 224 349 – 1 573 1 573 – 100.0% 1 166 1 059

114
Departm
ent of Mineral Resources
AN
NU
AL R
EPORT
2017/18
DEPARTMENT OF MINERAL RESOURCES • VOTE 29APPROPRIATION STATEMENT for the year ended 31 March 2018
Economic classification
2017/18 2016/17
Adjusted appropriation
Shifting of funds Virement Final
appropriationActual
expenditure Variance
Expenditure as a
percentage of final
appropriation
Final appropriation
Actual expenditure
R’000 R’000 R’000 R’000 R’000 R’000 Percentage R’000 R’000Other transfers to households 294 -254 – 40 40 – 100.0% 280 120Payments for capital assets 10 779 608 -2 041 9 346 9 339 7 99.9% 9 185 8 418Buildings and other fixed structures
1 830 -869 -698 263 263 – 100.0% 153 153
Buildings 1 830 -869 -698 263 263 – 100.0% – –Other fixed structures – – – – – – – 153 153Machinery and equipment 8 949 685 -1 343 8 291 8 284 7 99.9% 9 032 8 265Transport equipment – 1 595 – 1 595 1 595 – 100.0% 3 272 3 262Other machinery and equipment
8 949 -910 -1 343 6 696 6 689 7 99.9% 5 760 5 003
Software and other intangible assets
– 792 – 792 792 – 100.0% – –
Payment for financial assets – – – – – – – 110 111Total 339 931 – 22 975 362 906 362 470 436 99.9% 362 796 361 050
Sub-programme 1.1: Ministry
Economic classification
2017/18 2016/17
Adjusted appropriation
Shifting of funds Virement Final
appropriationActual
expenditure Variance
Expenditure as a percentage
of final appropriation
Final appropriation
Actual expenditure
R’000 R’000 R’000 R’000 R’000 R’000 Percentage R’000 R’000Current payments 27 847 2 223 4 182 34 252 34 252 – 100.0% 33 614 35 082Compensation of employees 17 609 1 594 – 19 203 19 222 -19 100.1% 17 762 17 642Goods and services 10 238 629 4 182 15 049 15 030 19 99.9% 15 852 17 440Payments for capital assets 203 -18 – 185 185 – 100.0% 193 26
Machinery and equipment 203 -18 – 185 185 – 100.0% 193 26Payment for financial assets – – – – – – – 15 15
Total 28 050 2 205 4 182 34 437 34 437 – 100.0% 33 822 35 123

115
Dep
artm
ent o
f Min
eral
Reso
urce
sA
NN
UA
L R
EPO
RT
201
7/18
DEPARTMENT OF MINERAL RESOURCES • VOTE 29APPROPRIATION STATEMENT for the year ended 31 March 2018
Sub-programme 1.2: Corporate Services
Economic classification
2017/18 2016/17
Adjusted appropriation
Shifting of funds Virement Final
appropriationActual
expenditure Variance
Expenditure as a percentage
of final appropriation
Final appropriation
Actual Expenditure
R’000 R’000 R’000 R’000 R’000 R’000 Percentage R’000 R’000Current payments 137 552 13 592 23 681 174 825 174 771 54 100.0% 178 913 180 840Compensation of employees 79 489 3 292 – 82 781 82 782 -1 100.0% 79 220 79 528
Goods and services 58 063 10 300 23 681 92 044 91 989 55 99.9% 99 693 101 312
Transfers and subsidies 3 358 95 – 3 453 3 331 122 96.5% 3 162 2 895Departmental agencies and accounts
1 840 – – 1 840 1 718 122 93.4% 1 716 1 716
Households 1 518 95 – 1 613 1 613 – 100.0% 1 446 1 179
Payments for capital assets 4 165 -146 -298 3 721 3 721 – 100.0% 4 075 4 078
Buildings and other fixed structures
1 830 -869 -698 263 263 – 100.0% 153 153
Machinery and equipment 2 335 679 400 3 414 3 414 – 100.0% 3 922 3 925
Software and other intangible assets
– 44 – 44 44 – 100.0% – –
Payment for financial assets – – – – – – – 27 28
Total 145 075 13 541 23 383 181 999 181 823 176 99.9% 186 177 187 841
Sub-programme 1.3: Department Management
Economic classification
2017/18 2016/17
Adjusted appropriation
Shifting of funds Virement Final
appropriationActual
expenditure Variance
Expenditure as a percentage
of final appropriation
Final appropriation
Actual expenditure
R’000 R’000 R’000 R’000 R’000 R’000 Percentage R’000 R’000Current payments 21 776 -1 846 -4 449 15 481 15 481 – 100.0% 16 638 12 449Compensation of employees 14 846 -95 -4 449 10 302 10 280 22 99.8% 12 152 7 986
Goods and services 6 930 -1 751 – 5 179 5 201 -22 100.4% 4 486 4 463
Payments for capital assets – 60 – 60 60 – 100.0% 61 –
Machinery and equipment – 60 – 60 60 – 100.0% 61 –
Payment for financial assets – – – – – – – 8 8
Total 21 776 -1 786 -4 449 15 541 15 541 – 100.0% 16 707 12 457

116
Departm
ent of Mineral Resources
AN
NU
AL R
EPORT
2017/18
DEPARTMENT OF MINERAL RESOURCES • VOTE 29APPROPRIATION STATEMENT for the year ended 31 March 2018
Sub-programme 1.4: Financial Administration
Economic classification
2017/18 2016/17
Adjusted appropriation
Shifting of funds Virement Final
appropriationActual
expenditure VarianceExpenditure as a percentage
of final appropriation
Final appropriation
Actual expenditure
R’000 R’000 R’000 R’000 R’000 R’000 Percentage R’000 R’000Current payments 91 212 -1 726 3 071 92 557 92 304 253 99.7% 89 150 89 353Compensation of employees 56 459 -3 292 -3 649 49 518 49 502 16 100.0% 48 857 48 832Goods and services 34 753 1 566 6 720 43 039 42 802 237 99.4% 40 293 40 521Payments for capital assets 6 411 676 -1 743 5 344 5 337 7 99.9% 4 496 4 125
Machinery and equipment 6 411 -72 -1 743 4 596 4 589 7 99.8% 4 496 4 125Software and other intangible assets
– 748 – 748 748 – 100.0% – –
Payment for financial assets – – – – – – – 58 58
Total 97 623 -1 050 1 328 97 901 97 641 260 99.7% 93 704 93 536
Sub-programme 1.5: Internal Audit
Economic classification
2017/18 2016/17
Adjusted appropriation
Shifting of funds Virement Final
appropriationActual
expenditure VarianceExpenditure as a percentage
of final appropriation
Final appropriation
Actual expenditure
R’000 R’000 R’000 R’000 R’000 R’000 Percentage R’000 R’000Current payments 14 524 -2 977 -1 469 10 078 10 078 – 100.0% 10 539 10 418Compensation of employees 11 323 -1 594 -1 469 8 260 8 259 1 100.0% 8 386 8 269Goods and services 3 201 -1 383 – 1 818 1 819 -1 100.1% 2 153 2 149Payments for capital assets – 36 – 36 36 – 100.0% 360 189
Machinery and equipment – 36 – 36 36 – 100.0% 360 189Payment for financial assets – – – – – – – 2 2Total 14 524 -2 941 -1 469 10 114 10 114 – 100.0% 10 901 10 609
Sub-programme 1.6: Office Accommodation
Economic classification
2017/18 2016/17
Adjusted appropriation
Shifting of funds Virement Final
appropriationActual
expenditure VarianceExpenditure as a percentage
of final appropriation
Final appropriation
Actual expenditure
R’000 R’000 R’000 R’000 R’000 R’000 Percentage R’000 R’000Current payments 32 883 -9 969 – 22 914 22 914 – 100.0% 21 485 21 484Goods and services 32 883 -9 969 – 22 914 22 914 – 100.0% 21 485 21 484Total 32 883 -9 969 – 22 914 22 914 – 100.0% 21 485 21 484

117
Dep
artm
ent o
f Min
eral
Reso
urce
sA
NN
UA
L R
EPO
RT
201
7/18
DEPARTMENT OF MINERAL RESOURCES • VOTE 29APPROPRIATION STATEMENT for the year ended 31 March 2018
Programme 2: Mine Health and Safety
2017/18 2016/17
Adjusted appropriation
Shifting of funds Virement Final
appropriationActual
expenditure Variance
Expenditure as a percentage
of final appropriation
Final appropriation
Actual expenditure
R’000 R’000 R’000 R’000 R’000 R’000 Percentage R’000 R’000Sub-programme1. Governance Policy and
Oversight47 087 -4 606 2 546 45 027 45 013 14 100.0% 47 395 46 430
2. Mine Health and Safety Regions
140 897 4 606 6 995 152 498 152 482 16 100.0% 143 045 143 127
3. Mine Health and Safety Council
6 162 – – 6 162 6 162 – 100.0% – –
Total 194 146 – 9 541 203 687 203 657 30 100.0% 190 440 189 557
Economic classification
2017/18 2016/17
Adjusted appropriation
Shifting of funds Virement Final
appropriationActual
expenditure Variance
Expenditure as a
percentage of final
appropriation
Final appropriation
Actual expenditure
R’000 R’000 R’000 R’000 R’000 R’000 Percentage R’000 R’000Current payments 187 295 – 8 843 196 138 196 108 30 100.0% 189 239 188 377Compensation of employees 155 720 – 10 159 165 879 165 879 – 100.0% 158 934 158 029
Salaries and wages 136 203 36 10 159 146 398 146 398 – 100.0% 141 993 139 666
Social contributions 19 517 -36 – 19 481 19 481 – 100.0% 16 941 18 363
Goods and services 31 575 – -1 316 30 259 30 229 30 99.9% 30 305 30 348
Administrative fees 305 -40 – 265 220 45 83.0% 384 207
Advertising 174 -174 – – – – – 102 69
Minor assets 160 -136 – 24 22 2 91.7% 137 13
Bursaries: Employees – – – – – – – 6 –
Catering: Departmental activities
364 -124 – 240 238 2 99.2% 69 42
Communication (goods and services)
1 635 -1 386 246 495 532 -37 107.5% 1 855 2 874
Computer services 750 -750 – – – – – 3 –

118
Departm
ent of Mineral Resources
AN
NU
AL R
EPORT
2017/18
DEPARTMENT OF MINERAL RESOURCES • VOTE 29APPROPRIATION STATEMENT for the year ended 31 March 2018
Economic classification
2017/18 2016/17
Adjusted appropriation
Shifting of funds Virement Final
appropriationActual
expenditure Variance
Expenditure as a
percentage of final
appropriation
Final appropriation
Actual expenditure
R’000 R’000 R’000 R’000 R’000 R’000 Percentage R’000 R’000Consultants: Business and advisory services
1 754 230 -1 500 484 469 15 96.9% 1 367 1 375
Legal services 680 69 – 749 749 – 100.0% 506 506Contractors 274 -79 – 195 174 21 89.2% 246 207Entertainment 9 -4 – 5 – 5 – 4 –Fleet services (including government motor transport)
317 32 -8 341 318 23 93.3% 216 269
Inventory: Materials and supplies
– – – – – – – 7 –
Inventory: Medical supplies – – – – – – – 1 –Consumable supplies 723 -255 – 468 454 14 97.0% 504 434Consumable: Stationery, printing and office supplies
1 939 -1 290 -5 644 650 -6 100.9% 1 478 879
Operating leases 61 – – 61 44 17 72.1% 358 37Property payments 121 -121 – – – – – 5 –Travel and subsistence 19 536 6 168 – 25 704 25 813 -109 100.4% 22 129 22 700
Training and development 742 -513 -49 180 176 4 97.8% 363 230
Operating payments 493 -216 – 277 254 23 91.7% 387 337Venues and facilities 1 528 -1 411 – 117 116 1 99.1% 178 169Rental and hiring 10 – – 10 – 10 – – –Transfers and subsidies 6 162 – – 6 162 6 162 – 100.0% – –Departmental agencies and accounts
6 162 – – 6 162 6 162 – 100.0% – –
Departmental agencies (non-business entities)
6 162 – – 6 162 6 162 – 100.0% – –
Payments for capital assets 689 – 698 1 387 1 387 – 100.0% 301 280Machinery and equipment 689 – 698 1 387 1 387 – 100.0% 301 280Other machinery and equipment
689 – 698 1 387 1 387 – 100.0% 301 280
Total 194 146 – 9 541 203 687 203 657 30 100.0% 190 440 189 557

119
Dep
artm
ent o
f Min
eral
Reso
urce
sA
NN
UA
L R
EPO
RT
201
7/18
DEPARTMENT OF MINERAL RESOURCES • VOTE 29APPROPRIATION STATEMENT for the year ended 31 March 2018
Sub-programme 2.1: Governance Policy and Oversight
Economic classification
2017/18 2016/17
Adjusted appropriation
Shifting of funds Virement Final
appropriationActual
expenditure VarianceExpenditure as a percentage
of final appropriation
Final appropriation
Actual expenditure
R’000 R’000 R’000 R’000 R’000 R’000 Percentage R’000 R’000Current payments 46 398 -4 606 2 251 44 043 44 029 14 100.0% 46 718 45 794Compensation of employees 33 717 – 4 025 37 742 37 742 – 100.0% 39 234 38 330Goods and services 12 681 -4 606 -1 774 6 301 6 287 14 99.8% 7 484 7 464
Payments for capital assets 689 – 295 984 984 – 100.0% 72 31Machinery and equipment 689 – 295 984 984 – 100.0% 72 31Payment for financial assets – – – – – – – 605 605
Total 47 087 -4 606 2 546 45 027 45 013 14 100.0% 47 395 46 430
Sub-programme 2.2: Mine Health and Safety Regions
Economic classification
2017/18 2016/17
Adjusted appropriation
Shifting of funds Virement Final
appropriationActual
expenditure VarianceExpenditure as a percentage
of final appropriation
Final appropriation
Actual expenditure
R’000 R’000 R’000 R’000 R’000 R’000 Percentage R’000 R’000Current payments 140 897 4 606 6 592 152 095 152 079 16 100.0% 142 521 142 583Compensation of employees 122 003 – 6 134 128 137 128 137 – 100.0% 119 700 119 699Goods and services 18 894 4 606 458 23 958 23 942 16 99.9% 22 821 22 884
Payments for capital assets – – 403 403 403 – 100.0% 229 249Machinery and equipment – – 403 403 403 – 100.0% 229 249Payment for financial assets – – – – – – – 295 295
Total 140 897 4 606 6 995 152 498 152 482 16 100.0% 143 045 143 127
Sub-programme 2.3: Mine Health and Safety Council
Economic classification
2017/18 2016/17
Adjusted appropriation
Shifting of funds Virement Final
appropriationActual
expenditure VarianceExpenditure as a percentage
of final appropriation
Final appropriation
Actual expenditure
R’000 R’000 R’000 R’000 R’000 R’000 Percentage R’000 R’000Transfers and subsidies 6 162 – – 6 162 6 162 – 100.0% – –Departmental agencies and accounts
6 162 – – 6 162 6 162 – 100.0% – –
Total 6 162 – – 6 162 6 162 – 100.0% – –

120
Departm
ent of Mineral Resources
AN
NU
AL R
EPORT
2017/18
DEPARTMENT OF MINERAL RESOURCES • VOTE 29APPROPRIATION STATEMENT for the year ended 31 March 2018
Programme 3: Mineral Regulation
2017/18 2016/17
Adjusted appropriation
Shifting of funds Virement Final
appropriationActual
expenditure Variance
Expenditure as a percentage
of final appropriation
Final appropriation
Actual expenditure
R’000 R’000 R’000 R’000 R’000 R’000 Percentage R’000 R’000Sub-programme1. Mineral Regulation and
Administration199 198 3 456 -384 202 270 202 178 92 100.0% 189 809 189 778
2. Management Mineral Regulation
27 059 -3 456 -8 484 15 119 14 923 196 98.7% 17 163 15 775
3. South African Diamond and Precious Metals Regulator
65 865 – – 65 865 65 865 – 100.0% 53 205 53 205
4. Petroleum Agency South Africa
87 138 – – 87 138 87 138 – 100.0% – –
Total 379 260 – -8 868 370 392 370 104 288 99.9% 260 177 258 758
Economic classification
2017/18 2016/17
Adjusted appropriation
Shifting of funds Virement Final
appropriationActual
expenditure Variance
Expenditure as a percentage
of final appropriation
Final appropriation
Actual expenditure
R’000 R’000 R’000 R’000 R’000 R’000 Percentage R’000 R’000Current payments 226 218 – -9 954 216 264 215 969 295 99.9% 206 173 204 781Compensation of employees 186 505 – -592 185 913 185 631 282 99.8% 173 195 173 194Salaries and wages 163 130 -2 994 -592 159 544 159 497 47 100.0% 149 018 149 155Social contributions 23 375 2 994 – 26 369 26 134 235 99.1% 24 177 24 039Goods and services 39 713 – -9 362 30 351 30 338 13 100.0% 32 978 31 587Administrative fees 656 -287 -42 327 290 37 88.7% 483 300Advertising 162 -65 – 97 133 -36 137.1% 165 136Minor assets 454 -435 – 19 17 2 89.5% 245 15Bursaries: Employees – – – – – – – 60 –Catering: Departmental activities
530 -365 – 165 165 – 100.0% 423 81
Communication (goods and services)
3 150 56 268 3 474 3 474 – 100.0% 3 291 3 760
Computer services 4 450 -91 -3 600 759 759 – 100.0% 1 002 469Legal services 1 611 2 959 55 4 625 4 625 – 100.0% 4 301 4 916Contractors 45 -4 – 41 1 40 2.4% 17 6

121
Dep
artm
ent o
f Min
eral
Reso
urce
sA
NN
UA
L R
EPO
RT
201
7/18
DEPARTMENT OF MINERAL RESOURCES • VOTE 29APPROPRIATION STATEMENT for the year ended 31 March 2018
Economic classification
2017/18 2016/17
Adjusted appropriation
Shifting of funds Virement Final
appropriationActual
expenditure Variance
Expenditure as a percentage
of final appropriation
Final appropriation
Actual expenditure
R’000 R’000 R’000 R’000 R’000 R’000 Percentage R’000 R’000Fleet services (including government motor transport)
2 706 1 122 15 3 843 3 843 – 100.0% 2 384 3 448
Inventory: Materials and supplies
– – – – – – – 27 5
Consumable supplies 1 109 -44 -449 616 602 14 97.7% 806 593Consumable: Stationery, printing and office supplies
2 980 -179 -1 908 893 886 7 99.2% 2 004 1 278
Operating leases 22 -15 – 7 – 7 – 14 –Property payments 588 -188 -400 – – – – 14 1Travel and subsistence 16 233 -1 684 -300 14 249 14 330 -81 100.6% 14 999 13 807Training and development 2 308 -118 -2 001 189 188 1 99.5% 1 177 969Operating payments 959 -190 – 769 747 22 97.1% 992 926Venues and facilities 1 750 -472 -1 000 278 278 – 100.0% 574 877Transfers and subsidies 153 003 – – 153 003 153 003 – 100.0% 53 205 53 207Departmental agencies and accounts
65 865 – – 65 865 65 865 – 100.0% 53 205 53 205
Departmental agencies (non-business entities)
65 865 – – 65 865 65 865 – 100.0% 53 205 53 205
Public corporations and private enterprises
87 138 – – 87 138 87 138 – 100.0% – –
Private enterprises 87 138 – – 87 138 87 138 – 100.0% – –Subsidies on products and production (pe)
87 138 – – 87 138 87 138 – 100.0% – –
Households – – – – – – – – 2Other transfers to households – – – – – – – – 2Payments for capital assets 39 – 1 086 1 125 1 132 -7 100.6% 598 569Machinery and equipment 39 – 1 086 1 125 1 132 -7 100.6% 598 569Other machinery and equipment
39 – 1 086 1 125 1 132 -7 100.6% 598 569
Payment for financial assets – – – – – – – 201 201
Total 379 260 – -8 868 370 392 370 104 288 99.9% 260 177 258 758
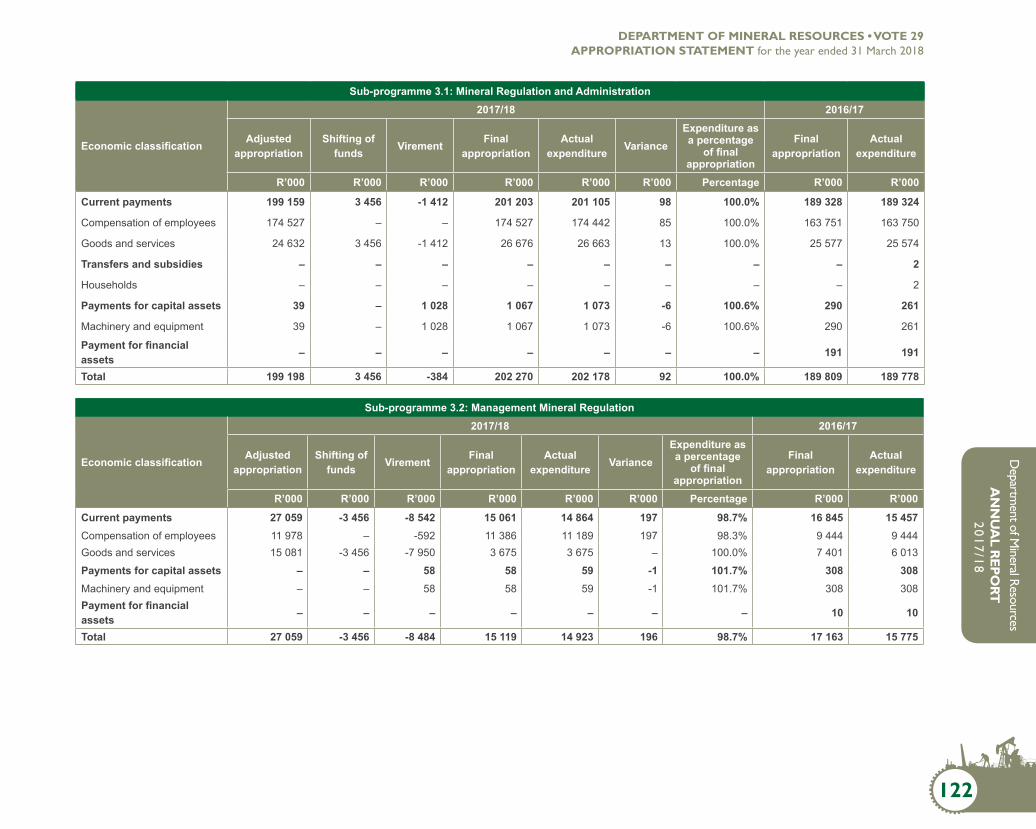
122
Departm
ent of Mineral Resources
AN
NU
AL R
EPORT
2017/18
DEPARTMENT OF MINERAL RESOURCES • VOTE 29APPROPRIATION STATEMENT for the year ended 31 March 2018
Sub-programme 3.1: Mineral Regulation and Administration
Economic classification
2017/18 2016/17
Adjusted appropriation
Shifting of funds Virement Final
appropriationActual
expenditure VarianceExpenditure as a percentage
of final appropriation
Final appropriation
Actual expenditure
R’000 R’000 R’000 R’000 R’000 R’000 Percentage R’000 R’000
Current payments 199 159 3 456 -1 412 201 203 201 105 98 100.0% 189 328 189 324
Compensation of employees 174 527 – – 174 527 174 442 85 100.0% 163 751 163 750
Goods and services 24 632 3 456 -1 412 26 676 26 663 13 100.0% 25 577 25 574
Transfers and subsidies – – – – – – – – 2
Households – – – – – – – – 2
Payments for capital assets 39 – 1 028 1 067 1 073 -6 100.6% 290 261
Machinery and equipment 39 – 1 028 1 067 1 073 -6 100.6% 290 261
Payment for financial assets – – – – – – – 191 191
Total 199 198 3 456 -384 202 270 202 178 92 100.0% 189 809 189 778
Sub-programme 3.2: Management Mineral Regulation
Economic classification
2017/18 2016/17
Adjusted appropriation
Shifting of funds Virement Final
appropriationActual
expenditure VarianceExpenditure as a percentage
of final appropriation
Final appropriation
Actual expenditure
R’000 R’000 R’000 R’000 R’000 R’000 Percentage R’000 R’000
Current payments 27 059 -3 456 -8 542 15 061 14 864 197 98.7% 16 845 15 457Compensation of employees 11 978 – -592 11 386 11 189 197 98.3% 9 444 9 444Goods and services 15 081 -3 456 -7 950 3 675 3 675 – 100.0% 7 401 6 013
Payments for capital assets – – 58 58 59 -1 101.7% 308 308Machinery and equipment – – 58 58 59 -1 101.7% 308 308Payment for financial assets – – – – – – – 10 10
Total 27 059 -3 456 -8 484 15 119 14 923 196 98.7% 17 163 15 775

123
Dep
artm
ent o
f Min
eral
Reso
urce
sA
NN
UA
L R
EPO
RT
201
7/18
DEPARTMENT OF MINERAL RESOURCES • VOTE 29APPROPRIATION STATEMENT for the year ended 31 March 2018
Sub-programme 3.3: South African Diamond and Precious Metals Regulator
Economic classification
2017/18 2016/17
Adjusted appropriation
Shifting of funds Virement Final
appropriationActual
expenditure VarianceExpenditure as a percentage
of final appropriation
Final appropriation
Actual expenditure
R’000 R’000 R’000 R’000 R’000 R’000 Percentage R’000 R’000Transfers and subsidies 65 865 – – 65 865 65 865 – 100.0% 53 205 53 205Departmental agencies and accounts
65 865 – – 65 865 65 865 – 100.0% 53 205 53 205
Total 65 865 – – 65 865 65 865 – 100.0% 53 205 53 205
Sub-programme 3.4: Petroleum Agency South Africa
Economic classification
2017/18 2016/17
Adjusted appropriation
Shifting of funds Virement Final
appropriationActual
expenditure VarianceExpenditure as a percentage
of final appropriation
Final appropriation
Actual expenditure
R’000 R’000 R’000 R’000 R’000 R’000 Percentage R’000 R’000Transfers and subsidies 87 138 – – 87 138 87 138 – 100.0% – –Public corporations and private enterprises
87 138 – – 87 138 87 138 – 100.0% – –
Total 87 138 – – 87 138 87 138 – 100.0% – –
Programme 4: Mineral Policy and Promotion2017/18 2016/17
Adjusted appropriation
Shifting of funds Virement Final
appropriationActual
expenditure VarianceExpenditure as a percentage
of final appropriation
Final appropriation
Actual expenditure
R’000 R’000 R’000 R’000 R’000 R’000 Percentage R’000 R’000Sub-programme1. Management 31 484 20 -6 383 25 121 23 935 1 186 95.3% 26 546 26 4092. Mineral Policy 19 985 -42 -1 644 18 299 18 223 76 99.6% 28 195 28 0873. Mineral Promotion
and International Coordination
47 837 181 -4 139 43 879 43 869 10 100.0% 49 496 48 769
4. Assistance to Mines – – – – – – – – –5. Council for Geoscience 366 988 – – 366 988 366 988 – 100.0% 378 598 378 5986. Mintek 367 256 – – 367 256 367 256 – 100.0% 356 416 356 4167. Economic Advisory
Services4 502 -150 -634 3 718 3 388 330 91.1% 4 632 4 019
8. Mine Environmental Management
28 060 -9 -10 848 17 203 16 795 408 97.6% 11 781 9 438
Total 866 112 – -23 648 842 464 840 454 2 010 99.8% 855 664 851 736

124
Departm
ent of Mineral Resources
AN
NU
AL R
EPORT
2017/18
DEPARTMENT OF MINERAL RESOURCES • VOTE 29APPROPRIATION STATEMENT for the year ended 31 March 2018
Economic classification
2017/18 2016/17
Adjusted appropriation
Shifting of funds Virement Final
appropriationActual
expenditure Variance
Expenditure as a
percentage of final
appropriation
Final appropriation
Actual expenditure
R’000 R’000 R’000 R’000 R’000 R’000 Percentage R’000 R’000Current payments 131 714 – -24 305 107 409 105 399 2 010 98.1% 119 439 115 796
Compensation of employees 68 809 – – 68 809 66 800 2 009 97.1% 65 862 65 319
Salaries and wages 60 385 -261 – 60 124 58 617 1 507 97.5% 57 154 57 386
Social contributions 8 424 261 – 8 685 8 183 502 94.2% 8 708 7 933
Goods and services 62 905 – -24 305 38 600 38 599 1 100.0% 53 577 50 477
Administrative fees 3 651 -245 -2 617 789 778 11 98.6% 1 403 1 522
Advertising 1 514 3 645 -67 5 092 5 092 – 100.0% 5 040 2 547
Minor assets 227 -39 -183 5 4 1 80.0% 108 1
Catering: Departmental activities
1 995 -316 -1 349 330 321 9 97.3% 353 186
Communication (oods and services)
518 -280 -144 94 94 – 100.0% 1 237 2 190
Computer services 55 -55 – – – – – 2 074 2 061
Consultants: Business and advisory services
3 650 -3 115 -500 35 69 -34 197.1% 2 716 4 671
Legal services 100 7 396 – 7 496 7 496 – 100.0% 50 584
Contractors 17 776 -3 881 -9 951 3 944 3 939 5 99.9% 1 884 7
Fleet services (including government motor transport)
227 173 -72 328 328 – 100.0% 388 404
Inventory: Clothing material and accessories
– – – – – – – 30 –
Consumable supplies 246 -5 -184 57 45 12 78.9% 197 101
Consumable: Stationery, printing and office supplies
1 841 -870 -623 348 348 – 100.0% 962 432
Operating leases 567 -147 – 420 420 – 100.0% 446 490
Travel and subsistence 12 194 -56 -3 602 8 536 8 531 5 99.9% 14 158 11 908
Training and development 1 223 -424 -485 314 328 -14 104.5% 727 252
Operating payments 7 643 184 -1 018 6 809 6 809 – 100.0% 17 230 20 080
Venues and facilities 3 428 935 -1 266 3 097 3 092 5 99.8% 4 374 3 012
Rental and hiring 5 800 -2 900 -1 994 906 905 1 99.9% 200 29
Transfers and subsidies 734 244 – – 734 244 734 244 – 100.0% 735 214 735 214
Departmental agencies and accounts
366 988 – – 366 988 366 988 – 100.0% 378 598 378 598

125
Dep
artm
ent o
f Min
eral
Reso
urce
sA
NN
UA
L R
EPO
RT
201
7/18
DEPARTMENT OF MINERAL RESOURCES • VOTE 29APPROPRIATION STATEMENT for the year ended 31 March 2018
Economic classification
2017/18 2016/17
Adjusted appropriation
Shifting of funds Virement Final
appropriationActual
expenditure Variance
Expenditure as a
percentage of final
appropriation
Final appropriation
Actual expenditure
R’000 R’000 R’000 R’000 R’000 R’000 Percentage R’000 R’000Departmental agencies (non-business entities)
366 988 – – 366 988 366 988 – 100.0% 378 598 378 598
Public corporations and private enterprises
367 256 – – 367 256 367 256 – 100.0% 356 616 356 616
Public corporations 367 256 – – 367 256 367 256 – 100.0% 356 616 356 616Subsidies on products and production (pc)
367 256 – – 367 256 367 256 – 100.0% 356 616 356 616
Payments for capital assets 154 – 657 811 811 – 100.0% 937 652
Machinery and equipment 154 – 657 811 811 – 100.0% 937 652Other machinery and equipment
154 – 657 811 811 – 100.0% 937 652
Payment for financial assets – – – – – – – 74 74
Total 866 112 – -23 648 842 464 840 454 2 010 99.8% 855 664 851 736
Sub-programme 4.1: Management
Economic classification
2017/18 2016/17
Adjusted appropriation
Shifting of funds
VirementFinal
appropriationActual
expenditureVariance
Expenditure as a percentage
of final appropriation
Final appropriation
Actual expenditure
R’000 R’000 R’000 R’000 R’000 R’000 Percentage R’000 R’000Current payments 31 416 20 -6 473 24 963 23 777 1 186 95.2% 26 254 26 124Compensation of employees 10 542 – – 10 542 9 357 1 185 88.8% 9 374 9 243
Goods and services 20 874 20 -6 473 14 421 14 420 1 100.0% 16 880 16 881
Transfers and subsidies – – – – – – – 200 200
Public corporations and private enterprises
– – – – – – – 200 200
Payments for capital assets 68 – 90 158 158 – 100.0% 91 84Machinery and equipment 68 – 90 158 158 – 100.0% 91 84
Payment for financial assets – – – – – – – 1 1
Total 31 484 20 -6 383 25 121 23 935 1 186 95.3% 26 546 26 409

126
Departm
ent of Mineral Resources
AN
NU
AL R
EPORT
2017/18
DEPARTMENT OF MINERAL RESOURCES • VOTE 29APPROPRIATION STATEMENT for the year ended 31 March 2018
Sub-programme 4.2: Mineral Policy
Economic classification
2017/18 2016/17
Adjusted appropriation
Shifting of funds Virement Final
appropriationActual
expenditure VarianceExpenditure as a percentage
of final appropriation
Final appropriation
Actual expenditure
R’000 R’000 R’000 R’000 R’000 R’000 Percentage R’000 R’000Current payments 19 985 -42 -1 873 18 070 17 993 77 99.6% 28 075 28 075Compensation of employees 11 998 – – 11 998 11 921 77 99.4% 10 645 10 645Goods and services 7 987 -42 -1 873 6 072 6 072 – 100.0% 17 430 17 430Payments for capital assets – – 229 229 230 -1 100.4% 108 –Machinery and equipment – – 229 229 230 -1 100.4% 108 –Payment for financial assets – – – – – – – 12 12
Total 19 985 -42 -1 644 18 299 18 223 76 99.6% 28 195 28 087
Sub-programme 4.3: Mineral Promotion and International Coordination
Economic classification
2017/18 2016/17
Adjusted appropriation
Shifting of funds Virement Final
appropriationActual
expenditure VarianceExpenditure as a percentage
of final appropriation
Final appropriation
Actual expenditure
R’000 R’000 R’000 R’000 R’000 R’000 Percentage R’000 R’000Current payments 47 820 181 -4 417 43 584 43 574 10 100.0% 48 889 48 330Compensation of employees 33 691 150 – 33 841 33 840 1 100.0% 34 017 33 778Goods and services 14 129 31 -4 417 9 743 9 734 9 99.9% 14 872 14 552Payments for capital assets 17 – 278 295 295 – 100.0% 547 379Machinery and equipment 17 – 278 295 295 – 100.0% 547 379Payment for financial assets – – – – – – – 60 60
Total 47 837 181 -4 139 43 879 43 869 10 100.0% 49 496 48 769
Sub-programme 4.4: Assistance to Mines
Economic classification
2017/18 2016/17
Adjusted appropriation
Shifting of funds Virement Final
appropriationActual
expenditure VarianceExpenditure as a percentage
of final appropriation
Final appropriation
Actual expenditure
R’000 R’000 R’000 R’000 R’000 R’000 Percentage R’000 R’000Current payments – – – – – – – – –Transfers and subsidies – – – – – – – – –Payments for capital assets – – – – – – – – –Total – – – – – – – – –

127
Dep
artm
ent o
f Min
eral
Reso
urce
sA
NN
UA
L R
EPO
RT
201
7/18
DEPARTMENT OF MINERAL RESOURCES • VOTE 29APPROPRIATION STATEMENT for the year ended 31 March 2018
Sub-programme 4.5: Council for Geoscience
Economic classification
2017/18 2016/17
Adjusted appropriation
Shifting of funds Virement Final
appropriationActual
expenditure VarianceExpenditure as a percentage
of final appropriation
Final appropriation
Actual expenditure
R’000 R’000 R’000 R’000 R’000 R’000 Percentage R’000 R’000Transfers and subsidies 366 988 – – 366 988 366 988 – 100.0% 378 598 378 598Departmental agencies and accounts
366 988 – – 366 988 366 988 – 100.0% 378 598 378 598
Total 366 988 – – 366 988 366 988 – 100.0% 378 598 378 598
Sub-programme 4.6: Mintek
Economic classification
2017/18 2016/17
Adjusted appropriation
Shifting of funds Virement Final
appropriationActual
expenditure VarianceExpenditure as a percentage
of final appropriation
Final appropriation
Actual expenditure
R’000 R’000 R’000 R’000 R’000 R’000 Percentage R’000 R’000Transfers and subsidies 367 256 – – 367 256 367 256 – 100.0% 356 416 356 416Public corporations and private enterprises
367 256 – – 367 256 367 256 – 100.0% 356 416 356 416
Total 367 256 – – 367 256 367 256 – 100.0% 356 416 356 416
Sub-programme 4.7: Economic Advisory Services
Economic classification
2017/18 2016/17
Adjusted appropriation
Shifting of funds Virement Final
appropriationActual
expenditure VarianceExpenditure as a percentage
of final appropriation
Final appropriation
Actual expenditure
R’000 R’000 R’000 R’000 R’000 R’000 Percentage R’000 R’000Current payments 4 502 -150 -658 3 694 3 364 330 91.1% 4 463 3 851Compensation of employees 3 704 -150 – 3 554 3 228 326 90.8% 3 856 3 688
Goods and services 798 – -658 140 136 4 97.1% 607 163
Payments for capital assets – – 24 24 24 – 100.0% 169 168Machinery and equipment – – 24 24 24 – 100.0% 169 168
Total 4 502 -150 -634 3 718 3 388 330 91.1% 4 632 4 019

128
Departm
ent of Mineral Resources
AN
NU
AL R
EPORT
2017/18
DEPARTMENT OF MINERAL RESOURCES • VOTE 29APPROPRIATION STATEMENT for the year ended 31 March 2018
Sub programme 4.8: Mine Environmental Management
Economic classification
2017/18 2016/17
Adjusted appropriation
Shifting of funds Virement Final
appropriationActual
expenditure Variance
Expenditure as a percentage
of final appropriation
Final appropriation
Actual expenditure
R’000 R’000 R’000 R’000 R’000 R’000 Percentage R’000 R’000Current payments 27 991 -9 -10 884 17 098 16 691 407 97.6% 11 758 9 416Compensation of employees 8 874 – – 8 874 8 454 420 95.3% 7 970 7 965
Goods and services 19 117 -9 -10 884 8 224 8 237 -13 100.2% 3 788 1 451
Payments for capital assets 69 – 36 105 104 1 99.0% 22 21Buildings and other fixed structures
– – – – – – – – –
Machinery and equipment 69 – 36 105 104 1 99.0% 22 21
Payment for financial assets – – – – – – – 1 1
Total 28 060 -9 10 920 17 203 16 795 408 97.6% 11 781 9 438
1. Detail of transfers and subsidies as per the Appropriation Act (after Virement):
Detail of these transactions can be viewed in the note on transfers and subsidies, disclosure notes and Annexure 1 (A-H) to the Annual Financial Statements.
2. Detail of specifically and exclusively appropriated amounts voted (after Virement):
Detail of these transactions can be viewed in Note 1 (annual appropriation) to the Annual Financial Statements.
3. Detail on payments for financial assets
Detail of these transactions per programme can be viewed in the note on payments for financial assets to the Annual Financial Statements.
4. Explanations of material variances from amounts voted (after Virement):
There were no material variances on the voted fund.

129
Dep
artm
ent o
f Min
eral
Reso
urce
sA
NN
UA
L R
EPO
RT
201
7/18
DEPARTMENT OF MINERAL RESOURCES • VOTE 29APPROPRIATION STATEMENT for the year ended 31 March 2018
4.1 Per programme
Final appropriation Actual expenditure Variance R’000
Variance as a percentage of final appropriation
Administration 362 906 362 470 436 0.1%The saving of R436 000 is mainly due to cost-containment measures implemented on consumables and stationery.
Final appropriation Actual expenditure Variance R’000
Variance as a percentage of final appropriation
Mine Health and Safety 203 687 203 657 30 0.0%The saving of R30 000 is mainly due to cost-containment measures implemented on fleet services.
Final appropriation Actual expenditure Variance R’000
Variance as a percentage of final appropriation
Mineral Regulation 370 392 370 104 288 0.1%The underspending of R288 000 is mainly due to savings on compensation of employees.
Final appropriation Actual expenditure Variance R’000
Variance as a percentage of final appropriation
Mineral Policy and Promotion 842 464 840 454 2 010 0.2%The underspending of R2 million is mainly due to savings on compensation of employees.
4.2 Per economic classification
Final appropriation Actual expenditure Variance Variance as a percentage of final appropriation
R’000 R’000 R’000 PercentageCurrent payments Compensation of employees 590 665 588 355 2 310 0.0%Goods and services 279 253 278 921 332 0.0%
Transfers and subsidiesDepartmental agencies and accounts 440 855 440 733 122 0.0%Public corporations and private enterprises 454 394 454 394 – 0.0%Households 1 613 1 613 – 0.0%
Payments for capital assetsBuildings and other fixed structures 263 263 – 0.0%Machinery and equipment 11 614 11 614 0 1.6%
Compensation of employees has an allocated budget of R590.7 million for the 2017/18 financial year. The actual expenditure of R588.4 million is below the final appropriation of R590.7 million by R2.3 million or 99.6%. The saving of R2.3 million is mainly due is the delay on the filling of critical vacant posts that were identified and advertised during the financial year.

130
Departm
ent of Mineral Resources
AN
NU
AL R
EPORT
2017/18
DEPARTMENT OF MINERAL RESOURCES • VOTE 29STATEMENT OF FINANCIAL PERFORMANCE for the year ended 31 March 2018
Note 2017/18 2016/17R’000 R’000
REVENUEAnnual appropriation 1 1 779 449 1 669 077Departmental revenue 2 38 912 38 072Aid assistance 3 – 13 265
TOTAL REVENUE 1 818 361 1 720 414
EXPENDITURE
Current expenditureCompensation of employees 4 588 355 558 798Goods and services 5 278 921 299 784Total current expenditure 867 276 858 582
Transfers and subsidiesTransfers and subsidies 7 896 740 791 316Aid assistance 3 – 11 493Total transfers and subsidies 896 740 802 809
Expenditure for capital assetsTangible assets 8 11 877 9 917Intangible assets 792 –Total expenditure for capital assets 12 669 9 917
Payments for financial assets 6 – 1 286
TOTAL EXPENDITURE 1 776 685 1 672 594
SURPLUS/(DEFICIT) FOR THE YEAR 41 757 47 820
Reconciliation of net surplus/(deficit) for the yearVoted funds 2 764 7 976Annual appropriation 2 764 7 976
Departmental revenue and National Revenue Fund (NRF) receipts 2.1 38 912 38 072
Aid assistance 3 – 1 772
SURPLUS/(DEFICIT) FOR THE YEAR 41 676 47 820

131
Dep
artm
ent o
f Min
eral
Reso
urce
sA
NN
UA
L R
EPO
RT
201
7/18
DEPARTMENT OF MINERAL RESOURCES • VOTE 29STATEMENT OF FINANCIAL POSITION for the year ended 31 March 2018
Note 2017/18 2016/17
R’000 R’000ASSETS
Current assets 1 330 16 804Cash and cash equivalents 9 1 057 10 643
Prepayments and advances 10 34 88
Receivables 11 239 6 073
Non-current assets 5 924 –
Receivables 11 5 924 –
TOTAL ASSETS 7 254 16 804
LIABILITIES
Current liabilities 3 915 13 049Voted funds to be surrendered to the Revenue Fund 12 2 764 7 976
Departmental revenue and NRF receipts to be surrendered to the Revenue Fund
13 951 749
Payables 14 200 2 552
Aid assistance repayable 3 – 1 772
TOTAL LIABILITIES 3 915 13 049
NET ASSETS 3 339 3 755
Represented by:
Recoverable revenue 3 339 3 755
TOTAL 3 339 3 755

132
Departm
ent of Mineral Resources
AN
NU
AL R
EPORT
2017/18
DEPARTMENT OF MINERAL RESOURCES • VOTE 29STATEMENT OF CHANGES IN NET ASSETS for the year ended 31 March 2018
Note 2017/18 2016/17
R’000 R’000Recoverable revenueOpening balance 3 755 4 268
Transfers: (416) (513)
Debts revised -240 -1 466
Debts recovered (included in departmental receipts) -830 -1 118
Debts raised 654 2 071
Closing balance 3 339 3 755
TOTAL 3 339 3 755

133
Dep
artm
ent o
f Min
eral
Reso
urce
sA
NN
UA
L R
EPO
RT
201
7/18
Note 2017/18 2016/17R’000 R’000
CASH FLOWS FROM OPERATING ACTIVITIESReceipts 1 818 361 1 720 414
Annual appropriated funds received 1.1 1 779 449 1 669 077
Departmental revenue received 2 38 723 37 807
Interest received 2.3 189 265
Aid assistance received 3 – 13 265
Net (increase)/decrease in working capital (2 388) (7 120)
Surrendered to Revenue Fund (46 769) (40 529)
Surrendered to RDP Fund/donor (1 772) (1 772)
Current payments (867 276) (858 582)
Payments for financial assets – (1 286)
Transfers and subsidies paid (896 740) (802 809)
Net cash flow available from operating activities 15 3 497 8 316
CASH FLOWS FROM INVESTING ACTIVITIESPayments for capital assets 8 (12 669) (9 917)
Net cash flows from investing activities (12 669) (9 917)
CASH FLOWS FROM FINANCING ACTIVITIESIncrease/(decrease) in net assets (416) (513)
Net cash flows from financing activities (416) (513)
Net increase/(decrease) in cash and cash equivalents (9 588) (2 114)
Cash and cash equivalents at beginning of period 10 646 12 760
Cash and cash equivalents at end of period 6 1 057 10 646
DEPARTMENT OF MINERAL RESOURCES • VOTE 29CASH FLOW STATEMENT for the year ended 31 March 2018

134
Departm
ent of Mineral Resources
AN
NU
AL R
EPORT
2017/18
DEPARTMENT OF MINERAL RESOURCES • VOTE 29NOTES TO THE ANNUAL FINANCIAL STATEMENTS for the year ended 31 March 2018
Summary of significant accounting policies
The financial statements have been prepared in accordance with the following policies, which have been applied consistently in all material aspects, unless otherwise indicated. Management has concluded that the financial statements present the Department’s primary and secondary information fairly.
The historical cost convention has been used, except where otherwise indicated. Management has used assessments and estimates in preparing the Annual Financial Statements. These are based on the best information available at the time of preparation.
Where appropriate and meaningful, additional information has been disclosed to enhance the usefulness of the financial statements and to comply with the statutory requirements of the Public Finance Management Act, Act No. 1 of 1999 (as amended by Act No. 29 of 1999), and the Treasury Regulations issued in terms of the PFMA and the annual Division of Revenue Act.
1. Basis of preparation
The financial statements have been prepared in accordance with the Modified Cash Standard.
2. Going concern
The financial statements have been prepared on a going-concern basis.
3. Presentation currency
Amounts have been presented in the currency of the South African rand (R), which is also the functional currency of the Department.
4. Rounding
Unless otherwise stated, financial figures have been rounded to the nearest one thousand rand (R’000).
5. Comparative information
5.1 Prior-period comparative information
Prior-period comparative information has been presented in the current year’s financial statements. Where necessary, figures included in the
prior-period financial statements have been reclassified to ensure that the format in which the information is presented is consistent with the format of the current year’s financial statements.
5.2 Current-year comparison with budget
A comparison between the approved final budget and actual amounts for each programme and economic classification is included in the Appropriation Statement.
6. Revenue
6.1 Appropriated funds
Appropriated funds comprises departmental allocations, as well as direct charges against the Revenue Fund (i.e. statutory appropriation).
Appropriated funds are recognised in the Statement of Financial Performance on the date the appropriation becomes effective. Adjustments made in terms of the adjustments budget process are recognised in the Statement of Financial Performance on the date the adjustments become effective.
The net amount of any appropriated funds due to or from the relevant revenue fund at the reporting date is recognised as a payable or receivable in the Statement of Financial Position.
6.2 Departmental revenue
Departmental revenue is recognised in the Statement of Financial Performance when received and is subsequently paid into the relevant revenue fund, unless stated otherwise.
Any amount owing to the relevant revenue fund at the reporting date is recognised as a payable in the Statement of Financial Position.
6.3 Accrued departmental revenue
Accruals in respect of departmental revenue (excluding tax revenue) are recorded in the Notes to the Annual Financial Statements when:
• it is probable that the economic benefits or service potential associated with the transaction will flow to the Department; and
• the amount of revenue can be measured reliably.

135
Dep
artm
ent o
f Min
eral
Reso
urce
sA
NN
UA
L R
EPO
RT
201
7/18
DEPARTMENT OF MINERAL RESOURCES • VOTE 29NOTES TO THE ANNUAL FINANCIAL STATEMENTS for the year ended 31 March 2018
The accrued revenue is measured at the fair value of the consideration receivable.
Accrued tax revenue (and related interest or penalties) is measured at amounts receivable from collecting agents.
Write-offs are made according to the Department’s debt write-off policy
7. Expenditure
7.1 Compensation of employees
7.1.1 Salaries and wages
Salaries and wages are recognised in the Statement of Financial Performance on the date of payment.
7.1.2 Social contributions
Social contributions made by the Department in respect of current employees are recognised in the Statement of Financial Performance on the date of payment. Social contributions made by the Department in respect of former employees are classified as transfers to households in the Statement of Financial Performance on the date of payment.
7.2 Other expenditure
Other expenditure (such as goods and services, transfers and subsidies, and payments for capital assets) is recognised in the Statement of Financial Performance on the date of payment. The expense is classified as a capital expense if the total consideration paid is more than the capitalisation threshold.
7.3 Accrued expenditure payable
Accruals and payables not recognised are recorded in the Notes to the Annual Financial Statements at cost at the reporting date.
7.4 Leases
7.4.1 Operating leases
Operating lease payments made during the reporting period are recognised as current expenditure in the Statement of Financial Performance on the date of payment.
The operating lease commitments are recorded in the Notes to the Annual Financial Statements.
7.4.2 Finance leases
Finance lease payments made during the reporting period are recognised as capital expenditure in the Statement of Financial Performance on the date of payment.
The finance lease commitments are recorded in the Notes to the Annual Financial Statements and are not apportioned between the capital and interest portions.
Finance lease assets acquired at the end of the lease term are recorded and measured at the lower of:
• cost, being the fair value of the asset; or• the sum of the minimum lease payments made, including any
payments made to acquire ownership at the end of the lease term, excluding interest.
8. Aid assistance
8.1 Aid assistance received
Aid assistance received in cash is recognised in the Statement of Financial Performance when received. In-kind aid assistance is recorded in the Notes to the Annual Financial Statements on the date of receipt and is measured at fair value.
Aid assistance not spent for the intended purpose and any unutilised funds from aid assistance that are required to be refunded to the donor are recognised as a payable in the Statement of Financial Position.
8.2 Aid assistance paid
Aid assistance paid is recognised in the Statement of Financial Performance on the date of payment. Aid assistance payments made prior to the receipt of funds are recognised as a receivable in the Statement of Financial Position.
9. Cash and cash equivalents
Cash and cash equivalents are stated at cost in the Statement of Financial Position.

136
Departm
ent of Mineral Resources
AN
NU
AL R
EPORT
2017/18
DEPARTMENT OF MINERAL RESOURCES • VOTE 29NOTES TO THE ANNUAL FINANCIAL STATEMENTS for the year ended 31 March 2018
Bank overdrafts are shown separately on the face of the Statement of Financial Position as a current liability.
For the purposes of the Cash Flow Statement, cash and cash equivalents comprise cash on hand, deposits held, other short-term highly liquid investments and bank overdrafts.
10. Prepayments and advances
Prepayments and advances are recognised in the Statement of Financial Position when the Department receives or disburses the cash.
Prepayments and advances are initially and subsequently measured at cost.
11. Loans and receivables
Loans and receivables are recognised in the Statement of Financial Position at cost plus accrued interest, where interest is charged, less amounts already settled or written-off. Write-offs are made according to the Department’s write-off policy.
12. Financial assets
12.1 Financial assets (not covered elsewhere)
A financial asset is recognised initially at its cost plus transaction costs that are directly attributable to the acquisition or issue of the financial asset.
At the reporting date, the Department measures its financial assets at cost, less amounts already settled or written-off, except for recognised loans and receivables, which are measured at cost plus accrued interest, where interest is charged, less amounts already settled or written-off.
12.2 Impairment of financial assets
Where there is an indication of impairment of a financial asset, an estimation of the reduction in the recorded carrying value, to reflect the best estimate of the amount of the future economic benefits expected to be received from that asset, is recorded in the Notes to the Annual Financial Statements.
13. Payables
Payables recognised in the Statement of Financial Position are recognised at cost.
14. Capital assets
14.1 Immovable capital assets
Immovable assets reflected in the Department’s Asset Register are recorded in the Notes to the Annual Financial Statements at cost or fair value, where the cost cannot be determined reliably. Immovable assets acquired in a non-exchange transaction are recorded at fair value at the date of acquisition. Immovable assets are subsequently carried in the Asset Register at cost and are not currently subject to depreciation or impairment. Subsequent expenditure of a capital nature forms part of the cost of the existing asset when ready for use.
Additional information on immovable assets not reflected in the Asset Register is provided in the Notes to Annual Financial Statements.
14.2 Movable capital assets
Movable capital assets are initially recorded in the Notes to the Annual Financial Statements at cost. Movable capital assets acquired through a non-exchange transaction are measured at fair value as at the date of acquisition.
Where the cost of movable capital assets cannot be determined reliably, the movable capital assets are measured at fair value, and where fair value cannot be determined, the movable assets are measured at R1.
All assets acquired prior to 1 April 2002 (or a later date as approved by the Office of the Auditor-General) may be recorded at R1.
Movable capital assets are subsequently carried at cost and are not subject to depreciation or impairment.
Biological assets are subsequently carried at fair value. Subsequent expenditure that is of a capital nature forms part of the cost of the existing asset when ready for use.
14.3 Intangible assets
Intangible assets are initially recorded in the Notes to the Annual Financial Statements at cost. Intangible assets acquired through a non-exchange transaction are measured at fair value as at the date of acquisition. Internally generated intangible assets are recorded in the Notes to the Annual Financial Statements when the Department commences the development phase of the project.

137
Dep
artm
ent o
f Min
eral
Reso
urce
sA
NN
UA
L R
EPO
RT
201
7/18
DEPARTMENT OF MINERAL RESOURCES • VOTE 29NOTES TO THE ANNUAL FINANCIAL STATEMENTS for the year ended 31 March 2018
15.4 Commitments
Commitments (other than for transfers and subsidies) are recorded at cost in the Notes to the Annual Financial Statements when there is a contractual arrangement or an approval by management in a manner that raises a valid expectation that the Department will discharge its responsibilities, thereby incurring future expenditure that will result in the outflow of cash.
16. Unauthorised expenditure
Unauthorised expenditure is recognised in the Statement of Financial Position until such time as the expenditure is:
• approved by Parliament or the provincial legislature with funding and the related funds are received;
• approved by Parliament or the provincial legislature without funding and is written off against the appropriation in the Statement of Financial performance; or
• transferred to receivables for recovery.
Unauthorised expenditure is measured at the amount of the confirmed unauthorised expenditure.
17. Fruitless and wasteful expenditure
Fruitless and wasteful expenditure is recorded in the Notes to the Annual Financial Statements when confirmed. The amount recorded is equal to the total value of the fruitless and or wasteful expenditure incurred.
Fruitless and wasteful expenditure is removed from the Notes to the Annual Financial Statements when it is resolved or transferred to receivables for recovery.
Fruitless and wasteful expenditure receivables are measured at the amount that is expected to be recoverable and are derecognised when settled or subsequently written-off as irrecoverable.
18. Irregular expenditure
Irregular expenditure is recorded in the Notes to the Annual Financial Statements when confirmed. The amount recorded is equal to the value of
Where the cost of intangible assets cannot be determined reliably, the intangible capital assets are measured at fair value, and where fair value cannot be determined, the intangible assets are measured at R1.
All assets acquired prior to 1 April 2002 (or a later date as approved by the Office of the Auditor-General) may be recorded at R1.
Intangible assets are subsequently carried at cost and are not subject to depreciation or impairment.
Subsequent expenditure of a capital nature forms part of the cost of the existing asset when ready for use. 15. Provisions and contingents
15.1 Provisions
Provisions are recorded in the Notes to the Annual Financial Statements when there is a present legal or constructive obligation to forfeit economic benefits as a result of events in the past and it is probable that an outflow of resources embodying economic benefits or service potential will be required to settle the obligation, and a reliable estimate of the obligation can be made. The provision is measured as the best estimate of the funds required to settle the present obligation at the reporting date.
15.2 Contingent liabilities
Contingent liabilities are recorded in the Notes to the Annual Financial Statements when there is a possible obligation that arises from past events, and whose existence will be confirmed only by the occurrence or non-occurrence of one or more uncertain future events not within the control of the Department, or when there is a present obligation that is not recognised because it is not probable that an outflow of resources will be required to settle the obligation, or the amount of the obligation cannot be measured reliably.
15.3 Contingent assets
Contingent assets are recorded in the Notes to the Annual Financial Statements when a possible asset arises from past events, and whose existence will be confirmed by the occurrence or non-occurrence of one or more uncertain future events not within the control of the Department.

138
Departm
ent of Mineral Resources
AN
NU
AL R
EPORT
2017/18
DEPARTMENT OF MINERAL RESOURCES • VOTE 29NOTES TO THE ANNUAL FINANCIAL STATEMENTS for the year ended 31 March 2018
the irregular expenditure incurred unless it is impracticable to determine, in which case reasons for the irregular expenditure are provided in the note.
Irregular expenditure is removed from the note when it is condoned by the relevant authority, transferred to receivables for recovery or not condoned and not recoverable.
Irregular expenditure receivables are measured at the amount that is expected to be recoverable and are derecognised when settled or subsequently written-off as irrecoverable.
19. Changes in accounting policies, accounting estimates and errors
Changes in accounting policies that are affected by management have been applied retrospectively in accordance with Modified Cash Standard requirements, except to the extent that it is impracticable to determine the period-specific effects or the cumulative effect of the change in policy. In such instances, the Department shall restate the opening balances of assets, liabilities and net assets for the earliest period for which retrospective restatement is practicable.
Changes in accounting estimates are applied prospectively in accordance with Modified Cash Standard requirements.
Correction of errors is applied retrospectively in the period in which the error has occurred in accordance with Modified Cash Standard requirements, except to the extent that it is impracticable to determine the period-specific effects or the cumulative effect of the error. In such cases, the Department shall restate the opening balances of assets, liabilities and net assets for the earliest period for which retrospective restatement is practicable.
20. Events after the reporting date
Events after the reporting date that are classified as adjusting events have been accounted for in the financial statements. The events after the reporting date that are classified as non-adjusting events after the reporting date have been disclosed in the Notes to the Annual Financial Statements.
21. Recoverable revenue
Amounts are recognised as recoverable revenue when a payment made in a previous financial year becomes recoverable from a debtor in the current financial year. Amounts are either transferred to the national or provincial
Revenue Fund when recovered or are transferred to the Statement of Financial Performance when written-off.
22. Related-party transactions
A related-party transaction is a transfer of resources, services or obligations between the reporting entity and a related party. Related-party transactions within the Minister or Member of the Executive Committee portfolio are recorded in the Notes to the Annual Financial Statements when the transaction is not at arm’s length.
Key management personnel are those persons having the authority and responsibility for planning, directing and controlling the activities of the Department. The number of individuals and their full compensation is recorded in the Notes to the Annual Financial Statements.
28 Inventories
At the date of acquisition, inventories are recognised at cost in the Statement of Financial Performance.
Where inventories are acquired as part of a non-exchange transaction, the inventories are measured at fair value as at the date of acquisition.
Inventories are subsequently measured at the lower of cost and net realisable value or where intended for distribution (or consumed in the production of goods for distribution) at no or a nominal charge, the lower of cost and current replacement value.
The cost of inventories is assigned by using the weighted average cost basis.
30 Employee benefits
The value of each major class of employee benefit obligation (accruals, payables not recognised and provisions) is disclosed in the employee benefits note.

139
Dep
artm
ent o
f Min
eral
Reso
urce
sA
NN
UA
L R
EPO
RT
201
7/18
DEPARTMENT OF MINERAL RESOURCES • VOTE 29NOTES TO THE ANNUAL FINANCIAL STATEMENTS for the year ended 31 March 2018
1. Annual appropriation
1.1 Annual appropriation
Included are funds appropriated in terms of the Appropriation Act (and the Adjustments Appropriation Act) for national departments (voted funds):
2017/18 2016/17
Final appropriation
Actual funds received
Final appropriation
Appropriationreceived
R’000 R’000 R’000 R’000Administration 362 906 339 931 362 796 362 796Mine Health and Safety 203 687 194 146 190 440 190 440Mineral Regulation 370 392 379 260 260 177 260 177Mineral Policy and Promotion 842 464 866 112 855 664 855 664
Total 1 779 449 1 779 449 1 669 077 1 669 077
2. Departmental revenueNote 2017/18 2016/17
R’000 R’000Sales of goods and services other than capital assets 2.1 11 642 10 149Fines, penalties and forfeits 2.2 1 294 990Interest, dividends and rent on land 2.3 23 576 23 881Transactions in financial assets and liabilities 2.4 2 400 3 052
Departmental revenue collected 38 912 38 072
2.1 Sales of goods and services other than capital assetsNote 2017/18 2016/17
2 R’000 R’000Sales of goods and services produced by the Department 11 642 10 147
Sales by market establishment 453 473Administrative fees 10 518 9 073Other sales 671 602
Sales of scrap, waste and other used current goods – 1Total 11 642 10 149
2.2 Fines, penalties and forfeitsNote 2017/18 2016/17
2 R’000 R’000Fines 635 120Penalties 659 870Total 1 294 990

140
Departm
ent of Mineral Resources
AN
NU
AL R
EPORT
2017/18
DEPARTMENT OF MINERAL RESOURCES • VOTE 29NOTES TO THE ANNUAL FINANCIAL STATEMENTS for the year ended 31 March 2018
2.3 Interest, dividends and rent on land Note 2017/18 2016/17
2 R’000 R’000Interest 189 265Rent on land 23 387 23 616
Total 23 576 23 881
2.4 Transactions in financial assets and liabilitiesNote 2017/18 2016/17
2 R’000 R’000Receivables 2 400 3 052Total 2 400 3052
3. Aid assistanceNote 2017/18 2016/17
R’000 R’000Opening balance 1 772 1 772Aid assistance received 1l – 13 265Aid assistance utilised 1l – (11 493)
Paid during the year (1 772) (1 772)
Closing balance – 1 772
3.1 Analysis of balanceNote 2017/18 2016/17
R’000 R’000Aid assistance utilised – 1 772
Closing balance – 1 772
4. Compensation of employees
4.1 Salaries and wagesNote 2017/18 2016/17
4 R’000 R’000Basic salary 404 405 383 493Performance award 12 431 12 998Service based 128 316Compensative/circumstantial 5 999 8 744Periodic payments 3 535 49Other non-pensionable allowances 86 077 81 765
Total 512 575 487 365

141
Dep
artm
ent o
f Min
eral
Reso
urce
sA
NN
UA
L R
EPO
RT
201
7/18
DEPARTMENT OF MINERAL RESOURCES • VOTE 29NOTES TO THE ANNUAL FINANCIAL STATEMENTS for the year ended 31 March 2018
4.2 Social contributionsNote 2017/18 2016/17
4 R’000 R’000Employer contributionsPension 52 435 49 616
Medical aid 23 258 21 735
Bargaining council 87 82
Total 75 780 71 433
Total compensation of employees 588 355 558 798
Average number of employees 1 069 1 108
5. Goods and servicesNote 2017/18 2016/17
R’000 R’000Administrative fees 2 484 3 248
Advertising 5 813 5 453
Minor assets 5.1 1 482 968
Bursaries (employees) 1 246 1 234
Catering 1 432 951
Communication 12 706 17 281
Computer services 5.2 23 850 26 872
Consultants: Business and advisory services 2 134 8 237
Legal services 13 561 11 213
Contractors 4 481 1 057
Entertainment 5 –
Audit cost – external 5.3 7 013 6 247
Fleet services 10 657 10 518
Inventory 5.4 – 292
Consumables 5.5 6 138 6 737
Operating leases 88 614 89 325
Property payments 5.6 6 562 6 259
Rental and hiring 1 118 232
Travel and subsistence 5.7 69 141 68 383
Venues and facilities 6 081 6 643
Training and development 4 749 4 892
Other operating expenditure 5.8 9 654 23 742
Total 278 921 299 784

142
Departm
ent of Mineral Resources
AN
NU
AL R
EPORT
2017/18
DEPARTMENT OF MINERAL RESOURCES • VOTE 29NOTES TO THE ANNUAL FINANCIAL STATEMENTS for the year ended 31 March 2018
5.1 Minor assetsNote 2017/18 2016/17
5 R’000 R’000Tangible assets 1 482 968Machinery and equipment 1 482 968
5.2 Computer servicesNote 2017/18 2016/17
5 R’000 R’000State Information Technology Agency (SITA) computer services 7 176 8 578External computer service providers 16 674 18 294
Total 23 850 26 872
5.3 Audit cost – ExternalNote 2017/18 2016/17
5 R’000 R’000Regularity audits 7 013 6 247
Total 7 013 6 247
5.4 InventoryNote 2017/18 2016/17
5 R’000 R’000Clothing material and accessories – 53Food and food supplies – 19Materials and supplies – 218Medical supplies – 2
Total – 292
5.5 ConsumablesNote 2017/18 2016/17
5 R’000 R’000Consumable supplies 2 251 2 065Uniform and clothing 1 336 1 380Household supplies 262 274IT consumables 168 59Other consumables 485 352Stationery, printing and office supplies 3 887 4 672
Total 6 138 6 737

143
Dep
artm
ent o
f Min
eral
Reso
urce
sA
NN
UA
L R
EPO
RT
201
7/18
DEPARTMENT OF MINERAL RESOURCES • VOTE 29NOTES TO THE ANNUAL FINANCIAL STATEMENTS for the year ended 31 March 2018
5.6 Property paymentsNote 2017/18 2016/17
5 R’000 R’000Property maintenance and repairs – 60Other 6 562 6 199
Total 6 562 6 259
5.7 Travel and subsistenceNote 2017/18 2016/17
5 R’000 R’000Local 60 940 55 902Foreign 8 201 12 481
Total 69 141 68 383
5.8 Other operating expenditureNote 2017/18 2016/17
5 R’000 R’000Professional bodies, membership and subscription fees 7 275 20 093Resettlement costs 847 1 740Other 1 532 1 909
Total 9 654 23 742
6. Payments for financial assetsNote 2017/18 2016/17
R’000 R’000Debts written off 6.1 – 1 286
Total – 1 286
6.1 Debts written offNote 2017/18 2016/17
6 R’000 R’000Nature of debts written offBad debt written off – 1 286
Total debt written off – 1 286

144
Departm
ent of Mineral Resources
AN
NU
AL R
EPORT
2017/18
DEPARTMENT OF MINERAL RESOURCES • VOTE 29NOTES TO THE ANNUAL FINANCIAL STATEMENTS for the year ended 31 March 2018
7. Transfers and subsidiesNote 2017/18 2016/17
R’000 R’000Departmental agencies and accounts Annexure 1B 440 733 433 519Public corporations and private enterprises Annexure 1D 454 394 356 616Households Annexure 1G 1 613 1 181
Total 896 740 791 316
8. Expenditure for capital assetsNote 2017/18 2016/17
R’000 R’000Tangible assets 11 877 9 917
Buildings and other fixed structures 29 263 153Machinery and equipment 27 11 614 9 764
Intangible assets – –Software 28 792 –
Total 12 669 9 917
8.1 Analysis of funds utilised to acquire capital assets – 2017/18Voted funds
R’000Tangible assets 11 877
Buildings and other fixed structures 263Machinery and equipment 11 614
Intangible assets 792Software 792
Total 12 669
8.2 Analysis of funds utilised to acquire capital assets – 2016/17Voted funds
R’000Tangible assets 9 917
Buildings and other fixed structures 153Specialised military assets 9 764
Total 9 917

145
Dep
artm
ent o
f Min
eral
Reso
urce
sA
NN
UA
L R
EPO
RT
201
7/18
DEPARTMENT OF MINERAL RESOURCES • VOTE 29NOTES TO THE ANNUAL FINANCIAL STATEMENTS for the year ended 31 March 2018
9. Cash and cash equivalentsNote 2017/18 2016/17
R’000 R’000Consolidated Paymaster-General Account (680) 10 262
Cash on hand 72 71
Investments (domestic) 1 665 310
Total 1 057 10 643
10. Prepayments and advancesNote 2017/18 2016/17
R’000 R’000Travel and subsistence 34 88
Total 34 88
11. ReceivablesNote 2017/18 2016/17
Current Non-current Total Current TotalR’000 R’000 R’000 R’000 R’000
Claims recoverable 11.1 12 1 457 1 469 1 457 1 457
Recoverable expenditure 11.2 7 99 106 76 76
Staff debt 11.3 220 4 368 4 588 4 540 4 540
Total 239 5 924 6 163 6 073 6 073
11.1 Claims recoverableNote 2017/18 2016/17
R’000 R’000National departments 11 and Annexure 4 1 457 1 457
Provincial departments 12 –
Total 1 469 1 457
11.2 Recoverable expenditure (disallowance accounts)Note 2017/18 2016/17
11 R’000 R’000Salary tax debt 8 –
Disallowance damages and losses 98 76
Total 106 76

146
Departm
ent of Mineral Resources
AN
NU
AL R
EPORT
2017/18
DEPARTMENT OF MINERAL RESOURCES • VOTE 29NOTES TO THE ANNUAL FINANCIAL STATEMENTS for the year ended 31 March 2018
11.3 Staff debtNote 2017/18 2016/17
11 R’000 R’000Contract – 67
Study debt 3 123 2 990
Subsidised vehicle 181 176
Dinners – 56
Government Garage car 168 47
Other 1 062 1 143
Tax debt 54 61
Total 4 588 4 540
11.4 Impairment of receivablesNote 2017/18 2016/17
R’000 R’000Estimate of impairment of receivables 4 560 5 804
Total 4 560 5 804
12. Voted funds to be surrendered to the Revenue FundNote 2017/18 2016/17
R’000 R’000Opening balance 7 978 61
As restated 7 978 61
Transfer from Statement of Financial Performance (as restated) 2 764 7 978
Paid during the year (7 978) (61)
Closing balance 2 764 7 978
13. Departmental revenue and NRF receipts to be surrendered to the Revenue FundNote 2017/18 2016/17
R’000 R’000Opening balance 749 3 145
As restated 749 3 145
Transfer from Statement of Financial Performance (as restated) 38 912 38 072
Paid during the year (38 710) (40 468)
Closing balance 951 749

147
Dep
artm
ent o
f Min
eral
Reso
urce
sA
NN
UA
L R
EPO
RT
201
7/18
DEPARTMENT OF MINERAL RESOURCES • VOTE 29NOTES TO THE ANNUAL FINANCIAL STATEMENTS for the year ended 31 March 2018
14. Payables – CurrentNote 2017/18 2016/17
R’000 R’000Clearing accounts 14.1 200 2 517
Other payables 14.2 – 35
Total 200 2 552
14.1 Clearing accountsNote 2017/18 2016/17
R’000 R’000Salary pension funds 37 104
Salary income tax 162 2 412
Salary bargaining council 1 –
Salary garnishee order – 1
Total 200 2 517
14.2 Other payablesNote 2017/18 2016/1721 R’000 R’000
Salary reversal control – 35
Total – 35
15. Net cash flow available from operating activitiesNote 2017/18 2016/17
R’000 R’000Net surplus as per Statement of Financial Performance 41 757 47 820
Add back non-cash/cash movements not deemed operating activities (38 260) (39 504)
(Increase)/decrease in receivables – Current (90) 1 107
(Increase)/decrease in prepayments and advances 54 217
Increase/(decrease) in payables – Current (2 352) (8 444)
Expenditure on capital assets 12 669 9 917
Surrenders to Revenue Fund (46 769) (40 529)
Surrenders to Reconstruction and Development Programme (RDP) Fund/donor (1 772) (1 772)
Net cash flow generated by operating activities 3 497 8 316

148
Departm
ent of Mineral Resources
AN
NU
AL R
EPORT
2017/18
DEPARTMENT OF MINERAL RESOURCES • VOTE 29NOTES TO THE ANNUAL FINANCIAL STATEMENTS for the year ended 31 March 2018
16. Reconciliation of cash and cash equivalents for cash flow purposesNote 2017/18 2016/1714 R’000 R’000
Consolidated Paymaster-General account (680) 10 265
Cash on hand 72 71
Cash with commercial banks (local) 1 665 310
Total 1 057 10 646
17. Contingent liabilities and contingent assets
17.1 Contingent liabilitiesNote 2017/18 2016/17
R’000 R’000Liable to natureClaims against the Department Annexure 3B 97 467 5 609 311
Environmental rehabilitation liability Annexure 3B 1 860 559 1 701 279
Other 10 032 –
Inter-government payables unconfirmed balance 2 442 –
Total 1 970 500 7 310 590
Included in other contingent liability is future lease payment in dispute because of a contract signed by an official without the delegated authority. The environmental rehabilitation liability comprises derelict and ownerless mines that have been earmarked by the Department for rehabilitation, depending on the availability of funds. The reduction in the cases against the Department amount to R5 billion and have since been completed and closed, and there is no future liability for the Department to be incurred.
17.2 Contingent assetsNote 2017/18 2016/17
R’000 R’000Lease contract in dispute 4 122 –
Total 4 122 –
The contingent assets relate to a possible refund on contingent liability raised on an unauthorised lease agreement contract that the third party considers binding regardless of terms and condition of contract relating to billing not being adhered to.

149
Dep
artm
ent o
f Min
eral
Reso
urce
sA
NN
UA
L R
EPO
RT
201
7/18
DEPARTMENT OF MINERAL RESOURCES • VOTE 29NOTES TO THE ANNUAL FINANCIAL STATEMENTS for the year ended 31 March 2018
18. CommitmentsNote 2017/18 2016/17
R’000 R’000Current expenditure*Approved and contracted 31 666 8 667
31 666 8 667
Capital expenditureApproved and contracted 109 –
Approved but not yet contracted – 152
109 152
Total commitments 31 775 8 819
*Included in the commitment is the R13.3 million that relates to 2019/20 financial year
19. Accruals and payables not recognised2017/18 2016/17
30 days 30+ days Total TotalR’000 R’000 R’000 R’000
Listed by economic classificationGoods and services 7 094 – 7 094 9 397
Capital assets 118 – 118 –
Total 7 212 – 7 212 9 397
Note 2017/18 2016/17
R’000 R’000Listed by programme levelAdministration 4 147 5 516
Mine Health and Safety 371 1 077
Mineral Regulation 1 634 715
Mineral Policy and Promotion 1 060 2 089
Total 7 212 9 397

150
Departm
ent of Mineral Resources
AN
NU
AL R
EPORT
2017/18
DEPARTMENT OF MINERAL RESOURCES • VOTE 29NOTES TO THE ANNUAL FINANCIAL STATEMENTS for the year ended 31 March 2018
19.2 Payables not recognised2017/18 2016/17
30 days 30+ days Total TotalR’000 R’000 R’000 R’000
Listed by economic classificationGoods and services 635 – 635 846
Total 635 – 635 846
Note 2017/18 2016/17
R’000 R’000Listed by programme levelAdministration 632 194
Mine Health and Safety 3 599
Mineral Regulation – 4
Mineral Policy and Promotion – 49
Total 635 846
Note 2017/18 2016/17R’000 R’000
Included in the above totals are the following:Confirmed balances with other departments Annexure 5 8 540 1 615
Total 8 540 1 615
20. Employee benefitsNote 2017/18 2016/17
R’000 R’000Leave entitlement 26 425 25 080
Service bonus (13h cheque) 16 184 15 192
Performance awards 8 860 12 116
Capped leave commitments 5 685 5 837
Total 57 154 58 225
Included in the above leave entitlement balance are employees with a negative leave balance amounting to R505 776.55.

151
Dep
artm
ent o
f Min
eral
Reso
urce
sA
NN
UA
L R
EPO
RT
201
7/18
DEPARTMENT OF MINERAL RESOURCES • VOTE 29NOTES TO THE ANNUAL FINANCIAL STATEMENTS for the year ended 31 March 2018
21. Lease commitments
21.1 Operating leases expenditureBuildings and
other fixed structures
Machinery and
equipmentTotal
2017/18 R’000 R’000 R’000Not later than one year 20 539 3 428 23 967Later than one year and not later than five years – 3 205 3 205Total lease commitments 20 539 6 633 27 172
Buildings and other fixed structures
Machinery and
equipmentTotal
2016/17 R’000 R’000 R’000Not later than one year 40 721 249 40 970Later than one year and not later than five years – 34 34Total lease commitments 40 721 283 41 004
Note 2017/18 2016/17R’000 R’000
Rental earned on sub-leased assets 2 – 473Total – 473
22. Accrued departmental revenueNote 2017/18 2016/17
R’000 R’000Interest, dividends and rent on land 183 187 157 811
Total 183 187 157 811
22.1 Analysis of accrued departmental revenueNote 2017/18 2016/17
R’000 R’000Opening balance 157 811 128 973Less: Amounts received 23 379 23 616Add: Amounts recognised 48 755 52 454
Total 183 187 157 811

152
Departm
ent of Mineral Resources
AN
NU
AL R
EPORT
2017/18
DEPARTMENT OF MINERAL RESOURCES • VOTE 29NOTES TO THE ANNUAL FINANCIAL STATEMENTS for the year ended 31 March 2018
22.2 Impairment of accrued departmental revenueNote 2017/18 2016/17
R’000 R’000Estimate of impairment of accrued departmental revenue 88 438 67 696
Total 88 438 67 696
23. Irregular expenditure
23.1 Reconciliation of irregular expenditureNote 2017/18 2016/17
R’000 R’000Add: Irregular expenditure – relating to prior year 6 802 –
Add: Irregular expenditure – relating to current year 3 456 –
Less: Current year amounts condoned (364) –
Closing balance 9 894 –Analysis of awaiting condonation per age classification
Current year 3 092 –
Prior year 6 802 –
Total 9 894 –
23.2 Details of irregular expenditure
Incident Disciplinary steps taken/criminal proceedings2017/18
R’000Incorrect application of PPPF (used 90/10 instead of 80/20 on awarding a contract) Verbal warning and training of staff 364 Unauthorised lease contract Investigation In progress 9 894
Total 10 258
Irregular expenditure relates to the 2014/15 financial year lease payments that did not follow due process. The Department is currently investigating all the matters relating to irregular expenditure, and appropriate action will be taken upon conclusion of the investigations.
23.3 Details of irregular expenditure condoned
Incident Disciplinary steps taken/criminal proceedings2017/18
R’000Stationery contract: Incorrect classification of PPPF Condoned by National Treasury 364
Total 364

153
Dep
artm
ent o
f Min
eral
Reso
urce
sA
NN
UA
L R
EPO
RT
201
7/18
DEPARTMENT OF MINERAL RESOURCES • VOTE 29NOTES TO THE ANNUAL FINANCIAL STATEMENTS for the year ended 31 March 2018
24. Fruitless and wasteful expenditure
24.1 Reconciliation of fruitless and wasteful expenditure Note 2017/18 2016/17
R’000 R’000Fruitless and wasteful expenditure – relating to the prior year 6 135 –
Total 6 135 –
The Department identified payments made in 2014/15 for office accommodation and tenant installation in which no value was derived from the expenditure. The incident is regarded as a criminal conduct and further investigations are being conducted to determine who the responsible official is from whom the amount should be recovered for the expenditure incurred by the Department.
24.2 Analysis of awaiting resolution per economic classificationNote 2017/18 2016/17
R’000 R’000Current 1 577 –
Capital 4 558 –
Total 6 135 –
24.3 Analysis of current year’s (relating to current and prior years) fruitless and wasteful expenditure
Incident Disciplinary steps taken/criminal proceedings2017/18
R’000
Payment of office accommodation and tenant installation
The incident is regarded as criminal conduct and further investigations are being conducted to determine who the responsible official from whom the amount should be recovered for the expenditure incurred by the Department is.
6 135
Total 6 135
25. Related-party transactions
Entity Nature of related-party relationshipCouncil for Geoscience
An entity under the control of the Minister
MINTEK
South African Diamond and Precious Metals Regulator
Mine Health and Safety Council
State Diamond Trader

154
Departm
ent of Mineral Resources
AN
NU
AL R
EPORT
2017/18
DEPARTMENT OF MINERAL RESOURCES • VOTE 29NOTES TO THE ANNUAL FINANCIAL STATEMENTS for the year ended 31 March 2018
26. Key management personnel
Number of individuals
2017/18 2016/17R’000 R’000
Political office bearers 3 4 390 4 222
Level 15 to 16 8 11 110 10 564
Level 14 16 18 954 15 764
Total 34 454 30 550
27. ProvisionsNote 2017/18 2016/17
R’000 R’000Environmental liability 326 058 336 806
Long-service awards 323 186
Departmental legal cases 110 –
Total 326 491 336 992
The provision for environmental rehabilitation liability comprised derelict and ownerless mines that have been earmarked by the Department to be rehabilitated depending on the availability of funds in terms of the MTEF. Long-service awards consist of officials who are anticipated to be rewarded for long service in the public service in the next financial year. Departmental cases, based on the legal outcome, are those where there is a high probability that the Department is liable and is awaiting the final estimate to settle.
27.1 Reconciliation of movement in provisions – 2017/18Environmental
liabilityLong-service
awardsDepartmental
legal cases Total
provisionsR’000 R’000 R’000 R’000
Opening balance 336 806 186 – 336 992
Increase in provision (10 748) 138 110 (10 500)
Closing balance 326 058 324 110 326 492
Reconciliation of movement in provisions – 2016/17Environmental
liabilityLong-service
awardsTotal
provisionsR’000 R’000 R’000
Opening balance 332 647 151 332 798
Increase in provision 4 159 35 4 194
Closing balance 336 806 186 336 992

155
Dep
artm
ent o
f Min
eral
Reso
urce
sA
NN
UA
L R
EPO
RT
201
7/18
DEPARTMENT OF MINERAL RESOURCES • VOTE 29NOTES TO THE ANNUAL FINANCIAL STATEMENTS for the year ended 31 March 2018
28. Movable tangible capital assetsOpening balance Additions Disposals Closing
balanceR’000 R’000 R’000 R’000
Machinery and equipment 78 622 11 733 1 959 88 396Transport assets 5 306 1 595 – 6 901Computer equipment 35 054 7 771 1 920 40 905Furniture and office equipment 33 605 1 643 39 35 209Other machinery and equipment 4 657 724 – 5 381
Total movable tangible capital assets 78 622 11 732 1 959 88 396
28.1 Additions
CashReceived current, not
paid (paid current year, received prior year)
Total
R’000 R’000 R’000Machinery and equipment 11 615 118 11 733Transport assets 1 595 – 1 595Computer equipment 7 771 – 7 771Furniture and office equipment 1 525 118 1643Other machinery and equipment 724 – 724
Total movable tangible capital assets 11 615 118 11 733
28.2 DisposalsNon-cash disposal
Total disposals
R’000 R’000Machinery and equipment 1 959 1 959Computer equipment 1 920 1 920Furniture and office equipment 39 39
Total movable tangible capital assets 1 959 1 959

156
Departm
ent of Mineral Resources
AN
NU
AL R
EPORT
2017/18
DEPARTMENT OF MINERAL RESOURCES • VOTE 29NOTES TO THE ANNUAL FINANCIAL STATEMENTS for the year ended 31 March 2018
28.3 Movement for 2016/17
Movement in movable tangible capital assets per the Asset Register for the year ended 31 March 2018
Opening balance Additions Disposals Closing
balanceR’000 R’000 R’000 R’000
Machinery and equipment 70 788 8 077 243 78 622Transport assets 2 046 3 260 – 5 306Computer equipment 31 775 3 432 153 35 054Furniture and office equipment 32 597 1 098 90 33 605Other machinery and equipment 4 370 287 – 4 657
Total movable tangible capital assets 70 788 8 077 243 78 622
28.4 Minor assets
Movement in minor assets per the Asset Register for the year ended 31 March 2018Machinery
and equipment
Total
R’000 R’000Opening balance 16 760 16 760
Additions 1 481 1 481
Disposals 475 475
Total minor assets 17 766 17 766
Machinery and
equipmentTotal
R’000 R’000Number of minor assets at cost 10 492 10 492
Total minor assets 10 492 10 492

157
Dep
artm
ent o
f Min
eral
Reso
urce
sA
NN
UA
L R
EPO
RT
201
7/18
DEPARTMENT OF MINERAL RESOURCES • VOTE 29NOTES TO THE ANNUAL FINANCIAL STATEMENTS for the year ended 31 March 2018
Minor assets
Movement in minor assets per the Asset Register for the year ended as at 31 March 2017Machinery
and equipment
Total
R’000 R’000Opening balance 16 120 16 120
Additions 968 968
Disposals (328) (328)
Total minor assets 16 760 16 760
Machinery and
equipmentTotal
R’000 R’000Number of minor assets at cost 9 789 9 789
Total minor assets 9 789 9 789
29. Intangible capital assets
Movement in intangible capital assets per the Asset Register for the year ended 31 March 2018Opening balance Disposals Closing
balanceR’000 R’000 R’000
Software 3 321 792 4 113Total intangible capital assets 3 321 792 4 113
29.1 Additions
Additions in intangible assets per the Asset Register for the year ended 31 March 2018Cash TotalR’000 R’000
Software 792 792Total additions to intangible capital assets 792 792

158
Departm
ent of Mineral Resources
AN
NU
AL R
EPORT
2017/18
DEPARTMENT OF MINERAL RESOURCES • VOTE 29NOTES TO THE ANNUAL FINANCIAL STATEMENTS for the year ended 31 March 2018
29.2 Movement for 2016/17Opening balance Disposals Closing
balanceR’000 R’000 R’000
Software 11 030 7 709 3 321Total intangible capital assets 11 030 7 709 3 321
30. Immovable tangible capital assetsOpening balance Disposals Closing
balanceR’000 R’000 R’000
Buildings and other fixed structuresOther fixed structures 52 403 32 52 435Total immovable intangible capital assets 52 403 32 52 435
30.1 AdditionsCash TotalR’000 R’000
Building and other fixed structuresOther fixed structures 32 32Total additions to immovable tangible capital assets 32 32
30.2 Movement for 2016/17Opening balance Disposals Closing
balanceR’000 R’000 R’000
Buildings and other fixed structuresOther fixed structures 52 250 153 52 403Total immovable tangible capital assets 52 250 153 52 403
31. InventoriesNote 2017/18 2016/17
Annexure 6 R’000 R’000Opening balance 4 258Add/(Less): Adjustments to prior year balances 356 7
Add: Additions/purchases – Cash 4 348 1 500
(Less): Issues (4 493) (1 521)
Add/(Less): Adjustments 95 (240)
Closing balance 310 4

159
Dep
artm
ent o
f Min
eral
Reso
urce
sA
NN
UA
L R
EPO
RT
201
7/18
DEPARTMENT OF MINERAL RESOURCES • VOTE 29ANNEXURES TO THE ANNUAL FINANCIAL STATEMENTS for the year ended 31 March 2018
Annexure 1B: Statement of Transfers to Departmental Agencies and Accounts
DEPARTMENT/AGENCY/ACCOUNT
TRANSFER ALLOCATION TRANSFER 2016/17
Adjusted appropriation
Total available
Actual transfer
Percentage of available funds transferred
Appropriation Act
R’000 R’000 R’000 Percentage R’000Council for Geoscience 366 988 366 988 366 988 100% 378 598
South African Diamond and Precious Metal Regulator 65 865 65 865 65 865 100% 53 205
Mining Qualification Authority 1 840 1 840 1 718 93% 1 716Mine Health and Safety Council 6 162 6 162 6 162 100% –Total 440 855 440 855 440 733 – 433 519
Annexure 1D: Statement of Transfers/Subsidies to Public Corporations and Private Enterprises
NAME OF PUBLIC CORPORATION/ PRIVATE ENTERPRISE
TRANSFER ALLOCATION EXPENDITURE 2016/17
Adjusted appropriation
Total available
Actual transfer
Percentage of available funds transferred Capital Current Appropriation
ActR’000 R’000 R’000 Percentage R’000 R’000 R’000
Public corporationsMintek 367 256 367 256 367 256 100.0% 367 256 343 039 356 416State Diamond Trader – – – – – – 200Sub-total 367 256 367 256 367 256 100.0% 367 256 343 039 356 616Private enterprisesPetroleum SA 87 138 87 138 87 138 100.0% – 87 138 –Sub-total 87 138 87 138 87 138 100.0% – 87 138 –
Total 454 394 454 394 454 394 100.0% 367 256 430 177 356 616
Annexure 1G: Statement of Transfer to Households
HOUSEHOLDS
TRANSFER ALLOCATION EXPENDITURE 2016/17
Adjusted appropriation
Total available
Actual transfer
Percentage of available funds transferred
Appropriation Act
R’000 R’000 R’000 Percentage R’000Transfers – – – – –Leave gratuity (employer service benefits) 1 573 1 573 1 573 100.0% 1 059Claims against the state (cash) – – – – 2Donations and gifts (cash) 40 40 40 100.0% 120Total 1 613 1 613 1 613 – 1 181

160
Departm
ent of Mineral Resources
AN
NU
AL R
EPORT
2017/18
DEPARTMENT OF MINERAL RESOURCES • VOTE 29ANNEXURES TO THE ANNUAL FINANCIAL STATEMENTS for the year ended 31 March 2018
Annexure 1I: Statement of Aid Assistance Received
NAME OF DONORPurpose
Opening balance Paid back on/by 31 March Closing balance
R’000 R’000 R’000Received in cashEuropean Donor Transfer to Council for Geoscience 1 772 (1 772) –Total 1 772 (1 772) –
Annexure 1J: Statement of Gifts, Donations and Sponsorships Made
NATURE OF GIFT, DONATION OR SPONSORSHIP2017/18 2016/17
R’000 R’000Made in kindPayments made as an act of grace to household 40 120Total 40 120
Annexure 3B: Statement of Contingent Liabilities as at 31 March 2018
NATURE OF LIABILITY
Opening balance
1 April 2017
Liabilities paid/cancelled/reduced
during the year
Closing balance
31 March 2018 R’000 R’000 R’000 Claims against the Department
Claims against the Department 5 609 311 (5 511 844) 97 467
Subtotal 5 609 311 (5 511 844) 97 467
Environmental liability
Environmental liability 1 701 279 159 280 1 860 559
Other - 10 032 10 032
Subtotal 1 701 279 160 312 1 870 591
Total 7 310 590 5 681 156 1 968 058

161
Dep
artm
ent o
f Min
eral
Reso
urce
sA
NN
UA
L R
EPO
RT
201
7/18
DEPARTMENT OF MINERAL RESOURCES • VOTE 29ANNEXURES TO THE ANNUAL FINANCIAL STATEMENTS for the year ended 31 March 2018
Annexure 4: Claims Recoverable
GOVERNMENT ENTITY
CONFIRMED BALANCE OUTSTANDING
UNCONFIRMED BALANCE OUTSTANDING TOTAL
31/03/2018 31/03/2017 31/03/2018 31/03/2017 31/03/2018 31/03/2017R’000 R’000 R’000 R’000 R’000 R’000
DepartmentDepartment of Energy – – 1 457 1 457 1 457 1 457Northern Cape Department of Transport, Safety and Liaison – – 12 – 12
Total – – 1 469 1 457 1 469 1 457
Annexure 5: Inter-government Payables
GOVERNMENT ENTITY
CONFIRMED BALANCE OUTSTANDING
Unconfirmed balance outstanding TOTAL
31/03/2018 31/03/2017 31/03/2018 31/03/2017 31/03/2018 31/03/2017R’000 R’000 R’000 R’000 R’000 R’000
DepartmentsCurrentDepartment of Justice and Constitutional Development 343 792 – – 343 792Department of Public Works 5 888 168 2 442 – 5 888 168Gauteng Government Garage 2 301 655 – – 2 301 655Department of Social Development 8 – – – 8 –
Total 8 540 1 615 2 442 – 8 540 1 615
Annexure 6: Inventories
INVENTORY
Note Quantity 2017/18 Quantity 2016/17R’000 R’000 R’000 R’000
Opening balance 155 4 32 345 258Add/(less): Adjustments to prior-year balance 58 348 356 – 7Add: Additions/purchases – cash 94 666 4 348 8 409 1 500(Less): Issues (102 401) (4 493) (10 318) (1 521)Add/(Less): Adjustments 124 95 (30 281) (240)
Closing balance 50 892 310 155 4

162
Departm
ent of Mineral Resources
AN
NU
AL R
EPORT
2017/18
NOTES:

163
Dep
artm
ent o
f Min
eral
Reso
urce
sA
NN
UA
L R
EPO
RT
201
7/18
NOTES:


165
Dep
artm
ent o
f Min
eral
Reso
urce
sA
NN
UA
L R
EPO
RT
201
7/18
Department of Mineral Resources
Postal address Private Bag X59ARCADIA0007
Physical addresTrevenna Campus, Building 2 B&CC/o Meintjes and Francis Baard StreetSUNNYSIDE
Department of Mineral Resources | DMR_SA | Department of Mineral Resources
RP366/2018ISBN: 978-0-621-46752-9
Switchboard: (012) 444 3000Email: [email protected]: www.dmr.gov.za