Embed Size (px)
Citation preview
Gas phase thermometry of hot turbulent jets using laser induced phosphorescence
Martin Lawrence, Hua Zhao, and Lionel Ganippa*
Department of Mechanical Engineering
Brunel University,
Uxbridge, Middlesex,
UB8 3PH, UK
Abstract: The temperature distributions of heated turbulent jets of air were determined using two
dimensional (planar) laser induced phosphorescence. The jets were heated to specific temperature
increments, ranging from 300 – 850 K and several Reynolds numbers were investigated at each
temperature. The spectral ratio technique was used in conjunction with thermographic phosphors
BAM and YAG:Dy, individually. Single shot and time averaged results are presented as two
dimensional stacked images of turbulent jets. YAG:Dy did not produce a high enough signal for
single shot measurements. The results allowed for a direct comparison between BAM and YAG:Dy,
revealing that BAM is more suitable for relatively lower temperature, fast and turbulent regimes and
that YAG:Dy is more suited to relatively higher temperature, steady flow situations.
1. Introduction
Temperature measurement techniques are used throughout a wide variety of applications
from physical, to chemical and in biological processes. Laser thermometry enables in situ
measurements to be carried out with minimal disturbances and with high spatial and temporal
resolution, which is an advantage when measuring dynamic systems such as those in fluid flow and
combustion. Improving the understanding of such systems will lead to more efficient real world
solutions such as better engine designs, enhanced gas turbine aerodynamics and cleaner combustion.
Laser induced phosphorescence (LIP) is a semi-invasive, thermometry technique that uses the
temperature dependent properties of thermographic phosphors (TPs) to determine the temperature of
a system. A phosphor is a microcrystalline solid luminescent material and they are usually white in
appearance. Phosphors are thermographic if they display variations in their emission characteristics
with a change in temperature. TPs are generally made up of ceramic materials doped in rare earth
metals [1]. Each chemical exhibits different absorption and emission characteristics, with varying
temperature sensitivity and survivability capabilities, making TPs suitable for thermometry
measurements in environments from cryogenic to combustion temperatures [2].
Phosphorescence is defined as long lived luminescence which can be explained by the
radiative emission from a substance when transferring energy from an excited state to a lower energy
state. Phosphorescence differs from fluorescence as fluorescence occurs from electric dipole allowed
transitions and phosphorescence occurs from forbidden ones [3]. TPs can have their lifetimes ranging
from milliseconds to less than 1 nanosecond, making them suitable for measuring temperature in
almost any situation [4].
Both the phosphorescence emission spectra and decay lifetime are affected by temperature
variation [5]. Therefore it is possible to perform temperature measurements using two methods. The
spectral method takes the ratio of two or more bands of the emission spectrum, compared with
previously recorded calibration data, to convey the local temperature [6]. The temporal method
records the time it takes for the phosphorescent emission to decay to a negligible amount [7], where a
negligible amount is considered to be where the phosphorescence signal reaches a value similar to
that of the background level. The time constant of the decay rate is usually determined by fitting a
mono-exponential curve to the data, through which the temperature can be found when compared
with a calibration measurement. Both methods can be used for either point [8] or planar
measurements [9], achieved by using a focused laser beam or laser sheet, respectively. Planar
measurements are essential for surveying a flow field and are advantageous for combustion studies.
The LIP technique has been applied to surface temperature measurements, such as thermal
barrier coatings [10], optical access internal combustion engines [11] and gas turbine studies [12–14].
In order to carry out surface temperature measurements the TPs have to be adhered to the surface in
question. Specific adhesives are required for this, which are called binder materials, this is usually a
liquid which can be easily mixed with the TP powder and then the mixture painted onto the surface.
Surface measurements are well established and the work has been reviewed in the following review
articles [2, 4, 15]. More recently thermometry techniques using TPs have advanced from surface
measurement to droplet and spray applications [16–18], where instead of the TP powder being
attached to a surface it is suspended within a droplet of solution. This led the way for non-surface
measurements, leading to the capability of gas phase temperature measurement, where TPs are
seeded within the flow in powder form. Examples of previous studies in the gas phase include
fundamental studies of heated jet temperature distributions [19–23] and practical applications of
in-cylinder temperature measurements in engines [19, 24, 25].
LIP is a relatively simple technique with respect to the experimental setup and post
processing methodology, compared to other laser-based thermometry techniques, such as CARS,
LIF, LIGS and TLAF. The limitations in terms of speed and temperature of the technique depend on
the specific TP and therefore LIP could be applied to a wide range of surface and flow situations. TPs
provide a high signal yield, where the intensity ratio is insensitive to oxygen quenching and is very
negligibly affected by laser profile and TP concentration. Challenges that occur when using
thermographic phosphors include overcoming the stickiness of the particles and discovering an
efficient seeding method. The particles must be seeded within the flow with a sufficient enough
volume density that a significant phosphorescence signal can be detected. Low signal to noise ratio is
one of the major concerns in gas phase LIP. These challenges are discussed in more detail later on in
this paper.
This study focuses on using the spectral ratio method in conjunction with YAG:Dy and BAM
to produce gas phase planar temperature measurements of heated turbulent jets issuing into quiescent
air. Spectroscopic analyses of both phosphors were carried out in order to reveal the temperature
dependence of the phosphorescence signal. Calibrations of both phosphors were carried out
identically to the turbulent heated jet measurements. The LIP technique was applied to heated
gaseous jets, producing both averaged and single shot data for the YAG:Dy and BAM phosphors.
Temperature distributions were calculated using the data in conjunction with the calibrations and
they are presented from 300 – 850 K at different flow conditions. Finally, precision and uncertainty
evaluations are also discussed.
Figure 1. Simplified YAG:Dy3+
energy diagram, where grey arrows represent absorption of a photon
and excitation to a higher energy level, black wiggly arrows represent non-radiative de-excitation
mechanisms (phonons) and black straight arrows represent radiative de-excitation mechanisms (photons) i.e. phosphorescence.
2. Thermographic phosphors
2.1 YAG:Dy
YAG is the common name for yttrium aluminum garnet, with chemical formula Y3Al5O12.
The specific TP used in this study is Y3Al5O12:Dy, which is YAG doped in trivalent dysprosium
(Dy3+
) ions. In this work 2.5 and 10.2 µm median diameter YAG:Dy particles (QMK66/UF-X and
QMK66/N-X respectively) were used, which were provided by Phosphor Technology Ltd. YAG
crystals are widely used in solid state lasers, such as Neodymium doped YAG (Nd:YAG) lasers. The
YAG:Dy crystal structure is described as body centered cubic, with Dy3+
ions replacing Y3+
ions at
the dodecahedral Y3+
sites in the Y3Al5O12 host lattice [26]. There are three emission bands in
Dysprosium that occur from 4
I to 6
H transitions in the Dy3+
ion, see Figure 1 for details. The most
energetic of which is an electric dipole around 453 nm, due to the transition from 4
I15/2 to 6
H15/2.
This band is weak near room temperature, but intensifies significantly as temperature increases [27].
The remaining blue part of the spectrum between 460 and 500 nm is due to electronic transitions 4
F9/2 to 6
H15/2, corresponding to a magnetic dipole transition which is insensitive to crystal field
symmetry around the Dy3+
ion. The yellow emission band from 555 - 610 nm is due to electronic
transitions 4
F9/2 to 6
H13/2, relating to a forced electric dipole transition which is strongly influenced
by the surrounding environment. At a local site without inversion symmetry, the yellow emission is
dominant, however for YAG:Dy3+
there is inversion symmetry and the blue emission is prevalent
[26, 28].
Figure 2. Normalized intensity YAG:Dy emission spectra at specified temperatures after 355 nm
excitation, determined by surface measurements on a thermocouple coated in YAG:Dy using a high
temperature binder, measured in the same position as the jet temperature measurements. The
thermocouple was heated in two ways; in the hot air where temperature was varied by varying jet
temperature and in a flame where temperature was measured by moving the thermocouple around the
flame. The grey areas represent filters placed over the image doubler centered at 458 nm with a
FWHM of 10 nm and centered at 492 nm with a FWHM of 10 nm.
Increasing the temperature can affect the spectrum of rare earth ions in several ways.
Broadening of linewidth due to lattice vibrations, or phonons, which also reduce the radiative
transition lifetime via quenching, vibrational relaxation and internal conversions, represented in
Figure 1 as wiggly arrows, where the increased vibration non-radiatively relaxes the excited
electronic state. Thermal expansion of the lattice creates larger ion separation, which can lead to a
frequency shift, reducing the crystal field and reducing Stark component separation [29]. An increase
in the population of upper energy levels of the system, according to Boltzmann’s law, causes the
intensity distribution of the spectrum to change with temperature. This thermalization effect occurs
when two rare earth energy levels are relatively close to one another. It can be seen from Figure 1
that YAG:Dy displays this in its F and G energy levels, which are separated by about 1000 cm−1
.
Laser light can excite the Dy3+
ions into the F level, which undergoes fast thermal equilibrium and
can pump some of its population to the G level and phosphorescence can then be observed from both
states. At low temperatures, the G level will generally not emit phosphorescence due to very high
multiphonon relaxation rates which quench the closely spaced levels. The population of the G level
emission band rises with temperature, significantly increasing the amount of phosphorescence from
this level. Above 1800 K the phosphorescence intensity reduces below detectable limits due to large
phonon quenching rates at such high temperatures [29].
The melting point of the YAG crystal is approximately 2200 K [30]. Phosphorescence decay
time ranges from 1 ms at room temperature to an order of 1 µs at high temperatures [27]. The
survivability of the YAG:Dy phosphorescence has been investigated, where the intensity ratio was
found to be the same before and after the phosphor particles had passed through a flame front [31].
2.2 BAM
BAM is the common name for barium magnesium aluminate, with chemical formula
BaMgAl10O17. The specific TP used in this study is BaMgAl10O17:Eu, which is BAM doped in
divalent europium (Eu2+
) ions of 2.9 µm median size BAM particles (KEMK63/UF-P1) which were
provided by Phosphor Technology Ltd. BAM is widely used in display technology such as plasma
display panels [32–34]. It has a β-alumina crystal structure which is made up of spinal blocks, spaced
by conduction layers. The BAM:Eu has its barium ions in the conduction layer replaced with Eu2+
ions which activate it, producing a highly efficient broad band emission around 450 nm, due to the
transition from 4f6
5d1
to 4f7
of divalent europium ions [34, 35]. As the temperature increases the
emission band broadens and shifts towards the UV. The decay behavior of BAM is governed by
activator properties and defects in the crystal structure. Divalent europium shows quite a short decay
time in the range of 1 – 10 µs due to the 5d – 4f being spin and parity allowed. The decay time for
BAM is short, shown to be 1.17 µs at room temperature in [33]. The decay lifetime is a function of
temperature and reduces with an increase in temperature. This short lifetime makes BAM an
excellent candidate for turbulent flow visualization. It also has a high melting point of approximately
2200 K [36].
It has been reported that the BAM:Eu2+
phosphorescence signal starts to degrade when it is
heated above a temperature of about 750 K, in an air atmosphere [34, 35]. Both emission and
excitation efficiency are affected and studies show that the amount of degradation increases as
temperature increases, up to approximately 900 K. Near and above this temperature the emission
spectra changes. The blue peak around 450 nm vanishes whilst peaks between 580 and 700 nm, in
the red region becomes more prominent, with a maximum around 610 nm. This emission is
representative of the trivalent europium ion, consistent with the 4f6
intra-configurational transitions
[35], which is not considered in this study. It has been shown that when the TP is heated in a
non-oxidizing atmosphere, the emission spectrum remains almost unchanged [34]. This evidence
points to the degradation mechanism being caused by the divalent europium ion concentration
decreasing due to oxidation effects, which results in an increase in trivalent europium ions. There
also appears to be a structural variation contributing to the reduced emission around 450 nm, where
the location structure of the trivalent ions changes from β-alumina to magnetoplumbite
(EuMgAl11O19). The degradation mechanism has been reported only when BAM is heated for long
incubation times of greater than 1 hour [34, 35]. Though, it is possible that no degradation effects
will occur when BAM experiences an extreme temperature environment for a significantly shorter
period of time [21]. The survivability of the BAM signal was proven in [25], where phosphorescence
intensity is shown to be the same, prior and subsequent to a combustion event. However, the work in
[25] also disregards results above 650 K due to weak signal. The diminishing signal with an increase
in temperature is probably due to similar thermal effects as YAG:Dy, such as increased phonon
quenching rates at elevated temperatures.
Figure 3. Normalized intensity BAM emission spectra at specified temperatures after 355 nm
excitation, determined by surface measurements on a thermocouple coated in BAM using a high
temperature binder, measured in the same position as the jet temperature measurements. The
thermocouple was heated in two ways; in the hot air where temperature was varied by varying jet
temperature and in a flame where temperature was measured by moving the thermocouple around the
flame. The grey areas represent filters placed over the image doubler centered at 400 nm with a FWHM of 50 nm and centered at 458 nm with a FWHM of 10 nm.
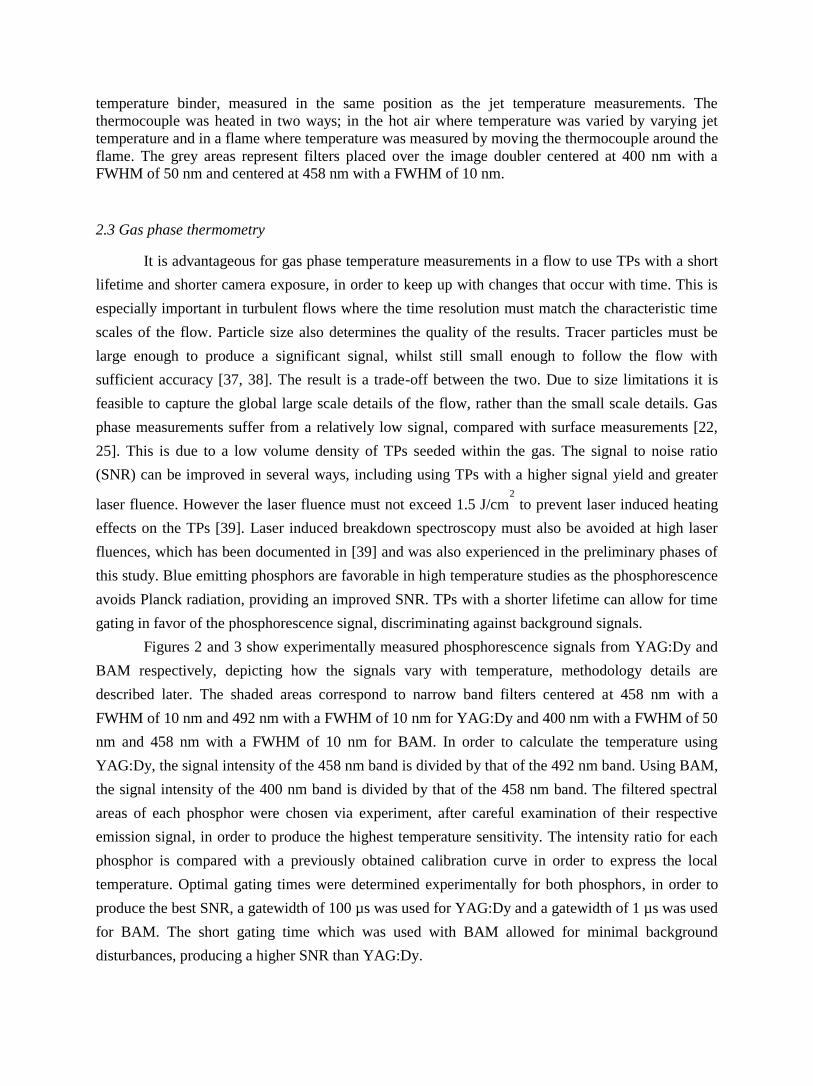
2.3 Gas phase thermometry
It is advantageous for gas phase temperature measurements in a flow to use TPs with a short
lifetime and shorter camera exposure, in order to keep up with changes that occur with time. This is
especially important in turbulent flows where the time resolution must match the characteristic time
scales of the flow. Particle size also determines the quality of the results. Tracer particles must be
large enough to produce a significant signal, whilst still small enough to follow the flow with
sufficient accuracy [37, 38]. The result is a trade-off between the two. Due to size limitations it is
feasible to capture the global large scale details of the flow, rather than the small scale details. Gas
phase measurements suffer from a relatively low signal, compared with surface measurements [22,
25]. This is due to a low volume density of TPs seeded within the gas. The signal to noise ratio
(SNR) can be improved in several ways, including using TPs with a higher signal yield and greater
laser fluence. However the laser fluence must not exceed 1.5 J/cm2
to prevent laser induced heating
effects on the TPs [39]. Laser induced breakdown spectroscopy must also be avoided at high laser
fluences, which has been documented in [39] and was also experienced in the preliminary phases of
this study. Blue emitting phosphors are favorable in high temperature studies as the phosphorescence
avoids Planck radiation, providing an improved SNR. TPs with a shorter lifetime can allow for time
gating in favor of the phosphorescence signal, discriminating against background signals.
Figures 2 and 3 show experimentally measured phosphorescence signals from YAG:Dy and
BAM respectively, depicting how the signals vary with temperature, methodology details are
described later. The shaded areas correspond to narrow band filters centered at 458 nm with a
FWHM of 10 nm and 492 nm with a FWHM of 10 nm for YAG:Dy and 400 nm with a FWHM of 50
nm and 458 nm with a FWHM of 10 nm for BAM. In order to calculate the temperature using
YAG:Dy, the signal intensity of the 458 nm band is divided by that of the 492 nm band. Using BAM,
the signal intensity of the 400 nm band is divided by that of the 458 nm band. The filtered spectral
areas of each phosphor were chosen via experiment, after careful examination of their respective
emission signal, in order to produce the highest temperature sensitivity. The intensity ratio for each
phosphor is compared with a previously obtained calibration curve in order to express the local
temperature. Optimal gating times were determined experimentally for both phosphors, in order to
produce the best SNR, a gatewidth of 100 µs was used for YAG:Dy and a gatewidth of 1 µs was used
for BAM. The short gating time which was used with BAM allowed for minimal background
disturbances, producing a higher SNR than YAG:Dy.
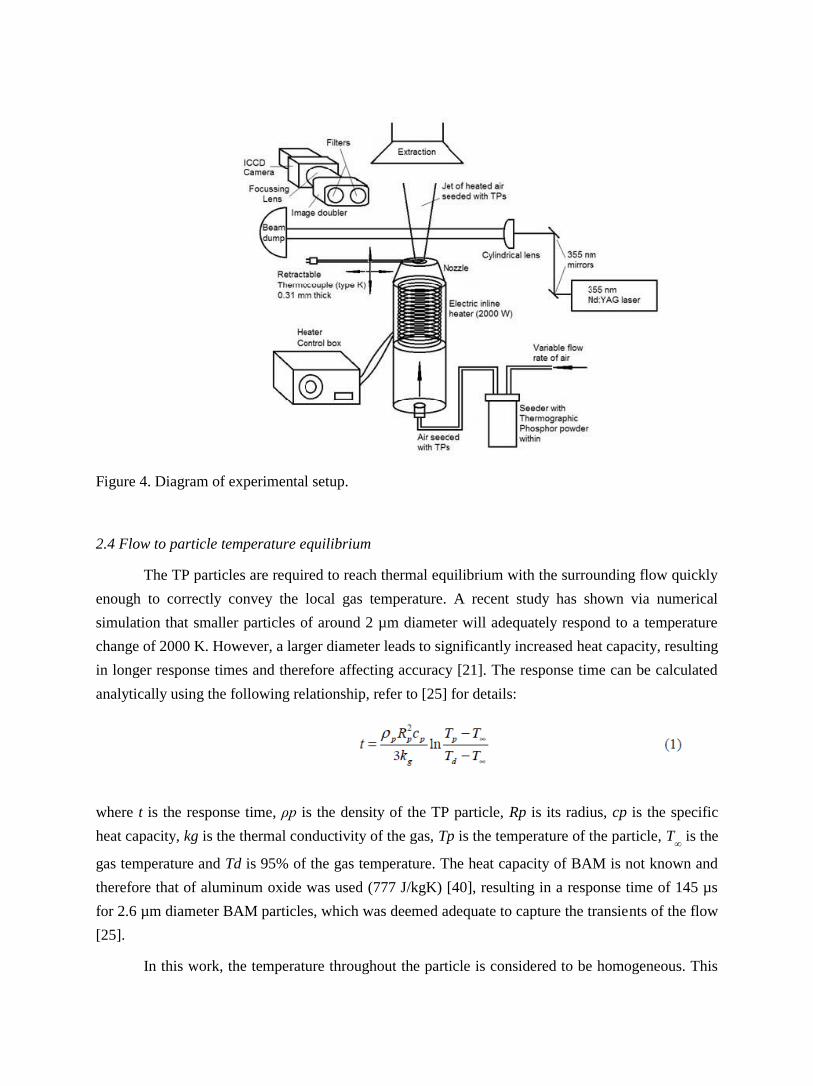
Figure 4. Diagram of experimental setup.
2.4 Flow to particle temperature equilibrium
The TP particles are required to reach thermal equilibrium with the surrounding flow quickly
enough to correctly convey the local gas temperature. A recent study has shown via numerical
simulation that smaller particles of around 2 µm diameter will adequately respond to a temperature
change of 2000 K. However, a larger diameter leads to significantly increased heat capacity, resulting
in longer response times and therefore affecting accuracy [21]. The response time can be calculated
analytically using the following relationship, refer to [25] for details:
where t is the response time, ρp is the density of the TP particle, Rp is its radius, cp is the specific
heat capacity, kg is the thermal conductivity of the gas, Tp is the temperature of the particle, T∞ is the
gas temperature and Td is 95% of the gas temperature. The heat capacity of BAM is not known and
therefore that of aluminum oxide was used (777 J/kgK) [40], resulting in a response time of 145 µs
for 2.6 µm diameter BAM particles, which was deemed adequate to capture the transients of the flow
[25].
In this work, the temperature throughout the particle is considered to be homogeneous. This
due to the thermal conductivities of both phosphors being several orders of magnitude higher than the
surrounding medium (kBAM = 24.2 W/mK, kYAG = 14 W/mK, kair,300 K = 0.026 W/mK kair,800 K
= 0.057 W/mK). The same procedure for calculating the response time of the phosphors was used as
explained above. The values are set to kg = 0.0415 W/mK (mid way between kair,300 K and kair,800
K) with a maximum temperature T∞ = 850 K. The densities of
BAM and YAG:Dy are 3700 and 4550 kg/m3
respectively and the cp of undoped YAG
crystal is known to be 590 J/kgK [41]. The cp used for the BAM calculation was also that of
aluminum oxide. The response time for the 2.9 µm BAM particles was 124 µs and the 2.5 µm
YAG:Dy was 86 µs, which were deemed acceptable for conveying temperature with sufficient
accuracy. The larger 10.2 µm YAG:Dy particles showed a 1.4 ms response time which means that
they would produce less accurate results.
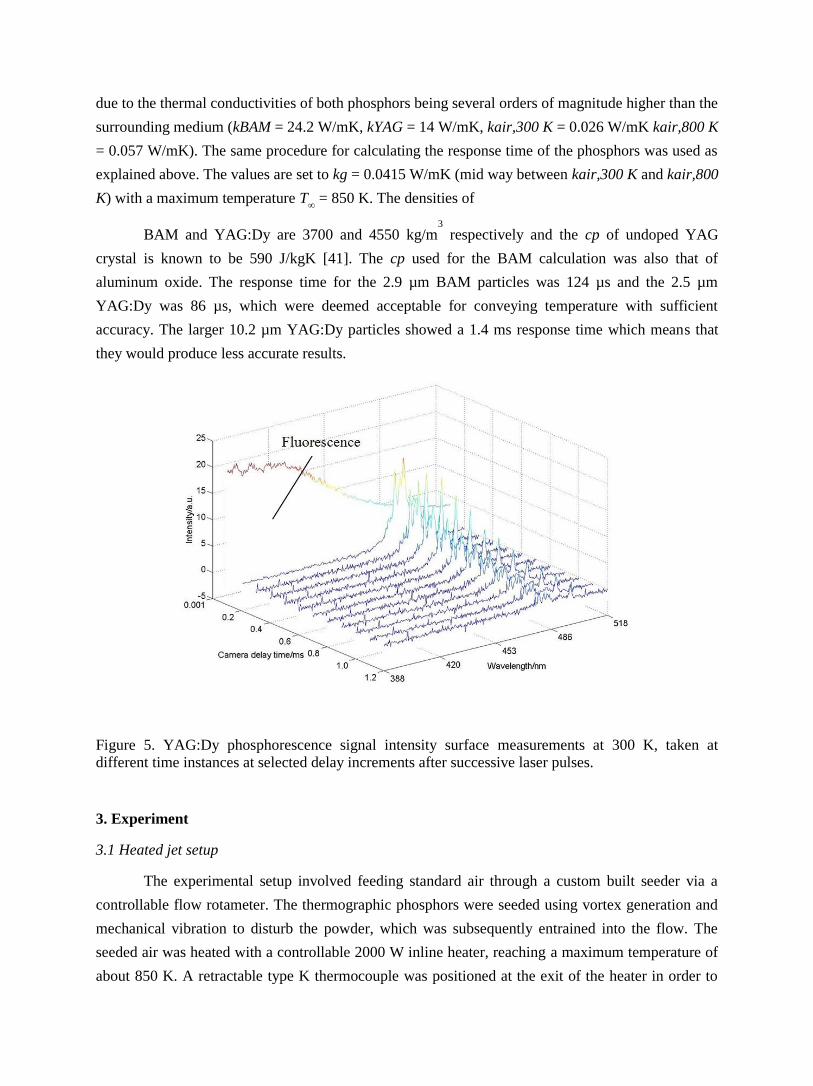
Figure 5. YAG:Dy phosphorescence signal intensity surface measurements at 300 K, taken at different time instances at selected delay increments after successive laser pulses.
3. Experiment
3.1 Heated jet setup
The experimental setup involved feeding standard air through a custom built seeder via a
controllable flow rotameter. The thermographic phosphors were seeded using vortex generation and
mechanical vibration to disturb the powder, which was subsequently entrained into the flow. The
seeded air was heated with a controllable 2000 W inline heater, reaching a maximum temperature of
about 850 K. A retractable type K thermocouple was positioned at the exit of the heater in order to
verify the flow temperature. Figure 4 shows a diagram of the entire setup. The thermocouple was
removed during phosphor thermometry measurements and replaced immediately after to verify flow
temperature.
A free turbulent jet issuing into quiescent air was produced, where the Reynolds number was
varied by changing the flow rate or altering the exit nozzle geometry. For time-averaged shots, steep
gradient flow restrictors with 2.1, 4.2 and 8.4 mm sized diameters were used to generate turbulent
jets, with Reynolds numbers of 10,000, 5,000 and 2,500 respectively. For single shot measurements,
the larger 8.4 mm diameter nozzle was used in an attempt to improve resolution and the Reynolds
number was varied by changing the airflow rate. Flow rates of 10, 15 and 18 l/min were used,
producing Reynolds numbers of 1,650, 2,500 and 3,000 respectively. Increasing the flow rate caused
a higher phosphor seeding density within the flow, due to increased turbulence within the seeder. The
seeding method produced relatively high density seeding at such low flow rates, compared with
commercially available aerosol generators.
The stickiness of the particles has been addressed in previous studies [25, 39]. This property
can become a problem in applied optical engine studies where the phosphors can coat the internal
surfaces including the optical window and it is shown that using TPs with a transparent, anti-stick
coating would reduce the degree of stickiness [25]. The phosphors used herein were uncoated and the
smaller 2.5 µm YAG:Dy and 2.9 µm BAM particles tend to stick significantly more than the larger
10.2 µm YAG:Dy particles. This was denoted by the difficulty of seeding of the smaller particles,
compared with the larger ones. A higher seeding density could be achieved at lower flow rates using
the larger YAG:Dy phosphors.
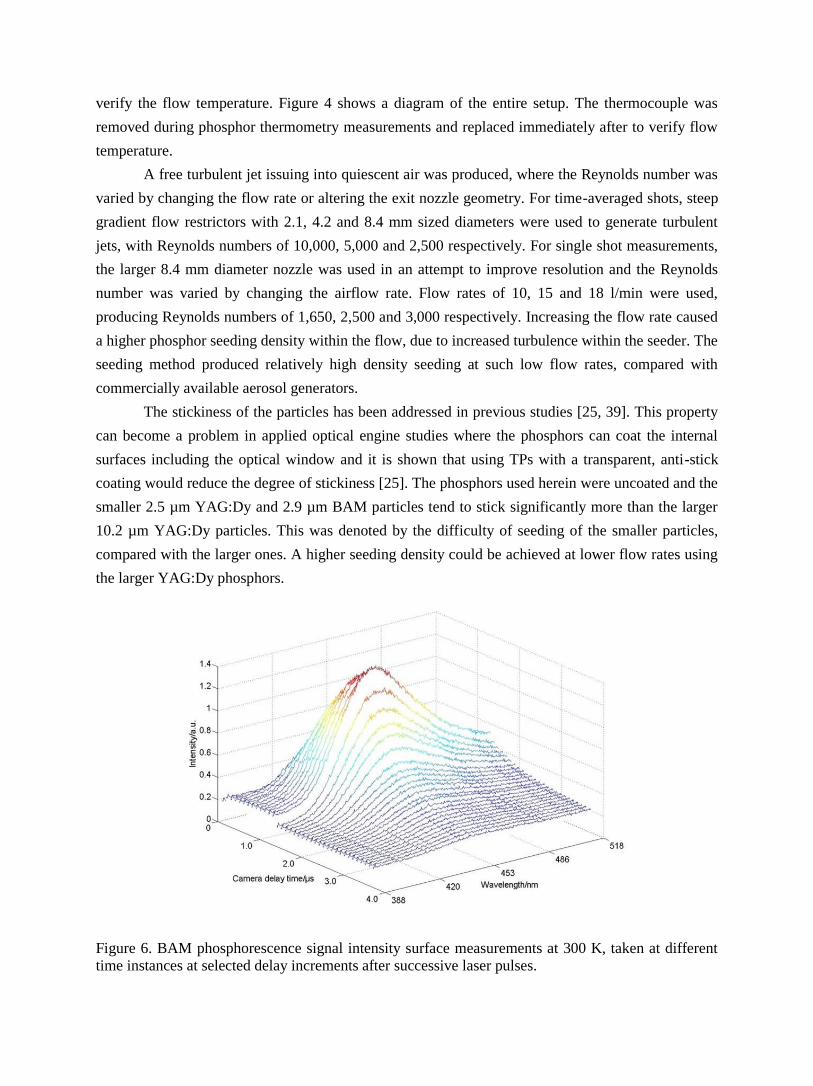
Figure 6. BAM phosphorescence signal intensity surface measurements at 300 K, taken at different time instances at selected delay increments after successive laser pulses.
3.2 Optical setup
Both BAM and YAG:Dy were excited with the third harmonic of a Continuum Surelite II
solid state, neodymium doped YAG (Nd:YAG) laser, operated at 10 Hz, using a pulse energy of 20
mJ, for subsequent phosphorescent emission. The laser beam was guided using high reflectivity 355
nm mirrors (99.75% at AOI 45°). Spectral measurements were acquired by focussing the laser beam
with a spherical lens and two dimensional measurements were carried out by transforming the beam
into a sheet with a cylindrical lens. The laser sheet was 0.5 mm wide and 12 mm high for the
accumulated measurements and 0.5 mm wide and 32 mm high for single shot measurements,
producing laser fluences of 0.333 and 0.125 J/cm2
respectively. Both laser sheets were chopped at the
extremities, leaving heights of 10 and 30 mm. The phosphorescence emission was focused by a 50
mm Nikkor lens and collected by an Andor Instaspec V ICCD camera through an image doubler
from LaVision. High efficiency filters (>90%), corresponding to the individual TP, were placed over
the image doubler. Great care was taken to ensure both parts of the image were the same, through
alignment and flat fielding. The camera and laser pulse were synchronized using a Stanford Research
DG645 delay generator and were controlled by image acquisition software. Spectra were measured at
a maximum of 10 Hz and for 2d spectral filtered images, approximately 7 shots per min were
acquired. A short delay had to be incurred due to fluorescence interference after laser excitation,
which will be discussed in more detail later. Spectral measurements were taken using an imaging
spectrograph, 1/8 m, Oriel MS127i, model 77480, with a single grating of 600 lines/mm, combined
with the ICCD camera. The entrance slit width was 50 µm, providing a spectral resolution of less
than 1 nm.
It was necessary to correct the phosphorescence images for background interferences prior to
processing. This was done using the image acquisition software as part of the acquisition process.
Preceding phosphorescence signal acquisition, images of the darkened room were taken, which were
then subtracted from the signal on a pixel-by-pixel basis. This would reduce excess noise signals, as
well as the dark current produced by the ICCD camera itself. The background corrected images
underwent flat fielding using MATLAB to overlay the images for pixel-by-pixel division of the
respective emission band intensities. A white light combined with a light box was used to create a
uniformly illuminated field for pixel correction. A Gaussian filter of the same size as each image was
applied to the images prior to division in order to smooth out fluctuations. Spatial alignment of the
images was achieved by capturing a reference image of a grid with symbols, which was positioned in
place of the jet. This allowed for exact image mapping in both x and y directions.
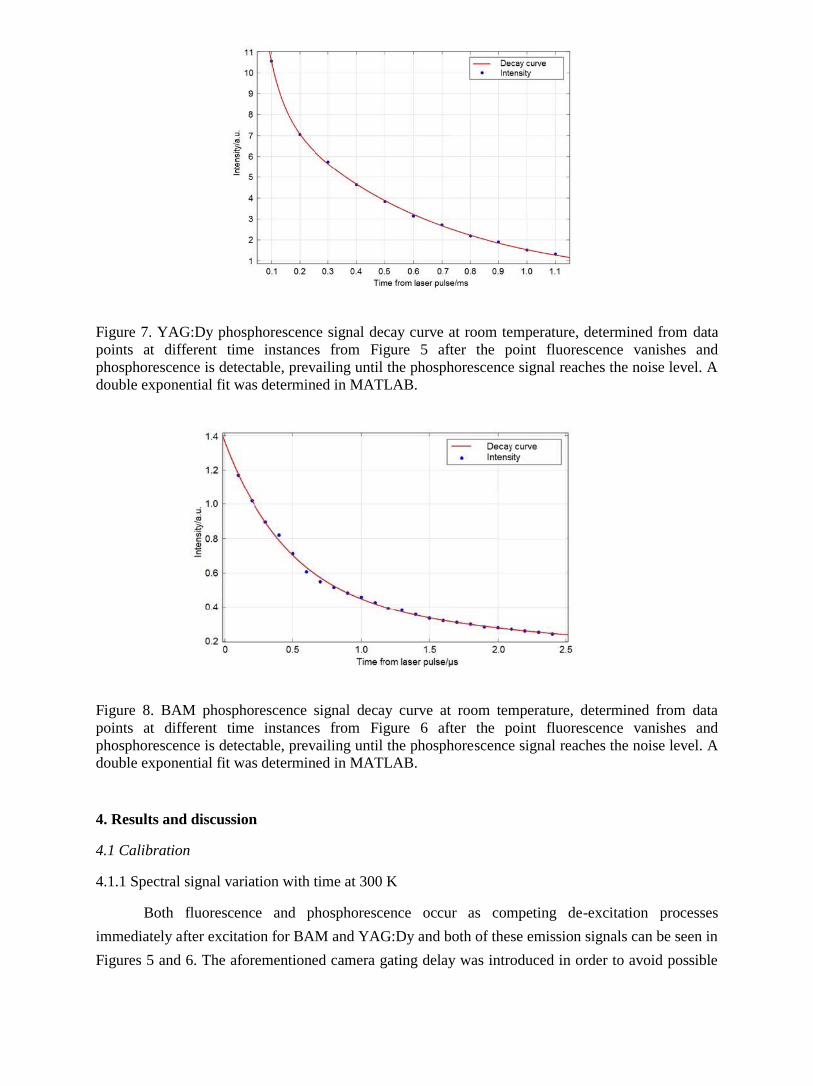
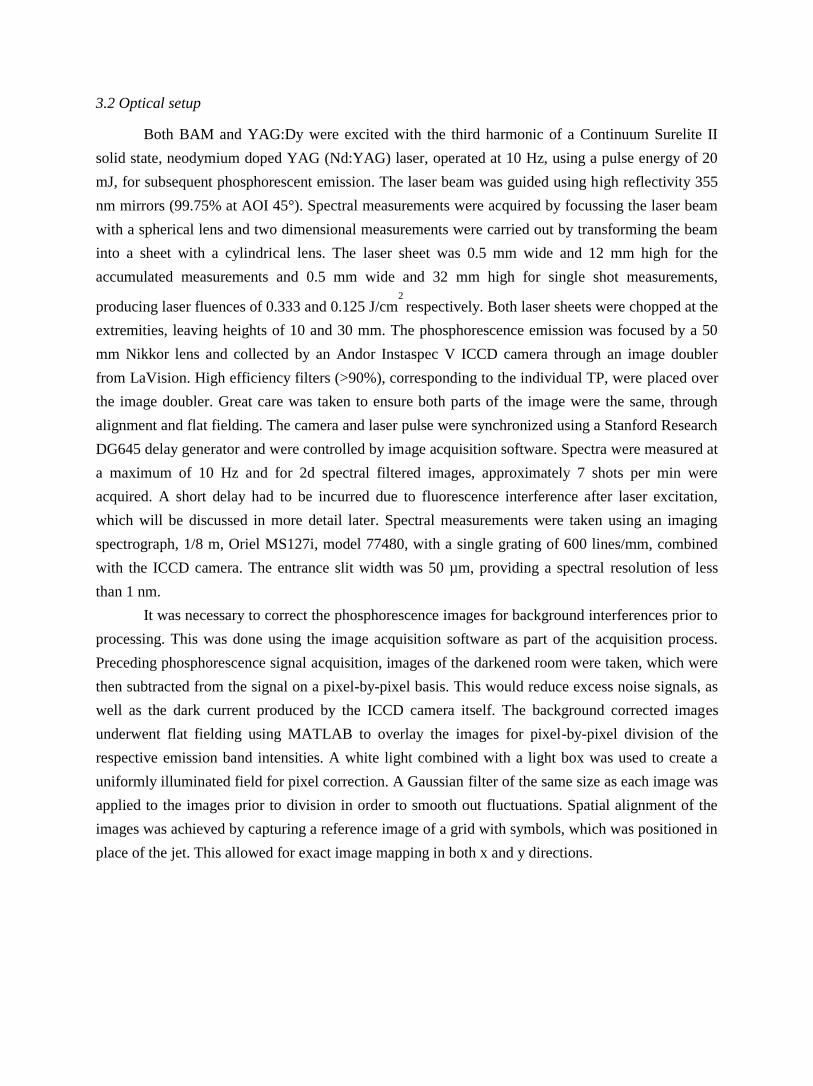
Figure 7. YAG:Dy phosphorescence signal decay curve at room temperature, determined from data
points at different time instances from Figure 5 after the point fluorescence vanishes and
phosphorescence is detectable, prevailing until the phosphorescence signal reaches the noise level. A
double exponential fit was determined in MATLAB.
Figure 8. BAM phosphorescence signal decay curve at room temperature, determined from data
points at different time instances from Figure 6 after the point fluorescence vanishes and
phosphorescence is detectable, prevailing until the phosphorescence signal reaches the noise level. A double exponential fit was determined in MATLAB.
4. Results and discussion
4.1 Calibration
4.1.1 Spectral signal variation with time at 300 K
Both fluorescence and phosphorescence occur as competing de-excitation processes
immediately after excitation for BAM and YAG:Dy and both of these emission signals can be seen in
Figures 5 and 6. The aforementioned camera gating delay was introduced in order to avoid possible
interference from fluorescence signals, which occur in much shorter timeframes than
phosphorescence. Figures 5 and 6 show the entire emission spectra at different time instances, for
YAG:Dy and BAM respectively, at selected delay increments of detection after successive laser
pulses. The YAG:Dy timescale is in milliseconds, whilst the BAM timescale is in microseconds due
to the phosphorescence lifetime variations, allowing Figure 6 to more accurately convey the
fluorescence lifetime, compared with Figure 5. The figure shows fluorescence prevailing up to 1 µs
after the laser pulse and therefore this timing was used for the camera gating delay. Phosphorescence
emission lifetime reduces with an increase in temperature and no fluorescence signal was present at
higher temperatures using these timings and therefore the fluorescence signal lifetime is expected to
remain constant or reduce with an increase in temperature. Figures 7 and 8 show the
phosphorescence decay lifetime at room temperature, translated from their respective emission
histories, beginning after the fluorescence signal disappears, showing YAG:Dy to last for 1.1 ms and
BAM approximately 2.5 µs. Both phosphors have double exponential curves fitted to their respective
decay rate which confirmed the observations of [33]. Normally a single exponent is used for
temporal method temperature measurements, however in this study the spectral method was used and
the nature of the decay signal was not considered. The lifetime of BAM could be different to that
shown in [33] due to experimental and methodological differences, such as dopant concentration, TP
synthesis procedure, excitation and detection equipment, and detection procedure. In this work the
phosphorescence lifetimes were used to determine the optimal camera gating times by comparing the
spectral emission intensities measured with the spectrograph at various gatewidths.
4.1.2 Spectral signal variation with temperature
It was essential to carry out the calibration measurements for both phosphors in the same
position and with the same optical equipment as the gas phase results, in order to minimise
systematic errors which can occur from moving optical equipment [42]. Calibrations were carried out
for each TP individually. The calibration procedure involved heating a type K thermocouple with
0.31 mm diameter using two heating methods. The thermocouple was coated with the individual TP
using an Omega CC high temperature binder. Care was taken to ensure TP-binder layer of minimal
thickness was applied, ensuring that the thermocouple and TP temperature matched as closely as
possible. A TP-binder layer thickness of 0.03 mm was measured by taking wire thickness
measurements before and after application, using a micrometer.
For temperatures ranging from 300 to 850 K, the hot jet of air produced by the heater was
used to heat the thermocouple and for higher temperatures a flame was used to heat the thermocouple
from 500 to 1300 K. The thermocouple was moved to different locations within the flame in order to
vary its temperature for the calibration measurements. The flame signal had to be subtracted from the
phosphorescence signal and this was done in the same way as the background correction in other
measurements. The phosphorescence signal was much stronger than the flame incandescence for
surface measurements. The background image in this case was the thermocouple positioned within
the flame. A stable, laminar premixed flame was used that remained consistent throughout the
measurement process.
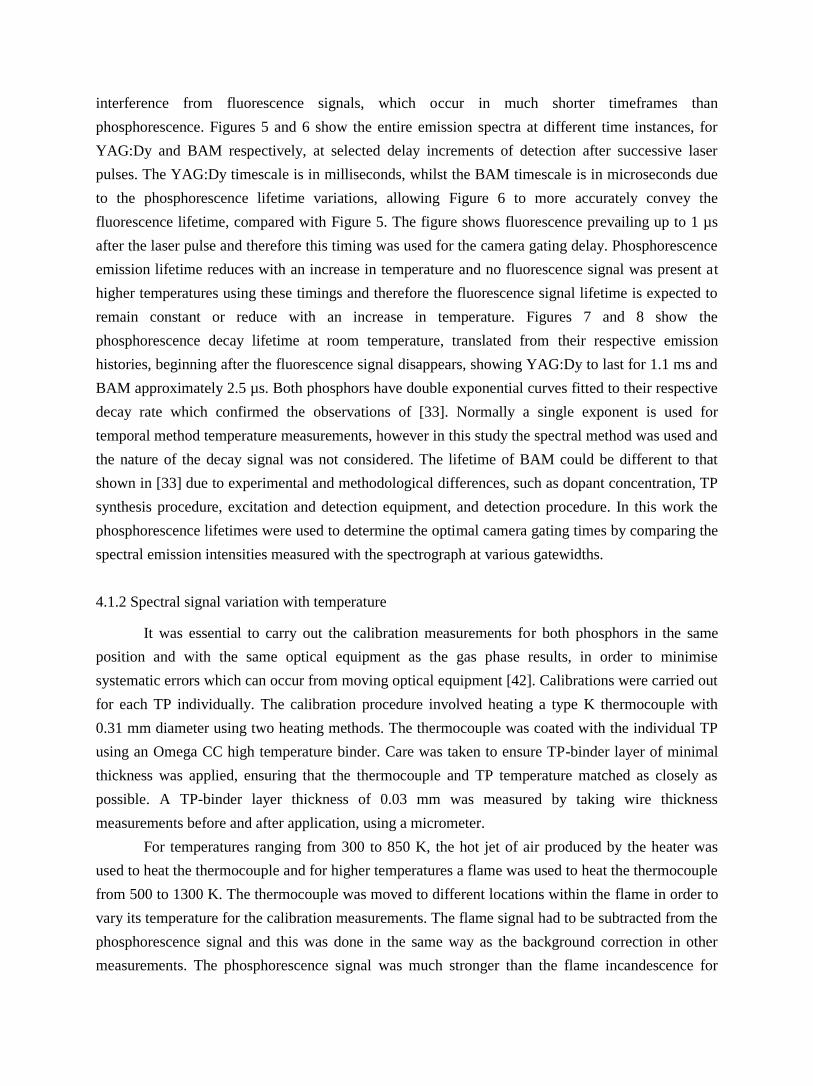
Figure 9. YAG:Dy calibration curve determined from surface measurements of a thermocouple
heated to specified set temperatures by dividing the 458 nm filtered emission region by the 492 nm
filtered emission region at each temperature.
Figure 10. BAM calibration curve determined from surface measurements of a thermocouple heated
to specified set temperatures by dividing the 400 nm filtered emission region by the 458 nm filtered
emission region at each temperature.
Figures 9 and 10 show the calibration curves for YAG:Dy and BAM respectively, as
measured experimentally. The calibration was carried out with and without the spectrograph,
conveying a very similar intensity ratio to temperature relation, with small differences induced by
changing the optical equipment. The calibration curves produced for the respective phosphors using
both heating methods were almost identical within the overlapping temperature range, revealing that
the flame method did not incur any significant errors due to flame incandescence background
correction. The phosphorescence emission spectrum was found to be fluence independent within the
fluence range tested in this study
4.1.3 Signal intensity variation with temperature
Figure 9 shows the YAG:Dy calibration curve up to 1300 K, where the phosphorescence
signal starts to diminish. The upper limit of detection varies from study to study, from 1300 K [31],
to almost 1600 K [19, 24], to 1800 K [29], to around 2000 K [27], where the discrepancies could be
due to the differences in experimental setup, such as optical equipment and calibration technique.
Specifically, in [31] a small particle diameter of 1.8 µm was used, which could have resulted in lower
recorded phosphorescence intensity. The work in [19] and [24] uses the same calibration method,
involving 4 µm sized particles, using fibres to focus the laser beam and for emission collection, along
with an ICCD device coupled with a photomultiplier tube. These factors could all contribute to the
high SNR. The study in [29] specifies a doping concentration of 3%, which could be a factor
contributing to relatively higher emission, along with the usage of relatively large particle sizes 10 –
100 µm. In [27] the TPs were in powder form, therefore maximum volume density was used. The
lifetime method was used with different percentage doping levels, which affected the
phosphorescence signal intensity.
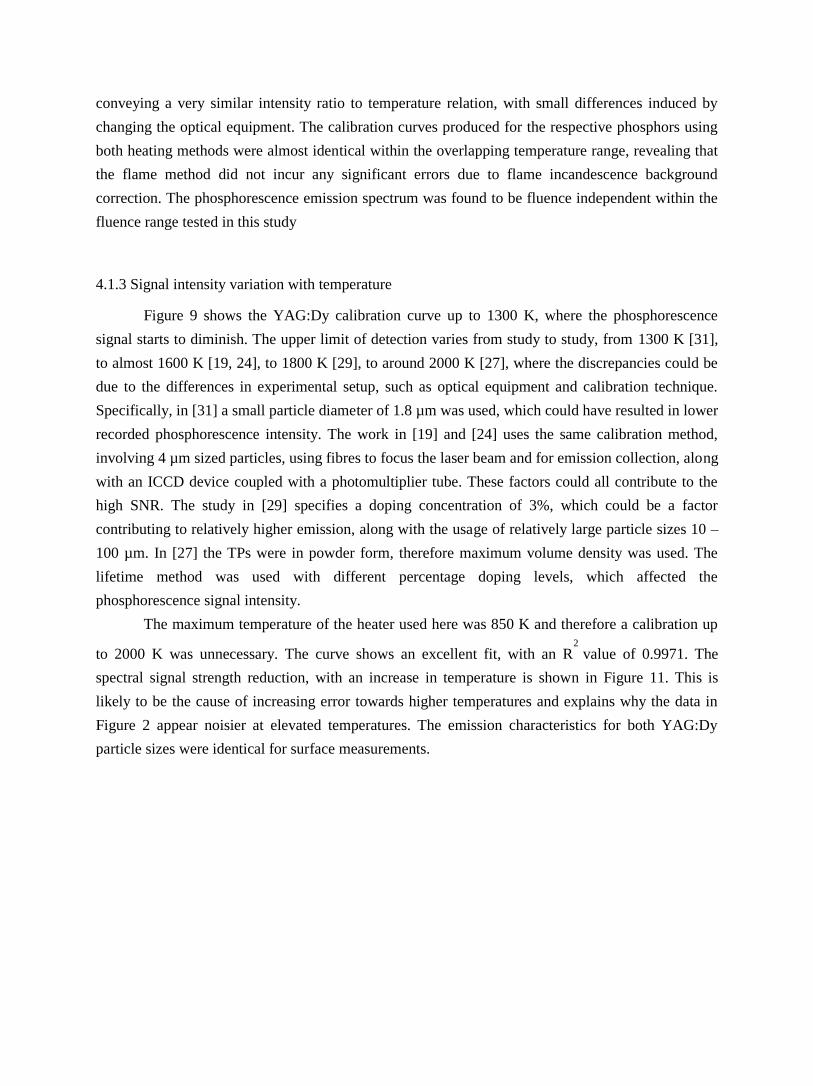
The maximum temperature of the heater used here was 850 K and therefore a calibration up
to 2000 K was unnecessary. The curve shows an excellent fit, with an R2
value of 0.9971. The
spectral signal strength reduction, with an increase in temperature is shown in Figure 11. This is
likely to be the cause of increasing error towards higher temperatures and explains why the data in
Figure 2 appear noisier at elevated temperatures. The emission characteristics for both YAG:Dy
particle sizes were identical for surface measurements.
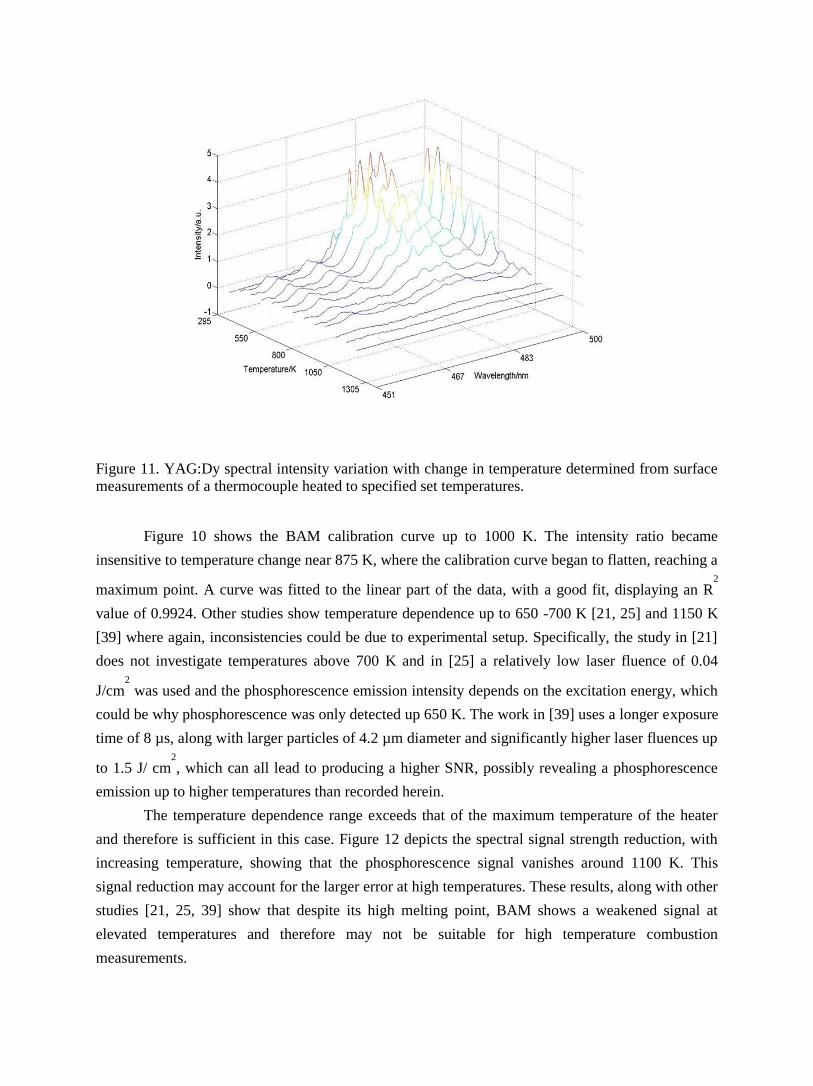
Figure 11. YAG:Dy spectral intensity variation with change in temperature determined from surface measurements of a thermocouple heated to specified set temperatures.
Figure 10 shows the BAM calibration curve up to 1000 K. The intensity ratio became
insensitive to temperature change near 875 K, where the calibration curve began to flatten, reaching a
maximum point. A curve was fitted to the linear part of the data, with a good fit, displaying an R2
value of 0.9924. Other studies show temperature dependence up to 650 -700 K [21, 25] and 1150 K
[39] where again, inconsistencies could be due to experimental setup. Specifically, the study in [21]
does not investigate temperatures above 700 K and in [25] a relatively low laser fluence of 0.04
J/cm2
was used and the phosphorescence emission intensity depends on the excitation energy, which
could be why phosphorescence was only detected up 650 K. The work in [39] uses a longer exposure
time of 8 µs, along with larger particles of 4.2 µm diameter and significantly higher laser fluences up
to 1.5 J/ cm2
, which can all lead to producing a higher SNR, possibly revealing a phosphorescence
emission up to higher temperatures than recorded herein.
The temperature dependence range exceeds that of the maximum temperature of the heater
and therefore is sufficient in this case. Figure 12 depicts the spectral signal strength reduction, with
increasing temperature, showing that the phosphorescence signal vanishes around 1100 K. This
signal reduction may account for the larger error at high temperatures. These results, along with other
studies [21, 25, 39] show that despite its high melting point, BAM shows a weakened signal at
elevated temperatures and therefore may not be suitable for high temperature combustion
measurements.
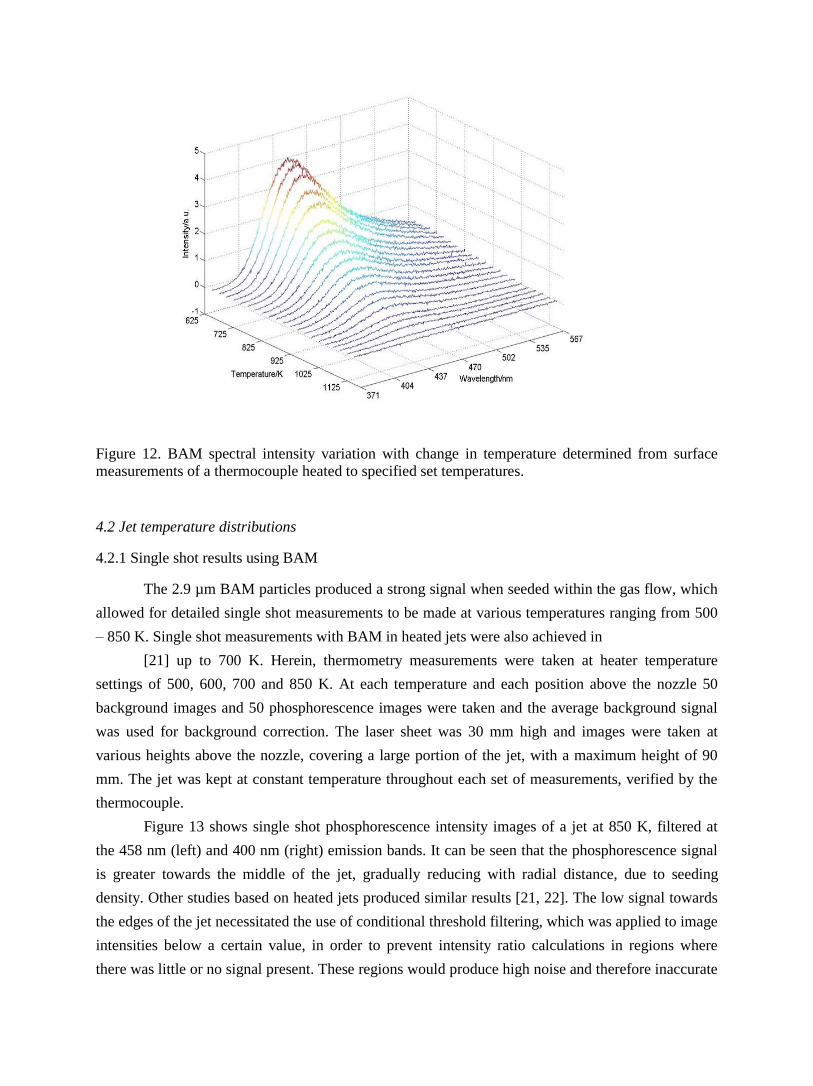
Figure 12. BAM spectral intensity variation with change in temperature determined from surface measurements of a thermocouple heated to specified set temperatures.
4.2 Jet temperature distributions
4.2.1 Single shot results using BAM
The 2.9 µm BAM particles produced a strong signal when seeded within the gas flow, which
allowed for detailed single shot measurements to be made at various temperatures ranging from 500
– 850 K. Single shot measurements with BAM in heated jets were also achieved in
[21] up to 700 K. Herein, thermometry measurements were taken at heater temperature
settings of 500, 600, 700 and 850 K. At each temperature and each position above the nozzle 50
background images and 50 phosphorescence images were taken and the average background signal
was used for background correction. The laser sheet was 30 mm high and images were taken at
various heights above the nozzle, covering a large portion of the jet, with a maximum height of 90
mm. The jet was kept at constant temperature throughout each set of measurements, verified by the
thermocouple.
Figure 13 shows single shot phosphorescence intensity images of a jet at 850 K, filtered at
the 458 nm (left) and 400 nm (right) emission bands. It can be seen that the phosphorescence signal
is greater towards the middle of the jet, gradually reducing with radial distance, due to seeding
density. Other studies based on heated jets produced similar results [21, 22]. The low signal towards
the edges of the jet necessitated the use of conditional threshold filtering, which was applied to image
intensities below a certain value, in order to prevent intensity ratio calculations in regions where
there was little or no signal present. These regions would produce high noise and therefore inaccurate
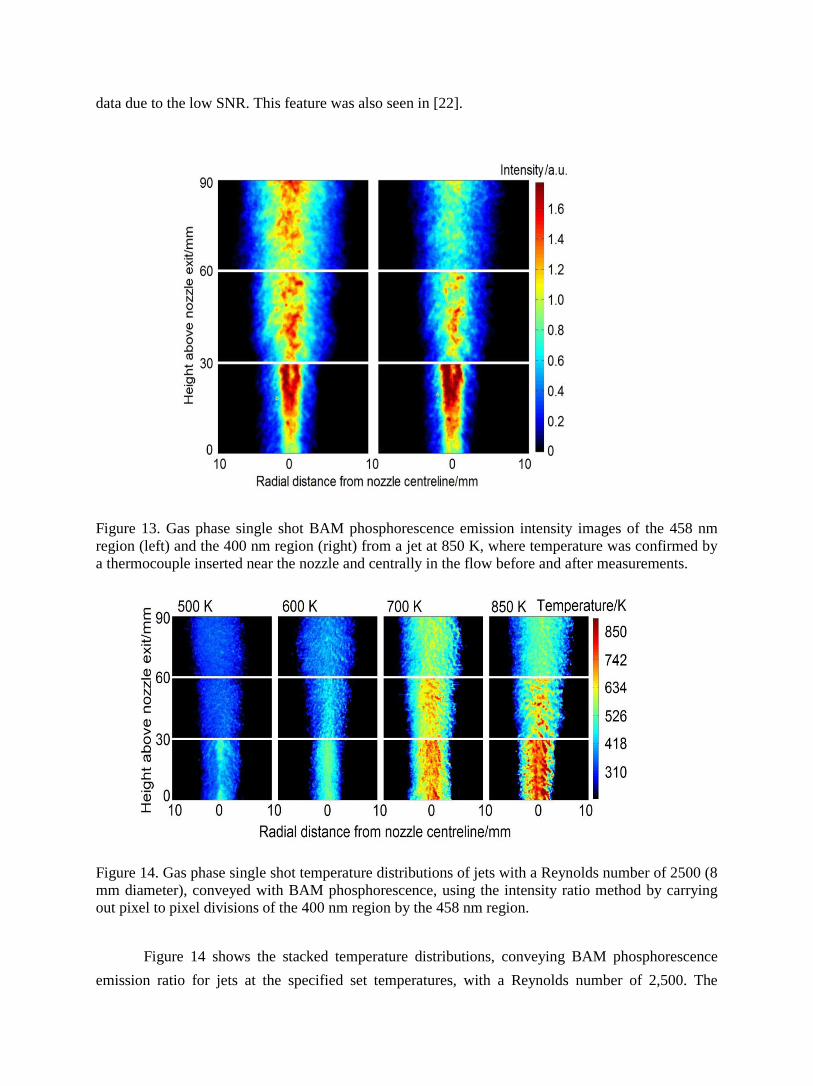
data due to the low SNR. This feature was also seen in [22].
Figure 13. Gas phase single shot BAM phosphorescence emission intensity images of the 458 nm
region (left) and the 400 nm region (right) from a jet at 850 K, where temperature was confirmed by
a thermocouple inserted near the nozzle and centrally in the flow before and after measurements.
Figure 14. Gas phase single shot temperature distributions of jets with a Reynolds number of 2500 (8
mm diameter), conveyed with BAM phosphorescence, using the intensity ratio method by carrying out pixel to pixel divisions of the 400 nm region by the 458 nm region.
Figure 14 shows the stacked temperature distributions, conveying BAM phosphorescence
emission ratio for jets at the specified set temperatures, with a Reynolds number of 2,500. The
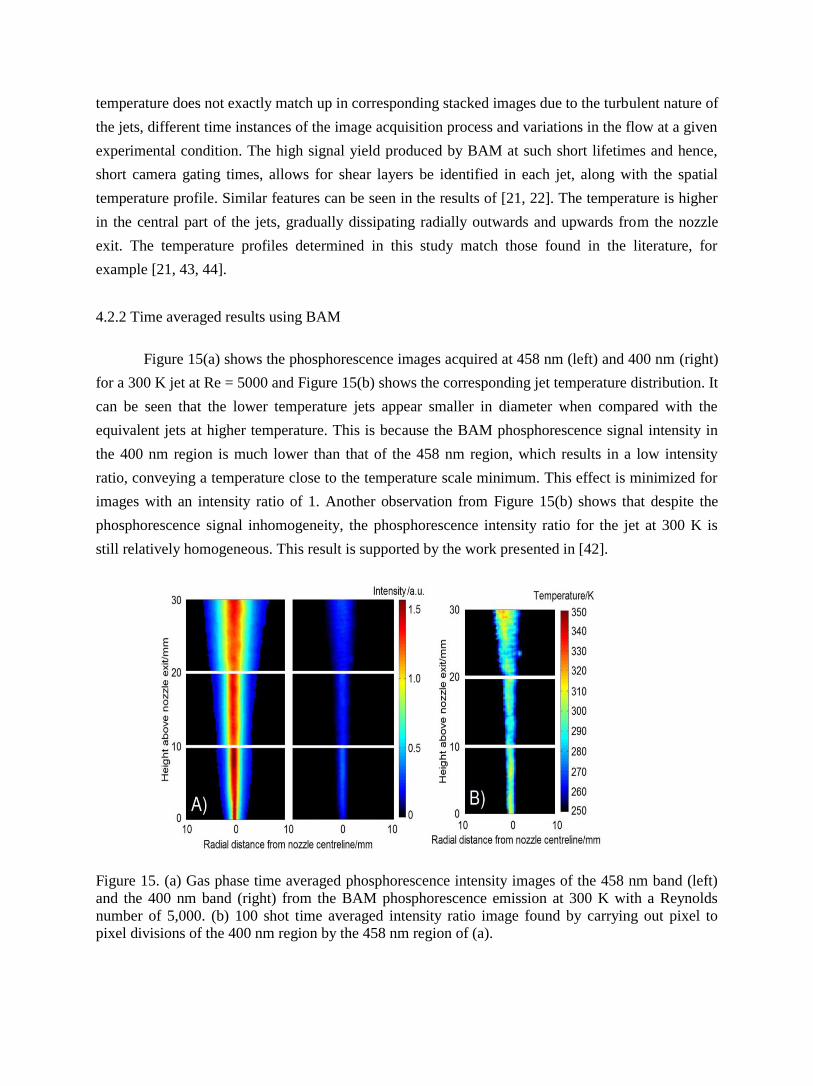
temperature does not exactly match up in corresponding stacked images due to the turbulent nature of
the jets, different time instances of the image acquisition process and variations in the flow at a given
experimental condition. The high signal yield produced by BAM at such short lifetimes and hence,
short camera gating times, allows for shear layers be identified in each jet, along with the spatial
temperature profile. Similar features can be seen in the results of [21, 22]. The temperature is higher
in the central part of the jets, gradually dissipating radially outwards and upwards from the nozzle
exit. The temperature profiles determined in this study match those found in the literature, for
example [21, 43, 44].
4.2.2 Time averaged results using BAM
Figure 15(a) shows the phosphorescence images acquired at 458 nm (left) and 400 nm (right)
for a 300 K jet at Re = 5000 and Figure 15(b) shows the corresponding jet temperature distribution. It
can be seen that the lower temperature jets appear smaller in diameter when compared with the
equivalent jets at higher temperature. This is because the BAM phosphorescence signal intensity in
the 400 nm region is much lower than that of the 458 nm region, which results in a low intensity
ratio, conveying a temperature close to the temperature scale minimum. This effect is minimized for
images with an intensity ratio of 1. Another observation from Figure 15(b) shows that despite the
phosphorescence signal inhomogeneity, the phosphorescence intensity ratio for the jet at 300 K is
still relatively homogeneous. This result is supported by the work presented in [42].
Figure 15. (a) Gas phase time averaged phosphorescence intensity images of the 458 nm band (left)
and the 400 nm band (right) from the BAM phosphorescence emission at 300 K with a Reynolds
number of 5,000. (b) 100 shot time averaged intensity ratio image found by carrying out pixel to pixel divisions of the 400 nm region by the 458 nm region of (a).
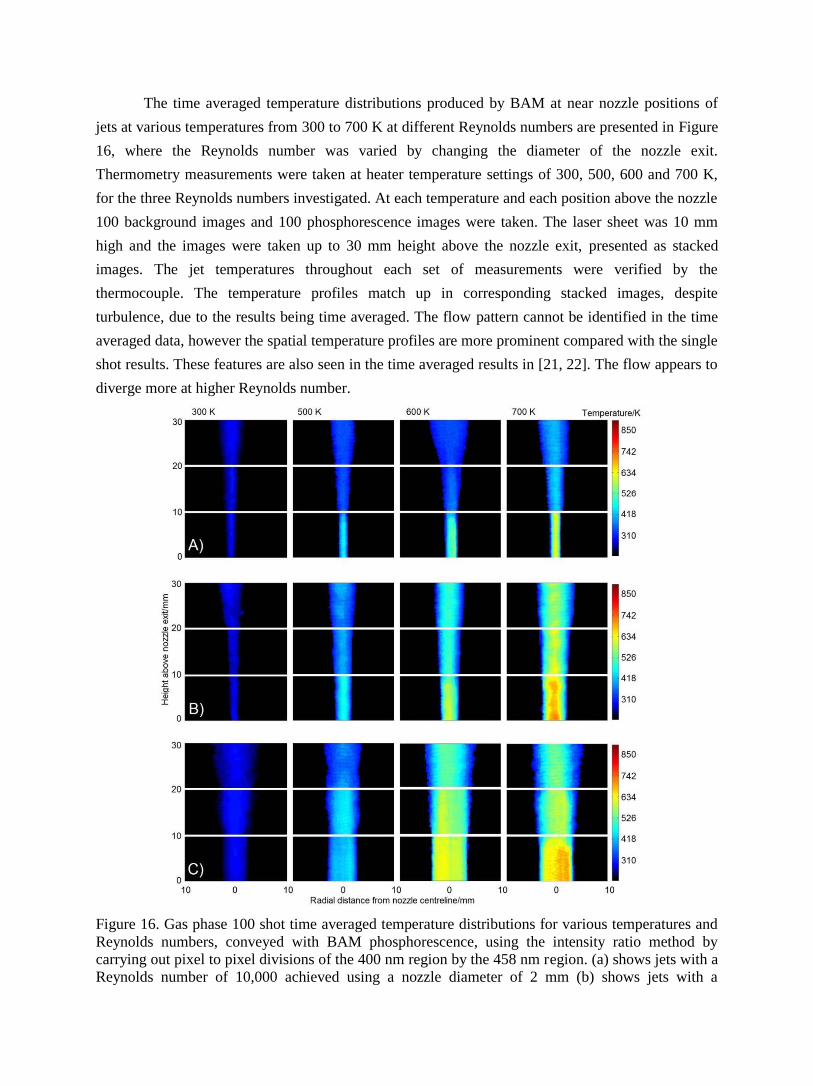
The time averaged temperature distributions produced by BAM at near nozzle positions of
jets at various temperatures from 300 to 700 K at different Reynolds numbers are presented in Figure
16, where the Reynolds number was varied by changing the diameter of the nozzle exit.
Thermometry measurements were taken at heater temperature settings of 300, 500, 600 and 700 K,
for the three Reynolds numbers investigated. At each temperature and each position above the nozzle
100 background images and 100 phosphorescence images were taken. The laser sheet was 10 mm
high and the images were taken up to 30 mm height above the nozzle exit, presented as stacked
images. The jet temperatures throughout each set of measurements were verified by the
thermocouple. The temperature profiles match up in corresponding stacked images, despite
turbulence, due to the results being time averaged. The flow pattern cannot be identified in the time
averaged data, however the spatial temperature profiles are more prominent compared with the single
shot results. These features are also seen in the time averaged results in [21, 22]. The flow appears to
diverge more at higher Reynolds number.
Figure 16. Gas phase 100 shot time averaged temperature distributions for various temperatures and
Reynolds numbers, conveyed with BAM phosphorescence, using the intensity ratio method by
carrying out pixel to pixel divisions of the 400 nm region by the 458 nm region. (a) shows jets with a
Reynolds number of 10,000 achieved using a nozzle diameter of 2 mm (b) shows jets with a
Reynolds number of 5,000 achieved using a nozzle diameter of 4 mm and (c) shows jets with a
Reynolds number of 2,500 achieved using a nozzle diameter of 8 mm.
4.2.3 Single shot and time averaged results using YAG:Dy
There was a very negligible amount of the phosphorescence signal produced by the 2.5 µm
diameter YAG:Dy particles when seeded within the flow. This can be explained by the excitation and
emission characteristics of the YAG:Dy phosphor becoming more transparent to visible light as it
increases in size, reducing trapping efficiency caused by light scattering of particles [38]. Therefore
at smaller sizes less luminescence is produced. This, combined with a relatively low seeding density,
compared with surface measurements, resulted in little or no measured emission of phosphorescence
for the jets both for single shot and time averaged measurements. This low signal effect was also
mentioned in [25] where the authors mitigated the usage of BAM instead of YAG:Dy, in order to
produce gas phase results.
The 10.2 µm YAG:Dy did produce relatively better phosphorescence signal than the 2.5 µm
YAG:Dy particles, but still there was not a high enough phosphorescence signal yield for single shot
measurements. However, accumulating a number of single shot images resulted in an average
temperature distribution. It has also been documented in [23] that the SNR of YAG:Dy is low, where
the principle of superpixels is necessitated. Superpixels combine the intensities in regions consisting
of multiple pixels, for example using 5x5 pixels to improve SNR. However, in this study it was
sufficient to accumulate the data for an improved SNR. It was also beneficial not to use superpixels
here, in the interest of comparing the results of the two phosphors, as well as preserving the spatial
resolution of the images.
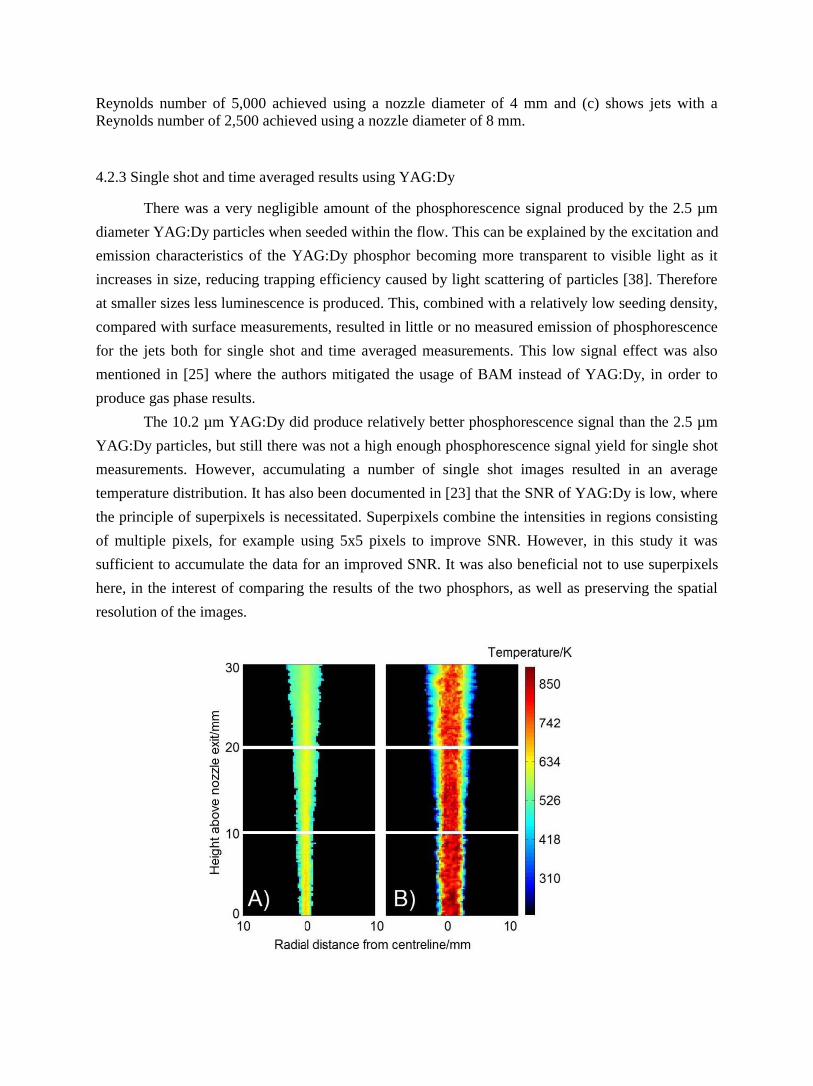
Figure 17. Gas phase 100 shot, time-averaged temperature distributions conveyed with YAG:Dy
phosphorescence, using the intensity ratio method by carrying out pixel to pixel divisions of the 458
nm region by the 492 nm region for (A) A jet at 600 K with a Reynolds number of 5,000 achieved
with a nozzle diameter of 4 mm and (B) a jet at 850 K with a Reynolds number of 2,500 achieved
with a nozzle diameter of 8 mm.
The 458 nm emission band of the YAG:Dy conveyed no appreciable signal near room
temperature and at low temperatures up to about 500 K, during gas phase measurements. This,
combined with the application of conditional threshold filtering, mentioned above, meant that jets at
temperatures below 550 K could not be accurately deduced using YAG:Dy. Figure 17 shows
temperature distributions for two jets, where each image was an average of 100 shots. It can be seen
from the less pronounced jet temperatures, that the signal strength is less than that of the BAM
time-averaged shots. The figure shows a jet at 600 K with a Reynolds number of 5,000 (left) and a jet
at 850 K with a Reynolds number of 2,500 (right). In order to get a good SNR at 600 K, the seeding
density had to be increased and therefore a nozzle diameter of 4 mm was used, instead of 8 mm. This
was done in order to increase the signal yield of the 458 nm band. Only two jets of temperatures of
600 K and 850 K are presented using YAG:Dy. In Figures 17(a) and 17(b) the jets appear thinner
relative to the corresponding BAM measurements of jets taken at the same temperature and Reynolds
number. This is again due to a low phosphorescence signal produced at low temperatures in the 458
nm region, for YAG:Dy, producing a low intensity ratio and hence conveying a temperature close to
the temperature scale minimum. The YAG:Dy calibration curve in Figure 9 is steeper towards higher
temperatures and the jet temperature distributions show only a small change over a variation of 250
K. This shows that YAG:Dy displays less sensitivity to temperature change, compared with BAM at
this range.
4.2.4 Precision and uncertainty
The precision of the gas phase LIP thermometry technique was calculated using single shot
BAM phosphorescence images from the near nozzle part of the gas jets, within the central region.
Five matching pixels were compared from each of the 50 single shot images at every temperature
increment presented in the results. Figure 18 depicts the number of pixels conveying specific
temperatures for each temperature set. The standard deviation of the results at 300 K was 8.6 K
(2.8%), increasing up to 49.8 K (5.9%) at 850 K, showing a decrease in precision and increase in
uncertainty with an increase in temperature. The data for each temperature was corrected using
conditional filtering in such a way that the temperature did not go below 280 K. The YAG:Dy
phosphor could not be used for this analysis as its emission signal was not strong enough for single
shot analysis. However there is expected to be a further inaccuracy induced when using the YAG:Dy
due to the larger diameter and hence longer response times with change in temperature. This,
combined with having to average data shows that YAG:Dy is more suited to steadier situations, such
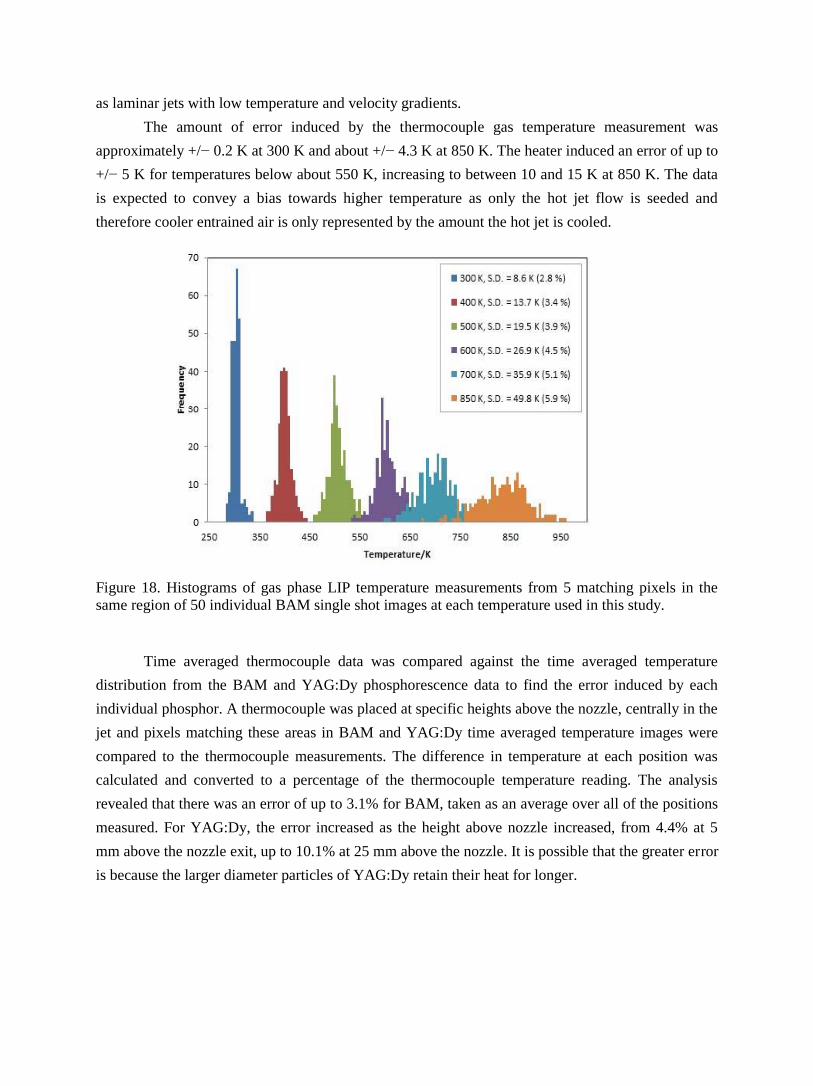
as laminar jets with low temperature and velocity gradients.
The amount of error induced by the thermocouple gas temperature measurement was
approximately +/− 0.2 K at 300 K and about +/− 4.3 K at 850 K. The heater induced an error of up to
+/− 5 K for temperatures below about 550 K, increasing to between 10 and 15 K at 850 K. The data
is expected to convey a bias towards higher temperature as only the hot jet flow is seeded and
therefore cooler entrained air is only represented by the amount the hot jet is cooled.
Figure 18. Histograms of gas phase LIP temperature measurements from 5 matching pixels in the
same region of 50 individual BAM single shot images at each temperature used in this study.
Time averaged thermocouple data was compared against the time averaged temperature
distribution from the BAM and YAG:Dy phosphorescence data to find the error induced by each
individual phosphor. A thermocouple was placed at specific heights above the nozzle, centrally in the
jet and pixels matching these areas in BAM and YAG:Dy time averaged temperature images were
compared to the thermocouple measurements. The difference in temperature at each position was
calculated and converted to a percentage of the thermocouple temperature reading. The analysis
revealed that there was an error of up to 3.1% for BAM, taken as an average over all of the positions
measured. For YAG:Dy, the error increased as the height above nozzle increased, from 4.4% at 5
mm above the nozzle exit, up to 10.1% at 25 mm above the nozzle. It is possible that the greater error
is because the larger diameter particles of YAG:Dy retain their heat for longer.
5. Conclusion
Planar laser induced phosphorescence was used in conjunction with thermographic phosphors
BAM and YAG:Dy to determine the temperature distribution of heated jets with different Reynolds
numbers and at a range of temperatures. YAG:Dy conveyed no appreciable phosphorescence signal
at 2.5 µm diameter when seeded within the gas flow, however larger
10.2 µm YAG:Dy particles did produce a high enough signal for gas phase temperature
measurements. The 2.9 µm BAM particles produced a higher phosphorescence signal yield,
compared with both 2.5 and 10.2 µm YAG:Dy particle diameters, therefore single shot results with
high SNR were acquired using BAM, but not with YAG:Dy. Both phosphors could be used to
express time averaged temperature distributions, due to an increase in signal to noise ratio that could
be achieved by accumulating images.
The YAG:Dy and BAM phosphorescence signal strengths are shown to decrease with an
increase in temperature and diminish around 1300 K and 1100 K respectively, where BAM only
shows temperature sensitivity up to 875 K. The phosphorescence lifetimes at room temperature are
shown to be approximately 1.1 ms for YAG:Dy and 2.5 µs for BAM.
The high emission intensity produced by BAM allowed for detailed jet temperature
distributions to be made at various temperatures up to 850 K, displaying a large portion of the jet, up
to 90 mm above the nozzle exit. The fact that BAM phosphorescence emission intensity is high at
short gating times of around 1 µs means that it is capable of detecting the flow structure at this
characteristic time scale in the jet. Raw images at 300 K show the intensity ratio is almost
homogeneous despite phosphorescence signal inhomogeneity. Near nozzle time averaged images
were produced for both of the phosphors, where the spatial temperature distributions are clearly
defined and the characteristics of different jets were identified.
The precision and uncertainty of the experiment were investigated, where the standard
deviation of the results at 300 K was 8.6 K (2.8%), increasing up to 49.8 K (5.9%) at 850 K, showing
a decrease in precision and increase in uncertainty with an increase in temperature. The largest
calculated error for BAM was 3.1% and for YAG:Dy 10.1%, where the discrepancy is likely to be
due to the larger sized YAG:Dy particles and hence, longer response times. BAM is suitable for
turbulent flow situations, whereas YAG:Dy displays less sensitivity within the temperature range in
this study and a slower response time to temperature changes.
References and links
1. W. M. Yen, S. Shionoya, and H. Yamamoto, Phosphor Handbook, 2nd Ed. (CRC Press/Taylor and Francis, 2007).
2. S. W. Allison and G. T. Gilles, “Remote thermometry with thermographic phosphors: instrumentation and applications,” Rev. Sci. Instrum. 68(7), 2615–2650 (1997).
3. N. J. Turro, J. C. Scaiano, and V. Ramamurthy, Principles of Molecular Photochemistry: an
Introduction (University science books, 2009).
4. M. Aldén, A. Omrane, M. Richter, and G. Sarner, “Thermographic phosphors for thermometry: a survey of combustion applications,” Prog. Energ. Combust. 37(4), 422–461 (2011).
5. N. Fuhrmann, J. Brubach, and A. Dreizler, “Phosphor thermometry: a comparson of the
luminescence lifetime and the intensity ratio approach,” Proc. Combust. Inst. 34(2), 3611–3618 (2013).
6. S. A. Wade, S. F. Collins, and G. W. Baxter, “Fluorescence intensity ratio technique for optical fiber point temperature sensing,” J. Appl. Phys. 94(8), 4743–4756 (2003).
7. S. Someya, S. Yoshida, Y. Li, and K. Okamoto, “Combined measurement of velocity and
temperature distributions in oil based on the luminescent lifetimes of seeded particles,” Meas. Sci.
Technol. 20(2), 025403 (2009).
8. A. Omrane, F. Ossler, M. Alden, U. Gtoransson, and G. Holmstedt, “Surface temperature
measurement of flame spread using thermographic phosphors,” Fire Safety Science 7, 141–152 (2003).
9. G. Särner, M. Richter, and M. Aldén, “Two-dimensional thermometry using temperature-induced line shifts of ZnO:Zn and ZnO:Ga fluorescence,” Opt. Lett. 33(12), 1327–1329 (2008).
10. J. I. Eldridge, T. J. Bencic, S. W. Allison, and D. L. Beshears, “Depth-penetrating temperature
measurements of thermal barrier coatings incorporating thermographic phosphors,” J. Therm. Spray Technol. 13(1), 44–50 (2004).
11. N. Fuhrmann, M. Schild, D. Bensing, S. A. Kaiser, C. Schulz, J. Brubach, and A. Dreizler,
“Two-dimensional cycle-resolved exhaust valve temperature measurements in an optically accessible
internal combustion engine using thermographic phosphors,” Appl. Phys. B 106(4), 945–951 (2012).
12. K. W. Tobin, S. W. Allison, M. R. Cates, G. J. Capps, and D. L. Beshears, “High temperature
phosphor thermometry of rotating turbine blades,” AAIA J. 28(8), 1485–1490 (1990).
13. B. W. Noel, H. M. Borella, W. Lewis, W. D. Turley, D. L. Beshears, G. J. Capps, M. R. Cates, J.
D. Muhs, and
K. W. Tobin, “Evaluating thermographic phosphors in an operating turbine engine,” J. Eng. Gas Turbines Power 113(2), 242–245 (1991).
14. J. P. Feist, A. L. Heyes, and S. Seedfelt, “Thermographic phosphors for gas turbine
instrumentation development and measurement uncertainties,” Proceedings of the 11th International Symposium on Applications of Laser Techniques to Fluid Mechanics, p. 18 (2002).
15. J. Brubach, C. Pflitsch, A. Dreizler, and B. Atakan, “On surface temperature measurements with thermographic phosphors: a review,” Prog. Energ. Combust. 39(1), 37–60 (2013).
16. A. Omrane, G. Juhlin, F. Ossler, and M. Aldén, “Temperature measurements of single droplets
by use of laser-induced phosphorescence,” Appl. Opt. 43(17), 3523–3529 (2004).
17. A. Omrane, G. Sarner, and M. Aldén, “2D-temperature imaging if single droplets and sprays using thermographic phosphors,” Appl. Phys. B 79(4), 431–434 (2004).
18. J. Brubach, A. Patt, and A. Dreizler, “Spray thermometry using thermographic phosphors,” Appl. Phys. B 83(4), 499–502 (2006).
19. R. Hasegawa, I. Sakata, H. Yanagihara, B. Johansson, A. Omrane, and M. Aldén,

“Two-dimensional gas-phase temperature measurements using phosphor thermometry,” Appl. Phys.
B 88(2), 291–296 (2007).
20. A. Omrane, P. Petersson, M. Aldén, and M. A. Linne, “Simultaneous 2D flow velocity and gas temperature measurements using thermographic phosphors,” Appl. Phys. B 92(1), 99–102 (2008).
21. B. Fond, C. Abram, A. L. Heyes, A. M. Kempf, and F. Beyrau, “Simultaneous temperature,
mixture fraction and velocity imaging in turbulent flows using thermographic phosphor tracer
particles,” Opt. Express 20(20), 22118– 22133 (2012).
22. D. A. Rothamer and J. Jordan, “Planar imaging thermometry in gaseous flows using
upconversion excitation of thermographic phosphors,” Appl. Phys. B 106(2), 435–444 (2012).
23. G. Jovicic, L. Zigan, S. Pfadler, and A. Leipertz, “Simultaneous two-dimensional temperature
and velocity measurements in a gas flow applying thermographic phosphors,” in 16th International Symposium on Applications of Laser Techniques to Fluid Mechanics, Lisbon, Portugal (2012).
24. R. Hasegawa, I. Sakata, H. Yanagihara, G. Sarner, M. Richter, M. Aldén and B. Johansson,
“Two-dimensional temperature measurements in engine combustion using phosphor thermometry,” SAE J.-Automot. Eng. Paper number 2007–01–1883, 1797-1803 (2007).
25 . P. J. van Lipzig, M. Yu, N. J. Dam, C. C. M. Luijten and L. P. H. de Goey, “Gas phase
thermometry in a high pressure cell using BaMgAl10O17:Eu as a thermographic phosphor,” submitted to Appl. Phys. B (in revision) (2012).
26. G. S. R. Raju, H. C. Jung, J. Y. Park, J. W. Chung, B. K. Moon, J. H. Jeong, S.-M. Son, and J. H.
Kim, “Sintering temperature effect and luminescent properties of Dy3+:YAG nanophosphor,” J.
Optoelectron. Adv. Mater. 12(6), 1273–1278 (2010).
27. M. R. Cates, S. W. Allison, S. L. Jaiswal, and D. L. Beshears, “YAG:Dy and YAG:Tm fluorescence to 1700 C,” in 49th International Instrumentation Symposium, Orlando, Florida (2003).
28. S. J. Skinner, J. P. Feist, I. J. E. Brooks, S. Seefeldt, and A. L. Heyes, “YAG:YSZ composites as
potential thermographic phosphors for high temperature sensor applications,” Sensor. Actuat. Biol. Chem. 136, 52–59 (2009).
29. L. P. Goss, A. A. Smith, and M. E. Post, “Surface thermometry by laser-induced fluorescence,” Rev. Sci. Instrum. 60(12), 3702–3706 (1989).
30. J. L. Caslavsky and D. J. Viechnicki, “Melting behaviour and metastability of yttrium aluminium
garnet (YAG) and YAlO3 determined by optical differential thermal analysis,” J. Mater. Sci. 15(7), 1709–1718 (1980).
31. M. Yu, G. Sarner, C. C. M. Luijten, M. Richter, M. Aldén, R. S. G. Baert, and L. P. H. de Goey,
“Survivability of thermographic phosphors (YAG:Dy) in a combustion environment,” Meas. Sci.
Technol. 21(3), 037002 (2010).
32. C. R. Ronda, “Recent achievements in research on phosphors for lamps and displays,” J. Lumin.
72-74, 49–54 (1997).
33. T. Justel, H. Bechtel, W. Mayr, and D. U. Wiechert, “Blue emitting BaMgAl10O17:Eu with a
blue body color,” J. Lumin. 104(1-2), 137–143 (2003).
34. K.-B. Kim, K.-W. Koo, T.-Y. Cho, and H.-G. Chun, “Effect of heat treatment on
photoluminescence behaviour of BaMgAl10O17:Eu phosphors,” Mater. Chem. Phys. 80(3), 682–689 (2003).
35. G. Bizarri and B. Moine, “On BaMgAl10O17:Eu2+ phosphor degradation mechanism: thermal
treatment effects,” J. Lumin. 113(3-4), 199–213 (2005).
36. D. Ravichandran, R. Roy, W. B. E. S. White, and S. Erdei, “Synthesis and characterisation of
sol-gel dervied hexa-aluminate phosphors,” J. Mater. Res. 12(3), 819–824 (1997).
37. A. Melling, “Tracer particles and seeding for particle image velocimetry,” Meas. Sci. Technol.
8(12), 1406–1416 (1997).
38. N. T. Tran, J. P. You, and F. G. Shi, “Effect of phosphor particle size on luminous efficacy of
phosphor-converted white LED,” J. Lightwave Technol. 27(22), 5145–5150 (2009).
39. J. Lindén, N. Takada, B. Johansson, M. Richter, and M. Aldén, “Investigation of potential
laser-induced heating effects when using thermographic phosphors for gas-phase thermometry,”
Appl. Phys. B 96(2-3), 237–240 (2009).
40. D. C. Ginnings and G. T. Furukawa, “Heat capacity standards for the range 14 to 1200 K,” J.
Am. Chem. Soc. 75(3), 522–527 (1953).
41. W. Koechner, Solid-State Laser Engineering, 6th Edition (Springer science and business media
inc., 2006).
42. J. Lindén, C. Knappe, M. Richter, and M. Aldén, “Precision in 2D temperature measurements
using the thermographic phosphor BAM,” Meas. Sci. Technol. 23(8), 085205 (2012).
43. F. Lemoine, Y. Antoine, M. Wolff, and M. Lebouche, “Simultaneous temperature and 2D
velocity measurements in a turbulent heated jet using combined laser-induced fluorescence and
LDA,” Exp. Fluids 26(4), 315–323 (1999).
44. A. Agrawal, K. R. Sreenivas, and A. K. Prasad, “Velocity and temperature measurements in an
axisymmetric turbulent jet with cloud-like off-source heating,” Int. J. Heat Mass Tran. 47(6-7),
1433–1444 (2004).
Acknowledgments
The authors would like to thank the Thomas Gerald Gray Charitable Trust for the PhD
studentship and making the project possible, along with Phosphor Technology for their contribution
and the technicians Kenneth Anstiss, Costas Xanthos, Clive Barret and Andrew Selaway for their
efforts and guidance towards equipment setup.