Embed Size (px)
Citation preview
167
DEPARTMENT OF HEALTH
Legal Basis
Presidential Proclamation (June 23, 1898) created the Board of Health in the New Republicunder President Emilio Aguinaldo.Executive Order No. 317 (January 1, 1941) elevated the Board of Health into the Department ofHealth and Public Welfare (DHPW).Executive Order No. 94 (October 4, 1947), pursuant to Republic Act No. 51 or the ReorganizationAct of 1946, transferred the Bureau of Public Welfare under the DHPW to the Office of thePresident and renamed the DHPW to Department of Health (DOH).Executive Order No. 851 (December 2, 1982) reorganized the DOH to synchronize healthstructures and operations with the shift to parliamentary form of government whence it becameknown as the Ministry of Health (MOH).Executive Order No. 119 (January 30, 1987) reorganized the MOH (later, under the presidentialform, as Department of Health) and clustered agencies and programs under the Office of PublicHealth Services, Office for Hospital and Facilities Services, Office for Standards and Regulations,and Office for Management Services.Executive Order No. 102 (May 21, 1999) redirected the functions and operations of the Departmentof Health consistent with the Administrative Code of 1987 (EO 292) and the Local GovernmentCode of 1991 (RA 7160).
Mandate
The Department of Health (DOH) provides assistance to local government units (LGUs), people’sorganizations (POs), and other members of civil society in effectively implementing programs,projects and services that promote the health and well being of every Filipino; prevent and controldiseases among populations at risks; protect individuals, families and communities exposed tohazards and risks; and treat, manage, rehabilitate individuals affected by disease and disability.
The Department of Health (DOH) logo is dominated by a caduceus, a winged staff with two snakeswrapped around it, which is the symbol of the medical profession, its basic quality being the powerto heal. Inside the ‘shield’ are the figures of a building, representing a hospital; a microscope,symbolizing research; and an anchor, denoting quarantine. Under these symbols is the motto“Floreat Salubrita Populi”, meaning “Promotion of Health for the People”, which is an abstract of whatDOH is mandated to do.
168
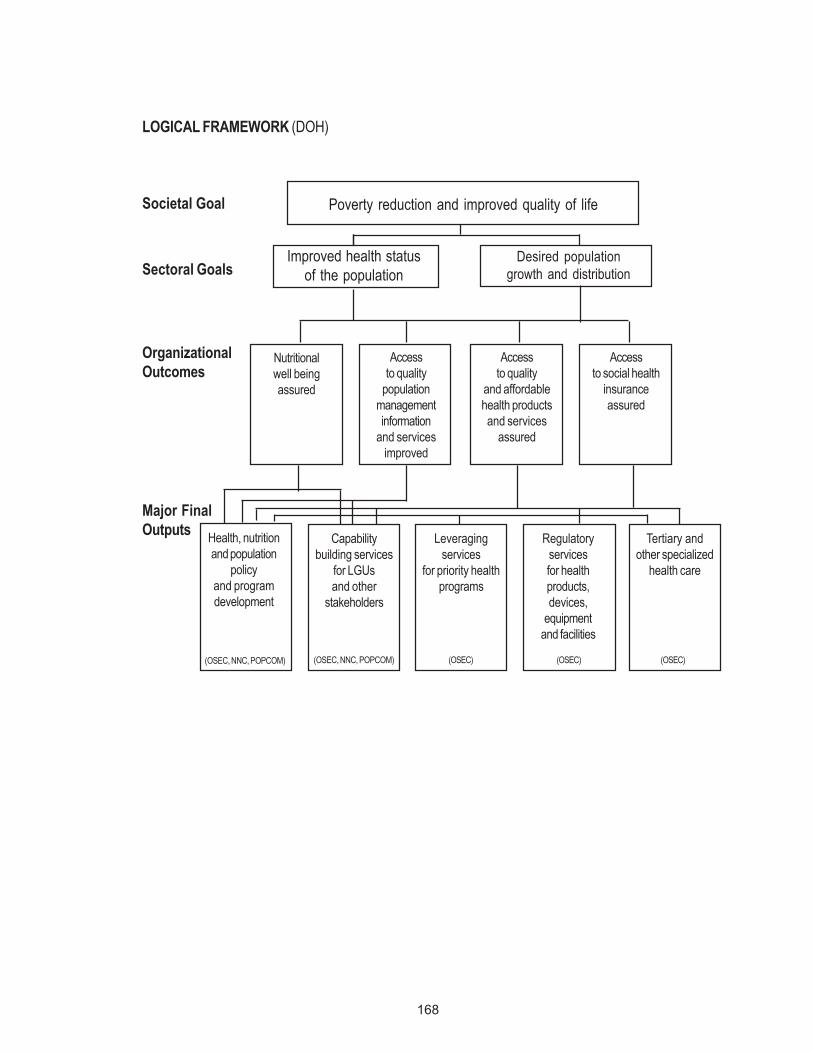
LOGICAL FRAMEWORK (DOH)
Major FinalOutputs
Societal Goal
Sectoral Goals
OrganizationalOutcomes
Poverty reduction and improved quality of life
Improved health statusof the population
Nutritionalwell beingassured
Accessto quality
populationmanagementinformation
and servicesimproved
Accessto quality
and affordablehealth productsand services
assured
Accessto social health
insuranceassured
Health, nutritionand population
policyand programdevelopment
Capabilitybuilding services
for LGUsand other
stakeholders
Leveragingservices
for priority healthprograms
Regulatoryservicesfor healthproducts,devices,
equipmentand facilities
Tertiary andother specialized
health care
Desired populationgrowth and distribution
(OSEC, NNC, POPCOM) (OSEC, NNC, POPCOM) (OSEC) (OSEC) (OSEC)

169
FY 2008 MFO BUDGET
By Agency/By MFO(In thousand Pesos)
Particulars
MFO 1 Health,
nutrition and population policy and program
development
MFO 2 Capability building
services for LGUs and
other stakeholders
MFO 3 Leveraging services for
priority health
programs
MFO 4 Regulatory services for
health products, devices,
equipment and facilities
MFO 5 Tertiary and
other specialized health care
TOTAL
% Share
Department of Health (Office of the Secretary)
2,526,066
2,528,804
2,373,703
683,794
7,280,791
15,393,158
94.68%
National Nutrition Council
34,324
439,001
-
-
- 473,325
2.91% POPCOM
265,829
126,679
-
-
- 392,508
2.41%
TOTAL
2,826,219
3,094,484
2,373,703
683,794
7,280,791 16,258,991
100%
% Share
17.38%
19.03%
14.60%
4.21%
44.78%
100%
170
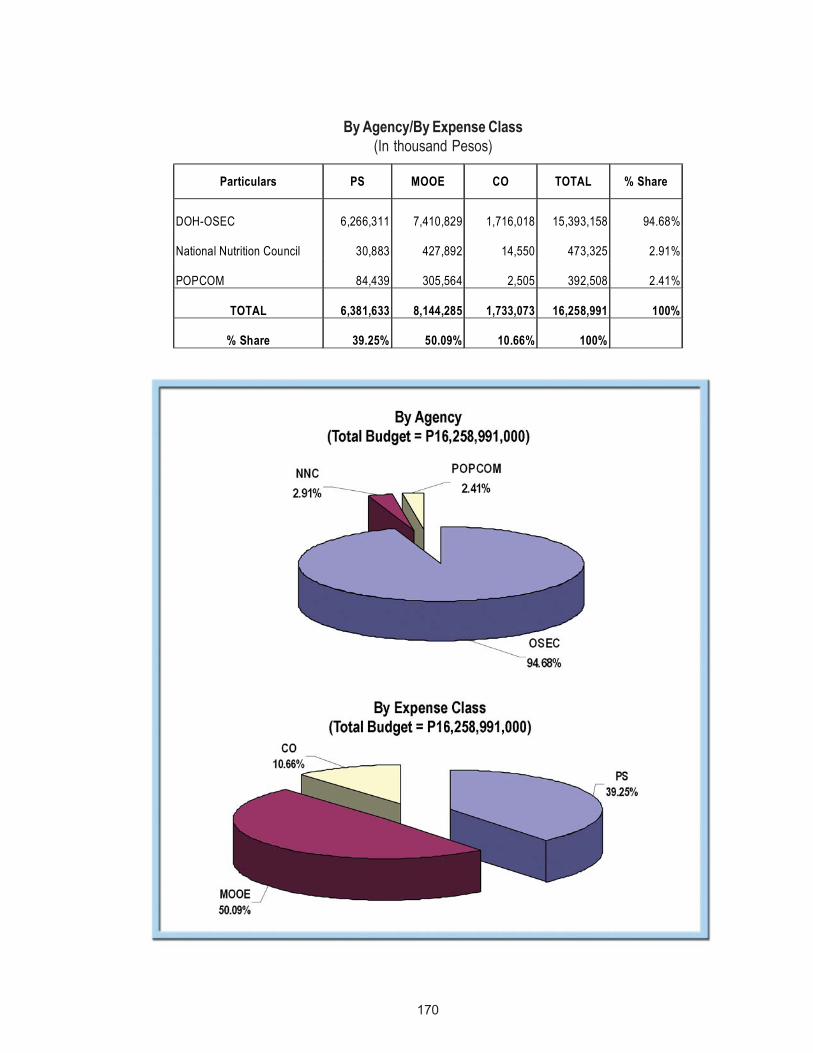
By Agency/By Expense Class(In thousand Pesos)
Particulars PS MOOE CO TOTAL % Share
DOH-OSEC
6,266,311
7,410,829
1,716,018
15,393,158 94.68%
National Nutrition Council
30,883
427,892
14,550
473,325 2.91%
POPCOM
84,439
305,564
2,505
392,508 2.41%
TOTAL
6,381,633
8,144,285
1,733,073
16,258,991 100%
% Share
39.25%
50.09%
10.66%
100%

171
LOGICAL FRAMEWORK (DOH-OSEC)
Major FinalOutputs
Societal Goal
Sectoral Goal
OrganizationalOutcomes
Improved health status of the population
Access to social healthinsurance assured
Health policy andhealth programdevelopment
Capabilitybuilding services
for LGUsand other
stakeholders
Leveragingservices
for priority healthprograms
Regulatoryservices for
health products,devices,
equipmentand facilities
Tertiaryand otherspecializedhealth care
Service DeliveryPrograms
• Epidemiology & Disease Surveillance
• Disease Prevention & Control
• Operation of PNAC
• Health Promotion
• Health Emergency
• Health Facility Planning, Operations & Infrastructure Development
Foreign AssistedProjects
• Help for CatubigagriculturalAdvancement Project
• Women’s Healthand SafemotherhoodProject II
(MFO 1, 2, 3)
Regulation Programs•Regulation of Food &Drugs
• Regulation of HealthFacilities & Services
• Regulation of Devicesand Radiation Health
• Quarantine Services &International HealthSurveillance
• NationalPharmaceuticalDevelopment includingprovision of drugs andmedicines
(MFO 1, 2, 3, 4)
Operation of CHDs• Field coordination,internal & area sectoralplanning, humanresource development& other supportservices
• Implementation ofhealth regulations &standards
• Local healthassistance includinghealth systemsdevelopment & publichealth program support
• Direct serviceprovision
(MFO 1, 2, 3, 4, 5)
Service DeliveryPrograms
• Operation of SpecialHospitals, MedicalCenters & Institutes forDisease Prevention &Control
• Operation of DangerousDrug Abuse Treatment &Rehabilitation Centers
Foreign AssistedProjects
• Development of a Sub-specialty Centers forHeart, Lung, KidneyDisease in Luzon,Visayas & Mindanao
(MFO 5)
General Administration& Support Services
Support to Operations• Formulation &
Development ofNational Health Policies& Plans includingEssential NationalHealth Research
• Health InformationSystems & TechnologyDevelopment
• Health Human ResourceDev’t
• Development ofpolicies, supportmechanisms &collaboration forinternational healthcooperation
• Health SystemDevelopment
• Health Care AssistanceForeign Assisted
Projects• Health Sector
Dev’tProject• Health Sector Reform
Project
(MFO 1, 2, 3, 4, 5)
P/A/Ps
Access to qualityand affordablehealth products
and services assured
Basic needs of the population are met towards poverty reduction
DOH-Office of the Secretary
172
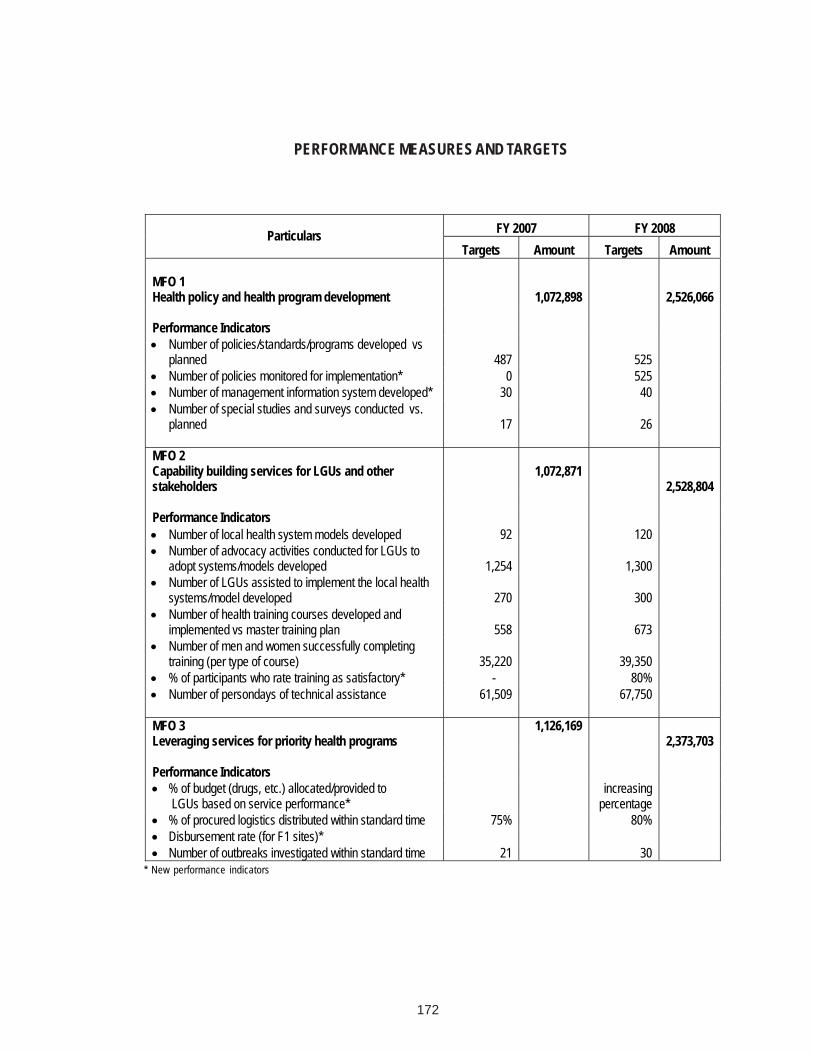
FY 2007 FY 2008 Particulars Targets Amount Targets Amount
MFO 1 Health policy and health program development
1,072,898
2,526,066
Performance Indicators • Number of policies/standards/programs developed vs
planned 487 525 • Number of policies monitored for implementation* 0 525 • Number of management information system developed* 30 40 • Number of special studies and surveys conducted vs.
planned 17 26 MFO 2 Capability building services for LGUs and other stakeholders
1,072,871
2,528,804 Performance Indicators • Number of local health system models developed 92 120 • Number of advocacy activities conducted for LGUs to
adopt systems/models developed 1,254 1,300 • Number of LGUs assisted to implement the local health
systems/model developed 270 300 • Number of health training courses developed and
implemented vs master training plan 558 673 • Number of men and women successfully completing
training (per type of course) 35,220 39,350 • % of participants who rate training as satisfactory* - 80% • Number of persondays of technical assistance 61,509 67,750 MFO 3 Leveraging services for priority health programs
1,126,169 2,373,703
Performance Indicators • % of budget (drugs, etc.) allocated/provided to
LGUs based on service performance* increasing
percentage • % of procured logistics distributed within standard time 75% 80% • Disbursement rate (for F1 sites)* • Number of outbreaks investigated within standard time 21 30
PERFORMANCE MEASURES AND TARGETS
* New performance indicators
173
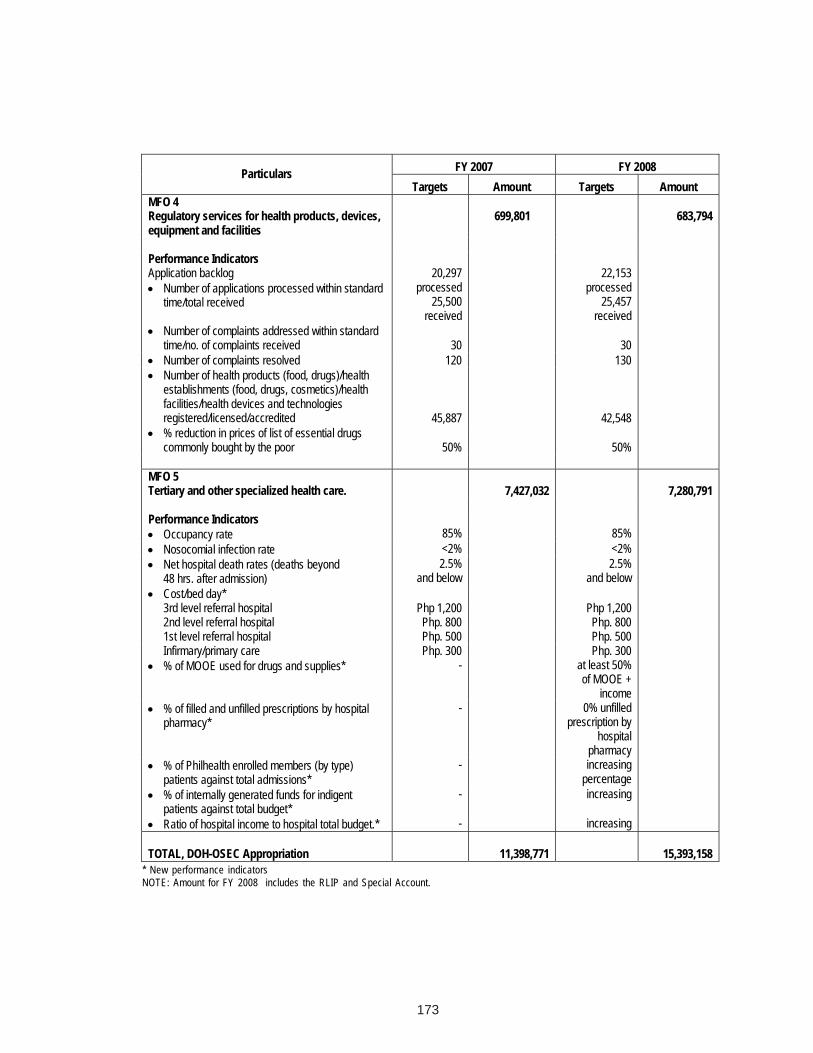
FY 2007 FY 2008 Particulars Targets Amount Targets Amount
MFO 4 Regulatory services for health products, devices, equipment and facilities
699,801
683,794
Performance Indicators Application backlog • Number of applications processed within standard
time/total received
20,297 processed
25,500 received
22,153 processed
25,457 received
• Number of complaints addressed within standard time/no. of complaints received 30 30
• Number of complaints resolved 120 130 • Number of health products (food, drugs)/health
establishments (food, drugs, cosmetics)/health facilities/health devices and technologies registered/licensed/accredited 45,887 42,548
• % reduction in prices of list of essential drugs commonly bought by the poor 50% 50%
MFO 5 Tertiary and other specialized health care.
7,427,032
7,280,791
Performance Indicators • Occupancy rate 85% 85% • Nosocomial infection rate <2% <2% • Net hospital death rates (deaths beyond
48 hrs. after admission) 2.5%
and below 2.5%
and below • Cost/bed day*
3rd level referral hospital Php 1,200 Php 1,200 2nd level referral hospital Php. 800 Php. 800 1st level referral hospital Php. 500 Php. 500 Infirmary/primary care Php. 300 Php. 300
• % of MOOE used for drugs and supplies* -
at least 50% of MOOE +
income • % of filled and unfilled prescriptions by hospital
pharmacy* -
0% unfilled prescription by
hospital pharmacy
• % of Philhealth enrolled members (by type) patients against total admissions*
-
increasing percentage
• % of internally generated funds for indigent patients against total budget*
-
increasing
• Ratio of hospital income to hospital total budget.* - increasing
TOTAL, DOH-OSEC Appropriation 11,398,771 15,393,158 * New performance indicators
NOTE: Amount for FY 2008 includes the RLIP and Special Account.
174
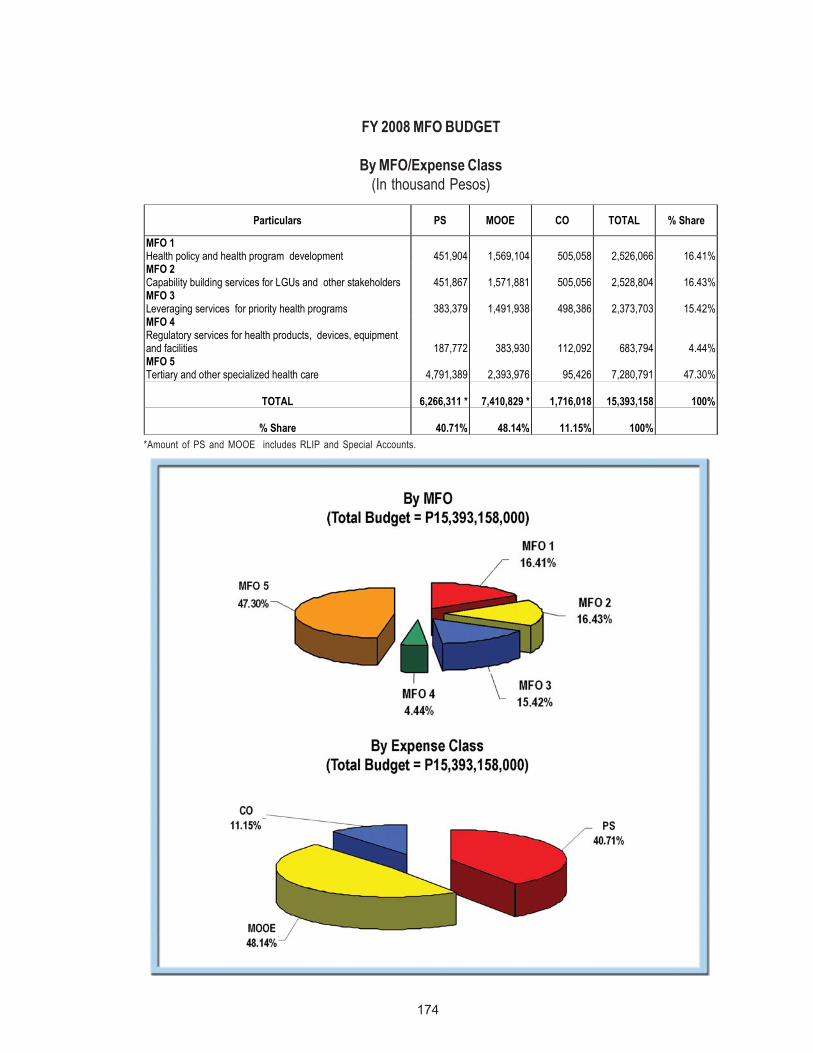
Particulars PS MOOE CO TOTAL % Share
MFO 1 Health policy and health program development
451,904
1,569,104
505,058
2,526,066
16.41%
MFO 2 Capability building services for LGUs and other stakeholders
451,867
1,571,881
505,056
2,528,804
16.43%
MFO 3 Leveraging services for priority health programs
383,379
1,491,938
498,386
2,373,703
15.42%
MFO 4 Regulatory services for health products, devices, equipment and facilities
187,772
383,930
112,092
683,794
4.44% MFO 5 Tertiary and other specialized health care
4,791,389
2,393,976
95,426
7,280,791
47.30%
TOTAL
6,266,311 *
7,410,829 *
1,716,018
15,393,158
100%
% Share
40.71%
48.14%
11.15%
100%
FY 2008 MFO BUDGET
By MFO/Expense Class(In thousand Pesos)
*Amount of PS and MOOE includes RLIP and Special Accounts.
175
Legal Basis
! Republic Act No. 6365 (August 16, 1971) established the National Population Program andcreated the Commission on Population.
! Presidential Decree No. 79 (December 8, 1972) revised certain provisions of RA 6365, placingPOPCOM under the control and supervision of the Office of the President, and its purposes,objectives and functions redefined.
! Executive Order No. 123 (January 30, 1987) reorganized the Department of Social Welfare andDevelopment (DSWD) and made POPCOM one of its attached agencies.
! Executive Order No. 408 (June 18, 1990) transferred POPCOM from DSWD to the Office of thePresident.
! Executive Order No. 476 (August 14, 1991) attached POPCOM to the National Economic andDevelopment Authority (NEDA) to facilitate coordination on policies and programs relative topopulation.
! Executive Order No. 188 (March 24, 2003) attached POPCOM to the Department of Health(DOH).
Mandate
The Commission on Population (POPCOM) is the central policymaking, planning, coordinating, andmonitoring body of the population program.
Commission on Population
The Commission on Population (POPCOM) logo is a symbolic form ofall types of people. The adjoined loops connote interrelationship ortogetherness, whether in connection with a family or with individuals in acommunity. Completing the logo is a circle enveloping the symbolicfamily or community, signifying that the family and the individual in thecommunity are the main focus of all POPCOM’s efforts.
176
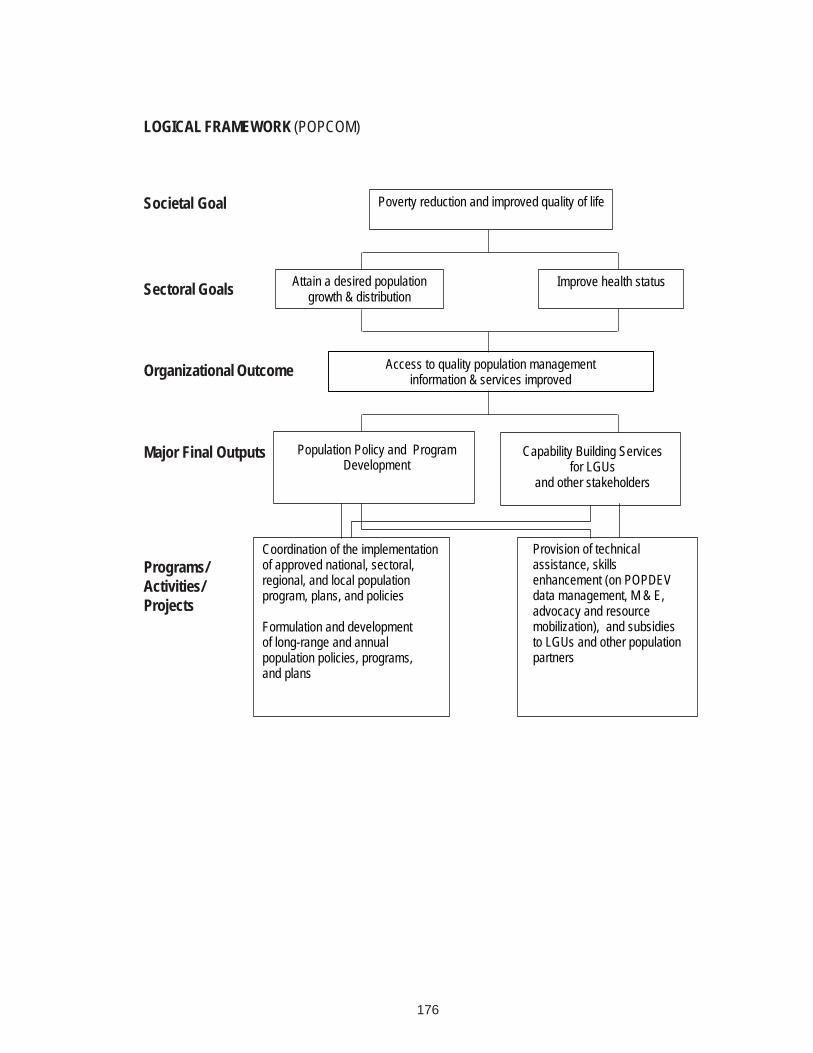
LOGICAL FRAMEWORK (POPCOM)
Societal Goal
Major Final Outputs
Programs/Activities/Projects
Poverty reduction and improved quality of life
Population Policy and Program Development
Capability Building Services for LGUs
and other stakeholders
Coordination of the implementation of approved national, sectoral, regional, and local population program, plans, and policies Formulation and development of long-range and annual population policies, programs, and plans
Provision of technical assistance, skills enhancement (on POPDEV data management, M & E, advocacy and resource mobilization), and subsidies to LGUs and other population partners
Access to quality population management information & services improved
Improve health status Attain a desired population growth & distribution Sectoral Goals
Organizational Outcome
177
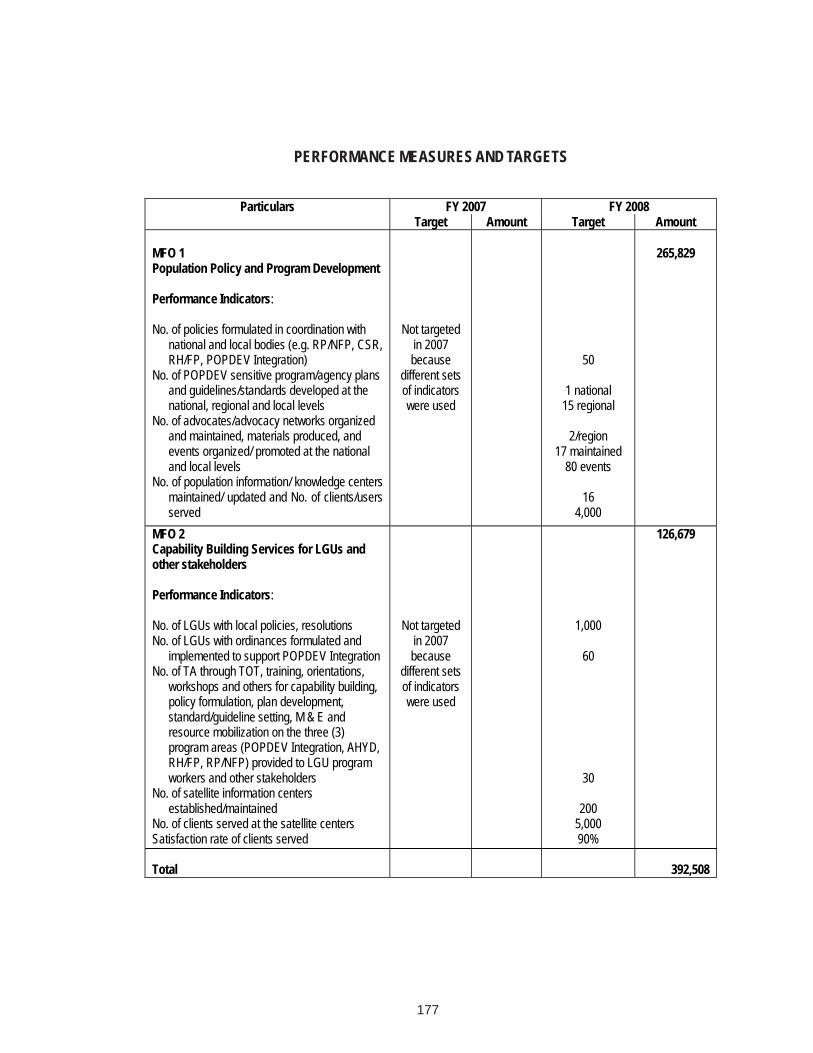
PERFORMANCE MEASURES AND TARGETS
Particulars FY 2007 FY 2008 Target Amount Target Amount MFO 1 Population Policy and Program Development Performance Indicators: No. of policies formulated in coordination with
national and local bodies (e.g. RP/NFP, CSR, RH/FP, POPDEV Integration)
No. of POPDEV sensitive program/agency plans and guidelines/standards developed at the national, regional and local levels
No. of advocates/advocacy networks organized and maintained, materials produced, and events organized/ promoted at the national and local levels
No. of population information/ knowledge centers maintained/ updated and No. of clients/users served
Not targeted
in 2007 because
different sets of indicators were used
50
1 national 15 regional
2/region
17 maintained 80 events
16
4,000
265,829
MFO 2 Capability Building Services for LGUs and other stakeholders Performance Indicators: No. of LGUs with local policies, resolutions No. of LGUs with ordinances formulated and
implemented to support POPDEV Integration No. of TA through TOT, training, orientations,
workshops and others for capability building, policy formulation, plan development, standard/guideline setting, M & E and resource mobilization on the three (3) program areas (POPDEV Integration, AHYD, RH/FP, RP/NFP) provided to LGU program workers and other stakeholders
No. of satellite information centers established/maintained
No. of clients served at the satellite centers Satisfaction rate of clients served Total
Not targeted in 2007 because
different sets of indicators were used
1,000
60
30
200 5,000 90%
126,679
392,508
178
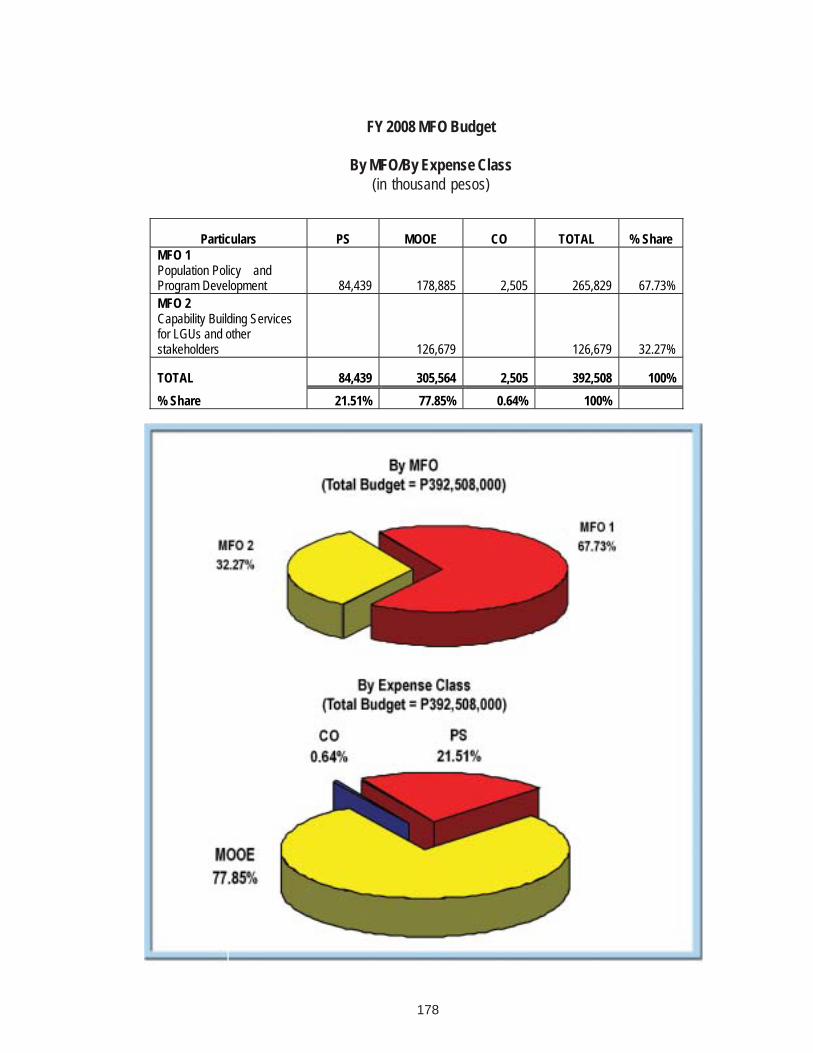
FY 2008 MFO Budget
By MFO/By Expense Class(in thousand pesos)
Particulars PS MOOE CO TOTAL % Share MFO 1 Population Policy and Program Development 84,439 178,885 2,505 265,829 67.73% MFO 2 Capability Building Services for LGUs and other stakeholders 126,679 126,679 32.27%
TOTAL 84,439 305,564 2,505 392,508 100% % Share 21.51% 77.85% 0.64% 100%
179
National Nutrition Council
Legal Basis
! Presidential Decreee No. 491 (June 25, 1974), or the “Nutrition Act of the Philippines”, createdthe National Nutrition Council (NNC) under the Office of the President as the policy-making andcoordinating body for nutrition.
! Executive Order No. 234 (July 22, 1987), “Reorganization Act of the National Nutrition Council”,reaffirmed the need for an intersectoral national policy-making and coordinating body on nutrition,transferring NNC to the Department of Social Welfare and Development (DSWD).
! Administrative Order No. 88 (August 28, 1987) transferred the NNC as an attached agencyfrom the DSWD to the Department of Agriculture (DA), the latter having been named Chair of theNNC Governing Board.
! Executive Order No. 472 (November 2005) named the Department of Health (DOH) as NNCChair and transferred the NNC to DOH as an attached agency.
! Executive Order No. 616 (April 2007) created the Anti-Hunger Task Force composed of 29national government agencies, led by DOH through NNC, to ensure that hunger mitigationprograms are in place.
Mandate
The National Nutrition Council (NNC) oversees the implementation of the hunger mitigation program.It formulates national food and nutrition policies and strategies; and coordinates planning, monitoringand evaluation of the national nutrition program.
The National Nutrition Council (NNC) logo is a spoke of spoons denotingthat improving the nutrition situation cannot be achieved by spoonfeedingalone, nor by the generosity of a single sector’s ‘spoon’. The solutionrequires a collaborative effort, or a contribution from several ‘spoons’.It means creating and recreating ideas, seeking unity and a totality ofapproach for the improvement of Filipino lives.
180
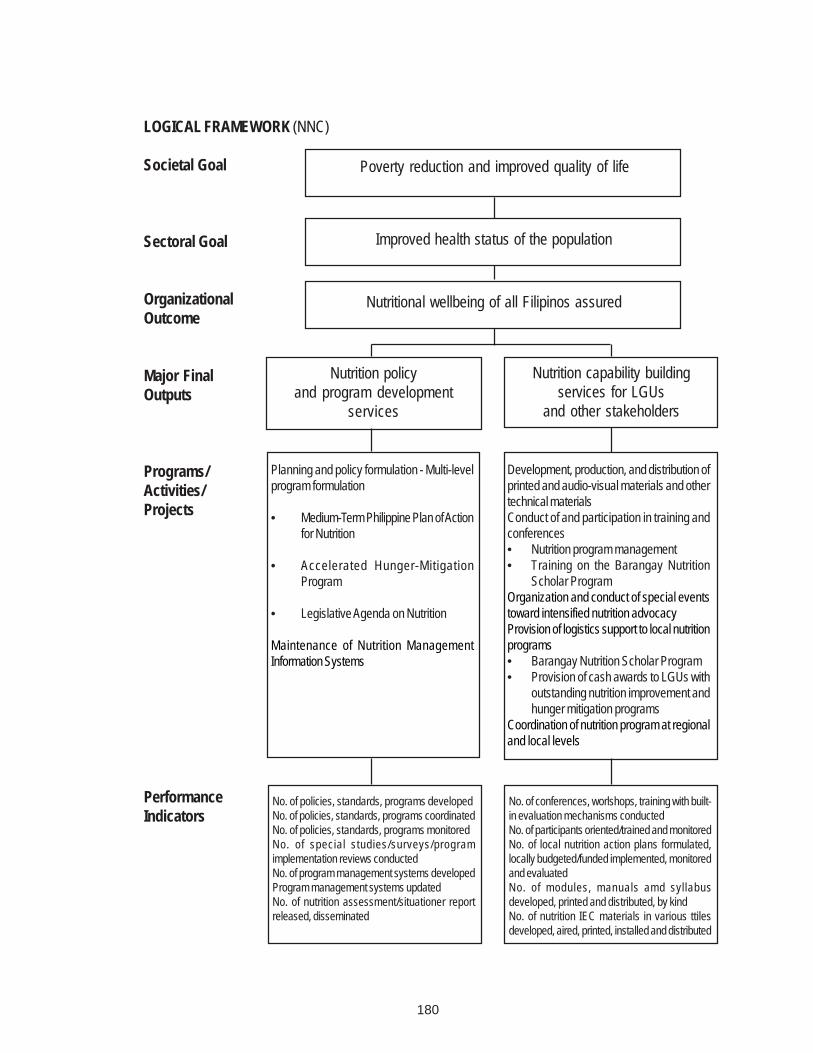
LOGICAL FRAMEWORK (NNC)
Societal Goal
Sectoral Goal
OrganizationalOutcome
Major FinalOutputs
Programs/Activities/Projects
PerformanceIndicators
Poverty reduction and improved quality of life
Improved health status of the population
Nutritional wellbeing of all Filipinos assured
Nutrition policyand program development
services
Nutrition capability buildingservices for LGUs
and other stakeholders
Planning and policy formulation - Multi-levelprogram formulation
• Medium-Term Philippine Plan of Actionfor Nutrition
• Accelerated Hunger-MitigationProgram
• Legislative Agenda on Nutrition
Maintenance of Nutrition ManagementInformation Systems
Development, production, and distribution ofprinted and audio-visual materials and othertechnical materialsConduct of and participation in training andconferences• Nutrition program management• Training on the Barangay Nutrition
Scholar ProgramOrganization and conduct of special eventstoward intensified nutrition advocacyProvision of logistics support to local nutritionprograms• Barangay Nutrition Scholar Program• Provision of cash awards to LGUs with
outstanding nutrition improvement andhunger mitigation programs
Coordination of nutrition program at regionaland local levels
No. of policies, standards, programs developedNo. of policies, standards, programs coordinatedNo. of policies, standards, programs monitoredNo. of special studies/surveys/programimplementation reviews conductedNo. of program management systems developedProgram management systems updatedNo. of nutrition assessment/situationer reportreleased, disseminated
No. of conferences, worlshops, training with built-in evaluation mechanisms conductedNo. of participants oriented/trained and monitoredNo. of local nutrition action plans formulated,locally budgeted/funded implemented, monitoredand evaluatedNo. of modules, manuals amd syllabusdeveloped, printed and distributed, by kindNo. of nutrition IEC materials in various ttilesdeveloped, aired, printed, installed and distributed
181
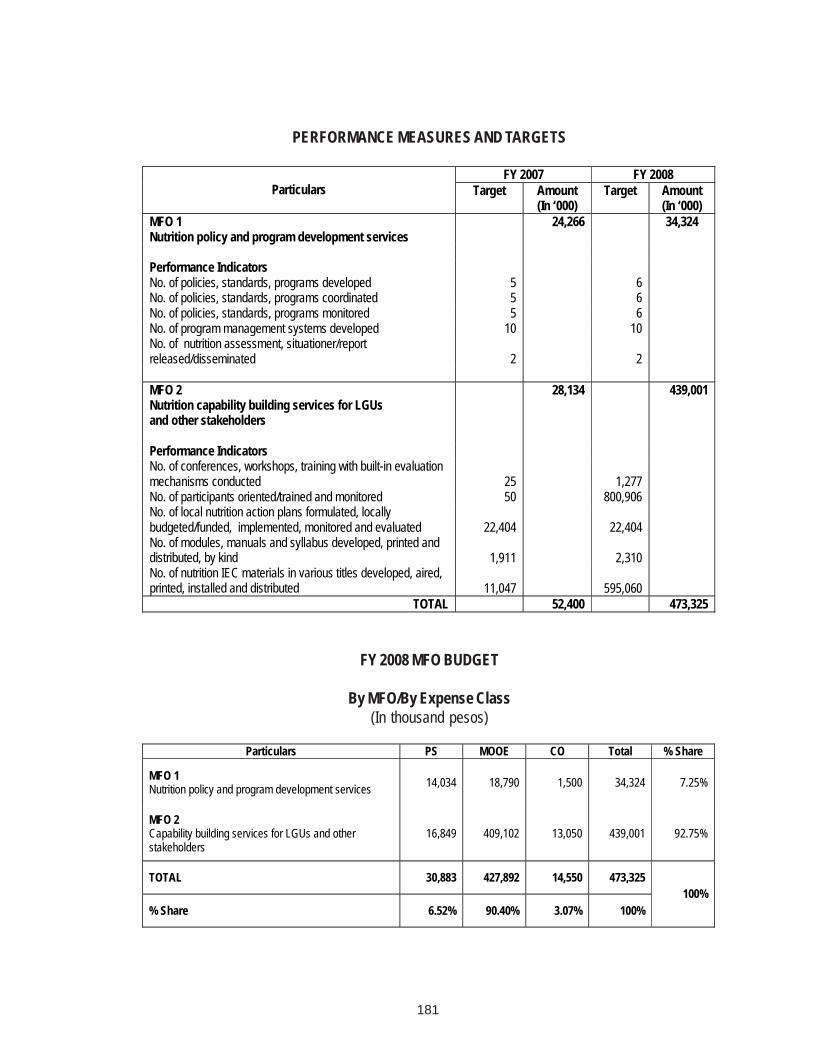
PERFORMANCE MEASURES AND TARGETS
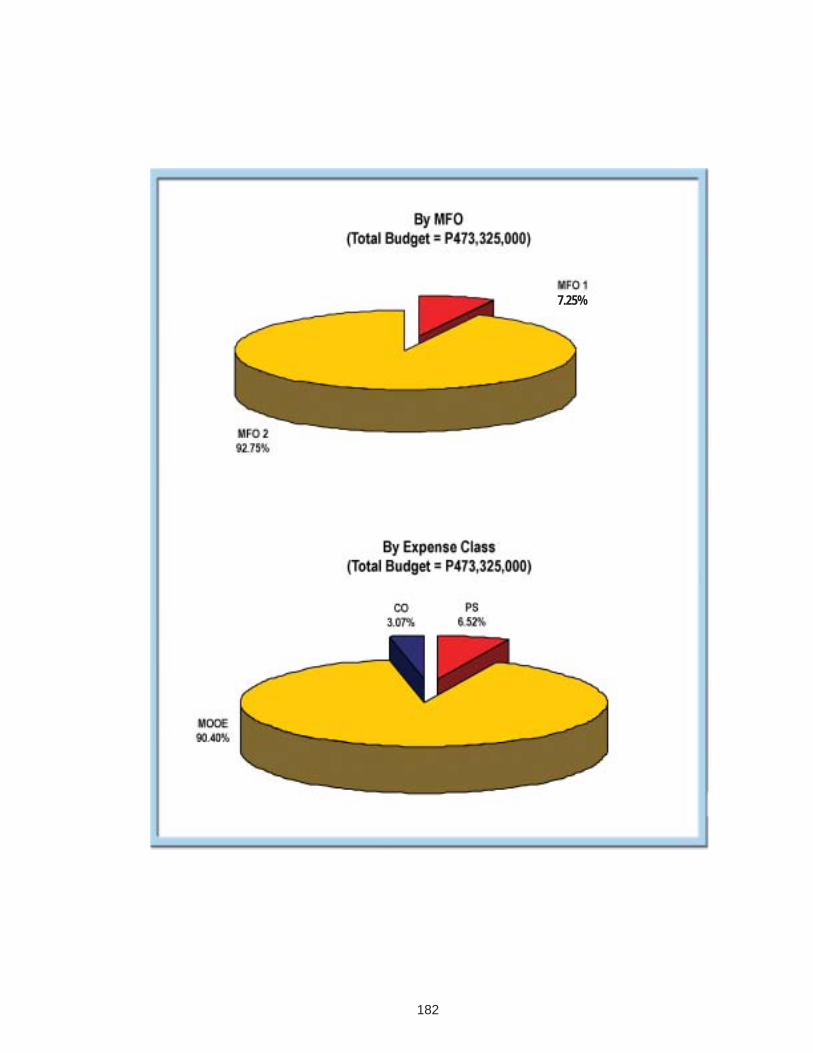
FY 2008 MFO BUDGET
By MFO/By Expense Class(In thousand pesos)
Particulars PS MOOE CO Total % Share
MFO 1 Nutrition policy and program development services 14,034 18,790 1,500 34,324 7.25%
MFO 2 Capability building services for LGUs and other stakeholders
16,849 409,102 13,050 439,001 92.75%
TOTAL 30,883 427,892 14,550 473,325
% Share 6.52% 90.40% 3.07% 100% 100%
FY 2007 FY 2008 Particulars Target Amount
(In ‘000) Target Amount
(In ‘000) MFO 1 Nutrition policy and program development services
24,266 34,324
Performance Indicators No. of policies, standards, programs developed 5 6 No. of policies, standards, programs coordinated 5 6 No. of policies, standards, programs monitored 5 6 No. of program management systems developed 10 10 No. of nutrition assessment, situationer/report released/disseminated 2 2 MFO 2 Nutrition capability building services for LGUs and other stakeholders
28,134 439,001
Performance Indicators No. of conferences, workshops, training with built-in evaluation mechanisms conducted
25
1,277
No. of participants oriented/trained and monitored 50 800,906 No. of local nutrition action plans formulated, locally budgeted/funded, implemented, monitored and evaluated 22,404 22,404
No. of modules, manuals and syllabus developed, printed and distributed, by kind 1,911 2,310 No. of nutrition IEC materials in various titles developed, aired, printed, installed and distributed 11,047 595,060
TOTAL 52,400 473,325
182
7.25%


![NAP Gen. Circular 3 [GRDS for LGUs]](https://img.pdfslide.us/doc/110x75/586a136a1a28ab677d8bb7b9/nap-gen-circular-3-grds-for-lgus.jpg)