Embed Size (px)
Citation preview
����� Department of Health of the Republic of the Philippines ��� Deutsche Gesellschaft für Technische Zusammenarbeit
Health and Management Information System
����
Detlef Schwefel1, Benjamin Ariel Marte2, Teofila Remotigue1,
Maria Rosario David1, Bernadette Carmela Magtaas1,
Vidal Pantilano2, Ferdinand Quijano1, Rachel Delino1,
Manolito Ringor1, Melahi Pons2
1 German Agency for Technical Cooperation, Manila and Cagayan de Oro
2 Department of Health, Manila
����A Health and Management
Information System
for the Philippines
Manila 1995
Philippine-German Cooperation
between the
Department of Health (DOH) of the Republic of the Philippines
German Agency for Technical Cooperation (GTZ)
German Federal Ministry for Economic Cooperation and Development (BMZ)
to Strengthen the
Health and Management Information System
(HAMIS)
Occasional Paper No. 11
Copyright by HAMIS
Department of Health
San Lazaro Compound, Rizal Avenue
1003 Santa Cruz, Manila, Philippines
Telefax: (63-2) 711 61 40 or 815 31 64
i
HAMIS
A Health and Management
Information System for the Philippines
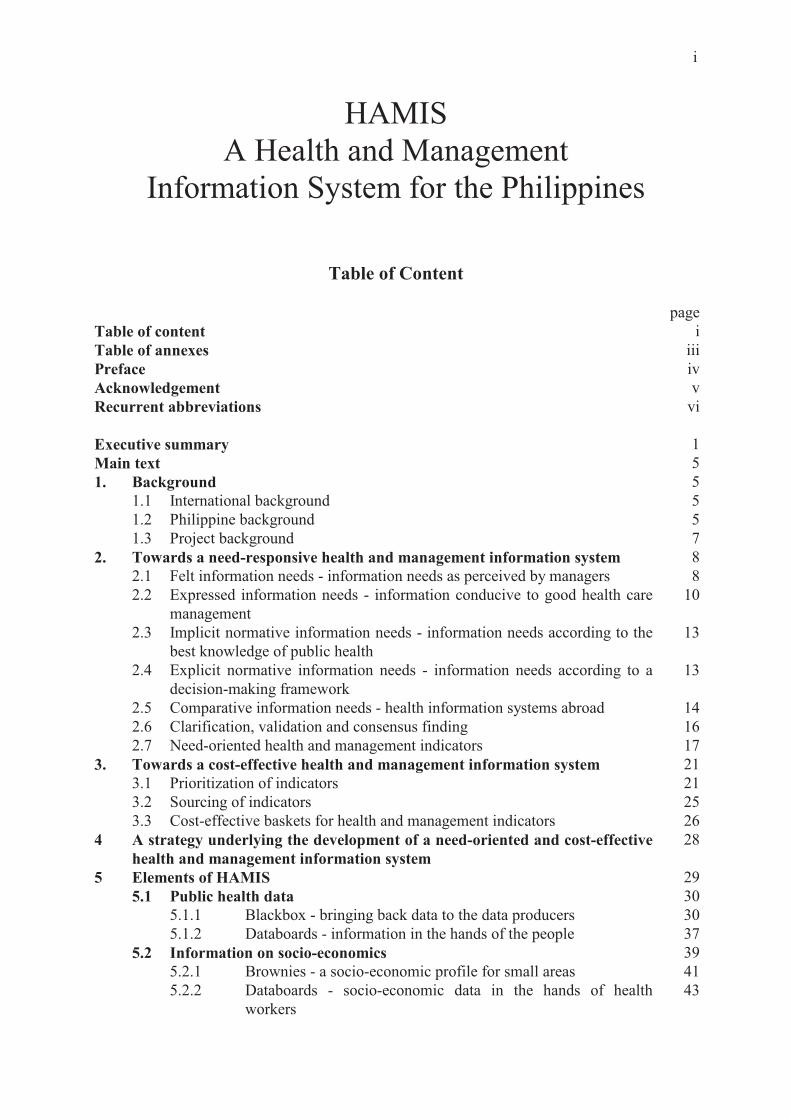
Table of Content
page
Table of content i
Table of annexes iii
Preface iv
Acknowledgement v
Recurrent abbreviations vi
Executive summary 1
Main text 5
1. Background 5
1.1 International background 5
1.2 Philippine background 5
1.3 Project background 7
2. Towards a need-responsive health and management information system 8
2.1 Felt information needs - information needs as perceived by managers 8
2.2 Expressed information needs - information conducive to good health care
management
10
2.3 Implicit normative information needs - information needs according to the
best knowledge of public health
13
2.4 Explicit normative information needs - information needs according to a
decision-making framework
13
2.5 Comparative information needs - health information systems abroad 14
2.6 Clarification, validation and consensus finding 16
2.7 Need-oriented health and management indicators 17
3. Towards a cost-effective health and management information system 21
3.1 Prioritization of indicators 21
3.2 Sourcing of indicators 25
3.3 Cost-effective baskets for health and management indicators 26
4 A strategy underlying the development of a need-oriented and cost-effective
health and management information system
28
5 Elements of HAMIS 29
5.1 Public health data 30
5.1.1 Blackbox - bringing back data to the data producers 30
5.1.2 Databoards - information in the hands of the people 37
5.2 Information on socio-economics 39
5.2.1 Brownies - a socio-economic profile for small areas 41
5.2.2 Databoards - socio-economic data in the hands of health
workers
43
ii
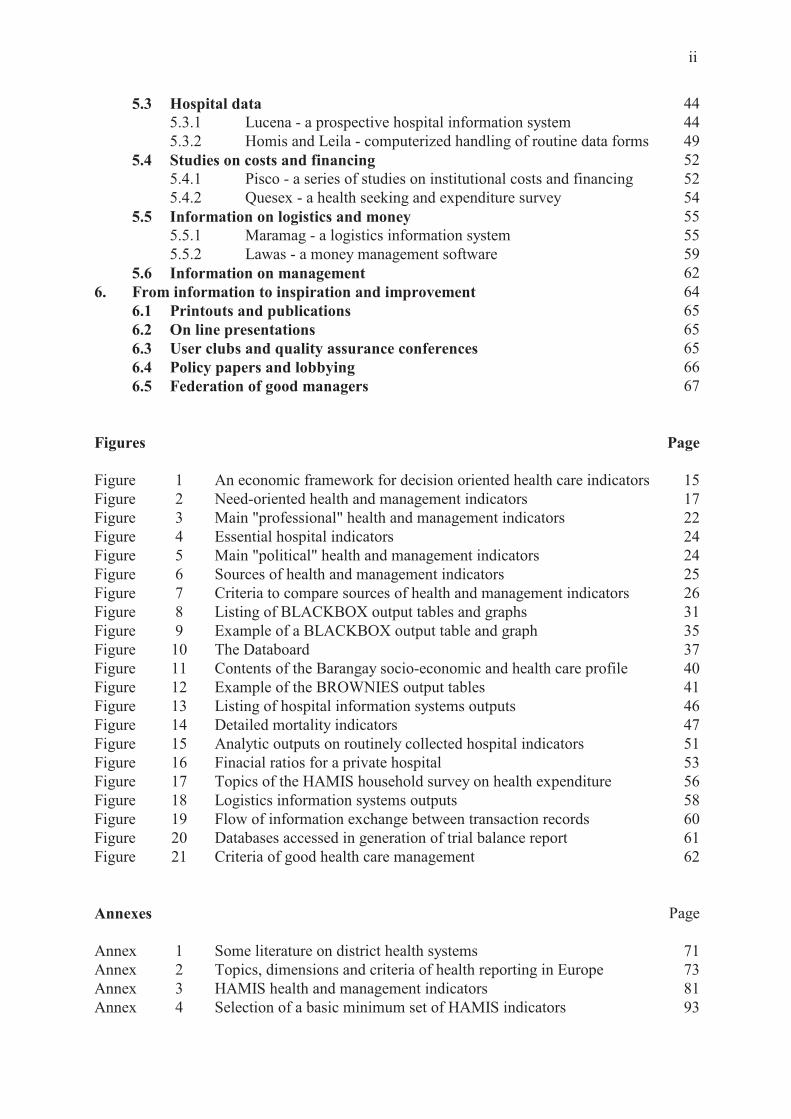
5.3 Hospital data 44
5.3.1 Lucena - a prospective hospital information system 44
5.3.2 Homis and Leila - computerized handling of routine data forms 49
5.4 Studies on costs and financing 52
5.4.1 Pisco - a series of studies on institutional costs and financing 52
5.4.2 Quesex - a health seeking and expenditure survey 54
5.5 Information on logistics and money 55
5.5.1 Maramag - a logistics information system 55
5.5.2 Lawas - a money management software 59
5.6 Information on management 62
6. From information to inspiration and improvement 64
6.1 Printouts and publications 65
6.2 On line presentations 65
6.3 User clubs and quality assurance conferences 65
6.4 Policy papers and lobbying 66
6.5 Federation of good managers 67
Figures Page
Figure 1 An economic framework for decision oriented health care indicators 15
Figure 2 Need-oriented health and management indicators 17
Figure 3 Main "professional" health and management indicators 22
Figure 4 Essential hospital indicators 24
Figure 5 Main "political" health and management indicators 24
Figure 6 Sources of health and management indicators 25
Figure 7 Criteria to compare sources of health and management indicators 26
Figure 8 Listing of BLACKBOX output tables and graphs 31
Figure 9 Example of a BLACKBOX output table and graph 35
Figure 10 The Databoard 37
Figure 11 Contents of the Barangay socio-economic and health care profile 40
Figure 12 Example of the BROWNIES output tables 41
Figure 13 Listing of hospital information systems outputs 46
Figure 14 Detailed mortality indicators 47
Figure 15 Analytic outputs on routinely collected hospital indicators 51
Figure 16 Finacial ratios for a private hospital 53
Figure 17 Topics of the HAMIS household survey on health expenditure 56
Figure 18 Logistics information systems outputs 58
Figure 19 Flow of information exchange between transaction records 60
Figure 20 Databases accessed in generation of trial balance report 61
Figure 21 Criteria of good health care management 62
Annexes Page
Annex 1 Some literature on district health systems 71
Annex 2 Topics, dimensions and criteria of health reporting in Europe 73
Annex 3 HAMIS health and management indicators 81
Annex 4 Selection of a basic minimum set of HAMIS indicators 93
iii
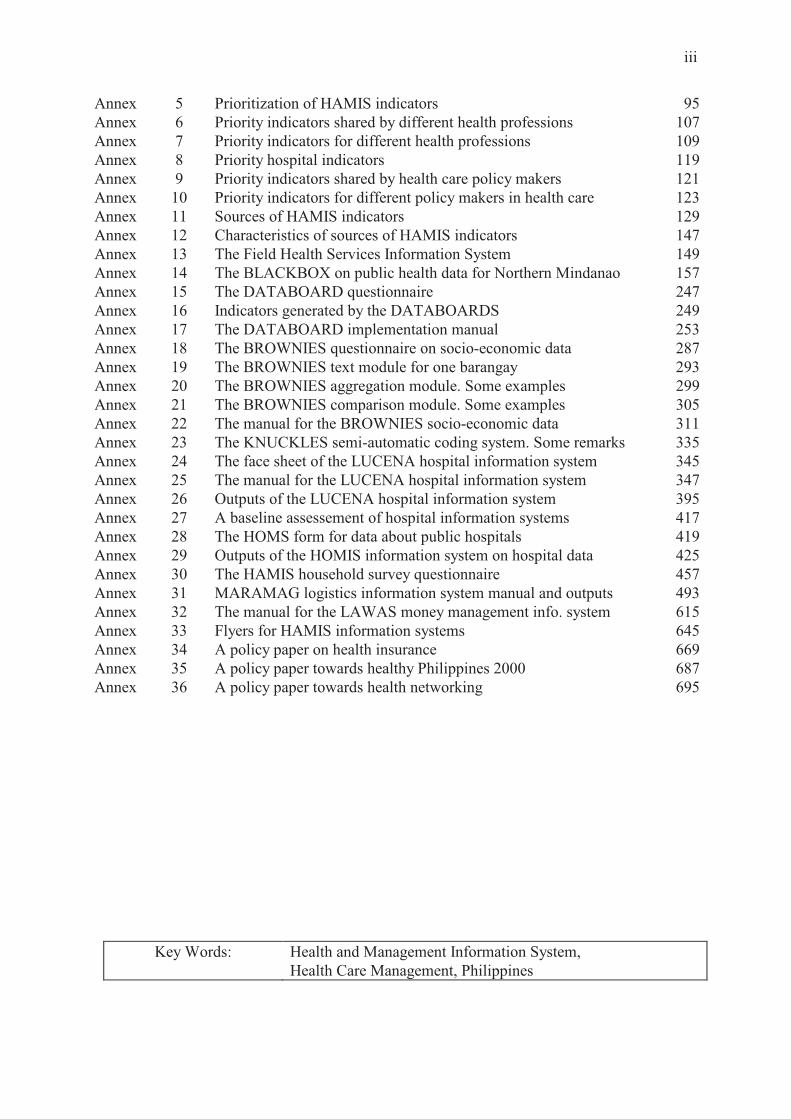
Annex 5 Prioritization of HAMIS indicators 95
Annex 6 Priority indicators shared by different health professions 107
Annex 7 Priority indicators for different health professions 109
Annex 8 Priority hospital indicators 119
Annex 9 Priority indicators shared by health care policy makers 121
Annex 10 Priority indicators for different policy makers in health care 123
Annex 11 Sources of HAMIS indicators 129
Annex 12 Characteristics of sources of HAMIS indicators 147
Annex 13 The Field Health Services Information System 149
Annex 14 The BLACKBOX on public health data for Northern Mindanao 157
Annex 15 The DATABOARD questionnaire 247
Annex 16 Indicators generated by the DATABOARDS 249
Annex 17 The DATABOARD implementation manual 253
Annex 18 The BROWNIES questionnaire on socio-economic data 287
Annex 19 The BROWNIES text module for one barangay 293
Annex 20 The BROWNIES aggregation module. Some examples 299
Annex 21 The BROWNIES comparison module. Some examples 305
Annex 22 The manual for the BROWNIES socio-economic data 311
Annex 23 The KNUCKLES semi-automatic coding system. Some remarks 335
Annex 24 The face sheet of the LUCENA hospital information system 345
Annex 25 The manual for the LUCENA hospital information system 347
Annex 26 Outputs of the LUCENA hospital information system 395
Annex 27 A baseline assessement of hospital information systems 417
Annex 28 The HOMS form for data about public hospitals 419
Annex 29 Outputs of the HOMIS information system on hospital data 425
Annex 30 The HAMIS household survey questionnaire 457
Annex 31 MARAMAG logistics information system manual and outputs 493
Annex 32 The manual for the LAWAS money management info. system 615
Annex 33 Flyers for HAMIS information systems 645
Annex 34 A policy paper on health insurance 669
Annex 35 A policy paper towards healthy Philippines 2000 687
Annex 36 A policy paper towards health networking 695
Key Words: Health and Management Information System,
Health Care Management, Philippines
iv
HAMIS
A Health and Management
Information System for the Philippines
Preface
Since 1989 the German Ministry for Economic Cooperation and Development (BMZ) has
supported the strengthening of the Health and Management Information System (HAMIS) of
the Department of Health (DOH) through its German Agency for Technical Cooperation
(GTZ).
The HAMIS project has sucessfully realized most of its planned activities and has achieved
some very good results. Different HAMIS software modules were introduced to the national
and some local governments and institutions aimed at the gradual and self-sustained take-over
by the users. Social processes to strengthen information production and utilization were
initiated and promoted, e.g., by quality assurance conferences. Through the HAMIS Contests
on good health care management a variety of community programs for those in need was
identified and integrated into an extended national networking. Several of the programs
developed or discovered by HAMIS received national recognition for their valuable
contributions to health and social development.
The long-term goal of HAMIS is to improve the health services in the Philippines. The short-
term purpose of the project is to provide and utilize relevant information and knowledge for a
more equity, efficiency and effectiveness-oriented health management system. Based on a
successful pilot phase (1989-1992) and implementation phase (1992-1995) the project now
intends to consolidate the results to accomplish a sustainable institutionalisation of the project
components. In its final phase these will be the results to be achieved until 1998:
• Health and management information systems are refined and integrated.
• Health and management information systems are implemented in most regions.
• HAMIS is institutionalized at national and some local levels.
• Information-based health policy formulated and advocacy accelerated / intensified.
• Innovative community health management programs are sustained and expanded.
This publication is one of the many achievements of HAMIS. We welcome this contribution
to the performance of the Department of Health. We see it as a fruitful result of a good
Philippine-German Partnership.
Dr Hilarion J. Ramiro, Jr., MD, MHA Dr Manuel G. Roxas. MD, MPH
Secretary of Health Undersecretary of Health and Chief of Staff
Department of Health Department of Health
v
HAMIS
A Health and Management
Information System for the Philippines
Acknowledgements
Papers like this are a product of a team rather than of individuals even if individuals might be
the driving forces. This is why we would like to acknowledge the fruitful cooperation of all
who were members of our team during the time that we had been working on the experiences
and writing this book. They include the following:
Mr Rodelio Ampon
Ms Anita Baguio
Ms Beth Balinas
Dr Jane Baltazar
Dr Teresita Bonoan
Dr Ruben Caragay
Mr Sotico Cascara
Dr Mario Cuento
Ms Gloria G. Custodio
Dr Inocentes Dagohoy
Hon Agnes Devanadera
Dr Marietta Fuentes
Dr Nemesio Gako
Dr Carlos Gamboa
Mr Jose Isaac Gamboa
Dr Leonita Gorgolon
Dr Alejandro Herrin
Mr Francis X. Intong
Mr Robert Kaiser
Mr Emmanuel Lagustan
Dr Noel Lawas
Mr Necito de Leon
Dr Zenaida Ludovice
Mr Robert Manuel
Dr Ophelia Mendoza
Ms Maylene Meniado
Dr Alfredo Mercado
Dr Remigio Mercado
Dr Cesar Morales
Dr Jose Mortus
Dr Juan Nañagas
Ms Agnette Peralta
Dr Rodel Perez
Ms Carmen Ranes
Dr Manuel Salazar
Dr Teodofreda Sarabosing
Dr Cesar Sia
Ms Thelma Tacbas
Ms Charity Tan
Mr Chito Tanchoco
Mr Voltaire Ucab
Ms Crispinita Valdez
Mr Joel Victoria
Dr Filipina Villa
Ms Jona Yapchiongco
Ms Merceditas Yutuk
All Health Workers in Don Carlos, Maramag, Malaybalay, Surigao del Norte, Quezon
Province encouraged our pilot-testing. The HAMIS Winners inspired us.
We would like to express our special thanks for the strong support given to us until 1992 by
former Health Secretary Dr Alfredo R. Bengzon and by his Undersecretary Mr Mario M.
Taguiwalo and very much also to Dr Juan M. Flavier, Secretary of Health, 1992 - 1995.

PARTIAL REPRINT
HAMISA Health and Management Information System
for the Philippines
Detlef Schwefel, Benjamin Ariel Marte, Teofila Remotigue, Maria Rosario David, Bernadette Carmela Magtaas, Vidal Pantilano, Ferdinand Quijano, Rachel Delino, Manolito Ringor, Melahi Pons
Executive Summary
Increased decentralization of health care tries to strengthen self-determination and management at a level closer to the communities. Information support for decentralized health care is the objective of a Philippine-German cooperation. Five approaches were used to justify and develop strategy and components of a need-responsive and cost-effective H ealth and Management Information System (HAMIS):
> felt information needs of health managers were identified via a survey with 192 health managers in two provinces of Northern Mindanao
> implicit normative information needs according to the state of the art of public health were elaborated by an outstanding expert in this field
> explicit normative information needs were drafted according to an economic decision making framework for the health sector
> expressed information needs were analyzed in case studies of good health care management schemes that were discovered by contests in many provinces of the Philippines
> comparative information needs were assessed via a review of health reporting systems abroad.
The health and management indicators that emerged from these steps were reviewed and validated by health managers at local, regional and national levels. After further technical review this list of indicators was fed back in surveys conducted among the different groups of health professionals and representatives of local governments. The purpose of this exercise was to identify key indicators for management at local, provincial and regional levels of health care. The existing as well as the potential data sources for all identified indicators were then determined and compared according to "cost" criteria of availability and supply. These steps allowed us to propose the missing links for a need-responsive and cost-effective information system. Based on all these inputs, HAMIS designed, developed, tested and used the following modules and embarked on the following activities:
> Public health data are presented and analyzed from above and from below: • The Field Health Services Information System (FHSIS) of the Department of Health contains very important data
on health services. These are brought back to the lower levels of health care management in an understandable way through the Blackbox Information System. The Blackbox information system is based on routinely collected data, that covers all over the Philippines.
• Community Databoards were discovered through the first HAMIS Contest. They contain data on public health at the lowest local levels, the “puroks” or household clusters. They are being managed and maintained by Volunteer Community Health Workers. Advocacy, support and national replication for this self sustained information system complements HAMIS activities in this area.
> Information on socio-economics: The missing link between socioeconomics and health care can be filled by using the HAMIS Barangay Socio-economic Profile. In addition to socio-economic data, it contains data on environment, culture, as well as on provision of and access to health care at the local levels. Through interactive clarification and consensus processes this system combines the information demands and needs of program managers and of politicians at different levels of health care.
> Hospital data are presented and produced from inside and from outside: • The development of a computerized Hospital Information System on admissions and discharges was supported
by HAMIS. The system contains management indicators as well as data on morbidity and mortality. In this system, information is a byproduct of good management and vice versa. The system is being replicated now in several hospitals all over the Philippines.
• DOH requires data from all hospitals through the Hospital Operations and Management Service (HOMS) Quarterly Hospital Statistical Report form. The HOMS Report is encoded and analyzed through a software that HAMIS developed. Many of the relevant hospital management indicators can be produced through the abovementioned computerized hospital information system.
> Information on costs and financing is provided from the institutional as well as from the private perspectives: • Institutional cost and financing had been determined through a series of studies on private and public hospitals
and other institutions of inpatient, outpatient and preventive health care.
2
• Private health care expenditure and its financing was identified through a representative survey of more than 1,700 families. Survey findings provides essential background data for health care planning and management.
> Information on logistics and money is provided from the monetary as well as from the material point of view: • Our material management information system deals with the inventory, distribution and monitoring of items such
as drugs, medical supplies and laboratory supplies. We set up a library of a wide range of items. After pilot-testing, the system is now used for health care management.
• A money management information system supports the cashiers´ and the accountants´ job. It shall be linked with the above mentioned material management information system.
> Information on management: Last but not least, one important step for obtaining knowledge on the data and information of good management is the discovery of good management models. We conducted a national contest for this discovery exercise. The role of data and information as production factors for such a management was likewise examined which led to the establishment of an association of all such excellent health care managers whose active participation and involvement are vital in the health care arena.
From information to inspiration and improvement: Data/information/knowledge obtained through HAMIS instruments are being recycled back in an understandable way to health workers and decision makers in the communities and local governments through various means and media such as: > tailor made compilations of most relevant tables for groups of endusers > manuals and diskettes containing softwares and data files > policy papers and case study reports and publications > workshops and conferences and seminars > “soul massaging” through many very intensive one-on-one conversations Information based quality assurance programs in focal hospitals and provinces support this drive towards linking information and action, and ultimately, towards improving the health management system. This is how we try to increase equity, efficiency and effectiveness of health care.
HAMIS
A Health and Management Information System for the Philippines
Main text
1. Background
1.1 International Background
During recent years, the concept of "district" health systems received increasing attention. International literature (Annex 1) hints at three major features: > Closeness to the grassroots: District health systems
are seen as a vital link between grassroots levels of primary health care and national levels of health policy making as indicated by the following connotations taken from a WHO declaration: "close to where people live", "local level", "community needs".
> Self determination: A second aspect is the decentralization conceived in the same WHO declaration, as indicated by such terms as "certaindegree of autonomy", "local government", "community action", "effective participation". District health systems are thus smaller but nearlyself-contained and self-sustained health systems without the usual gaps between policy and action, aiming and doing, planning and managing. This relates very much to the important question of local financing and resource allocation.
> Management: District health systems are at the same time the best entry point to remedy a weak
organization and management. Such had been detected during primary health care implementation time and again. It referred to the intra- and intersectoral management as well as to community participation. The catchword here is: "manageable units".
Thus, the very issue of district health systems might be seen as a fashionable fresh focus and as a ready remedy to solve the problem that health planning and management were rather nice words than realities, hitherto. The entry point for problem solving is not at the top nor at the bottom but somewhere in-between.
1.2 Philippine background
Two major issues shaped the meaning of the concept of a decentralized or a "district" health system in the Philippines, an earlier one within the Department of Health and a more recent one on a national scale:
> District Health Offices: It was during the AquinoAdministration in 1986 when the Department of Health (DOH) was reorganized. This brought about the creation of District Health Offices (DHOs). The main function of the DHO is to control and supervise curative and preventive health services in a catchment area below the level of a province but
3
above that of a municipality. The presence of DHOs should allow a better front-line administration andmanagement, and introduce an intermediate management level between the 77 provinces and the 1,935 municipalities. The provinces and municipalities that constitute the main layers of political administration between the 41.226barangays and the nation. The DHO was essentially built around the existing smaller hospitals of DOH,whose tasks and responsibilities were widened to integrate public health and clinical services. In response to international request, DOH created a Task Force to conceptualize a District Health System, to define major responsibilities and authorities, to look into the organizational support needed, to assess the relationships with other DOH levels, and to enhance the management capability ofthe DHO chief. Essentially, the District Health Offices would take over some financial and managerial responsibilities of the Provincial Health Offices. The proposed policy statements and implementing guidelines of that Task Force were onepolitical legacy of the Aquino administration.
> Local Government Code: Another legacy of the Aquino administration is the 1991 Local Government Code. The Code provides for the reassignment of tasks of the health planning, management and operation to provinces and municipalities, bringing back responsibilities in the hands of local governments. This act apparently introduced decentralization by giving local government units more powers, authority, responsibilities and resources via their own sources of revenue. Decentralization also enables the maximization of resources as well as the devolutionof responsibilities, including health services hitherto assumed by the national government. In quite a drastic way, the power structure shifted from a central government to local governments. In the health sector it means that the 77 provinces take over the responsibilities of the government hospitals, and the thousands of mayors of cities or of municipalities are now given the responsibility for planning and managing health offices, health centers and health stations, and for implementing public health programs. Only tertiary health care, some vertical programs, and functions of policy, advice, standards and regulation, remain in the hands of the central government. In fact, a very long stabilization period until 2020 is foreseen for this Code’s full implementation.
Because the District Health Office did not have a corresponding political level organization (the Local Government Code does not provide for it), the plan for a district health office therefore had only little chance to survive. It was a rather unpolitical and technocratic bowing to international discussions. The concept of the importance of smaller scale management units, however, became a pillar of the “new Philippines”. Decentralization runs the risk of slicing health care into units that are sometimes non-viable and too small, each consisting on the average of half a million constituents. The health care system might be renationalized or its decentralization suspended orrevitalized, time and again. Nevertheless, the creation of DHOs and the provisions of the Local Government Code show a clearer thrust towards administration and management at lower levels than before, closer to the communities and with a broader autonomy. These developments incorporate basic ideas regarding district health systems as promoted and disseminated by the international health systems community.
1.3 Project background
Valid and reliable information is an essential prerequisite for a more effective, efficient, and equitable health care system. Since 1989, the Federal Republic of Germany has supported the DOH in such endeavors through a grantchanneled through the German Agency for Technical Cooperation (GTZ) on behalf of the Federal Ministry for Economic Cooperation and Development (BMZ), starting 1989.1 By means of the Goal Oriented Project Planning (ZOPP) methodology, essential elements were found to strengthen the health and management information system (HAMIS) in the Philippines. The salient points of this planning strategy are: > planning mainly by Filipino nationals > participation of various professional groups with
different levels of responsibility > use of visualization techniques > smooth consensus finding and democratic decision
rules.
It was repeatedly discovered in ZOPP that a core problem in health care management in the Philippines was aninefficient and ineffective health and management information system. Six major causes were identified and worded into epidemiological and economical language: > information gaps = insufficient supply > underutilization of data = insufficient demand > excessive generation of data = excessive supply > poor reliability and validity of data = insufficient product quality > lack of skills in information management = poor production management > lack of cost-effectiveness of health management. Following ZOPP methodology these problems were translated into objectives. The objectives were then opera-tionalized by identifying the activities to achieve them.
The interaction between planning, exploration, implementation and replanning shows clearly that developing or strengthening health and management information systems is not just a technical matter of data handling and informatics. It is also multidisciplinary involving the medical and social sciences, and economics. HAMIS has at least four dimensions, namely: > Information on management means discovering good
management practices in the field. It means understanding from reality and not just from textbooks, what good management is, and the role that data and information play in it. It is a kind of information sociology.
> Information for management means improving management of health care through data and information, and thus enhancing an information culture for key areas of concern; for example, decentralized health care and assured health care for the poor. Medical informatics is at stake.
> Information management refers to information economics, i.e. efficiency in informatics and information collection and using need-responsiveness and cost-effectiveness concepts.
> Project management means addressing this broad focus pragmatically in view of constraints.
1 Details of the planning methodology, processes and outcomes
are documented in: Melahi Pons and Detlef Schwefel:
Strengthening Information Support for Health Care. A Goal-
Oriented Project Planning Exercise in the Philippine Context.
Manila (HAMIS at the Department of Health: Occasional Paper
Number 1) 1992. 160 pages
4
These four dimensions of HAMIS deny a predominantlytechnical notion of health and management information systems. Rather, they are part and parcel of an incremental but nevertheless systematic approach to use data and information and understanding to strengthen a knowledge-based, i.e. rational decision making to improve effectiveness, efficiency and equity in health care.
To develop some key elements of a Health and Management Information System (HAMIS) it was thought that the district level of health was a very appropriate one to start at. This was in line with the international discussion and laid a good groundwork for a need-oriented and user-responsive development and a careful pilot-testing of HAMIS. Since its inception, the Philippine-German Cooperation on HAMIS was to address information needs at the grassroots rather than that at the higher levels.
2. Towards a need-responsive health and management information system
There seems to be a general understanding and/or feeling of what good management is. With the absence of a generally accepted theory of management, we posit that the driving forces behind management are legally enforced and/or socially accepted rules of achieving goals as well as smart and entrepreneurial personalities. Some of these forces are already understood, others not yet. Nevertheless, one of these forces might be knowledge. Data and information are but means for this, sometimes important ones. Our basic aim therefore is to contribute to a knowledge-basedmanagement of health and health care.
There are at least four approaches toward conceptualizing the basic framework for data / information / knowledge needed to improve management of health care: a felt needs: assessing the felt needs of managers, i.e.
identifying the data and information demand as perceived and requested by health care managers
b expressed needs: identifying the information thatgood managers use, i.e. discovering good health (care) management examples and analyzing (retrospectively) what information and/or knowledgehad been used and if this was strategically important for good management
c comparative needs: studying the data and information used or the information requirements proposed by similar projects (here and abroad), i.e. doing a comparative analysis of health and management information systems in the health care sector
d normative needs: taking into account the recommendations of outstanding public health specialists, e.g., at Schools of Public Health and/or conceptualizing a theory, e.g., by constructing a decision oriented framework for health (care) management and deriving information needs from this.
These ways of working out a basic framework differ in that they get its legitimization from individuals (a), analysis of experiences (b and c) and/or from implicitly or explicitly formulated scientific considerations (d). If there were a framework that could be legitimized by most of suchsources of knowledge, this would be a good one.
2.1 Felt information needs - information needs as perceived by managers
In two provinces of Northern Mindanao, HAMIS conducted a survey to assess the felt information needs of local health
care managers.2 Local health care managers comprise all groups of health personnel, i.e. midwifes staffing the health stations, nurses supervising them, staff at the health centers and hospitals. We interviewed 192 health managers altogether. Felt information needs were assessed within the conceptual framework of a socioeconomic production cycle of information: > it starts with an identification of felt information
needs and demands, > continues with the assessment - of the production factors (manpower,
material, money, etc.) and - of the production processes (mobilization,
motivation, etc.) > to get data (through (imposed) filling of forms or
data collection) and to transfer and process and analyze them (by certain categories of manpower)
> until an enduse is achieved by the data and information beneficiaries
- in the intermediate form of tables and analyses and
- in the final form of a modified management > that should improve health care and/or raise new
questions that > initiate the reproduction of the production cycle of
information, again and again. This production cycle interlinks needs, demands, production, end-use and reproduction of data and information.
Empirical approaches related to this socioeconomic viewpoint of a production cycle of information lead to important findings. Enforced by higher levels of management, local health care managers are usually requested to collect and process data. Many times they themselves do not need such data. If they need them they get them back very late, if ever. Often they are not trained to collect or to analyze and understand them. Even if this obligatory data collection and transfer is being mandated from above, it is seldomly supervised and controlled. Higher level program managers sometimes ask for data but do not use them properly, if at all. On the other hand, the data that local health care managers use and need in their daily routine of patient management and prevention and promotion are not being supported, as a rule. Localmanagers are usually left alone with their own needs and demands for data and information and knowledge to improve services and/or alleviate the burden of everyday work.
These dilemmas between data demand and information supply, and among managers at different levels, lead to poor data quality, to overproduction, and to unsatisfied demand, all at the same time. It could be seen as the result of a planned information economy that is not linked to real information markets, to phrase it in a fashionable way. If information and management - i.e. supply and need/demand for data and information - were linked by concepts as e.g., an information based decision making by and for thedifferent levels of managers involved, then a better quality of information and management could result. Conceptually, the best results could be expected when a kind of information subsistence economy would exist, where the consumer of information is the producer of information at the same time. The two paradigms of an information subsistence economy and of market economies for information hint at this intrinsic relationship that is so vital for strengthening health care management.
2 Ophelia M. Mendoza: The Philippine Health and Management
Information System. Baseline Assessment in two Provinces of
Northern Mindanao. Manila (HAMIS at the Department of
Health: Occasional Paper Number 2) 1992. 70 pages
5
> Information subsistence economy: this concept reinforces the point of view that information is being produced properly and with quality if it is being needed, demanded and used or consumed by the producer her/himself.
> Information market economy: this concept looks into the different markets of information for the different demands of different customers and stresses that information is being "bought" only if demanded and usable.
The felt information needs of health managers do not primarily pinpoint a certain set of data or indicators. They rather ask to close the existing gap between knowledge and management through appropriate tools of health and management information systems.
This has at least three implications for developing or strengthening health and management information systems. > From information to management: It is asking to
strengthen and to reinforce and to analyze the self-sustained authentic and autochthonuous data production processes and information systems at anylevel of health care management. The Community Databoards are one example. They were discovered by HAMIS in Northern Mindanao. These are local information systems in the hands of volunteer health workers. They are spot maps of the catchment. They contain at least seven indicators collected quarterly for each and every household at the level of the purok, i.e. of about 50 households: immunization, nutrition, prenatal care, water, garbage, toilets, family planning and - if the communities decide so - on vegetable gardening, smoking or alcohol consumption. It is an example of a health information system that is subsisting on its own - in a sustainable way.3 This is a self-sustained way of proceeding from information to management.
> From management to information: A self-sustained way of proceeding from management to information would be, for example, a hospital information system that is a byproduct of proper case management. In developing our Hospital Information System we proceeded from the understanding that the routine practices of admission and discharges - a bit rationalized, though - should be the starting point for collecting and processing the data. This avoids additional data collection and reduces the burden of the admissions and medical records clerks. The sameholds true for managing the data of the cashiers and of the accountants in the hospitals.4
> Comparing viewpoints or even confronting information systems: Opposing views will persist, however strong our arguments are in favor of an integrated information production cycle. This should not be seen as something negative. Rather, it givesthe chance of comparing them: public health data asshown in imposed information systems versus those in self-sustained information systems, hospital data as reported to data demanding agencies versus thosethat are a byproduct of good management, logistics data from the money point of view versus the
3 In 1993 one of the 23 national programs of the Department of
Health was to strengthen and expand this "information system in
the hands of the people". Our Popular Paper Number 2 gives the
details. Teofila E. Remotigue, Maria Rosario David, Risa
Yapchiongco, Oscar Banias, Teresita Bonoan, Detlef Schwefel:
Health Databoards for Communities. An Orientation Guidebook
on the National Implementation of the Community Health
Databoards. Manila (HAMIS at the Department of Health:
Popular Paper No.2) 1994, 193 pages. For some more details:
see chapter 5.1.2.
4 See details regarding the hospital and the money management
information systems in chapter 5.3.
material point of view, cost and financing information at the level of households versus the level of institutions. Such comparisons are rather relevant for the checking of reliability and validity.
The first two issues show that health and management information systems can evolve from the actual pattern of concerns of the managers rather than from any kind of imposed data and information collection that does not correspond to the management needs. The third point shows that a systems perspective is advisable. Such are the lessons to be learned from an analysis of the felt information needs of health care managers.
2.2 Expressed information needs - information conducive to good health care management
One should know what good health care management is, if one is to build up a health and management information system that would improve health care management. Discovering good health care management is often the neglected other side of Health and Management Information Systems, which usually limit themselves to the question of data and information management. One source of information is to discover, describe and analyze examples of innovative health management schemes. At the level of local health services a contest for discovering innovations is a choice that HAMIS used.5
In 1991, more than 100 applications for the First HAMIS Contest were received from all regions of the Philippines and from 52 of the 77 provinces. All applications were subjected to a standardized four-fold peer review. A total of 70 projects from 50 provinces were screened in detail through site visits. A checklist of 59 binarily worded criteria looked into quality, innovativeness, effectiveness, equity, efficiency and sustainability. One project was unanimously chosen as the best by all Selection Committee members, two others with only one dissenting vote each. In aceremony held in Malacañan Palace, the three gold and the eight silver winners were awarded by the President of the Philippines, the German Ambassador and the Secretary of Health. In the Second HAMIS Contest held in 1994, the Philippine President awarded 68 additional outstanding health care management models. The winners of the HAMIS Contests show that there are innovative ways of improving effectiveness and efficiency of health care for those in need. An in-depth research was done to study factors of success of these winners. It was found that good management makes way for improvement in health care under any given circumstances. The experience of the winners showed that good health care management means doing the right things despite scarcity of resources and immobility of institutions and people. Good health care management > discovers untapped resources in terms of financial,
material, moral and time resources, for example, through innovative ways of fund raising or using herbal plants or converting charity into economics or using the time of mothers of malnourished children,
> mobilizes human and intellectual resources, for example, via empowerment of mothers and health workers and through better use of knowledge and information,
5 Detlef Schwefel, Melahi Pons: Discovering Good Management.
An information system on innovations in health care
management in the Philippines. Manila (HAMIS at the
Department of Health: Occasional Paper No. 5) 1993, 160
pages, and: Melahi C. Pons, Detlef Schwefel: Good Health Care
Management. The Winners of the First HAMIS Contest. Manila
(HAMIS at the Department of Health: Popular Paper No.1)
1993, 192 pages.
6
> combines existing resource patterns resulting in multiplicative effects, for example, university training and health services or private and public health services or radio stations,
> reconfirms productivity gains through self-organization and banding together, for example, through patient associations and drug cooperatives.
Good health care management in this sense is the more productive use of otherwise overlooked resources for the benefit of those in need.
After the first contest, the 52 winners formed associations to strengthen and lobby for good management. HAMIS Clubs were built upon issues of mutual interest, i.e. community health workers, herbal medicine, drug cooperatives, health financing and health insurance. The winners associated into a Regional Unification of Northern HAMIS Winners (RUN-WIN) and a Southern HAMIS Association for Regional Progress and Development (SHARP). Both federated in1993 into the Federation of HAMIS Winners in the Philippines, Inc. with the aim of networking and reinforcing the members, replicating achievements, and disseminating the message of good health care management. This enabled and empowered the winners to participate actively in local and national policy making, as for example on incentives for barangay health workers, national health insurance, community drug insurances, herbal medicine, community databoards. The winners were coequal partners for preparing, implementing and using the second HAMIS contest - in 1994 - to bring into their Federation another 68 excellent health care managers and to establish and renew self-sustainable reassurance networks to benefit the poor.
The contest served us to study the expressed information needs of good health care managers. As we had seen during our felt needs analysis, poor health care managers often ask others to provide data and then they just file them and start to invent new forms. Opposite to this practice, what is the role that data and information play for good health care managers? Extended case studies were undertaken regarding more than 30 of these projects to try to understand them better. Four multidisciplinary research groups from the University of the Philippines and one from La Salle University did these studies. In their terms of reference, they were to ask the respondents if data and/or information and/or knowledge were decisive elements to turn an idea into good management, and to sustain it. This was considered to be a source to validate health and management information systems.6 What were the results? Good management can be found within a challenging or a supporting context. It can originate within an especially poor array of resources or with good resources at hand. It can start alone and from scratch, or might be reinforced by a wider and broader program, i.e. an institutional network or a comprehensive health and livelihood approach. Community organizations and volunteers can provide a proper back up.
6 See the HAMIS Occasional Papers on the extended case studies:
Minda Mella, Yolanda D. Romblon, Maria Fe A. de los Santos:
Community-based health care financing schemes. Extended case
studies on good health care management in the Philippines.
Manila (HAMIS at the Department of Health: Occasional Paper
No.7) 1994, 52 pages; Romeo Quieta: Health strategies and
interventions. extended case studies on good health care
management in the Philippines. Manila (HAMIS at the
Department of Health: Occasional Paper No. 8) 1994, 64 pages;
Maruja Asis: Community-based initiatives in health:
Development, growth and transformation. Extended case studies
on good health care management in the Philippines. Manila
(HAMIS at the Department of Health: Occasional Paper No. 9)
1994, 60 pages; Maria Elena Chong-Javier: Innovative Health
Care Management in the Philippines. Manila (HAMIS at the
Department of Health: Occasional Paper No. 10) 1994, 113
pages; Sandra Tempongko et al: Case Studies on Good Health
Care Management (in preparation).
Such reinforcement, we see, can stem from many different realities. The context seems to be not the decisive factor to predict good management. It is rather the human factor. It is the proper personality traits and leadership qualifications of the managers. Leadership means empowerment of partners, staff and target groups. One who excels in clarifying or even simplifying goals and objectives, especially at the earlier stages of a project. One who keeps the processes going on through smooth follow up and motivation. In the Philippines it is women that often play this role of a "guiding star" or "moving spirit" behind good health care management.
What about the role of data and information for good management? Here again, it was not the pinpointing at individual data or information requests that we found, or long listings of indicators. Our findings hint at something that deals with realities way beyond data. Yes, data are being needed for good management. And good managershave essential data on population, health status, health care, and its natural and socioeconomic environment. Usually not in computers or on paper, but “at their fingertips”. Insiders like them know already what outsiders have to get through formal or even computerized information systems. This refers especially to smaller projects or catchments. Good managers do not look so much into individual data but into their relationships and into the linkages with concepts behind such data. Such linkages between data, information, understanding, knowledge and even values and wisdom is one key for good management.
These results of our extended case studies on good health care management (that are not yet completed) show that data and information and understanding and knowledge and wisdom and values and personality traits interact very strongly, and that a health and management information system has to be seen in this very broad context.
2.3 Implicit normative information needs - information needs according to the best knowledge of public health
Data and information are an essential pillar of any public health activity. Schools of Public Health are considered to be the standard setting institutions for public health policies, programs and projects. To elicit such prevailing standards HAMIS asked one of the outstanding personalities in the College of Public Health, University of the Philippines - Remigio Mercado - to draft a list of relevant indicators for district health (care) management according to his best knowledge. He was asked to do so in his capacity as a professor of public health administration, as a long-term (district) health care manager in the Philippines and a long-term consultant at the WHO´s Regional Office for the Region.7
He started by citing the Philippine Constitution and its recognition that health is a fundamental human right. He linked this to some internationally acclaimed fundamental goals of health care: that health should be for all and thus the primary health care approach should be chosen, especially in favor of the poor. Health planning and health care management were then looked into at the district level. "In planning and managing the district health system, one unavoidably has to resort with measurements which have become controversial as the discipline of public health advances." Then he lists the usual canon of difficulties with reliability and validity, accuracy and completeness,
7 Remigio D. Mercado: District Health Indicators. Indicators in
support of the district health system. Manila (HAMIS at the
Department of Health: Occasional Paper No. 3) 1993, 23 pages.
7
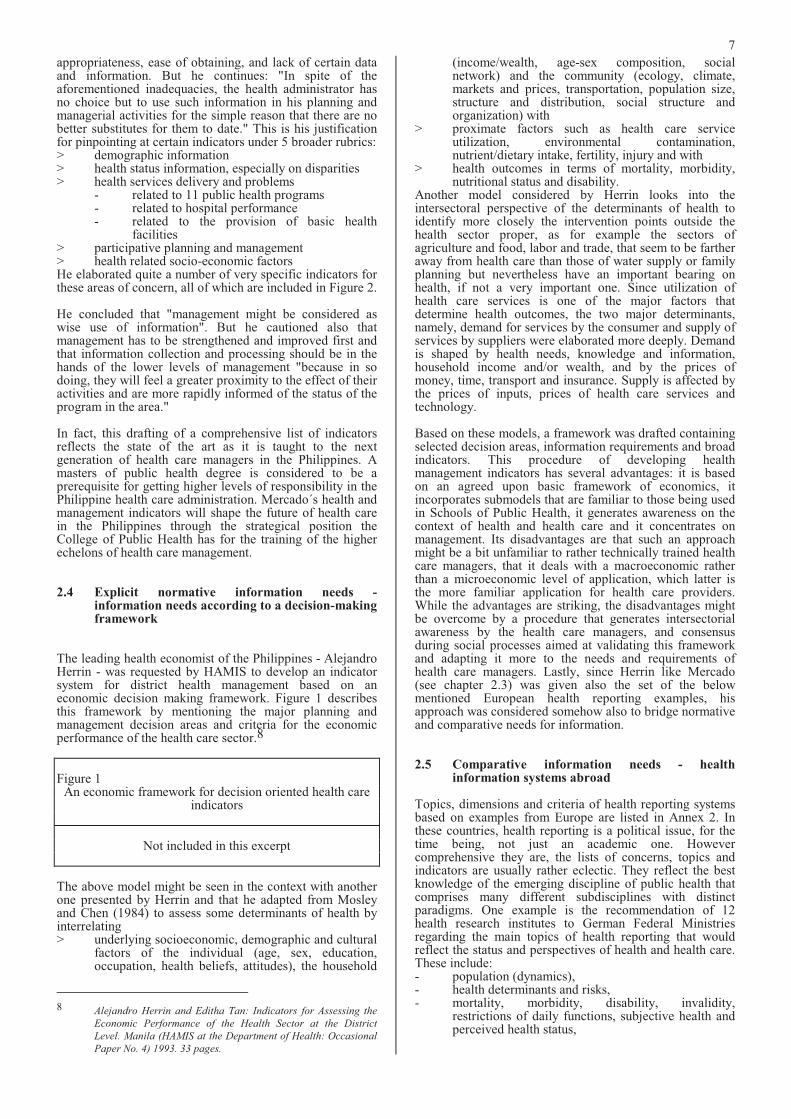
appropriateness, ease of obtaining, and lack of certain data and information. But he continues: "In spite of theaforementioned inadequacies, the health administrator has no choice but to use such information in his planning and managerial activities for the simple reason that there are no better substitutes for them to date." This is his justification for pinpointing at certain indicators under 5 broader rubrics: > demographic information > health status information, especially on disparities > health services delivery and problems - related to 11 public health programs - related to hospital performance - related to the provision of basic health
facilities > participative planning and management > health related socio-economic factors He elaborated quite a number of very specific indicators for these areas of concern, all of which are included in Figure 2.
He concluded that "management might be considered as wise use of information". But he cautioned also that management has to be strengthened and improved first and that information collection and processing should be in the hands of the lower levels of management "because in so doing, they will feel a greater proximity to the effect of their activities and are more rapidly informed of the status of the program in the area."
In fact, this drafting of a comprehensive list of indicators reflects the state of the art as it is taught to the next generation of health care managers in the Philippines. A masters of public health degree is considered to be a prerequisite for getting higher levels of responsibility in the Philippine health care administration. Mercado´s health and management indicators will shape the future of health care in the Philippines through the strategical position the College of Public Health has for the training of the higher echelons of health care management.
2.4 Explicit normative information needs - information needs according to a decision-making framework
The leading health economist of the Philippines - Alejandro Herrin - was requested by HAMIS to develop an indicator system for district health management based on an economic decision making framework. Figure 1 describes this framework by mentioning the major planning andmanagement decision areas and criteria for the economic performance of the health care sector.8
Figure 1An economic framework for decision oriented health care
indicators
Not included in this excerpt
The above model might be seen in the context with another one presented by Herrin and that he adapted from Mosley and Chen (1984) to assess some determinants of health by interrelating > underlying socioeconomic, demographic and cultural
factors of the individual (age, sex, education, occupation, health beliefs, attitudes), the household
8 Alejandro Herrin and Editha Tan: Indicators for Assessing the
Economic Performance of the Health Sector at the District
Level. Manila (HAMIS at the Department of Health: Occasional
Paper No. 4) 1993. 33 pages.
(income/wealth, age-sex composition, social network) and the community (ecology, climate, markets and prices, transportation, population size, structure and distribution, social structure and organization) with
> proximate factors such as health care service utilization, environmental contamination, nutrient/dietary intake, fertility, injury and with
> health outcomes in terms of mortality, morbidity,nutritional status and disability.
Another model considered by Herrin looks into the intersectoral perspective of the determinants of health to identify more closely the intervention points outside the health sector proper, as for example the sectors ofagriculture and food, labor and trade, that seem to be farther away from health care than those of water supply or family planning but nevertheless have an important bearing on health, if not a very important one. Since utilization of health care services is one of the major factors that determine health outcomes, the two major determinants, namely, demand for services by the consumer and supply of services by suppliers were elaborated more deeply. Demand is shaped by health needs, knowledge and information, household income and/or wealth, and by the prices of money, time, transport and insurance. Supply is affected by the prices of inputs, prices of health care services and technology.
Based on these models, a framework was drafted containing selected decision areas, information requirements and broad indicators. This procedure of developing health management indicators has several advantages: it is based on an agreed upon basic framework of economics, it incorporates submodels that are familiar to those being used in Schools of Public Health, it generates awareness on the context of health and health care and it concentrates on management. Its disadvantages are that such an approach might be a bit unfamiliar to rather technically trained health care managers, that it deals with a macroeconomic rather than a microeconomic level of application, which latter is the more familiar application for health care providers. While the advantages are striking, the disadvantages might be overcome by a procedure that generates intersectorial awareness by the health care managers, and consensus during social processes aimed at validating this framework and adapting it more to the needs and requirements of health care managers. Lastly, since Herrin like Mercado (see chapter 2.3) was given also the set of the below mentioned European health reporting examples, his approach was considered somehow also to bridge normative and comparative needs for information.
2.5 Comparative information needs - health information systems abroad
Topics, dimensions and criteria of health reporting systems based on examples from Europe are listed in Annex 2. In these countries, health reporting is a political issue, for the time being, not just an academic one. However comprehensive they are, the lists of concerns, topics and indicators are usually rather eclectic. They reflect the best knowledge of the emerging discipline of public health that comprises many different subdisciplines with distinct paradigms. One example is the recommendation of 12 health research institutes to German Federal Ministries regarding the main topics of health reporting that would reflect the status and perspectives of health and health care. These include: - population (dynamics), - health determinants and risks, - mortality, morbidity, disability, invalidity,
restrictions of daily functions, subjective health and perceived health status,
8
- supply of health facilities and services and central aspects of health policies,
- utilization of health services, - expenditures, income and financing networks as well
as costs of selected diseases or groups of diseases. The proposed topics and/or indicator sets listed above are usually not based on theoretical frameworks but on checklists such as: - health status components: mortality, morbidity,
functional impairments, perceived health status, risk factors, etc.
- health system components: health, health care, health system or structure (resources and supply), process(utilization and quality), outcome (satisfaction and quality))
or evaluation criteria such as: - importance, relevancy, significance, appropriateness,
effectivity, efficiency, need-orientation, coverage, affordability, accessibility, equity, completeness,coordination, intersectorality, multidisciplinarity, acceptability, compliance, participation, orientation towards planning and evaluation or - in a more condensed way -
- efforts, effectiveness, efficiency and equity. Checklists try to ensure a theoretical comprehensiveness whereas evaluation criteria provide a more practical approach based on critical concerns encountered during (previous) evaluations. The advantage of these listings is that hardly anything is overlooked, the disadvantage is that too much is required. Nevertheless, they are starting points. The Performance Indicators for the British Health System - for example - were based on similar considerations, too, even if not as comprehensive as the cited ones. Theinteresting feature is that they were submitted to rigorous justification and consensus finding processes involving good researchers and good managers. A combination of both procedures might be promising: comprehensive checklists and listings are good starters to be validated in social processes of awareness generation, justification and consensus finding.
2.6 Clarification, validation and consensus finding
The five approaches thus discussed elaborate upon the needs for a health and management information system. They stem from quite different levels of legitimacy: > the viewpoints and actions of managers, > the experiences of other projects, > the state of the art of research and science. The more that these sources of legitimization converge in justifying information needs, the more essential are such information needs.
To develop a list of essential data and information for decision making and management in health care, we initiated the social processes for clarification, validation and consensus finding. By including the academe and managers and experts of foreign information systems, bridges between the different justifications of needs could be constructed.
Being usually physicians, decision makers in public health might consider models as presented by Herrin as too macro-economic in scope. To overcome such biases, the model was submitted to several loops of clarification, validation and consensus finding. These loops were meant at the same time to bridge the normative and felt needs for information.
The first validation loop for the economic decision making framework was done in a set of informal meetings and discussions with district health managers in the Province of Misamis Oriental in Northern Mindanao, home province of the proponent of the model. The results of this validation were incorporated in his final models and the resulting indicator set.
The second validation and consensus loop was done during a conference participated in by nearly all the health officers from the District, City and Provincial Health Offices in Northern Mindanao. This conference started with a presentation of the framework and its suggested set of indicators for health care management and an open discussion on it. On the second day, it was complemented by workshops to draft the usual decision patterns by health managers and to derive information needs from that. Most of the points raised by Herrin were validated; others were reformulated by him. This conference was used also to get comments on our analysis of the felt needs for data and information, that had been conducted in Northern Mindanao several months before.
A national consensus conference was held with the Secretary of Health and all his Undersecretaries as well as with leading figures from health care associations and the academe. During this conference the results of the above mentioned felt needs analysis, those of the implicit normative needs assessment of Mercado as well as the explicit normative needs model of Herrin were presented and discussed in detail. This procedure resulted in a consensus about the main elements of the district health and management indicator system to be used.
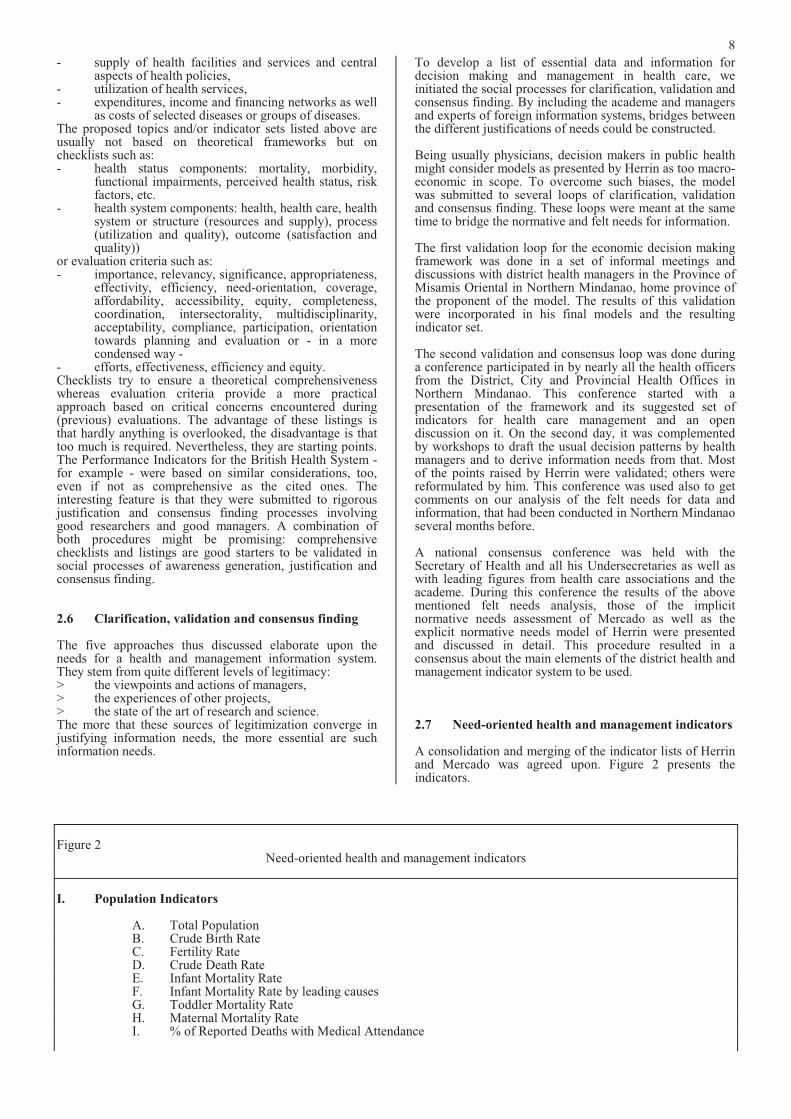
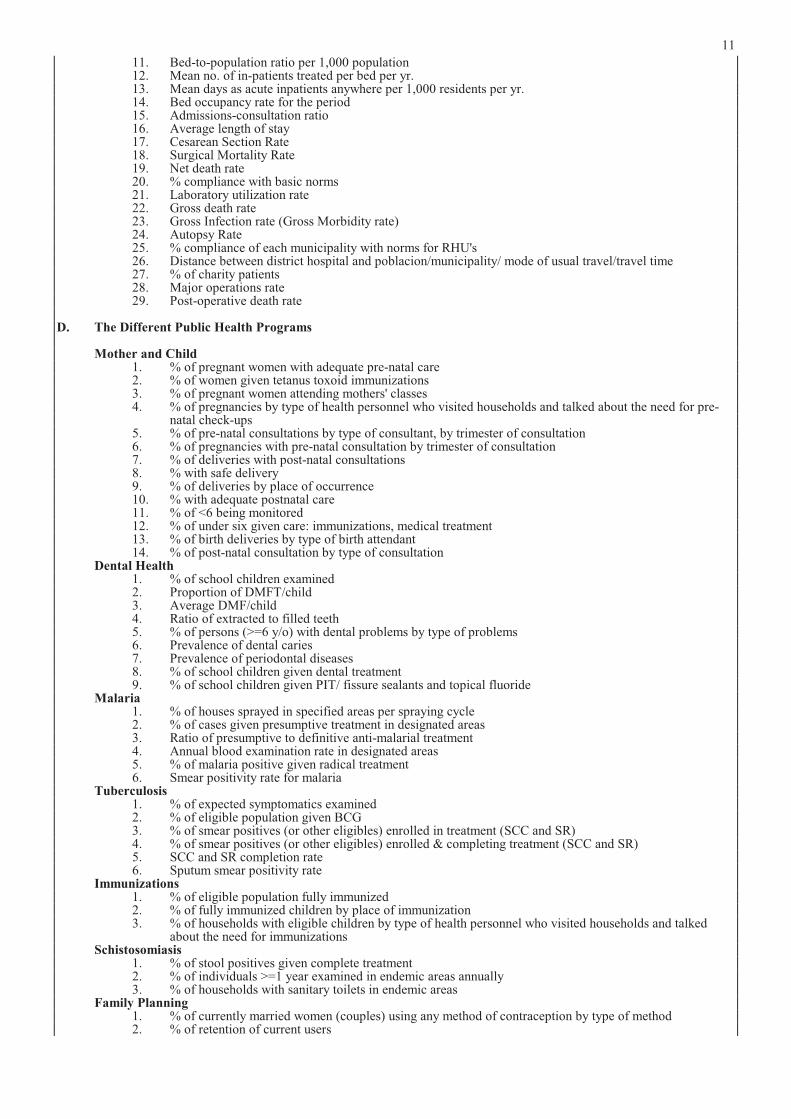
2.7 Need-oriented health and management indicators
A consolidation and merging of the indicator lists of Herrin and Mercado was agreed upon. Figure 2 presents the indicators.
Figure 2Need-oriented health and management indicators
I. Population Indicators
A. Total Population B. Crude Birth Rate C. Fertility Rate D. Crude Death Rate E. Infant Mortality Rate F. Infant Mortality Rate by leading causes G. Toddler Mortality Rate H. Maternal Mortality Rate I. % of Reported Deaths with Medical Attendance
9
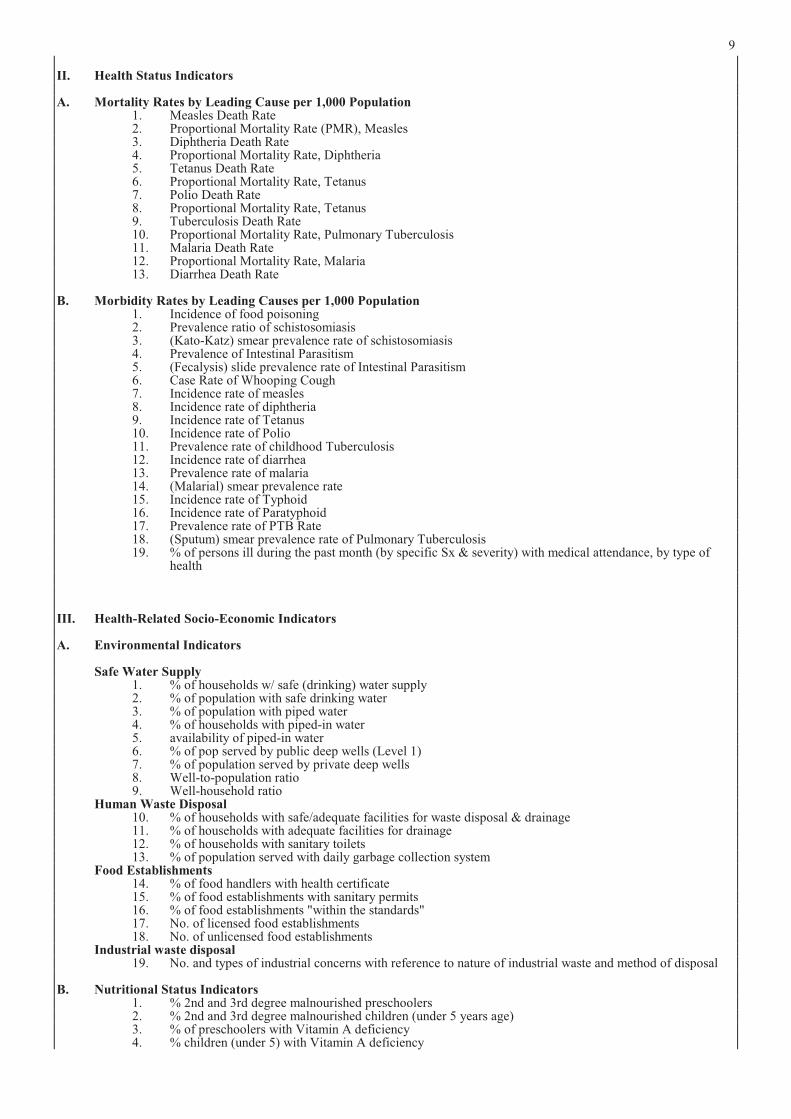
II. Health Status Indicators
A. Mortality Rates by Leading Cause per 1,000 Population 1. Measles Death Rate 2. Proportional Mortality Rate (PMR), Measles 3. Diphtheria Death Rate 4. Proportional Mortality Rate, Diphtheria 5. Tetanus Death Rate 6. Proportional Mortality Rate, Tetanus 7. Polio Death Rate 8. Proportional Mortality Rate, Tetanus 9. Tuberculosis Death Rate 10. Proportional Mortality Rate, Pulmonary Tuberculosis 11. Malaria Death Rate 12. Proportional Mortality Rate, Malaria 13. Diarrhea Death Rate
B. Morbidity Rates by Leading Causes per 1,000 Population 1. Incidence of food poisoning 2. Prevalence ratio of schistosomiasis 3. (Kato-Katz) smear prevalence rate of schistosomiasis 4. Prevalence of Intestinal Parasitism 5. (Fecalysis) slide prevalence rate of Intestinal Parasitism 6. Case Rate of Whooping Cough 7. Incidence rate of measles 8. Incidence rate of diphtheria 9. Incidence rate of Tetanus 10. Incidence rate of Polio 11. Prevalence rate of childhood Tuberculosis 12. Incidence rate of diarrhea 13. Prevalence rate of malaria 14. (Malarial) smear prevalence rate 15. Incidence rate of Typhoid 16. Incidence rate of Paratyphoid 17. Prevalence rate of PTB Rate 18. (Sputum) smear prevalence rate of Pulmonary Tuberculosis 19. % of persons ill during the past month (by specific Sx & severity) with medical attendance, by type of
health
III. Health-Related Socio-Economic Indicators
A. Environmental Indicators
Safe Water Supply 1. % of households w/ safe (drinking) water supply 2. % of population with safe drinking water 3. % of population with piped water 4. % of households with piped-in water 5. availability of piped-in water 6. % of pop served by public deep wells (Level 1) 7. % of population served by private deep wells 8. Well-to-population ratio 9. Well-household ratio
Human Waste Disposal 10. % of households with safe/adequate facilities for waste disposal & drainage 11. % of households with adequate facilities for drainage 12. % of households with sanitary toilets 13. % of population served with daily garbage collection system
Food Establishments 14. % of food handlers with health certificate 15. % of food establishments with sanitary permits 16. % of food establishments "within the standards" 17. No. of licensed food establishments 18. No. of unlicensed food establishments
Industrial waste disposal 19. No. and types of industrial concerns with reference to nature of industrial waste and method of disposal
B. Nutritional Status Indicators 1. % 2nd and 3rd degree malnourished preschoolers 2. % 2nd and 3rd degree malnourished children (under 5 years age) 3. % of preschoolers with Vitamin A deficiency 4. % children (under 5) with Vitamin A deficiency
10
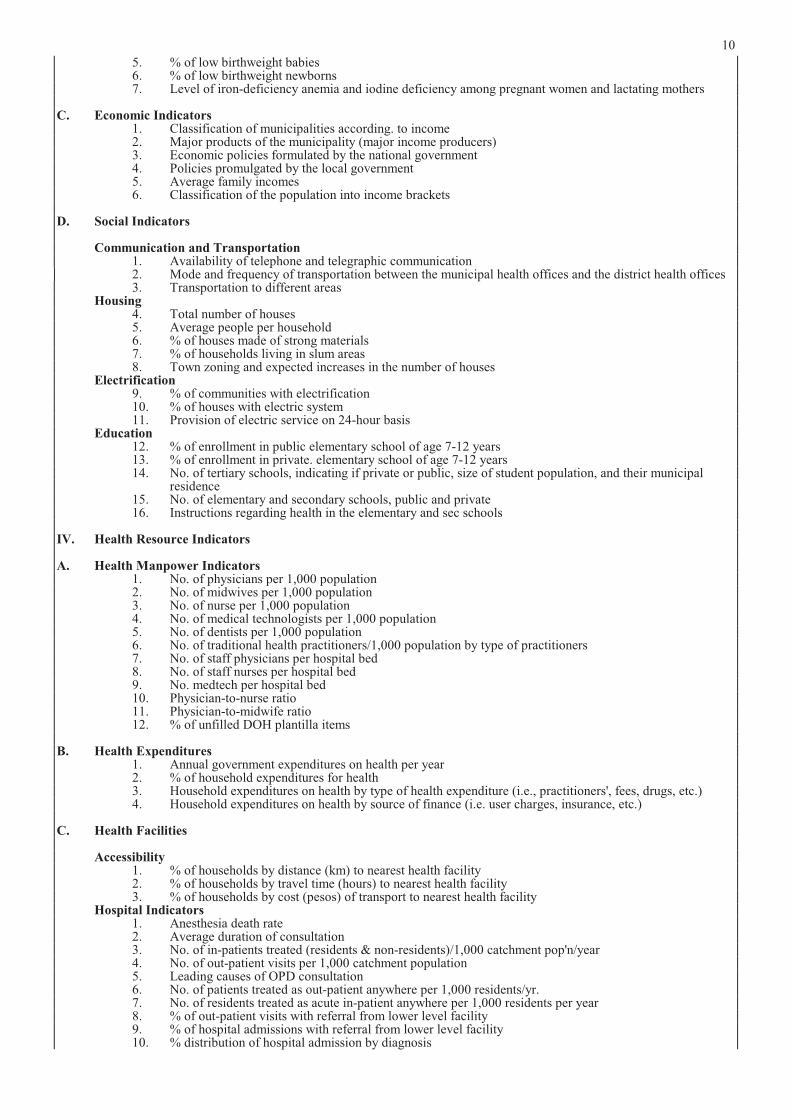
5. % of low birthweight babies 6. % of low birthweight newborns 7. Level of iron-deficiency anemia and iodine deficiency among pregnant women and lactating mothers
C. Economic Indicators 1. Classification of municipalities according. to income 2. Major products of the municipality (major income producers) 3. Economic policies formulated by the national government 4. Policies promulgated by the local government 5. Average family incomes 6. Classification of the population into income brackets
D. Social Indicators
Communication and Transportation 1. Availability of telephone and telegraphic communication 2. Mode and frequency of transportation between the municipal health offices and the district health offices 3. Transportation to different areas
Housing 4. Total number of houses 5. Average people per household 6. % of houses made of strong materials 7. % of households living in slum areas 8. Town zoning and expected increases in the number of houses
Electrification 9. % of communities with electrification 10. % of houses with electric system 11. Provision of electric service on 24-hour basis
Education 12. % of enrollment in public elementary school of age 7-12 years 13. % of enrollment in private. elementary school of age 7-12 years 14. No. of tertiary schools, indicating if private or public, size of student population, and their municipal
residence 15. No. of elementary and secondary schools, public and private 16. Instructions regarding health in the elementary and sec schools
IV. Health Resource Indicators
A. Health Manpower Indicators 1. No. of physicians per 1,000 population 2. No. of midwives per 1,000 population 3. No. of nurse per 1,000 population 4. No. of medical technologists per 1,000 population 5. No. of dentists per 1,000 population 6. No. of traditional health practitioners/1,000 population by type of practitioners 7. No. of staff physicians per hospital bed 8. No. of staff nurses per hospital bed 9. No. medtech per hospital bed 10. Physician-to-nurse ratio 11. Physician-to-midwife ratio 12. % of unfilled DOH plantilla items
B. Health Expenditures 1. Annual government expenditures on health per year 2. % of household expenditures for health 3. Household expenditures on health by type of health expenditure (i.e., practitioners', fees, drugs, etc.) 4. Household expenditures on health by source of finance (i.e. user charges, insurance, etc.)
C. Health Facilities
Accessibility 1. % of households by distance (km) to nearest health facility 2. % of households by travel time (hours) to nearest health facility 3. % of households by cost (pesos) of transport to nearest health facility
Hospital Indicators 1. Anesthesia death rate 2. Average duration of consultation 3. No. of in-patients treated (residents & non-residents)/1,000 catchment pop'n/year 4. No. of out-patient visits per 1,000 catchment population 5. Leading causes of OPD consultation 6. No. of patients treated as out-patient anywhere per 1,000 residents/yr. 7. No. of residents treated as acute in-patient anywhere per 1,000 residents per year 8. % of out-patient visits with referral from lower level facility 9. % of hospital admissions with referral from lower level facility 10. % distribution of hospital admission by diagnosis
11
11. Bed-to-population ratio per 1,000 population 12. Mean no. of in-patients treated per bed per yr. 13. Mean days as acute inpatients anywhere per 1,000 residents per yr. 14. Bed occupancy rate for the period 15. Admissions-consultation ratio 16. Average length of stay 17. Cesarean Section Rate 18. Surgical Mortality Rate 19. Net death rate 20. % compliance with basic norms 21. Laboratory utilization rate 22. Gross death rate 23. Gross Infection rate (Gross Morbidity rate) 24. Autopsy Rate 25. % compliance of each municipality with norms for RHU's 26. Distance between district hospital and poblacion/municipality/ mode of usual travel/travel time 27. % of charity patients 28. Major operations rate 29. Post-operative death rate
D. The Different Public Health Programs
Mother and Child 1. % of pregnant women with adequate pre-natal care 2. % of women given tetanus toxoid immunizations 3. % of pregnant women attending mothers' classes 4. % of pregnancies by type of health personnel who visited households and talked about the need for pre-
natal check-ups 5. % of pre-natal consultations by type of consultant, by trimester of consultation 6. % of pregnancies with pre-natal consultation by trimester of consultation 7. % of deliveries with post-natal consultations 8. % with safe delivery 9. % of deliveries by place of occurrence 10. % with adequate postnatal care 11. % of <6 being monitored 12. % of under six given care: immunizations, medical treatment 13. % of birth deliveries by type of birth attendant 14. % of post-natal consultation by type of consultation Dental Health 1. % of school children examined 2. Proportion of DMFT/child 3. Average DMF/child 4. Ratio of extracted to filled teeth 5. % of persons (>=6 y/o) with dental problems by type of problems 6. Prevalence of dental caries 7. Prevalence of periodontal diseases 8. % of school children given dental treatment 9. % of school children given PIT/ fissure sealants and topical fluoride
Malaria 1. % of houses sprayed in specified areas per spraying cycle 2. % of cases given presumptive treatment in designated areas 3. Ratio of presumptive to definitive anti-malarial treatment 4. Annual blood examination rate in designated areas 5. % of malaria positive given radical treatment 6. Smear positivity rate for malaria
Tuberculosis 1. % of expected symptomatics examined 2. % of eligible population given BCG 3. % of smear positives (or other eligibles) enrolled in treatment (SCC and SR) 4. % of smear positives (or other eligibles) enrolled & completing treatment (SCC and SR) 5. SCC and SR completion rate 6. Sputum smear positivity rate
Immunizations 1. % of eligible population fully immunized 2. % of fully immunized children by place of immunization 3. % of households with eligible children by type of health personnel who visited households and talked
about the need for immunizations Schistosomiasis
1. % of stool positives given complete treatment 2. % of individuals >=1 year examined in endemic areas annually 3. % of households with sanitary toilets in endemic areas
Family Planning 1. % of currently married women (couples) using any method of contraception by type of method 2. % of retention of current users
12
3. % of women (couples) of reproductive age using modern contraception by source of supplies/services/training of use
4. % of currently married women (couples) of reproductive age visited by health personnel who talked about the importance/ need for family planning
5. Family size 6. Parity 7. Method mix of users 8. Method mix of acceptors 9. % of new acceptors in relation to national target 10. Age of currently pregnant women 11. Pregnancy Interval
Nutrition 1. % of preschoolers with small upper arm circumference 2. % of preschoolers weighed for nutritional status 3. % of preschoolers (0-6 years) by nutritional status according to weight-for-age 4. % of preschoolers (0-6 years) by nutritional status according to height-for-age 5. % of preschoolers (0-6 years) by nutritional status accdg. to weight-for-height 6. % of low weight-for-age preschoolers 7. % of low weight-for-height preschoolers 8. % of underweight children given food assistance (& micronutrient supplement) 9. % of underweight children under 6 being monitored 10. % of malnourished preschoolers given food supplements 11. % of pre-school children enrolled in supplemental feeding program by nutritional status of child and
sponsor of program 12. % of households with pre-school children visited by health personnel who talked about the need for
growth monitoring, by type of personnel 13. % of low height-for-age preschoolers 14. % of school age children (7-13 years) by N.S. accdg. to weight-for-age 15. % of school age children (7-13 years) by N.S. accdg. to height-for-age 16. % of school age children (7-13 years) by N.S. accdg. to weight-for-height 17. % of weighed school children by type of health personnel conducting nutritional surveillance 18. % of children (0-12 yrs) with Vitamin A deficiency nightblindness and Bitot's spots 19. % of xerophthalmia among preschoolers 20. % of cases of Vitamin A deficiency given adequate nutritional supplement 21. % of persons with iron-deficiency anemia 22. % of pregnant women with iron-deficiency anemia 23. % of persons with iodine deficiency (goiter) in endemic areas 24. % of adolescent group with goiter in endemic areas 25. % of goiter cases under treatment
Diarrhea 1. % of diarrhea cases given ORS
Others 1. % of households with correct knowledge (beliefs, practices) on causes, symptoms and prevention of
common diseases, e.g. diarrhea
These indicators were checked thereafter by two outstanding epidemiologists and biostatisticians regarding the precision of epidemiological meaning and definitions according to the state of the art. Some indicators had to be reworded despite the consensus achieved on them before. Others were too vague to be measured directly. Naming or wording the indicator and defining it by relating numerators and denominators were carefully distinguished. Annex 3 contains the definitions.
This reviewed and defined list of indicators was the starting point for the strengthening of the health and management information system in the Philippines. Nevertheless, the analyses of felt and expressed information needs taught us that such a listing of indicators is just a first element of a health and management information system. To become a system it has to be linked with managerial tasks and skills, tactics and strategies. This aspect will be dealt with later when discussing the utilization of data and information.
3. Towards a cost-effective health and management information system
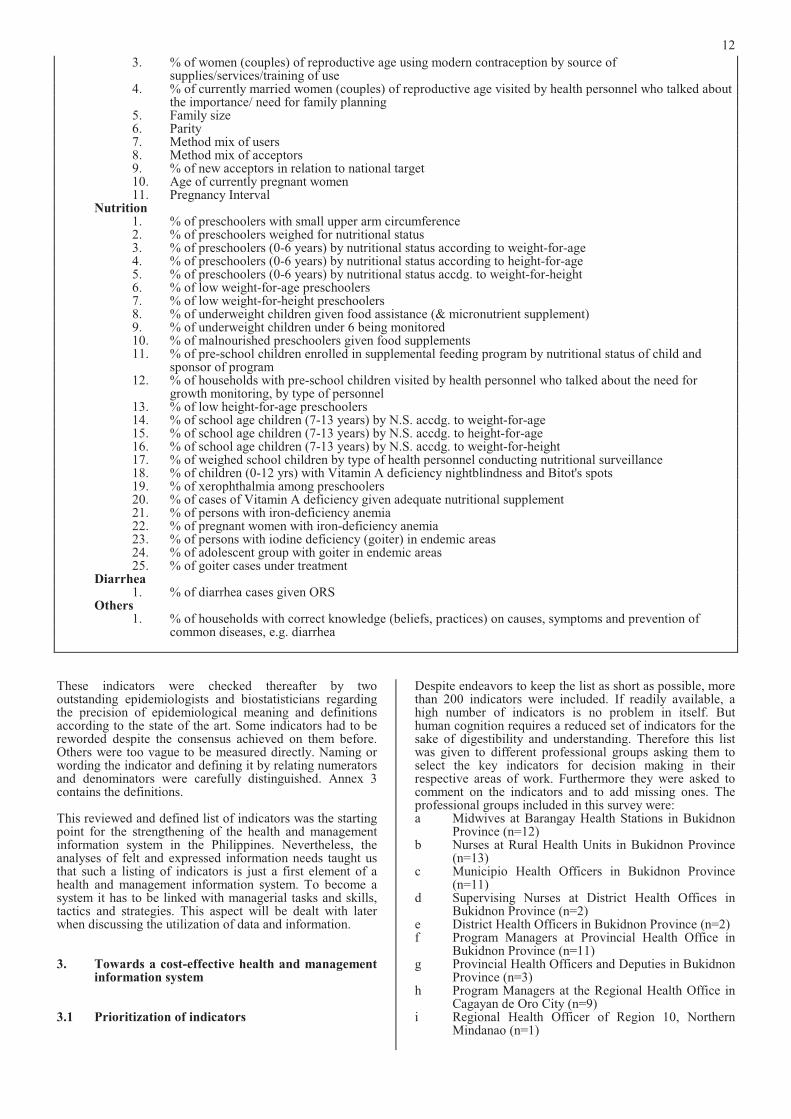
3.1 Prioritization of indicators
Despite endeavors to keep the list as short as possible, more than 200 indicators were included. If readily available, a high number of indicators is no problem in itself. But human cognition requires a reduced set of indicators for the sake of digestibility and understanding. Therefore this list was given to different professional groups asking them to select the key indicators for decision making in their respective areas of work. Furthermore they were asked to comment on the indicators and to add missing ones. The professional groups included in this survey were: a Midwives at Barangay Health Stations in Bukidnon
Province (n=12) b Nurses at Rural Health Units in Bukidnon Province
(n=13) c Municipio Health Officers in Bukidnon Province
(n=11) d Supervising Nurses at District Health Offices in
Bukidnon Province (n=2) e District Health Officers in Bukidnon Province (n=2) f Program Managers at Provincial Health Office in
Bukidnon Province (n=11) g Provincial Health Officers and Deputies in Bukidnon
Province (n=3) h Program Managers at the Regional Health Office in
Cagayan de Oro City (n=9) i Regional Health Officer of Region 10, Northern
Mindanao (n=1)
13
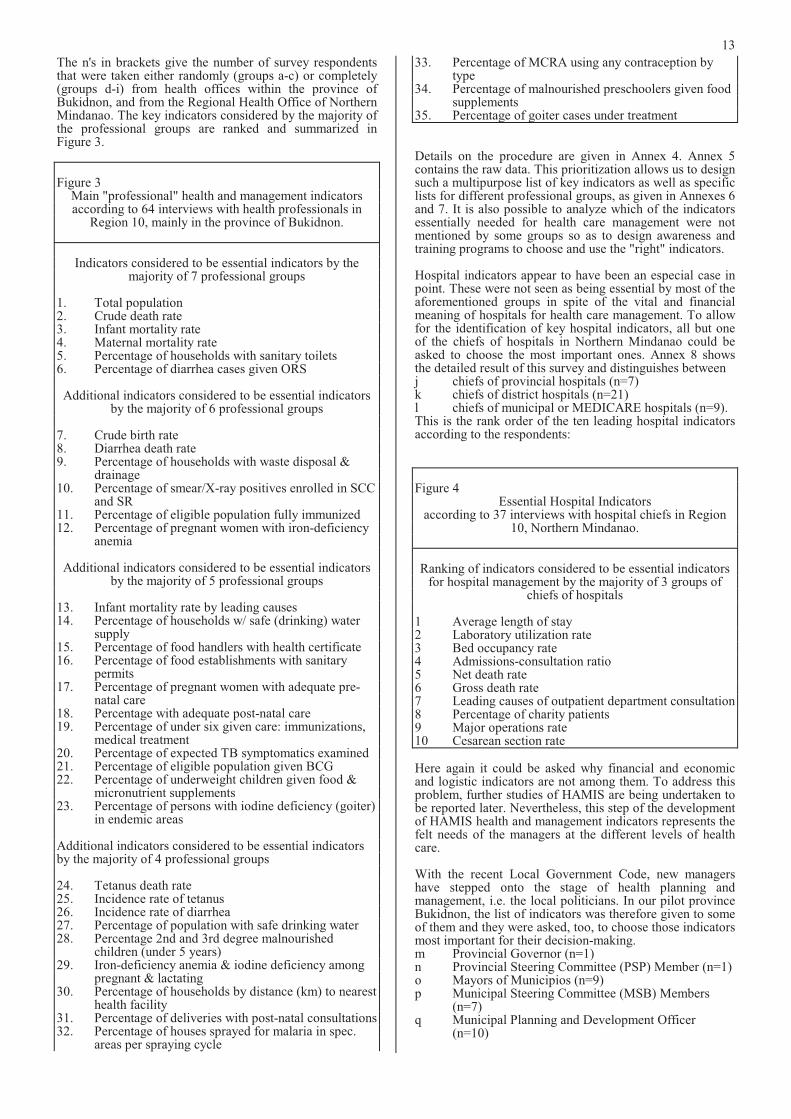
The n's in brackets give the number of survey respondents that were taken either randomly (groups a-c) or completely (groups d-i) from health offices within the province of Bukidnon, and from the Regional Health Office of Northern Mindanao. The key indicators considered by the majority of the professional groups are ranked and summarized in Figure 3.
Figure 3 Main "professional" health and management indicators according to 64 interviews with health professionals in
Region 10, mainly in the province of Bukidnon.
Indicators considered to be essential indicators by the majority of 7 professional groups
1. Total population 2. Crude death rate 3. Infant mortality rate 4. Maternal mortality rate 5. Percentage of households with sanitary toilets 6. Percentage of diarrhea cases given ORS
Additional indicators considered to be essential indicators by the majority of 6 professional groups
7. Crude birth rate 8. Diarrhea death rate 9. Percentage of households with waste disposal &
drainage 10. Percentage of smear/X-ray positives enrolled in SCC
and SR 11. Percentage of eligible population fully immunized 12. Percentage of pregnant women with iron-deficiency
anemia
Additional indicators considered to be essential indicators by the majority of 5 professional groups
13. Infant mortality rate by leading causes 14. Percentage of households w/ safe (drinking) water
supply 15. Percentage of food handlers with health certificate 16. Percentage of food establishments with sanitary
permits 17. Percentage of pregnant women with adequate pre-
natal care 18. Percentage with adequate post-natal care 19. Percentage of under six given care: immunizations,
medical treatment 20. Percentage of expected TB symptomatics examined 21. Percentage of eligible population given BCG 22. Percentage of underweight children given food &
micronutrient supplements 23. Percentage of persons with iodine deficiency (goiter)
in endemic areas
Additional indicators considered to be essential indicators by the majority of 4 professional groups
24. Tetanus death rate 25. Incidence rate of tetanus 26. Incidence rate of diarrhea 27. Percentage of population with safe drinking water 28. Percentage 2nd and 3rd degree malnourished
children (under 5 years) 29. Iron-deficiency anemia & iodine deficiency among
pregnant & lactating 30. Percentage of households by distance (km) to nearest
health facility 31. Percentage of deliveries with post-natal consultations 32. Percentage of houses sprayed for malaria in spec.
areas per spraying cycle
33. Percentage of MCRA using any contraception by type
34. Percentage of malnourished preschoolers given food supplements
35. Percentage of goiter cases under treatment
Details on the procedure are given in Annex 4. Annex 5 contains the raw data. This prioritization allows us to design such a multipurpose list of key indicators as well as specific lists for different professional groups, as given in Annexes 6 and 7. It is also possible to analyze which of the indicators essentially needed for health care management were not mentioned by some groups so as to design awareness and training programs to choose and use the "right" indicators.
Hospital indicators appear to have been an especial case in point. These were not seen as being essential by most of the aforementioned groups in spite of the vital and financial meaning of hospitals for health care management. To allow for the identification of key hospital indicators, all but one of the chiefs of hospitals in Northern Mindanao could be asked to choose the most important ones. Annex 8 shows the detailed result of this survey and distinguishes between j chiefs of provincial hospitals (n=7) k chiefs of district hospitals (n=21) l chiefs of municipal or MEDICARE hospitals (n=9). This is the rank order of the ten leading hospital indicators according to the respondents:
Figure 4 Essential Hospital Indicators
according to 37 interviews with hospital chiefs in Region 10, Northern Mindanao.
Ranking of indicators considered to be essential indicators for hospital management by the majority of 3 groups of
chiefs of hospitals
1 Average length of stay 2 Laboratory utilization rate 3 Bed occupancy rate 4 Admissions-consultation ratio 5 Net death rate 6 Gross death rate 7 Leading causes of outpatient department consultation 8 Percentage of charity patients 9 Major operations rate 10 Cesarean section rate
Here again it could be asked why financial and economic and logistic indicators are not among them. To address this problem, further studies of HAMIS are being undertaken to be reported later. Nevertheless, this step of the development of HAMIS health and management indicators represents the felt needs of the managers at the different levels of health care.
With the recent Local Government Code, new managershave stepped onto the stage of health planning and management, i.e. the local politicians. In our pilot province Bukidnon, the list of indicators was therefore given to some of them and they were asked, too, to choose those indicators most important for their decision-making. m Provincial Governor (n=1) n Provincial Steering Committee (PSP) Member (n=1) o Mayors of Municipios (n=9) p Municipal Steering Committee (MSB) Members
(n=7) q Municipal Planning and Development Officer
(n=10)
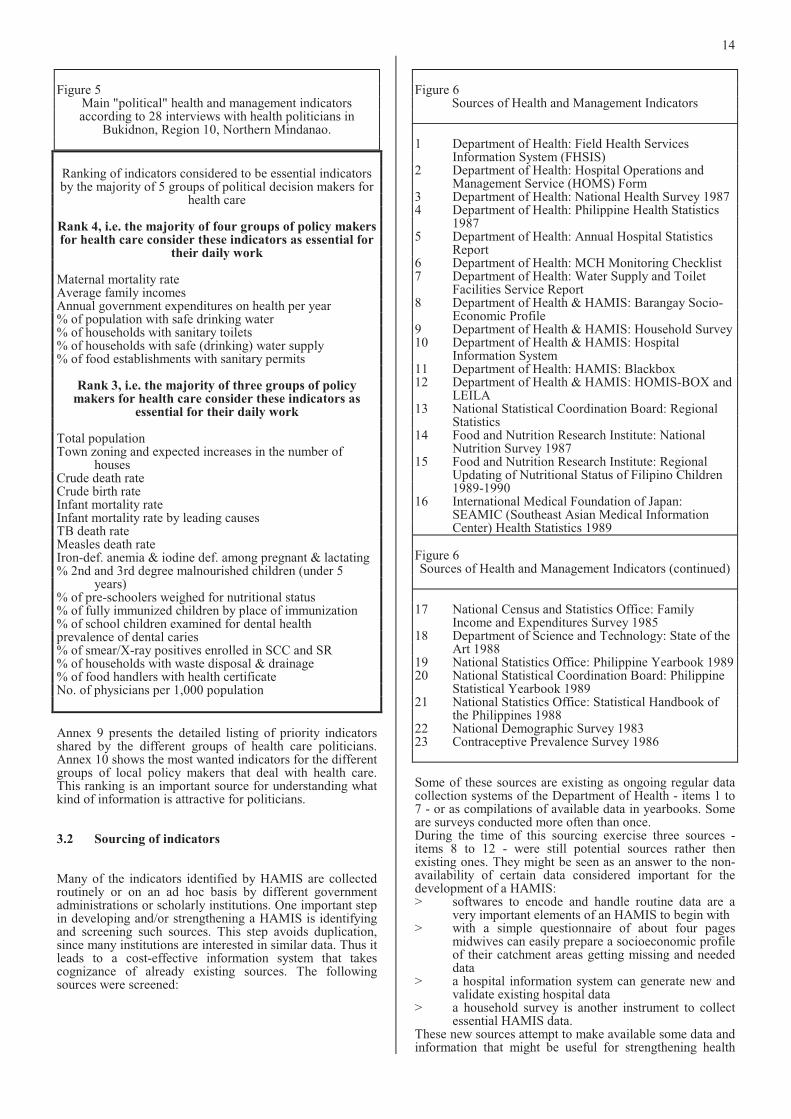
14
Figure 5 Main "political" health and management indicators according to 28 interviews with health politicians in
Bukidnon, Region 10, Northern Mindanao.
Ranking of indicators considered to be essential indicators by the majority of 5 groups of political decision makers for
health care
Rank 4, i.e. the majority of four groups of policy makers for health care consider these indicators as essential for
their daily work
Maternal mortality rate Average family incomes Annual government expenditures on health per year % of population with safe drinking water % of households with sanitary toilets % of households with safe (drinking) water supply % of food establishments with sanitary permits
Rank 3, i.e. the majority of three groups of policymakers for health care consider these indicators as
essential for their daily work
Total population Town zoning and expected increases in the number of
houses Crude death rate Crude birth rate Infant mortality rate Infant mortality rate by leading causes TB death rate Measles death rate Iron-def. anemia & iodine def. among pregnant & lactating % 2nd and 3rd degree malnourished children (under 5
years) % of pre-schoolers weighed for nutritional status % of fully immunized children by place of immunization % of school children examined for dental health prevalence of dental caries % of smear/X-ray positives enrolled in SCC and SR % of households with waste disposal & drainage % of food handlers with health certificate No. of physicians per 1,000 population
Annex 9 presents the detailed listing of priority indicators shared by the different groups of health care politicians. Annex 10 shows the most wanted indicators for the different groups of local policy makers that deal with health care. This ranking is an important source for understanding what kind of information is attractive for politicians.
3.2 Sourcing of indicators
Many of the indicators identified by HAMIS are collected routinely or on an ad hoc basis by different government administrations or scholarly institutions. One important step in developing and/or strengthening a HAMIS is identifying and screening such sources. This step avoids duplication, since many institutions are interested in similar data. Thus it leads to a cost-effective information system that takes cognizance of already existing sources. The following sources were screened:
Figure 6 Sources of Health and Management Indicators
1 Department of Health: Field Health Services Information System (FHSIS)
2 Department of Health: Hospital Operations and Management Service (HOMS) Form
3 Department of Health: National Health Survey 19874 Department of Health: Philippine Health Statistics
1987 5 Department of Health: Annual Hospital Statistics
Report 6 Department of Health: MCH Monitoring Checklist 7 Department of Health: Water Supply and Toilet
Facilities Service Report 8 Department of Health & HAMIS: Barangay Socio-
Economic Profile 9 Department of Health & HAMIS: Household Survey 10 Department of Health & HAMIS: Hospital
Information System 11 Department of Health: HAMIS: Blackbox 12 Department of Health & HAMIS: HOMIS-BOX and
LEILA 13 National Statistical Coordination Board: Regional
Statistics 14 Food and Nutrition Research Institute: National
Nutrition Survey 1987 15 Food and Nutrition Research Institute: Regional
Updating of Nutritional Status of Filipino Children1989-1990
16 International Medical Foundation of Japan: SEAMIC (Southeast Asian Medical Information Center) Health Statistics 1989
Figure 6 Sources of Health and Management Indicators (continued)
17 National Census and Statistics Office: Family Income and Expenditures Survey 1985
18 Department of Science and Technology: State of the Art 1988
19 National Statistics Office: Philippine Yearbook 1989 20 National Statistical Coordination Board: Philippine
Statistical Yearbook 1989 21 National Statistics Office: Statistical Handbook of
the Philippines 1988 22 National Demographic Survey 1983 23 Contraceptive Prevalence Survey 1986
Some of these sources are existing as ongoing regular data collection systems of the Department of Health - items 1 to 7 - or as compilations of available data in yearbooks. Some are surveys conducted more often than once. During the time of this sourcing exercise three sources - items 8 to 12 - were still potential sources rather then existing ones. They might be seen as an answer to the non-availability of certain data considered important for the development of a HAMIS: > softwares to encode and handle routine data are a
very important elements of an HAMIS to begin with > with a simple questionnaire of about four pages
midwives can easily prepare a socioeconomic profileof their catchment areas getting missing and neededdata
> a hospital information system can generate new and validate existing hospital data
> a household survey is another instrument to collect essential HAMIS data.
These new sources attempt to make available some data and information that might be useful for strengthening health
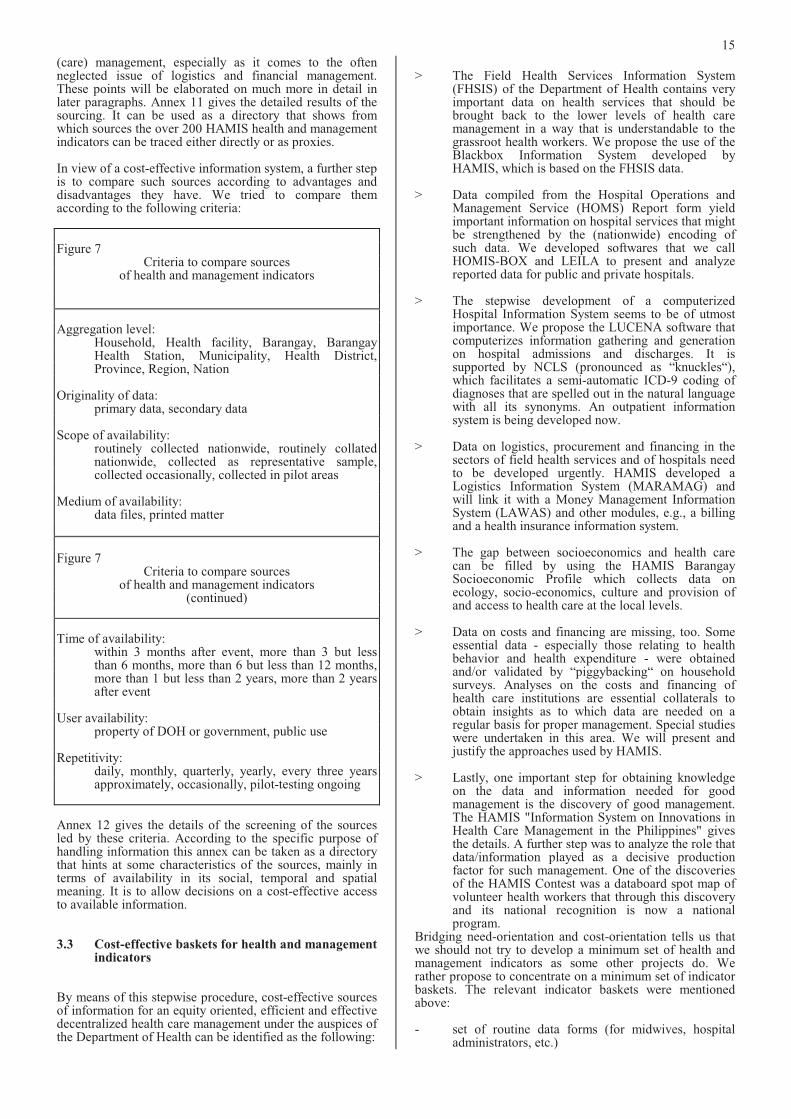
15
(care) management, especially as it comes to the often neglected issue of logistics and financial management. These points will be elaborated on much more in detail in later paragraphs. Annex 11 gives the detailed results of the sourcing. It can be used as a directory that shows from which sources the over 200 HAMIS health and management indicators can be traced either directly or as proxies.
In view of a cost-effective information system, a further step is to compare such sources according to advantages and disadvantages they have. We tried to compare them according to the following criteria:
Figure 7 Criteria to compare sources
of health and management indicators
Aggregation level: Household, Health facility, Barangay, Barangay
Health Station, Municipality, Health District, Province, Region, Nation
Originality of data: primary data, secondary data
Scope of availability: routinely collected nationwide, routinely collated
nationwide, collected as representative sample, collected occasionally, collected in pilot areas
Medium of availability: data files, printed matter
Figure 7 Criteria to compare sources
of health and management indicators (continued)
Time of availability: within 3 months after event, more than 3 but less
than 6 months, more than 6 but less than 12 months,more than 1 but less than 2 years, more than 2 years after event
User availability: property of DOH or government, public use
Repetitivity: daily, monthly, quarterly, yearly, every three years
approximately, occasionally, pilot-testing ongoing
Annex 12 gives the details of the screening of the sources led by these criteria. According to the specific purpose of handling information this annex can be taken as a directory that hints at some characteristics of the sources, mainly in terms of availability in its social, temporal and spatial meaning. It is to allow decisions on a cost-effective access to available information.
3.3 Cost-effective baskets for health and management indicators
By means of this stepwise procedure, cost-effective sources of information for an equity oriented, efficient and effective decentralized health care management under the auspices of the Department of Health can be identified as the following:
> The Field Health Services Information System (FHSIS) of the Department of Health contains very important data on health services that should be brought back to the lower levels of health care management in a way that is understandable to the grassroot health workers. We propose the use of theBlackbox Information System developed by HAMIS, which is based on the FHSIS data.
> Data compiled from the Hospital Operations and Management Service (HOMS) Report form yield important information on hospital services that might be strengthened by the (nationwide) encoding of such data. We developed softwares that we call HOMIS-BOX and LEILA to present and analyze reported data for public and private hospitals.
> The stepwise development of a computerized Hospital Information System seems to be of utmost importance. We propose the LUCENA software that computerizes information gathering and generation on hospital admissions and discharges. It is supported by NCLS (pronounced as “knuckles“), which facilitates a semi-automatic ICD-9 coding of diagnoses that are spelled out in the natural language with all its synonyms. An outpatient information system is being developed now.
> Data on logistics, procurement and financing in the sectors of field health services and of hospitals need to be developed urgently. HAMIS developed a Logistics Information System (MARAMAG) and will link it with a Money Management Information System (LAWAS) and other modules, e.g., a billing and a health insurance information system.
> The gap between socioeconomics and health care can be filled by using the HAMIS Barangay Socioeconomic Profile which collects data on ecology, socio-economics, culture and provision of and access to health care at the local levels.
> Data on costs and financing are missing, too. Some essential data - especially those relating to health behavior and health expenditure - were obtained and/or validated by “piggybacking“ on household surveys. Analyses on the costs and financing of health care institutions are essential collaterals to obtain insights as to which data are needed on a regular basis for proper management. Special studies were undertaken in this area. We will present and justify the approaches used by HAMIS.
> Lastly, one important step for obtaining knowledge on the data and information needed for good management is the discovery of good management. The HAMIS "Information System on Innovations in Health Care Management in the Philippines" gives the details. A further step was to analyze the role that data/information played as a decisive production factor for such management. One of the discoveries of the HAMIS Contest was a databoard spot map of volunteer health workers that through this discovery and its national recognition is now a national program.
Bridging need-orientation and cost-orientation tells us that we should not try to develop a minimum set of health and management indicators as some other projects do. Werather propose to concentrate on a minimum set of indicator baskets. The relevant indicator baskets were mentioned above:
- set of routine data forms (for midwives, hospitaladministrators, etc.)
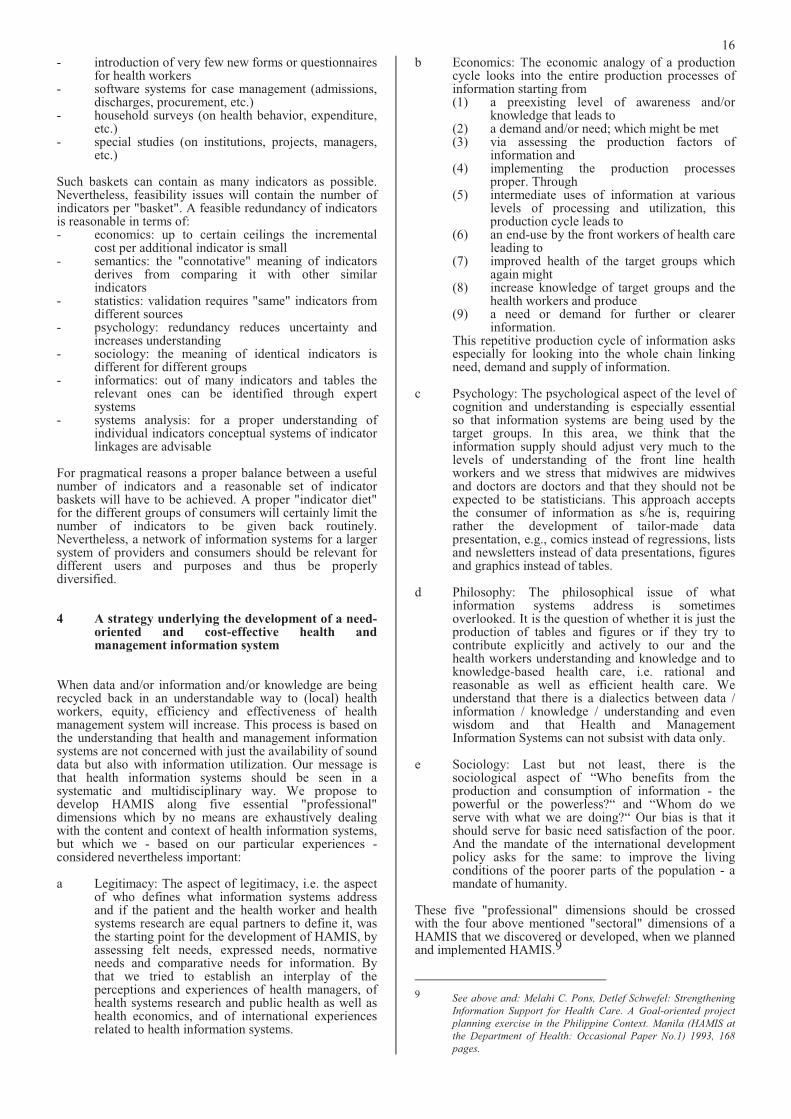
16
- introduction of very few new forms or questionnaires for health workers
- software systems for case management (admissions,discharges, procurement, etc.)
- household surveys (on health behavior, expenditure, etc.)
- special studies (on institutions, projects, managers, etc.)
Such baskets can contain as many indicators as possible. Nevertheless, feasibility issues will contain the number of indicators per "basket". A feasible redundancy of indicators is reasonable in terms of: - economics: up to certain ceilings the incremental
cost per additional indicator is small - semantics: the "connotative" meaning of indicators
derives from comparing it with other similar indicators
- statistics: validation requires "same" indicators from different sources
- psychology: redundancy reduces uncertainty and increases understanding
- sociology: the meaning of identical indicators isdifferent for different groups
- informatics: out of many indicators and tables the relevant ones can be identified through expert systems
- systems analysis: for a proper understanding of individual indicators conceptual systems of indicator linkages are advisable
For pragmatical reasons a proper balance between a useful number of indicators and a reasonable set of indicator baskets will have to be achieved. A proper "indicator diet" for the different groups of consumers will certainly limit the number of indicators to be given back routinely. Nevertheless, a network of information systems for a larger system of providers and consumers should be relevant for different users and purposes and thus be properly diversified.
4 A strategy underlying the development of a need-oriented and cost-effective health and management information system
When data and/or information and/or knowledge are being recycled back in an understandable way to (local) health workers, equity, efficiency and effectiveness of health management system will increase. This process is based on the understanding that health and management information systems are not concerned with just the availability of sound data but also with information utilization. Our message is that health information systems should be seen in asystematic and multidisciplinary way. We propose todevelop HAMIS along five essential "professional" dimensions which by no means are exhaustively dealing with the content and context of health information systems, but which we - based on our particular experiences - considered nevertheless important:
a Legitimacy: The aspect of legitimacy, i.e. the aspect of who defines what information systems address and if the patient and the health worker and healthsystems research are equal partners to define it, was the starting point for the development of HAMIS, byassessing felt needs, expressed needs, normative needs and comparative needs for information. By that we tried to establish an interplay of the perceptions and experiences of health managers, of health systems research and public health as well as health economics, and of international experiences related to health information systems.
b Economics: The economic analogy of a production cycle looks into the entire production processes ofinformation starting from
(1) a preexisting level of awareness and/or knowledge that leads to
(2) a demand and/or need; which might be met (3) via assessing the production factors of
information and (4) implementing the production processes
proper. Through (5) intermediate uses of information at various
levels of processing and utilization, this production cycle leads to
(6) an end-use by the front workers of health care leading to
(7) improved health of the target groups which again might
(8) increase knowledge of target groups and the health workers and produce
(9) a need or demand for further or clearer information.
This repetitive production cycle of information asks especially for looking into the whole chain linkingneed, demand and supply of information.
c Psychology: The psychological aspect of the level of cognition and understanding is especially essentialso that information systems are being used by the target groups. In this area, we think that the information supply should adjust very much to the levels of understanding of the front line health workers and we stress that midwives are midwives and doctors are doctors and that they should not beexpected to be statisticians. This approach acceptsthe consumer of information as s/he is, requiring rather the development of tailor-made data presentation, e.g., comics instead of regressions, lists and newsletters instead of data presentations, figures and graphics instead of tables.
d Philosophy: The philosophical issue of what information systems address is sometimes overlooked. It is the question of whether it is just the production of tables and figures or if they try to contribute explicitly and actively to our and the health workers understanding and knowledge and to knowledge-based health care, i.e. rational and reasonable as well as efficient health care. We understand that there is a dialectics between data / information / knowledge / understanding and even wisdom and that Health and Management Information Systems can not subsist with data only.
e Sociology: Last but not least, there is the sociological aspect of “Who benefits from the production and consumption of information - the powerful or the powerless?“ and “Whom do we serve with what we are doing?“ Our bias is that it should serve for basic need satisfaction of the poor. And the mandate of the international development policy asks for the same: to improve the living conditions of the poorer parts of the population - a mandate of humanity.
These five "professional" dimensions should be crossed with the four above mentioned "sectoral" dimensions of a HAMIS that we discovered or developed, when we planned and implemented HAMIS.9
9 See above and: Melahi C. Pons, Detlef Schwefel: Strengthening
Information Support for Health Care. A Goal-oriented project
planning exercise in the Philippine Context. Manila (HAMIS at
the Department of Health: Occasional Paper No.1) 1993, 168
pages.
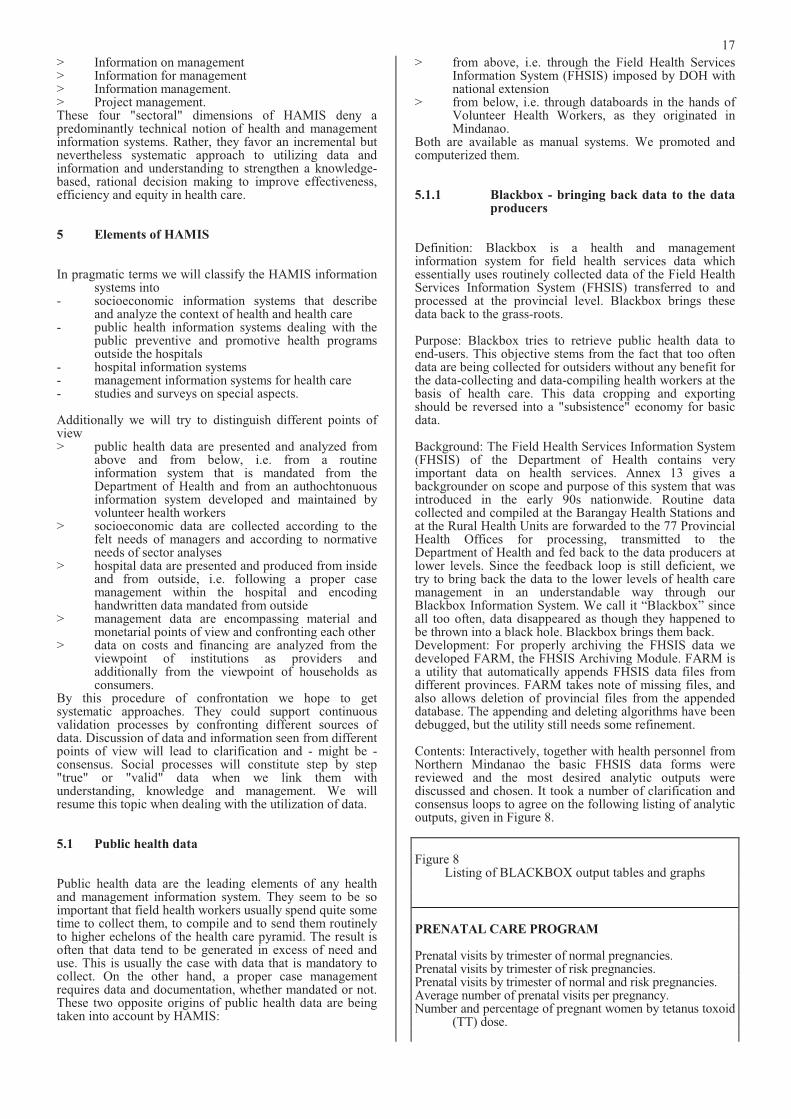
17
> Information on management > Information for management > Information management. > Project management. These four "sectoral" dimensions of HAMIS deny a predominantly technical notion of health and management information systems. Rather, they favor an incremental but nevertheless systematic approach to utilizing data and information and understanding to strengthen a knowledge-based, rational decision making to improve effectiveness, efficiency and equity in health care.
5 Elements of HAMIS
In pragmatic terms we will classify the HAMIS information systems into
- socioeconomic information systems that describe and analyze the context of health and health care
- public health information systems dealing with the public preventive and promotive health programs outside the hospitals
- hospital information systems - management information systems for health care - studies and surveys on special aspects.
Additionally we will try to distinguish different points of view > public health data are presented and analyzed from
above and from below, i.e. from a routine information system that is mandated from the Department of Health and from an authochtonuous information system developed and maintained by volunteer health workers
> socioeconomic data are collected according to thefelt needs of managers and according to normative needs of sector analyses
> hospital data are presented and produced from inside and from outside, i.e. following a proper case management within the hospital and encoding handwritten data mandated from outside
> management data are encompassing material and monetarial points of view and confronting each other
> data on costs and financing are analyzed from theviewpoint of institutions as providers and additionally from the viewpoint of households as consumers.
By this procedure of confrontation we hope to get systematic approaches. They could support continuous validation processes by confronting different sources of data. Discussion of data and information seen from different points of view will lead to clarification and - might be - consensus. Social processes will constitute step by step "true" or "valid" data when we link them with understanding, knowledge and management. We will resume this topic when dealing with the utilization of data.
5.1 Public health data
Public health data are the leading elements of any health and management information system. They seem to be so important that field health workers usually spend quite some time to collect them, to compile and to send them routinely to higher echelons of the health care pyramid. The result is often that data tend to be generated in excess of need and use. This is usually the case with data that is mandatory to collect. On the other hand, a proper case management requires data and documentation, whether mandated or not. These two opposite origins of public health data are being taken into account by HAMIS:
> from above, i.e. through the Field Health Services Information System (FHSIS) imposed by DOH with national extension
> from below, i.e. through databoards in the hands of Volunteer Health Workers, as they originated in Mindanao.
Both are available as manual systems. We promoted and computerized them.
5.1.1 Blackbox - bringing back data to the data producers
Definition: Blackbox is a health and management information system for field health services data which essentially uses routinely collected data of the Field Health Services Information System (FHSIS) transferred to and processed at the provincial level. Blackbox brings these data back to the grass-roots.
Purpose: Blackbox tries to retrieve public health data to end-users. This objective stems from the fact that too often data are being collected for outsiders without any benefit for the data-collecting and data-compiling health workers at the basis of health care. This data cropping and exporting should be reversed into a "subsistence" economy for basic data.
Background: The Field Health Services Information System (FHSIS) of the Department of Health contains very important data on health services. Annex 13 gives abackgrounder on scope and purpose of this system that was introduced in the early 90s nationwide. Routine data collected and compiled at the Barangay Health Stations and at the Rural Health Units are forwarded to the 77 Provincial Health Offices for processing, transmitted to the Department of Health and fed back to the data producers at lower levels. Since the feedback loop is still deficient, we try to bring back the data to the lower levels of health care management in an understandable way through our Blackbox Information System. We call it “Blackbox” since all too often, data disappeared as though they happened to be thrown into a black hole. Blackbox brings them back. Development: For properly archiving the FHSIS data we developed FARM, the FHSIS Archiving Module. FARM isa utility that automatically appends FHSIS data files from different provinces. FARM takes note of missing files, and also allows deletion of provincial files from the appended database. The appending and deleting algorithms have been debugged, but the utility still needs some refinement.
Contents: Interactively, together with health personnel from Northern Mindanao the basic FHSIS data forms were reviewed and the most desired analytic outputs werediscussed and chosen. It took a number of clarification and consensus loops to agree on the following listing of analytic outputs, given in Figure 8.
Figure 8 Listing of BLACKBOX output tables and graphs
PRENATAL CARE PROGRAM
Prenatal visits by trimester of normal pregnancies.Prenatal visits by trimester of risk pregnancies. Prenatal visits by trimester of normal and risk pregnancies. Average number of prenatal visits per pregnancy. Number and percentage of pregnant women by tetanus toxoid
(TT) dose.
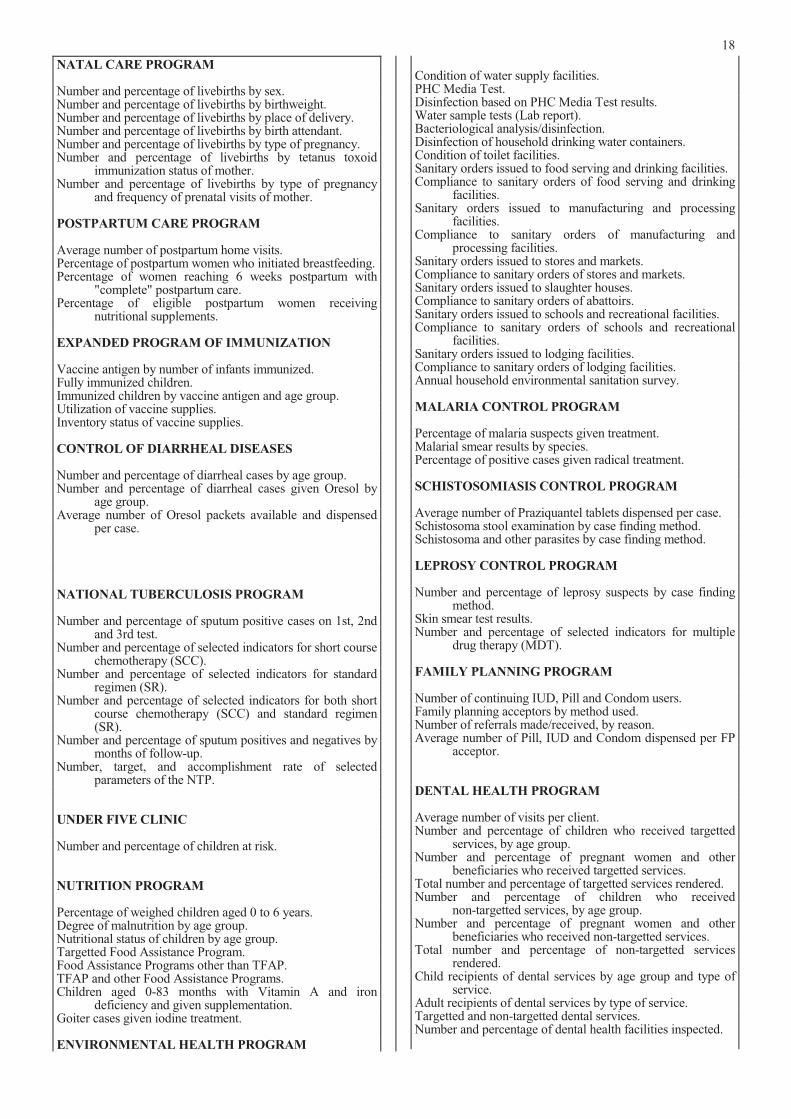
18
NATAL CARE PROGRAM
Number and percentage of livebirths by sex. Number and percentage of livebirths by birthweight.Number and percentage of livebirths by place of delivery. Number and percentage of livebirths by birth attendant. Number and percentage of livebirths by type of pregnancy. Number and percentage of livebirths by tetanus toxoid
immunization status of mother. Number and percentage of livebirths by type of pregnancy
and frequency of prenatal visits of mother.
POSTPARTUM CARE PROGRAM
Average number of postpartum home visits. Percentage of postpartum women who initiated breastfeeding. Percentage of women reaching 6 weeks postpartum with
"complete" postpartum care. Percentage of eligible postpartum women receiving
nutritional supplements.
EXPANDED PROGRAM OF IMMUNIZATION
Vaccine antigen by number of infants immunized. Fully immunized children. Immunized children by vaccine antigen and age group. Utilization of vaccine supplies. Inventory status of vaccine supplies.
CONTROL OF DIARRHEAL DISEASES
Number and percentage of diarrheal cases by age group. Number and percentage of diarrheal cases given Oresol by
age group. Average number of Oresol packets available and dispensed
per case.
NATIONAL TUBERCULOSIS PROGRAM
Number and percentage of sputum positive cases on 1st, 2nd and 3rd test.
Number and percentage of selected indicators for short course chemotherapy (SCC).
Number and percentage of selected indicators for standard regimen (SR).
Number and percentage of selected indicators for both short course chemotherapy (SCC) and standard regimen (SR).
Number and percentage of sputum positives and negatives by months of follow-up.
Number, target, and accomplishment rate of selectedparameters of the NTP.
UNDER FIVE CLINIC
Number and percentage of children at risk.
NUTRITION PROGRAM
Percentage of weighed children aged 0 to 6 years. Degree of malnutrition by age group. Nutritional status of children by age group. Targetted Food Assistance Program. Food Assistance Programs other than TFAP. TFAP and other Food Assistance Programs. Children aged 0-83 months with Vitamin A and iron
deficiency and given supplementation. Goiter cases given iodine treatment.
ENVIRONMENTAL HEALTH PROGRAM
Condition of water supply facilities. PHC Media Test. Disinfection based on PHC Media Test results. Water sample tests (Lab report). Bacteriological analysis/disinfection. Disinfection of household drinking water containers. Condition of toilet facilities. Sanitary orders issued to food serving and drinking facilities. Compliance to sanitary orders of food serving and drinking
facilities. Sanitary orders issued to manufacturing and processing
facilities. Compliance to sanitary orders of manufacturing and
processing facilities. Sanitary orders issued to stores and markets. Compliance to sanitary orders of stores and markets. Sanitary orders issued to slaughter houses. Compliance to sanitary orders of abattoirs. Sanitary orders issued to schools and recreational facilities. Compliance to sanitary orders of schools and recreational
facilities. Sanitary orders issued to lodging facilities. Compliance to sanitary orders of lodging facilities. Annual household environmental sanitation survey.
MALARIA CONTROL PROGRAM
Percentage of malaria suspects given treatment. Malarial smear results by species. Percentage of positive cases given radical treatment.
SCHISTOSOMIASIS CONTROL PROGRAM
Average number of Praziquantel tablets dispensed per case. Schistosoma stool examination by case finding method. Schistosoma and other parasites by case finding method.
LEPROSY CONTROL PROGRAM
Number and percentage of leprosy suspects by case finding method.
Skin smear test results. Number and percentage of selected indicators for multiple
drug therapy (MDT).
FAMILY PLANNING PROGRAM
Number of continuing IUD, Pill and Condom users. Family planning acceptors by method used. Number of referrals made/received, by reason. Average number of Pill, IUD and Condom dispensed per FP
acceptor.
DENTAL HEALTH PROGRAM
Average number of visits per client. Number and percentage of children who received targetted
services, by age group. Number and percentage of pregnant women and other
beneficiaries who received targetted services. Total number and percentage of targetted services rendered. Number and percentage of children who received
non-targetted services, by age group. Number and percentage of pregnant women and other
beneficiaries who received non-targetted services. Total number and percentage of non-targetted services
rendered. Child recipients of dental services by age group and type of
service. Adult recipients of dental services by type of service. Targetted and non-targetted dental services. Number and percentage of dental health facilities inspected.
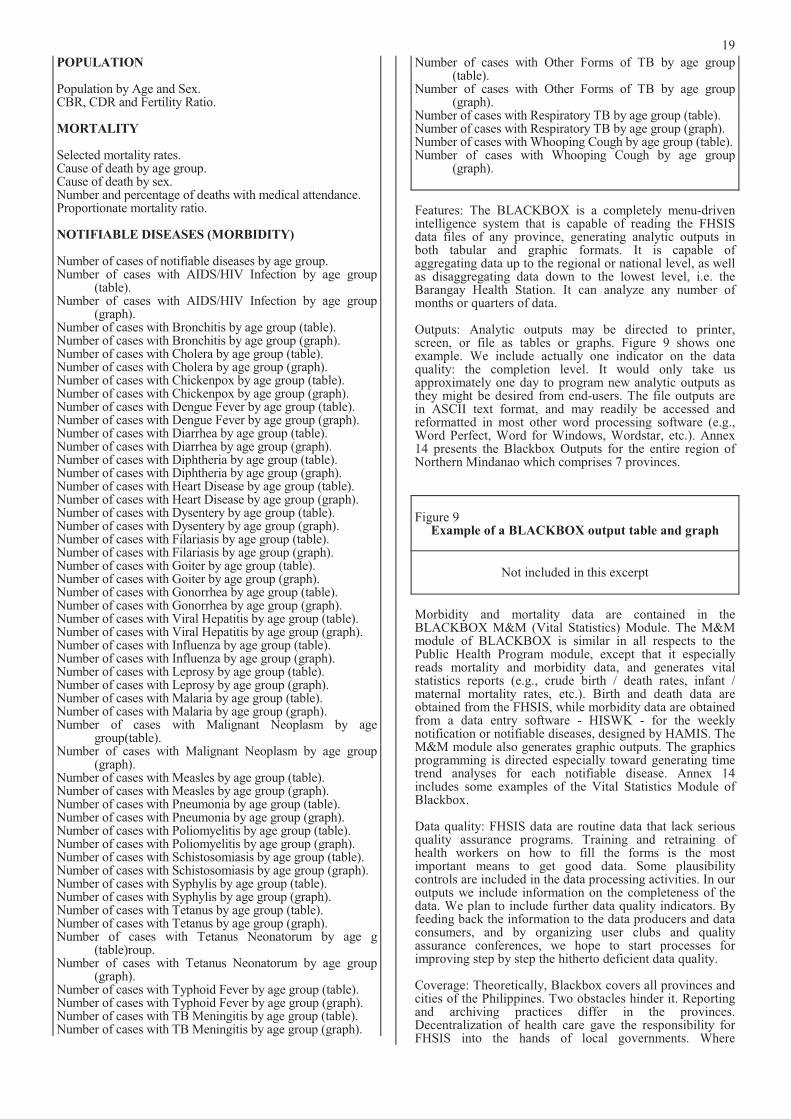
19
POPULATION
Population by Age and Sex. CBR, CDR and Fertility Ratio.
MORTALITY
Selected mortality rates. Cause of death by age group. Cause of death by sex. Number and percentage of deaths with medical attendance. Proportionate mortality ratio.
NOTIFIABLE DISEASES (MORBIDITY)
Number of cases of notifiable diseases by age group. Number of cases with AIDS/HIV Infection by age group
(table). Number of cases with AIDS/HIV Infection by age group
(graph). Number of cases with Bronchitis by age group (table). Number of cases with Bronchitis by age group (graph). Number of cases with Cholera by age group (table). Number of cases with Cholera by age group (graph). Number of cases with Chickenpox by age group (table). Number of cases with Chickenpox by age group (graph). Number of cases with Dengue Fever by age group (table). Number of cases with Dengue Fever by age group (graph). Number of cases with Diarrhea by age group (table).Number of cases with Diarrhea by age group (graph).Number of cases with Diphtheria by age group (table). Number of cases with Diphtheria by age group (graph). Number of cases with Heart Disease by age group (table). Number of cases with Heart Disease by age group (graph). Number of cases with Dysentery by age group (table). Number of cases with Dysentery by age group (graph). Number of cases with Filariasis by age group (table). Number of cases with Filariasis by age group (graph). Number of cases with Goiter by age group (table). Number of cases with Goiter by age group (graph). Number of cases with Gonorrhea by age group (table). Number of cases with Gonorrhea by age group (graph). Number of cases with Viral Hepatitis by age group (table). Number of cases with Viral Hepatitis by age group (graph). Number of cases with Influenza by age group (table). Number of cases with Influenza by age group (graph). Number of cases with Leprosy by age group (table). Number of cases with Leprosy by age group (graph). Number of cases with Malaria by age group (table). Number of cases with Malaria by age group (graph). Number of cases with Malignant Neoplasm by age
group(table). Number of cases with Malignant Neoplasm by age group
(graph). Number of cases with Measles by age group (table). Number of cases with Measles by age group (graph). Number of cases with Pneumonia by age group (table). Number of cases with Pneumonia by age group (graph). Number of cases with Poliomyelitis by age group (table). Number of cases with Poliomyelitis by age group (graph). Number of cases with Schistosomiasis by age group (table). Number of cases with Schistosomiasis by age group (graph). Number of cases with Syphylis by age group (table).Number of cases with Syphylis by age group (graph).Number of cases with Tetanus by age group (table). Number of cases with Tetanus by age group (graph). Number of cases with Tetanus Neonatorum by age g
(table)roup. Number of cases with Tetanus Neonatorum by age group
(graph). Number of cases with Typhoid Fever by age group (table). Number of cases with Typhoid Fever by age group (graph). Number of cases with TB Meningitis by age group (table). Number of cases with TB Meningitis by age group (graph).
Number of cases with Other Forms of TB by age group(table).
Number of cases with Other Forms of TB by age group(graph).
Number of cases with Respiratory TB by age group (table). Number of cases with Respiratory TB by age group (graph). Number of cases with Whooping Cough by age group (table). Number of cases with Whooping Cough by age group
(graph).
Features: The BLACKBOX is a completely menu-driven intelligence system that is capable of reading the FHSIS data files of any province, generating analytic outputs in both tabular and graphic formats. It is capable of aggregating data up to the regional or national level, as well as disaggregating data down to the lowest level, i.e. the Barangay Health Station. It can analyze any number of months or quarters of data.
Outputs: Analytic outputs may be directed to printer, screen, or file as tables or graphs. Figure 9 shows one example. We include actually one indicator on the data quality: the completion level. It would only take us approximately one day to program new analytic outputs as they might be desired from end-users. The file outputs are in ASCII text format, and may readily be accessed and reformatted in most other word processing software (e.g., Word Perfect, Word for Windows, Wordstar, etc.). Annex 14 presents the Blackbox Outputs for the entire region of Northern Mindanao which comprises 7 provinces.
Figure 9 Example of a BLACKBOX output table and graph
Not included in this excerpt
Morbidity and mortality data are contained in the BLACKBOX M&M (Vital Statistics) Module. The M&M module of BLACKBOX is similar in all respects to the Public Health Program module, except that it especially reads mortality and morbidity data, and generates vital statistics reports (e.g., crude birth / death rates, infant / maternal mortality rates, etc.). Birth and death data are obtained from the FHSIS, while morbidity data are obtained from a data entry software - HISWK - for the weeklynotification or notifiable diseases, designed by HAMIS. The M&M module also generates graphic outputs. The graphics programming is directed especially toward generating time trend analyses for each notifiable disease. Annex 14 includes some examples of the Vital Statistics Module of Blackbox.
Data quality: FHSIS data are routine data that lack serious quality assurance programs. Training and retraining of health workers on how to fill the forms is the mostimportant means to get good data. Some plausibilitycontrols are included in the data processing activities. In our outputs we include information on the completeness of the data. We plan to include further data quality indicators. By feeding back the information to the data producers and data consumers, and by organizing user clubs and qualityassurance conferences, we hope to start processes for improving step by step the hitherto deficient data quality.
Coverage: Theoretically, Blackbox covers all provinces and cities of the Philippines. Two obstacles hinder it. Reporting and archiving practices differ in the provinces. Decentralization of health care gave the responsibility for FHSIS into the hands of local governments. Where
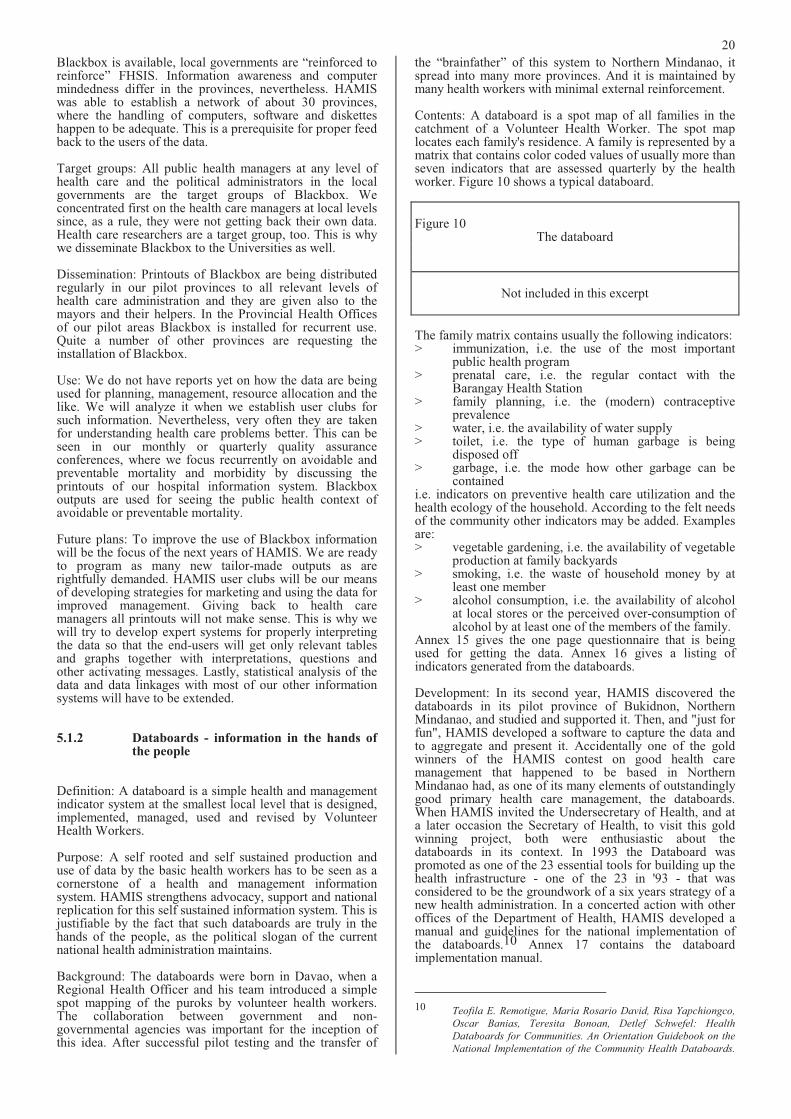
20
Blackbox is available, local governments are “reinforced to reinforce” FHSIS. Information awareness and computer mindedness differ in the provinces, nevertheless. HAMIS was able to establish a network of about 30 provinces, where the handling of computers, software and diskettes happen to be adequate. This is a prerequisite for proper feed back to the users of the data.
Target groups: All public health managers at any level of health care and the political administrators in the local governments are the target groups of Blackbox. We concentrated first on the health care managers at local levels since, as a rule, they were not getting back their own data. Health care researchers are a target group, too. This is why we disseminate Blackbox to the Universities as well.
Dissemination: Printouts of Blackbox are being distributed regularly in our pilot provinces to all relevant levels of health care administration and they are given also to the mayors and their helpers. In the Provincial Health Offices of our pilot areas Blackbox is installed for recurrent use. Quite a number of other provinces are requesting the installation of Blackbox.
Use: We do not have reports yet on how the data are being used for planning, management, resource allocation and the like. We will analyze it when we establish user clubs for such information. Nevertheless, very often they are taken for understanding health care problems better. This can be seen in our monthly or quarterly quality assurance conferences, where we focus recurrently on avoidable and preventable mortality and morbidity by discussing the printouts of our hospital information system. Blackbox outputs are used for seeing the public health context of avoidable or preventable mortality.
Future plans: To improve the use of Blackbox information will be the focus of the next years of HAMIS. We are ready to program as many new tailor-made outputs as are rightfully demanded. HAMIS user clubs will be our means of developing strategies for marketing and using the data for improved management. Giving back to health care managers all printouts will not make sense. This is why we will try to develop expert systems for properly interpreting the data so that the end-users will get only relevant tables and graphs together with interpretations, questions and other activating messages. Lastly, statistical analysis of the data and data linkages with most of our other information systems will have to be extended.
5.1.2 Databoards - information in the hands of the people
Definition: A databoard is a simple health and management indicator system at the smallest local level that is designed, implemented, managed, used and revised by VolunteerHealth Workers.
Purpose: A self rooted and self sustained production and use of data by the basic health workers has to be seen as a cornerstone of a health and management information system. HAMIS strengthens advocacy, support and national replication for this self sustained information system. This is justifiable by the fact that such databoards are truly in the hands of the people, as the political slogan of the current national health administration maintains.
Background: The databoards were born in Davao, when a Regional Health Officer and his team introduced a simple spot mapping of the puroks by volunteer health workers. The collaboration between government and non-governmental agencies was important for the inception of this idea. After successful pilot testing and the transfer of
the “brainfather” of this system to Northern Mindanao, it spread into many more provinces. And it is maintained by many health workers with minimal external reinforcement.
Contents: A databoard is a spot map of all families in the catchment of a Volunteer Health Worker. The spot map locates each family's residence. A family is represented by a matrix that contains color coded values of usually more than seven indicators that are assessed quarterly by the health worker. Figure 10 shows a typical databoard.
Figure 10 The databoard
Not included in this excerpt
The family matrix contains usually the following indicators: > immunization, i.e. the use of the most important
public health program > prenatal care, i.e. the regular contact with the
Barangay Health Station > family planning, i.e. the (modern) contraceptive
prevalence > water, i.e. the availability of water supply > toilet, i.e. the type of human garbage is being
disposed off > garbage, i.e. the mode how other garbage can be
contained i.e. indicators on preventive health care utilization and the health ecology of the household. According to the felt needs of the community other indicators may be added. Examples are: > vegetable gardening, i.e. the availability of vegetable
production at family backyards > smoking, i.e. the waste of household money by at
least one member > alcohol consumption, i.e. the availability of alcohol
at local stores or the perceived over-consumption of alcohol by at least one of the members of the family.
Annex 15 gives the one page questionnaire that is being used for getting the data. Annex 16 gives a listing of indicators generated from the databoards.
Development: In its second year, HAMIS discovered the databoards in its pilot province of Bukidnon, Northern Mindanao, and studied and supported it. Then, and "just for fun", HAMIS developed a software to capture the data and to aggregate and present it. Accidentally one of the gold winners of the HAMIS contest on good health care management that happened to be based in Northern Mindanao had, as one of its many elements of outstandingly good primary health care management, the databoards. When HAMIS invited the Undersecretary of Health, and at a later occasion the Secretary of Health, to visit this gold winning project, both were enthusiastic about the databoards in its context. In 1993 the Databoard was promoted as one of the 23 essential tools for building up the health infrastructure - one of the 23 in '93 - that was considered to be the groundwork of a six years strategy of a new health administration. In a concerted action with other offices of the Department of Health, HAMIS developed a manual and guidelines for the national implementation of the databoards.10 Annex 17 contains the databoard implementation manual.
10 Teofila E. Remotigue, Maria Rosario David, Risa Yapchiongco,
Oscar Banias, Teresita Bonoan, Detlef Schwefel: Health
Databoards for Communities. An Orientation Guidebook on the
National Implementation of the Community Health Databoards.
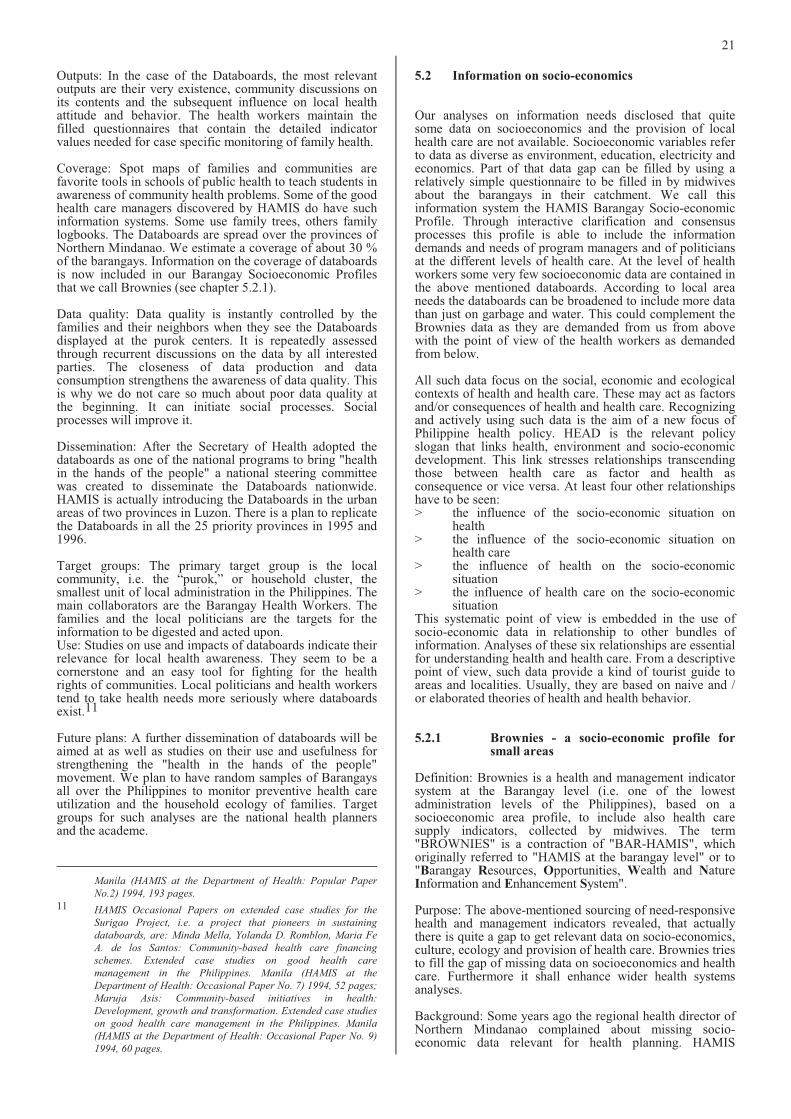
21
Outputs: In the case of the Databoards, the most relevant outputs are their very existence, community discussions on its contents and the subsequent influence on local health attitude and behavior. The health workers maintain the filled questionnaires that contain the detailed indicator values needed for case specific monitoring of family health.
Coverage: Spot maps of families and communities arefavorite tools in schools of public health to teach students in awareness of community health problems. Some of the good health care managers discovered by HAMIS do have such information systems. Some use family trees, others family logbooks. The Databoards are spread over the provinces of Northern Mindanao. We estimate a coverage of about 30 % of the barangays. Information on the coverage of databoards is now included in our Barangay Socioeconomic Profiles that we call Brownies (see chapter 5.2.1).
Data quality: Data quality is instantly controlled by the families and their neighbors when they see the Databoards displayed at the purok centers. It is repeatedly assessed through recurrent discussions on the data by all interested parties. The closeness of data production and data consumption strengthens the awareness of data quality. This is why we do not care so much about poor data quality at the beginning. It can initiate social processes. Social processes will improve it.
Dissemination: After the Secretary of Health adopted the databoards as one of the national programs to bring "health in the hands of the people" a national steering committee was created to disseminate the Databoards nationwide. HAMIS is actually introducing the Databoards in the urban areas of two provinces in Luzon. There is a plan to replicate the Databoards in all the 25 priority provinces in 1995 and 1996.
Target groups: The primary target group is the local community, i.e. the “purok,” or household cluster, the smallest unit of local administration in the Philippines. The main collaborators are the Barangay Health Workers. The families and the local politicians are the targets for the information to be digested and acted upon. Use: Studies on use and impacts of databoards indicate their relevance for local health awareness. They seem to be a cornerstone and an easy tool for fighting for the health rights of communities. Local politicians and health workers tend to take health needs more seriously where databoards exist.11
Future plans: A further dissemination of databoards will be aimed at as well as studies on their use and usefulness for strengthening the "health in the hands of the people" movement. We plan to have random samples of Barangays all over the Philippines to monitor preventive health care utilization and the household ecology of families. Target groups for such analyses are the national health planners and the academe.
Manila (HAMIS at the Department of Health: Popular Paper
No.2) 1994, 193 pages.
11 HAMIS Occasional Papers on extended case studies for the
Surigao Project, i.e. a project that pioneers in sustaining
databoards, are: Minda Mella, Yolanda D. Romblon, Maria Fe
A. de los Santos: Community-based health care financing
schemes. Extended case studies on good health care
management in the Philippines. Manila (HAMIS at the
Department of Health: Occasional Paper No. 7) 1994, 52 pages;
Maruja Asis: Community-based initiatives in health:
Development, growth and transformation. Extended case studies
on good health care management in the Philippines. Manila
(HAMIS at the Department of Health: Occasional Paper No. 9)
1994, 60 pages.
5.2 Information on socio-economics
Our analyses on information needs disclosed that quite some data on socioeconomics and the provision of local health care are not available. Socioeconomic variables refer to data as diverse as environment, education, electricity and economics. Part of that data gap can be filled by using a relatively simple questionnaire to be filled in by midwives about the barangays in their catchment. We call this information system the HAMIS Barangay Socio-economic Profile. Through interactive clarification and consensus processes this profile is able to include the information demands and needs of program managers and of politicians at the different levels of health care. At the level of health workers some very few socioeconomic data are contained in the above mentioned databoards. According to local area needs the databoards can be broadened to include more data than just on garbage and water. This could complement the Brownies data as they are demanded from us from above with the point of view of the health workers as demanded from below.
All such data focus on the social, economic and ecological contexts of health and health care. These may act as factors and/or consequences of health and health care. Recognizing and actively using such data is the aim of a new focus of Philippine health policy. HEAD is the relevant policy slogan that links health, environment and socio-economic development. This link stresses relationships transcending those between health care as factor and health as consequence or vice versa. At least four other relationships have to be seen: > the influence of the socio-economic situation on
health > the influence of the socio-economic situation on
health care > the influence of health on the socio-economic
situation > the influence of health care on the socio-economic
situation This systematic point of view is embedded in the use of socio-economic data in relationship to other bundles of information. Analyses of these six relationships are essential for understanding health and health care. From a descriptive point of view, such data provide a kind of tourist guide to areas and localities. Usually, they are based on naive and / or elaborated theories of health and health behavior.
5.2.1 Brownies - a socio-economic profile for small areas
Definition: Brownies is a health and management indicator system at the Barangay level (i.e. one of the lowest administration levels of the Philippines), based on a socioeconomic area profile, to include also health care supply indicators, collected by midwives. The term "BROWNIES" is a contraction of "BAR-HAMIS", which originally referred to "HAMIS at the barangay level" or to "Barangay Resources, Opportunities, Wealth and Nature Information and Enhancement System".
Purpose: The above-mentioned sourcing of need-responsive health and management indicators revealed, that actually there is quite a gap to get relevant data on socio-economics, culture, ecology and provision of health care. Brownies tries to fill the gap of missing data on socioeconomics and health care. Furthermore it shall enhance wider health systems analyses.
Background: Some years ago the regional health director of Northern Mindanao complained about missing socio-economic data relevant for health planning. HAMIS
22
challenged him that his midwives would have all such data at their fingertips if they really serve their communities. Furthermore, his midwives would get him informationrelevant for political bargaining with his colleagues from other social and economic sectors, if just a simplequestionnaire would be designed that would concentrate on evident questions of every day life.
Development: First we started with a listing of socio-economic aspects to be considered when doing sectoranalyses. This listing was proposed by the World Bank. A long sequence of clarification and consensus meetings followed with many partners from headquarters and local health workers in Northern Mindanao. Very differentechelons of health personnel participated. A pilot testing was done in the province of Bukidnon, for which data were entered from all of the 460 barangays. Repeated trainings of the midwives aimed at getting a proper health care awareness as well. Data were collected by means of a 4-page questionnaire - Annex 18 - accomplished by the Rural Health Midwives in 1991. Some of the midwives were asked to do the data encoding - a small income generating incentive - during validation conferences for the data. During the replications of Brownies in other provinces, relevant suggestions for adding information were taken into account, e.g., on dump sites, reforestation, health insurance, herbal and vegetable gardening, income generating projects.
Contents: Brownies answers the need to define and identify socioeconomic variables at the barangay level that may be affecting the health status of communities. These include such factors as the terrain, language, agricultural profile, wealth and poverty indicators, and others. In addition to socio-economic data, it contains data on environment, culture and provision of and access to health care at the local levels.
Figure 11 Contents of the Barangay socio-economic and health care
profile
Area land area topography Population population according age and sex > source of information > year and month of data on
population households, number of Culture and education languages spoken highest educational attainment vocational and technical courses Economics main sources of living agricultural production animal production fish production Housing water supply toilets houses outer walls Wealth private belongings physical infrastructure and
establishments Health care practicing health workers > living in barangay > living & working in barangay
(full-time)
> living & working in barangay (part-time)
> working, not living in barangay (full-time)
> working, not living in barangay (part-time)
health care facilities recourse in medical emergencies transportation to referral points > distance > fare > travel time health service delivery problems Community community organizations perceived development problems
It deserves mentioning that the "wealth" indicators contain a host of socio-economic indicators. Private wealth is indicated by the availability of tangible and “seeable” durable consumer goods like bicycles or refrigerators. Public wealth is indicated by infrastructure and programs like databoards, schools, reforestation sites. The more than 80 indicators of wealth provide a rich picture about the barangay. Topography is indicated by characteristics like swampy, mountains, island. Observation unit is the barangay.
Outputs: The system generates the Socioeconomic Profile of a given barangay of a certain set of barangays. We distinguish descriptive and analytic outputs. > The descriptive output is a text module that
represents the data for each barangay in a way thatquestions and answers are spelled out, i.e. in a way how each midwife and barangay health worker and barangay captain can understand and therefore control it. Annex 19 gives the example of one barangay. Such outputs are our "tourist guides" to barangays as well as our printouts for updating andcontrolling data.
> We have a set of analytic outputs, too, i.e. aggregate reports at the municipal and provincial levels. Brownbox is similar in all respects to the Public Health Program module of Blackbox except that it specializes in the Brownies data. Brownbox can thusanalyze the socioeconomic data of any barangay or aggregate thereof (e.g., municipal, health district, or provincial levels of aggregation). Analytic outputsare in tabular form and may be directed to printer,screen, or file. Annex 20 gives some examples.
Figure 12 Example of the Brownies output tables
Not included in this excerpt
Data quality: Validity of the data is being checked by three tracer indicators that are available in other data sources. We obtained population figures according to the national census from the National Statistics Office. Figures on the numbers of schools were obtained from the Ministry of Education and the Planning Offices of the provinces provided data on the size of the barangay. A comparison of such data sources with the Brownies data can be provided as given in Annex 21. In another version of our text module output ofBrownies, we included both sources to generate an awareness of data quality. According to the circumstances, the data provided by our midwives sometimes might be
23
better than those from the census. Apart from this we try to improve data quality through social processes of clarification and validation. Different representatives of the barangays are convening within the municipalities and discussing the data, their validity and relevance for fighting for community concerns. Another validation is the feeding back of the data to all midwives and all others interested and the proper editing of any modification. Here again, data quality is not a previous given but the product of social processes.
Coverage: All barangays of four provinces are actually covered by our Brownies, one of them twice, i.e. 1991 and 1994. It is planned to use Brownies in all 25 provinces of the national health plan for 1995-96. Several otherprovinces have requested the replication of Brownies in their areas.
Target groups: Midwives and barangay officials and volunteers are the primary target groups. Health managers at any level benefit from the data, too.
Dissemination: All target groups are provided by HAMIS with relevant printouts, i.e. about their barangays or municipalities or provinces and relevant comparative data. Clarification and consensus and validation meetingscomplement this dissemination strategy. During our quality assurance conferences Brownies data often are cited or requested for enhancing the understanding of preventable or avoidable deaths, which is the focal point of our quality assurance conferences hitherto. Use: Brownies data are being used actually for local area planning, for health plans for minorities and for other purposes of planning, monitoring and evaluation. The manual for the users of Brownies is given in Annex 22.
Future plans: Statistical analyses of the data and their linkages with data from other HAMIS information systems offer a variety of opportunities for understanding better health and health care in the Philippines. This should be done before further disseminating the system so as to get even more arguments for replication and dissemination. Users’ clubs of Brownies data will be further tested as we introduced them in Cavite Province. These Users’ Clubs are the opposite number of what we call the Quality Assurance Conferences in the hospital setting. They provide a forum for discussing health and health care in its local socio-economic context. Such discussions will transcend the borderlines of Brownies and open up demands for other HAMIS information systems.
5.2.2 Databoards - socio-economic data in the hands of village health workers
Some socio-economic data are included in the community databoards (see chapter 5.1.2). As far as more socio-economic data would be considered as relevant for community affairs, such data could be included. Nevertheless, the closer we know families, the more we know their socio-economic situation. This is why village health workers might not include them as a first choice. Such things might be certain for them as insiders. Information systems reduce uncertainties. They do not have such uncertainties regarding socio-economics. Socio-economic data seem to be more relevant for outsiders.
5.3 Hospital data
Our surveys on information needs and priorities reveal that there seems to be a lack of awareness about the relevance of hospital data. Public health data seem to be more respected
and important. There is a considerable lack of understanding, that data beyond the set of traditional hospital indicators have quite a bearing for health planning and policies. From the economic point of view hospitals use most of the financial and material resources allocated to the health sector. This is in spite of the secondary importance of hospitals when compared with primary health care endeavors. This is the paradox: the more resources are spent for hospitals, the less they are being assessed. Information on many aspects of hospital management is missing. This refers to the data on morbidity and mortality as well as to those on procurement, logistics, costs and financing.
Information systems could proceed from properly informed case management, e.g. on admissions and discharges and warehouse handling. There are quite some managementsystems related to this issue. Nevertheless, most have not yet jumped into the computer age. As opposed to such information demands originating from inside the hospital, quite a lot of information is requested regularly on a routine basis from the hospitals. Such data demanded from the outside could be collected, compiled and analyzed better than is actually done.
5.3.1 Lucena - a prospective hospital information system
Definition: Lucena is a hospital health and management information system composed of indicators needed for hospital management and the appraisal of performance quality; for the time being it contains admission and medical records data.
Purpose: The purpose of the Lucena system is to improve hospital management, and by and for this, to get better information on morbidity, mortality and the handling of patients and hospital resources. This should improve the quality of care and economize the use of resources.
Background: Not to reinvent the wheel, was our basic concern. We thought that there certainly would exist somewhere in the Philippines a computerized hospital information system. When HAMIS tried to hire a medical informatics specialist through an advertisement in a major newspaper, a hospital administrator of a private hospital informed us about the system he developed in his hospital in the north of Luzon. We challenged him to try to convince us that his system is applicable and usable in a public hospital, as well. Research and development on this started as early as 1991. Quezon, with its provincial capital Lucena was chosen as a HAMIS pilot province by virtue of the province’s performance in the HAMIS contest on goodhealth care management. Quezon has the most and the best health care initiatives. This is why we thought this province would be a good choice for new initiatives to improve health care management. Quezon Memorial Hospital inLucena was chosen to be the pilot site for developing this system. Many interactive processes between HAMIS, the hospital management and the private software house took place. Many adaptations and debuggings were necessary until in 1994 we considered the system to be ready for a limited number of guided replications. This we are now completing in 7 hospitals in 5 provinces. These hospitals range from a 10 bed hospital to a 600 bed hospital.
Development: The development of a computerized Hospital Information System on admissions and discharges wassupported by HAMIS. Here, information is seen to be a byproduct of good management, and vice versa. The development of LUCENA was contracted to Robert Kaiser of LORMA Hospital in San Fernando, La Union. He adapted existing modules of the LORMA system to suit the environment of a DOH hospital. LUCENA consists of 2
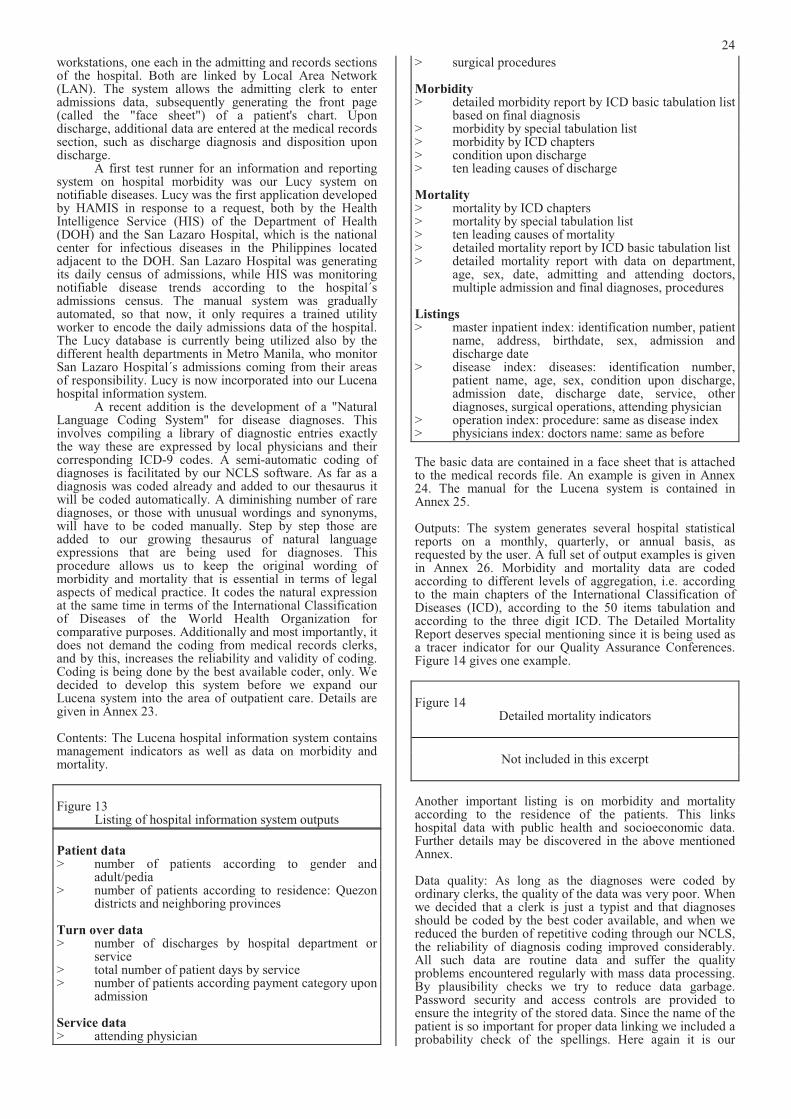
24
workstations, one each in the admitting and records sections of the hospital. Both are linked by Local Area Network (LAN). The system allows the admitting clerk to enter admissions data, subsequently generating the front page (called the "face sheet") of a patient's chart. Upon discharge, additional data are entered at the medical records section, such as discharge diagnosis and disposition upon discharge. A first test runner for an information and reporting system on hospital morbidity was our Lucy system onnotifiable diseases. Lucy was the first application developed by HAMIS in response to a request, both by the Health Intelligence Service (HIS) of the Department of Health (DOH) and the San Lazaro Hospital, which is the national center for infectious diseases in the Philippines located adjacent to the DOH. San Lazaro Hospital was generating its daily census of admissions, while HIS was monitoring notifiable disease trends according to the hospital´s admissions census. The manual system was gradually automated, so that now, it only requires a trained utility worker to encode the daily admissions data of the hospital. The Lucy database is currently being utilized also by the different health departments in Metro Manila, who monitor San Lazaro Hospital´s admissions coming from their areas of responsibility. Lucy is now incorporated into our Lucena hospital information system. A recent addition is the development of a "NaturalLanguage Coding System" for disease diagnoses. Thisinvolves compiling a library of diagnostic entries exactly the way these are expressed by local physicians and their corresponding ICD-9 codes. A semi-automatic coding of diagnoses is facilitated by our NCLS software. As far as a diagnosis was coded already and added to our thesaurus it will be coded automatically. A diminishing number of rare diagnoses, or those with unusual wordings and synonyms, will have to be coded manually. Step by step those are added to our growing thesaurus of natural language expressions that are being used for diagnoses. Thisprocedure allows us to keep the original wording ofmorbidity and mortality that is essential in terms of legal aspects of medical practice. It codes the natural expression at the same time in terms of the International Classification of Diseases of the World Health Organization for comparative purposes. Additionally and most importantly, it does not demand the coding from medical records clerks, and by this, increases the reliability and validity of coding. Coding is being done by the best available coder, only. We decided to develop this system before we expand ourLucena system into the area of outpatient care. Details are given in Annex 23.
Contents: The Lucena hospital information system contains management indicators as well as data on morbidity and mortality.
Figure 13 Listing of hospital information system outputs
Patient data> number of patients according to gender and
adult/pedia > number of patients according to residence: Quezon
districts and neighboring provinces
Turn over data> number of discharges by hospital department or
service > total number of patient days by service > number of patients according payment category upon
admission
Service data> attending physician
> surgical procedures
Morbidity > detailed morbidity report by ICD basic tabulation list
based on final diagnosis > morbidity by special tabulation list > morbidity by ICD chapters > condition upon discharge > ten leading causes of discharge
Mortality> mortality by ICD chapters > mortality by special tabulation list > ten leading causes of mortality > detailed mortality report by ICD basic tabulation list > detailed mortality report with data on department,
age, sex, date, admitting and attending doctors, multiple admission and final diagnoses, procedures
Listings> master inpatient index: identification number, patient
name, address, birthdate, sex, admission and discharge date
> disease index: diseases: identification number, patient name, age, sex, condition upon discharge, admission date, discharge date, service, other diagnoses, surgical operations, attending physician
> operation index: procedure: same as disease index> physicians index: doctors name: same as before
The basic data are contained in a face sheet that is attached to the medical records file. An example is given in Annex 24. The manual for the Lucena system is contained in Annex 25.
Outputs: The system generates several hospital statistical reports on a monthly, quarterly, or annual basis, as requested by the user. A full set of output examples is given in Annex 26. Morbidity and mortality data are codedaccording to different levels of aggregation, i.e. according to the main chapters of the International Classification of Diseases (ICD), according to the 50 items tabulation and according to the three digit ICD. The Detailed Mortality Report deserves special mentioning since it is being used as a tracer indicator for our Quality Assurance Conferences. Figure 14 gives one example.
Figure 14 Detailed mortality indicators
Not included in this excerpt
Another important listing is on morbidity and mortality according to the residence of the patients. This links hospital data with public health and socioeconomic data. Further details may be discovered in the above mentioned Annex.
Data quality: As long as the diagnoses were coded by ordinary clerks, the quality of the data was very poor. When we decided that a clerk is just a typist and that diagnoses should be coded by the best coder available, and when we reduced the burden of repetitive coding through our NCLS, the reliability of diagnosis coding improved considerably. All such data are routine data and suffer the quality problems encountered regularly with mass data processing. By plausibility checks we try to reduce data garbage. Password security and access controls are provided to ensure the integrity of the stored data. Since the name of the patient is so important for proper data linking we included a probability check of the spellings. Here again it is our
25
feeling that data quality improvement is a slow process that is strengthened when this information system is linked to management practices, when production and consumption of data are interrelated.
Coverage: The first step in replicating the Lucena system was a guided replication. By this we mean that a detailed assessment of the hospital management practices is being done - see an example in Annex 27 - and that, interactively with the hospital managers the replication is prepared and carried out. Some minor changes of the software are being accepted. To be prepared for a larger wave of replications, we chose different types and sizes of hospitals in different regions to test the robustness of our software. The Lucena system is being replicated in 6 further hospitals in 5 provinces altogether. Supervision is done by HAMIS, and debugging of the software by the contracted software house.
Target groups: The primary target groups are the hospital managers, including all clinical, nursing, and administrative staff. The aggregated data for several hospitals might be relevant for provincial, regional and national decision makers, especially as data on morbidity and mortality are missing otherwise.
Dissemination: Once in a month we organize a Quality Assurance Conference (see chapter 6.3) with about 50 representatives of Quezon Memorial Hospital representing physicians, nurses, technical and administrative personnel, as well as representatives from district hospitals and from the provincial health planners. Basic printouts for the last month or for special questions are being given to all. Anybody interested gets relevant printouts upon request.
Use: The willingness in all our replication hospitals to use the admissions module indicates that hospital staffrecognize the reduction of manual work load through a computerized system. The medical records module seems to be less attractive to the medical records staff but the more important for external users. Training and retraining of the medical records staff is one option, another one is to reconsider basically the need for such a staff after computerization has started. Future plans: We will study the use of the Lucena system and its impact on morbidity and mortality, mediated through quality assurance conferences and data user clubs. Statistical data analyses will be started when linking Lucena with proper statistical softwares. Our semi-automatic coding system might be expanded into a text coding system for broader applications. Adding an outpatient module and other modules is being planned, too. Collateral to all such plans is a further wave of replications mediated through good managers requesting such a system. Selected HAMIS winners will be promoters of the Lucena system in their areas of influence. An expansion into all provincial hospitals of 25 priority provinces is foreseen in the national health plan for 1995-96. Some other provinces have requested the Lucena hospital information system, as well.
5.3.2 Homis and Leila - computerized handling of routine hospital data forms
Definition: Essentially a data system, HOMIS was developed for the quarterly hospital statistical report that each hospital is requested to fill and submit to the Department of Health regularly. LEILA was developed to facilitate the encoding of hospital licensing data. HOMIS and LEILA are softwares that compile and aggregate such data in a user friendly way.
Purpose: The routinely collected data on hospital operations and management for public hospitals and similar data for the licensing of private hospitals deserve proper storage, processing and retrieval. To make such data available for
descriptive and analytic purposes is the aim of developing HOMIS and LEILA.
Background: For about 30 years or so, the Hospital Operations and Management Service (HOMS) of the Department of Health has been requesting regularly data from all hospitals through the Hospital Operations and Management Service (HOMS) form. The HOMS form for public hospitals is shown in Annex 28, a similar one is being used for private hospitals. DOH is currently trying to reconcile the small differences so to come up with a unified form. Quite some of this data can be produced through the above mentioned computerized hospital information system, i.e. Lucena.
Development: During our analysis of information needs, we discovered that the HOMS form is a very rich but somehow underutilized source for an information based management of hospitals. Thus we developed a software to encode and analyze the data. HOMIS, the Hospital Operations and Management Information System, was designed to allow even a low level encoder to enter data from the HOMS report form. Diagnostic entries for discharges, deaths, and consultations are encoded exactly as they appear. The program was written in dBASE since this is the mostcommonly used language in the health field. It is now available as a menu driven software that needs only a very low level of computer literacy for using it. One program submodule is CARE which stands for “Coding and Recoding Editor”. CARE is a utility that was originally designed to edit diagnostic (character string) entries in HOMIS. The idea was to allow low level encoders to enter character strings for disease diagnoses rapidly without having to burden them with any prior coding in ICD-9. Subsequently, the diagnostic "cleanup" could be done by more qualified encoders. CARE allows the user to edit the diagnostic entries. The utility then locates the corresponding records in the database and automatically replaces the diagnosis with the modified entry. CARE has been successfully applied as a stand-alone utility for recoding character string entries. It has great potential for processing research data, especially where the responses are not fixed. CARE was the forerunner of NCLS. The aggregation program for the HOMS data is the HOMISBOX. It is similar in all respects to BLACKBOXexcept that it specializes in the HOMIS data. HOMISBOX was designed to generate all the hospital indicators deemed necessary by hospital managers. This list of hospital indicators was obtained from a survey of hospital administrators and authorities conducted in 1990. HOMISBOX allows the user to select any aggregate ordisaggregate of hospitals, and analyze data for anyaggregate or disaggregate of quarters. For now, HOMISBOX generates analytic outputs in tabular form, which can be directed to printer, screen, or file. In response to a request of the Hospital LicensingSection of Regional Health Office No. 10, LEILA wasdeveloped. It is a hospital data encoding and analysis software that includes data from private hospitals. There was a need to generate 5 routine aggregate output tables based on the front sheet of the hospital licensing report of each hospital in the region. The generation of these output tables required sorting of records according to different fields (e.g., whether government or private hospital, primary or secondary hospital, etc.). It is envisioned to expand LEILA to cover all data collected per hospital, and then to develop the decision algorithm for licensing. This has been put temporarily on hold pending evaluation and revision of the hospital licensing standards.
Contents and outputs: HOMIS generates the quarterlyreport of any given hospital for a given quarter, and directs the output to printer, screen, or file. Thus, a hospital can enter the statistical data directly into HOMIS and print out a
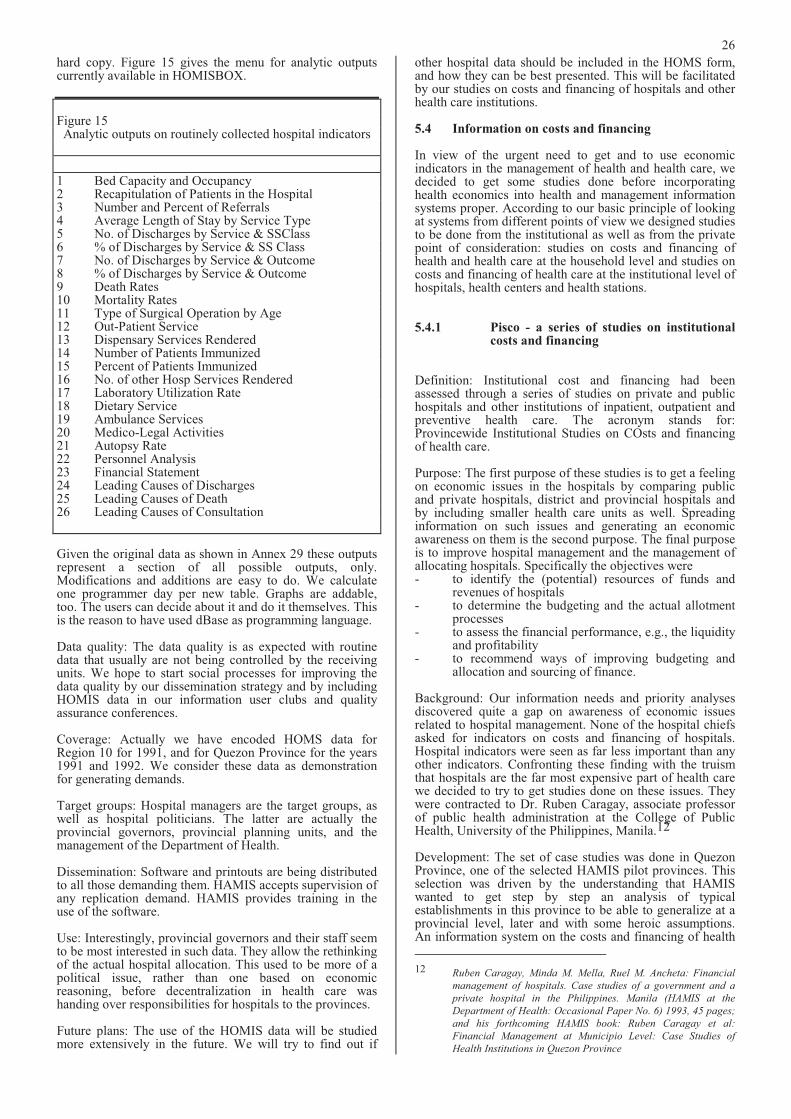
26
hard copy. Figure 15 gives the menu for analytic outputs currently available in HOMISBOX.
Figure 15 Analytic outputs on routinely collected hospital indicators
1 Bed Capacity and Occupancy 2 Recapitulation of Patients in the Hospital 3 Number and Percent of Referrals 4 Average Length of Stay by Service Type 5 No. of Discharges by Service & SSClass 6 % of Discharges by Service & SS Class 7 No. of Discharges by Service & Outcome 8 % of Discharges by Service & Outcome 9 Death Rates 10 Mortality Rates 11 Type of Surgical Operation by Age 12 Out-Patient Service 13 Dispensary Services Rendered 14 Number of Patients Immunized 15 Percent of Patients Immunized 16 No. of other Hosp Services Rendered 17 Laboratory Utilization Rate 18 Dietary Service 19 Ambulance Services 20 Medico-Legal Activities 21 Autopsy Rate 22 Personnel Analysis 23 Financial Statement 24 Leading Causes of Discharges 25 Leading Causes of Death 26 Leading Causes of Consultation
Given the original data as shown in Annex 29 these outputs represent a section of all possible outputs, only. Modifications and additions are easy to do. We calculate one programmer day per new table. Graphs are addable, too. The users can decide about it and do it themselves. This is the reason to have used dBase as programming language.
Data quality: The data quality is as expected with routine data that usually are not being controlled by the receiving units. We hope to start social processes for improving the data quality by our dissemination strategy and by including HOMIS data in our information user clubs and quality assurance conferences.
Coverage: Actually we have encoded HOMS data for Region 10 for 1991, and for Quezon Province for the years 1991 and 1992. We consider these data as demonstration for generating demands.
Target groups: Hospital managers are the target groups, as well as hospital politicians. The latter are actually the provincial governors, provincial planning units, and the management of the Department of Health.
Dissemination: Software and printouts are being distributed to all those demanding them. HAMIS accepts supervision of any replication demand. HAMIS provides training in the use of the software.
Use: Interestingly, provincial governors and their staff seem to be most interested in such data. They allow the rethinking of the actual hospital allocation. This used to be more of a political issue, rather than one based on economic reasoning, before decentralization in health care was handing over responsibilities for hospitals to the provinces.
Future plans: The use of the HOMIS data will be studied more extensively in the future. We will try to find out if
other hospital data should be included in the HOMS form, and how they can be best presented. This will be facilitated by our studies on costs and financing of hospitals and other health care institutions.
5.4 Information on costs and financing
In view of the urgent need to get and to use economic indicators in the management of health and health care, we decided to get some studies done before incorporating health economics into health and management information systems proper. According to our basic principle of looking at systems from different points of view we designed studies to be done from the institutional as well as from the private point of consideration: studies on costs and financing of health and health care at the household level and studies on costs and financing of health care at the institutional level of hospitals, health centers and health stations.
5.4.1 Pisco - a series of studies on institutionalcosts and financing
Definition: Institutional cost and financing had been assessed through a series of studies on private and public hospitals and other institutions of inpatient, outpatient and preventive health care. The acronym stands for: Provincewide Institutional Studies on COsts and financing of health care.
Purpose: The first purpose of these studies is to get a feeling on economic issues in the hospitals by comparing public and private hospitals, district and provincial hospitals and by including smaller health care units as well. Spreading information on such issues and generating an economic awareness on them is the second purpose. The final purpose is to improve hospital management and the management of allocating hospitals. Specifically the objectives were - to identify the (potential) resources of funds and
revenues of hospitals - to determine the budgeting and the actual allotment
processes - to assess the financial performance, e.g., the liquidity
and profitability - to recommend ways of improving budgeting and
allocation and sourcing of finance.
Background: Our information needs and priority analyses discovered quite a gap on awareness of economic issues related to hospital management. None of the hospital chiefs asked for indicators on costs and financing of hospitals. Hospital indicators were seen as far less important than any other indicators. Confronting these finding with the truism that hospitals are the far most expensive part of health care we decided to try to get studies done on these issues. They were contracted to Dr. Ruben Caragay, associate professor of public health administration at the College of Public Health, University of the Philippines, Manila.12
Development: The set of case studies was done in Quezon Province, one of the selected HAMIS pilot provinces. This selection was driven by the understanding that HAMIS wanted to get step by step an analysis of typical establishments in this province to be able to generalize at a provincial level, later and with some heroic assumptions. An information system on the costs and financing of health
12 Ruben Caragay, Minda M. Mella, Ruel M. Ancheta: Financial
management of hospitals. Case studies of a government and a
private hospital in the Philippines. Manila (HAMIS at the
Department of Health: Occasional Paper No. 6) 1993, 45 pages;
and his forthcoming HAMIS book: Ruben Caragay et al:
Financial Management at Municipio Level: Case Studies of
Health Institutions in Quezon Province
27
care was aimed at. Being the first, Quezon MemorialHospital accepted willingly to participate actively in the study. A larger private hospital was the second case study. Further case studies referred to a public district hospital, to a smaller hospital, to a rural health unit and a health station.
Contents: The case studies analyzed the main sources of finance and its development and did cost finding analyses, using the step-down method. Cost recovery rates were determined and break-even analyses made. Recommendations were spelled out. The following figure 16 presents the financial ratios that were calculated for the private hospital. They might be introduced into thegovernment system as well.
Figure 16 Financial ratios for a private hospital
Not included in this excerpt
Outputs: Specific outputs were given to the hospitals studied. In the case of the private hospital this reinforced the chance to do a study there. For a detailed description see the many tables in the above mentioned book of Ruben Caragay.
Data quality: The critical attitude of hospital administrators vis a vis university driven studies led to an intensive checking of the data quality. It took the researchers quite some time to get plausible and consistent data, on the other hand side.
Coverage: Case studies do not have a systematic coverage. They just select some cases to be considered like amicrocosm, in the best case.
Target groups: The hospital managers were the target groups and health politicians that should be convinced that cost and financing analysis are important tools foreconomizing health care for the benefit of the poor. Another target group was HAMIS, i.e. to learn from such studies for the development of information systems that will generate the most important of such data on a regular basis.
Dissemination: Conferences were held at the Department of Health and university students were given lectures on such issues, an avenue for health economics for these two clientele.
Use: Replication of such studies has been demanded from the Department of Health for larger public hospitals. We try to promote self-analyzing capacities in such institutions, linked to consultants from universities. The above mentioned use of the studies by HAMIS deserves underscoring, again. These studies had quite an impact on designing scope and purposes of our material and money management information systems for hospitals. Future plans: We will try to complete the set of studies on cost and financing by including some more establishments like pharmacies and drug stores. We will not try to be representative. Our case studies are just eye openers. For our information systems, too.
5.4.2 Quesex - a health seeking and expenditure survey
Definition: Quesex is a representative household survey in Quezon Province on health seeking behavior and direct and
indirect costs and the financing of health and health care. The acronym stands for: QUEzon health SEeking and health EXpenditure survey
Purpose: Quesex intends to provide essential background data for health care planning and management, especially those missing according to our information needs analyses. It focuses on the household production of health and it tries to validate some data included in other HAMIS information systems. Specifically it focuses on > the extent of utilization of health resources, i.e. - to determine the frequency with which people
consult different types of health workers (both traditional and non-traditional) and health institutions
- to determine the types of problems for which different types of health workers are consulted
- to determine the extent of coverage of selected health services like: immunization, food supplementation, weighing, pre-natal care, house spraying for malaria
> the direct and indirect costs of illness and its financing
the second being the prime concern of Quesex.
Background: Since the conception of HAMIS a household survey was considered to be a very important tool for the development and strengthening of health and management information systems. It seemed to be a panacea for any missing data. Different conceptualizations were started until we decided to focus very specifically on health expenditure of households, including all direct and indirect costs and the sources of financing.13
Development: Based on a detailed draft by HAMIS thequestionnaire was developed and pilot-tested by theDepartment of Biostatistics and Epidemiology of theCollege of Public Health, University of the Philippines, Manila.14!
Study design: The survey was done using a two-stagestratified systematic sampling design with municipalities as the stratification variable and the barangays as the primary sampling units. All the 40 municipalities and one city of Quezon province were represented in the study. A total of 1728 households were chosen and these samples allocated to the different barangays and municipalities with probabilities proportional to size.
Contents: The questionnaire is given in Annex 30. The main concepts included are listed in Figure 17.
Figure 17 Topics of the HAMIS household survey
on health seeking behavior and expenditure
Health related household expenditure
> Direct costs - cost for drugs - cost of self-medication (other than drugs, e.g.,
food, plants) - fee for (professional) consultation(s)
including dentists
13 Detlef Schwefel et alii (Eds.): Economic Aspects of AIDS and
HIV Infection. Berlin (Springer Publications) 1990 was taken as
source for verifying the different types of costs.
14 Ophelia Mendoza et alii: The HAMIS Household Survey on
Health Seeking and Health Expenditure in Quezon Province.
Forthcoming HAMIS Occasional Paper
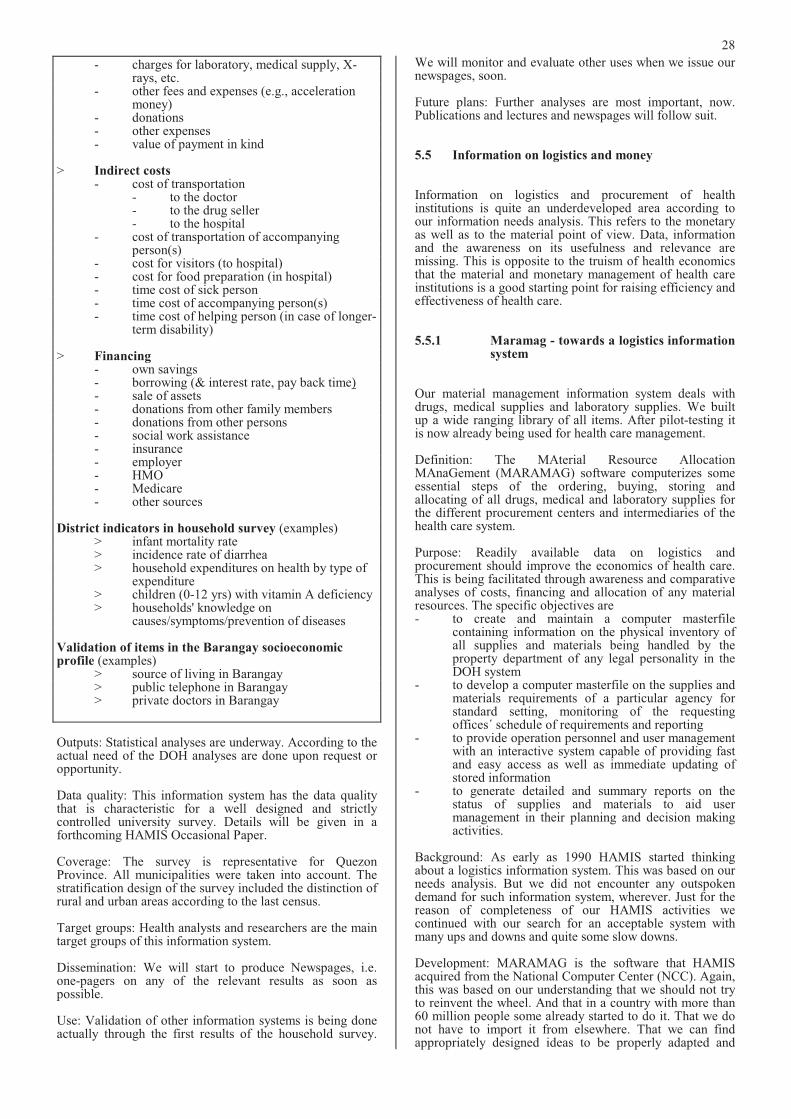
28
- charges for laboratory, medical supply, X-rays, etc.
- other fees and expenses (e.g., acceleration money)
- donations - other expenses - value of payment in kind
> Indirect costs - cost of transportation - to the doctor - to the drug seller - to the hospital - cost of transportation of accompanying
person(s) - cost for visitors (to hospital) - cost for food preparation (in hospital) - time cost of sick person - time cost of accompanying person(s) - time cost of helping person (in case of longer-
term disability)
> Financing - own savings - borrowing (& interest rate, pay back time) - sale of assets - donations from other family members - donations from other persons - social work assistance - insurance - employer - HMO - Medicare - other sources
District indicators in household survey (examples) > infant mortality rate > incidence rate of diarrhea > household expenditures on health by type of
expenditure > children (0-12 yrs) with vitamin A deficiency > households' knowledge on
causes/symptoms/prevention of diseases
Validation of items in the Barangay socioeconomic profile (examples) > source of living in Barangay > public telephone in Barangay > private doctors in Barangay
Outputs: Statistical analyses are underway. According to the actual need of the DOH analyses are done upon request or opportunity.
Data quality: This information system has the data quality that is characteristic for a well designed and strictly controlled university survey. Details will be given in a forthcoming HAMIS Occasional Paper.
Coverage: The survey is representative for Quezon Province. All municipalities were taken into account. The stratification design of the survey included the distinction of rural and urban areas according to the last census.
Target groups: Health analysts and researchers are the main target groups of this information system.
Dissemination: We will start to produce Newspages, i.e. one-pagers on any of the relevant results as soon as possible.
Use: Validation of other information systems is being done actually through the first results of the household survey.
We will monitor and evaluate other uses when we issue our newspages, soon.
Future plans: Further analyses are most important, now. Publications and lectures and newspages will follow suit.
5.5 Information on logistics and money
Information on logistics and procurement of health institutions is quite an underdeveloped area according to our information needs analysis. This refers to the monetary as well as to the material point of view. Data, information and the awareness on its usefulness and relevance are missing. This is opposite to the truism of health economics that the material and monetary management of health care institutions is a good starting point for raising efficiency and effectiveness of health care.
5.5.1 Maramag - towards a logistics information system
Our material management information system deals with drugs, medical supplies and laboratory supplies. We built up a wide ranging library of all items. After pilot-testing it is now already being used for health care management.
Definition: The MAterial Resource Allocation MAnaGement (MARAMAG) software computerizes some essential steps of the ordering, buying, storing and allocating of all drugs, medical and laboratory supplies for the different procurement centers and intermediaries of the health care system.
Purpose: Readily available data on logistics and procurement should improve the economics of health care. This is being facilitated through awareness and comparative analyses of costs, financing and allocation of any material resources. The specific objectives are - to create and maintain a computer masterfile
containing information on the physical inventory ofall supplies and materials being handled by the property department of any legal personality in theDOH system
- to develop a computer masterfile on the supplies and materials requirements of a particular agency for standard setting, monitoring of the requesting offices´ schedule of requirements and reporting
- to provide operation personnel and user management with an interactive system capable of providing fast and easy access as well as immediate updating of stored information
- to generate detailed and summary reports on the status of supplies and materials to aid user management in their planning and decision making activities.
Background: As early as 1990 HAMIS started thinkingabout a logistics information system. This was based on our needs analysis. But we did not encounter any outspoken demand for such information system, wherever. Just for the reason of completeness of our HAMIS activities we continued with our search for an acceptable system with many ups and downs and quite some slow downs.
Development: MARAMAG is the software that HAMIS acquired from the National Computer Center (NCC). Again, this was based on our understanding that we should not try to reinvent the wheel. And that in a country with more than 60 million people some already started to do it. That we do not have to import it from elsewhere. That we can find appropriately designed ideas to be properly adapted and
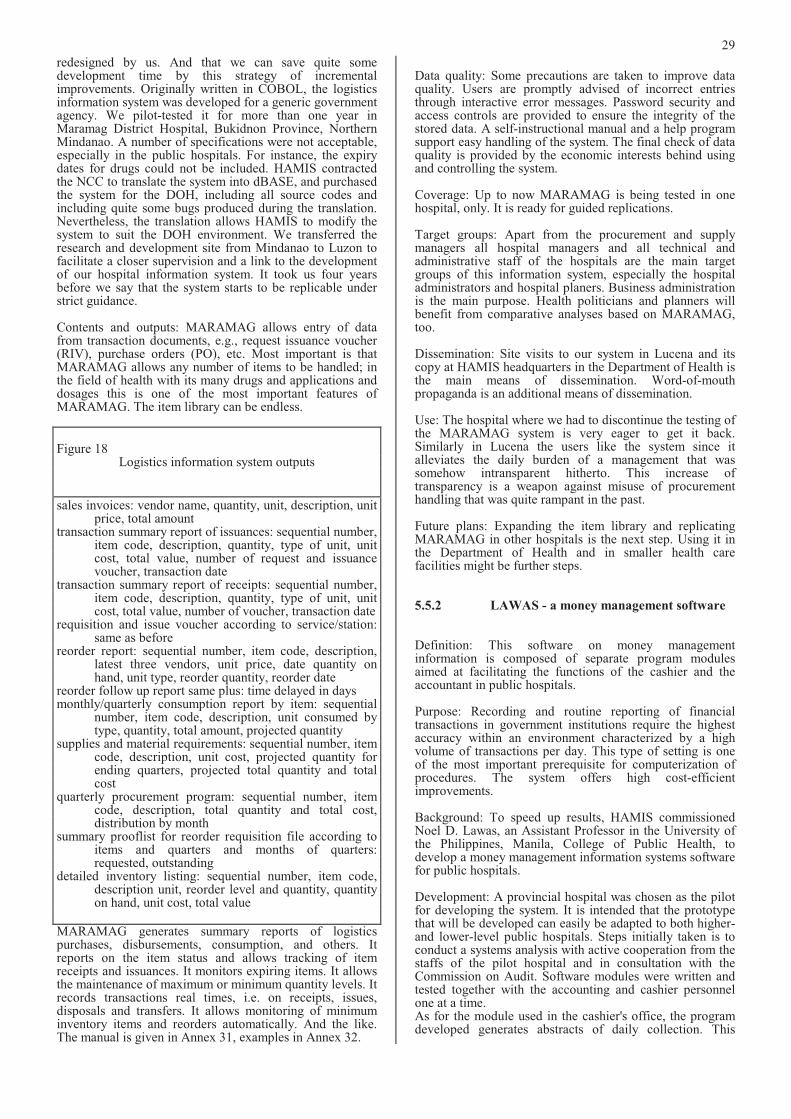
29
redesigned by us. And that we can save quite some development time by this strategy of incremental improvements. Originally written in COBOL, the logistics information system was developed for a generic government agency. We pilot-tested it for more than one year in Maramag District Hospital, Bukidnon Province, Northern Mindanao. A number of specifications were not acceptable, especially in the public hospitals. For instance, the expiry dates for drugs could not be included. HAMIS contracted the NCC to translate the system into dBASE, and purchased the system for the DOH, including all source codes and including quite some bugs produced during the translation. Nevertheless, the translation allows HAMIS to modify the system to suit the DOH environment. We transferred the research and development site from Mindanao to Luzon to facilitate a closer supervision and a link to the development of our hospital information system. It took us four years before we say that the system starts to be replicable under strict guidance.
Contents and outputs: MARAMAG allows entry of data from transaction documents, e.g., request issuance voucher (RIV), purchase orders (PO), etc. Most important is that MARAMAG allows any number of items to be handled; in the field of health with its many drugs and applications and dosages this is one of the most important features of MARAMAG. The item library can be endless.
Figure 18 Logistics information system outputs
sales invoices: vendor name, quantity, unit, description, unit price, total amount
transaction summary report of issuances: sequential number, item code, description, quantity, type of unit, unit cost, total value, number of request and issuance voucher, transaction date
transaction summary report of receipts: sequential number, item code, description, quantity, type of unit, unit cost, total value, number of voucher, transaction date
requisition and issue voucher according to service/station: same as before
reorder report: sequential number, item code, description, latest three vendors, unit price, date quantity on hand, unit type, reorder quantity, reorder date
reorder follow up report same plus: time delayed in days monthly/quarterly consumption report by item: sequential
number, item code, description, unit consumed by type, quantity, total amount, projected quantity
supplies and material requirements: sequential number, item code, description, unit cost, projected quantity for ending quarters, projected total quantity and totalcost
quarterly procurement program: sequential number, item code, description, total quantity and total cost, distribution by month
summary prooflist for reorder requisition file according to items and quarters and months of quarters: requested, outstanding
detailed inventory listing: sequential number, item code, description unit, reorder level and quantity, quantity on hand, unit cost, total value
MARAMAG generates summary reports of logistics purchases, disbursements, consumption, and others. It reports on the item status and allows tracking of item receipts and issuances. It monitors expiring items. It allows the maintenance of maximum or minimum quantity levels. It records transactions real times, i.e. on receipts, issues, disposals and transfers. It allows monitoring of minimum inventory items and reorders automatically. And the like. The manual is given in Annex 31, examples in Annex 32.
Data quality: Some precautions are taken to improve data quality. Users are promptly advised of incorrect entries through interactive error messages. Password security and access controls are provided to ensure the integrity of the stored data. A self-instructional manual and a help program support easy handling of the system. The final check of data quality is provided by the economic interests behind using and controlling the system.
Coverage: Up to now MARAMAG is being tested in one hospital, only. It is ready for guided replications.
Target groups: Apart from the procurement and supply managers all hospital managers and all technical and administrative staff of the hospitals are the main target groups of this information system, especially the hospital administrators and hospital planers. Business administration is the main purpose. Health politicians and planners will benefit from comparative analyses based on MARAMAG,too.
Dissemination: Site visits to our system in Lucena and its copy at HAMIS headquarters in the Department of Health is the main means of dissemination. Word-of-mouth propaganda is an additional means of dissemination.
Use: The hospital where we had to discontinue the testing of the MARAMAG system is very eager to get it back. Similarly in Lucena the users like the system since it alleviates the daily burden of a management that was somehow intransparent hitherto. This increase of transparency is a weapon against misuse of procurement handling that was quite rampant in the past.
Future plans: Expanding the item library and replicating MARAMAG in other hospitals is the next step. Using it in the Department of Health and in smaller health carefacilities might be further steps.
5.5.2 LAWAS - a money management software
Definition: This software on money management information is composed of separate program modulesaimed at facilitating the functions of the cashier and the accountant in public hospitals.
Purpose: Recording and routine reporting of financial transactions in government institutions require the highest accuracy within an environment characterized by a high volume of transactions per day. This type of setting is one of the most important prerequisite for computerization of procedures. The system offers high cost-efficient improvements.
Background: To speed up results, HAMIS commissionedNoel D. Lawas, an Assistant Professor in the University of the Philippines, Manila, College of Public Health, to develop a money management information systems software for public hospitals.
Development: A provincial hospital was chosen as the pilot for developing the system. It is intended that the prototype that will be developed can easily be adapted to both higher- and lower-level public hospitals. Steps initially taken is to conduct a systems analysis with active cooperation from the staffs of the pilot hospital and in consultation with the Commission on Audit. Software modules were written and tested together with the accounting and cashier personnel one at a time. As for the module used in the cashier's office, the program developed generates abstracts of daily collection. This
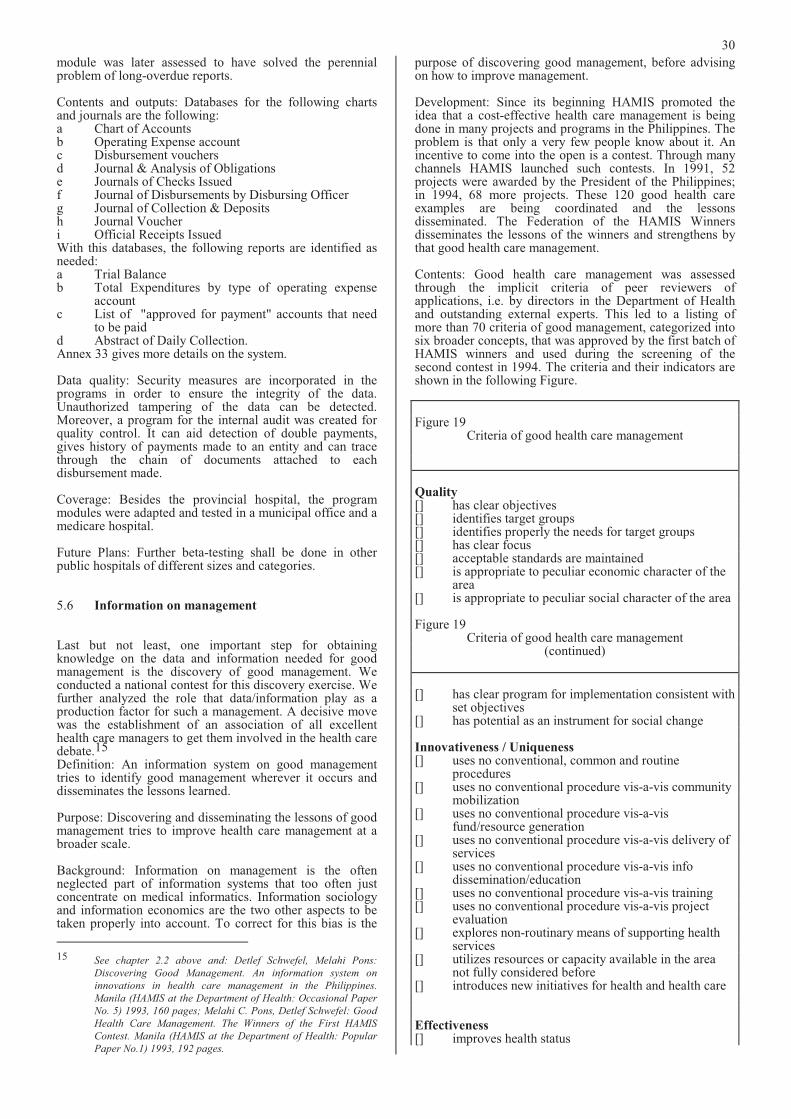
30
module was later assessed to have solved the perennial problem of long-overdue reports.
Contents and outputs: Databases for the following charts and journals are the following: a Chart of Accounts b Operating Expense account c Disbursement vouchers d Journal & Analysis of Obligations e Journals of Checks Issued f Journal of Disbursements by Disbursing Officer g Journal of Collection & Deposits h Journal Voucher i Official Receipts Issued With this databases, the following reports are identified as needed: a Trial Balance b Total Expenditures by type of operating expense
account c List of "approved for payment" accounts that need
to be paid d Abstract of Daily Collection. Annex 33 gives more details on the system.
Data quality: Security measures are incorporated in the programs in order to ensure the integrity of the data. Unauthorized tampering of the data can be detected.Moreover, a program for the internal audit was created for quality control. It can aid detection of double payments, gives history of payments made to an entity and can trace through the chain of documents attached to each disbursement made.
Coverage: Besides the provincial hospital, the program modules were adapted and tested in a municipal office and a medicare hospital.
Future Plans: Further beta-testing shall be done in other public hospitals of different sizes and categories.
5.6 Information on management
Last but not least, one important step for obtaining knowledge on the data and information needed for good management is the discovery of good management. We conducted a national contest for this discovery exercise. We further analyzed the role that data/information play as a production factor for such a management. A decisive move was the establishment of an association of all excellent health care managers to get them involved in the health care debate.15
Definition: An information system on good management tries to identify good management wherever it occurs and disseminates the lessons learned.
Purpose: Discovering and disseminating the lessons of good management tries to improve health care management at a broader scale.
Background: Information on management is the often neglected part of information systems that too often just concentrate on medical informatics. Information sociology and information economics are the two other aspects to be taken properly into account. To correct for this bias is the
15 See chapter 2.2 above and: Detlef Schwefel, Melahi Pons:
Discovering Good Management. An information system on
innovations in health care management in the Philippines.
Manila (HAMIS at the Department of Health: Occasional Paper
No. 5) 1993, 160 pages; Melahi C. Pons, Detlef Schwefel: Good
Health Care Management. The Winners of the First HAMIS
Contest. Manila (HAMIS at the Department of Health: Popular
Paper No.1) 1993, 192 pages.
purpose of discovering good management, before advising on how to improve management.
Development: Since its beginning HAMIS promoted theidea that a cost-effective health care management is being done in many projects and programs in the Philippines. The problem is that only a very few people know about it. An incentive to come into the open is a contest. Through many channels HAMIS launched such contests. In 1991, 52 projects were awarded by the President of the Philippines; in 1994, 68 more projects. These 120 good health care examples are being coordinated and the lessons disseminated. The Federation of the HAMIS Winners disseminates the lessons of the winners and strengthens by that good health care management.
Contents: Good health care management was assessed through the implicit criteria of peer reviewers of applications, i.e. by directors in the Department of Health and outstanding external experts. This led to a listing of more than 70 criteria of good management, categorized into six broader concepts, that was approved by the first batch of HAMIS winners and used during the screening of the second contest in 1994. The criteria and their indicators are shown in the following Figure.
Figure 19 Criteria of good health care management
Quality[] has clear objectives [] identifies target groups [] identifies properly the needs for target groups [] has clear focus [] acceptable standards are maintained [] is appropriate to peculiar economic character of the
area [] is appropriate to peculiar social character of the area
Figure 19 Criteria of good health care management
(continued)
[] has clear program for implementation consistent with set objectives
[] has potential as an instrument for social change
Innovativeness / Uniqueness[] uses no conventional, common and routine
procedures [] uses no conventional procedure vis-a-vis community
mobilization [] uses no conventional procedure vis-a-vis
fund/resource generation [] uses no conventional procedure vis-a-vis delivery of
services [] uses no conventional procedure vis-a-vis info
dissemination/education [] uses no conventional procedure vis-a-vis training [] uses no conventional procedure vis-a-vis project
evaluation [] explores non-routinary means of supporting health
services [] utilizes resources or capacity available in the area
not fully considered before [] introduces new initiatives for health and health care
Effectiveness[] improves health status
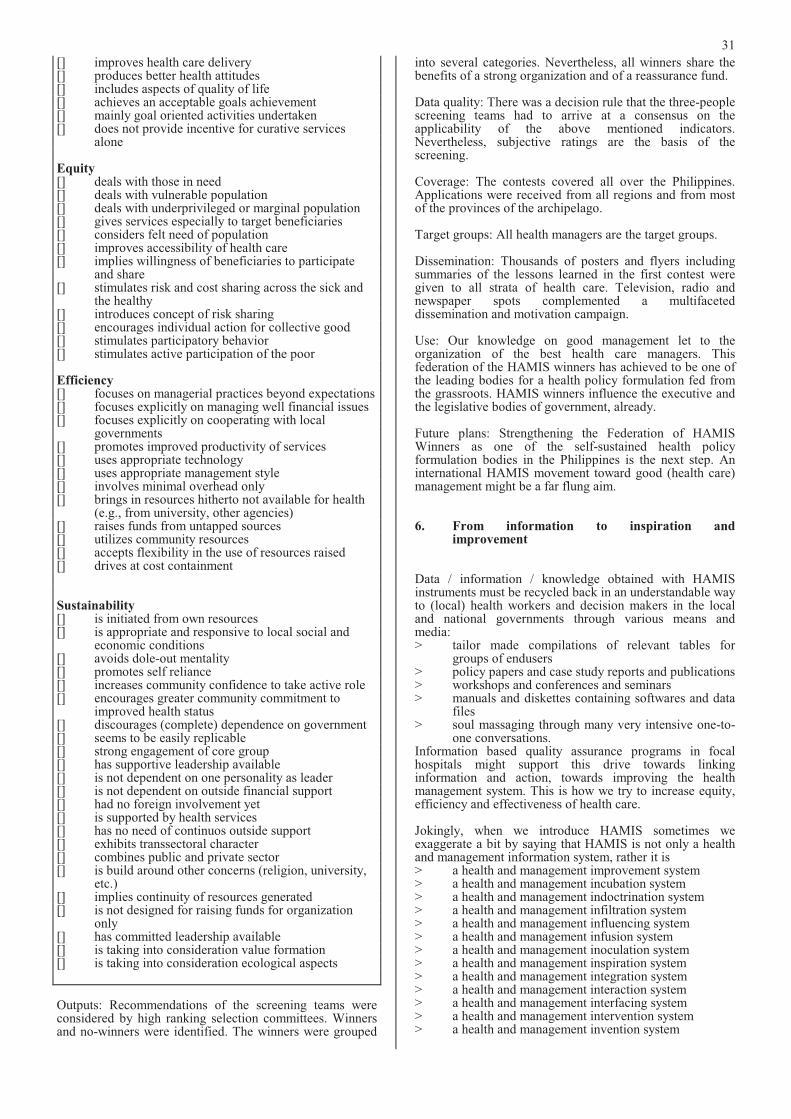
31
[] improves health care delivery [] produces better health attitudes [] includes aspects of quality of life [] achieves an acceptable goals achievement [] mainly goal oriented activities undertaken [] does not provide incentive for curative services
alone
Equity [] deals with those in need [] deals with vulnerable population [] deals with underprivileged or marginal population [] gives services especially to target beneficiaries [] considers felt need of population [] improves accessibility of health care [] implies willingness of beneficiaries to participate
and share [] stimulates risk and cost sharing across the sick and
the healthy [] introduces concept of risk sharing [] encourages individual action for collective good[] stimulates participatory behavior [] stimulates active participation of the poor
Efficiency[] focuses on managerial practices beyond expectations [] focuses explicitly on managing well financial issues [] focuses explicitly on cooperating with local
governments [] promotes improved productivity of services [] uses appropriate technology [] uses appropriate management style [] involves minimal overhead only [] brings in resources hitherto not available for health
(e.g., from university, other agencies) [] raises funds from untapped sources [] utilizes community resources [] accepts flexibility in the use of resources raised [] drives at cost containment
Sustainability[] is initiated from own resources [] is appropriate and responsive to local social and
economic conditions [] avoids dole-out mentality [] promotes self reliance [] increases community confidence to take active role [] encourages greater community commitment to
improved health status [] discourages (complete) dependence on government [] seems to be easily replicable [] strong engagement of core group [] has supportive leadership available [] is not dependent on one personality as leader [] is not dependent on outside financial support [] had no foreign involvement yet [] is supported by health services [] has no need of continuos outside support [] exhibits transsectoral character [] combines public and private sector [] is build around other concerns (religion, university,
etc.) [] implies continuity of resources generated [] is not designed for raising funds for organization
only [] has committed leadership available [] is taking into consideration value formation [] is taking into consideration ecological aspects
Outputs: Recommendations of the screening teams were considered by high ranking selection committees. Winners and no-winners were identified. The winners were grouped
into several categories. Nevertheless, all winners share the benefits of a strong organization and of a reassurance fund.
Data quality: There was a decision rule that the three-people screening teams had to arrive at a consensus on theapplicability of the above mentioned indicators. Nevertheless, subjective ratings are the basis of the screening.
Coverage: The contests covered all over the Philippines. Applications were received from all regions and from most of the provinces of the archipelago.
Target groups: All health managers are the target groups.
Dissemination: Thousands of posters and flyers including summaries of the lessons learned in the first contest were given to all strata of health care. Television, radio and newspaper spots complemented a multifaceted dissemination and motivation campaign.
Use: Our knowledge on good management let to the organization of the best health care managers. Thisfederation of the HAMIS winners has achieved to be one of the leading bodies for a health policy formulation fed from the grassroots. HAMIS winners influence the executive and the legislative bodies of government, already.
Future plans: Strengthening the Federation of HAMISWinners as one of the self-sustained health policy formulation bodies in the Philippines is the next step. An international HAMIS movement toward good (health care) management might be a far flung aim.
6. From information to inspiration and improvement
Data / information / knowledge obtained with HAMIS instruments must be recycled back in an understandable way to (local) health workers and decision makers in the local and national governments through various means and media: > tailor made compilations of relevant tables for
groups of endusers > policy papers and case study reports and publications > workshops and conferences and seminars > manuals and diskettes containing softwares and data
files > soul massaging through many very intensive one-to-
one conversations. Information based quality assurance programs in focal hospitals might support this drive towards linking information and action, towards improving the health management system. This is how we try to increase equity, efficiency and effectiveness of health care.
Jokingly, when we introduce HAMIS sometimes we exaggerate a bit by saying that HAMIS is not only a health and management information system, rather it is > a health and management improvement system > a health and management incubation system > a health and management indoctrination system > a health and management infiltration system > a health and management influencing system > a health and management infusion system > a health and management inoculation system > a health and management inspiration system > a health and management integration system > a health and management interaction system > a health and management interfacing system > a health and management intervention system > a health and management invention system
32
By this we mean that an information system is to be seen in its context, in the production cycle of information that ranges from a needs assessment, through production and dissemination of data to the use of information for better health care management.
6.1 Printouts and publications
It is already a step forward when the higher echelons of health care management feed back printouts of data to the data producers. Very often up to now, not even this was done. Information systems were a kind of mining for export. Data were taken away from those obliged to produce them and no value added came back to the producers. This seems to be a keyword for this chapter: there should be a value added stemming from information.
Printouts of the data are at least a feedback from above. They are valuable if they are understandable and attractive to read. We have to keep in mind that midwives are midwives and not statisticians and that doctors should be doctors and not statisticians. Regression coefficients are fashionable and modernistic but not for end-users. Lists and graphs and even newspaper like presentations or comics are more adapted. Tables are just the second best. It would be better to attach interpretations to them and to feed back only such tables that are really relevant. Developing expert-systems for interpreting the thousands of tables will be an important step into the future. Nevertheless, printouts of tables are better than nothing, if they are combined with a strategy that is converting data into social processes.
6.2 On line presentations
Computer literacy is spreading rapidly all over the world. We in the Philippines are quite fast with it. Quite a number of doctors and mayors and other decision makers are getting used to have computers at their fingertips. This is why we bring our softwares wherever they are requested. The menu driven softwares are so easy to understand and to operate, that they are good starters for a knowledge driven computer literacy in favor of health and health care improvement. Quite a number of computer fans now play around with our systems and derive benefits for their jobs and catchments.
6.3 User clubs and quality assurance conferences
Social processes which bring data and information and knowledge into health and health care seem to be one of the most important strategies for an applied HAMIS.
In one of our pilot provinces, in Quezon Province, we started to conduct monthly Quality Assurance Conferences aimed at sending our information tools and results back to the health managers. Once in a month, every third Thursday the main hospital staff meets with some HAMIS staff and invitees from academe or other hospitals. Clinical, nursing, technical, administrative staff participate as well as district health officers and members of the provincial health planning boards. Based on results and findings of our information systems health and health management issues are being presented and discussed, mainly let by representatives of the province. There is always one recurrent theme: avoidable or preventable morbidity and mortality. Printouts of our hospital information system are the leading papers, especially the detailed mortality listing. For interpreting such data many other data from different information systems are being presented and referred to. Data linkages are usually hybrid ones, i.e. via the residence
of the patients. The most important data linkages are nevertheless the understanding of the audience and the taking over responsibility when discovering that there are ways and means to reduce the number of preventable and avoidable deaths and diseases. HAMIS has built up a small library for reference and has linked with the computerized library and journals information system of the College of Public Health at the University of the Philippines, Manila.
In additional to the focus on avoidable deaths, a special topic or theme is introduced. Special topics are decided upon beforehand to allow preparation of the participants. Topics are varied and range from infectious diseases and economics, to hospital development. These monthly conferences are held for the purpose of being updated on trends and issues, and of providing the hospital staff some kind of reinforcement. Externals are accepted as lecturers as long as there are no internals to do the presentations yet.
This is how we spell the HAMIS quality assurance conferences: H Health and management information systems are
presented in its various aspects; at least one different information system is looked into in some detail.
A Avoidable or preventable deaths are being used as a quality tracer with reference to the detailed mortality listing generated from our Lucena system.A moderator coming from outside the catchment would be preferable.
M Mini-research should be presented by the participants, i.e. questions arising in meetings should be addressed by the participants in a "research" minded way. Cooperation of universities and pharmaceutical industries could bring some incentives.
I Invited speakers should be Involved speakers, i.e. they should be asked to join occasionally to comment and improve on the mini-researches of the hospital staff. The speakers should give updates onthe latest technology or state of the art and stimulate the audience to frame their own research questions.
S Strategic planning for the next quality assurance conferences, based on the understanding that the most important aspect is to convert information into understanding and ultimately, into action.
These conferences have been greatly appreciated by the participants. It seems to be a good way for feeding back information of our HAMIS to those who should benefit from the data for improving health and health care for the poor.
6.4 Policy papers and lobbying
Data are like words. Just drops in the ocean of communication, information and understanding. This is why we sometimes mention that the most important information systems in the world are newspapers and television news. We conceptualize information systems as the exercise to give empirical foundation for wording hypotheses, findings and understandings. If this is the case, policy papers are an important tool for disseminating the findings of information systems and insights gained by them. We give three examples:
- Our information system on good health care management discovered quite a number of initiativestowards health assurance and health insurance at local levels. Based on this the Federation of the HAMIS Winners formulated a policy paper on social health insurance - see Annex 34 - and recommended quite a number of amendments of the senate proposal for a national health insurance. Lobbying in
33
the Department of Health, with the Senate and with representatives of the Congress was a "must" felt by the Federation of HAMIS Winners when they were aware of a national health insurance bill that would be quite relevant for good health care managers at the grassroots. Such a linking of information and action is the very reason for information systems.
- Our information system on small area socioeconomics tries to describe the cultural, social and economic context of health and health care. Thescarcity of funds for the health sector and the very relevance of such outer factors for health and health care can be taken into account when health policy tries to export health issues to other sectors. Creating or awarding a healthy environment is a strategy of the Department of Health that transcends the usual boundaries of ministries. Based on our Barangay Socioeconomic Profile we extended our strategy of describing the "healthy context" of health and health care to a much wider array of institutions: healthybarrios, healthy streets, healthy resorts, healthy factories, healthy cities, etc. Annex 35 gives our example of writing a policy paper along these linesof reasoning.
- The policy paper on Health Networking in Annex 36extends this viewpoint: it is matching five HAMIS information systems with five essential public health programs and five social mobilization strategies, that were discovered by HAMIS. Thus it is advocating a knowledge based and community managed health care delivery system.
Policy papers are nothing if they are not read. This calls for fighting for getting attention, e.g., in hearings, in newspapers or just telling the contents to everybody who
should know and act, even if they are not yet interested in the issues.
6.5 Federation of good managers
One of our information systems tried to identify good health care management. Good health care managers we can find everywhere, i.e. in the ministries, in local governments, in trade unions and churches, in non-governmental organizations, in peoples organizations and in spontaneous groups of concerned citizens. Our HAMIS contests identified 120 good projects that are striving to achieve effectiveness, efficiency and equity under conditions of quality, innovativeness and sustainability. When weassociated all these projects and federated them we started a process of accelerated economies of scale and effects that are to be called bushfire or snowball or spill over or trickle up or down effects. People and organizations willing to achieve and to learn are the best partners of information systems. This is why we now hand over our information tools to these health care managers, inter alia. This is why we dedicate this book to the good health care managers in the Philippines. There are many. Many more have to be discovered. And to be empowered.
This is a partial reprint of: Detlef Schwefel, B.A. Marte, T. Remotigue, M.R. David, B.C. Magtaas, R. Delino, F. Quijano, M. Ringor, M. Pons: HAMIS. A health and management information system for the Philippines. Manila (HAMIS at the Department of Health: Occasional Paper No. 11) 1995, 703 pag
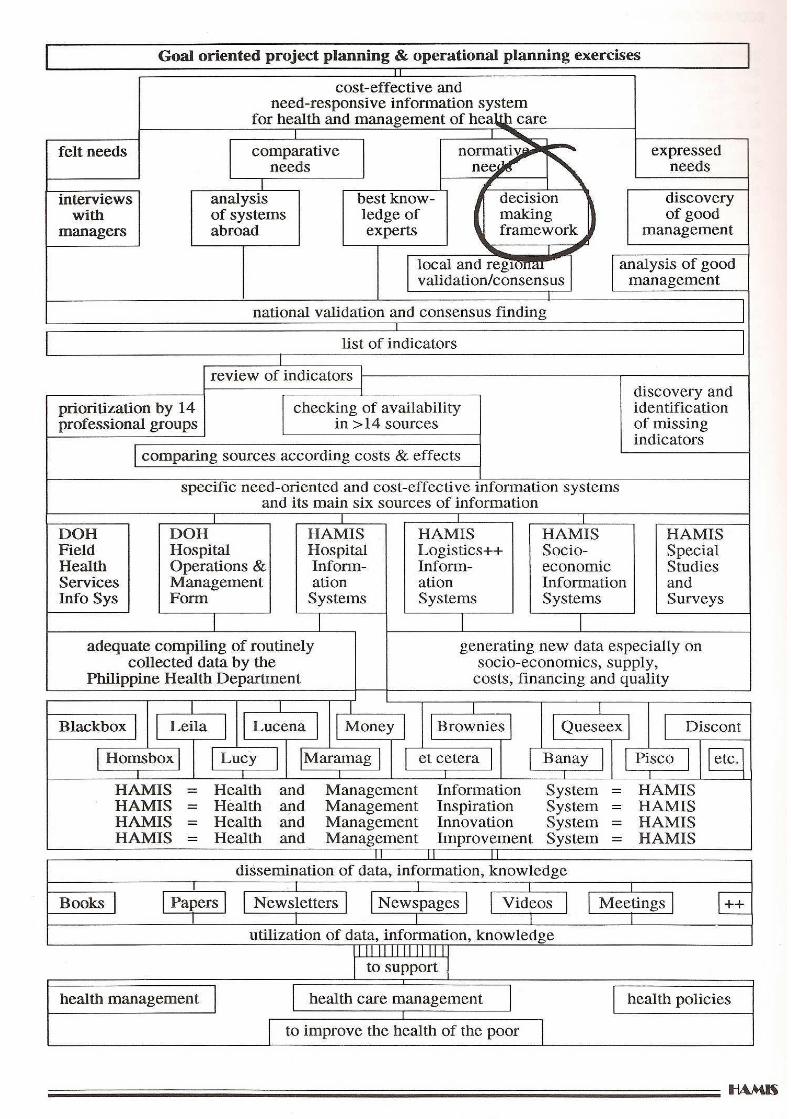


![Schwefel-Stickstoff-Verbindungen, XI [1] Elektrochemische ...zfn.mpdl.mpg.de/data/Reihe_B/37/ZNB-1982-37b-1137.pdf · 1139 G. Brands-A. Golloch Schwefel-Stickstoff-Verbindungen ß)](https://img.pdfslide.us/doc/110x75/5d5f0bab88c993a4798ba9b6/schwefel-stickstoff-verbindungen-xi-1-elektrochemische-zfnmpdlmpgdedatareiheb37znb-1982-37b-1137pdf.jpg)