Embed Size (px)
Citation preview

Department of Geosciences, Faculty of Science and Technology
3D and 4D seismic investigations of fluid flow and gas hydrate systems At sites across the Barents Sea and the NW Svalbard margin
Malin Waage
A dissertation for the degree of Philosophiae Doctor – February 2019

1
Mt. Baker, Washington state. Private photo.
“The Earth is what we all have in common”
Naturalist and writer, Wendell Berry

2
Abstract
Using the state-of-the-art high resolution P-Cable 3D seismic system, in this thesis we (1) study the shallow strata (<1km below seabed) and describe the geological controls and driving mechanisms for fluid leakage at two sites in the northern Barents Sea, and (2) introduce a new time-lapse seismic method for high-frequency (~30-350 Hz) P-Cable seismic data. The study areas are interesting as they are located close to the upper termination of the gas hydrate stability zone and may experience ongoing or past growth and decomposition of gas hydrates. Bjørnøyrenna area hosts over 100 km-wide craters – a possible result of methane blowouts in the past. In Storfjordrenna, methane venting associates to gas hydrate bearing mounds (pingos). The northern Barents Sea is an underexplored area compared to the southern Barents Sea open for petroleum exploration. Therefore, our studies provide unique insight into the architecture and nature of shallow methane accumulations, fluid flow dynamics and gas hydrate inventories connected to thermogenic gas reservoirs that are deemed to occur elsewhere in the region. Our results point towards different geological controls on fluid flow. In Storfjordrenna, methane from Paleocene strata migrates along permeable beds and extensional faults linked to the regional Hornsund Fault Complex, accumulates under Quaternary glacial tills and locally forms gas hydrate chimneys. The Bjørnøyrenna lacks a glacial cover and the craters are incised in lithified, yet fractured, Triassic bedrocks. The source and reservoir of methane here is shallow Triassic clinoforms widespread across the Barents Sea. Furthermore, using 6 P-Cable 3D seismic datasets from three areas with and without known active fluid flow, we test seismic repeatability at various geological setting and develop an optimal workflow for 4D seismic approach. The results show high potential of such high-resolutions time-lapse seismic studies to reveal natural fluid flow dynamics on a yearly time scale.

3
Preface
This doctoral thesis was carried out between September 2015 and December 2018 at the Department of Geosciences at UiT - The Arctic University of Norway, Tromsø. The PhD project was funded by VISTA - a basic research program in collaboration between The Norwegian Academy of Science and Letters, and Statoil (proj. number 6266). The project was integrated into the sub seabed reservoirs group (WP1) at the Centre of Excellence for Arctic Gas Hydrates, Environment and Climate (CAGE) (Research Council of Norway (grant no. 223259). My main supervisor and VISTA project director was Prof. Stefan Bünz. In addition, I was co-supervised by Prof. Jürgen Mienert (CAGE) and Prof. Karin Andreassen (CAGE). As a part of this thesis work, I have processed 2D, 3D, 4D seismic data and interpreted several high-resolution 2D and P-Cable 3D seismic datasets. Furthermore, I have participated in seven CAGE research cruises gaining field experience during more than 100 days at sea throughout my three years of the doctoral degree training. As a doctoral student in geosciences at UiT - The Arctic University of Norway, I have been a member of the research school AMGG (Arctic Marine Geology and Geophysics), and thus participated in several AMGG field trips (10-ECT) to Italy and the AMGG hosted International Training School “Bubbles 2017” (5-ECT). Doctoral candidates are required to complete courses worth 30-ECT. Compulsory courses are AMGG-courses mentioned above (10-ECT) and a 5-ECT “Philosophy of science and ethics” course. Optional courses carried out and approved are a 5 ECT “Practical Seismic Processing” course and a 10 ECT “Fold and Thrust Belts and Foreland Basin Systems at UNIS, Svalbard. I have participated and presented new scientific results and findings at several international and national conferences and workshops including the EGU16 General Assembly (European Geological Union), GIMS13 (13th International Conference on Gas in Marine Sediments in Tromsø, Norway), ICGH9 (9th International Conference on Gas Hydrates in Denver, Colorado, USA) and the EAGE/SEG Research Workshop 2017 (Geophysical Monitoring of CO2 Injection: CCS and CO2-EOR in Trondheim, Norway). At EGU16, I was invited as a panelist at the press conference “Giant seafloor craters and thriving fauna: Methane seepage in the Arctic”. The first part of my doctoral thesis introduces the thematic and regional framework and background of the project including stating the overall objectives of the thesis. In the second part, I present geological and physiographic characteristics of the main study areas. The third sections summarizes the materials and methodology. The fourth part contains a summary of the research articles, a synthesis discussing the overall conclusions and findings of the work and recommendations for future work. Subsequently, the three research articles of this thesis are presented. The supplementary materials contain a list of other research works that are not included in this thesis.
4
List of articles
1. Malin Waage, Alexey Portnov, Pavel Serov, Stefan Bünz, Kate A. Waghorn, Sunil Vadakkepuliyambatta, Jürgen Mienert, Karin Andreassen. GGeological controls on fluid flow and gas hydrate pingo development on the Barents Sea margin. Post revision in editor’s office, G-cubed – Geochemistry, Geophysics, Geosciences.
2. Malin Waage, Pavel Serov, Karin Andreassen, Kate A. Waghorn, Stefan Bünz. CControls on giant methane blow-out craters and mounds on the Arctic seafloor. Manuscript.
3. Malin Waage, Stefan Bünz, Martin Landrø, Andreia Plaza-Faverola, Kate Alyse Waghorn. (2018). RRepeatability of high-resolution 3D seismic data. Accepted manuscript, Geophysics, 84(1), 1-60. DOI: 10.1190/geo2018-0099.1

5
Supervisors Prof. SStefan Bünz CAGE – Centre for Arctic Gas Hydrate, Environment and Climate, Department of Geosciences, UiT – the Arctic University of Norway, Tromsø, Norway Prof. KKarin Andreassen CAGE – Centre for Arctic Gas Hydrate, Environment and Climate, Department of Geosciences, UiT – the Arctic University of Norway, Tromsø, Norway Prof. JJürgen Mienert CAGE – Centre for Arctic Gas Hydrate, Environment and Climate, Department of Geosciences, UiT – the Arctic University of Norway, Tromsø, Norway

6
Acknowledgements
Thanks to Stefan Bünz, my main supervisor, firstly, for opening up the opportunity for me to start a Ph.D. (through a VISTA scholarship) with a topic that was very appealing. The choice of leaving the industry (and loads of free time) and starting a new career within the academia was quite easy. Secondly, for the support, guidance, and knowledge that you have shared with me these years and to complete the degree finally. I am genuinely grateful for everything you have done along the way. My co-supervisors, Jürgen Mienert and Karin Andreassen, also deserve a big thank you for the support, inspirational talks and guidance. You are all great, engaging and dedicated scientists and a true inspiration to learn from and work with, and have been a part of creating, structuring and editing the different articles. I am also grateful that I got the opportunity to be a part of CAGE, through the center I have gained insight in- and been involved in many different disciplines, and learned the benefit of multidisciplinary approaches.
I moreover would like to thank my colleagues and other co-authors on articles that have contributed to the work leading to these three articles. Kate, that taught me how to process seismic data, and that has been massive support the entire way. I also truly appreciate the close friendship we have made along the way. Thank you Alexey Portnov, you contributed to a kick-start of article 1 and good support the entire way of this article. Pavel Serov made a significant contribution to article 1 and 2, thank you! Thank you Martin Landrø, for offering to help to shape article 3, and for the guidance, discussions and significant contributions regarding this article. I also really appreciated the contributions and discussion from Sunil Vadakkepuliyambatta, Andreia-Plaza Faverola, and Espen Valberg.
The environment in CAGE, but also the rest of IG, was beyond all expectations. Such a unique workplace with many young PhDs and Post Docs that share similar interests for the great outdoors and the activities it follows. Especially thanks to Sten-Andreas, Anna, Alex, Alexey, Kate, Sunil, Sunny, Vårin, Lis, Kärt, Dasha, Calvin, Mariana, Carly, Henry, Emmilie, Arunima, and Giacomo for all discussions, activities, dinners, and parties that made these years a lot more fun and fruitful! I can go on with friends outside of work, but the list will be too extensive. Giuliana Panieri arranged several field trips to Italy and workshops that further increased our social bonds, knowledge and led to many happy memories, to that I am grateful!
The crew at Helmer Hanssen, always in a good mood and hands on, and Steinar Iversen, Bjørn-Runar Olsen and Truls Holm, the engineers onboard, deserve many thanks for the smooth data acquisitions.
I would also like to thank Håkon Sandbakken for coordinating the project and organizing interactions with other VISTA-scholars in Oslo.

7
Og så vil eg takke familien min for all støtte gjennom nesten 20 år med studia. Dei har alltid hatt trua på meg, og det har motivert meg til å fortsetje.
Lastly, Pasha that has supported me endlessly throughout these years. His ability to see things clear is one of many good qualities he poses. While my thoughts are always spinning around, he can slow the carousel down, and make me see clearer too. Over the last two years, he has also been my best skiing-, hiking- and running friend, so thanks for all our joyful moments together, which has also, kept the motivation up!
Thank you all, Malin

8
Table of Content
Abstract Preface Supervisors Acknowledgements List of articles
1. Introduction…………………………………………………………………………………………………………………………9 1.1. Scope 1.2. Hydrocarbon gases in marine sediments 1.3. Natural gas seepage
2. Study areas…………………………………………………………………………………………………………………………17
2.1. Geologic and physiographic settings of the Barents Sea 2.2. Hydrocarbon leakage in the Barents Sea 2.3. The Storfjordrenna gas hydrate pingo site (Article 1) 2.4. The Bjørnøyrenna crater area (Article 2) 2.5. The Vestnesa Ridge (Article 3)
3. Materials and methodology………………………………………………………………………………………………..23
3.1. Seismic data and interpretation 3.2. The P-cable system 3.3. P-Cable 3D seismic processing 3.4. Seismic repeatability
4. Summary of articles ……………………………………………………………………………………………………………29
4.1. Article 1 4.2. Article 2 4.3. Article 3
5. Synthesis and Outlook………………………………………………………………………………………………………..32
5.1. Synthesis 5.2. Outlook References…………………………………………………………………………………………………………….................36
6. Supplementary 6.1. Article contributions 6.2. General research results

9
1. Introduction
1.1 Scope Since the discovery of fluid flow expressions on the seafloor some 50-60 years ago, awareness of the dynamic processes related to submarine fluid flow has grown considerably (e.g. Judd and Hovland, 2009). It is now assumed that the flow of fluids (liquids and gases) through marine sediments is one of the most dominant and pervasive processes on continental margins (Etiope, 2015). Tryon et al., (2001) states that it affects nearly every physical, mechanical, chemical and thermal properties of the upper crust. Although widely disputed, methane gas emissions from the seafloor affect the oceans and atmosphere, the distribution of biological communities on both the seafloor and sub-seafloor, and it can have large geohazardous and geotechnical impacts (e.g. Bugge et al., 1987; Maslin et al., 2010; Pauli et al., 2000). Despite that methane is consumed and oxidized in the sediments and in the water column, respectively, some portions of the gas may reach the atmosphere contributing to climate gas budgets (Kvenvolden, 2002). Also, when methane aerobically oxidizes in the ocean, it produces CO2, which contributes to ocean acidification (Biastoch et al., 2011). Presently, climatic contributions from oceanic methane are small, however there is an ongoing debate concerning in the role of natural methane in warming events in the Earth’s history (Dickens et al., 1997; Katz et al., 1999). Methane in shallow marine sediments has led to drilling hazards, and several authors suggest that its transformation from hydrate- to gaseous state have contributed to large submarine slides and subsequent tsunamis (Maslin et al., 2010). Furthermore, seepage sites where methane is released are regarded as important local sources of energy to support chemosynthetic benthic communities. Considering the large but often uncertain effects and impacts, there is a need for a better understanding of the amount and distribution of natural hydrocarbon gas in the marine realm and the processes and mechanisms controlling its dynamics.
This doctoral thesis is based on using high-resolution P-Cable 3D seismic data in order to 1) identify and understand the geological controls and driving mechanisms of fluid flow and associated seafloor features and 2) develop and test this technology as a 4D tool. Hence, the individual objectives associated with the overall goal of this doctoral thesis are:
Determining the structure of fluid migration features at the active methane release sites in the Barents Sea and on the western Svalbard margin;
Investigating fluid migration mechanisms, their spatial and temporal variation and the processes driving them;
Identifying the source of gas rich fluids and whether they relate to gas hydrate dissociation

10
Develop 4D time-lapse seismic processing technique for the high-resolution P-Cable 3D seismic data and document accurate repeatability through time-lapse seismic studies.
We focus on several study sites representing methane release hot-spots in the northern Barents Sea and western Svalbard margin (Fig. 1): the Storfjordrenna (AArticle 1) and Bjørnøyrenna (AArticle 2), in the northern Barents Sea and the Vestnesa Ridge (AArticle 3) on the northwestern Svalbard margin.
Figure 1- The geologic and physiographic location of the studied seepage sites. The colors indicate the ages of the bedrock (see legend) that outcrops at the seafloor or below the upper regional unconformity (URU). Black dashed lines indicate major structural lineaments. The pink dots mark locations of sub-seafloor gas migration through faults and chimneys mapped within the SW

11
Barents Sea open for petroleum activity (modified from Vadakkepuliyambatta et al., 2013). The orange patches are seafloor leakage of methane and other hydrocarbon gases locations observed during CAGE research cruises (CAGE-13-JM, CAGE-15-2, CAGE-16-3, CAGE-17-1, CAGE-18-1, CAGE-18-5) and from Mau et al., 2017.
1.2 Hydrocarbon gases in marine sediments Hydrocarbon gases in marine sediments mainly exist in form of ffree gas, dissolved gas or gas hydrates. Gas hydrate concentrates hydrocarbon gas by trapping its molecules in a cage-like lattice formed of water molecules (Henriet et al., 1998; Sloan Jr and Koh, 2007) (Fig. 2). Methane is the most common gas in natural submarine gas hydrates by far. Hydrates are stable in specific low temperature (T) and high-pressure (P) conditions within the ggas hydrate stability zone (GHSZ) (Ruppel and Kessler, 2017). Dependence on this P and T envelop causes gas hydrates to occur in permafrost regions, probable underneath glaciers and ice sheets, and on continental slopes where water depth exceeds 300-500 m (Fig. 3). In addition to temperature and pressure, the stability of gas hydrates also depends on the availability of methane and other hydrocarbon gases in dissolved or free gas form, porosity of sediments, presence of water, and amount of inhibitors, such as salt (Sloan Jr and Koh, 2007). On seismic data, the bottom of the GHSZ can be detected by observing a bottom simulation reflector (BSR) that crosscut sedimentary strata (Berndt et al., 2004).
Figure 2 – Gas hydrate sampling at a CAGE research cruise. Gas hydrates consist of gas molecules trapped in a crystalline cage of water molecules – unstable at the earth surface where they start to decompose and release free gas.

12
Figure 3 – Gas hydrate stability under (A) permafrost and (B and C) marine conditions. Figure from (Ruppel and Kessler, 2017)
Gas hydrates are potent sstorage capacitors of methane. When 1 m3 of hydrate dissociates, it releases as much as 160 m3 of free gas (under atmospheric conditions). Therefore, the sedimentary basins bulk pore space volume may host enormous amounts of hydrocarbon gases. It is estimated that around 5000-20000 Gt of the world’s carbon is stored as gas hydrates in marine sediments lying within the GHSZ, which is just 8.27% of global marine sediment volume (Dickens, 2003; Ruppel and Kessler, 2017; Wallmann et al., 2012). Notably, this volume-efficient storage exceeds all other known fossil fuel inventories in the world regarding the amount of carbon contained. Natural gas hydrates play an essential role in tthe carbon cycle since they are responsible for temporarily locking large quantities of methane, and they are still considered as a significant energy resource for the future (Koh et al., 2012),
as well as a potential hazard for drilling operations and infrastructure (Max et al., 1997). Several successful production tests of gas hydrate prospects offshore Japan and China highlight a possibility of commercial gas hydrate exploitation in the future (Koh et al., 2012). Methane (CH4) is, by far, the most common hydrocarbon gas in natural cold seep systems (Claypool and Kaplan, 1974). Additionally, ccontributions of ethane (C2H6), propane (C3H8), butane (C4H10) are commonly reported (Claypool and Kaplan, 1974). Methane is produced microbially in the shallow sediments where methanogenic archaea decompose organic matter (bbiogenic methane), or in the deeper lithosphere (2-3 km sub-seafloor depth) due to a chain of thermochemical reactions breaking organic matter molecules and releasing thermogenic methane and other hydrocarbon gas (e.g. Clayton, 1991) (Fig. 4). While biogenic gas is mainly composed of methane, thermogenic gas often contains heavier hydrocarbons. The gas origin can be determined based on the molecular ratio of methane to other hydrocarbons and the isotopic composition of carbon (Whiticar, 1999). Biogenic gas is a widespread component in shallow marine sediments in regions with high primary

13
productivity, while production of thermogenic gas, apart from the organic matter supply, depends on anoxic conditions and sedimentation burial depths over long periods of time. Furthermore, the appearance of thermogenic gas in the shallow subsurface requires one or a combination of the following allowing fluids to migrate from depth: permeable formations, faults, hydraulic fractures, significant uplift and erosion of overburden. Due to the fact that such favorable conditions occur in almost all sedimentary basins, the flow of hydrocarbon gases through marine sediments is one of the most dominant and pervasive processes on continental margins globally (Etiope, 2015).
Figure 4 – Environments favourable for gas hydrate accumulations and sources of methane. Figure from Ruppel et al., 2017.
1.3 Natural gas seepage “Natural gas seepage is the steady or episodic, slow or rapid, visible or invisible flow of
hydrocarbon gases from subsurface sources to Earth’s Surface.” (Etiope, 2015).
Hydrocarbons migrate through sedimentary strata according to Darcy`s law, which states that the amount of fluids passing from point A to point B depends on permeability and pressure contrasts between A and B. The liquids or gases commonly migrate through layers of marine sediments or rocks due to the pressure gradient or the buoyancy force of fluids. Alternatively, dissolved gases may migrate through ddiffusion from areas with higher concentration to areas with lower concentration across the concentration gradients (Judd and Hovland, 2009).
Advection of gases occurs within focused fluid pathways, commonly attributed to veins and fractures within pipes, chimneys or along fault planes and permeable strata within the

14
subsurface. CChimneys and pipes are vertical conduits for fluid flow often connecting deep faults to seafloor pockmarks and mounds (fig. 6). In the literature, the difference between the chimneys and pipes is vague. However, pipes are generally smaller than chimneys. They are both characterized on seismic data as sub-vertical to vertical zones of highly discontinuous or disturbed reflections, or zones of complete loss of acoustic signals (Løseth et al., 2009). Chimneys are typical in many sedimentary basins and observed to form up to 500 m wide anomalies in seismic reflection data. They are thought to be the result of hydrofracturing and fluid migration, but it is not known for how long they remain open and how permeable they are compared to the host rocks. Moreover, it remains elusive whether they are dominated by free gas and/or gas hydrates or carbonate formations. FFaults can act as conduits for fluids from deep reservoirs to the shallow strata if the faults have higher permeability than the strata they incise. Whereas compressional regimes are more likely to cause closure and decreased permeability compared to faulting in extensional regimes.
Venting of gaseous fluids through the seafloor are commonly associated with the formation of pockmarks (Chand et al., 2009; Hovland et al., 2002), ccraters (Andreassen et al., 2017; Lammers et al., 1995), ggas hydrate pingos (Serov et al., 2017), mmethane-derived authigenic carbonate formations (Crémière et al., 2016), and complex cchemosynthesis based benthic communities (Boetius et al., 2000; Hovland and Svensen, 2006; Niemann et al., 2006). Under specific geological and thermobaric conditions, fluids (e.g. methane gas) may mobilize parts of the sedimentary successions resulting in its subvertical migration and occasional eruptions on the seafloor forming submarine mud volcanoes (fig. 5) (Mazzini and Etiope, 2017; Sauter et al., 2006).
Figure 5 – Methane is bubbling out from a submarine mud volcano in the Gulf of Mexico. Photo: NOAA.

15
Figure 6 - The subsurface setting beneath a gas hydrate pingo in Storfjordrenna area, presented by P-Cable 3D seismic data. Fluid migration occurs through a gas chimney in the glacial deposits capping the gas hydrate pingo and gas discharge on the seafloor. Figure from Waage et al., submitted (article 1, this thesis).
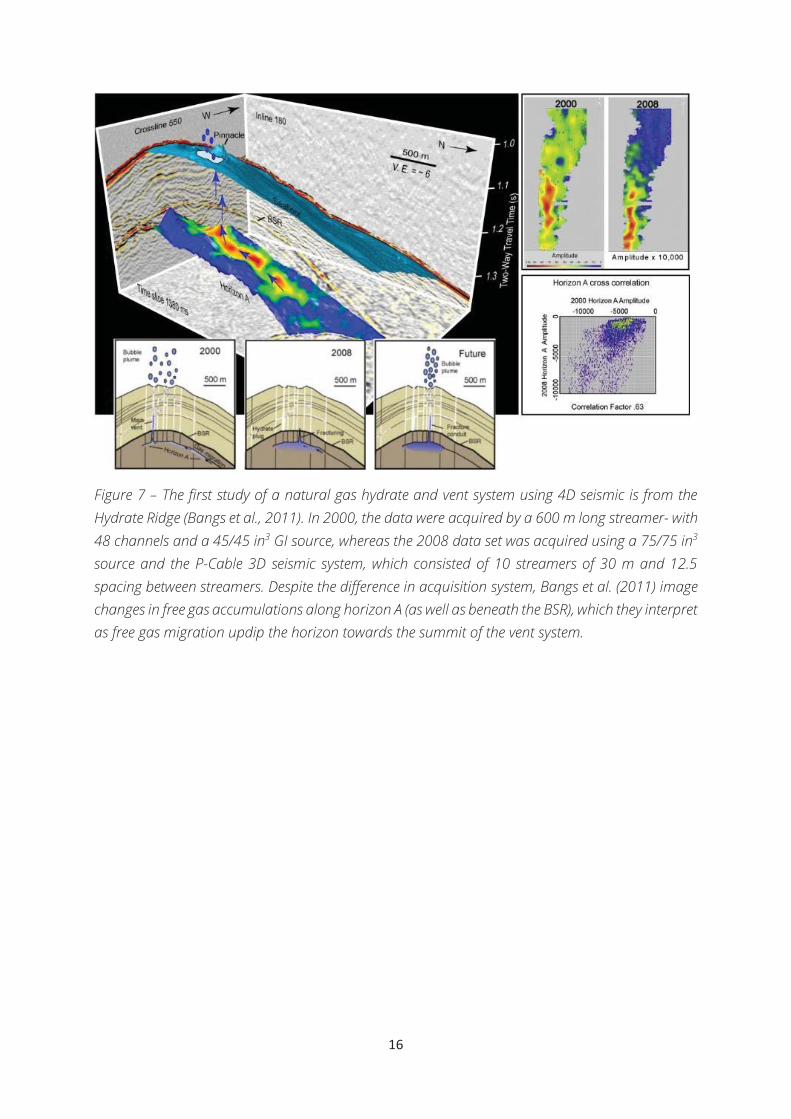
1.4 High-resolution 4D seismic to detect fluid flow- and gas hydrate dynamics The time-lapse or 4D seismic method involves acquisition, processing and interpretation of 3D seismic surveys acquired over the same area, but repeated in certain time intervals at the same location. Differences between the datasets attributed to travel-time or amplitude intend to provide information about subsurface changes over time. 4D seismic methods have been used exclusively within the petroleum industry to monitor reservoir depletions during oil and gas production, and the spread of CO2 plumes at CO2 storage sites (Chadwick et al., 2009; Lumley, 2010). For both purposes, conventional (low-resolution) 3D seismic data are being used. 4D seismic as a monitoring tool for fine-scale (high-resolution) changes in the shallow subsurface has a potential to provide a better understanding of the short-term dynamics at active leakage sites and shallow reservoirs, whether it is related to natural seepage or production of shallow reservoirs. Hence, our motivation of aarticle 3 was to test if time-lapse studies may be undertaken using very high resolution P-Cable 3D seismic and whether such an approach may be applied to natural seep and gas hydrate sites. The figure beneath shows the first study that attempted to use time-lapse high-resolution 3D seismic data to detect and investigate differences in free gas distribution along an horizon in a hydrate province (Fig. 7) (Bangs et al., 2011).
16
Figure 7 – The first study of a natural gas hydrate and vent system using 4D seismic is from the Hydrate Ridge (Bangs et al., 2011). In 2000, the data were acquired by a 600 m long streamer- with 48 channels and a 45/45 in3 GI source, whereas the 2008 data set was acquired using a 75/75 in3 source and the P-Cable 3D seismic system, which consisted of 10 streamers of 30 m and 12.5 spacing between streamers. Despite the difference in acquisition system, Bangs et al. (2011) image changes in free gas accumulations along horizon A (as well as beneath the BSR), which they interpret as free gas migration updip the horizon towards the summit of the vent system.

17
2. Geological setting and study areas
2.1 Geologic and physiographic setting of the Barents Sea The Barents Sea is an epicontinental sea with an average water depth of 350 m, situated between Norway in the south, Svalbard in the northwest and Russia in the east, and the North-Atlantic Ocean in the southwest. The Barents Sea shelf features intricate pattern of highs and basins. Its western margin is a shear-extensional zone marking the boundary between the continental and the oceanic crust. The regional tectonic configuration of the Barents Sea is a result of two major continental collisions since the Devonian and associated break up and rifting events (Smelror et al., 2009). The first collision event - the Caledonian Orogeny was followed by Late Paleozoic to Mesozoic orogenic collapse and breakup of the Pangea supercontinent. The second collision event and collapse relates to the opening of the North Atlantic Ocean in eearly-middle Cenozoic (Eldholm et al., 1987, Faleide et al., 2008).
In the PPaleozoic, the Barents Sea was a shallow (continental) sea were carbonates and evaporates where common (Smelror et al., 2009). Continental drift northwards and therefore colder environments caused a shift to clastic sedimentation in the MMesozoic era (Heafford, 1988, Worsley et al., 2008). The late Cenozoic is a period of intense glaciations in the northern hemisphere (Vorren et al., 1988). The Barents Sea and related shelf- and land areas where repeatedly covered by large, erosive ice sheets. Uplift and glacial erosion associated to the last compressional tectonic phase and the northern hemisphere glaciations became dominant processes in the Cenozoic (Henriksen et al., 2011a; Rodrigues Duran et al., 2013). Resulting from a combination of uplift and erosion, between 500 and 3000 m of the upper sedimentary column was removed, erosion products transported and redeposited at the continental shelf edge and slope. In areas where the ice moved faster, ice streams became the dominant erosive force (Stokes and Clark, 2001). Due to intensified bottom erosion beneath the ice streams, the ice carved deep troughs, and large volumes of glacially eroded sediments were deposited in large trough mouth fans (TMFs) on the marginal slope (Vorren et al., 1989).
Cycles of Quaternary glaciations and deglaciations associated with sea level fall and rise as well as episodic sedimentation, erosion, and uplift, as well as loading and unloading of ice sheets have affected the pressure- and temperature gradients of bottom sediments and sedimentary rocks (Maslin et al., 2010). The combination of these processes controlled a dynamic gas hydrate stability zone (GHSZ), fluctuating from non-stable or shallow GHSZ during interglacials to several hundreds of meters thick GHSZ during glacial maximums (e.g. Andreassen et al., 2017; Portnov et al., 2016; Serov et al., 2017). Gas hydrates can act as a seal for fluid flow and uptake hydrocarbon gases, and release these gases accumulated within and sealed beneath the GHSZ once stability conditions vanish. In addition to gas hydrate dynamics, erosion and uplift might reactivate former tectonic faults, and trigger formation of new joints and fractures in the subsurface, facilitating migration of hydrocarbons towards the seafloor.
18
2.2 Hydrocarbon leakage in the Barents Sea and the high Arctic Since the beginning of oil and gas exploration during the 19th century, observations of seep sites have led to numerous economically important oil and gas discoveries (Abrams, 2005; Link, 1952; Macgregor, 1993). The Barents Sea is an area prominent for petroleum exploration concentrating to regions south of 74 N. In the northern sectors of the Barents Sea, seismic data sets remain scarce, causing great uncertainties in the driving mechanisms of fluid flow, the leakage of hydrocarbon gases and amounts of gas hydrates.
Extensive seabed gas release has been observed in the southwestern Barents Sea and along the western Svalbard margin (e.g. Berndt et al., 2004; Chand et al., 2014; Knies et al., 2018; Mau et al., 2017; Westbrook et al., 2009). Furthermore, past fluid release events manifested themselves in form of large sub-seabed leakage structures such as chimneys and pipes, and seafloor expressions such as pockmarks, craters, and gas hydrate pingos across the Barents Sea margin (e.g. Andreassen et al., 2017; Chand et al., 2014; Chand et al., 2008; Lammers et al., 1995; Petersen et al., 2010; Serov et al., 2017; Smith et al., 2014; Vadakkepuliyambatta et al., 2013). Such past and presently active seep and gas hydrate provinces are reported in variable geological settings (Bünz et al., 2012; Vadakkepuliyambatta et al., 2013) on the shelf, on transitions between continental and oceanic crust, within the continental slope and further downslope on young oceanic crust (Rajan et al., 2012; Smith et al., 2014). At these settings, previous works reported thermogenic gas leaking from petroleum reservoirs (e.g. Andreassen et al., 2017; Ostanin et al., 2013; Serov et al., 2017) and microbial gas production and leakage (Johnson et al., 2015; Plaza Faverola et al., 2015), and hypothesized an abiotic methane system due to serpentinization of ultramafic rocks proximal to mid-Atlantic ridge (Johnson et al.,) (Fig. 1).
Within the Barents Sea, methane of thermogenic origin is deemed widespread in shallow strata (Vadakkepuliyambatta et al., 2013, etc.). Upper Jurassic and Middle Triassic organic rich shales constitute wide spread source rocks provinces (Lundschien et al, 2014). However, other formations such as the upper Carboniferous, lower and upper Permian and lower Cenozoic are also indicated to have source rock potential (Knies et al., 2015; Lerch et al., 2016; Ohm et al., 2008). Regional seismic lines and stratigraphy boreholes indicate that potential hydrocarbon source rocks are widely spread in the Barents Sea, and are located very shallow in present stratigraphic columns. Significant portions of the thermogenic hydrocarbons have leaked or migrated into the very shallow subsurface and are now trapped in gas-hydrate and shallow-gas reservoirs.

19
Figure 8 – Seabed topography of the Barents Sea with location of the study areas; Study area of article 1 in the Storfjordrenna, article 2 in the Bjørnøyrenna and article 3 at the Vestnesa Ridge.
2.3 The Storfjordrenna gas hydrate pingo site (Article 1) The Storfjordrenna is the second largest glacially eroded trough in the Barents Sea, located ~50 km south of Svalbard within 200-400 m water depth in the northern Barents Sea (Fig. 8). The trough was developed by a large erosional ice stream operating during the multiple Qarternary glaciations. During the last glacial maximim (25,000 years ago), the ice thickness in the Storfjordrenna reached 1 km (Patton et al., 2017). Responding to loading and unloading of the lithosphere during glaciation and deglaciation, the area is still undergoing isostatic adjustments today (Auriac et al., 2016).
At the northern side of the trough, about 35 km from the shelf edge and, in a water depth of 350-390 m, the study area shows six positive seabed structures leaking methane in the water column. The domes are up to 500 m wide and 10 m high. They show leakge of methane ebullition closely associates to their crests (Serov et al., 2017). The structures are called gas hydrate pingos, since massive hydrates and authigenic carbonate formations are widespread within them (Serov et al., 2017).
The area is interesting due to the high gas hydrate saturations within a shallow inventory located very close to termination of gas hydrate stability zone, which makes it sensitive to small-scale temperature and sea level changes. The study area is within a region where more than 1200 methane seeps exist along the western Svlabrd shelf and the upper slope (Mau et al., 2017). Also, the suite of gas hydrate pingos in Storfjordrenna is the first occurrence of non-permafrost related mounds of such type on the Eurasian Arctic shelf. The scarcity and low resolution of available seismic data have not allowed in the past to draw a link between the structural elements, the source of fluids and seafloor discharge. A shallow stratigraphic borehole 7616/11 U 02 10 km east of our study site (Grogan et al., 1999; Lasabuda et al., 2018) (fig. 9) confirms the presence of Palaeocene matured hydrocarbon shows (Grogan et

20
al., 1999), suggesting that small-scaled and shallow rift-related sedimentary basins along the Hornsund fault zone can have a potential to host thermogenic hydrocarbon accumulations.
Article one shows an integration of high resolution P-Cable and lower resolution industry seismic data allowing to provide new insights into the feeding systems of Barents Sea gas hydrate pingos.
Figure 9 – Seismic cross-section (a511, see Figure 1 for location) from W to E along the Storfjordrenna (crossing the study area) indicating a thin Quarternary sediment cap above faulted Paleocene-Cretaceous rocks and a prominent Pre-Devonian high. The figure is redrawn from Lasabuda et al., 2018.
2.4 The Bjørnøyrenna and crater area (Article 2) The Bjørnøyrenna is the largest glacially eroded trough that cross-cuts large areas of the Barents Sea, and is particular evident about 100 km south of the Storfjordrenna (fFig. 9). Bjørnøyrenna hosted an up to 2 km thick ice stream that affected this area during the repeated glaciations since at least 700 ky BP (Sættem et al., 1992). A volumetric mass balance approach allowed estimating that up to 3 km of sedimentary strata have been removed from this area and redeposited at the trough mouth fan and deeper continental slope during the Cenozoic (Laberg et al ., 2012).
On the northern flank of the central section of the trough, the area of ~440 km2 demonstrates very active seepage and hosts more than 100 km-wide and up to 35 m deep seabed craters and mounds (Fig. 2 in article 1). Gas discharge occurs from the mounds and craters as well as in areas between such seafloor features. The study area occupies the SE part of the
21
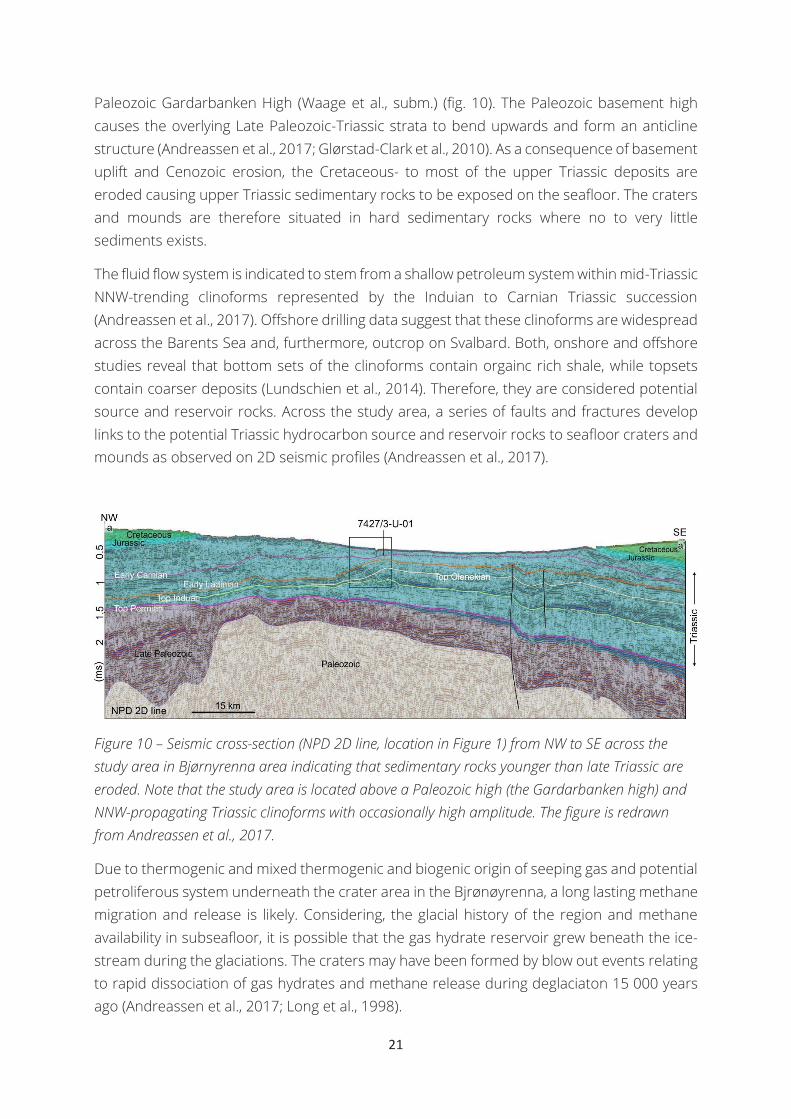
Paleozoic Gardarbanken High (Waage et al., subm.) (fig. 10). The Paleozoic basement high causes the overlying Late Paleozoic-Triassic strata to bend upwards and form an anticline structure (Andreassen et al., 2017; Glørstad-Clark et al., 2010). As a consequence of basement uplift and Cenozoic erosion, the Cretaceous- to most of the upper Triassic deposits are eroded causing upper Triassic sedimentary rocks to be exposed on the seafloor. The craters and mounds are therefore situated in hard sedimentary rocks where no to very little sediments exists.
The fluid flow system is indicated to stem from a shallow petroleum system within mid-Triassic NNW-trending clinoforms represented by the Induian to Carnian Triassic succession (Andreassen et al., 2017). Offshore drilling data suggest that these clinoforms are widespread across the Barents Sea and, furthermore, outcrop on Svalbard. Both, onshore and offshore studies reveal that bottom sets of the clinoforms contain orgainc rich shale, while topsets contain coarser deposits (Lundschien et al., 2014). Therefore, they are considered potential source and reservoir rocks. Across the study area, a series of faults and fractures develop links to the potential Triassic hydrocarbon source and reservoir rocks to seafloor craters and mounds as observed on 2D seismic profiles (Andreassen et al., 2017).
Figure 10 – Seismic cross-section (NPD 2D line, location in Figure 1) from NW to SE across the study area in Bjørnyrenna area indicating that sedimentary rocks younger than late Triassic are eroded. Note that the study area is located above a Paleozoic high (the Gardarbanken high) and NNW-propagating Triassic clinoforms with occasionally high amplitude. The figure is redrawn from Andreassen et al., 2017.
Due to thermogenic and mixed thermogenic and biogenic origin of seeping gas and potential petroliferous system underneath the crater area in the Bjrønøyrenna, a long lasting methane migration and release is likely. Considering, the glacial history of the region and methane availability in subseafloor, it is possible that the gas hydrate reservoir grew beneath the ice-stream during the glaciations. The craters may have been formed by blow out events relating to rapid dissociation of gas hydrates and methane release during deglaciaton 15 000 years ago (Andreassen et al., 2017; Long et al., 1998).
22
Article 2 shows that the craters and mounds are situated on top of conjugate Triassic fault pairs and related fault-damage zones that have an upper termination at the seafloor, thus suggesting a link between the occurrence of the prominent seafloor features and seepages and faulted lineaments, fault intersection points and damage zones.
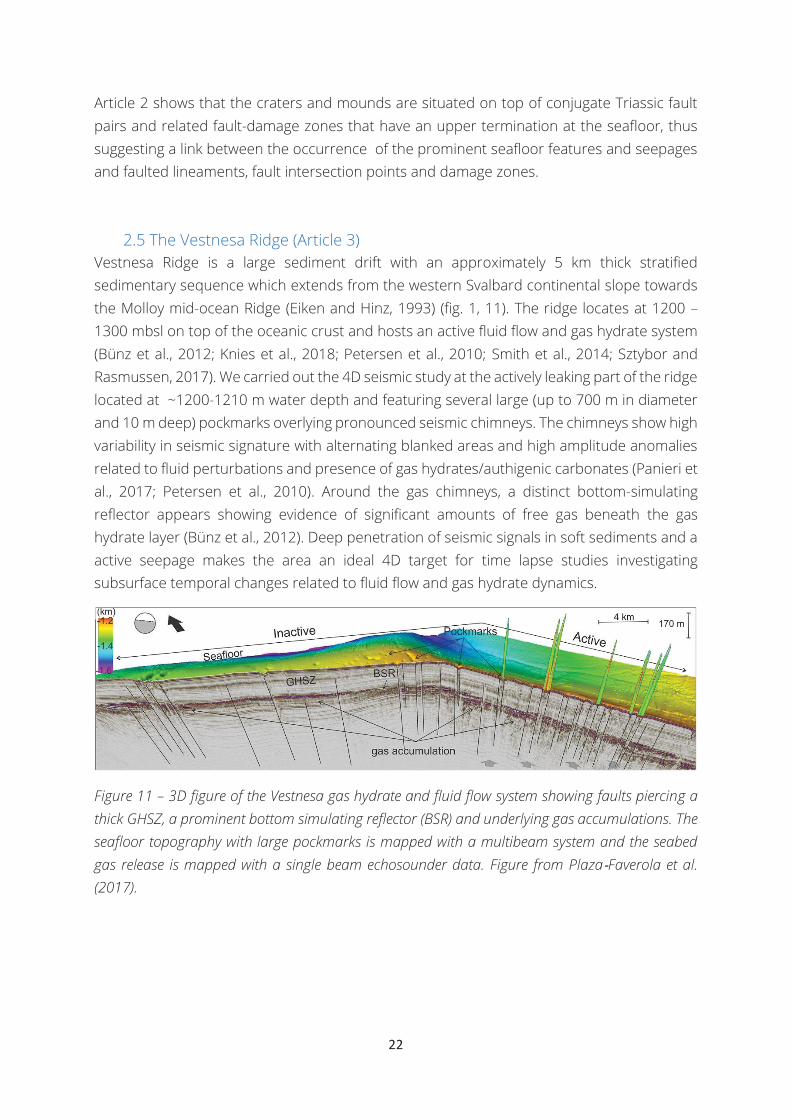
2.5 The Vestnesa Ridge (Article 3) Vestnesa Ridge is a large sediment drift with an approximately 5 km thick stratified sedimentary sequence which extends from the western Svalbard continental slope towards the Molloy mid-ocean Ridge (Eiken and Hinz, 1993) (fig. 1, 11). The ridge locates at 1200 – 1300 mbsl on top of the oceanic crust and hosts an active fluid flow and gas hydrate system (Bünz et al., 2012; Knies et al., 2018; Petersen et al., 2010; Smith et al., 2014; Sztybor and Rasmussen, 2017). We carried out the 4D seismic study at the actively leaking part of the ridge located at ~1200-1210 m water depth and featuring several large (up to 700 m in diameter and 10 m deep) pockmarks overlying pronounced seismic chimneys. The chimneys show high variability in seismic signature with alternating blanked areas and high amplitude anomalies related to fluid perturbations and presence of gas hydrates/authigenic carbonates (Panieri et al., 2017; Petersen et al., 2010). Around the gas chimneys, a distinct bottom-simulating reflector appears showing evidence of significant amounts of free gas beneath the gas hydrate layer (Bünz et al., 2012). Deep penetration of seismic signals in soft sediments and a active seepage makes the area an ideal 4D target for time lapse studies investigating subsurface temporal changes related to fluid flow and gas hydrate dynamics.
Figure 11 – 3D figure of the Vestnesa gas hydrate and fluid flow system showing faults piercing a thick GHSZ, a prominent bottom simulating reflector (BSR) and underlying gas accumulations. The seafloor topography with large pockmarks is mapped with a multibeam system and the seabed gas release is mapped with a single beam echosounder data. Figure from Plaza Faverola et al. (2017).

23
3. Materials and methodology
3.1 Seismic data and seismic interpretation Seismic waves are energy that propagate through the earth (Sheriff and Geldart, 1995). The seismic method is unique as it enables imaging geological structures and layers , and it allows calculation of rock properties, pore fill fluids, fluid pressure and seismic velocities down to several 1000s of meters with a resolution of 10s of meters (Waters and Waters, 1987). Seismic waves are distinctively attenuated by the presence of gas, hence, it is one of the most suitable techniques for detecting and mapping shallow gas and gas hydrates (Wood et al., 1994). Seismic energy is generated by a low-frequency sound emitted from a fabricated source i.e. air gun within the upper water layer. The sound compressional waves propagate through the water and reflect at geological interfaces where a change in acoustic impedance occurs. AAcoustic impedance is a function of velocity and density of the medium caused by changes in physical properties of the matrix or fluids in pore space (i.e. clay versus sand or water versus free gas or hydrates) (Waters and Waters, 1987).
3D seismology allows studying three-dimensional features and image layers and structures from all angles (fig. 12). Therefore, it is a key tool to better understand subsurface geology. Seismic interpretations require a solid understanding of both geology and reflection seismology as well as the various algorithms implemented in the processing of the data and interpretation tools (Sheriff and Geldart, 1995). Some processing steps are typically applied to place the seismic traces into correct depth and place alignments and enhance resolution and the signal-to-noise ratio. Sources of noise often relate to the acquisition imperfections such as ship noise, storm and breaking ocean surface conditions. Once the noise is filtered out during processing, 3D data allow for interpretations within the entire seismic cube, generating 2D cross-sections at any desired location, time slice maps as well as creating attribute maps to image changes in physical properties and morphology within certain surface areas. Attribute maps are useful for mapping the distribution of seismic chimneys, pipes, bright spots and other high amplitude anomalies and stratal disturbances within a seismic cube (Brown, 2011).

24
Figure 12 - Acquiring 3D seismic data allows detailed imaging of layer, faults and sedimentary structures. Image from https://www.mapnagroup.com/en/projects/oil-gas/3d-seismic-data-acquisition,-data-processing-int.
How detailed and clear we can image fluid flow features depend on the sampling rate and frequency of the data, which in turn is determined by the purpose of the acquisition and the depth of the target. Conventional 3D seismic investigations typically target several kilometer deep structures, and, thus, operate with low-frequency bandwidth (approximately 5-120 Hz) emitted from large air guns. This setup favors deep penetration of signals, but with lower resolution where the minimum size of resolvable features and layers is typically tens of meters. For shallower subsurface targets, higher dominant frequencies emitted from smaller air guns are used because they generate data of higher (often meter scale) resolution.
The Time-lapse seismic (or 4D seismic) method involves the acquisition, processing, and interpretation of repeated seismic surveys at the same target area. The prime objective of time-lapse studies is to detect subtle changes in the sub-surface acoustic response driven by changes in the fluid flow regime and by the dynamics and characteristics of the fluids that are present in the area. The remote sensing of these temporal variations is achieved by the comparison of repeated 3D seismic monitor surveys and with the baseline survey. By analyzing 4D anomalies such as travel-time and amplitude differences, one can gain information about temporal subsurface variations, such as free gas concentration differences, fluid migration, and gas hydrate dynamics. As such, the 4D seismic technology has been used within the industry on conventional 3D seismic data and ocean bottom technologies to monitor reservoir exploitation and CO2 storage sites for decades. Since

25
industrial target depths are generally deep, conventional deep-penetrating seismic data have been necessary. However, the discovery of shallow reservoirs (i.e. in the Barents Sea) and higher demands for overburden monitoring and leakage controls causes a growing interest and necessity to target shallower horizons with higher resolution. High-resolution time-lapse seismic data sets with the frequency content of several hundred hertz and spatial resolution
on a meters scale are ideal to image the shallow subsurface in detail.
3.2 The P-Cable 3D seismic system The P-Cable 3D seismic system was developed more than a decade ago to image and characterize the upper geosphere in high-resolution (Planke and Berndt, 2002; Planke et al., 2009). It is a low-cost, light, flexible and mobile acquisition system, where deployment and recovery usually take less than an hour. The systems main component is a 150 - 300 m long cross-cable spanned by two doors and towed perpendicular to the vessels steaming direction, about 150 m behind the vessel. Along the cross-cable, up to 24 streamers of 25-100 m length and with 3.125 m receiver spacing can be attached (fig. 13). The configuration enables a dense coverage with bin sizes (spatial resolution) of 3 m, which is a 16 times better resolution than broadband conventional 3D seismic data (12.5x12.5 m) operated at frequencies between 10 and 400 Hz (fig. 14). The P-Cable 3D seismic system of the UiT – The Arctic University of Norway consists of 14 streamers of 25 m length and was used acquiring data for this thesis. Furthermore, UiT has two air-gun configurations, a pair of mini-GI air-guns of 15-30 in3 volumes for high resolution surveys and a pair of two GI-air-guns of 45-105 in3 volume for targeting slightly deeper sub-seabed targets at the expense of resolution. They are both towed approximately 33 m behind the vessel (in 3D mode) in 2-3 m below the sea surface. The air guns fire with a pressure of approximantly 160-170 bars every 3-6 seconds. The guns have two chambers - an injector and a generator volume and are operated in a harmonic mode, in order to reduce bubble noise (noise from the collapse of the air bubble that follows the high-pressured air release). During the acquisition of time-lapse surveys, a particular focus was given to using identical survey configuration, which minimizes acquisition effects on the time-lapse seismic data.

26
Figure 13 - Configuration and geometry of the P-Cable seismic system.
Figure 14 - Comparison of conventional 3D seismic and P-Cable 3D seismic data. The P-Cable seismic data have a horizontal and vertical resolution of 6 and 4-5 m, respectively. The conventional 3D seismic data have horizontal and vertical resolution of 25 and over 8 m, respectively. Figure prepared by Andreia Plaza-Faverola.

27
3.3 P-Cable 3D seismic processing A sound 3D seismic processing scheme for high-resolution P-Cable 3D seismic data has been established at UiT and documented in numerous publications (e.g. Bünz et al., 2012; Petersen et al., 2010; Plaza Faverola et al., 2015; Rajan et al., 2012). The different 3D seismic datasets are processed slightly differently, depending on target depths, acquisition parameters and acquisition conditions at sea (the specific processing flows are described in the articles), however, they are all processed in the software RADEX pro and a typical processing flow consists of:
Reading SegD files (raw format sorted by shot numbers) Importing navigational files and assigning geometry of the P-Cable system Band-pass filtering and assessing sources of noise (various types of noise removal
steps if necessary). Binning the data to 6.25 bin size Perform NMO correction using the water velocities generated from a CTD
measurement before the start of the survey (to correct for the difference in travel time between the source-receiver offset).
Amplitude correction to correct for the spherical divergence of the sound waves SharpSeis deghosting (removing the effect of sound waves propagating between the
sea surface and air gun or streamers) if necessary. Stacking of all traces/data Migration using 3D Stolt- or a post-stack 3D Kirchhoff method.
3.3 P-Cable 4D seismic processing Sophisticated preparation of a time-lapse dataset including many processing steps is needed to enable comparison of true amplitude and travel-time. Firstly, it is crucial that the repeat 3D survey is processed identically to the base survey (see section above). During this process, it is also important to make sure that the common-midpoint-numbers and cross-line and inline numbers are identical, and that the seismic is cropped spatially and depth-vise to achieve a 100 % overlap. Furthermore, if the seafloor depth-average deviates due to water-velocity or acquisition statics, it is possible to bulk-shift the repeat dataset so that the seafloor or top reflections are aligned. Now one can balance the amplitudes for potential deviations in the source signal for a common average. The correlation window should be an area of the seismic that is not associated with fluid-related pore-fill changes. Afterward the settings are applied to the entire volume. At this stage, a “raw” time-lapse dataset is created. Subsequent processing steps intend to correct for misalignments in phase, frequency, amplitude, and travel-time, globally and locally to increase the overall repeatability of the data by reducing acquisition- and processing related effects. The 4D processing done for the study of article 3 was conducted using the Pro4D module of the Hampson-Russel Software package.
28
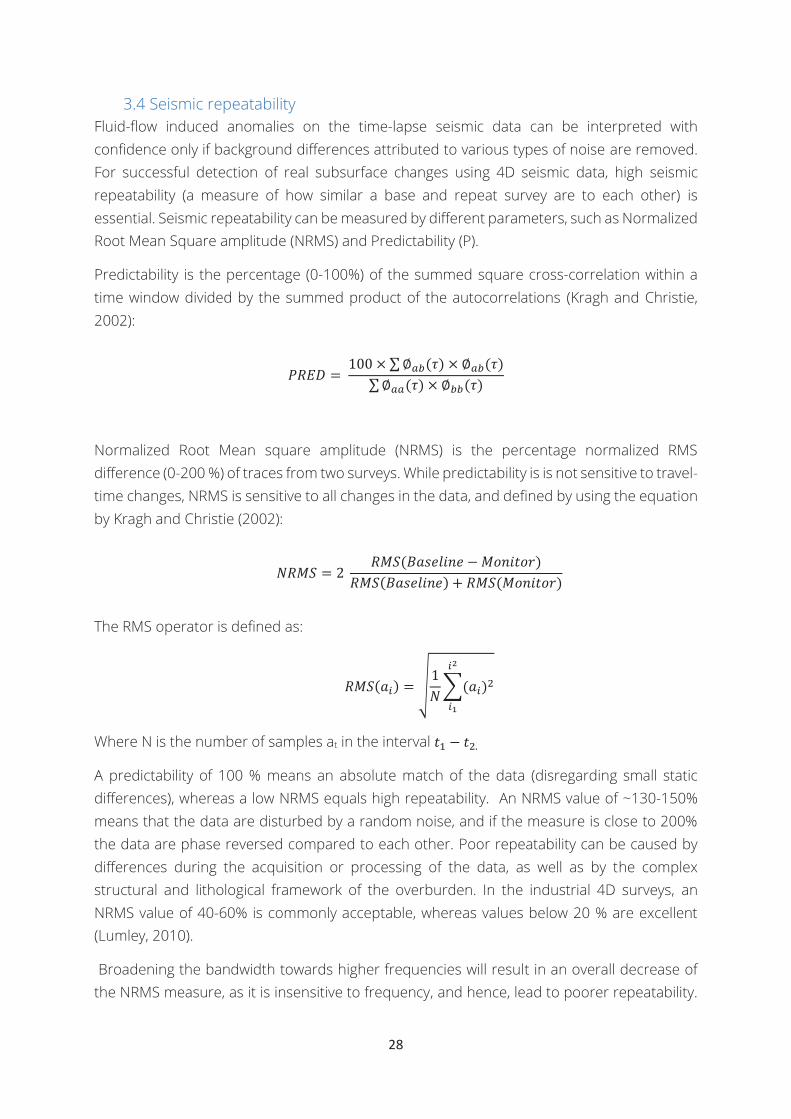
3.4 Seismic repeatability Fluid-flow induced anomalies on the time-lapse seismic data can be interpreted with confidence only if background differences attributed to various types of noise are removed. For successful detection of real subsurface changes using 4D seismic data, high seismic repeatability (a measure of how similar a base and repeat survey are to each other) is essential. Seismic repeatability can be measured by different parameters, such as Normalized Root Mean Square amplitude (NRMS) and Predictability (P).
Predictability is the percentage (0-100%) of the summed square cross-correlation within a time window divided by the summed product of the autocorrelations (Kragh and Christie, 2002):
Normalized Root Mean square amplitude (NRMS) is the percentage normalized RMS difference (0-200 %) of traces from two surveys. While predictability is is not sensitive to travel-time changes, NRMS is sensitive to all changes in the data, and defined by using the equation by Kragh and Christie (2002):
The RMS operator is defined as:
Where N is the number of samples at in the interval
A predictability of 100 % means an absolute match of the data (disregarding small static differences), whereas a low NRMS equals high repeatability. An NRMS value of ~130-150% means that the data are disturbed by a random noise, and if the measure is close to 200% the data are phase reversed compared to each other. Poor repeatability can be caused by differences during the acquisition or processing of the data, as well as by the complex structural and lithological framework of the overburden. In the industrial 4D surveys, an NRMS value of 40-60% is commonly acceptable, whereas values below 20 % are excellent (Lumley, 2010).
Broadening the bandwidth towards higher frequencies will result in an overall decrease of the NRMS measure, as it is insensitive to frequency, and hence, lead to poorer repeatability.

29
In addition, the high-frequency content of high-resolution seismic data causes a higher sensitivity to environmental effects such as weather and waves and geology effects such as hard and complex surfaces and strata. Thus, testing the limitations of the method and optimizing the procedures are important first steps towards using high-resolution seismic systems as a time-lapse tool.
4. Summary of articles
4.1 Article 1
Malin Waage, Alexey Portnov, Pavel Serov, Stefan Bünz, Kate A. Waghorn, Sunil Vadakkepuliyambatta, Jürgen Mienert, Karin Andreassen. GGeological controls on fluid flow and gas hydrate pingo development on the Barents Sea margin. Post revision in editor’s office, G-cubed – Geochemistry, Geophysics, Geosciences.
In 2014, the discovery of seafloor mounds leaking methane gas into the water column in the northwestern Barents Sea became the first evidence of the existence of non-permafrost related gas hydrate pingos (GHP) on the Eurasian Arctic shelf. This seepage location has been the focus of several articles since its discovery (Hong et al., 2017; Hong et al., 2018; Sen et al., 2018; Serov et al., 2017). For the first time, however, integrated regional 2D and high-resolution P-Cable 3D seismic data, enabled new insights into the connection between dep and shallow subsurface geology and assessment the geological controls and mechanisms for gas hydrate pingo development and methane seepage.
We observe a 50-150 m unit of Pleistocene glaciogenic deposits beneath a 4-5 m thin cover of Holocene muddy sediments. Beneath the glacial deposits, a unit of Cretaceous-middle Cenozoic sedimentary rocks occurs overlying pre-Devonian crystalline basement rock of the Sørkapp-Hornsund high. The data indicate gas hydrates, authigenic carbonates, and free gas within the GHPs located on tops of acoustically masked areas (gas chimneys) which pierce the thin section of low-permeability glacial deposits. These chimneys connect to faults, tilted and folded strata within the underlying gas hydrate-bearing sedimentary rocks. A patchy BSR also occurs around the location of the gas hydrate pingos. In accommodation spaces between these pre-tectonic strata, syn-tectonic rift basins of various scales are present. Syn-tectonic deposits do not show indications of fluid anomalies. Correlation of our data with regional 2D seismic surveys shows a spatial connection between the shallow subsurface fluid flow system and the deep-seated Hornsund Fault Zone. We suggest that fault-controlled Paleocene hydrocarbon reservoirs “inject” methane into the low-permeability glacial deposits and near-seabed sediments, forming the GHPs. Furthermore, our proposed conceptual model explains the relationship between this shallow methane ventilation system and the

30
regional Hornsund Fault Zone, which likely demonstrates a typical scenario of fault-controlled methane migration within the Svalbard-Barents Sea margin.
4.2 Article 2
Malin Waage, Pavel Serov, Karin Andreassen, Kate A. Waghorn, Stefan Bünz. CControls on giant methane blow-out craters and mounds on the Arctic seafloor. Manuscript.
In this article, we characterize the morphology of giant seafloor craters and mounds in the Bjørnøyrenna, investigate their shallow stratigraphy, map subsurface horizons, fractures, and faults and perform fault seal analysis. Combining these geophysical observations, we investigate possible geological controls of ongoing and past fluid flow and crater development. 54 craters are characterized by a dominant orientation (long axis) to the NNW-SSE. Furthermore, 20 % of the craters are coupled with mounds that are mainly located on the NE side of the coupled crater. Therefore, there is an apparent trend in orientation of the craters and mound structures. In the shallow stratigraphy, extensional faults occur in two principal directions, NW-SE and NNE-SSW, coinciding with regional fault characteristics of the middle-Triassic strata in the area. Fault displacement varies between 0 and 16 m, where the NNE-SSW faults show the most significant fault displacement. Larger fault displacement is usually related to broader fault zones, which are up to 300 m wide. Noteworthy, the orientation of craters does not coincide with the strike orientation of the subsurface faults, rather the middle-orientation between these fault pairs. The 3D seismic data show that craters (and mounds) often occur in the inner corner of intersecting faults and in areas of fault-related damage zones (more fractured, breccia material indicated from various attribute maps). It is possible that the damage zones, initially formed by tectonism, but are modified and widened by the fluid-related processes, i.e. fluid pressure and gas hydrate formation and dissociation that may play a crucial role in crater and mound formation. Nevertheless, we suggest that pre-existing weakness- and fracture zone attributed to Triassic fault activity have a significant control on the appearance and orientation of these craters, mounds, and hydrocarbon gas seepages at the present and in the past. .

31
4.3 Article 3
Malin Waage, Stefan Bünz, Martin Landrø, Andreia Plaza-Faverola, Kate Alyse Waghorn. (2018). RRepeatability of high-resolution 3D seismic data. Accepted manuscript, Geophysics, 84(1), 1-60. DOI: 10.1190/geo2018-0099.1
Three time-lapse (one baseline and one monitor survey) P-Cable 3D seismic datasets (Six 3D seismic cubes in total) from different areas and variable geological settings are used in this study (locations in fig. 1). The overall goals are to develop a robust 4D processing routine optimized for high-resolution P-cable 3D seismic data with frequency content from ~10 to 350 Hz, and to document repeatability of such datasets. The sites for the time-lapse seismic study are: (1) a North-Norwegian Fjord with a post-glacial basin filled with stratified sediments overrlying glacial moraine deposits (data from 2012 and 2014); (2) the Snøhvit reservoir and CO2 storage complex in the SW Barents Sea with glacial deposits overlying sedimentary rocks and featuring a complex geomorphology, a hard seafloor and sub-seafloor structure including the presence of free gas (data from 2011 and 2013); and (3) the Vestnesa Ridge on the W Svalbard margin, a large deep-water sediment drift with focused fluid-flow structures showing abundant amplitude anomalies and gas seepage at the seafloor (data from 2012 and 2013). Using the data from these three sites, we investigate the impact of the acquisition (e.g., weather, waves and hardware configuration) and processing steps (e.g. tidal corrections, swell noise, residual move-out) on P-Cable 3D seismic repeatability in different geological settings.
Little to no fluid expressions are present in the Lyngen fjord and Snøhvit area, so here, we did not expect subsurface changes related to fluid flow. For testing P-Cable data repeatability, this was necessary as we could assume that all 4D anomalies present were noise-related. However, when comparing time-lapse data at the active Vestnesa Ridge, we aimed to achieve good repeatability in the strata outside chimney structures and seepage areas, and observe 4D anomalies attributed to real fluid flow dynamics within the gas chimneys.
The 4D processing and survey calibration procedure presented in the article was tracked step-wise by time-lapse repeatability measures such as the NRMS and Predictability. We demonstrate acceptable repeatability with frequency content between 30 and 350 Hz and find that repeatability is strongly dependent on geological setting. In stratified marine sediments, we achieve an average NRMS of <30 %, whereas in glacial and harder sedimentary rocks it varied between 30 and 40 %. In complex moraine material, the NRMS-level is 70-75 %. Other factors that influence repeatability are differences in the acquisition setup, weather, and wave activity (bad weather naturally increases the noise level), as well as the shot-rate (less time cause more residual shot noise). At the active seepage site, the Vestnesa Ridge, good repeatability is achieved outside the chimneys and time-lapse anomalies are detected within the chimney structures. These 4D anomalies might attribute to real changes in fluid flow between the summer of 2012 and 2013, which is promising for future high-resolution time-lapse investigations.
32
5. Synthesis and Outlook 5.1 Synthesis
Article 1 and 2 describe two fluid flow systems with distinctively different stratigraphy, structural settings and source of fluids. Article 1 describes a fluid flow system controlled by the uplift related to the Sørkapp-Hornsund High, intense erosion of the Storfjordrenna ice stream, and large-scale extensional faulting related to the evolution of the regional Hornsund Fault complex. The thin drape of Quaternary glacigenic deposits focusses the flow of fluids to few chimney structures piercing this low permeability cap in the areas of the least thickness. In article 2 such Quaternary cap is missing in the fluid flow system. Yet, the tectonic and glacial regime beneath the seepage site described in article 2 is also related to former extensional faults, and uplift and erosion processes leading to shallowing of reservoir and source rocks. However the formations that host the fluid flow systems described in article 1 and 2 and its structural setting are quite different in that: while source and reservoir rocks within small-scale early Cenozoic rift basins exists in the Storfjordrenna, the source and reservoir rocks responsible for the fluid system in the Bjørnøyrenna relate to large-scale Triassic clinoforms mapped across the Barents Sea and Svalbard.
The fault zones are more easily defined using the 3D seismic data in the Bjørnøyrenna (article 2). Using the 3D dataset, we can observe the effects of faults, fault linkages and fault intersections, as well as damage zones on fluid focussing. Furthermore, we can observe up to 300 m wide fault zones that are leaking methane. The latter suggests that the fault zones in this area may not have been influenced by smearing and consequent fault sealing. Likely due to the structural complexity in the Storfjordrenna area, with tilted layering and complex topography of the glacial unit, it is harder to characterize and understand the leakage through faults beyond connecting them to the regional fault complexes and the fluid flow system.
The outcome of article 1 and 2 are a better understanding of the geological setting that controls the fluid flow system at the two most prominent seepage structures identified in CAGE. The two sites may represent typical scenarios for fluid flow and shallow gas/hydrate accumulations across the Barents Sea in areas with and without glacial sediment cover.
The famous Arctic deep-water methane release and gas hydrate site – Vestnesa Ridge ( e.g. Bünz et al., 2012; Panieri et al., 2017; Petersen et al., 2010; Plaza Faverola et al., 2015; Smith et al., 2014) is ideal for P-Cable based time-lapse studies due to soft contourite sediments, deep water, and large chimneys. Our first 4D seismic study using P-Cable 3D seismic technology indicates anomalies that likely attribute to real amplitude and travel-time changes related to fluid flow over a one year period (2012-2013). The methodological study of repeatability of P-Cable 3D seismic presented in article 3 provides promising results for future use of the high-resolution P-Cable seismic as a time-lapse tool in areas of natural and human-caused subseabed fluid flow.

33
5.2 Outlook The orientation of extensional faults in the Storfjordrenna area is NNW-SSE, whereas in Crater Area, extensional faults occur in two main directions, NW-SE and NNE-SSW. Across the SW Barents Sea, typical large-scale faults that show extensive leakage and strike through various rock formations including Cretaceous, Jurassic and Triassic rocks are NE-SW oriented (Vadakkepuliyambatta et al., 2013) (Fig. 1). The maximum horizontal stress direction, measured from several wells in the southern Barents Sea is N-S oriented. For future research, it would be interesting to map fault of various fault types (reverse faults, strike slip faults, normal faults) and other strike-directions at seepage sites and investigate if there is a link between fluid leakage through faults (in past and the present time), strike orientation and the current stress regime.
The two study sites one in Storfjordrenna and another one Bjørnøyrenna (article 1 and 2) were evaluated as potential future 4D targets. The geological complexity at these sites causes challenges for seismic repeatability, and hence, time-lapse seismic datasets most likely will not be acquired. However, since Vestnesa Ridge showed great potential for time-lapse seismic studies, we acquired additional repeats of the Vestnesa Ridge baseline survey in 2015 and 2017. The time-lapse datasets will be processed and compared to each other in an attempt to relate seismic amplitude changes and time shifts to migrating gas and with the ultimate aim to quantify flux through chimney structures. A 23 m long MeBo sediment core drilled in 2016 through one of the active pockmarks on the Vestnesa ridge provides information on physical properties of the upper chimney and hydrate-bearing sediments crucial for sub-seabed methane flux estimates. Furthermore, the inclusion of existing OBS data in the 4D seismic analyses will significantly improve the discernment and interpretation of fluid migration structures and estimation of the amount of hydrocarbon and gas hydrates present in this target area of fluid and gas hydrate dynamics. In addition, the work will link and receive input from a seafloor geochemical sampling and water column gas quantification using acoustic methods and discrete sampling. Together with these results, the time-lapse data provide unique possibilities to assess how changes of such a fluid and gas hydrate systems can be on the time scale of half a decade.
As shallow hydrocarbon systems can show a link to deeper reservoirs the potential for this project may also come from an increase of knowledge for future exploration activities in the Arctic. . A better understanding of fluid flow dynamics and mechanisms controlling the distribution of shallow gas and gas hydrate accumulations would allow for a safer and possibly more efficient exploration and exploitation of both, deep and shallow hydrocarbon reservoirs across the Barents Sea. Understanding the potential of the very high-resolution and portable P-Cable 3D seismic system to become a 4D tool is an important step from snapshot seismic surveys to monitoring the methane release systems with high resolution and accuracy. Evenly important is a deeper insight into fundamental natural processes leading to the release of methane and its importance for global warming, ocean acidification, and seafloor ecosystems.

34
List of figures
Figure 1 - The geologic and physiographic location of the studied seepage sites. The colors indicate the ages of the bedrock (see legend) that outcrops at the seafloor or below the upper regional unconformity (URU). Black dashed lines indicate major structural lineaments. The pink dots mark locations of sub-seafloor gas migration through faults and chimneys mapped within the SW Barents Sea open for petroleum activity (modified from Vadakkepuliyambatta et al., 2013). The orange patches are seafloor leakage of methane and other hydrocarbon gases locations observed during CAGE research cruises (CAGE-13-JM, CAGE-15-2, CAGE-16-3, CAGE-17-1, CAGE-18-1, and CAGE-18-5) and from Mau et al., 2017.
Figure 2 – Gas hydrate sampling at a CAGE research cruise. Gas hydrates consist of gas molecules trapped in a crystalline cage of water molecules – unstable at the earth surface where they start to decompose and release free gas.
Figure 3 – Gas hydrate stability under (A) permafrost and (B and C) marine conditions. Figure from (Ruppel and Kessler, 2017)
Figure 4 – Environments favourable for gas hydrate accumulations and sources of methane. Figure from Ruppel et al., 2017.
Figure 5 – Methane is bubbling out from a submarine mud volcano in the Gulf of Mexico. Photo: NOAA.
Figure 6 - The subsurface setting beneath a gas hydrate pingo in Storfjordrenna area, presented by P-Cable 3D seismic data. Fluid migration occurs through a gas chimney in the glacial deposits capping the gas hydrate pingo and gas discharge on the seafloor. Figure from Waage et al., submitted (article 1, this thesis).
Figure 7 – The first study of a natural gas hydrate and vent system using 4D seismic is from the Hydrate Ridge (Bangs et al., 2011). In 2000, the data were acquired by a 600 m long streamer- with 48 channels and a 45/45 in3 GI source, whereas the 2008 data set was acquired using a 75/75 in3 source and the P-Cable 3D seismic system, which consisted of 10 streamers of 30 m and 12.5 spacing between streamers. Despite the difference in acquisition system, Bangs et al. (2011) image changes in free gas accumulations along horizon A (as well as beneath the BSR), which they interpret as free gas migration updip the horizon towards the summit of the vent system.
Figure 8 – Seabed topography of the Barents Sea with location of the study areas; Study area of article 1 in the Storfjordrenna, article 2 in the Bjørnøyrenna and article 3 at the Vestnesa Ridge.
Figure 9 – Seismic cross-section (a511, see Figure 1 for location) from W to E along the Storfjordrenna (crossing the study area) indicating a thin Quarternary sediment cap above

35
faulted Paleocene-Cretaceous rocks and a prominent Pre-Devonian high. The figure is redrawn from Lasabuda et al., 2018.
Figure 10 – Seismic cross-section (NPD 2D line, location in Figure 1) from NW to SE across the study area in Bjørnyrenna area indicating that sedimentary rocks younger than late Triassic are eroded. Note that the study area is located above a Paleozoic high (the Gardarbanken high) and NNW-propagating Triassic clinoforms with occasionally high amplitude. The figure is redrawn from Andreassen et al., 2017.
Figure 11 – 3D figure of the Vestnesa gas hydrate and fluid flow system showing faults piercing a thick GHSZ, a prominent bottom simulating reflector (BSR) and underlying gas accumulations. The seafloor topography with large pockmarks is mapped with a multibeam system and the seabed gas release is mapped with a single beam echosounder data. Figure from Plaza Faverola et al. (2017).
Figure 12 - Acquiring 3D seismic data allows detailed imaging of layer, faults and sedimentary structures. Image from https://www.mapnagroup.com/en/projects/oil-gas/3d-seismic-data-acquisition,-data-processing-int.
Figure 13 - Configuration and geometry of the P-Cable seismic system.
Figure 14 - Comparison of conventional 3D seismic and P-Cable 3D seismic data. The P-Cable seismic data have a horizontal and vertical resolution of 6 and 4-5 m, respectively. The conventional 3D seismic data have horizontal and vertical resolution of 25 and over 8 m, respectively. Figure prepared by Andreia Plaza-Faverola.

36
References
Abrams, M. A., 2005, Significance of hydrocarbon seepage relative to petroleum generation and entrapment: Marine and Petroleum Geology, v. 22, no. 4, p. 457-477.
Andreassen, K., Hubbard, A., Winsborrow, M., Patton, H., Vadakkepuliyambatta, S., Plaza-Faverola, A., Gudlaugsson, E., Serov, P., Deryabin, A., and Mattingsdal, R., 2017, Massive blow-out craters formed by hydrate-controlled methane expulsion from the Arctic seafloor: Science, v. 356, no. 6341, p. 948-953.
Bangs, N. L., Hornbach, M. J., and Berndt, C., 2011, The mechanics of intermittent methane venting at South Hydrate Ridge inferred from 4D seismic surveying: Earth and Planetary Science Letters, v. 310, no. 1, p. 105-112.
Berndt, C., Bünz, S., Clayton, T., Mienert, J., and Saunders, M., 2004, Seismic character of bottom simulating reflectors: examples from the mid-Norwegian margin: Marine and Petroleum Geology, v. 21, no. 6, p. 723-733.
Biastoch, A., Treude, T., Rüpke, L. H., Riebesell, U., Roth, C., Burwicz, E. B., Park, W., Latif, M., Böning, C. W., and Madec, G., 2011, Rising Arctic Ocean temperatures cause gas hydrate destabilization and ocean acidification: Geophysical Research Letters, v. 38, no. 8.
Boetius, A., Ravenschlag, K., Schubert, C. J., Rickert, D., Widdel, F., Gieseke, A., Amann, R., Jørgensen, B. B., Witte, U., and Pfannkuche, O., 2000, A marine microbial consortium apparently mediating anaerobic oxidation of methane: Nature, v. 407, no. 6804, p. 623.
Brown, A. R., 2011, Interpretation of three-dimensional seismic data, Society of Exploration Geophysicists and American Association of Petroleum ….
Bugge, T., Befring, S., Belderson, R. H., Eidvin, T., Jansen, E., Kenyon, N. H., Holtedahl, H., and Sejrup, H. P., 1987, A giant three-stage submarine slide off Norway: Geo-marine letters, v. 7, no. 4, p. 191-198.
Bünz, S., Polyanov, S., Vadakkepuliyambatta, S., Consolaro, C., and Mienert, J., 2012, Active gas venting through hydrate-bearing sediments on the Vestnesa Ridge, offshore W-Svalbard: Marine Geology, v. 332, p. 189-197.
Chadwick, R., Noy, D., Arts, R., and Eiken, O., 2009, Latest time-lapse seismic data from Sleipner yield new insights into CO2 plume development: Energy Procedia, v. 1, no. 1, p. 2103-2110.
Chand, S., Knies, J., Baranwal, S., Jensen, H., and Klug, M., 2014, Structural and stratigraphic controls on subsurface fluid flow at the Veslemøy High, SW Barents Sea: Marine and Petroleum Geology, v. 57, p. 494-508.
Chand, S., Mienert, J., Andreassen, K., Knies, J., Plassen, L., and Fotland, B., 2008, Gas hydrate stability zone modelling in areas of salt tectonics and pockmarks of the Barents Sea suggests an active hydrocarbon venting system: Marine and Petroleum Geology, v. 25, no. 7, p. 625-636.
Chand, S., Rise, L., Ottesen, D., Dolan, M., Bellec, V., and Bøe, R., 2009, Pockmark-like depressions near the Goliat hydrocarbon field, Barents Sea: morphology and genesis: Marine and Petroleum Geology, v. 26, no. 7, p. 1035-1042.
Claypool, G. E., and Kaplan, I., 1974, The origin and distribution of methane in marine sediments, Natural gases in marine sediments, Springer, p. 99-139.

37
Clayton, C., 1991, Carbon isotope fractionation during natural gas generation from kerogen: Marine and petroleum geology, v. 8, no. 2, p. 232-240.
Crémière, A., Lepland, A., Chand, S., Sahy, D., Kirsimäe, K., Bau, M., Whitehouse, M. J., Noble, S. R., Martma, T., and Thorsnes, T., 2016, Fluid source and methane-related diagenetic processes recorded in cold seep carbonates from the Alvheim channel, central North Sea: Chemical Geology, v. 432, p. 16-33.
Dickens, G. R., 2003, Rethinking the global carbon cycle with a large, dynamic and microbially mediated gas hydrate capacitor: Earth and Planetary Science Letters, v. 213, no. 3-4, p. 169-183.
Dickens, G. R., Castillo, M. M., and Walker, J. C., 1997, A blast of gas in the latest Paleocene: Simulating first-order effects of massive dissociation of oceanic methane hydrate: Geology, v. 25, no. 3, p. 259-262.
Eiken, O., and Hinz, K., 1993, Contourites in the Fram Strait: Sedimentary Geology, v. 82, no. 1-4, p. 15-32.
Eldholm, O., Faleide, J. I., and Myhre, A. M., 1987, Continent-ocean transition at the western Barents Sea/Svalbard continental margin: Geology, v. 15, no. 12, p. 1118-1122.
Etiope, G., 2015, Natural gas seepage: The Earth’s Hydrocarbon Degassing. Springer, Switzerland, v. 199, p. 199.
Glørstad-Clark, E., Faleide, J. I., Lundschien, B. A., and Nystuen, J. P., 2010, Triassic seismic sequence stratigraphy and paleogeography of the western Barents Sea area: Marine and Petroleum Geology, v. 27, no. 7, p. 1448-1475.
Grogan, P., Østvedt-Ghazi, A.-M., Larssen, G., Fotland, B., Nyberg, K., Dahlgren, S., and Eidvin, T., Structural elements and petroleum geology of the Norwegian sector of the northern Barents Sea, in Proceedings Geological Society, London, Petroleum Geology Conference series1999, Volume 5, Geological Society of London, p. 247-259.
Henriet, J.-P., Mienert, J., and Mienert, J., Gas hydrates: relevance to world margin stability and climate change1998, Geological Society of London.
Hong, W.-L., Torres, M. E., Carroll, J., Crémière, A., Panieri, G., Yao, H., and Serov, P., 2017, Seepage from an arctic shallow marine gas hydrate reservoir is insensitive to momentary ocean warming: Nature communications, v. 8, p. 15745.
Hong, W. L., Torres, M., Portnov, A., Waage, M., Haley, B., and Lepland, A., 2018, Variations in gas and water pulses at an Arctic seep: fluid sources and methane transport: Geophysical Research Letters.
Hovland, M., Gardner, J. V., and Judd, A., 2002, The significance of pockmarks to understanding fluid flow processes and geohazards: Geofluids, v. 2, no. 2, p. 127-136.
Hovland, M., and Svensen, H., 2006, Submarine pingoes: Indicators of shallow gas hydrates in a pockmark at Nyegga, Norwegian Sea: Marine Geology, v. 228, no. 1-4, p. 15-23.
Johnson, J. E., Mienert, J., Plaza-Faverola, A., Vadakkepuliyambatta, S., Knies, J., Bünz, S., Andreassen, K., and Ferré, B., 2015, Abiotic methane from ultraslow-spreading ridges can charge Arctic gas hydrates: Geology, v. 43, no. 5, p. 371-374.
Judd, A., and Hovland, M., 2009, Seabed fluid flow: the impact on geology, biology and the marine environment, Cambridge University Press.
Katz, M. E., Pak, D. K., Dickens, G. R., and Miller, K. G., 1999, The source and fate of massive carbon input during the latest Paleocene thermal maximum: Science, v. 286, no. 5444, p. 1531-1533.

38
Knies, J., Daszinnies, M., Plaza-Faverola, A., Chand, S., Sylta, Ø., Bünz, S., Johnson, J. E., Mattingsdal, R., and Mienert, J., 2018, Modelling persistent methane seepage offshore western Svalbard since early Pleistocene: Marine and Petroleum Geology, v. 91, p. 800-811.
Knies, J., Plaza-Faverola, A., Bünz, S., Mienert, J., Daszinnies, M., Mattingsdal, R., and Chand, S., Finding the Source for Hydrocarbon Leakage on the Vestnesa Ridge, NW Svalbard, in Proceedings OTC Arctic Technology Conference2015, Offshore Technology Conference.
Koh, C. A., Sum, A. K., and Sloan, E. D., 2012, State of the art: Natural gas hydrates as a natural resource: Journal of Natural Gas Science and Engineering, v. 8, p. 132-138.
Kragh, E., and Christie, P., 2002, Seismic repeatability, normalized rms, and predictability: The Leading Edge, v. 21, no. 7, p. 640-647.
Kvenvolden, K. A., 2002, Methane hydrate in the global organic carbon cycle: Terra Nova, v. 14, no. 5, p. 302-306.
Lammers, S., Suess, E., and Hovland, M., 1995, A large methane plume east of Bear Island (Barents Sea): implications for the marine methane cycle: Geologische Rundschau, v. 84, no. 1, p. 59-66.
Lasabuda, A., Laberg, J. S., Knutsen, S.-M., and Safronova, P., 2018, Cenozoic tectonostratigraphy and pre-glacial erosion: A mass-balance study of the northwestern Barents Sea margin, Norwegian Arctic: Journal of Geodynamics.
Lerch, B., Karlsen, D., Matapour, Z., Seland, R., and Backer Owe, K., 2016, Organic geochemistry of Barents Sea petroleum: thermal maturity and alteration and mixing processes in oils and condensates: Journal of Petroleum Geology, v. 39, no. 2, p. 125-148.
Link, W. K., 1952, Significance of oil and gas seeps in world oil exploration: AAPG bulletin, v. 36, no. 8, p. 1505-1540.
Long, D., Lammers, S., and Linke, P., 1998, Possible hydrate mounds within large sea-floor craters in the Barents Sea: Geological Society, London, Special Publications, v. 137, no. 1, p. 223-237.
Lumley, D., 2010, 4D seismic monitoring of CO 2 sequestration: The Leading Edge, v. 29, no. 2, p. 150-155.
Løseth, H., Gading, M., and Wensaas, L., 2009, Hydrocarbon leakage interpreted on seismic data: Marine and Petroleum Geology, v. 26, no. 7, p. 1304-1319.
Macgregor, D. S., 1993, Relationships between seepage, tectonics and subsurface petroleum reserves: Marine and Petroleum Geology, v. 10, no. 6, p. 606-619.
Maslin, M., Owen, M., Betts, R., Day, S., Jones, T. D., and Ridgwell, A., 2010, Gas hydrates: past and future geohazard?: Philosophical Transactions of the Royal Society of London A: Mathematical, Physical and Engineering Sciences, v. 368, no. 1919, p. 2369-2393.
Mau, S., Römer, M., Torres, M. E., Bussmann, I., Pape, T., Damm, E., Geprägs, P., Wintersteller, P., Hsu, C.-W., and Loher, M., 2017, Widespread methane seepage along the continental margin off Svalbard-from Bjørnøya to Kongsfjorden: Scientific reports, v. 7, p. 42997.
Max, M., Pellanbarg, R., and Hurdle, B., 1997, Methane Hydrate, A Special Clathrate: Its Attributes and Potential: NAVAL RESEARCH LAB WASHINGTON DC CHEMISTRY DIV.
Mazzini, A., and Etiope, G., 2017, Mud volcanism: an updated review: Earth-Science Reviews, v. 168, p. 81-112.

39
Niemann, H., Lösekann, T., De Beer, D., Elvert, M., Nadalig, T., Knittel, K., Amann, R., Sauter, E. J., Schlüter, M., and Klages, M., 2006, Novel microbial communities of the Haakon Mosby mud volcano and their role as a methane sink: Nature, v. 443, no. 7113, p. 854.
Ohm, S. E., Karlsen, D. A., and Austin, T., 2008, Geochemically driven exploration models in uplifted areas: Examples from the Norwegian Barents Sea: AAPG bulletin, v. 92, no. 9, p. 1191-1223.
Ostanin, I., Anka, Z., di Primio, R., and Bernal, A., 2013, Hydrocarbon plumbing systems above the Snøhvit gas field: structural control and implications for thermogenic methane leakage in the Hammerfest Basin, SW Barents Sea: Marine and Petroleum Geology, v. 43, p. 127-146.
Panieri, G., Bünz, S., Fornari, D. J., Escartin, J., Serov, P., Jansson, P., Torres, M. E., Johnson, J. E., Hong, W., and Sauer, S., 2017, An integrated view of the methane system in the pockmarks at Vestnesa Ridge, 79° N: Marine Geology, v. 390, p. 282-300.
Pauli, C. K., Ussler, W., and Dillon, W. P., 2000, Potential role of gas hydrate decomposition in generating submarine slope failures, Natural Gas Hydrate, Springer, p. 149-156.
Petersen, C. J., Bünz, S., Hustoft, S., Mienert, J., and Klaeschen, D., 2010, High-resolution P-Cable 3D seismic imaging of gas chimney structures in gas hydrated sediments of an Arctic sediment drift: Marine and Petroleum Geology, v. 27, no. 9, p. 1981-1994.
Planke, S., and Berndt, C., 2002, Anordning for seismikkmåling Norwegian Patent 20021140. Planke, S., Eriksen, F. N., Berndt, C., Mienert, J., and Masson, D., 2009, P-Cable high-resolution
seismic: Oceanography, v. 22, no. 1, p. 85. Plaza Faverola, A., Bünz, S., Johnson, J. E., Chand, S., Knies, J., Mienert, J., and Franek, P., 2015,
Role of tectonic stress in seepage evolution along the gas hydrate charged Vestnesa Ridge, Fram Strait: Geophysical Research Letters, v. 42, no. 3, p. 733-742.
Plaza Faverola, A., Vadakkepuliyambatta, S., Hong, W. L., Mienert, J., Bünz, S., Chand, S., and Greinert, J., 2017, Bottom simulating reflector dynamics at Arctic thermogenic gas provinces: An example from Vestnesa Ridge, offshore west Svalbard: Journal of Geophysical Research: Solid Earth, v. 122, no. 6, p. 4089-4105.
Portnov, A., Vadakkepuliyambatta, S., Mienert, J., and Hubbard, A., 2016, Ice-sheet-driven methane storage and release in the Arctic: Nature communications, v. 7, p. 10314.
Rajan, A., Mienert, J., Bünz, S., and Chand, S., 2012, Potential serpentinization, degassing, and gas hydrate formation at a young (< 20 Ma) sedimented ocean crust of the Arctic Ocean ridge system: Journal of Geophysical Research: Solid Earth, v. 117, no. B3.
Ruppel, C. D., and Kessler, J. D., 2017, The interaction of climate change and methane hydrates: Reviews of Geophysics, v. 55, no. 1, p. 126-168.
Sauter, E. J., Muyakshin, S. I., Charlou, J.-L., Schlüter, M., Boetius, A., Jerosch, K., Damm, E., Foucher, J.-P., and Klages, M., 2006, Methane discharge from a deep-sea submarine mud volcano into the upper water column by gas hydrate-coated methane bubbles: Earth and Planetary Science Letters, v. 243, no. 3-4, p. 354-365.
Sen, A., Åström, E. K., Hong, W.-L., Portnov, A., Waage, M., Serov, P., Carroll, M. L., and Carroll, J., 2018, Geophysical and geochemical controls on the megafaunal community of a high Arctic cold seep: Biogeosciences Discuss, v. 2018, p. 1-52.
Serov, P., Vadakkepuliyambatta, S., Mienert, J., Patton, H., Portnov, A., Silyakova, A., Panieri, G., Carroll, M. L., Carroll, J., and Andreassen, K., 2017, Postglacial response of Arctic Ocean gas hydrates to climatic amelioration: Proceedings of the National Academy of Sciences, p. 201619288.

40
Sheriff, R. E., and Geldart, L. P., 1995, Exploration seismology, Cambridge university press. Sloan Jr, E. D., and Koh, C., 2007, Clathrate hydrates of natural gases, CRC press. Smith, A. J., Mienert, J., Bünz, S., and Greinert, J., 2014, Thermogenic methane injection via
bubble transport into the upper Arctic Ocean from the hydrate charged Vestnesa Ridge, Svalbard: Geochemistry, Geophysics, Geosystems, v. 15, no. 5, p. 1945-1959.
Stokes, C. R., and Clark, C. D., 2001, Palaeo-ice streams: Quaternary Science Reviews, v. 20, no. 13, p. 1437-1457.
Sztybor, K., and Rasmussen, T. L., 2017, Diagenetic disturbances of marine sedimentary records from methane influenced environments in the Fram Strait as indications of variation in seep intensity during the last 35 000 years: Boreas, v. 46, no. 2, p. 212-228.
Sættem, J., Poole, D., Ellingsen, L., and Sejrup, H., 1992, Glacial geology of outer Bjørnøyrenna, southwestern Barents Sea: Marine Geology, v. 103, no. 1-3, p. 15-51.
Vadakkepuliyambatta, S., Bünz, S., Mienert, J., and Chand, S., 2013, Distribution of subsurface fluid-flow systems in the SW Barents Sea: Marine and Petroleum Geology, v. 43, p. 208-221.
Vorren, T., Lebesbye, E., Andreassen, K., and Larsen, K.-B., 1989, Glacigenic sediments on a passive continental margin as exemplified by the Barents Sea: Marine Geology, v. 85, no. 2-4, p. 251-272.
Vorren, T. O., Hald, M., and Lebesbye, E., 1988, Late cenozoic environments in the Barents Sea: Paleoceanography and Paleoclimatology, v. 3, no. 5, p. 601-612.
Wallmann, K., Pinero, E., Burwicz, E., Haeckel, M., Hensen, C., Dale, A., and Ruepke, L., 2012, The global inventory of methane hydrate in marine sediments: A theoretical approach: Energies, v. 5, no. 7, p. 2449-2498.
Waters, K. H., and Waters, K. H., 1987, Reflection seismology: A tool for energy resource exploration, Wiley New York.
Westbrook, G. K., Thatcher, K. E., Rohling, E. J., Piotrowski, A. M., Pälike, H., Osborne, A. H., Nisbet, E. G., Minshull, T. A., Lanoisellé, M., and James, R. H., 2009, Escape of methane gas from the seabed along the West Spitsbergen continental margin: Geophysical Research Letters, v. 36, no. 15.
Whiticar, M. J., 1999, Carbon and hydrogen isotope systematics of bacterial formation and oxidation of methane: Chemical Geology, v. 161, no. 1-3, p. 291-314.
Wood, W. T., Stoffa, P. L., and Shipley, T. H., 1994, Quantitative detection of methane hydrate through high resolution seismic velocity analysis: Journal of Geophysical Research: Solid Earth, v. 99, no. B5, p. 9681-9695.

41
Article 1
Malin Waage, Alexey Portnov, Pavel Serov, Stefan Bünz, Kate A. Waghorn, Sunil Vadakkepuliyambatta, Jürgen Mienert, Karin Andreassen. GGeological controls on fluid flow and gas hydrate pingo development on the Barents Sea margin. Post revision in editor’s office, G-cubed – Geochemistry, Geophysics, Geosciences.

Article 2
Malin Waage, Pavel Serov, Karin Andreassen, Kate A. Waghorn, Stefan Bünz. CControls on giant methane blowout craters and mounds on the Arctic seafloor. Manuscript.

AArticle 3
Malin Waage, Stefan Bünz, Martin Landrø, Andreia Plaza-Faverola, Kate Alyse Waghorn. (2018). RRepeatability of high-resolution 3D seismic data. Accepted manuscript, Geophysics, 84(1), 1-60. DOI: 10.1190/geo2018-0099.1

6 Supplementary material

6.1 Article contributions In addition to the three articles presented in this thesis (presented in next section), I am the lead author or have contributed to several other articles;
Hong, Wei-Li; Torres, Marta E.; Portnov, Aleksei D; WWaage, Malin; Haley, B.; Lepland, Aivo. Variations in gas and water pulses at an Arctic seep: fluid sources and methane transport. Geophysical Research Letters 2018
Sen, Arunima; Åström, Emmelie; Hong, Wei-Li; Serov, Pavel; Portnov, Aleksei D; Waage, Malin; Carroll, Michael Leslie; Carroll, JoLynn. Geophysical and geochemical controls on the megafaunal community of a high Arctic cold seep. Biogeosciences, 2018 (1726 4170) 15 p. 4533 4559
Waage, Malin, Bünz, Stefan, Bøe, Reidulv, Mienert, Jürgen. High resolution 3D seismic exhibits new insights into the middle late Pleistocene stratigraphic evolution and sedimentary processes of the Bear Island trough mouth fan. Marine Geology, 2018 (0025 3227) 403 p. 139149
K. A. Waghorn, S. Bünz, M. Waage, A. Plaza-Faverola, S. Vadakkepuliyambatta. Crustal-Scale tectonics promoting long-lived fluid flow systems on the Northern Knipovich Ridge. In preparation.
Pavel Serov, Henry Patton, Malin Waage, Calvin Shackleton, Jürgen Mienert, Karin Andreassen. Subglacial erosion and transportation of gas hydrate bearing sediments on an Arctic Ocean continental margin. In preparation.
Giacomo Osti, Kate Alyse Waghorn, Andreia Plaza Faverola, Malin Waage, Benedicte Ferre, Jurgen Mienert. Evolution of contourite drifts in regions of gas-hydrate related bottom simulating reflectors and slope failures at eastern Fram Strait. In preparation.
6.2 Research results at international meetings and conferences 2018
Bellwald, B., WWaage, M., Planke, S., Lebedeva Ivanova, N., Polteau, S., Tasianas, A., Bünz, S., Plaza Faverola, A., Berndt, C., Stokke, H. H., Millett, J., Myklebust, R. "Monitoring Of CO2 Leakage Using High Resolution 3D Seismic Data – Examples FromSnøhvit, Vestnesa Ridge And The Western Barents Sea" in EarthDoc, 2018 p. 5. http://dx.doi.org/10.3997/2214-4609.201802965
Bellwald, B., WWaage, M., Planke, S., Lebedeva Ivanova, N., Polteau, S., Tasianas, A., Bünz, S., Plaza Faverola, A., Berndt, C., Stokke, H. H., Millett, J., Myklebust, R. Poster."Monitoring OfCO2 Leakage Using High Resolution 3D Seismic Data – Examples FromSnøhvit, Vestnesa Ridge And The Western Barents Sea". Fifth CO2 Geological Storage Workshop, 2018 11 21 2018-11 23, Utrecht, Netherlands
Bünz, S., Vadakkepuliyambatta, S., Plaza Faverola, A., Waghorn, K. A., Waage, M.,Romeyn, R. Poster. "Gas Hydrate Dynamics at Ultra Slow Spreading Ridges in the Fram Strait, Offshore Western Svalbard". AGU, Fall Meeting 2018, 2018 12 10 201812 14, Washington D.C., USA
Serov, P., WWaage, M. Oral presentation. "Gas hydrate dynamics and methane release across the Arctic Ocean continental margins". Seminar at Washington State University, 2018 03 07, Seattle, USA
Serov, P., WWaage, M., Vadakkepuliyambatta, S., Patton, H., Portnov, A. D., Mienert, J.,Bünz, S., Hubbard, A. L. Oral presentation. "Geological and glaciological control on an Arctic Ocean gas hydrate reservoir". AGU, Fall Meeting 2018, 2018 12 10 2018 1214, Washington D.C., USA
Waage, M., Serov, P. Oral presentation. "Gas hydrate dynamics and methane release across the Arctic Ocean continental margins". Seminar at Washington State University, 2018 03 07, Seattle, USA
2017
Bünz, Stefan; Plaza-Faverola, Andreia; Chand, Shyam; Vadakkepuliyambatta, Sunil; Franek, Peter; Portnov, Aleksei D; Singhroha, Sunny; Waghorn, Kate Alyse; Waage,, Malin; Valberg, Espen; Mienert, Jurgen. Gas Hydrate Systems on Arctic Margins Around Svalbard and in the Barents Sea. 9th International Conference on Gas Hydrates; Denver, USA, 2017-06-25 - 2017-06-30
Portnov, Aleksei D; WWaage, Malin; Waghorn, Kate Alyse; Serov, Pavel; Mienert, Jurgen; Bünz, Stefan; Andreassen, Karin. Geophysical 3D Characterization of Gas Hydrate Pingos Offshore Svalbard. 9th International Conference on Gas Hydrates, Denver, USA; 2017-06-25 - 2017-06-30
Sen, Arunima; Åström, Emmelie; Hong, Wei-Li; Serov, Pavel; Portnov, Aleksei D; Waage,, Malin; Carroll, Michael Leslie; Carroll, JoLynn. High Arctic cold seeps: visual and

acoustic imagery reveal spatial heterogeneity in megafaunal communities andsediment geochemistry. AMGG Research School Annual meeting 2017; 2017-10-03
WWaage, Malin; Bünz, Stefan; Plaza-Faverola, Andreia; Waghorn, Kate Alyse. Repeatability of P-Cable 3D seismic data. EAGE/SEG Research Workshop, Trondheim, Norway; 2017-08-28 - 2017-08-31
Waage, Malin; Bünz, Stefan; Plaza-Faverola, Andreia; Waghorn, Kate Alyse. Repeatability of P-Cable 3D seismic data. EarthDoc 2017.
Waage, Malin; Bünz, Stefan; Plaza-Faverola, Andreia; Waghorn, Kate Alyse. 4D Time-Lapse Seismic Analysis of Active Gas Seepage Systems on the Vestnesa Ridge, Offshore W-Svalbard. 9th International Conference on Gas Hydrates, Denver, USA; 2017-06-25 - 2017-06-30
2016
Waage, Malin; Bünz, Stefan; Andreassen, Karin. High-resolution 3D seismicinvestigation of giant seafloor craters in the Barents Sea. EGU General Assembly 2016, Vienna, Austria; 2016-04-17 - 2016-04-22
Waage, Malin; Bünz, Stefan; Andreassen, Karin. High-resolution 3D seismic investigation of giant seafloor craters in the Barents Sea. AMGG research school meeting; 2016-04-11 - 2016-04-12
Waage, Malin; Bünz, Stefan; Andreassen, Karin. Structural controlled fluid flow migration beneath giant craters and associated pingos in the Western Barents Sea. 13th International Conference on Gas In Marine Sediments, Tromsø, Norway; 2016-09-19 - 2016-09-22
Waage, Malin; Stuart, Mhairi. Bermuda-Triangle incident.. BBC Radio Scottland [Radio] 2016-03-14
Waage, Malin; Valberg, Espen. 4D time-lapse seismic studies of fluid flow. Steering Committee -Advisory Board Meeting with CAGE 2016 team; 2016-11-28 - 2016-11-29
Waage, Malin; Åström, Emmelie. Giant seafloor craters and thriving fauna: methane seepage in the Arctic, Press conference, PC4, EGU General Assembly 2016,2016-04-19.
2015
Waage, Malin. What is Messinian Salinity Crises?. Facts from the fields 2015