Embed Size (px)
Citation preview

I Department of the Geophysical sciences i \ The University of Chicago ,
\ I
\ \ \
ANGULAR DEPENDENCE OF ALBEDO FROM STRATIFORM CLOUDS
AS MEASURED BY TIROS IV SCANNING RADIOMETERS
isrnund Rabbe
IACCESSION NUMBER) - (TWRUI '
(CATEOORYI
GPO PRlCE s- CFST~ PRICE(S) $- ,
SMRP Research Pa*mr NUMBER 58
https://ntrs.nasa.gov/search.jsp?R=19660023263 2018-05-02T01:45:51+00:00Z
MESOMETEOROLOGY PROPCT - - - RESEARCH PAPERS
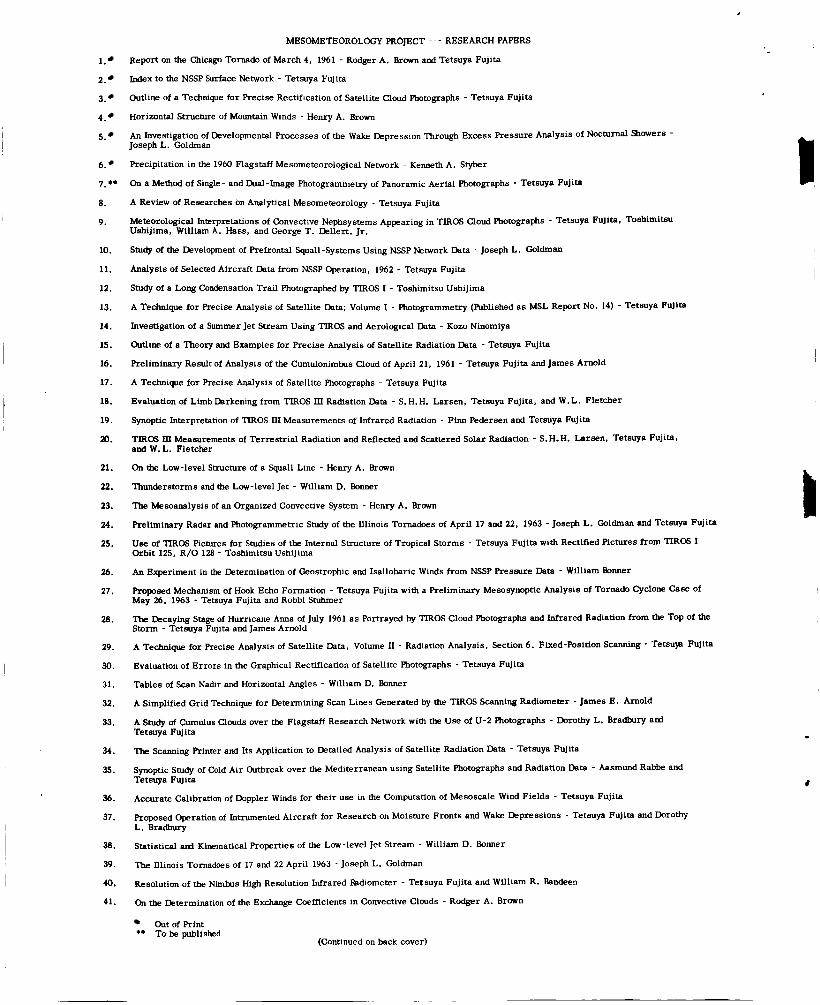
Report on the Chicago Tornado of March 4, 1961 - Rcdger A. Brown and Tetsuya Fujita
Index to the NSSP Surface Network - Tetsuya Fujita
Outline of a Technique for Precise Rectification of Satellite Cloud Photographs - Tetsuya Fujita
Horizontal Structure of Mountain Winds - Henry A. Brown
An Investigation of Developmental Processes of the Wake DepressLon Through Excess Pressure Analysis Of Nocturnal Showers - Joseph L. Goldman
Precipitation in the 1960 Flagstaff Mesometeorological Network - Kenneth A. Styber
On a Method of Single- and Dual-Image Photogrammetry of Panoramic Aerial Photographs - Tetsuya Fulita
A Review of Researches on Analytical Mesometeorology - Tetsuya Pujita
h%eteorological Interpretations of Convective Nephsystems Appearing in TIROS Cloud Photographs - Tetsuya Fujita, Toshimitsu Ushijima, William A. Hass, and George T. Dellert, Jr.
Study of the Development of Prefrontal Squall-Systems Using NSSP Network Data - Joseph L. Goldman
Analysis of Selected Aircraft Data from NSSP Operation, 1962 - Tetsuya Fujita
Study of a Long Condensation Trail Photographed by TIROS I - Toshimitsu Ushijima
A Technique for Precise Analysis of Satellite Data; Volume I - Photogrammetry (Published a s MSL Report No. 14) - Tetsuya Wits
Investigation of a hnmer Jet Stream Using TIROS and Aerological Data - Kozo Ninomiya
outline Of a Theory and Examples for Precise Analysis of Satellite Radiation Data - Tetsuya PuJita
Preliminary Result of Analysis of the Cumulonimbus Cloud of April 21, 1961 - Tetsuya Fujita and James Arnold
A Technique for Precise Analysis of Satellite Photographs - Tetsuya Fujita
Evaluation of Limb Darkening from TIROS III Radiation Data - S. H. H. Larsen, Tetsuya Fujita, and W. L. Fletcher
Synoptic Interpretation of TIROS III Measurements of Infrared Radiation - Finn Pedersen and Tetsuya Pulita
T I R E III Measurements of Terrestrial Radiation and Re5ected and Scamred Solar Radiation - S.H.H. Larsen. Tetsuya FWita, and W.L. Fletcher
On the Low-level Structure of a Squall Line - Henry A. Brown
Thunderstorms and the Low-level Jet - William D. Bonner
The Mesoanalysis of an Organized Convective System - Henry A. Brown
Preliminary Radar and Photogrammetric Study of the Illinois Tornadoes of April 17 and 22, 1963 - Joseph L. Goldman and Tetsuya Pujita
Use of TIROS Pictures for Studies of the Internal Structure of Tropical Storms - Tetsuya Pujita with Rectified Pictures from TIRm I Orbit 125, R/O 128 - Toshimitsu Ushijima
An Experiment in the Determination of Geostrophic and Isallobaric Winds from NSSP Pressure Data - William Borne1
Proposed Mechanism of Hook Echo Formation - Tetsuya Pujita with a Preliminary Mesosynoptic Analysis of Tornado cyclone Case Of May 26. 1963 - Tetsuya Fujita and Robbi Stuhmer
Tbe Decaying Stage of Hurricane Anna of July 1961 as Portrayed by TIROS Cloud Photographs and Infrared RadiaUon from the TOP Of the Storm - Tetsuya Pujita and James Arnold
A Technique for Precise Analysis of Satellite Data, Volume II - Radiation Analysis, Section 6. Fixed-Position Scanning - Tetsu)a Pujita
Evaluation of Errors in the Graphical Rectification of Satellite Photographs - Tetsuya Fujita
Tables of Scan Nadir and Horizontal Angles - William D. Bonner
1.
2.
3.
4.
5.
6.
7. ** 8.
9.
10.
11.
12.
13.
14.
15.
16.
17.
18.
19.
m.
21.
22.
23.
24.
25.
26.
27.
28.
29.
30.
31.
32.
33.
34.
35.
36.
37.
38.
39.
40.
41.
A Simplified Grid Technique for Determining Scan Lines Generated by the TIROS Scanning Radiometer - James E. Arnold
A Study of Cumulus Clouds over the Flagstaff Research Network with the Use of U-2 Photographs - Dorothy L. Bradbury a d Tetsuya Fujita
The Scanning Printer and Its Applicatlon to Detalled Analysis of Satellite Radiation Data - Tetsuya Fulita
Synoptic Study of Cold Air Outbreak over the Mediterranean using Satellite Photographs and Ra&ahon Data - Aasmund Rabbe and Tetsuya Fujita
Accurate Calibration of Doppler Winds for their use in the Computatlon of Mesoscale Wind Fields - Tetsuya Fujita
Proposed Operauon of Inhwnented Aircraft for Research on Moisture Fronts and Wake Depressions - Tetsuya Fujita and Dorothy L. Bradbury
Statistical a d Kinematical Properties of the Low-level Jet Stream - William D. Bonner
The Illinois Tornadoes of 17 and 22 April 1963 - Joseph L. Goldman
Resolution of the Nimhs High Resolution Infrared Fbdiometer - Tetsuya Fujita and William R. Bandeen
On the Determination of the Exchange Coefficients in Convective Clouds - Rcdger A. Brown
(kt of Print ** Tobe published
(Continued on back cover)

SATELLITE AND MESOMETEOROLOGY RESEARCH PROJECT
Department of the Geophysical Sciences
The University of Chicago
ANGULAR DEPENDENCE OF ALBEDO FROM STRATIFORM CLOUDS
AS MEASURED BY TIROS IV SCANNING RADIOMETERS
bY
ismund Rabbe
SMRP Research Paper #58 June 1966
The research reported in this paper has been supported by the National Aeronautics and Space Administration under grant NASA NsG 333.

.
ANGULAR DEPENDENCE OF ALBEDO FROM STRATIFORM CLOUDS
AS MEASURED BY TIROS IV SCANNING RADIO METERS^ isrnund Rabbe
Department of the Geophysical Sciences
The University of Chicago
Chicago, Illinois
r) ABSTRACT 5"
Pictures and radiation data from two orbits of TIROS IV
have been used in this study to show the anisotropy in the albedo of
low stratiform clouds. In order to scan the same clouds from two
different directions we have used the radiation data when the satellite
w a s in an alternating mode while the floor and wall sensors scanned
the earth successively. To express the anisotropy we have used the
specular angle, w , and the backscattering angle, qo , as parameters.
The resul ts show that the albedo is dependent on these two parameters,
particularly the specular angle.
1 . Introduction.
The szat ter i~g ar;d reflec~ien of light in the atmosphere have been the subject
of several studies. During World W a r 11, Waldram (1945) made some experiments
with a nephelometer and calculated the polar scatter index. H e found a pronounced
maximum a t Oo, or in the forward scattering direction; a secondary maximum a t
180°7 o r in the backward scattering direction; and a minimum around 90°, depending
on the purity of the air. Deirmendjian (1962) obtained resul ts very close to Waldram's;
however, his minimum was located at a scattering angle near l l O o . H e a lso found
a pronounced, relatively narrow maximum around 14307 which he explained as resulting
from the fogbow, o r white rainbow.
With the advent of the TIROS satellites with radiometers aboard, much radiation
data have become available for such studies. Several authors have shown that radiation
'The research reported in this paper has been supported by the National
Aeronautics and Space Administration under grant NASA NsG 333.

2
data obtained from Channel 2 (8-12p), combined with those from Channel 3 (0.25-6. Op ), a r e useful in interpreting cloud systems and weather patterns on synoptic charts.
The energy received by Channel 3 depends mainly on the reflecting surface, but this
is not the only dependency. The energy is a lso a function of the solar zenith angle, the satellite zenith angle, and the relative azimuth.
Bartman et. al. (1964) measured the reflected and scattered radiation received -- by a TIROS IV radiometer from a high altitude (34 km) balloon flight in June, 1962.
The radiation came from a rather uniform stratocumulus cover. Their readings
covered scattering angles from 40' to 160'. Two maximum values, located a t scattering
angles of 40' and above 140°, respectively, were obtained. The minimum was located
between 110' and 120'.
Larsen -- et. al. (1963) computed backscattering angles (the angle betweer, incident
and outgoing beam) for initial and complemental scans from one orbit of TIROS 111.
They kept the satellite zenith angles constant and assumed the solar zenith to be
constant because of the small time interval. The backscattering angles for initial
scans varied from 15' to 40'; for the complemental scans, there was only a slight
variation around 70°. The energy values received from the same scanspot during the
initial scans were higher than those received during the complemental scans. This
is in agreement with the resul ts of Deirmendjian and Bartman.
Viezee and Davis (1965) used one orbit of TIROS IV to show anisotropy in the
backscattered light when the satellite is in an alternating mode (i. e. , floor and waii
sensor are scanning the ear th successively). The scattering angles for floor and
wall sensors varied from 131' to 78' and from 100' to 53' respectively. They found
that the energy coming to the wall sensor was much higher than that coming to the
floor sensor.
In this study we too have used two orbits of TIROS IV when the satellite w a s
in an alternating mode, so that we could apply the data f rom both floor and wall sensors.
On the basis of satellite pictures, synoptic observations, and satellite radiation data, we have been able to distinguish between different kinds of cloud surfaces. The
purpose has been to see if there exist any significant differences in the reflecting
propert ies of low stratiform cloud surfaces when they are viewed by the satellite f rom
different directions. Although this problem has been the subject of much research,
no completely satisfactory solution has a s yet been offered.

I -
. 3
2 . Variation in Albedo of Stratoform Clouds as a Function of the Specular Angles.
The scattering and the backscattering angles, which are complementary, have
been used by most authors to express the angular dependence of the outgoing shortwave
radiation from the earth. The backscattering angle, qb , can be expressed by
cos Jb = cos 5, cos 5, + sin c,sin 5.~0s Aa ( 1 )
where (,and 5 , are the zenith angles of the sun and the satellite, respectively,
and A a is the relative azimuth (Fujita, 1963). The scattering and backscattering
angles are useful parameters for expressing this angular dependence if the short-wave
radiation picked up by the satellite is mainly scattered light. This may occur with
very large solar zenith angles and with incoming light scattered by diffuse c i r rus
cloud surfaces. But in the case of a low stratiform cloud surface, which consists
primarily of water droplets, reflection becomes by far the most important par t of
the short-wave radiation received by the satellite. Because of this we have found
i t useful to introduce another angle, w , the specular angle. This is the angle between
the radiometer axis and the specular reflection axis (Fig. 1). The specular angle
is found from
cos w =
Since the maximum albedo, at least from a stratiform cloud surface, is assumed
to coincide with the specular reEectia &s, it beccrr,es nhuin~: that t h i s angle
has a significant physical meaning.
the specular reflection axis in all directions, the specular angle would be the only
independent variable. This is not plausible; i t is more likely that the albedo is
determined by a more complicated function of solar zenith angle, satellite zenith
angle, and the relative azimuth. W e will therefore only assume that the specular
angle w is a relatively good first approximation for the expression of this angular
dependence, at least for small values of w .
cos 5, cos 5, + sin 5, sin 5, cos (180" - Acr) ( 2 )
If this maximum decreased uniformly out from
In the case of an alternating mode (Fig. l), where the two sensors look a t
the ear th f rom quite different directions, it is convenient to express the angular
dependence with the specular angle for one of the sensors and with the backscattering
angle for the other. The reason for this is the existence of a small backward scattered
maximum in the direction towards the sun, and another advantage is that the variation
iri both angles is kept within relatively low values.

4
3. Results of Dual Measurements by Floor and Wall Sensors During Two TIROS IV
Orbits.
When the TIROS satell i te 's spin axis i s oriented approximately parallel to
the ear th 's surface, the floor and the wall sensors scan the earth alternately. The wall sensor may scan an area first; then about three o r four minutes later the floor
sensor will scan approximately the same area. The overlapping area increases
with a decreasing angle between the primary lines and the TSP track.
The orbits used in this study a r e nos. 143 and 200 of TIROS IV on 18 and
22 February 1962, respectively: and the geographical area covered is a portion of
the Atlantic Ocean and West Africa, limited by 30W to SOW and SOON to 15ON. The
data are presented on sigma-t printout sheets produced by the Fujita scanning printer
(Fujita, 1964). Longitude and latitude lines, as well as coastlines and other landmarks,
are transferred to the printout sheets. Because of the conical scan geometry used
in TIROS, the distortion of the grid lines will be in opposite directions for the floor
and the wall sensors. This may cause confusion to the reader , who may prefer
to see the data transferred to a standard map projection. On the other hand, this
manner of presentation shows more clearly the many difficulties and uncertainties
involved in the interpretation of the data, which may be effected by limb darkening
space contamination, scan- spot size, etc.
Both nf t h e analyzed orbits had useable photographs of the area of interest .
These have been utilized in constructing the cloud composite char ts in Figs . 2 and
11. The pictures have been transferred to the same kind of distorted map that
was used for the floor sensor radiation data, because the floor sensor 's principal
l ines and t5e optical principal lines nearly coincide. The high tilt made it ra ther
difficult to construct a complete cloud chart from the pictures alone; in the uncertain
areas, however, the available synoptic data combined with the radiation data have
been used to complete the cloud charts. These areas have been singled out by
hatching.
The pictures alone do not enable us to distinguish clearly between the different
cloud types, but when combined with the synoptic data they give a fairly good idea about the clouds in question. The analyzed Channel 2 radiation data give additional
information about the cloud heights, and can be used to confirm what h a s been learned
from the two other sources. Using this method it was found that the clouds in the

5
areas indicated by A, B, C, in orbit 200 (Fig. 2) consisted of low stratiform clouds,
while those in the areas indicated by D and E w e r e altostratus or altocumulus, and
cirrostratus, respectively. In orbit 143 (Fig. 11) the clouds in the areas indicated
by F , G, and H all consisted of low stratiform clouds. Figures 3 and 4 show the albedo, A, in percentage, obtained in orbit 200 from
the wall and the floor sensors, respectively. The values have not been corrected
for sensor degradation, because the correction that could be obtained would be rather
uncertain, and also because w e were mainly interested in the relative values between
the wall and floor sensor. However, the readings have been corrected for 20% space
contamination, and the values farther out towards the apparent horizon and beyond
have been discarded. Isolines for specular angles and backscattering angles have
been drawn on the wall and the floor sensor charts, respectively.
indicated by capital letters are outlined in both maps; these areas are seen to coincide
with those of maximum albedo.
The cloudy areas
Figures 5 and 6 show the effective radiant emittances, w , obtained in the same orbit from the wall and the floor sensor respectively. These values have been
corrected for sensor degradation, but not for water vapor, ozone, limb darkening,
etc. The readings in the cloudy areas A, B, and C indicate ra ther small differences
from the virtually clear areas in the sea, while the readings in the areas D and E
are significantly lower. The c i r rus area E gives a minimum energy value of 18 watts m-2
in both sensors, which corresponds to a temperature of approximately -25C. Tine
soundings from the area indicate a cirrus temperature of -45C, which means that the
energy coming to the satellite is strongly influenced by the background radiation.
Figures 12 and 13 show the albedo values obtained in orbit 143 f rom the wall The explanations of Figs. 3 and 4, orbit and from the floor sensors, respectively.
200, are more o r less valid for these figures also.
4 . Use of Effective Psuedo-radiant Emittance in Determining Cloud Albedo Excluding
Background Albedo.
As the composite cloud charts in Figs. 2 and 11 indicate, the cloud covers investigated are not all solid, but instead are broken or scattered. The albedo A
measured by Channel 3 f rom many of the areas therefore must have originated partly f rom the clouds and partly from the background. In order to eliminate the effect

6
.
0'
of the background albedo we will make use of EQ. (3) which was derived from Eqs. (11)
and (13) of Fujita and Grandoso (1966). Thus,
where A, i s the cloud albedo, p is a coefficient varying between 0 and 1 .0 depending
upon the type and thickness of the cloud, and is equivalent to p in Fujita and Grandoso;
Ab is the background albedo, Bb is the effective background radiant emittance,
and B, is the effective cloud radiant emittance.
is defined as the effective pseudo-radiant emittance; this is found to be a useful
quantity in determining the type of clouds. It can immediately be seen that the value
of iF increases with increasing cloud heights, and i t also increases with decreasing
cloud thickness and increasing cloud diffuseness. From Eq. (3) the cloud albedo
can be found, if p, A b , Bb, and B, are known. In this particular case we are mainly interested in the albedo from low stratiform clouds over a water surface.
In the case of low, relatively thick stratus clouds p is expected to be approximately
equal to 1 and the background albedo from water A, is assumed to equal 0.01 at
least when the solar zenith angle is less than 60°. If we take the rat io between the
cloud albedo for the wall sensor and that for the floor sensor under these conditions,
we obtain - FL 7T -WL ( 4 )
AWL AFL lT - = -
This means that we only have to compute ? for both floor and wall sensors in order
to obtain the ratio between the cloud albedo coming to the two sensors . In order
to compute we must know the background albedo Ab and the effective background
radiant emittance Bb . In Figs. 7 and 8 the background albedo A b for both sensors
in orbi t 200 has been estimated. The water albedo has been assumed to be 0.01, which is plausible, as long as the solar zenith angle stays below 609 The Sahara
Deser t , which is indicated by stippling on the chart, gives a very high background
albedo A b , which more or less coincides with the actual albedo A because the area is apparently cloudless. In Figs. 9 and 10 the effective background radiant emittances
have been estimated for both wall and floor sensor in orbit 200. The effective radiant
l
I I
emittance from water is close to 35 watts m-' for the main par t of the area, except I

7
near the horizon where the l imb darkening effect occurs. It may also be noted that
the Sahara Desert is relatively cold compared to its surroundings; this is due to
the early t ime of day and the high reflectance from the sand. F rom the maps in
Figs . 3, 5, 7, and 9, and from the maps in Figs. 4 , 6, 8, and 10, we are able to compute ?? for wall sensor and floor sensor in orbit 200, respectively.
5. Discussion of Anisotropic Albedo Obtained.
The resul ts of the 7 computations are shown in Figs. 14 and 15 for orbit
200 and in Figs. 16 and 17 for orbit 143. The values of TI- in the stratus cloud areas
A, B, and C in Figs. 14 and 15 are relatively low and uniform for both sensors;
moreover, the values of FWLseem to be mainly a little lower than those of F? The values of 77 in the cirrus area are high in both sensors, but relatively the FFL values are almost twice as large as those of FWL. The stratocumulus cloud cover
at D shows values of about three times as high in the floor sensor as in the wall
sensor. This latter may be caused by several things; the satellite zenith angle for
the wall sensor is above 70' in this area, which makes the computation of 7 uncertain
because of limb darkening, scanspot size, etc. ; furthermore the relative azimuth
is close to 180' in the area and the specular angle is small, around 20'. In Figs.
16 and 17 the Ti values for wall and floor sensors in orbit 143 are presented. These
va!r;zs are cmsistently a little lnwer than those from the s t ra tus area in orbit 200;
this is mainly due to higher albedo but partly due to lower cloud heights.
To find the angular dependence of the albedo we have used Eq. (4) for the
areas covered with low stratiform clouds over water. The areas of c i r rus and alto-
cumulus have been excluded, primarily because we do not know the value of p for
these clouds. The resul ts of these computations are shown in Figs. 18 and 19.
The ratio A t L / A F (between the cloud albedo obtained by the wall sensor and the
cloud albedo obtained by the floor sensor) has been plotted as a function of the specular
angle uWLfor the wall sensor, and the backscattering angle q F f o r the floor sensor.
The number in each square is an average over a loo interval, for both angles; the number
in parentheses indicates how many values were averaged.
In orbit 200 the backscattering angles qbFL remain almost constant between 10' and 20°, while the specular angles uwL vary from 40' down to almost 0'. The ratio
ATL/AFL the ra t io increases graduaily for iowei- values of aWL ; it reaches a maximum of
should then be primarily a function of the specular angle. As can be seen,

8
1 . 5 5 when the specular angle is between Oo and loo. In orbit 143 both the backscattering
angle and the specular angle vary between 10Oand 70°. As in orbit 200, the ratio
ATL/AFLincreases as the specular angle decreases, and it a lso increases as the
backscattering angle decreases. In the regions of loo to 20° backscattering angle,
and of 40° to 70' specular angle, the ratio is close to 1 which should indicate isotropic conditions.
6. Conclusions.
Evidence of anisotropy in the albedo from low stratiform clouds seems obvious
from the resul ts obtained in the two orbits. Since these clouds consist mainly of
water droplets, reflection is by far the most important par t of the short-wave radiation
measured by the satellite. The specular angle w , which is a measure of the deviation
from the specular reflection axis, seems .to be an important and convenient parameter
to express this dependence, even though we believe the exact relationship to be a more
complicated function of the solar zenith angle, satellite zenith angle, and relative azimuth.
The resul ts obtained do not allow many generalizations, because of the small sample
of data, but it seems evident that the anisotropy becomes more and more significant
as the specular angle w decreases. The orbit 143 data seem to suggest nearly isotropic
conditions when the specular angle wWLexceeds 40°- 50°, but this certainly has to be
substantiated by further rese~rch The backward scattering or reflecting maximum
towards the sun seems also to be a reality, since the ratio A y / A r L increases with
decreasing backscattering angles *EL .
anisotropy in the albedo. Investigation of these clouds i s , however, more complex,
as their coefficient 0 is less than 1, and as their tops consist mainly of ice crystals
which may scatter the light more than they reflect it.
The data f rom c i r rus and altocumulus areas in orbit 200 also suggest a strong
ACKNOWLEDGEMENTS
The author wishes to thank Dr. Fujita for his valuable advice and
suggestions offered during the course of this research.

9
REFERENCES
Bartinan, F. L., L. W. Chaney, P. A. Titus, and M. G. Whybra, 1964: Infrared and visible radiation measurements by radiometer and interferometer on
high altitude balloon flights at 34-km altitude. High Altitude Engineering
Laboratory, Univ. of Michigan, 16 pp.
Deirmendjian, D., 1962: Scattering and polarization properties of polydispersed
suspensions with partial absorbtion. The Rand Corporation, Santa Monica,
California, Memorandum RM-3228-PR, 34 pp.
Fujita, T. , 1963b: Outline of a theory and examples for precise analysis of satellite
radiation data. Mesomet. Project Res. Paper, No. 15, Univ. of Chicago,
35 pp.
, 1964: The scanning printer and its application to detailed analysis of satellite
radiation data. SMRP Res. Paper No. 34, Univ. of Chicago.
, and H. Grandoso, 1966: A proposed method of estimating cloud-top temperature,
cloud covers, and emissivity and whiteness of clouds from short- and long-
wave radiation data obtained by TIROS scanning radiometers. SMRP Research
Paper No. 48, Univ. of Chicago.
Larsen, S. H. H. , T. Fujita, W. L. Fletcher, 1963: TIROS I11 measurements of
terrestr ia l radiation and reflected and scattered solar radiation. Mesomet.
Project Res. Paper No. 20, Univ. of Chicago, 11 pp.
Waldram, J. M., 1945: Measurement of the photometric properties of the upper
atmosphere. Quart., J. R. meteor. SOC., 71, 319-336.
Wiezee, W., and P. A. Davis, 1965: Evidence of the dependence of reflected solar
radiation on viewing geometry in a TIROS IV radiation data sample. Journal
of Appl. Meteorology, Volume4, No. 5, 637-639.

Fig. 1. Schematic view of the satell i te scanning the s a m e spot on the
e a r t h f rom two different positions. The specular angle, wWL, and
the backscattering angle, $:, a r e indicated by heavy lines.
CLOUD COMPOSITE CHART ORBIT 200. 22 FEE 1962
Fig. 2. Composite cloud chart f rom Orbit 200, TIROS IV, 22 February 1962. The clouds in the
a r e a s indicated by A, B, and C consist of low stratiform clouds, whereas the clouds in the areas D and E consist of altocumulus and cirrostratus, respectively.

11
ALBEDO A(%) TIROS IV ORBIT 200 CHANNEL 3 WALL 1131 - 1136GMT, 22 FEB 1962
- I
ALBEDO A(%) TIROS IV ORBIT 200 CHANNEL 3 FLOOR 1136-1141 GMT, 22 FEB 1962
Fig. 4. Patterns of Channel 3, albedo A (Yd received by the Zsor sciiscr &ring Orbit 200, n R O S IV, 22 February 1962. Isolines for the backscattering angle, +:, a r e indicated by dashed lines.

EFFECTIVE RADIANT EMITTANCE (watts mZ)
TIROS IV ORBIT 2 0 0 CHANNEL 2 WALL 1131-1136GMT, 22FEB 1962
Fig. 5. Patterns of Channel 2 ( 8 - 1 2 ~ ) effective radiant emittance % (watts m-') received by the wall sensor during Orbit 200, n R O S IV, 22 February 1962. Longitude and latitude lines are drawn for every 10' interval and the coastlines are indicated by heavy lines.
EFFECTIVE RADIANT EMITTANCE (watts miz) TIROS IV ORBIT 200 CHANNEL 2 FLOOR 1136-1141 GMT, 22 FEE 1962
- Fig. 6. Patterns of Channel 2 effective iadiaiii eiiiitts-.ce W (\ratts m-' received by the floor sensor
during Orbit 200, floor sensor, TIROS IV, 22 February 1962.

/ -
ESTIMATED BACKGRWND ALBEDO Ab (%) TIROS IV ORBIT 200 WALL 1131-1136GMT, 22 FEE 1962
Fig. 7. Patterns of estimated background albedo A,(%) for the wall sensor, Orbit 200, TIROS TV, 22 February 1962. The stippled area represents the Sahara Desert.
ESTIMATED BACKGROUND ALBEDO Ab(%)
TlROS IV ORBIT200 FLOOR 1136-1141 GMT, 22 FEE 1962
Flg. 8. Fatrerns of zs~iriatec! hackgrniind albedo A,, (%) for the floor sensor, Orbit 200, TIROS TV, 22 February 1962.

14
ESTIMATED BACKGROUND RADIANT EMITTANCE B,(watts m3 TIROS IV ORBIT 200 WALL ll3l-I136GMT, 22 FEE 1962
i
Fig. 9 . Patterns of estimated effective.background radiant emittance gb (watts m-') for the wall sensor,
Orbit 200, 22 February 1962. The stippled area represents the Sahara Desert.
I I
ESTIMATED BACKGRWM) RADIANT EMITTANCE (watts ni9 TlROS I V ORBIT 200 FLOOR 1136- 1141 GMT, 22 FEB 1962
Fig. 10. Patterns of estimated effective background radiant emittance &(watts m-2) for the floor sensor, Orbit 200, TIROS IV, 22 February 1962.

15
ORBIT 143, 18 FEE 1962 \
Fig. 11. Composite cloud chart from Orbit 143, TIROS IV, 18 February 1962. The clouds in the areas indicated by F , G, and H consist mainly in low stratiform clouds.
ALBEDO A N ) TIROS IV ORBIT 143 CHANNEL3 WALL 1211-1216GMT, 18 FEE 1962
Fig. 12. Wrter~s of Channel 3 albedo A (g received by the wall sensor during Orbit 143, TIROS IV,
18 February 1962. Isolines for the specular angle urnare indicated by dashed lines.

16
TlROS IV ORBIT 143 CHANNEL 3 FLOOR 1214-1219GMT. 18 FEE 1962
I Fig. 13. Patterns of Channel 3 albedo A (a received by the floor sensor during Orbit 143, TIROS IV,
18 February 1962. Isolines for the backscattering angles $pare indicated by dashed lines.
I
EFFECTIVE PSEUDO RADIANT EMITTANCE zm TlROS IV ORBIT 200 WALL 2 2 FEE 1962
Figg; 14. Computed effective pseudo-radiant emittance Fwcof the cloudy areas indicated by A, B, C,
D, and E for the wall sensor, Orbit 200, TIROS W, 22 February 1962.

17
2-*
EFFECTIVE PSEUDO RADIANT EMITTANCE zFL TIROS I V ORBIT 2 0 0 FLOOR 22 FEB 1962
:ig. 15. Computed effechve pseudo-radiant emittance %"of the cloudy areas indicated by A, B, C, D, and E for the floor sensor, Orbit 200, TIROS N, 22 February 1962.
EFFECTIVE PSEUDO RADIANT EMITTANCE %" TIROS IV ORBIT 143 WALL 18 FEE 1962
l=i&. 16. Cer!?puted effective pseudo-radiant emittance 5"of the cloudy a r e a s indicated by F, G, and H
for the wall sensor, Orbit 143, TIROS IV, 18 February 1962.

. 18
.
18 FEB 1962
Fig. 17. Computed effective pseudo-radiant emittance TFL of the cloudy a r e a s indicated by F, G, and
H f o r the floor sensor , Orbit 143, TIROS IV, 18 February 1962.
t g?AF FROM ORBIT 200 TIROS IV, 22 FEB 1962
Fig. 18. 'IXe ratio, AY'/A:' between the cloud albedo to the wall sensor
and the cloud albedo to the floor sensor a s a function of the specular
angle of the wall sensor, wwL, and the backscattering angie of tile
floor sensor , I+:. TIROS IV, Orbit 200, 22 February 1962.

c
+ &A: FROM ORBIT 143 TIROS IV. 18 FEE 1962 .
Fig. 19. The ratio, AF/AFL, plotted as a function of the specular angle cPL and the backscattering angle $rbm . TIROS IV, Orbit 143,
18 February 1962.

MESOMETEOROLOGY PROJECT - - - RESEARCH PAPERS
(Continued from front cover)
c
mb
42. A Study of Factors Contributing to Dissipation of Energy in a Developing Cumulonimbus - Rodger A. Brown and Tetsuya Fujita
43. A Program fo r Computer Gridding of Satellite Photographs for Mesoscale Research - William D. Bonner
44. Comparison of Grassland Surface Temperatures Measured by TIROS VI1 and Airborne Radiometers under Clear Sky and Cirr i form Cloud Conditions - Ronald M. Reap
45. Death Valley Temperature Analysis Utilizing Nimbus I Infrared Data and Ground- Based Measurements - Ronald M. Reap and Tetsuya Fujita
t 46. On the "Thunderstorm-High Controversy" - Rodger A. Brown
47. Application of Precise Fujita Method on Nimbus I Photo Gridding - Lt. Cma. Ruben Nasta
48. A Proposed Method of Estimating Cloud-top Temperature, Cloud Cover, and Emissivity and Whiteness of Clouds from Short- and Long-wave Radiation Data Obtained by TIROS Scanning Radiometers - T. Fujita and H. Grandoso
49. Aerial Survey of the Palm Sunday Tornadoes of April 11, 1965 - Tetsuya Fujita
50. Early Stage of Tornado Development as Revealed by Satellite Photographs - Tetsuya Fujita
Si . Featuies aiid Mc?tions of Radar Echoes on Palm Sunday, 1965 - D. L. Bradbury and Tetsuya Fujita
52. Stability and Differential Advection Associated with Tornado Development - Tetsuya Fujita and Dorothy L. Bradbury
53. Estimated Wind Speeds of the Palm Sunday Tornadoes - Tetsuya Fujita
54. On the Determination of Exchange Coefficients: Part I1 - Rotating and Nonrotating Convective Currents - Rodger A. Brown
55. Satellite Meteorological Study of Evaporation and Cloud Formation over the Western Pacific under the Influence of the Winter Monsoon - K. Tsuchiya and T. Fujita
56. A Proposed Mechanism of Snowstorm Mesojet over Japan under the Influence of the Winter Monsoon - T. Fujita and K. Tsuchiya
57. Some Effects of Lake Michigan upon Squall Lines and Summertime Convection - Walter A. Lyons