Embed Size (px)
Citation preview

Department of Fisheries and Department of Fisheries and Department of Fisheries and Department of Fisheries and Marine ResourcesMarine ResourcesMarine ResourcesMarine Resources
2008200820082008 Water Sampling Pilot StudyWater Sampling Pilot StudyWater Sampling Pilot StudyWater Sampling Pilot Study
Part of the AnguillaPart of the AnguillaPart of the AnguillaPart of the Anguilla Marine Monitoring Programme Marine Monitoring Programme Marine Monitoring Programme Marine Monitoring Programme

2
Note: The conclusions and recommendations of this report are solely the opinions of the author and other contributors and do not constitute a statement of policy, decision, or position on behalf of the Government of Anguilla. Citation: Wynne S. (2009). 2008
Water Sampling Pilot Study. Produced by the Department of Fisheries and Marine Resources for the Government of Anguilla. Copies
can be obtained by contacting [email protected]

3
1. INTRODUCTION Marine habitats and communities are intrinsically linked, if not defined, by the water chemistry that exists around them. For example, coral reefs have historically thrived in oligotrophic water, lacking nutrients that can allow algae to flourish and out-compete recruiting corals (Szmant, 2002). Similarly, the clarity of the water, a more physical characteristic often referred to as turbidity, affects light penetration that will influence photosynthesis in both coral zooxanthellae and seagrasses (AIMS, 2008). Furthermore, parameters such as temperature influence not just water chemistry, but also biological life directly: with the potential to initiate coral bleaching events or alter fish migratory patterns (Fitt et al., 2001; Hannesson, 2007). In fact changes to any variable will have a knock on effect to the present ecosystem balance in one way or another. Thus monitoring such parameters is of utmost importance to help understand potential reasons for any observed ecological changes. Ocean chemistry is however complex and many parameters require sophisticated technology to accurately measure them. With this being the case, the Department of Fisheries and Marine Resources (DFMR) set out to conduct a pilot study that would assess: The viability of collecting such data; the practicality and accuracy of measuring different parameters with the resources available; and potential site selection for long-term data collection.
2. METHODS Although for this study the TSG Technologies (Anguilla) lab was used for the much of the analysis work, the ultimate aim is to utilise the Government of Anguilla’s Water Lab at the Department of Health Protection. This lab recently relocated and is as such still under construction. It is anticipated that continued annual sampling work to be designed based on the results of this pilot study will be able to make use of this lab. Equipment used:
• Transportation – Boat and/or pickup depending on sample site location.
• Multiparameter research meter.
• Clipboard, paper and pens to record data in field.
• SCUBA equipment to collect deep samples and sediment.
• Sample bottles to collect samples.
• Coolers to store collected samples.
• Saltwater sampling kit.
• TSG laboratory and technician.

4
Methodology: Sample sites were spread around the coast of Anguilla so to not leave any areas unrepresented. Some areas of specific interest had multiple sites to allow for mesoscale spatial variations (i.e. Road Bay). Ultimately seventy five sites were selected to be part of this pilot study, details of which can be found in Appendix 1. Some of these sites had were sampled at different depths due to the presence of a thermocline, thus approximately eighty data points were collected during each replicate. Other sites were located around the offshore cays and reefs, with further sites a good distance away from land sampled to act as controls, (although it is recognised that they were not in fact true controls as contamination is always possible due to the dynamic nature of oceans). The multiparameter research meter must be able to measure a minimum of temperature, pH and dissolved oxygen as these tests must be performed as soon as possible. Other parameters (nitrates, dissolved solids etc) can be conducted within 48 hours of the sample being collected, and could therefore be measured in the lab. Sampling was finally ready to begin at the beginning of September 2008. Initially three replicates were aimed to be conducted at each sampling site, with at least two sediment replicates. However because of logistical problems (DFMR vessel needing repairs), and because of interference by hurricane Omar, the number of replicates was somewhat reduced (most water samples were replicated twice and most sediment samples replicated once). Hurricane Omar did however provide an interesting case study of how storm surges affect coastal water quality, and this will be discussed in section 4. One member of staff was responsible for operation of the meter and data recording, while the other was responsible for collecting samples in sample bottles and labelling them correctly. The meter probes were submerged deeper than 30cm below the surface to avoid surface contamination, and not in areas where waves had churned up the sediment. Thus staff had to wade out into the water when collecting coastal samples. Water samples collected in bottles followed these rules also. Care was taken to avoid contamination from bathers when collecting coastal samples, or from the boat engine when collecting offshore samples. So for example samples were taken at least 30m away from bathers and off the bow of the boat to avoid engine contamination. In offshore areas deep enough to possess a thermocline, a deep water sample close to the sea bed was also collected. When collecting this a secondary sample was also obtained for use with the probes once back on the surface. The purchase of a Niskin bottle was considered to collect these samples, but as only a small number of deep water sites were incorporated into this study, and because none were below safe diving limits, the use of SCUBA equipment was adequate. Plastic sample jars were used while collecting these samples to allow for compression with depth, thus facilitating lid removal while at depth. If a glass jar were to be used the lid would be very difficult to remove and suck-back likely occur which might injure fingers. Once water samples were collected and bottles/jars correctly labelled they were placed into coolers to restrict warming. Once sampling had been completed for the day (the number of samples taken per day was based on TSG’s workload, but usually numbered 14 or 28 – only 14 samples at a time could be centrifuged) the coolers were taken to TSG’s lab, and test results emailed the following day.
5
Most of the sites with suitable bottom composition also had a sediment sample taken. The purchase of a sediment scoop was considered to allow these samples to be collected from the surface, however because bottom composition was often that with scattered patches of sediment among predominantly hard substrate, the use of SCUBA equipment and a plastic jar was considered more appropriate. Once at the bottom the surface layer of sand/sediment was brushed aside (1-2cm) and the underneath layer collected in the container. Once back at the lab the sample was drained of liquid and this liquid was then tested in the same way as water samples. Thus the results for sediment samples are not a true description of the sediments make up, but do give an indication of its content. For example, although phosphorous may be in low quantities, this likely means there is quite a high level of it in the sediment. If phosphorous levels are however below detectable levels (BDL), then it can be concluded that negligible amounts are present in the sediment. For detailed descriptions of the methodologies used by the TSG lab to run tests please contact [email protected]. All meters and other electronic equipment used in the lab were HACH. Parameters tested for were: Conductivity, total dissolved solids, ammonia, nitrates, phosphorous, chemical oxygen demand and turbidity. Other parameters were also tested by DFMR on a random selection of samples using the salt water testing kit. Parameters tested were: Hardness, nitrites, alkalinity and dissolved CO2. For detailed descriptions of the methodologies used please contact [email protected]. The validity of these tests and their use will be covered in section 4. Note: An error was noticed in the chemical oxygen demand test, and so all data relating to this variable collected prior to September 24th 2008 was discarded during analysis. This also contributed to the reduced replicate number mentioned at the beginning of this section.
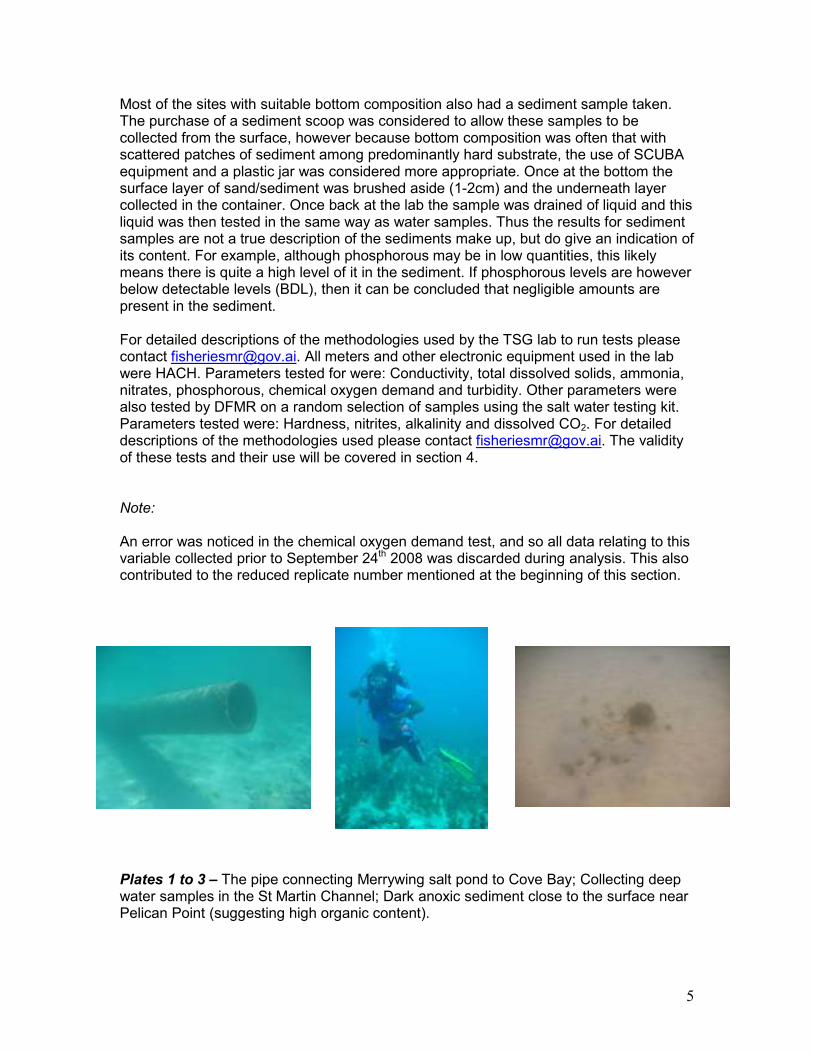
Plates 1 to 3 – The pipe connecting Merrywing salt pond to Cove Bay; Collecting deep water samples in the St Martin Channel; Dark anoxic sediment close to the surface near Pelican Point (suggesting high organic content).
6
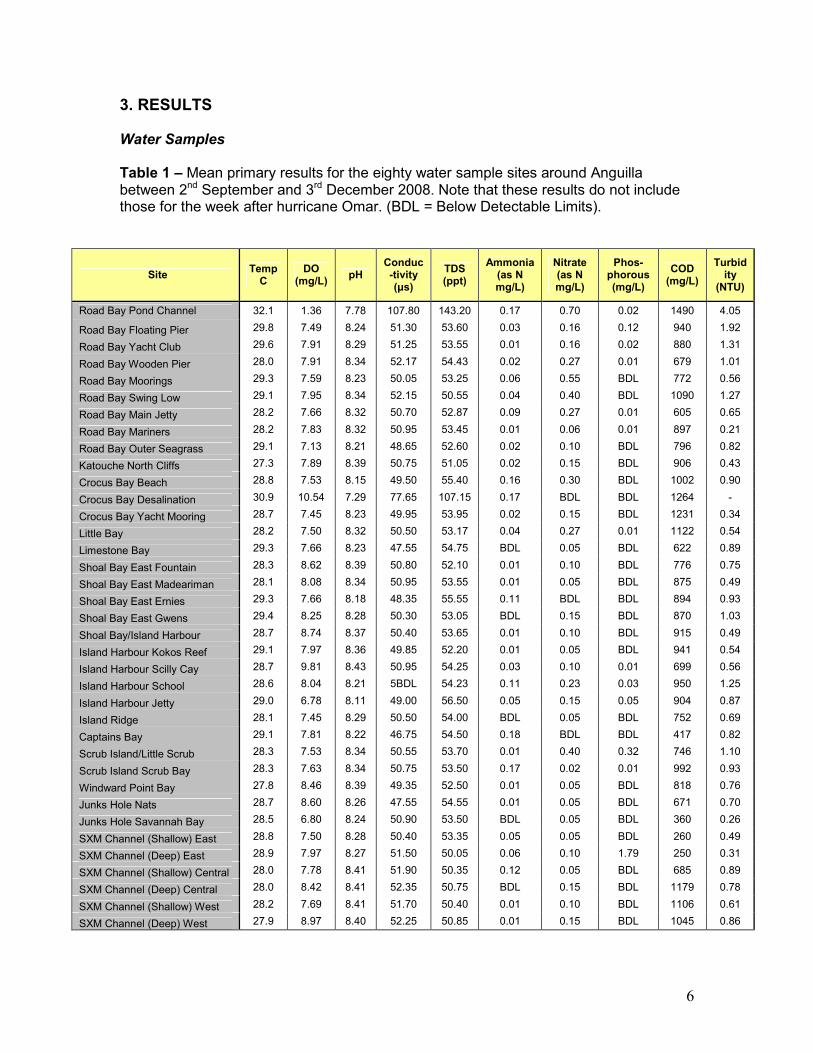
3. RESULTS Water Samples Table 1 – Mean primary results for the eighty water sample sites around Anguilla between 2nd September and 3rd December 2008. Note that these results do not include those for the week after hurricane Omar. (BDL = Below Detectable Limits).
Site Temp C
DO (mg/L)
pH Conduc-tivity (µs)
TDS (ppt)
Ammonia (as N mg/L)
Nitrate (as N mg/L)
Phos-phorous (mg/L)
COD (mg/L)
Turbidity
(NTU)
Road Bay Pond Channel 32.1 1.36 7.78 107.80 143.20 0.17 0.70 0.02 1490 4.05
Road Bay Floating Pier 29.8 7.49 8.24 51.30 53.60 0.03 0.16 0.12 940 1.92
Road Bay Yacht Club 29.6 7.91 8.29 51.25 53.55 0.01 0.16 0.02 880 1.31
Road Bay Wooden Pier 28.0 7.91 8.34 52.17 54.43 0.02 0.27 0.01 679 1.01
Road Bay Moorings 29.3 7.59 8.23 50.05 53.25 0.06 0.55 BDL 772 0.56
Road Bay Swing Low 29.1 7.95 8.34 52.15 50.55 0.04 0.40 BDL 1090 1.27
Road Bay Main Jetty 28.2 7.66 8.32 50.70 52.87 0.09 0.27 0.01 605 0.65
Road Bay Mariners 28.2 7.83 8.32 50.95 53.45 0.01 0.06 0.01 897 0.21
Road Bay Outer Seagrass 29.1 7.13 8.21 48.65 52.60 0.02 0.10 BDL 796 0.82
Katouche North Cliffs 27.3 7.89 8.39 50.75 51.05 0.02 0.15 BDL 906 0.43
Crocus Bay Beach 28.8 7.53 8.15 49.50 55.40 0.16 0.30 BDL 1002 0.90
Crocus Bay Desalination 30.9 10.54 7.29 77.65 107.15 0.17 BDL BDL 1264 -
Crocus Bay Yacht Mooring 28.7 7.45 8.23 49.95 53.95 0.02 0.15 BDL 1231 0.34
Little Bay 28.2 7.50 8.32 50.50 53.17 0.04 0.27 0.01 1122 0.54
Limestone Bay 29.3 7.66 8.23 47.55 54.75 BDL 0.05 BDL 622 0.89
Shoal Bay East Fountain 28.3 8.62 8.39 50.80 52.10 0.01 0.10 BDL 776 0.75
Shoal Bay East Madeariman 28.1 8.08 8.34 50.95 53.55 0.01 0.05 BDL 875 0.49
Shoal Bay East Ernies 29.3 7.66 8.18 48.35 55.55 0.11 BDL BDL 894 0.93
Shoal Bay East Gwens 29.4 8.25 8.28 50.30 53.05 BDL 0.15 BDL 870 1.03
Shoal Bay/Island Harbour 28.7 8.74 8.37 50.40 53.65 0.01 0.10 BDL 915 0.49
Island Harbour Kokos Reef 29.1 7.97 8.36 49.85 52.20 0.01 0.05 BDL 941 0.54
Island Harbour Scilly Cay 28.7 9.81 8.43 50.95 54.25 0.03 0.10 0.01 699 0.56
Island Harbour School 28.6 8.04 8.21 5BDL 54.23 0.11 0.23 0.03 950 1.25
Island Harbour Jetty 29.0 6.78 8.11 49.00 56.50 0.05 0.15 0.05 904 0.87
Island Ridge 28.1 7.45 8.29 50.50 54.00 BDL 0.05 BDL 752 0.69
Captains Bay 29.1 7.81 8.22 46.75 54.50 0.18 BDL BDL 417 0.82
Scrub Island/Little Scrub 28.3 7.53 8.34 50.55 53.70 0.01 0.40 0.32 746 1.10
Scrub Island Scrub Bay 28.3 7.63 8.34 50.75 53.50 0.17 0.02 0.01 992 0.93
Windward Point Bay 27.8 8.46 8.39 49.35 52.50 0.01 0.05 BDL 818 0.76
Junks Hole Nats 28.7 8.60 8.26 47.55 54.55 0.01 0.05 BDL 671 0.70
Junks Hole Savannah Bay 28.5 6.80 8.24 50.90 53.50 BDL 0.05 BDL 360 0.26
SXM Channel (Shallow) East 28.8 7.50 8.28 50.40 53.35 0.05 0.05 BDL 260 0.49
SXM Channel (Deep) East 28.9 7.97 8.27 51.50 50.05 0.06 0.10 1.79 250 0.31
SXM Channel (Shallow) Central 28.0 7.78 8.41 51.90 50.35 0.12 0.05 BDL 685 0.89
SXM Channel (Deep) Central 28.0 8.42 8.41 52.35 50.75 BDL 0.15 BDL 1179 0.78
SXM Channel (Shallow) West 28.2 7.69 8.41 51.70 50.40 0.01 0.10 BDL 1106 0.61
SXM Channel (Deep) West 27.9 8.97 8.40 52.25 50.85 0.01 0.15 BDL 1045 0.86

7
Table 1 (continued…)
Site Temp C
DO (mg/L)
pH Conduc-tivity (µs)
TDS (ppt)
Ammonia (as N mg/L)
Nitrate (as N mg/L)
Phos-phorous (mg/L)
COD (mg/L)
Turbidity
(NTU)
Sile Bay 29.0 8.75 8.29 51.35 52.40 0.01 0.20 BDL 195 0.26
Sea Feathers Bay 28.7 7.66 8.22 47.60 55.30 BDL BDL BDL 541 0.74
Conch Bay 28.8 7.17 8.28 50.75 53.45 BDL 0.10 BDL 380 0.16
Forest Bay Seagrass 29.2 7.78 8.26 50.45 53.50 0.01 0.10 BDL 730 0.69
Forest Bay Reef Channel 28.9 6.63 8.23 51.75 52.95 0.01 0.20 BDL 259 0.31
Corito Bay Buoys 29.1 7.38 8.26 51.10 54.40 BDL 0.23 BDL 419 0.21
Corito Bay Beach 28.3 8.47 8.36 48.70 55.90 0.04 0.50 0.02 723 0.72
Little Harbour Beach 29.9 9.76 8.34 49.40 52.05 BDL 0.35 BDL 1650 1.02
Little Harbour Middle Bay 29.0 7.47 8.27 51.80 52.90 0.01 0.20 BDL 464 0.94
Little Harbour Inlet 28.8 7.76 8.26 50.55 53.35 BDL 0.15 0.21 400 1.43
Blowing Point Fishing Boats 28.2 7.92 8.30 51.23 52.80 0.03 0.33 0.05 614 0.90
Blowing Point Ferryboat Inn 29.2 7.79 8.28 51.30 52.85 0.02 0.15 BDL 620 0.75
Blowing Point Sandy Point 28.1 7.66 8.33 51.13 52.70 0.03 0.23 BDL 941 0.62
Rendezvous Bay Great House 30.0 7.63 8.27 50.70 53.45 0.07 0.25 BDL 810 1.88
Rendezvous Bay Yacht Club 28.6 8.72 8.36 51.03 52.80 0.03 0.40 BDL 848 0.65
Rendezvous Bay Merrywing 29.0 7.67 8.28 50.90 53.85 0.05 0.25 BDL 790 3.36
Temenos Pond - Pipe 29.5 6.47 8.21 51.90 53.60 0.05 0.30 BDL 1760 4.10
Cove Bay Pond Pipe Outlet 28.6 6.50 8.31 50.10 52.75 0.06 0.20 0.01 1241 0.69
Cove Bay Smokeys 28.4 7.97 8.26 50.35 53.30 0.02 0.15 BDL 880 0.72
Cove Bay Pier 28.1 8.76 8.42 51.00 52.53 0.01 0.17 BDL 682 0.81
Cove Bay Cap Jaluca Access 28.6 8.22 8.31 50.20 53.30 BDL 0.10 BDL 740 1.59
Maundays Bay Pimms 28.0 7.68 8.36 50.40 53.60 0.02 0.05 BDL 992 0.23
Maundays Bay Villa 19 29.2 7.75 8.30 5BDL 52.90 BDL 0.05 BDL 800 1.74
Shoal Bay West Altamar 28.4 8.01 8.27 50.10 52.70 0.01 0.30 0.08 760 0.70
Shoal Bay West Cove Castles 28.6 7.60 8.28 50.40 53.45 0.01 0.15 BDL 790 0.87
Blowing Rock 28.3 7.78 8.35 50.55 54.35 0.06 0.10 BDL 672 0.74
Anguillita 28.5 7.95 8.36 50.65 54.00 BDL 0.05 BDL 863 0.67
West End Bay 27.7 8.08 8.36 51.50 49.80 0.02 0.30 BDL 890 0.89
Barnes Bay Mangoes 29.3 7.93 8.32 50.65 53.45 0.01 0.20 BDL 790 1.07
Barnes Bay Viceroy Beach 28.8 7.79 8.30 51.35 53.90 BDL 0.25 BDL 1350 1.27
Meads Bay Viceroy Point 28.1 7.73 8.35 51.05 53.65 0.02 0.10 BDL 832 0.85
Meads Bay Viceroy Beach 28.9 7.88 8.30 50.35 53.10 0.05 0.15 BDL 1000 0.64
Meads Bay Central Bay 28.2 7.74 8.34 50.50 52.70 0.11 0.05 BDL 438 0.96
Meads Bay Malliouhana 29.3 7.83 8.30 51.20 53.50 0.03 0.25 BDL 960 0.33
Long Bay Offshore Regis 29.0 7.56 8.24 49.60 54.25 0.01 BDL BDL 742 0.55
Long Bay East Beach 28.7 8.26 8.31 50.95 53.60 0.03 0.10 BDL 670 0.72
Isaacs Cliffs 28.0 7.57 8.37 50.50 51.25 0.01 BDL 0.01 845 0.71
Sandy Island Moorings 28.8 7.23 8.23 49.30 54.10 0.01 0.10 BDL 819 0.67
Seal Island Channel (Shallow) 28.0 7.80 8.39 50.70 51.00 0.02 0.10 BDL 955 0.70
Seal Island Channel (Deep) 28.0 8.12 8.37 50.40 51.25 0.02 0.10 BDL 887 0.95
Dog Island 28.9 7.74 8.33 50.65 53.90 0.01 0.10 BDL 1121 1.10
Prickly Pear 29.0 8.24 8.34 50.20 53.05 0.06 0.15 0.93 918 0.77
Long Reef 28.7 8.16 8.33 49.80 53.65 0.03 0.05 BDL 931 0.31
Means 28.7 7.80 8.28 51.53 54.97 0.03 0.16 0.05 826 0.90
8
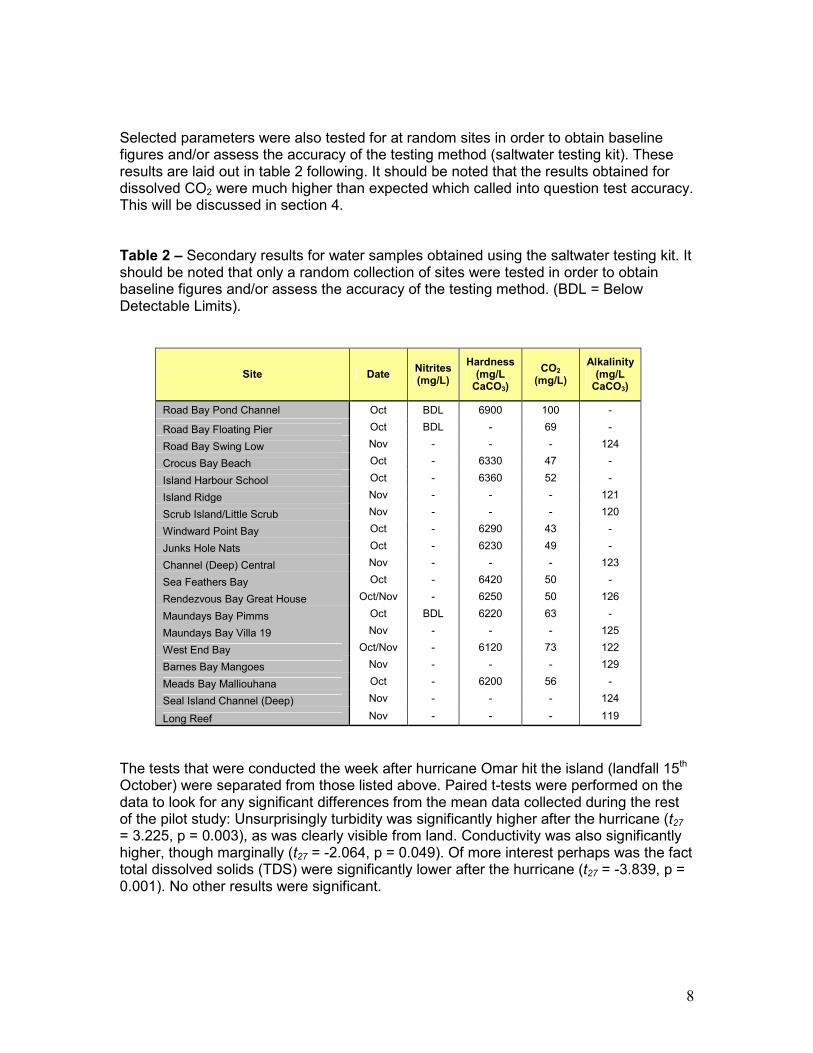
Selected parameters were also tested for at random sites in order to obtain baseline figures and/or assess the accuracy of the testing method (saltwater testing kit). These results are laid out in table 2 following. It should be noted that the results obtained for dissolved CO2 were much higher than expected which called into question test accuracy. This will be discussed in section 4. Table 2 – Secondary results for water samples obtained using the saltwater testing kit. It should be noted that only a random collection of sites were tested in order to obtain baseline figures and/or assess the accuracy of the testing method. (BDL = Below Detectable Limits).
Site Date Nitrites (mg/L)
Hardness (mg/L CaCO3)
CO2 (mg/L)
Alkalinity (mg/L CaCO3)
Road Bay Pond Channel Oct BDL 6900 100 -
Road Bay Floating Pier Oct BDL - 69 -
Road Bay Swing Low Nov - - - 124
Crocus Bay Beach Oct - 6330 47 -
Island Harbour School Oct - 6360 52 -
Island Ridge Nov - - - 121
Scrub Island/Little Scrub Nov - - - 120
Windward Point Bay Oct - 6290 43 -
Junks Hole Nats Oct - 6230 49 -
Channel (Deep) Central Nov - - - 123
Sea Feathers Bay Oct - 6420 50 -
Rendezvous Bay Great House Oct/Nov - 6250 50 126
Maundays Bay Pimms Oct BDL 6220 63 -
Maundays Bay Villa 19 Nov - - - 125
West End Bay Oct/Nov - 6120 73 122
Barnes Bay Mangoes Nov - - - 129
Meads Bay Malliouhana Oct - 6200 56 -
Seal Island Channel (Deep) Nov - - - 124
Long Reef Nov - - - 119
The tests that were conducted the week after hurricane Omar hit the island (landfall 15th October) were separated from those listed above. Paired t-tests were performed on the data to look for any significant differences from the mean data collected during the rest of the pilot study: Unsurprisingly turbidity was significantly higher after the hurricane (t27 = 3.225, p = 0.003), as was clearly visible from land. Conductivity was also significantly higher, though marginally (t27 = -2.064, p = 0.049). Of more interest perhaps was the fact total dissolved solids (TDS) were significantly lower after the hurricane (t27 = -3.839, p = 0.001). No other results were significant.

9
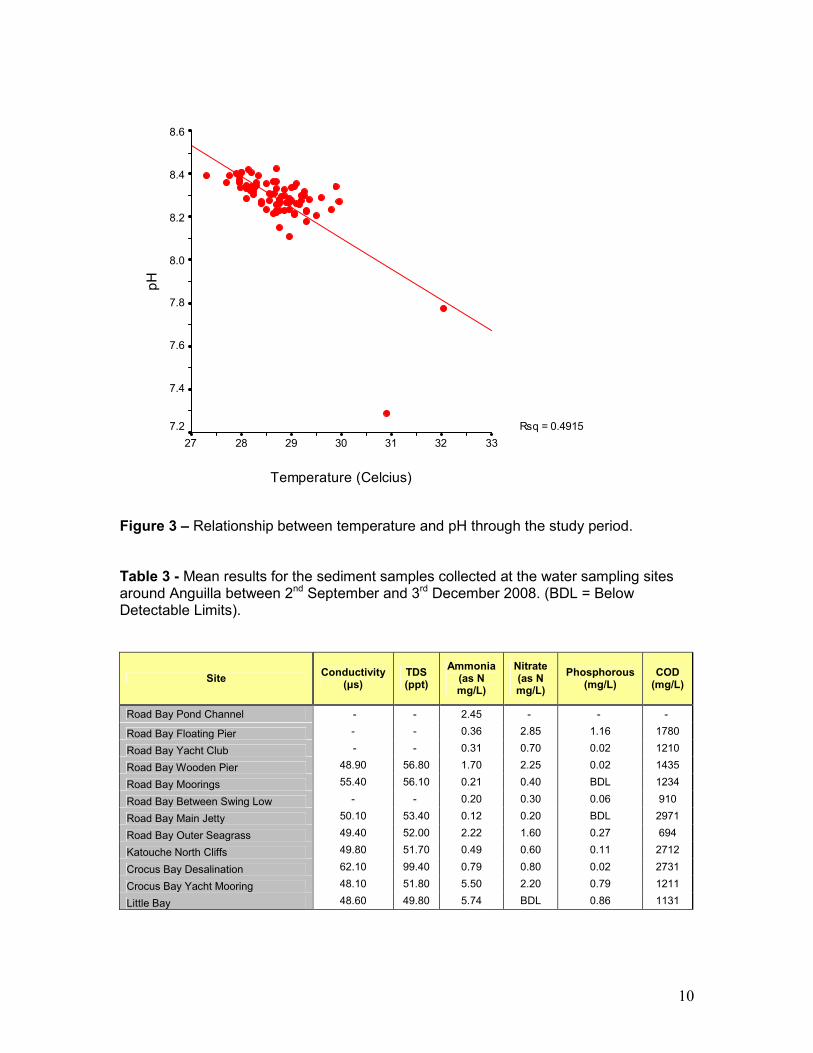
Another noticeable effect of hurricane Omar was the water cooling that happened directly afterwards. Although the drop was not significant it did fall below the 29°C mark at most sites. The temperature variations over the whole study period are showing in figure 1, which will be discussed in more detail in section 4. Other temporal relationships were analysed also, although because the study only took place over a three month period, and possibly because a hurricane occurred during this, very few trends were noticed. Of most interest was that pH generally increased over the study period as illustrated in figure 2, although this may be related to the temperature trends, a fact that will be again be discussed in section 4, as illustrated in figure 3.
Temperature Variation Over Sample Period
25.0
26.0
27.0
28.0
29.0
30.0
31.0
32.0
33.0
34.0
35.0
20-Aug-08
9-Sep-08
29-Sep-08
19-Oct-08
8-Nov-08
28-Nov-08
18-Dec-08
Date
Temperature (Celcius)
Figure 1 – Temperature trend through the study period. Note the interesting dip two days before hurricane Omar made landfall. Points noticeably above groups were from pond or inlet pipe samples. Graph does not include data collected the week directly after hurricane Omar.
pH Variation over sample period
8.0
8.1
8.2
8.3
8.4
8.5
8.6
8.7
20-Aug-08
9-Sep-08
29-Sep-08
19-Oct-08
8-Nov-08
28-Nov-08
18-Dec-08
Date
pH
Figure 2 – pH trend through the study period. Note the inverse relationship that seems to be occurring with temperature (see figure 1), a relationship that is demonstrated further in figure 3. Graph does not include data collected the week directly after hurricane Omar.
10
Temperature (Celcius)
33323130292827
pH
8.6
8.4
8.2
8.0
7.8
7.6
7.4
7.2 Rsq = 0.4915
Figure 3 – Relationship between temperature and pH through the study period. Table 3 - Mean results for the sediment samples collected at the water sampling sites around Anguilla between 2nd September and 3rd December 2008. (BDL = Below Detectable Limits).
Site Conductivity
(µs) TDS (ppt)
Ammonia (as N mg/L)
Nitrate (as N mg/L)
Phosphorous (mg/L)
COD (mg/L)
Road Bay Pond Channel - - 2.45 - - -
Road Bay Floating Pier - - 0.36 2.85 1.16 1780
Road Bay Yacht Club - - 0.31 0.70 0.02 1210
Road Bay Wooden Pier 48.90 56.80 1.70 2.25 0.02 1435
Road Bay Moorings 55.40 56.10 0.21 0.40 BDL 1234
Road Bay Between Swing Low - - 0.20 0.30 0.06 910
Road Bay Main Jetty 50.10 53.40 0.12 0.20 BDL 2971
Road Bay Outer Seagrass 49.40 52.00 2.22 1.60 0.27 694
Katouche North Cliffs 49.80 51.70 0.49 0.60 0.11 2712
Crocus Bay Desalination 62.10 99.40 0.79 0.80 0.02 2731
Crocus Bay Yacht Mooring 48.10 51.80 5.50 2.20 0.79 1211
Little Bay 48.60 49.80 5.74 BDL 0.86 1131

11
Table 3 (Continued….)
Site Conductivity
(µs) TDS (ppt)
Ammonia (as N mg/L)
Nitrate (as N mg/L)
Phosphorous (mg/L)
COD (mg/L)
Shoal Bay East Fountain 49.40 52.00 5.16 3.20 0.32 1074
Shoal Bay East Gwens 49.90 56.20 0.50 3.00 5.22 -
Shoal Bay/Island Harbour 48.90 57.20 0.21 BDL 0.02 407
Island Harbour Kokos Reef 49.00 55.40 0.33 0.40 0.03 302
Island Harbour Scilly Cay 48.70 55.10 0.21 0.10 0.02 732
Island Harbour School 48.80 55.30 BDL 0.02 BDL -
Island Harbour Jetty 48.80 55.30 0.80 0.02 BDL -
Island Ridge 52.10 50.90 0.11 0.20 BDL 971
Captains Bay 49.00 55.00 0.46 0.40 0.02 411
Scrub Island/Little Scrub 51.60 50.40 0.21 0.20 0.01 2730
Junks Hole Nats - - 0.02 0.10 0.09 211
Junks Hole Savannah Bay - - BDL 0.20 BDL 340
Channel (Deep) East 49.80 54.00 0.61 0.35 0.01 419
Channel (Deep) Central 51.60 50.30 0.41 0.55 0.11 1242
Channel (Deep) West 51.70 50.40 0.39 0.65 0.09 1406
Sile Bay 48.90 53.70 0.02 BDL BDL 1002
Forest Bay Seagrass 49.20 54.00 0.03 BDL BDL 691
Forest Bay Reef Channel 49.30 54.00 0.02 BDL BDL 738
Corito Bay Buoys 5BDL 54.30 0.04 BDL BDL 1763
Little Harbour Beach - - 3.80 3.15 0.72 1110
Little Harbour Middle Bay 5BDL 54.30 0.37 0.20 0.01 1027
Little Harbour Inlet 48.50 54.20 2.90 3.00 5.50 -
Blowing Point Fishing Boats 49.10 56.60 1.40 BDL 0.63 333
Rendezvous Bay Yacht Club - - 0.02 0.20 BDL 930
Rendezvous Bay Merrywing Bay 52.70 50.90 0.19 0.20 BDL 2989
Temenos Pond - Pipe - - 0.21 2.70 1.40 -
Cove Bay Pond Pipe Outlet 49.60 56.70 0.90 BDL 0.86 -
Cove Bay Pier 52.40 51.00 0.21 0.30 BDL 1311
Maundays Bay Pimms 52.20 51.00 0.23 0.20 BDL 1432
Shoal Bay West Cove Castles 52.20 51.20 0.22 0.20 BDL 1094
Barnes Bay Viceroy Beach 48.20 52.10 0.28 BDL 0.04 549
Meads Bay Central Bay 52.00 51.00 0.24 0.20 BDL 1347
Long Bay Offshore Regis 48.70 51.70 1.12 BDL 0.41 931
Isaacs Cliffs 49.80 51.80 0.76 1.10 0.17 2654
Sandy Island Moorings 51.80 51.70 0.09 0.20 0.01 1218
Seal Island Channel (Deep) 49.70 52.10 0.31 0.40 0.21 3177
Dog Island 51.90 51.10 0.07 0.30 0.01 1114
Prickly Pear 52.70 51.10 0.21 0.20 BDL 1232
Long Reef 52.30 50.90 0.12 0.30 0.02 832
Means 50.55 54.14 0.85 0.68 0.38 1267

12
4. DISCUSSION Sources of Error and Test Validity: The first thing to appreciate in relation to the results presented is that water sampling with inexpensive equipment is inherently open to errors. This is not just the fault of the equipment (calibration errors) but also because holding probes in the water column allows considerable variation (depth, wave action etc). Furthermore using such equipment in the field, it is not always possible to keep it in perfect condition (heat, rain, bumps etc), thus allowing for more potential variations. Finally, although all attempts to store the equipment in the correct manner were made, variations over time due to wear and tear cannot be ruled out, although periodic checks with control solutions hopefully minimised this. Samples were also regularly ‘spiked’ to check test accuracy. In terms of laboratory tests other variations come to light. Firstly, human error measuring liquids is highly relevant (incorrect reading of graduation), or imprecision in taking such measurements with the rudimentary equipment available. Secondly, when reagent tests are conducted it is often necessary to ‘choose’ when an ‘end point’ has been reached, again leading to potential result variation. This was especially the case with the DFMR saltwater testing kit, but less relevant at the TSG lab where meters were often used to take measurements. Finally methodology errors can sometimes inadvertently occur, as happened with the initial COD tests. Luckily this error was noticed and corrections made, although this did leave almost a months worth of COD data worthless. Perhaps a better approach would have been to continue with the old methodology while also testing the new methodology, then later introducing a conversion factor that could have been applied to the earlier data. Whatever the case, this is one of the important uses of a pilot study, and it is hoped that the 2009 monitoring will be as free of such errors as possible, and through lessons learnt other variations mentioned above minimised. One essential means to do this is to standardise methodologies so that even if inaccuracies exist, changes to the variables themselves will still be visible, even if their recorded values are not entirely correct. Again, such standardisation is a vital output of such a pilot study. As a final note, it is important to mention that during the 2009 sampling, the HACH meter DFMR used in 2008 will likely be replaced with the VWR sympHony meter that has recently been returned after the original unit malfunctioned. In order to introduce this meter into the programme, and in light of factors mentioned above, it will be necessary to use both meters side-by-side to begin with in order to check both are equally calibrated. Results were usually only quoted to two decimal places, thus any results lower than 0.01 were considered below detectable limits (BDL). Very few standard wet chemistry tests can accurately reproduce standard values that are lower than this, which means any such values would always be questionable, and possibly be caused by unknown interferences in the analysis method and the ability of the method to accurately determine the correct values. More questionable however are those tests carried out using the saltwater test kit. Because of the highly manual nature of these tests, and the subjective nature of the results – which is difficult to control for using standardised methods as what a researcher

13
one day chooses to be a ‘pink-green-grey’, might be different from what they choose a week later, or indeed what another researcher chooses. Such reagent tests are however useful if looking for the presence or absence of compounds (i.e. nitrites), rather than an exact value for their abundance. This came into question when testing for dissolved CO2 as results obtained were much higher than expected. After contacting some ‘experts’ they confirmed the results were very high, and after discussing with them the finer details of CO2 in ocean chemistry, it was decided that making such tests was far beyond the capabilities of this monitoring programme. The hardness test has an obvious endpoint and so such discrepancies unlikely, although as this test uses up a lot of reagents it was decided to move to total alkalinity tests. This test also provides more information relating to ocean chemistry and is therefore of more potential use. After running this test a number of times however it was once again decided the end point was very hard to spot, although the results obtained were very close to that reported as expected for natural sea water (reported as 2.0-2.5 meq/l which is the equivalent of c. 125mg/L CaCO3 – Tullock, 1996). Although alkalinity, hardness and CO2 differ from pH, any change in them will likely have a knock-on effect to it, and so it was concluded to just continue monitoring pH. If any concerning values are obtained in the future then the saltwater testing kit could be used to investigate further. In terms of current resources such tests are only really of use to look for extremes, rather than providing an accurate, precise figure. Thus in future the saltwater testing kit will only be used for:
• Presence or absence of compounds.
• Extremes of certain variables. In light of this it may be prudent for DFMR to purchase test strips for heavy metals as this would fill a gap that exists in its current monitoring programme, and complement the conclusions drawn above. Hurricane Omar Although most variables were not significantly affected by hurricane Omar around Anguilla, some interesting insights can be drawn from the results. For example, the water in Maundays Bay directly after the hurricane smelt ‘sulphurous’ which was reportedly caused by a salt pond breach, although other sources reported that the waste water treatment plant had flooded, with untreated waste being flushed into the sea. Whichever is true is largely irrelevant as the salt pond is reportedly one of the most polluted on the island anyway. What is of relevance is that nitrate, and chemical oxygen demand were markedly raised directly after Omar, and dissolved oxygen much reduced. This implies that some kind of ‘organic input’ took place in the area, and illustrates one potential hurricane effect if coastal defences or setbacks are not sufficient: nutrification. Nutrification is highly relevant at the moment in the Caribbean due to the ‘phase-shift’ that is occurring between nutrient-phobic corals, and nutrient-philic algae.

14
From a more positive perspective however, Omar can also be seen as a friend to Anguilla’s coral reefs. Firstly, it was not powerful enough to have caused extensive structural damage, and secondly it caused a noticeable drop in sea temperatures. Before Omar the water temperatures were hovering between 29 and 30°C. If these temperatures are maintained they can lead to coral bleaching, which during an especially long hot season can cause significant mortality to corals. If Omar had not influenced Anguilla then it is quite possible that although not a record breaking year in terms of temperature, it could have been sustained long enough to cause a moderate bleaching event. In actual fact only limited bleaching occurred before Omar hit, and none was observed subsequently. One interesting anomaly in the data are lower than normal temperatures noted on the 13th October, two days before Omar made landfall. Here temperatures dropped by approximately 1.5°C from those recorded previously. This is a phenomenon not reported in the literature and could be an important aspect of the effects hurricanes have on water masses immediately prior to passing. Unsurprisingly turbidity significantly increased the week after hurricane Omar, which would have been caused by both sediment being stirred up, and runoff entering the sea from land. Interestingly however total dissolved solids (TDS) actually decreased immediately after Omar, which is opposite to what would be expected if more solids are suspended in solution and that solution is being shaken up. One possible explanation could be related to temperature. As temperature was lower, it is possible that fewer solids were able to dissolve. This would be an example of the complexities in ocean chemistry where different parameters are intricately related to one another, so changes in one might be due to changes in another and not other external factors. Such a relationship exists between temperature and pH for example, as demonstrated in figure 3. Here, the TDS might be related to the pH increase that occurs when temperatures drop. Possibly however, such a relationship does not exist and the drop in TDS is caused by another external factor. This is a subject that requires further investigation. As a side note it is interesting to ponder this relationship between temperature and pH. If pH increases as temperature decreases, this means that acidity increases (lower pH) as temperature increases. In light of reported ocean acidification and reported increases in ocean temperature, one wonders if: Will increased temperatures mean that acidification will be more severe and add yet more stress to corals; or is the increase in temperature the reason that we are seeing a slight acidification of the ocean in the first place? Nutrification: Aside from ocean temperature and acidification, one of the greatest concerns relating to marine ecosystems is nutrification of coastal waters, otherwise known as eutrophication. Coral reefs are naturally oligotrophic (nutrient-poor water), hence they lack nutrients that would otherwise facilitate algal growth. If waters become eutrophic, algal growth on reef structures can out-compete recruiting corals, and algal blooms in the water column can block sunlight essential for coral zooxanthellae to photosynthesize. Coral reef waters can be considered eutrophic when critical nutrient levels cause algae to dominate over corals, and thus such threshold definitions will be different to those applied to other aquatic systems. Goreau & Thacker (1994) concluded that levels of

15
0.003 mg/l Phosphorous (orthophosphate plus dissolved organic phosphorus) and 0.014 mg/l Nitrogen (nitrate plus ammonium plus nitrite) could be considered eutrophic in a coral reef ecosystem. These levels are so low that they would not be eutrophic in any other ecosystem, and also so low that they will fall into (or very close to) the BDL categories mentioned earlier. This means that any detectable nutrients represent a eutrophic situation. Furthermore, due to the low sensitivity of the tests used, even if a nutrient variable is recorded as BDL, it may still be high enough to be considered eutrophic. However, for the purpose of this report and the usefulness of results, we will tentatively use BDL as a limit of eutrophication. With this being the case, the only sample site that had no nutrients at detectable levels was Sea Feather Bay. However subsequent monitoring will be needed to confirm this site does not have pervasive eutrophic conditions. It was also clear from the results that hurricanes can increase the input of nutrients into the marine environment via breaches, rain runoff, and also flooding of water treatment plants as reportedly happened at Maundays Bay. Similarly septic tanks have been historically used in Anguilla and if in low lying coastal areas may also be inundated by storm surges. Although their current use at coastal developments is discouraged, no current legislation restricts their use, and older tanks may be prone to leeching all year round through cracks and other deterioration features. Furthermore: Agriculture is increasing on the island; fertilisers are used by many of the large coastal developments to aid decorative plant growth; salt ponds within tourist developments that act as natural nutrient sinks have been connected to the ocean via outfall pipes; beach flora is often removed by coastal developments and other land use patterns that would otherwise trap surface runoff and its associated sediments and solutes – all of which potentially increase nutrient input into the marine environment causing eutrophication. So the question remains: ‘Where are these nutrients coming from?’. Deep water up-wellings are one potential natural source, and are extremely likely given Anguilla’s location. Indeed, certainly in terms of phosphorous, one of the offshore sites had the second highest value (Prickly Pear), and a deep sample taken from one of the St Martin Channel sites had a value almost twice this. Nitrates however differed, with coastal sites sometimes having the highest levels. This was especially the case with those near to salt ponds or other land-based sourced of pollution. Therefore an upwelling source can only currently be suspected, and although natural, the amount of nutrients in such up-wellings may be elevated through decades of nutrient input from many sources around the globe. This might explain the regional eutrophication that is being reported throughout the Caribbean that is suggested to be one of the main factors causing coral reef degradation on a regional level. Such a regional source can lead to complacency from a local legislative standpoint. What needs to be appreciated however is that local sources of nutrients can’t be ignored as they might prove to be the tipping point. For example, chemical oxygen demand was elevated at a number of sites, which is a sign of poor water quality; Little Harbour; Barnes Bay (outside the Viceroy Development); Cove Bay (near Tenemos Golf Course); Crocus Bay and in the St Martin channel. Again, the result from the St Martin channel is somewhat unexpected – indeed, these sites were in fact hoped to act a vague controls – but the others all have reasonably expected sources: Little Harbour – Connected to a salt pond; Cove Bay – Pipe connects it to a salt pond; Crocus Bay – Near where mega yachts moor and probably illegally dump waste water.
16
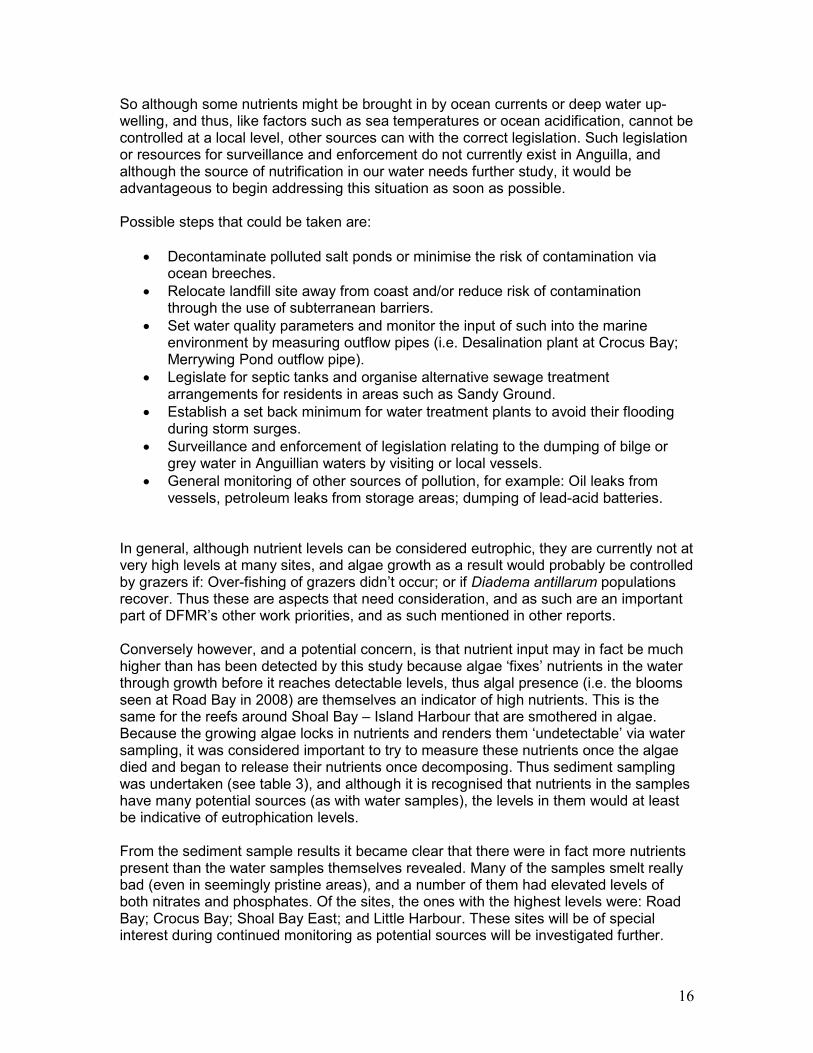
So although some nutrients might be brought in by ocean currents or deep water up-welling, and thus, like factors such as sea temperatures or ocean acidification, cannot be controlled at a local level, other sources can with the correct legislation. Such legislation or resources for surveillance and enforcement do not currently exist in Anguilla, and although the source of nutrification in our water needs further study, it would be advantageous to begin addressing this situation as soon as possible. Possible steps that could be taken are:
• Decontaminate polluted salt ponds or minimise the risk of contamination via ocean breeches.
• Relocate landfill site away from coast and/or reduce risk of contamination through the use of subterranean barriers.
• Set water quality parameters and monitor the input of such into the marine environment by measuring outflow pipes (i.e. Desalination plant at Crocus Bay; Merrywing Pond outflow pipe).
• Legislate for septic tanks and organise alternative sewage treatment arrangements for residents in areas such as Sandy Ground.
• Establish a set back minimum for water treatment plants to avoid their flooding during storm surges.
• Surveillance and enforcement of legislation relating to the dumping of bilge or grey water in Anguillian waters by visiting or local vessels.
• General monitoring of other sources of pollution, for example: Oil leaks from vessels, petroleum leaks from storage areas; dumping of lead-acid batteries.
In general, although nutrient levels can be considered eutrophic, they are currently not at very high levels at many sites, and algae growth as a result would probably be controlled by grazers if: Over-fishing of grazers didn’t occur; or if Diadema antillarum populations recover. Thus these are aspects that need consideration, and as such are an important part of DFMR’s other work priorities, and as such mentioned in other reports. Conversely however, and a potential concern, is that nutrient input may in fact be much higher than has been detected by this study because algae ‘fixes’ nutrients in the water through growth before it reaches detectable levels, thus algal presence (i.e. the blooms seen at Road Bay in 2008) are themselves an indicator of high nutrients. This is the same for the reefs around Shoal Bay – Island Harbour that are smothered in algae. Because the growing algae locks in nutrients and renders them ‘undetectable’ via water sampling, it was considered important to try to measure these nutrients once the algae died and began to release their nutrients once decomposing. Thus sediment sampling was undertaken (see table 3), and although it is recognised that nutrients in the samples have many potential sources (as with water samples), the levels in them would at least be indicative of eutrophication levels. From the sediment sample results it became clear that there were in fact more nutrients present than the water samples themselves revealed. Many of the samples smelt really bad (even in seemingly pristine areas), and a number of them had elevated levels of both nitrates and phosphates. Of the sites, the ones with the highest levels were: Road Bay; Crocus Bay; Shoal Bay East; and Little Harbour. These sites will be of special interest during continued monitoring as potential sources will be investigated further.

17
2009 Site choice: Based on aspects discussed in this report the below list of sites were chosen for continued study in 2009, with the hope of them becoming long-term water quality monitoring sites. Priority was given to: Those sites that are currently part of the Anguillian Marine Monitoring Programme (AMMP); sites that may be included in AMMP if or when this project is expanded; sites with elevated levels of nutrients or associated parameters; sites close to future proposed development or current developments; and offshore sites that may serve as a control. Balanced against this were the logistics of conducting the sampling work combined with the testing labs work load capabilities as currently the TSG lab can only accept fourteen samples a day. Thus, sites proposed are (clockwise from Sandy Ground):
Road Bay – Fishing Pier Road Bay – Wooden Pier Road Bay – Main Jetty
Road Bay – Mid-moorings Crocus Bay – Mega Yachts
Little Bay Limestone Bay
Shoal Bay East – Fountain Shoal Bay East – Ernies Shoal Bay East – Gwens
Shoal Bay – Island Harbour Island Harbour Jetty Scrub – Little Scrub
Junks Hole Sile Bay
Sandy Hill Bay Conch Bay
Forest Bay - Seagrass Forest Bay - Channel
Corito Bay St Martin Channel (Shallow)
St Martin Channel (Deep) Little Harbour - Beach Little Harbour - Berm
Blowing Point – Ferry Terminal Blowing Point – Sandy Point
Rendezvous Bay – Great House Rendezvous Bay - Merrywing
Cove Bay – Fishing Pier Cove Bay - Westend Cap Jaluca - Pimms Cap Jaluca – Villa 19
Shoal Bay West - Altamar Anguillita
Barnes Bay – Viceroy Meads Bay - Viceroy Meads Bay – Mid Bay
Long Bay Sandy Island Prickly Pear Dog Island Long Reef
A total of 42 sites mean that sampling can be completed during a three day period, and the sites chosen can be placed into three groups based on their locations to complement this (see figure 4). It is proposed that sampling be undertaken quarterly: January, April, July & October. Sediment samples will be collected if appropriate, depending on the testing labs capabilities at that given time.

18
Figure 4 – Map illustrating the proposed study sites for the beginning of on-going monitoring in 2009. The sites have been divided into three groups to facilitate sampling efforts: Blue – Land based day 1 (East End); Green – Land based day 2 (West End); Red – Boat based day 3 (circular route). The exact locations of some of the pilot study sampling sites (see Appendix 1 following) have been modified slightly to allow this.
19
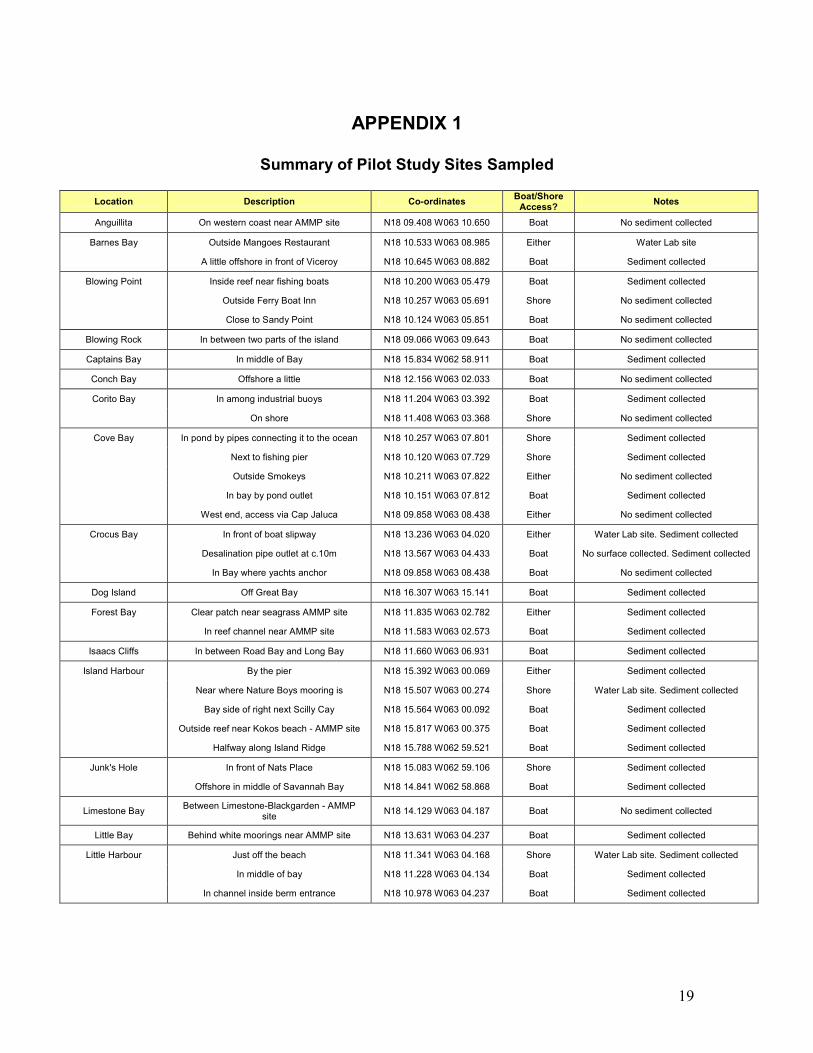
APPENDIX 1
Summary of Pilot Study Sites Sampled
Location Description Co-ordinates Boat/Shore Access?
Notes
Anguillita On western coast near AMMP site N18 09.408 W063 10.650 Boat No sediment collected
Barnes Bay Outside Mangoes Restaurant N18 10.533 W063 08.985 Either Water Lab site
A little offshore in front of Viceroy N18 10.645 W063 08.882 Boat Sediment collected
Blowing Point Inside reef near fishing boats N18 10.200 W063 05.479 Boat Sediment collected
Outside Ferry Boat Inn N18 10.257 W063 05.691 Shore No sediment collected
Close to Sandy Point N18 10.124 W063 05.851 Boat No sediment collected
Blowing Rock In between two parts of the island N18 09.066 W063 09.643 Boat No sediment collected
Captains Bay In middle of Bay N18 15.834 W062 58.911 Boat Sediment collected
Conch Bay Offshore a little N18 12.156 W063 02.033 Boat No sediment collected
Corito Bay In among industrial buoys N18 11.204 W063 03.392 Boat Sediment collected
On shore N18 11.408 W063 03.368 Shore No sediment collected
Cove Bay In pond by pipes connecting it to the ocean N18 10.257 W063 07.801 Shore Sediment collected
Next to fishing pier N18 10.120 W063 07.729 Shore Sediment collected
Outside Smokeys N18 10.211 W063 07.822 Either No sediment collected
In bay by pond outlet N18 10.151 W063 07.812 Boat Sediment collected
West end, access via Cap Jaluca N18 09.858 W063 08.438 Either No sediment collected
Crocus Bay In front of boat slipway N18 13.236 W063 04.020 Either Water Lab site. Sediment collected
Desalination pipe outlet at c.10m N18 13.567 W063 04.433 Boat No surface collected. Sediment collected
In Bay where yachts anchor N18 09.858 W063 08.438 Boat No sediment collected
Dog Island Off Great Bay N18 16.307 W063 15.141 Boat Sediment collected
Forest Bay Clear patch near seagrass AMMP site N18 11.835 W063 02.782 Either Sediment collected
In reef channel near AMMP site N18 11.583 W063 02.573 Boat Sediment collected
Isaacs Cliffs In between Road Bay and Long Bay N18 11.660 W063 06.931 Boat Sediment collected
Island Harbour By the pier N18 15.392 W063 00.069 Either Sediment collected
Near where Nature Boys mooring is N18 15.507 W063 00.274 Shore Water Lab site. Sediment collected
Bay side of right next Scilly Cay N18 15.564 W063 00.092 Boat Sediment collected
Outside reef near Kokos beach - AMMP site N18 15.817 W063 00.375 Boat Sediment collected
Halfway along Island Ridge N18 15.788 W062 59.521 Boat Sediment collected
Junk's Hole In front of Nats Place N18 15.083 W062 59.106 Shore Sediment collected
Offshore in middle of Savannah Bay N18 14.841 W062 58.868 Boat Sediment collected
Limestone Bay Between Limestone-Blackgarden - AMMP
site N18 14.129 W063 04.187 Boat No sediment collected
Little Bay Behind white moorings near AMMP site N18 13.631 W063 04.237 Boat Sediment collected
Little Harbour Just off the beach N18 11.341 W063 04.168 Shore Water Lab site. Sediment collected
In middle of bay N18 11.228 W063 04.134 Boat Sediment collected
In channel inside berm entrance N18 10.978 W063 04.237 Boat Sediment collected

20
Location Description Co-ordinates Boat/Shore Access?
Notes
Long Bay Far eastern end of beach N18 11.476 W063 07.526 Shore No sediment collected
Offshore - Outside St Regis resort N18 11.535 W063 07.857 Boat Sediment collected
Long Reef In shallows north of MV Sarah - AMMP site N18 16.209 W063 06.262 Boat Sediment collected
Maunday's Bay Next door to Pimms restaurant N18 09.855 W063 08.520 Either Sediment collected
Off the beach from Villa 19 N18 09.815 W063 08.887 Shore Water Lab site. No sediment collected
Mead's Bay Off beach by Malliouhana Hotel resturant N18 11.200 W063 08.084 Shore Water Lab site. No sediment collected
Offshore in middle of Bay N18 10.969 W063 08.416 Boat Sediment collected
End of bay next to Viceroy N18 10.772 W063 08.604 Shore Water Lab site. No sediment collected
Off rocks from point - Viceroy N18 10.830 W063 08.777 Boat No sediment collected
North Cliffs Offshore from Katouche North Cliffs N18 12.750 W063 05.028 Boat Sediment collected
Prickly Pear Inbetween Alans and Johnnos bar N18 15.877 W063 10.406 Boat Sediment collected
Rendezvous Bay Next to Yacht Club pier N18 10.171 W063 06.260 Shore Sediment collected
Outside Great House N18 10.643 W063 06.681 Either Water Lab site. No sediment collected
In front of Merrywing Bay N18 10.177 W063 07.345 Boat Sediment collected
Road Bay In the southern corner over at Mariners N18 11.743 W063 05.585 Either Water Lab site. No sediment collected
Underneath main jetty N18 11.873 W063 05.519 Boat Sediment collected
In amongst mooring area N18 12.046 W063 05.561 Boat Sediment collected
Underneath wooden pier N18 12.070 W063 05.457 Either Sediment collected
On beach near sailing club N18 12.140 W063 05.451 Either Close to Water Lab site. Sediment
Collected
Over in the northern corner by the floating
wharf N18 12.219 W063 05.527 Shore Sediment collected
In pond channel next to Fisheries Dept N18 12.249 W063 05.519 Shore Sediment collected
In middle of bay near Seagrass AMMP N18 12.249 W063 05.519 Shore Sediment collected
In middle of moorings N18 12.001 W063 05.928 Boat Sediment collected
Sandy Island In middle of Seafeathers Bay N18 12.695 W063 07.292 Boat Sediment collected
Sandy Hill Bay Inbetween Little Scrub and Big Scrub N18 13.219 W063 00.326 Boat No sediment collected
Scrub Island In middle of Scrub Bay N18 17.570 W062 57.251 Boat Sediment collected
Midway between Anguilla and Seal Island
(18m) N18 16.887 W062 57.441 Boat No sediment collected
Seal Island Channel Between Shoal Bay and Island Harbour N18 13.841 W063 08.558 Boat Surface, bottom & sediment collected
Shoal Bay East Offshore near serinity and gwens reggae grill N18 15.481 W063 00.994 Boat Sediment collected
Outside Uncle Ernies N18 15.348 W063 01.406 Boat Sediment collected
Offshore a little west of Fountain - AMMP site N18 15.287 W063 01.875 Shore Water Lab site. No sediment collected
Backside of Madeariman Reef N18 15.161 W063 02.482 Boat Sediment collected
Offshore from Altamar development N18 15.954 W063 02.010 Boat No sediment collected
Shoal Bay West On coast outside cove castles N18 09.690 W063 09.254 Boat No sediment collected
In middle of Bay beyond boat mooring N18 09.875 W063 09.543 Either Sediment collected
Sile Bay East end of channel (32m) N18 14.240 W062 59.084 Boat Sediment collected
St Martin Channel Middle of channel (23m) N18 12.777 W062 56.859 Boat Surface, bottom & sediment collected
West end of channel (18m) N18 09.191 W063 02.307 Boat Surface, bottom & sediment collected
In front of access channel N18 07.721 W063 07.644 Boat Surface, bottom & sediment collected
West End Bay In lagoon type area N18 10.275 W063 09.521 Shore No sediment collected
Windward Point On western coast near AMMP site N18 16.241 W062 58.115 Shore No sediment collected

21
5. REFERENCES AIMS 2008 – Published online at: http://www.aims.gov.au/pages/research/project-net/seagrass/apnet-seagrasses01.html (accessed 16th February 2009). Fitt W.K., Brown B.E., Warner M.E., & Dunne R.P. (2001). ‘Coral bleaching: interpretation of thermal tolerance limits and thermal thresholds in tropical corals’. Coral Reefs 20. p.51-65. Goreau T.J. & Thacker K (1994). ‘Coral Reefs, Sewage, and Water Quality Standards’. Report from the Caribbean Water and Wastewater Association Conference. Published online at: http://globalcoral.org/CORAL%20REEFS.%20SEWAGE,%20AND%20WATER%20QUALITY%20STANDARDS.htm (accessed 23
rd February 2009).
Hannesson R. (2007). ‘Global Warming and Fish Migrations’. Natural Resource Modeling 20. p.301. Szmant A.M. (2002). ‘Nutrient Enrichment on Coral Reefs: Is it a Major Cause of Coral Reef Decline?’ Estuaries 25. p.743-766. Tullock J.H. (1996). ‘Water Chemisrty – pH and alkalinity’. Published online at: http://www.amdareef.com/ho_chem1.htm (accessed 23rd February 2009).