Embed Size (px)
Citation preview

i
Department of Environment and Conservation
Internship Report 2012
A report submitted to the School of Engineering and Energy,
Murdoch University in partial fulfilment of the requirements for the
degree of Bachelor of Environmental Engineering
Benjamin Ho

ii
Abstract
The Department of Environment and Conservation is a government department of Western
Australia. It was established in 2006, and it combined the Department of Environment and
the Department of Conservation and Land Management. The DEC is responsible for ensuring
that the environment in the state of Western Australia is protected and conserved. There are
many departments within the DEC. One of the major departments within the DEC is the
Licensing and Regulation department. This department deals with the licensing and
regulation of commercial premises and their operations on site. No emission can be
discharged into the environment without an emission licence from the DEC. To acquire the
appropriate licence, the proponent has to justify and prove to DEC that the emission to the
environment will not have a significant impact on the surrounding environment and the
welfare of the public. Currently the application process is slow and inconsistent. This has
prompted a department wide reform project to look into the methodology of the application
process to see whether it can be improved to make the application process more efficient and
productive. This document is a result of the reform project and is the first stepping stone for a
total reform of the applications for emissions to water, air and land.

iii
Disclaimer
I declare the following to be my own work, unless otherwise referenced, as defined by the
University’s policy on plagiarism.

iv
Acknowledgements
I would like to thank Kim Squires and Tony Wynne for giving me the opportunity to work
with the Department of Environment and Conservation.
Thanks to my industry supervisor Tony Wynne for all the support and guidance during my
internship.
Thanks are also extended to Ruth Dowd and Scott Mcfarlane for helping me and have always
been there to discuss ideas and concepts.
Finally I would like to thank Dr Martin Anda and Dr Gareth Lee of Murdoch University for
acting as my academic supervisor and unit coordinator.

v
Table of contents
1 Introduction ......................................................................................................................................... 1
1.1 Background ................................................................................................................................... 1
1.2 Objective ....................................................................................................................................... 1
1.3 Current Practice ............................................................................................................................ 2
1.4 Research ........................................................................................................................................ 2
1.5 Legislation ..................................................................................................................................... 5
1.6 Application Process ....................................................................................................................... 6
2 Method ................................................................................................................................................ 7
2.1 Step 1: Determine environmental values ..................................................................................... 7
2.1.1 Ecosystem Health ................................................................................................................... 8
2.1.2 Primary Industries .................................................................................................................. 8
2.1.3 Recreation and Aesthetics ..................................................................................................... 9
2.1.4 Industrial Water Supply ......................................................................................................... 9
2.1.5 Cultural and Spiritual Values .................................................................................................. 9
2.2 Step 2: Determine environmental quality objectives ................................................................. 10
2.2.1 Ecosystem Health ................................................................................................................. 11
2.2.2 Primary Industries ................................................................................................................ 11
2.2.3 Recreation and Aesthetics ................................................................................................... 11
2.2.4 Industrial Water Supply ....................................................................................................... 11
2.2.5 Cultural and Spiritual Values ................................................................................................ 12
2.3 Step 3: Determine ecological protection .................................................................................... 13
2.4 Step 4: Determine environmental quality criteria ...................................................................... 15
2.4.1 Ecosystem health ................................................................................................................. 16
2.4.2 Primary industry ................................................................................................................... 27
2.4.3 Recreation ............................................................................................................................ 35
2.5 Step 5: Determine licence conditions ......................................................................................... 39
3 Future work ........................................................................................................................................ 40
4 Conclusion .......................................................................................................................................... 41
5 References ......................................................................................................................................... 42
vi
Figures and tables
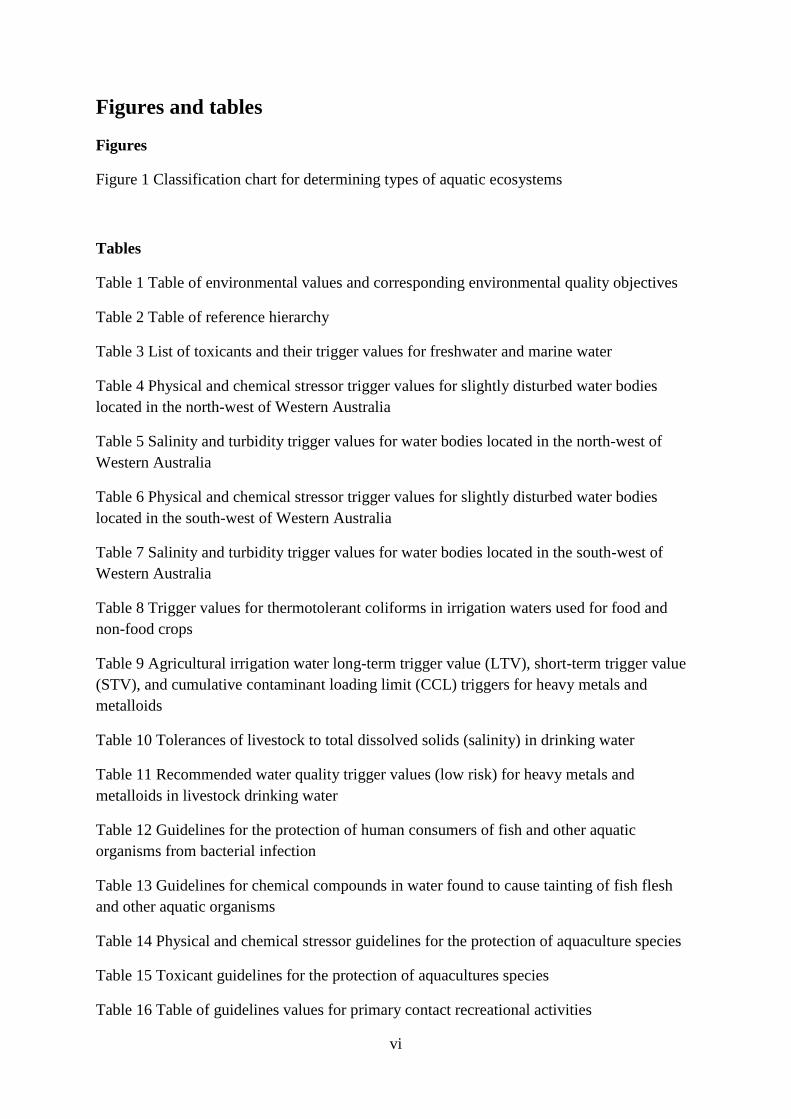
Figures
Figure 1 Classification chart for determining types of aquatic ecosystems
Tables
Table 1 Table of environmental values and corresponding environmental quality objectives
Table 2 Table of reference hierarchy
Table 3 List of toxicants and their trigger values for freshwater and marine water
Table 4 Physical and chemical stressor trigger values for slightly disturbed water bodies
located in the north-west of Western Australia
Table 5 Salinity and turbidity trigger values for water bodies located in the north-west of
Western Australia
Table 6 Physical and chemical stressor trigger values for slightly disturbed water bodies
located in the south-west of Western Australia
Table 7 Salinity and turbidity trigger values for water bodies located in the south-west of
Western Australia
Table 8 Trigger values for thermotolerant coliforms in irrigation waters used for food and
non-food crops
Table 9 Agricultural irrigation water long-term trigger value (LTV), short-term trigger value
(STV), and cumulative contaminant loading limit (CCL) triggers for heavy metals and
metalloids
Table 10 Tolerances of livestock to total dissolved solids (salinity) in drinking water
Table 11 Recommended water quality trigger values (low risk) for heavy metals and
metalloids in livestock drinking water
Table 12 Guidelines for the protection of human consumers of fish and other aquatic
organisms from bacterial infection
Table 13 Guidelines for chemical compounds in water found to cause tainting of fish flesh
and other aquatic organisms
Table 14 Physical and chemical stressor guidelines for the protection of aquaculture species
Table 15 Toxicant guidelines for the protection of aquacultures species
Table 16 Table of guidelines values for primary contact recreational activities

vii
Table 17 Table of guidelines values for secondary contact recreational activities
Table 18 Summary of water quality guidelines for recreational purposes: general chemicals
Table 19 Summary of water quality guidelines for recreational purposes: pesticides
Table 20 Table of guidelines values for aesthetic purposes

1
1 Introduction The Department of Environment and Conservation (DEC) is a Western Australian
government department that has the lead responsibility for the protection and conservation of
the environment within the State. Part of this responsibility is the assessment of applications
for works approvals and licences under Part V of the Environmental Protection Act 1986. All
applications must be assessed to ensure that there is no significant pollution of the
environment and that all reasonable measure is taken to minimise pollution.
1.1 Background
There is currently a reform project to review and improve all aspects of licensing. As part of
this, DEC is reviewing the methodology for the assessments of applications to ensure these
are done in a consistent and evidence based manner. Assessment processes for applications
for emissions to water, air and land are being reformed. Currently, emissions to water, air and
land have different applications processes. So both the assessment and the application
processes are being changed to be more consistent. This means that every environmental
officer who is assessing an application will go about the assessment in the same way, but also
all applicants that apply to the DEC for emissions water, air and land will go through the
same application process. Currently an application for an emission to water may be different
from an application for an emission to air and land.
1.2 Objective The objective of my internship was to write an environmental officer’s guide what will assist
new officers in the assessment of an emission to a water body. As there is currently no
procedure, the document is very important to enable the DEC to have consistent procedures
to assess emissions.
The purpose of the project is to produce a report that specifies the environmental quality
standards that can be used to assess the impact of wastewater emissions on the environment.
These environmental quality standards will be used by DEC in the assessment of applications
under Part V of the Environmental Protection Act 1986 in Western Australia. The project will
also investigate and recommend achievable emission values and concentrations of chemicals
and toxicants from industrial premises and into wastewater.

2
1.3 Current Practice Officers currently assess the acceptability of point source emissions to water on a case by
case basis. This means that different environmental officers may have different methods that
may not always give a consistent outcome. There is also no preferred document that gives
them guidance. Therefore this guidance document is important as it will give all
environmental officers an official method and process to follow and ensure that all
applications will be assessed consistently, regardless of the environmental officer assessing
the application.
1.4 Research To ensure that the guidance document is formed and based on the most accurate and current
guidelines, definitive research was required. There were many government and agency
documents that were read and understood to see whether the guidelines and concepts were
applicable to the current objective.
List of the main government documents that were researched:
Australian and New Zealand Environment and Conservation Council and Agriculture and
Resource Management Council of Australia and New Zealand. "An Introduction to the
Australian and New Zealand Guidelines for Fresh and Marine Water Quality." 2000.
This document provides a definitive guide to setting and guidance of water quality objectives
for water bodies in Australia and New Zealand. It outlines the environmental values and
objectives that should be recognized and protected. They list a large database of trigger
values that can be used as a guide to safely manage water bodies. These trigger values were
derived using the statistical distribution method. They were calculated for four different
levels, 80%, 90%, 95% and 99%. These trigger values apply to fresh and marine water. This
document is very important to my project as it outlines a large list of chemical and toxicant
trigger values. It has the largest list of any type of specific value and is the basis of most of
the documents that were written by other departments and organizations. However the
limitation of this document is that as it is only a guide and so more investigation and research
must be performed. It is a good guide, but cannot be the only basis for decisions regarding the
protection and restoration of local water bodies. This document will be one of my main
research documents and I will refer it extensively for my project.

3
Australian and New Zealand Environment and Conservation Council and Agriculture and
Resource Management Council of Australia and New Zealand. "Guidelines for Sewerage
Systems - Acceptance of Trade Waste." 2004.
This document outlines national guidelines for the discharge of trade waste into sewers. The
document was prepared as part of the National Water Quality Management Strategy. It gives
guidance to sewer authorities to implement trade waste management programs. The national
acceptance guidelines in the document are only a guide to local sewer authorities and more
investigation and research may be required. The values are useful as a reference for my
project, as I am able to gauge the difference between sewer acceptance values and other water
values, like fresh, marine and drinking water values. These values will then form the high end
threshold for chemicals and toxicants as no emissions to water bodies should exceed the
sewer acceptance levels.
Department of Environment and Conservation (WA). "Assessment levels for Soil, Sediment
and Water." Perth, 2010.
This document lists generic assessment levels that are used by the Department of
Environment and Conservation (DEC). It provides guidance on the assessment of sites and
helps determines if a site is potentially contaminated. The document contains assessment
levels for a range of substances that are commonly investigated at potentially contaminated
sites in Western Australia. It uses values from different documents and arranges them into a
values table. The table can be used to easily see what concentrations levels of pollutants are
recommended for different types of receiving water bodies. The values listed are fresh water,
marine water, drinking water, domestic non-potable groundwater, short term and long term
irrigation. The limitation of this document is that this document is used to access whether a
site is contaminated, which is different from the purpose of the project. However it is a useful
reference for the project.
Department of Environment and Resource Management (QLD). "Queensland Water Quality
Guidelines." 2009.
This document outlines the ANZECC Guidelines for Fresh and Marine Water Quality in
relation to the local Queensland waters. It addresses the need that is identified in the
ANZECC guide, which is to provide guideline values that are tailored to Queensland regions
and water types and to process and derive frameworks that can be applied locally for waters
in Queensland. It sets out guidelines to protect aquatic ecosystems and other environmental
values in Queensland. It is useful for the project as it has a similar scope and purpose to the
current project being worked on. There are limitations however as the governmental
organization is different in Queensland, compared to Western Australia.
4
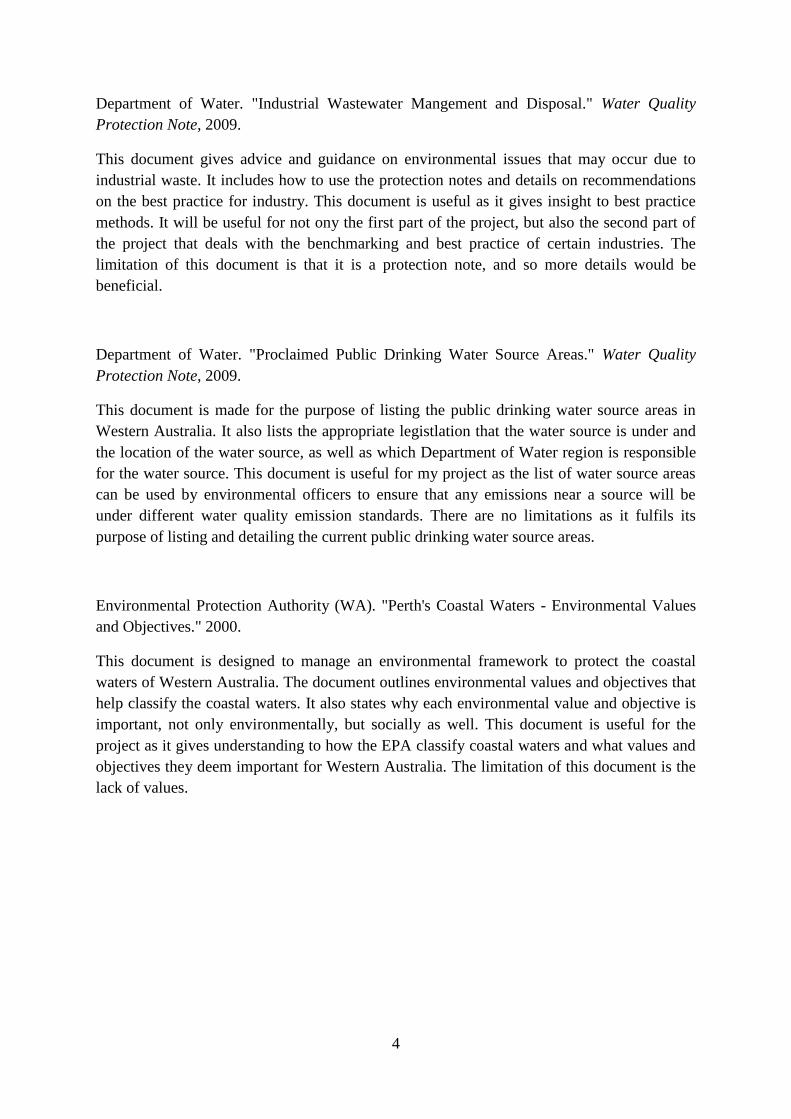
Department of Water. "Industrial Wastewater Mangement and Disposal." Water Quality
Protection Note, 2009.
This document gives advice and guidance on environmental issues that may occur due to
industrial waste. It includes how to use the protection notes and details on recommendations
on the best practice for industry. This document is useful as it gives insight to best practice
methods. It will be useful for not ony the first part of the project, but also the second part of
the project that deals with the benchmarking and best practice of certain industries. The
limitation of this document is that it is a protection note, and so more details would be
beneficial.
Department of Water. "Proclaimed Public Drinking Water Source Areas." Water Quality
Protection Note, 2009.
This document is made for the purpose of listing the public drinking water source areas in
Western Australia. It also lists the appropriate legistlation that the water source is under and
the location of the water source, as well as which Department of Water region is responsible
for the water source. This document is useful for my project as the list of water source areas
can be used by environmental officers to ensure that any emissions near a source will be
under different water quality emission standards. There are no limitations as it fulfils its
purpose of listing and detailing the current public drinking water source areas.
Environmental Protection Authority (WA). "Perth's Coastal Waters - Environmental Values
and Objectives." 2000.
This document is designed to manage an environmental framework to protect the coastal
waters of Western Australia. The document outlines environmental values and objectives that
help classify the coastal waters. It also states why each environmental value and objective is
important, not only environmentally, but socially as well. This document is useful for the
project as it gives understanding to how the EPA classify coastal waters and what values and
objectives they deem important for Western Australia. The limitation of this document is the
lack of values.
5
National Health and Medical Research Council. "Australian Drinking Water Guidelines 6."
2011.
This document details a framework for the management of drinking water sources and supply
in Australia. The National Health and Medical Research Council have developed this
document through best available scientific research and evidence. If the values and
management principles are upheld, then the water source and supply will be at a safe and
healthy level for the public. However these are just guidelines and so the values are
mandatory. The limitation of the document is that it is not rules and regulations for people to
follow, but as suggested guidelines. This document is important for the project, as when there
is a proposed emission to a water source, these values can be used to evaluate if the emission
will be allowed. It also has a comprehensive list of chemicals or toxicants, which will useful
for future reference, as well as a description and background information of the substance.
World Health Organization. "Guidelines for Drinking-water Quality." 2011.
This document details the framework and guidelines from the World Health Organization for
drinking water. It talks about the potential dangers of drinking water that is not of drinking
quality and lists and discusses the potential chemicals and substances that may hinder and
impact the quality of drinking water. It also outlines each of the health concerns that come
with microbial, chemical and radiological substances. This document is useful when dealing
with emissions to drinking water and also can be used to find more information about certain
microbial, chemical and radiological substances.
It was acknowledged that the most appropriate government document was the document “AN
Introduction to the Australian and New Zealand Guidelines for Fresh and Marine Water
Quality” by the Australian and New Zealand Environment and Conservation Council, 2000
(ANZECC). The figures and values outlines in that document have been used in this
document.
1.5 Legislation The information contained in this document may be considered in the decision making
required for whether a proposal is acceptable attached to the statutory instruments under the
Environmental Protection Act 1986 (EP Act) such as:
Licences, works approvals, notices and other regulatory issued under Part V of the EP Act.

6
1.6 Application Process The current DEC application process involves the completion of an application form that
provides information for DEC environmental officers. The application process has 4 steps.
Step 1: Completion of a DEC application form
The application form requires details on control measures, emissions and the impacts on the
environment.
Step 2: Describe the proposals and justify emissions control measures
The proponent must outline what best practice emissions and emissions controls are in place.
It must also justify whether a departure from the best practice emissions control measures
occurs.
Step 3: Identify emission levels from emissions control measures described in Step 2 and
compare to best practice standards
The proponent must outline the amounts and concentrations of the emissions. If the amounts
and concentrations do not meet the best practice standards, a justification must occur and the
application will move back to Step 2.
Step 4: Assess the environmental impacts on the water body and confirmation of the
acceptance of the emission
This is where this guidance document comes into effect. Once the first 3 steps are completed,
the environmental officer can look through this guidance document and assess the
environmental impacts on the water body and ultimately decide if the proposed emissions are
acceptable.

7
2 Method The method for the assessment of the applications involves 5 steps. Each step is important in
the decision process and each have a role to play in the final assessment. This method can be
used for all applications and water bodies in Western Australia. An environmental officer
performing the assessment can follow this method and should get the same result and
assessment outcome as another environmental officer performing the same assessment.
2.1 Step 1: Determine environmental values Officers need to determine what environmental values are relevant to the receiving water
body. Environmental values are defined by ANZECC as particular values or uses of the
environment that are important for a healthy ecosystem or for public benefit, welfare, safety
or health and which require protection from the effects of pollution, waste discharges and
deposits (Australian New Zealand Environmental Conservation Council, 2000). All water
bodies will have some value that should be protected and conserved. Many water bodies will
have more than one environmental value. There are several environmental values that are
listed in ANZECC and EPA WA that DEC expects proponents to adopt in their assessments
These are:
Ecosystem health
Primary industries e.g. aquaculture, livestock watering, irrigation, etc.
Recreation and aesthetics e.g. swimming, surfing, boating
Industrial water supply e.g., process cooling
Cultural and spiritual values

8
2.1.1 Ecosystem Health
If there is an ecosystem of flora and fauna in and around the water body, then the water body
has the environmental value of ecosystem health.
This environmental value is so important for protecting and conserving water bodies and their
ecosystems. It is recognised that the ecosystem itself is important in its own right. The
biodiversity of flora and fauna can only be protected if the habitat and ecosystem that they
live in is protected and conserved. To enable healthy flora and fauna to populate Western
Australia, the ecosystems that they live in, needs to be able to support growth and
reproduction of them (ANZECC 2000). This environmental value highlights the desire to
maintain and where necessary restore the essential natural structure and function of any
ecosystem found in Western Australia (EPA WA 2000). This environmental value not only
applies to water bodies in Western Australia, but also in the coastal waters of Western
Australia. Almost all water bodies will have ecosystem health as an environmental value.
Even the most highly disturbed water body will still have flora and fauna present. The flora
and fauna may be undesirable, but they are present nonetheless.
2.1.2 Primary Industries
If the water from the water body is being used to irrigate crops, as drinking water for
livestock, or if the water body is being used for aquaculture or seafood for human
consumption is being caught in it then the water body has the environmental value of primary
industries.
This environmental value is important as there are many different industries that rely on
water from water bodies. The importance of healthy water for irrigation, livestock drinking
water, human consumption of seafood and aquaculture is paramount for industries in Western
Australia. As most primary industries’ end result is human consumption, the water that is
used as either irrigation, drinking water or the habitat for fish and aquaculture has to meet
certain requirements. If these requirements are not met, the industry will suffer as humans
will not be able to consume the produce.

9
2.1.3 Recreation and Aesthetics
If the water body is used for recreation or the aesthetics of the water body is important to the
public or stakeholders, then the water body has the environmental value of recreation and
aesthetics. Recreation is split into two different groups, which are primary contact recreation
and secondary contact recreation. Primary contact recreation is activities like swimming,
surfing and body boarding where there people come into direct contact with the water.
Secondary contact recreation is activities like boating, fishing and other water sports.
This environmental value is important to ensure that the public are safe when participating in
primary and secondary contact recreation.
The aesthetics of a water body is also very important as the public would not want to swim at
a beach or in a water body that is littered with rubbish and algae.
2.1.4 Industrial Water Supply
If the water body is used for cooling of equipment and in industrial processes, then the
environmental value of industrial water supply applies to the water body.
This environmental value does not have trigger values and standards to assess them by.
However if the water from the water body is used for the cooling of equipment and processes,
the quality of water will normally have to be of a certain standard to ensure it does not have a
detrimental effect on the equipment and industrial processes in the process plant.
2.1.5 Cultural and Spiritual Values
If the water body has cultural or spiritual significance, then the water body has the
environmental value of cultural and spiritual values. This environmental value does not have
trigger values and standards to assess them by. However it is important to recognise that a
water body may have cultural and spiritual significance to different parts of the Australian
community.
For example, the Swan River has several environmental values. The environmental values
that correspond with the Swan River are ecosystem health, recreation and aesthetics and
cultural and spiritual values.

10
2.2 Step 2: Determine environmental quality objectives
Officers need to determine what environmental quality objectives apply to the water body.
Environmental quality objectives are defined as numerical concentration limit or descriptive
statement to be measured and reported back on. The environmental quality objectives main
aim is to preserve and protect the environmental values of the water body (Australian New
Zealand Environmental Conservation Council, 2000). Each environmental value has different
corresponding environmental quality objectives. Once the environmental values are
determined in Step 1, the corresponding environmental quality objectives are easily
determined, using Table 1.
Table 1 Table of environment values and corresponding environmental quality objectives
Environmental value Environmental quality objective
Ecosystem health Maintenance of ecosystem integrity
Primary industries
Maintenance of safe irrigation water for
crops
Maintenance of safe drinking water for
livestock
Maintenance of seafood for human
consumption
Maintenance of aquaculture
Recreation and aesthetics
Maintenance of primary contact
recreation values
Maintenance of secondary contact
recreation values
Maintenance of aesthetic values
Industrial water supply Maintenance of industrial water supply
values
Cultural and spiritual values Maintenance of cultural and spiritual
values
11
2.2.1 Ecosystem Health
There is one environmental quality objective for the environmental value of ecosystem
health. This environmental quality objective is the maintenance of ecosystem integrity,
including biological diversity, relative abundance and ecological processes.
2.2.2 Primary Industries
There are four environmental quality objectives for the environmental value of primary
industries. Maintenance of safe irrigation water for crops as an objective ensures that the
water quality of the water used for crops does not have detrimental effect on the crops and
also the humans who consume them. Maintenance of safe drinking water for livestock
ensures that the livestock are not affected by the quality of water they are drinking.
Maintenance of seafood for human consumption and aquaculture means that all seafood
either grown naturally in water bodies, or in farms, are safe for humans to consume.
2.2.3 Recreation and Aesthetics
Maintenance of primary and secondary recreation values ensures that the quality of water is
good enough for the public to swim, surf, boat and do whatever water activities they want.
The maintenance of aesthetic values ensures that the aesthetic values of water bodies are
maintained.
2.2.4 Industrial Water Supply
Maintenance of industrial water supply values ensures that water being used in cooling and
processes will not have a detrimental impact on equipment or hinder any process in industry
environments.

12
2.2.5 Cultural and Spiritual Values
Maintenance of cultural and spiritual values ensures that the any significance of water bodies
is recognised and protected in the appropriate way.
E.g.. The Swan River has an ecosystem present, there are people who use the river for
primary and secondary contact recreation, it is important that the aesthetics of the river are
maintained as the river runs through Perth and is a major river and there is cultural
significance associated with the Swan River.
The Swan River has the following environmental quality objectives:
Maintenance of ecosystem integrity
Maintenance of primary contact recreation values
Maintenance of secondary contact recreation values
Maintenance of aesthetics values
Maintenance of cultural and spiritual values

13
2.3 Step 3: Determine ecological protection If it has been determined in Step 1, that the water body has an environmental value of
ecosystem health, the officer must then follow Step 3. If not, the officer can go from Step 2
straight to Step 4.
Ecological protection only applies to the environmental value of ecosystem health. The other
environmental values do not require Step 3.
The level of ecological protection is a proposed amount of protection that local stakeholders
and DEC officers decide upon. The ANZECC Water Quality Guidelines outline that there are
4 different levels of ecological protection for ecosystems. These levels of protection are
detailed as trigger values of toxicants. Each toxicant trigger value has different values that
correspond to the different levels of protection. They are 80%,90%,95% and 99% species
protection. This means that if the 99% species protection level is chosen, then 99% of the
current species in the ecosystem should be protected. It is protected if the total toxicant level
in the water body is below the 99% trigger value.
Officers should firstly determine if the receiving water body is freshwater or marine water.
Once the type of water is determined, the officer should then classify the current state of the
water quality of the water body. The ANZECC Water Quality Guidelines outline the 3
different systems. They are:
High conservation/ecological value systems – effectively unmodified or other highly
–valued ecosystems, typically (but not always) occurring in national parks,
conservation reserves or in remote and/or inaccessible locations. Note that while there
are no aquatic ecosystems in Australia that are entirely without some human
influence, the ecological integrity of high conservation/ecological value systems are
regarded as intact. Other water bodies that are classified as high
conservation/ecological systems are water bodies that have an environmental policy
or agreement, for examples water bodies that are under an Environmental Protection
Policy (EPP), State Environmental Policy (SEP), used as a drinking water source by
the Water Corporation or are a Ramsar Convention Wetland.

14
Slightly to moderately disturbed systems – ecosystems in which aquatic biological
diversity may have been adversely affected to a relatively small but measurable
degree by human activity. The biological communities remain in a healthy condition
and ecosystem integrity is largely retained. Typically, freshwater systems would have
slightly to moderately cleared catchments and/or reasonably intact riparian vegetation;
marine systems would have largely intact habitats and associated biological
communities. Slightly-moderately disturbed systems could include rural streams
receiving runoff from land disturbed to varying degrees by grazing or pastoralism, or
marine ecosystems lying immediately adjacent to metropolitan areas.
Highly disturbed systems – measurably degraded ecosystems of lower ecological
value. Examples of highly disturbed systems would be some shipping ports and
sections of harbours serving coastal cities, urban streams receiving road and
stormwater runoff, or rural streams receiving runoff from intensive horticulture.
Eg. The Swan River runs through the heart of metropolitan Perth. Due to the size of the river,
there are many disturbances that occur to many parts of the river. Therefore the Swan River
would be classified as a slightly to moderately disturbed system.

15
2.4 Step 4: Determine environmental quality criteria Using the previously identified environmental values and environmental quality objectives
the officer should determine what environmental quality criteria to use to assess the
acceptability of the proposed emission. As each different environmental value has different
quality criteria, the officer must choose only the criteria that are relevant for that water body.
Environmental quality criteria are numerical figures and values that are outlined in the
ANZECC Water Quality Guidelines that will ensure the maintenance of environmental
quality objectives and protect and conserve environmental values of water bodies. Each
different environmental value has different quality criteria and so the appropriate values must
be chosen. The quality criteria can be guideline values or trigger values, they can also be for
biological, chemical and toxicant contaminants.
Eg. The environmental quality criteria that an officer will use to assess the emission based on
the environmental values of the Swan River are ecosystem health, recreation and aesthetics.
Using the list of concentrations and values of proposed emissions, the officer will go through
each relevant environmental quality criteria to assess if the proposed concentrations and
values are acceptable. There may be several different environmental quality criteria’s for
each environmental value. Ecosystem health for example has a table for toxicant trigger
values, and tables for physical and chemical assessments. The officer must choose the table
that is relevant to the situation.
In the event that a chemical or toxicant is not in the ANZECC guidelines and a trigger value
is required for the assessment, then a reference hierarchy must be followed to locate a
suitable emission to wetlands guideline within Australia or internationally.
Table 2 Table of reference hierarchy
Rank Criteria / Organisation
1 National Australian Guidelines (e.g. National Environmental Protection Measures (NEPMs))
2 World Health Organisation
3 United Kingdom – Environmental Agency, H1 Annex D-Basic Surface water discharges

16
2.4.1 Ecosystem health
2.4.1.1 Toxicant assessment
If the water body has an environmental value of ecosystem health, the officer must complete
Step 3, before moving onto Step 4.
After you have classified the current quality of the water body, you must then decide on what
level of species protection and therefore trigger value should apply.
The toxicant trigger values are based upon a percentage value of the expected protection of
the species in the water body. The protection levels are 80%, 90%, 95% and 99%. Each
protection level has a corresponding trigger value which is outlined in Table 3.4.1 in the
ANZECC Guidelines for fresh and marine water quality and also included below. These
trigger values have been derived from risk assessment principles. They are the best current
estimates of the concentrations of chemicals that should have no significant adverse effects
on the aquatic ecosystem. Therefore these values are a guideline and if the value is exceeded,
it would indicate that a potential environmental problem may occur, and so to ‘trigger’ a
management response.
The trigger values are a value of the total concentration of the chemical in that water body.
Therefore these values are to be compared to the modelled values by the proponent.
DEC expects that all high conservation/ecological systems should have the 99% trigger value
applied to them. If the water body is a part of an EPP, SEP, Water Corporation drinking water
source or Ramsar wetland, the officer must first research the policy and apply any
requirements of the policy first. If the policy does not specify a certain chemical or toxicant,
then the 99% trigger value should be applied.
All other water bodies that are not within a policy or not a high conservation /ecological
system should have the 95% trigger value applied. DEC considers this to be the default
trigger value for all slightly to moderate and highly disturbed systems. Proponents who are
unable to meet the 95% trigger value, must justify why they are unable to meet the 95%
trigger value or why it is not relevant for their application/site. The 90% and 80% trigger
values, may be applied if it can be justified by the proponent.

17
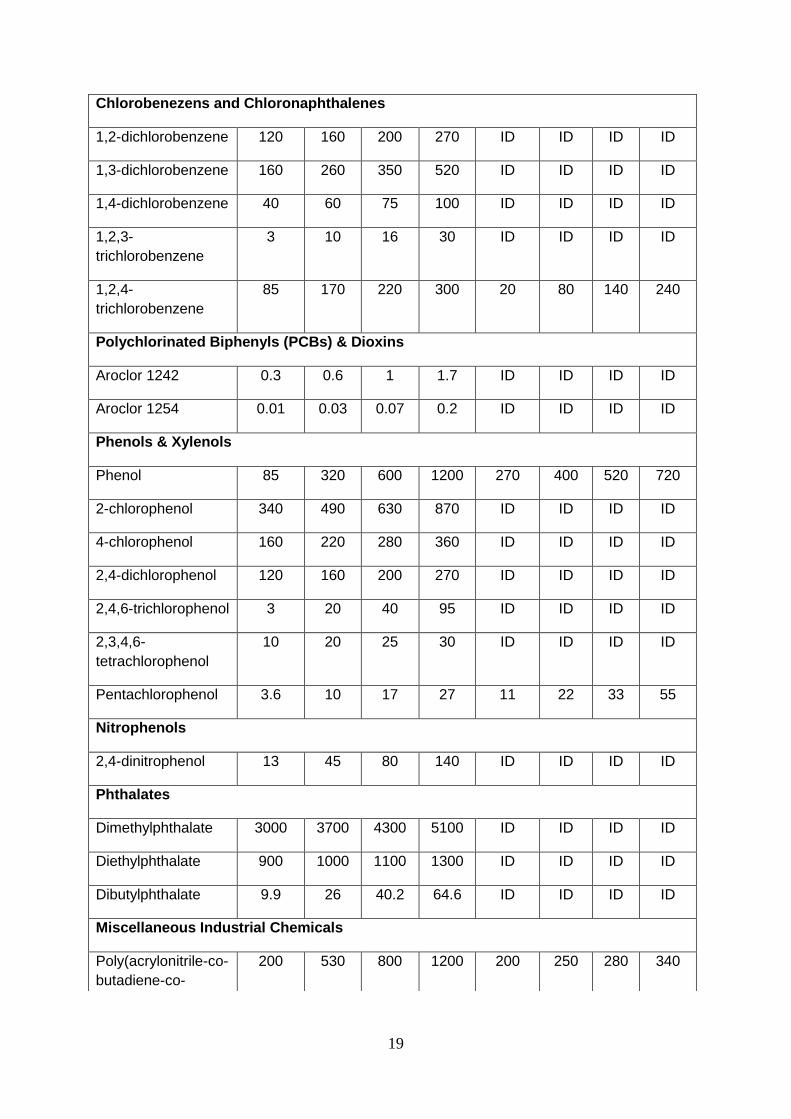
The table below lists toxicants and their respective trigger values for each different level of
protection.
Table 3 List of toxicants and their trigger values for freshwater and marine water (ANZECC,
2000)
Chemical Trigger values for freshwater
(µg/L)
Trigger values for marine water
(µg/L)
Level of protection (% species) Level of protection (% species)
99% 95% 90% 80% 99% 95% 90% 80%
Metals & Metalloids
Aluminium pH > 6.5 27 55 80 150 ID ID ID ID
Arsenic (As III) 1 24 94 360 ID ID ID ID
Arsenic (As V) 0.8 13 42 140 ID ID ID ID
Boron 90 370 680 1300 ID ID ID ID
Cadmium 0.06 0.2 0.4 0.8 0.7 5.5 14 36
Chromium (Cr III) ID ID ID ID 7.7 27.4 48.6 90.6
Chromium (Cr VI) 0.01 1 6 40 0.14 4.4 20 85
Cobalt ID ID ID ID 0.005 1 14 150
Copper 1 1.4 1.8 2.5 0.3 1.3 3 8
Lead 1 3.4 5.6 9.4 2.2 4.4 6.6 12
Manganese 1200 1900 2500 3600 ID ID ID ID
Mercury (inorganic) 0.06 0.6 1.9 5.4 0.1 0.4 0.7 1.4
Nickel 8 11 13 17 7 70 200 560
Selenium (Total) 5 11 18 34 ID ID ID ID
Silver 0.02 0.05 0.1 0.2 0.8 1.4 1.8 2.6
Tributyltin (as µg/L
Sn)
ID ID ID ID 0.0004 0.006 0.02 0.05
Vanadium ID ID ID ID 50 100 160 280

18
Zinc 2.4 8 15 31 7 15 23 43
Non-metallic Inorganics
Ammonia 320 900 1430 2300 500 910 1200 1700
Chlorine 0.4 3 6 13 ID ID ID ID
Cyanide 4 7 11 18 2 4 7 14
Nitrate 17 700 3400 17000 ID ID ID ID
Hydrogen sulfide 0.5 1 1.5 2.6 ID ID ID ID
Organic Alcohols
Ethanol 400 1400 2400 4000 ID ID ID ID
Chlorinated Alkanes
1,1,2-trichloroethane 5400 6500 7300 8400 140 1900 5800 18000
Hexachloroethane 290 360 420 500 ID ID ID ID
Anilines
Aniline 8 250 1100 4800 ID ID ID ID
2,4-dichloroaniline 0.6 7 20 60 ID ID ID ID
3,4-dichloroaniline 1.3 3 6 13 85 150 190 260
Aromatic Hydrocarbons
Benzene 600 950 1300 2000 500 700 900 1300
o-xylene 200 350 470 640 ID ID ID ID
p-xylene 140 200 250 340 ID ID ID ID
Polycyclic Aromatic Hydrocarbons
Naphthalene 2.5 16 37 85 50 70 90 120
Nitrobenzenes
Nitrobenzene 230 550 820 1300 ID ID ID ID
Nitrotoluenes
2,4-dinitrotoluene 16 65 130 250 ID ID ID ID
2,4,6-trinitrotoluene 100 140 160 210 ID ID ID ID
19
Chlorobenezens and Chloronaphthalenes
1,2-dichlorobenzene 120 160 200 270 ID ID ID ID
1,3-dichlorobenzene 160 260 350 520 ID ID ID ID
1,4-dichlorobenzene 40 60 75 100 ID ID ID ID
1,2,3-
trichlorobenzene
3 10 16 30 ID ID ID ID
1,2,4-
trichlorobenzene
85 170 220 300 20 80 140 240
Polychlorinated Biphenyls (PCBs) & Dioxins
Aroclor 1242 0.3 0.6 1 1.7 ID ID ID ID
Aroclor 1254 0.01 0.03 0.07 0.2 ID ID ID ID
Phenols & Xylenols
Phenol 85 320 600 1200 270 400 520 720
2-chlorophenol 340 490 630 870 ID ID ID ID
4-chlorophenol 160 220 280 360 ID ID ID ID
2,4-dichlorophenol 120 160 200 270 ID ID ID ID
2,4,6-trichlorophenol 3 20 40 95 ID ID ID ID
2,3,4,6-
tetrachlorophenol
10 20 25 30 ID ID ID ID
Pentachlorophenol 3.6 10 17 27 11 22 33 55
Nitrophenols
2,4-dinitrophenol 13 45 80 140 ID ID ID ID
Phthalates
Dimethylphthalate 3000 3700 4300 5100 ID ID ID ID
Diethylphthalate 900 1000 1100 1300 ID ID ID ID
Dibutylphthalate 9.9 26 40.2 64.6 ID ID ID ID
Miscellaneous Industrial Chemicals
Poly(acrylonitrile-co-
butadiene-co-
200 530 800 1200 200 250 280 340

20
styrene)
Organochlorine Pesticides
Chlordane 0.03 0.08 0.14 0.27 ID ID ID ID
DDT 0.006 0.01 0.02 0.04 ID ID ID ID
Endosulfan 0.03 0.2 0.6 1.8 0.005 0.01 0.02 0.05
Endrin 0.01 0.02 0.04 0.06 0.004 0.008 0.01 0.02
Heptachlor 0.01 0.09 0.25 0.7 ID ID ID ID
Lindane 0.07 0.2 0.4 1 ID ID ID ID
Toxaphene 0.1 0.2 0.3 0.5 ID ID ID ID
Organophosphorus Pesticides
Azinphos methyl 0.01 0.02 0.05 0.11 ID ID ID ID
Chlorpyrifos 0.00004 0.01 0.11 1.2 0.0005 0.009 0.04 0.3
Diazinon 0.00003 0.01 0.2 2 ID ID ID ID
Dimethoate 0.1 0.15 0.2 0.3 ID ID ID ID
Fenitrothion 0.1 0.2 0.3 0.4 ID ID ID ID
Malathion 0.002 0.05 0.2 1.1 ID ID ID ID
Parathion 0.0007 0.004 0.01 0.04 ID ID ID ID
Temephos ID ID ID ID 0.0004 0.05 0.4 3.6
Carbamate & Other Pesticides
Carbofuran 0.06 1.2 4 15 ID ID ID ID
Methomyl 0.5 3.5 9.5 23 ID ID ID ID
Pyrethroids
Esfenvalerate ID 0.001 ID ID ID ID ID ID
Bypyridilium Herbicides
Diquat 0.01 1.4 10 80 ID ID ID ID
Phenoxyacetic Acid Herbicides
2,4-D 140 280 450 830 ID ID ID ID

21
2,4,5-T 3 36 100 290 ID ID ID ID
Thiocarbamate Herbicides
Molinate 0.1 3.4 14 57 ID ID ID ID
Thiobencarb 1 2.8 4.6 8 ID ID ID ID
Thiram 0.01 0.2 0.8 3 ID ID ID ID
Triazine Herbicides
Atrazine 0.7 13 45 150 ID ID ID ID
Simazine 0.2 3.2 11 35 ID ID ID ID
Urea Herbicides
Tebuthiuron 0.02 2.2 20 160 ID ID ID ID
Miscellaneous Herbicides
Glyphosate 370 1200 2000 3600 ID ID ID ID
Trifluralin 2.6 4.4 6 9 ID ID ID ID
Surfactants
Linear alkylbenzene
sulfonates (LAS)
65 280 520 1000 ID ID ID ID
Alcohol
ethoxyolated sulfate
(AES)
340 650 850 1100 ID ID ID ID
Alcohol ethoxylated
surfactants (AE)
50 140 220 360 ID ID ID ID
Oil Spill Dispersants
Corexit 9527 ID ID ID ID 230 1100 2200 4400

22
Eg. The Swan River is connected to a few different inlets and catchments. The lower reaches
of the river is connected to an estuary and it is also connected to the Indian Ocean at
Fremantle. There is both freshwater and marine water present in the Swan River. In a case
like this, the officer can either do more research into the real constituents of the water body,
or they can choose the water which has the lowest trigger value.
The Swan River would be classified as a slightly to moderately disturbed system. Therefore
the 95% trigger value would apply.
If the proponent wanted to emit copper and lead into the Swan River, the officer must apply
the 95% trigger values.
The copper 95% trigger values for freshwater is 1.4 µg/L and 1.3 µg/L for marine water.
The lead 95% trigger values for freshwater is 3.4 µg/L and 4.4 µg/L for marine water.
As the Swan River can have both freshwater and marine water, the officer must choose the
lower value.
Therefore the total concentration of copper after the emission is received by the water body is
1.3 µg/L. The total concentration of lead after the emission is received by the water body is
3.4 µg/L.
The marine water trigger value was used for copper and the freshwater trigger value was used
for lead, as they were lower than the other trigger value.
The officer will run through all the contaminants that are proposed to be emitted to assess
whether these emissions are acceptable.
23
2.4.1.2 Physical and chemical assessment
There are a number of naturally-occurring physical and chemical stressors can cause serious
degradation of aquatic ecosystems when ambient values are too high or too low. If the
emission is likely to trigger a physical or chemical impact, the officer must use the following
tables to assessment the impact.
The following tables, in section 2.4.1.2 only apply to water bodies that are slightly to
moderately disturbed. If the water body being assessed is either a high
conservation/ecological value system, the officer will have to seek further clarification and
advice.
If the water body being assessed is a highly disturbed system, the trigger values for the
slightly to moderately disturbed system can be applied. If the trigger values are too stringent,
the proponent will have to justify why they are unable to meet the trigger values.
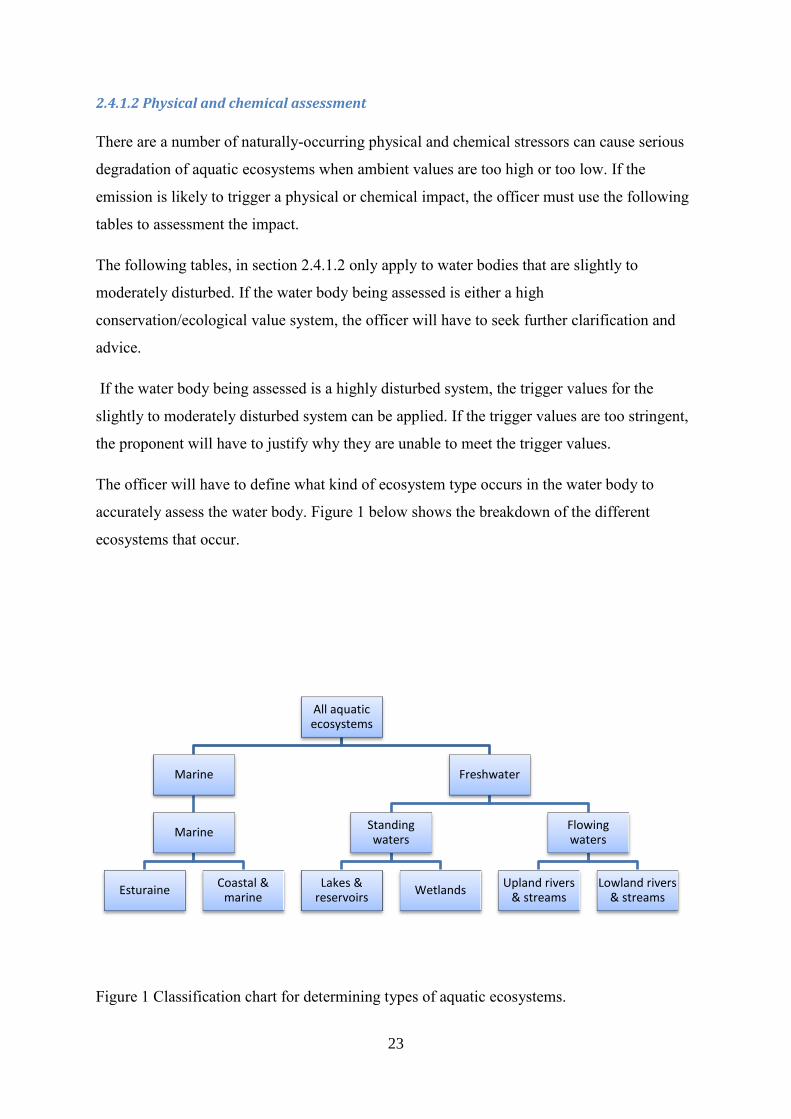
The officer will have to define what kind of ecosystem type occurs in the water body to
accurately assess the water body. Figure 1 below shows the breakdown of the different
ecosystems that occur.
Figure 1 Classification chart for determining types of aquatic ecosystems.
All aquatic ecosystems
Marine
Marine
Esturaine Coastal &
marine
Freshwater
Standing waters
Lakes & reservoirs
Wetlands
Flowing waters
Upland rivers & streams
Lowland rivers & streams

24
The following table lists default trigger values for physical and chemical stressors that apply
to tropical parts of Australia. The north-west of Western Australia is considered tropical
Australia. These values are only for slightly disturbed ecosystems.
Chl a = chlorophyll a
TP = total phosphorus
FRP = filterable reactive phosphate
TN = total nitrogen
NOx = oxides of nitrogen
NH4+ = ammonium
DO = dissolved oxygen
Table 4 Physical and chemical stressor trigger values for slightly disturbed water bodies
located in the north-west of Western Australia (ANZECC, 2000).
NB. Upland rivers are rivers 150m above ground level
Ecosystem
Type Chl a TP FRP TN Nox NH4
+ DO (%
saturation) pH
(µg/L) (µgP/L) (µgP/L) (µgN/L) (µgN/L) (µgN/L)
Lower
limit
Upper
limit
Lower
limit
Upper
limit
Upland
river
No
data 10 5 150 30 6 90 120 6.0 7.5
Lowland
river 5 10 4
200-
300 10 10 85 120 6.0 8.0
Freshwater
lakes &
reservoirs
3 10 5 350 10 10 90 120 6.0 8.0
Wetlands 10 10-50 5-25 350-
1200 10 10 90 120 6.0 8.0
Estuaries 2 20 5 250 30 15 80 120 7.0 8.5
Marine
(inshore)
0.7-
1.4 15 5 100 2-8 1-10 90
No
data 8.0 8.4

25
Marine
(offshore)
0.5-
0.9 10 2-5 100 1-4 1-6 90
No
data 8.2 8.2
Table 5 Salinity and turbidity trigger values for water bodies located in the north-west of
Western Australia (ANZECC, 2000)
NB. Upland rivers are rivers 150m above ground level
Ecosystem Type Salinity (µScm-1) Turbidity (NTU)
Upland and lowland rivers 20-250 2-15
Lakes, reservoirs and wetlands
90-900 2-200
Estuarine and marine 1-20
The follow table lists the default trigger values for physical and chemical stressors that apply
to southern Western Australia. These values are only for slightly disturbed ecosystems.
Table 6 Physical and chemical stressor trigger values for slightly disturbed water bodies
located in the south-west of Western Australia.
NB. Upland rivers are rivers 150m above ground level
Ecosystem
Type Chl a TP FRP TN Nox NH4
+ DO (%
saturation) pH
(µg/L) (µgP/L) (µgP/L) (µgN/L) (µgN/L) (µgN/L)
Lower
limit
Upper
limit
Lower
limit
Upper
limit
Upland
river
No
data 20 10 450 200 60 90
No
data 6.5 8.0
Lowland
river 3-5 65 40 1200 150 80 80 120 6.5 8.0
Freshwater
lakes &
reservoirs
3-5 10 5 350 10 10 90 No
data 6.5 8.0
Wetlands 30 60 30 1500 100 40 90 120 7.0 8.5
Estuaries 3 30 5 750 45 40 90 110 7.5 8.5
Marine
(inshore) 0.7 20 5 230 5 5 90
No
data 8.0 8.4

26
Marine
(offshore) 0.3 20 5 230 5 5 90
No
data 8.2 8.2
Table 7 Salinity and turbidity trigger values for water bodies located in the south-west of
Western Australia
NB. Upland rivers are rivers 150m above ground level
Ecosystem Type Salinity (µScm-1) Turbidity (NTU)
Upland and lowland rivers 120-300 10-20
Lakes, reservoirs and wetlands
300-1500 10-100
Estuarine and marine 1-2
The physical and chemical stressor trigger values should be used as a guide to ensure that the
emission does not cause any degradation of the ecosystem.
27
2.4.2 Primary industry
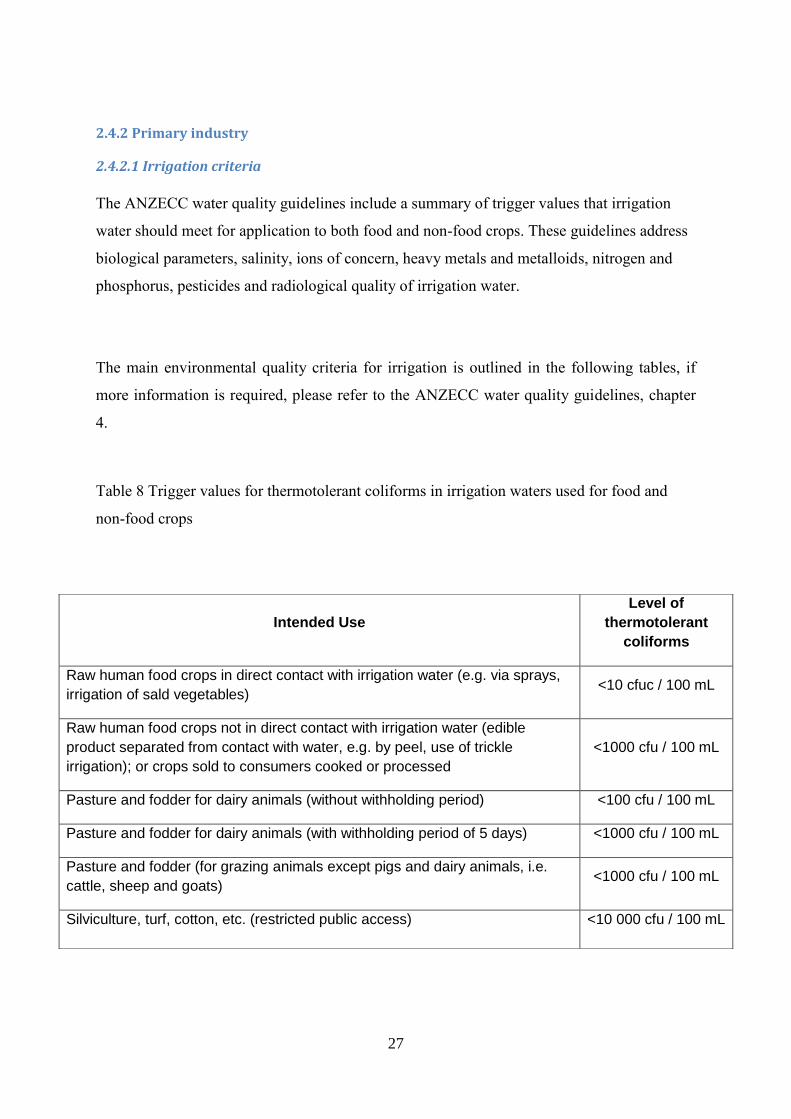
2.4.2.1 Irrigation criteria
The ANZECC water quality guidelines include a summary of trigger values that irrigation
water should meet for application to both food and non-food crops. These guidelines address
biological parameters, salinity, ions of concern, heavy metals and metalloids, nitrogen and
phosphorus, pesticides and radiological quality of irrigation water.
The main environmental quality criteria for irrigation is outlined in the following tables, if
more information is required, please refer to the ANZECC water quality guidelines, chapter
4.
Table 8 Trigger values for thermotolerant coliforms in irrigation waters used for food and
non-food crops
Intended Use
Level of
thermotolerant
coliforms
Raw human food crops in direct contact with irrigation water (e.g. via sprays,
irrigation of sald vegetables) <10 cfuc / 100 mL
Raw human food crops not in direct contact with irrigation water (edible
product separated from contact with water, e.g. by peel, use of trickle
irrigation); or crops sold to consumers cooked or processed
<1000 cfu / 100 mL
Pasture and fodder for dairy animals (without withholding period) <100 cfu / 100 mL
Pasture and fodder for dairy animals (with withholding period of 5 days) <1000 cfu / 100 mL
Pasture and fodder (for grazing animals except pigs and dairy animals, i.e.
cattle, sheep and goats) <1000 cfu / 100 mL
Silviculture, turf, cotton, etc. (restricted public access) <10 000 cfu / 100 mL

28
Table 9 Agricultural irrigation water long-term trigger value (LTV), short-term trigger value
(STV), and cumulative contaminant loading limit (CCL) triggers for heavy metals and
metalloids
NB: ND means there is no data for that element.
Element Suggested soil CCL (kg/ha)
LTV in irrigation water (long-term use - up to
100 yrs) (mg/L)
STV in Irrigation water (short-term use - up to
20 yrs) (mg/L)
Aluminium ND 5 20
Arsenic 20 0.1 2
Beryllium ND 0.1 0.5
Boron ND 0.5
Cadmium 2 0.01 0.05
Chromium ND 0.1 1
Cobalt ND 0.05 0.1
copper 140 0.2 5
Fluoride ND 1 2
Iron ND 0.2 10
Lead 260 2 5
Lithium ND 2.5 2.5
(0.075 Citrus crops) (0.075 Citrus crop)
Manganese ND 0.2 10
Mercury 2 0.002 0.002
Molybdenum ND 0.01 0.05
Nickel 85 0.2 2
Selenium 10 0.02 0.05
Uranium ND 0.01 0.1
Vanadium ND 0.1 0.5
Zinc 300 2 5
29
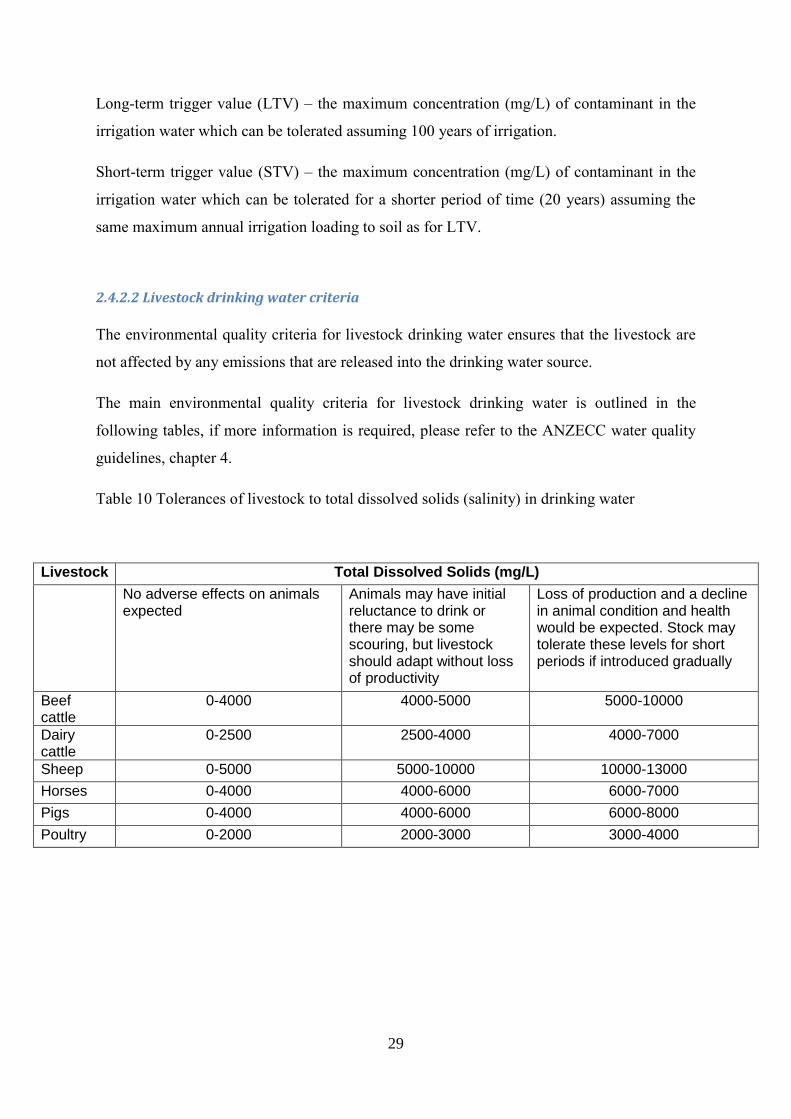
Long-term trigger value (LTV) – the maximum concentration (mg/L) of contaminant in the
irrigation water which can be tolerated assuming 100 years of irrigation.
Short-term trigger value (STV) – the maximum concentration (mg/L) of contaminant in the
irrigation water which can be tolerated for a shorter period of time (20 years) assuming the
same maximum annual irrigation loading to soil as for LTV.
2.4.2.2 Livestock drinking water criteria
The environmental quality criteria for livestock drinking water ensures that the livestock are
not affected by any emissions that are released into the drinking water source.
The main environmental quality criteria for livestock drinking water is outlined in the
following tables, if more information is required, please refer to the ANZECC water quality
guidelines, chapter 4.
Table 10 Tolerances of livestock to total dissolved solids (salinity) in drinking water
Livestock Total Dissolved Solids (mg/L)
No adverse effects on animals expected
Animals may have initial reluctance to drink or there may be some scouring, but livestock should adapt without loss of productivity
Loss of production and a decline in animal condition and health would be expected. Stock may tolerate these levels for short periods if introduced gradually
Beef cattle
0-4000 4000-5000 5000-10000
Dairy cattle
0-2500 2500-4000 4000-7000
Sheep 0-5000 5000-10000 10000-13000
Horses 0-4000 4000-6000 6000-7000
Pigs 0-4000 4000-6000 6000-8000
Poultry 0-2000 2000-3000 3000-4000
30
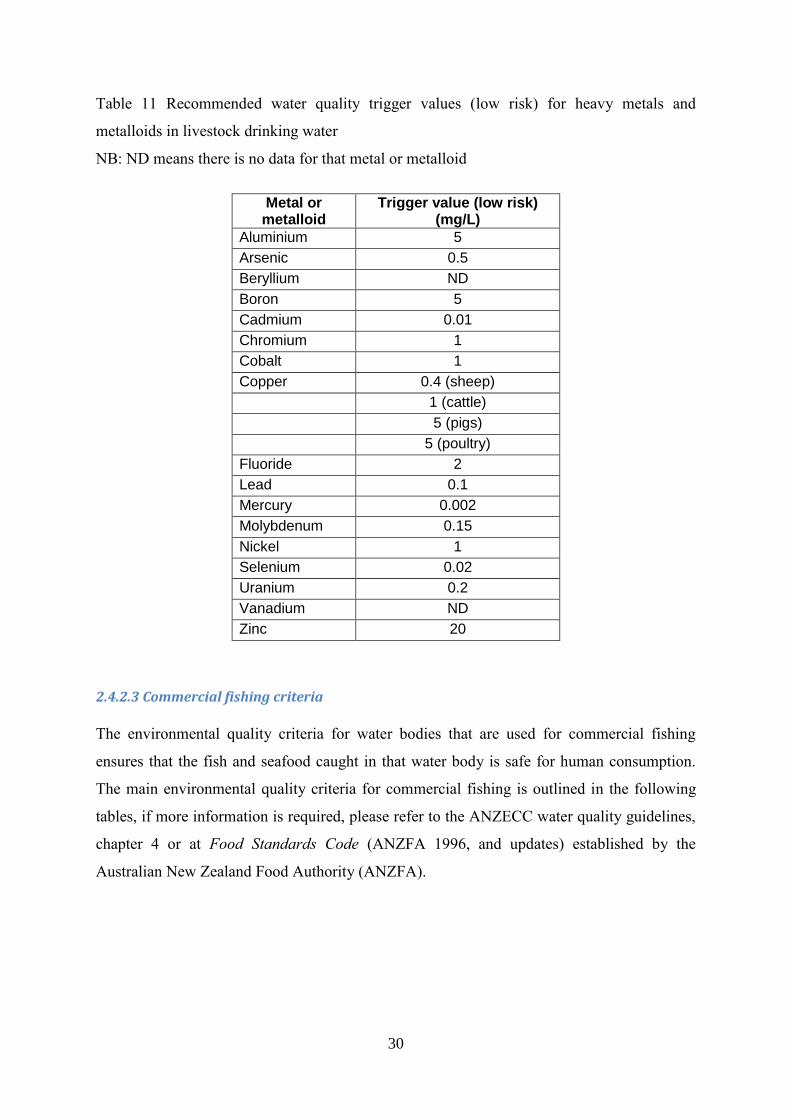
Table 11 Recommended water quality trigger values (low risk) for heavy metals and
metalloids in livestock drinking water
NB: ND means there is no data for that metal or metalloid
Metal or metalloid
Trigger value (low risk) (mg/L)
Aluminium 5
Arsenic 0.5
Beryllium ND
Boron 5
Cadmium 0.01
Chromium 1
Cobalt 1
Copper 0.4 (sheep)
1 (cattle)
5 (pigs)
5 (poultry)
Fluoride 2
Lead 0.1
Mercury 0.002
Molybdenum 0.15
Nickel 1
Selenium 0.02
Uranium 0.2
Vanadium ND
Zinc 20
2.4.2.3 Commercial fishing criteria
The environmental quality criteria for water bodies that are used for commercial fishing
ensures that the fish and seafood caught in that water body is safe for human consumption.
The main environmental quality criteria for commercial fishing is outlined in the following
tables, if more information is required, please refer to the ANZECC water quality guidelines,
chapter 4 or at Food Standards Code (ANZFA 1996, and updates) established by the
Australian New Zealand Food Authority (ANZFA).
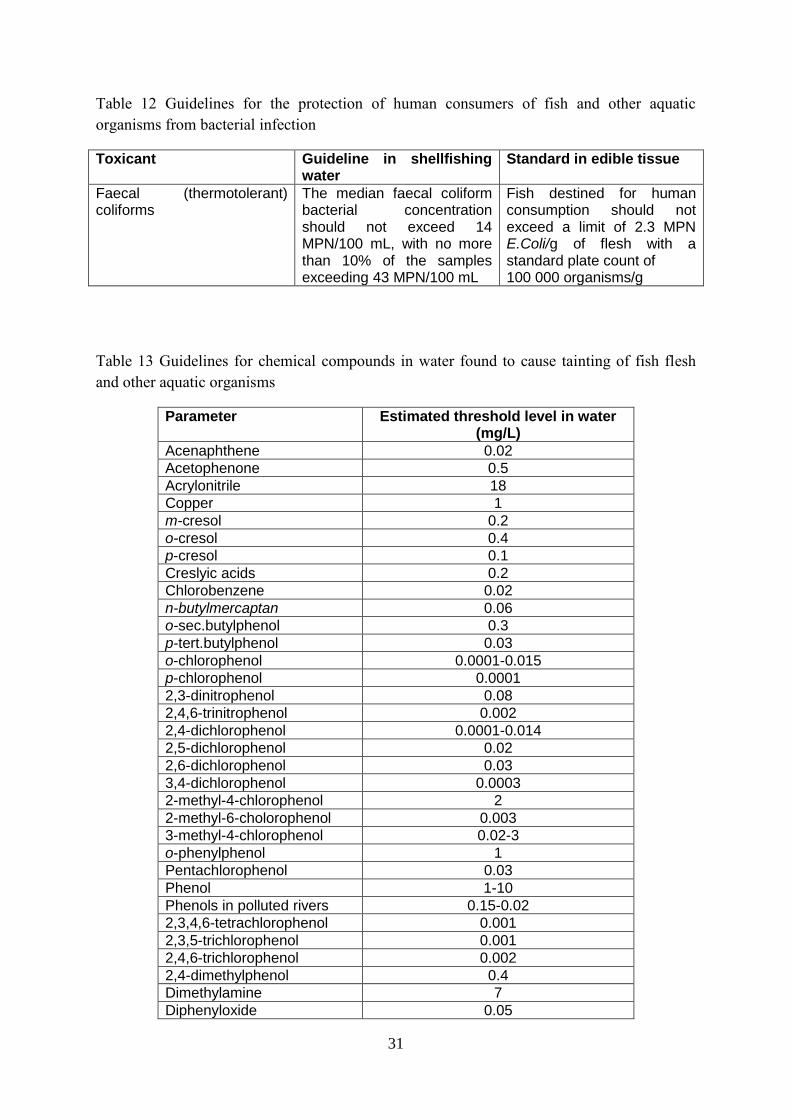
31
Table 12 Guidelines for the protection of human consumers of fish and other aquatic
organisms from bacterial infection
Toxicant Guideline in shellfishing water
Standard in edible tissue
Faecal (thermotolerant) coliforms
The median faecal coliform bacterial concentration should not exceed 14 MPN/100 mL, with no more than 10% of the samples exceeding 43 MPN/100 mL
Fish destined for human consumption should not exceed a limit of 2.3 MPN E.Coli/g of flesh with a standard plate count of 100 000 organisms/g
Table 13 Guidelines for chemical compounds in water found to cause tainting of fish flesh
and other aquatic organisms
Parameter Estimated threshold level in water (mg/L)
Acenaphthene 0.02
Acetophenone 0.5
Acrylonitrile 18
Copper 1
m-cresol 0.2
o-cresol 0.4
p-cresol 0.1
Creslyic acids 0.2
Chlorobenzene 0.02
n-butylmercaptan 0.06
o-sec.butylphenol 0.3
p-tert.butylphenol 0.03
o-chlorophenol 0.0001-0.015
p-chlorophenol 0.0001
2,3-dinitrophenol 0.08
2,4,6-trinitrophenol 0.002
2,4-dichlorophenol 0.0001-0.014
2,5-dichlorophenol 0.02
2,6-dichlorophenol 0.03
3,4-dichlorophenol 0.0003
2-methyl-4-chlorophenol 2
2-methyl-6-cholorophenol 0.003
3-methyl-4-chlorophenol 0.02-3
o-phenylphenol 1
Pentachlorophenol 0.03
Phenol 1-10
Phenols in polluted rivers 0.15-0.02
2,3,4,6-tetrachlorophenol 0.001
2,3,5-trichlorophenol 0.001
2,4,6-trichlorophenol 0.002
2,4-dimethylphenol 0.4
Dimethylamine 7
Diphenyloxide 0.05

32
B,B-dichlorodiethyl ether 0.09-1
o-dichlorobenzene <0.25
Ethylbenzene 0.25
Ethanethiol 0.2
Ethylacrylate 0.6
Formaldehyde 95
Gasoline 0.005
Guaicol 0.08
Kerosene 0.1
Kerosene plus kaolin 1
Hexachlorocyclopentadiene 0.001
Isopropylbenzene <0.25
Naphtha 0.1
Naphthalene 1
Naphthol 0.5
2-Naphthol 0.3
Nitrobenzene 0.03
a-methylstyrene 0.25
Oil, emulsifiable >15
Pyridine 5-28
Pyrocatechol 0.8-5
Pyrogallol 20-30
Quinoline 0.5-1
p-quinone 0.5
Styrene 0.25
Toluene 0.25
Outboard motor fuel as exhaust
7.2
Zinc 5
2.4.2.3 Aquaculture criteria
The aquaculture environmental quality criteria ensures that any seafood that is grown is safe
for human consumption. The recommended guidelines for freshwater production and
saltwater production outline that a water body that is within the limit of the entire guideline
values pose a low risk and therefore the water quality is acceptable for the production of
seafood. The main environmental quality criteria for aquaculture is outlined in the following
tables, if more information is required, please refer to the ANZECC water quality guidelines,
chapter 4.

33
Table 14 Physical and chemical stressor guidelines for the protection of aquaculture species
NB: N/A means that data is not available for that guideline
Measured parameter Recommended guideline (mg/L)
Freshwater production Saltwater production
Alkalinity ≥20 >20
Biochemical oxygen demand (BOD)
<15 N/A
Chemical oxygen demand (COD)
<40 N/A
Carbon dioxide <10 <15
Colour and appearance of water 30-40 (Pt-Co units) 30-40 (Pt-Co units)
Dissolved oxygen >5 >5
Gas supersaturation <100% <100
Hardness (CaCO3) 20-100 N/A
pH 5.0-9.0 6.0-9.0
Salinity (total dissolved solids) <3000 33000-37000
(3000-35000 Brackish)
Suspended solids <40 <10
(<75 Brackish)
Temperature <2oC change over 1 hour <2oC change over 1
hour
Table 15 Toxicant guidelines for the protection of aquaculture species
NB: N/A means that data is not available for that guideline
Measured parameter Guideline (µg/L)
Freshwater production Saltwater production
Inorganic Toxicants (heavy metals and others)
Aluminium <30 (pH >6.5) <10
<10 (pH <6.5)
Ammonia (un-ionised) <20 (pH >8.0) coldwater <100
<30 warmwater
Arsenic <50 <30
Cadmium (varies with hardness) <0.2-1.8 <0.5-5
Chlorine <3 <3
Chromium <20 <20
Copper (varies with hardness) <5 <5
Cyanide <5 <5
Fluorides <20 N/A
Hydrogen sulfide <1 <2

34
Iron <10 <10
Lead (varies with hardness) <1-7 <1-7
Magnesium <15 000 N/A
Manganese <10 <10
Mercury <1 <1
Nickel <100 <100
Nitrate (NO3-) <50 000 <100 000
Nitrite (NO2) <100 <100
Phosphates <100 <50
Selenium <10 <10
Silver <3 <3
Tributyltin (TBT) <0.026 <0.01
Total available nitrogen (TAN) <1000 <1000
Vanadium <100 <100
Zinc <5 <5
Organic Toxicants (non-pesticides)
Detergents and surfactants <0.1 N/A
Methane <65 000 <65 000
Oils and greases (including petrochemicals)
<300 N/A
Phenols and chlorinated phenols <0.6-1.7 N/A
Polychlorinated biphenyls (PCBs) <2 <2
Pesticides
2,4-dichlorophenol <4 N/A
Aldrin <0.01 N/A
Azinphos-methyl <0.1 N/A
Chlordane <0.1 0.004
Chlorpyrifos <0.001 N/A
DDT (including DDD & DDE) <0.0015 N/A
Demton <0.01 N/A
Dieldrin <0.005 N/A
Endosulfan <0.003 0.001
Endrin <0.002 N/A
Gunthion <0.01 N/A
Hexachlorobenzole <0.00001 N/A
Heptachlor <0.005 N/A
Lindane <0.01 0.004
Malathion <0.1 N/A
Methoxychlor <0.03 N/A
Mirex <0.001 N/A
Paraquat N/A <0.01
Parathion <0.04 N/A
Toxaphene <0.002 N/A
35
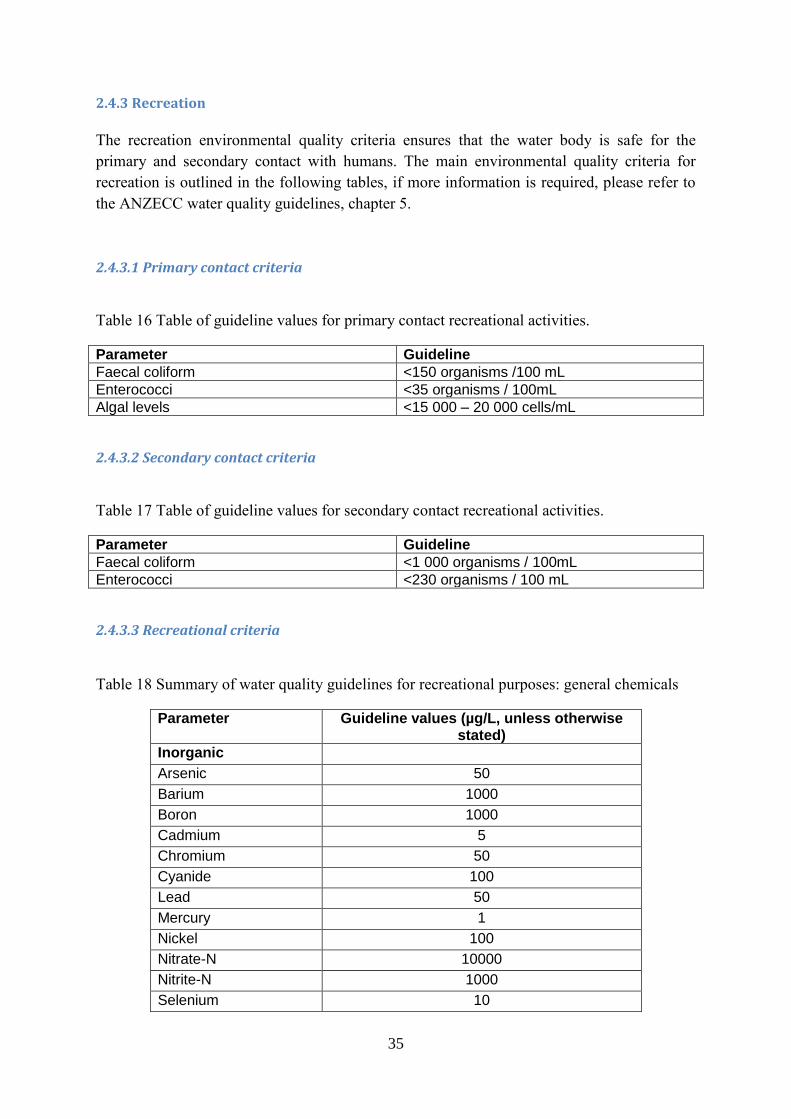
2.4.3 Recreation
The recreation environmental quality criteria ensures that the water body is safe for the
primary and secondary contact with humans. The main environmental quality criteria for
recreation is outlined in the following tables, if more information is required, please refer to
the ANZECC water quality guidelines, chapter 5.
2.4.3.1 Primary contact criteria
Table 16 Table of guideline values for primary contact recreational activities.
Parameter Guideline
Faecal coliform <150 organisms /100 mL
Enterococci <35 organisms / 100mL
Algal levels <15 000 – 20 000 cells/mL
2.4.3.2 Secondary contact criteria
Table 17 Table of guideline values for secondary contact recreational activities.
Parameter Guideline
Faecal coliform <1 000 organisms / 100mL
Enterococci <230 organisms / 100 mL
2.4.3.3 Recreational criteria
Table 18 Summary of water quality guidelines for recreational purposes: general chemicals
Parameter Guideline values (µg/L, unless otherwise stated)
Inorganic
Arsenic 50
Barium 1000
Boron 1000
Cadmium 5
Chromium 50
Cyanide 100
Lead 50
Mercury 1
Nickel 100
Nitrate-N 10000
Nitrite-N 1000
Selenium 10

36
Silver 50
Organic
Benzene 10
Benzo(a)pyrene 0.01
Carbon tetrachloride 3
1,1-Dichloroethene 0.3
1,2-Dichloroethane 10
Pentachlorophenol 10
Polychlorinated biphenyls
0.1
Tetrachloroethene 10
2,3,4,6-Tetrachlorophenol
1
Trichloroethene 30
2,4,5-Trichlorophenol 1
2,4,6-Trichlorophenol 10
Other chemicals
Aluminium 200
Ammonia (as N) 10
Chloride 400000
Copper 1000
Oxygen >6.5 (>80% saturation)
Hardness (as CaCO3) 500000
Iron 300
Manganese 100
Organics (CCE & CAE) 200
pH 6.5-8.5
Phenolics 2
Sodium 300000
Sulfate 400000
Sulfide 50
Surfactant (MBAS) 200
Total dissolved solids 1000000
Zinc 5000

37
Table 19 Summary of water quality guidelines for recreational purposes: pesticides
Compound Maximum
concentration (µg/L) Compound
Maximum concentration (µg/L)
Acephate 20 Fenvalerate 40
Alachlor 3 Flamprop-methyl 6
Aldrin 1 Fluometuron 100
Amitrol 1 Formothion 100
Asulam 100 Fosamine (ammonium salt)
3000
Azinphos-methyl 10 Glyphosate 200
Barban 300 Heptachlor 3
Benomyl 200 Hexaflurate 60
Bentazone 400 Hexazinone 600
Bioresmethrin 60 Lindane 10
Bromazil 600 Maldison 100
Bromophos-ethyl 20 Methidathion 60
Bromoxynil 30 Methomyl 60
Carbaryl 60 Metolachlor 800
Carbendazim 200 Metribuzin 5
Carbofuran 30 Mevinphos 6
Carbophenothion 1 Molinate 1
Chlordane 6 Monocrotophos 2
Chlordimeform 20 Nabam 30
Chlorfenvinphos 10 Nitralin 1000
Chloroxuron 30 Omethoate 0.4
Chlorpyrifos 2 Oryzalin 60
Clopzralid 1000 Paraquat 40
Cyhexatin 200 Parathion 30
2,4-D 100 Parathion-methyl 6
DDT 3 Pendimethalin 600
Demeton 30 Perfluidone 20
Diazinon 10 Permethrin 300
Dicamba 300 Picloram 30
Dichlobenil 20 Piperonyl butoxide 200
3,6-Dichloropicolinic acid
1000 Pirimicarb 100
Dichlorvos 20 Pirimiphos-ethyl 1
Diclofop-methyl 3 Pirimiphos-methyl 60
Dicofol 100 Profenofos 0.6
Dieldrin 1 Promecarb 60
Difenzoquat 200 Propanil 1000
Dimethoate 100 Propargite 1000
Diquat 10 Propoxur 1000
Disulfoton 6 Pyrazophos 1000

38
Diuron 40 Quintozene 6
DPA 500 Sulprofos 20
Endosulfan 40 2,4,5-T 2
Endothal 600 Temephos 30
Endrin 1 Thiobencarb 40
EPTC 60 Thiometon 20
Ethion 6 Thiophanate 100
Ethoprophos 1 Thiram 30
Fenchlorphos 60 Trichlorofon 10
Fenitrothion 20 Triclopyr 20
Fenoprop 20 Trifluralin 500
Fensulfothion 20
2.4.3.3 Aesthetics criteria
The environmental quality criteria for the aesthetics of a water body ensure that the water
body has a pleasant look. This is important as the public will not patron a water body that has
a repulsive appearance. The main environmental quality criteria for aesthetics is outlined in
the following tables, if more information is required, please refer to the ANZECC water
quality guidelines, chapter 5.
Table 20 table of guidelines values for aesthetic purposes
Parameter Guideline
Visual clarity & colour Natural visual clarity should not be reduced by more than 20%
Natural hue of the water should not be changed by more than 10 points on the Munsell scale
Natural reflectance of the water should not be changed by more than 50%
pH 5.0-9.0
Temperature 15-35oC
39
2.5 Step 5: Determine licence conditions
The licence conditions are the requirements that the proponent must meet to ensure that they
are within their licence. After the officer has assessed the proposed values and concentrations
of the proposed emissions, it is time for the officer to decide if it is acceptable for the licence.
If all the different constituents are at acceptable levels and all the modelling is sound, the
officer can accept the licence conditions. If the modelled emission is less than the trigger or
guideline value, the officer must use that modelled emission value as it is lower than the
trigger or guideline value.
Eg. If the proposed emission of copper for a slightly to moderately disturbed freshwater body
with the environmental value of ecosystem health is 0.8 µg/L. Then the officer will insert the
proposed value of 0.8 µg/L rather than the corresponding trigger value of 1.4 µg/L.

40
3 Future work The next step for this document is to be internally reviewed by the DEC. The document will
be reviewed by a few main environmental officers, where their input and comments will be
discussed and added to the document if appropriate. After this, the document will be put onto
the DEC’s intranet where all employees of the DEC can have a read of the document and
comment on the document. Discussions will take place to consider the comments and
changes will be made if appropriate. After that, the document is ready be approved by the
department manager and it will be implemented by the manager. The document will then be
made into an online training module so that all current and future environmental officers can
learn how to use the document.

41
4 Conclusion This document will be an integral piece of the reform project at the DEC. Once this document
is set into place, the guidance document for the assessment of an emission to air and land will
revamped in the same lay out and structure of this document. This will ensure that all
proponents that are applying for multiple DEC licences will see a consistent format and will
not have any problems with correctly completing out the application form. The consistency
and simplicity of the application form will benefit both the applicants and the environmental
officers reviewing the application forms. This will improve productivity and will hopefully
decrease the time taken to assess applications and ultimately make the application process
more efficient.

42
5 References
Australian and New Zealand Environment and Conservation Council and Agriculture and Resource
Management Council of Australia and New Zealand. “An Introduction to the Australian and
New Zealand Guidelines for Fresh and Marine Water Quality.” 2000.
Australian and New Zealand Environment and Conservation Council and Agriculture and Resource
Management Council of Australia and New Zealand. “Guidelines for Sewerage Systems -
Acceptance of Trade Waste.” 2004.
Department of Environment and Conservation (WA). “Assessment levels for Soil, Sediment and
Water.” Perth, 2010.
Department of Environment and Resource Management (QLD). “Water Monitoring Data Collection
Standards.” 2007.
Department of Water. “Industrial Wastewater Mangement and Disposal.” Water Quality Protection
Note, 2009.
Department of Water. “Proclaimed Public Drinking Water Source Areas.” Water Quality Protection
Note, 2009.
Environmental Protection Authority (WA). “Perth's Coastal Water - Environmental Values and
Objectives.” Perth, 2000.
National Environment Protection Council. “Guideline on the Investigation Levels for Soil and
Groundwater.” 1999.
National Health and Medical Research Council. “Australian Drinking Water Guidelines 6.” 2011.
National Health and Medical Research Council. “Australian Guidelines for Water Recycling: Managing
Health and Environmental Risks (Phase 1).” 2006.
National Health and Medical Research Council. “Australian Guidelines for Water Recycling: Managing
Health and Environmental Risks (Phase 2) - Augmentation of Drinking Water Supplies.” 2008.
Water Services Association of Australia. “National Wastewater Source Management Guideline.”
2008.
World Health Organization. “Guidelines for Drinking-water Quality.” 2011.