Embed Size (px)
Citation preview

Department of Environment and Conservation
2012–13 Annual Report
WEST E R N A U S T R ALIA
TH
E
GO V E R N M ENT OF

ACKNOWLEDGMENTS
This report was prepared by the Corporate Communications Branch of the Department of Environment and Conservation.
Note: The Department of Environment and Conservation was separated into the Department of Parks and Wildlife and the Department of Environment Regulation on 1 July 2013.
For more information contact:
Department of Environment Regulation
Level 4 The Atrium 168 St Georges Terrace Perth Western Australia 6000
Locked Bag 33 Cloisters Square Perth Western Australia 6850
Telephone (08) 6467 5000 Facsimile (08) 6467 5562
Recommended reference
The recommended reference for this publication is:
Department of Environment and Conservation 2012–13 Annual Report, Department of Environment and Conservation, 2013 Copies of this document are available in alternative formats on request.
ISSN 1835-1131 (Print) ISSN 1835-114X (Online)
September 2013
Photographs
Cover
Clockwise: Technical officer Judy Dunlop with a golden bandicoot (Isoodon auratus), photo: Brent Johnson/DEC; green turtle (Chelonia mydas) at the Labyrinth dive site in Lighthouse Bay, Ningaloo, photo: Tony Howard/DEC; Cochlospermum macnamarae, a Pilbara shrub named in honour of DEC’s Director General, the late Keiran McNamara, photo: Daniel Brassington/Western Botanical; environmental officer Yash Pal, photo: Shem Bisluk/DEC; 26 cyclists completing the first end-to-end ride of the 1,000 kilometre-long Munda Biddi Trail, photo: Terry Goodlich/DEC; kangaroo engraving, Murujuga National Park, Burrup Peninsula, photo: Mike Bodsworth/DEC.
See inside back cover for captions to page header pictures.
Department of Parks and Wildlife
17 Dick Perry Avenue Technology Park, Western Precinct Kensington Western Australia 6151
Locked Bag 104 Bentley Delivery Centre Western Australia 6983
Telephone (08) 9219 9000 Facsimile (08) 9334 0498

Department of Environment and Conservation
2012–13 Annual Report

DEPARTMENT OF ENVIRONMENT AND CONSERVATION 2012–13 ANNUAL REPORTB

DEPARTMENT OF ENVIRONMENT AND CONSERVATION 2012–13 ANNUAL REPORT i
LETTER TO THE MINISTER
Hon Albert Jacob MLA
Minister for Environment
In accordance with section 63 of the Financial Management Act 2006, I have pleasure in submitting for presentation to Parliament the Annual Report of the Department of Environment and Conservation for the period 1 July 2012 to 30 June 2013.
This report has been prepared in accordance with provisions of the Financial Management Act 2006.
Jim Sharp
Acting Director General

DEPARTMENT OF ENVIRONMENT AND CONSERVATION 2012–13 ANNUAL REPORTii
DIRECTOR GENERAL’S FOREWORD
This annual report is the last one delivered by the Department of Environment and Conservation (DEC), which on 1 July 2013 was separated by the government into the Department of Parks and Wildlife (DPaW) and Department of Environment Regulation (DER). Broadly, the Parks and Visitor Services, Nature Conservation and Sustainable Forest Management services of DEC became part of DPaW, while the Environmental Regulation and Environmental Sustainability and Climate Change services of DEC became part of DER.
DEC’s final year of operations delivered important conservation outcomes, including the creation of the state’s 100th national park, but was also marred by tragedy.
In November 2012, DEC firefighter Wendy Bearfoot died as a result of injuries sustained when she, along with several other DEC and brigade firefighters, was caught in a burn-over incident while fighting a bushfire near Two Peoples Bay Nature Reserve in the South Coast Region. Wendy’s death, the severe injuries suffered by her colleague, the devastation caused to families and friends, and the
impact the incident had on staff involved are a stark reminder of the dangers firefighters face and the stress associated with critical incident response.
WorkSafe issued DEC with 10 Improvement Notices following its investigation into the incident. The notices dealt with crew protection, vehicle modifications, training and information and the department is actively addressing the matters covered with the intent of managing and reducing risk to staff. The department is committed to satisfying the directives in the notices, as well as addressing any other issues that may compromise the safety or wellbeing of DEC staff during fire management activities. To this end, DEC appointed a full-time chaplain in January 2013. The chaplaincy program was developed following consultation with Western Australia Police, Department of Fire and Emergency Services and The Salvation Army.
In March 2013, DEC’s long-serving Director General Keiran McNamara died after a short illness. He was a remarkable public servant who made an exceptional contribution to the environment and to the development of Western Australia. He joined the former Department of Conservation and Land Management (CALM) in July 1985 and went on to become the Chief Executive Officer of CALM in July 2001 and then Director General of DEC in July 2006 following the merger of the Department of Environment and CALM.
The creation of Murujuga National Park on the Burrup Peninsula is significant in that not only is it the State’s 100th national park, it is the first one comprised of freehold land and the first to be managed under a joint management agreement under the amended Conservation and Land Management Act. The land within the park is owned by the Murujuga Aboriginal Corporation which is jointly managing the park with the department.
Among the other achievements that were the culmination of many years of work were the creation of Eighty Mile Beach Marine Park, part of the government’s investment in conservation to protect wilderness areas in the Kimberley; the completion of a Proposed Forest Management Plan 2014–2013; and the completion of the Munda Biddi Trail which now gives off-road cyclists the opportunity of riding all the way from Mundaring to Albany along a scenic 1,000-kilometre trail that passes through the state’s beautiful South West.
In the area of environmental regulation, further progress was made in improving the regulation of prescribed premises through the department’s licensing reform program.
The scope of DEC’s activities has been wide and the department’s members of staff have tackled the many challenges faced with professionalism and commitment. As we move into a new era, I want to take this opportunity to express my sincere thanks to staff across the state. I am confident the diverse services DEC provided across the state will be delivered with renewed vigour by DPaW and DER.
My thanks also go to DEC’s 4,717 volunteers and the many community-based and other organisations that assisted with a wide range projects and I look forward to their continued involvement and support through the programs that will continue under the auspices of DPaW and DER.

DEPARTMENT OF ENVIRONMENT AND CONSERVATION 2012–13 ANNUAL REPORT iii
I would also like to take this opportunity to acknowledge the work of the members of the Conservation Commission of Western Australia and the Marine Parks and Reserves Authority, along with members of the Waste Authority, Keep Australia Beautiful Council, the Swan River Trust and the Contaminated Sites Committee, to which DEC provided advice and support.
Jim Sharp
Acting Director General – Department of Parks and Wildlife (Acting Director General Department of Environment and Conservation until 30 June 2013)
September 2013
DIRECTOR GENERAL’S FOREWORD

DEPARTMENT OF ENVIRONMENT AND CONSERVATION 2012–13 ANNUAL REPORTiv
CONTENTS
Letter to the Minister i
Director General’s foreword ii
OVERVIEW OF AGENCY 1
Executive summary 2
Protecting our biodiversity 2
Ensuring the future of our forests 3
Managing our parks and reserves 4
Environmental regulation and assessment 5
Sustainability 6
Fire management 7
Operational structure 8
Enabling Legislation 8
Responsible Minister 8
Legislation administered by DEC at 30 June 2013 8
Changes made in 2012–13 to legislation administered 9
Notices, Orders and Approvals 11
DEC Organisational Chart 12
Performance management framework 13
Changes from the 2011–12 reporting year 14
Shared responsibilities with other agencies 14
AGENCY PERFORMANCE 15
Report on operations 16
Service 1: Nature Conservation 16
Service 2: Sustainable Forest Management 21
Service 3: Parks and Visitor Services 24
Service 4: Environmental Regulation 30
Service 5: Environmental Sustainability and Climate Change 34
Supporting our department 38
Strategic Development and Corporate Affairs 38
Environmental Enforcement Unit 39
Legal Services Branch 40
Fire Management Services Branch 40
Science Division 44

DEPARTMENT OF ENVIRONMENT AND CONSERVATION 2012–13 ANNUAL REPORT v
CONTENTS
Office for Information Management 45
Geographic Information Services 46
Corporate Information Services 47
Financial Services Branch 47
People Services Branch 47
DEC-managed lands and waters 48
SIGNIFICANT ISSUES AND TRENDS 55
DISCLOSURES AND LEGAL COMPLIANCE 57
Certification 58
Auditor General’s opinion 59
Financial Statements 62
Certification of Key Performance Indicators 113
Key Performance indicators 114
Ministerial directives 124
Other financial disclosures 124
Pricing policies 124
Capital works: incomplete and completed 124
Employment and industrial relations 124
Governance disclosures 128
Other legal requirements 129
Advertising (Electoral Act 1907, s175ZE) 129
Disability access and inclusion plan outcomes (Disability Services Act 1993, s29) 130
Compliance statements 132
Recordkeeping plans (State Records Act 2000, s61, State Records Commission Standards) 133
Government policy requirements 134
Substantive equality 134
Occupational safety, health and injury management 134

DEPARTMENT OF ENVIRONMENT AND CONSERVATION 2012–13 ANNUAL REPORTvi

DEPARTMENT OF ENVIRONMENT AND CONSERVATION 2012–13 ANNUAL REPORT 1
Clockwise from the left: Aboriginal heritage officer Delvene Cornwall, Aboriginal Heritage Unit (AHU) Midwest project officer Chontarle Bellottie, South West Native Title, culture and heritage liaison officer Karim Khan, AHU senior project officer Rhonda Murphy, Warren Region indigenous liaison officer Ian Michael and AHU project officer Bel Cox. Photo: Peter Nicholas/DEC
OVERVIEW OF AGENCY
DEPARTMENT OF ENVIRONMENT AND CONSERVATION 2012–13 ANNUAL REPORT2
EXECUTIVE SUMMARY
EXECUTIVE SUMMARY
The Department of Environment and Conservation (DEC) was formed in July 2006 by the merging of the Department of Environment and the former Department of Conservation and Land Management. The 2012–13 financial year was the final year of operation of DEC, which was separated into the Department of Environment Regulation and the Department of Parks and Wildlife on 1 July 2013. DEC’s key responsibilities included broad roles in conserving biodiversity, and protecting, managing, regulating and assessing many aspects of the use of the state’s natural resources. During 2012–13, significant achievements included the creation of Western Australia’s 100th national park; continued progress in involving Aboriginal people in the management of parks, with the first joint-management agreement reached under the amended Conservation and Land Management Act 1984 (CALM Act) coming into effect; the completion of a Proposed Forest Management Plan 2014–2023, which was submitted to the Environmental Protection Authority (EPA) for assessment; the opening of the completed 1,000 kilometre Munda Biddi Cycle Trail; and continued improvement in the regulation of prescribed premises through the implementation of DEC’s licensing reform program.
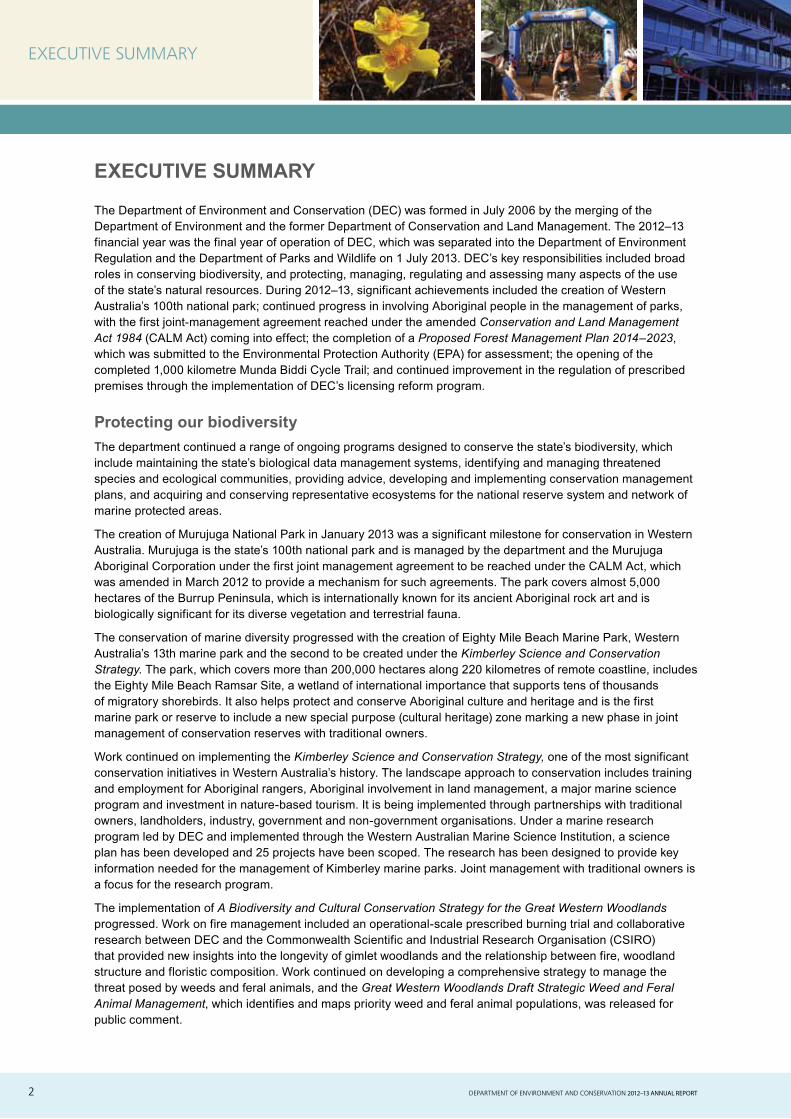
Protecting our biodiversityThe department continued a range of ongoing programs designed to conserve the state’s biodiversity, which include maintaining the state’s biological data management systems, identifying and managing threatened species and ecological communities, providing advice, developing and implementing conservation management plans, and acquiring and conserving representative ecosystems for the national reserve system and network of marine protected areas.
The creation of Murujuga National Park in January 2013 was a significant milestone for conservation in Western Australia. Murujuga is the state’s 100th national park and is managed by the department and the Murujuga Aboriginal Corporation under the first joint management agreement to be reached under the CALM Act, which was amended in March 2012 to provide a mechanism for such agreements. The park covers almost 5,000 hectares of the Burrup Peninsula, which is internationally known for its ancient Aboriginal rock art and is biologically significant for its diverse vegetation and terrestrial fauna.
The conservation of marine diversity progressed with the creation of Eighty Mile Beach Marine Park, Western Australia’s 13th marine park and the second to be created under the Kimberley Science and Conservation Strategy. The park, which covers more than 200,000 hectares along 220 kilometres of remote coastline, includes the Eighty Mile Beach Ramsar Site, a wetland of international importance that supports tens of thousands of migratory shorebirds. It also helps protect and conserve Aboriginal culture and heritage and is the first marine park or reserve to include a new special purpose (cultural heritage) zone marking a new phase in joint management of conservation reserves with traditional owners.
Work continued on implementing the Kimberley Science and Conservation Strategy, one of the most significant conservation initiatives in Western Australia’s history. The landscape approach to conservation includes training and employment for Aboriginal rangers, Aboriginal involvement in land management, a major marine science program and investment in nature-based tourism. It is being implemented through partnerships with traditional owners, landholders, industry, government and non-government organisations. Under a marine research program led by DEC and implemented through the Western Australian Marine Science Institution, a science plan has been developed and 25 projects have been scoped. The research has been designed to provide key information needed for the management of Kimberley marine parks. Joint management with traditional owners is a focus for the research program.
The implementation of A Biodiversity and Cultural Conservation Strategy for the Great Western Woodlands progressed. Work on fire management included an operational-scale prescribed burning trial and collaborative research between DEC and the Commonwealth Scientific and Industrial Research Organisation (CSIRO) that provided new insights into the longevity of gimlet woodlands and the relationship between fire, woodland structure and floristic composition. Work continued on developing a comprehensive strategy to manage the threat posed by weeds and feral animals, and the Great Western Woodlands Draft Strategic Weed and Feral Animal Management, which identifies and maps priority weed and feral animal populations, was released for public comment.

DEPARTMENT OF ENVIRONMENT AND CONSERVATION 2012–13 ANNUAL REPORT 3
EXECUTIVE SUMMARY
During 2012–13, a wetlands management guide was published. This marked a significant step in making information readily accessible to landowners, land managers, and natural resource managers, individuals, community members and employees of the public and private sector who are, or who are intending to, manage or restore a wetland. Western Australia’s unique and diverse wetlands are rich in ecological and cultural values and form an integral part of the natural environment. A guide to managing and restoring wetlands in Western Australia provides information about the nature of the state’s wetlands and practical guidance on how to manage and restore them for nature conservation.
Threatened species of the Pilbara were in the spotlight in March 2013 when 60 people with a range of expertise and experience attended a three-day workshop to identify the threats to biodiversity in the Pilbara and review the management actions available to mitigate these threats in a timely and efficient manner.
At the Western Australian Herbarium, the number of plant specimens held increased by 1.3 per cent, bringing the total number of specimens held to 742,929. A total of 283 vascular plant names was added to the state’s plant census. There are now 13,539 species, subspecies and varieties of vascular plants (flowering plants, ferns, cycads and conifers) recognised as occurring in Western Australia.
As part of the annual review of the state’s threatened fauna list, a major review was undertaken of the threat status of bird species in Australia. As a result, 14 species of birds, primarily migratory species that are suffering a worldwide decline, were added to the Wildlife Conservation Act 1950 list of specially protected (threatened) fauna. Eight bird species were removed from the list, seven were regraded from vulnerable to endangered and one species from endangered to critically endangered.
Across the state, work continued on feral animal control. Under the Western Shield program, about 3.9 million hectares of conservation reserves and State forest were baited, using more than 600,000 fox baits and 300,000 feral cat baits. In addition, a major internal review of the program was started to provide direction and improve the focus, integration and cost effectiveness of fauna conservation outcomes delivered.
At Lorna Glen, Operation Rangelands Restoration continued and the effectiveness of feral cat control was monitored, as were the reintroduced populations of bilby, brushtail possum, mala, golden bandicoot, boodie and Shark Bay mice. Monitoring of populations of mammals and birds translocated from Barrow Island to Hermite and Alpha islands under Gorgon Gas Development offset funding has shown that the animals are established and breeding.
Ensuring the future of our forestsThrough its Sustainable Forest Management service, DEC continued to provide for the sustainable use of Western Australia’s State forest and timber reserves while conserving biodiversity, and maintaining soil and water values to ensure the health and productive capacity of the forest for current and future generations. It did this by implementing the Forest Management Plan 2004–2013; gathering, maintaining and analysing data; mapping vegetation; managing approvals; monitoring timber harvesting operations, yields and standards; undertaking research to enhance biodiversity management; implementing fauna habitat zones; and carrying out forest audits.
During 2012–13, the Draft Forest Management Plan 2014–2023 was released for public comment and public information sessions were held in Perth, Bunbury and Manjimup to engage the public and encourage comment on the plan. Information sessions were also held with key stakeholders, including Aboriginal, industry and conservation groups and local government. More than 5,000 submissions were received and incorporated in the Analysis of Public Comment on the Draft Forest Management Plan 2014–2023. In April 2013, a Proposed Forest Management Plan 2014–2023 was submitted to the EPA for environmental impact assessment.
As part of the preparation for the Proposed Forest Management Plan 2014–2023, work was undertaken to improve modelling of the rate of Phytophthora dieback to predict impact on sustained yields of wood product. In 2012–13, detection and mapping of Phytophthora dieback was carried out on 19,970 hectares of DEC-managed lands to help plan and manage timber harvesting and prioritise disease treatments.

DEPARTMENT OF ENVIRONMENT AND CONSERVATION 2012–13 ANNUAL REPORT4
To ensure compliance with environmental outcomes sought in the Forest Management Plan 2004–2013, DEC evaluated and monitored 58 disturbance operations covering 7,930 hectares of State forest and timber reserves.
To assess the effects of timber harvesting on biodiversity, monitoring of FORESTCHECK grids continued. Eight new grids were installed in Donnelly District and analysis of data from the 10-year monitoring period 2002–12 was started.
Managing our parks and reservesA major focus for DEC continued to be to enable the community to enjoy park facilities and services, wildlife and the natural environment featured in parks. This focus included preparing and administering management plans for parks as well as recreation and site development plans. The department provided and maintained access, recreation opportunities and visitor facilities, including information and activities to enrich visitor experience and develop community awareness and support for parks and conservation. DEC worked with the tourism industry, both at a local and state level, with communities and with Aboriginal people in managing parks and providing facilities.
During 2012–13, significant progress was made in involving Aboriginal people in managing parks, with the first joint management agreement reached under the amended CALM Act coming into effect in January 2013 with the creation of Murujuga National Park. Further amendments to related legislation made it possible for Aboriginal people to undertake certain activities for customary purposes on reserves and other lands.
Collaboration was the cornerstone of work on the Naturebank program, a joint program with Tourism Western Australia that promotes ecotourism by offering opportunities for sustainable initiatives to be established in national parks. During 2012–13, preparatory work was carried out on five sites that have been identified as being suitable for development. A lease was awarded for Wharncliffe Mill in Bramley National Park and expressions of interest were assessed for a site in François Péron National Park. Environmental and cultural clearances were completed for a site in Ngamoowalem Conservation Park, and sites in Windjana Gorge and Cape Le Grand national parks were the subject of negotiations with the traditional owners.
After more than a decade of work, the Munda Biddi Trail, the cycling equivalent of the Bibbulmun Track, became a reality. In April 2013, the state’s premier long-distance off-road cycle touring trail was officially opened. It now extends more than 1,000 kilometres, linking Mundaring and Albany.
The department worked closely with the Department of Sport and Recreation, Outdoors WA, WestCycle and other key stakeholders on strategies and plans for the provision of cycle trails. In Margaret River, several mountain bike trails were developed in partnership with the Margaret River Off-Road Cycling Association. DEC also worked with the Recreation Trail Bike Rider’s Association of WA and the Department of Sport and Recreation on developing and improving trails for family and novice trail bike riders in the gazetted off-road vehicle areas at Pinjar.
Projects were progressed to make information about parks, visitor facilities and recreation opportunities easily accessible. This includes developing new online resources as well as adding to and improving existing resources. During 2012–13, DEC and Trails WA started work on a website that will showcase all the trails in WA. DEC also made progress on a new visitor-focused website to make it easier for people to find places to visit and activities in parks and reserves. Sixteen new electronic park guides were developed, bringing the total to 33. The downloadable guides have been designed to be used on smartphones.
Major infrastructure works were undertaken at several sites across the state, including the upgrading of roads, the provision of visitor facilities, the development of new campgrounds, the construction of wheelchair-accessible pathways, boardwalks and lookouts, and the installation of interpretive signage.
Visits to lands and water managed by DEC increased. A total of 16.02 million visits was recorded in 2012–13 compared to 15.42 million in 2011–12. The visitor satisfaction index was 88 per cent.
EXECUTIVE SUMMARY

DEPARTMENT OF ENVIRONMENT AND CONSERVATION 2012–13 ANNUAL REPORT 5
Volunteers continued to make a significant contribution, with 4,717 people contributing 564,350 hours to DEC projects across Western Australia. This represented a more than 20 per cent increase in both the number of active volunteers and the hours contributed compared to 2011–12.
Environmental regulation and assessmentAs a regulator, DEC helped ensure that Western Australia’s economic activity continued to be managed in a socially and environmentally responsible manner for the long-term benefit of the state. Through its Environmental Regulation division, the department worked to protect the environment and community by ensuring that emissions and discharges met acceptable criteria, that there was an effective response to pollution incidents and that contaminated sites were appropriately managed. The division also monitored air quality and oversaw the implementation of air quality management programs.
During 2012–13, DEC continued improving the consistency, quality and effectiveness of regulation of prescribed premises through its licensing reform program, Re-Engineering for Industry Regulation and the Environment (REFIRE). All new works approvals and licences are now issued using the REFIRE approach and existing licences are being converted to the REFIRE format. This will provide a platform for ongoing programs to further improve regulation of prescribed premises. DEC also made progress on its broader ongoing regulatory reform program, and identified areas where duplication and overlap could be eliminated and existing regulations could be improved and streamlined.
To improve compliance with licence conditions DEC carried out a planned proactive compliance management program in industry regulation. During 2012–13, 480 inspections of licensed premises and 135 inspections of controlled waste carrier and disposal sites were carried out. An asbestos management program was implemented and focused on ensuring compliance with departmental guidelines for managing asbestos at construction and demolition waste recycling facilities. Phase 2 of the compliance program for the Environmental Protection (Packaged Fertiliser) Regulations 2010 was also implemented.
In keeping with the trend set in 2010–11, DEC continued to receive and process a high number of works approvals for both major resource projects and other industry projects. During 2012–13, 140 major resource project works approvals were issued. These approvals were processed, on average, within the 60-day target timeframe.
As part of a review of the operation and effectiveness of the Contaminated Sites Act 2003 (CS Act), DEC received 31 submissions in response to the first stage of consultation. A summary of those responses was published in February 2013. As of 30 June 2013, there were 2,517 sites classified under the CS Act, with 476 classified during 2012–13.
As part of an initiative to improve air quality management legislation in Western Australia and harmonise state fuel quality legislation with national fuel quality standards issued under the federal Fuel Quality Standards Act 2000, significant amendments to the Environmental Protection (Petrol) Regulations 1999 were gazetted in October 2012. This paved the way for ethanol blend petrol (E10) to be introduced in Perth.
DEC made significant progress in addressing two long-running issues causing community concern: Cockburn Cement Ltd’s (CCL) operations at Munster and the Southern Metropolitan Regional Council’s (SMRC) Regional Resource Recovery Centre in Canning Vale. Action taken in response to licence conditions set by DEC resulted in improvements and a reduction in complaints about both facilities. At CCL, a baghouse filter was installed on kiln five and in May 2013 it was commissioned. There has been a significant reduction in emissions and improvement in air quality in the local area since the filter came into operation. At the SMRC’s Regional Resource Recovery Centre, installation of new humidifiers for the biofilters was not completed by the 15 December 2012 deadline and the facility stopped receiving waste over the summer. In March, the facility recommenced receiving waste. It will continue to operate at a reduced throughput, as required under an amended licence, issued in May 2012, until the new pollution control equipment has been shown to be effective.
EXECUTIVE SUMMARY
DEPARTMENT OF ENVIRONMENT AND CONSERVATION 2012–13 ANNUAL REPORT6
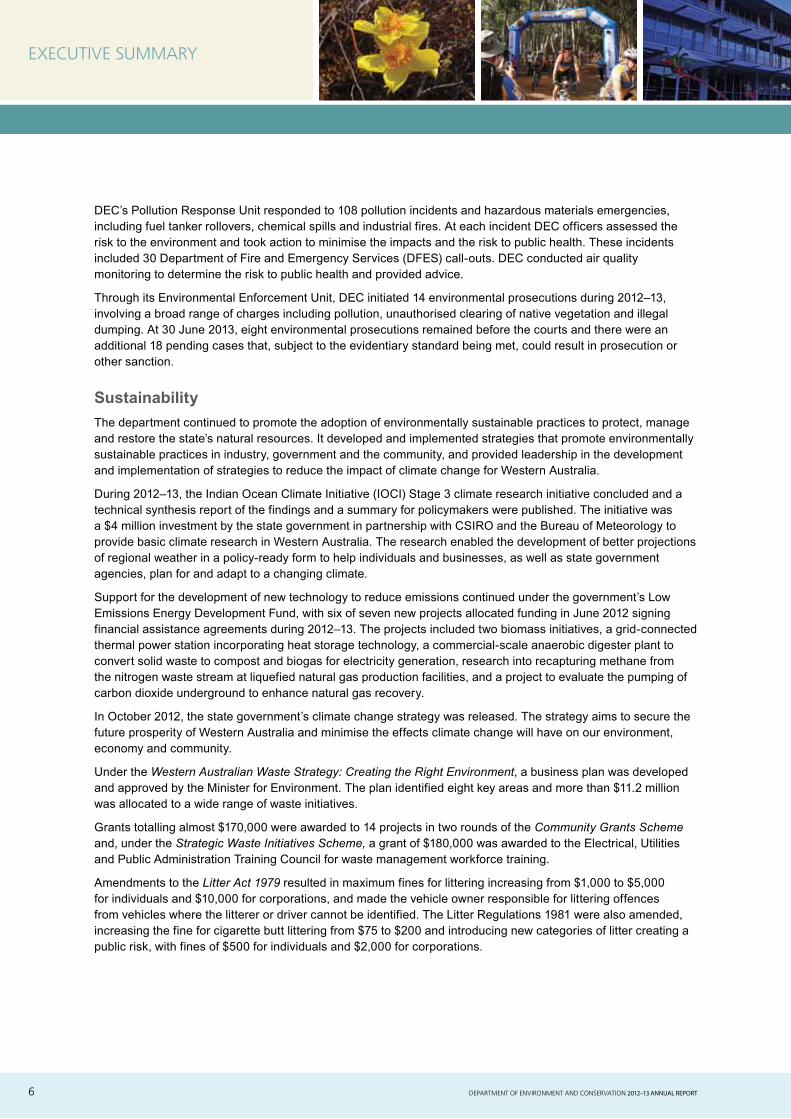
DEC’s Pollution Response Unit responded to 108 pollution incidents and hazardous materials emergencies, including fuel tanker rollovers, chemical spills and industrial fires. At each incident DEC officers assessed the risk to the environment and took action to minimise the impacts and the risk to public health. These incidents included 30 Department of Fire and Emergency Services (DFES) call-outs. DEC conducted air quality monitoring to determine the risk to public health and provided advice.
Through its Environmental Enforcement Unit, DEC initiated 14 environmental prosecutions during 2012–13, involving a broad range of charges including pollution, unauthorised clearing of native vegetation and illegal dumping. At 30 June 2013, eight environmental prosecutions remained before the courts and there were an additional 18 pending cases that, subject to the evidentiary standard being met, could result in prosecution or other sanction.
SustainabilityThe department continued to promote the adoption of environmentally sustainable practices to protect, manage and restore the state’s natural resources. It developed and implemented strategies that promote environmentally sustainable practices in industry, government and the community, and provided leadership in the development and implementation of strategies to reduce the impact of climate change for Western Australia.
During 2012–13, the Indian Ocean Climate Initiative (IOCI) Stage 3 climate research initiative concluded and a technical synthesis report of the findings and a summary for policymakers were published. The initiative was a $4 million investment by the state government in partnership with CSIRO and the Bureau of Meteorology to provide basic climate research in Western Australia. The research enabled the development of better projections of regional weather in a policy-ready form to help individuals and businesses, as well as state government agencies, plan for and adapt to a changing climate.
Support for the development of new technology to reduce emissions continued under the government’s Low Emissions Energy Development Fund, with six of seven new projects allocated funding in June 2012 signing financial assistance agreements during 2012–13. The projects included two biomass initiatives, a grid-connected thermal power station incorporating heat storage technology, a commercial-scale anaerobic digester plant to convert solid waste to compost and biogas for electricity generation, research into recapturing methane from the nitrogen waste stream at liquefied natural gas production facilities, and a project to evaluate the pumping of carbon dioxide underground to enhance natural gas recovery.
In October 2012, the state government’s climate change strategy was released. The strategy aims to secure the future prosperity of Western Australia and minimise the effects climate change will have on our environment, economy and community.
Under the Western Australian Waste Strategy: Creating the Right Environment, a business plan was developed and approved by the Minister for Environment. The plan identified eight key areas and more than $11.2 million was allocated to a wide range of waste initiatives.
Grants totalling almost $170,000 were awarded to 14 projects in two rounds of the Community Grants Scheme and, under the Strategic Waste Initiatives Scheme, a grant of $180,000 was awarded to the Electrical, Utilities and Public Administration Training Council for waste management workforce training.
Amendments to the Litter Act 1979 resulted in maximum fines for littering increasing from $1,000 to $5,000 for individuals and $10,000 for corporations, and made the vehicle owner responsible for littering offences from vehicles where the litterer or driver cannot be identified. The Litter Regulations 1981 were also amended, increasing the fine for cigarette butt littering from $75 to $200 and introducing new categories of litter creating a public risk, with fines of $500 for individuals and $2,000 for corporations.
EXECUTIVE SUMMARY

DEPARTMENT OF ENVIRONMENT AND CONSERVATION 2012–13 ANNUAL REPORT 7
Fire managementDEC continued to be involved in both the suppression of bushfires and the use of prescribed fire to achieve land management objectives in the varied environments of the state. During 2012–13, DEC staff attended and monitored 676 bushfires, which burnt about 5,477,395 hectares. The most serious bushfires attended by DEC occurred in the South Coast and South West regions and significant assistance was provided to local government authorities and DFES at fires in Bullsbrook and Lennard Brook.
The area able to be prescribed burnt this year was significantly reduced because of the combination of unsuitable weather conditions, fuels remaining dry due to summer conditions extending into autumn, and enhanced requirements in prescribed burn planning and risk management following the 2011 Margaret River bushfire. The indicative burn target for 2012–13 in the south-west forest regions was 200,000 hectares and DEC achieved 23,468 hectares. In the Kimberley, Pilbara, Goldfields, Midwest, Wheatbelt and South Coast regions a further 6,023,884 hectares was burnt on DEC-managed lands as well as unallocated Crown lands and unmanaged reserves.
Following the Special Inquiry by Mr Mick Keelty AO into the Margaret River bushfire of November 2011, DEC has been taking action on the recommendations made. Particular attention was given to recommendation two, which advocated a review of risk management practices associated with prescribed burning. Through the Bushfire Cooperative Research Centre, two consultants were engaged to review DEC’s prescribed burning processes and practices against the international standard for risk management (ISO 31000). Implementation of the findings of this review and the process of aligning DEC’s prescribed burning activities with the standard are ongoing. A new corporate policy on prescribed burning has been developed and all prescribed fire plans now include a risk management context statement and a context map showing surrounding fuels, major assets and access and egress, as well as a risk register in which risk assessment, evaluation and treatment processes are clearly documented for scrutiny, decision making and approval.
The 2012–13 bushfire season was marked by tragedy. On 12 October 2012, a burn-over during a bushfire in the South Coast Region resulted in the injury and tragic death of DEC firefighter Wendy Bearfoot, who was involved in the fire suppression efforts. The subsequent WorkSafe investigation resulted in 10 Improvement Notices being issued to DEC. The notices addressed issues relating to crew protection, vehicle modifications, training and information. DEC engaged the help of national experts to assist in the provision and storage of personal protective equipment (specifically fire blankets), and the installation of vehicle radiant heat shields and vehicle water spray/deluge systems. With regard to preparing staff, more than 800 DEC staff were trained in bushfire readiness, staying safe at fires and awareness of the ‘dead man zone’. Training in burn-over drills/exercises started in June 2013.
EXECUTIVE SUMMARY

DEPARTMENT OF ENVIRONMENT AND CONSERVATION 2012–13 ANNUAL REPORT8
OPERATIONAL STRUCTURE
OPERATIONAL STRUCTURE
Enabling LegislationOn 1 July 2006 the Department of Environment and Conservation (DEC) was formed from the amalgamation of the former Department of Conservation and Land Management and the former Department of Environment under the Public Sector Management Act 1994.
Responsible MinisterDEC’s responsibility during most of the reporting period was to the former Minister for Environment, Hon Bill Marmion MLA, and then to the Minister for Environment, Hon Albert Jacob MLA, from 21 March 2013. Both ministers exercised authority under the Environmental Protection Act 1986, the Conservation and Land Management Act 1984 and other DEC-administered legislation.
Legislation administered by DEC at 30 June 2013 Acts
• Carbon Rights Act 2003
• Conservation and Land Management Act 1984
• Carbon Rights Act 2003
• Conservation and Land Management Act 1984
• Contaminated Sites Act 2003
• Environmental Protection Act 1986
• Environmental Protection (Landfill) Levy Act 1998
• National Environment Protection Council (Western Australia) Act 1996
• Reserves (National Parks and Conservation Parks) Act 2004
• Reserves (National Parks, Conservation Parks and Other Reserves) Act 2004
• Reserves (National Parks, Conservation Parks, Nature Reserves and Other Reserves) Act 2004
• Sandalwood Act 1929
• Wildlife Conservation Act 1950
Regulations
• Clean Air (Determination of Air Impurities in Gases Discharged into the Atmosphere) Regulations 1983
• Conservation and Land Management Regulations 2002
• Contaminated Sites Regulations 2006
• Environmental Protection Regulations 1987
• Environmental Protection (Abattoirs) Regulations 2001
• Environmental Protection (Abrasive Blasting) Regulations 1998
• Environmental Protection (Clearing of Native Vegetation) Regulations 2004
• Environmental Protection (Concrete Batching and Cement Product Manufacturing) Regulations 1998
• Environmental Protection (Controlled Waste) Regulations 2004
• Environmental Protection (Domestic Solid Fuel Burning Appliances and Firewood Supply) Regulations 1998
• Environmental Protection (Fibre Reinforced Plastics) Regulations 1998
• Environmental Protection (Goldfields Residential Areas) (Sulphur Dioxide) Regulations 2003
• Environmental Protection (Kwinana) (Atmospheric Wastes) Regulations 1992
• Environmental Protection (Metal Coating) Regulations 2001

DEPARTMENT OF ENVIRONMENT AND CONSERVATION 2012–13 ANNUAL REPORT 9
OPERATIONAL STRUCTURE
• Environmental Protection (National Environment Protection Measure–National Pollutant Inventory [NEPM–NPI]) Regulations 1998
• Environmental Protection (Noise) Regulations 1997
• Environmental Protection (Packaged Fertiliser) Regulations 2010
• Environmental Protection (Petrol) Regulations 1999
• Environmental Protection (Recovery of Vapours from the Transfer of Organic Liquids) Regulations 1995
• Environmental Protection (Rural Landfill) Regulations 2002
• Environmental Protection (Unauthorised Discharges) Regulations 2004
• Forest Management Regulations 1993
• Noise Abatement (Noise Labelling of Equipment) Regulations (No 2) 1985
• Sandalwood Regulations 1993
• Wildlife Conservation Regulations 1970
• Wildlife Conservation (Reptiles and Amphibians) Regulations 2002
Environmental Protection Policies
• Environmental Protection (Swan Coastal Plain Lakes) Policy 1992
• Environmental Protection (Gnangara Mound Crown Land) Policy 1992
• Environmental Protection (Peel Inlet–Harvey Estuary) Policy 1992
• Environmental Protection (Kwinana) (Atmospheric Wastes) Policy 1999
• Environmental Protection (Goldfields Residential Areas) (Sulphur Dioxide) Policy 2003
• Environmental Protection (South West Agricultural Zone Wetlands) Policy 1998
• Environmental Protection (Western Swamp Tortoise Habitat) Policy 2011
Other written laws on which DEC officers assisted
• Litter Act 1979
• Litter Regulations 1981
• Swan and Canning Rivers (Consequential and Transitional Provisions) Act 2006
• Swan and Canning Rivers (Transitional) Regulations (No. 2) 2007
• Swan and Canning Rivers (Transitional) Regulations 2007
• Swan and Canning Rivers Management Act 2006
• Swan and Canning Rivers Foundation Rules 2009
• Swan and Canning Rivers Management Regulations 2007
• Waste Avoidance and Resource Recovery Act 2007
• Waste Avoidance and Resource Recovery Regulations 2008
• Waste Avoidance and Resource Recovery Levy Act 2007
• Waste Avoidance and Resource Recovery Levy Regulations 2008
Changes made in 2012–13 to legislation administeredA number of changes to legislation administered by DEC occurred during the reporting period.
The Environmental Protection Amendment Regulations (No. 3) 2012 were gazetted on 27 November 2012. They amended regulation 2B of the Environmental Protection Regulations 1987 by inserting a definition of ‘exempt matter’ to mean matter that is exempt under the Freedom of Information Act 1992 (FOI Act) Schedule 1, and by providing that the Environmental Protection Authority (EPA) may determine that a particular minute of
DEPARTMENT OF ENVIRONMENT AND CONSERVATION 2012–13 ANNUAL REPORT10
proceedings of a meeting of the EPA contains exempt matter, and no part of that minute is to be made available to a person unless a decision has been made regarding an access application under the FOI Act that the person is to be given access to the minute or part of the minute.
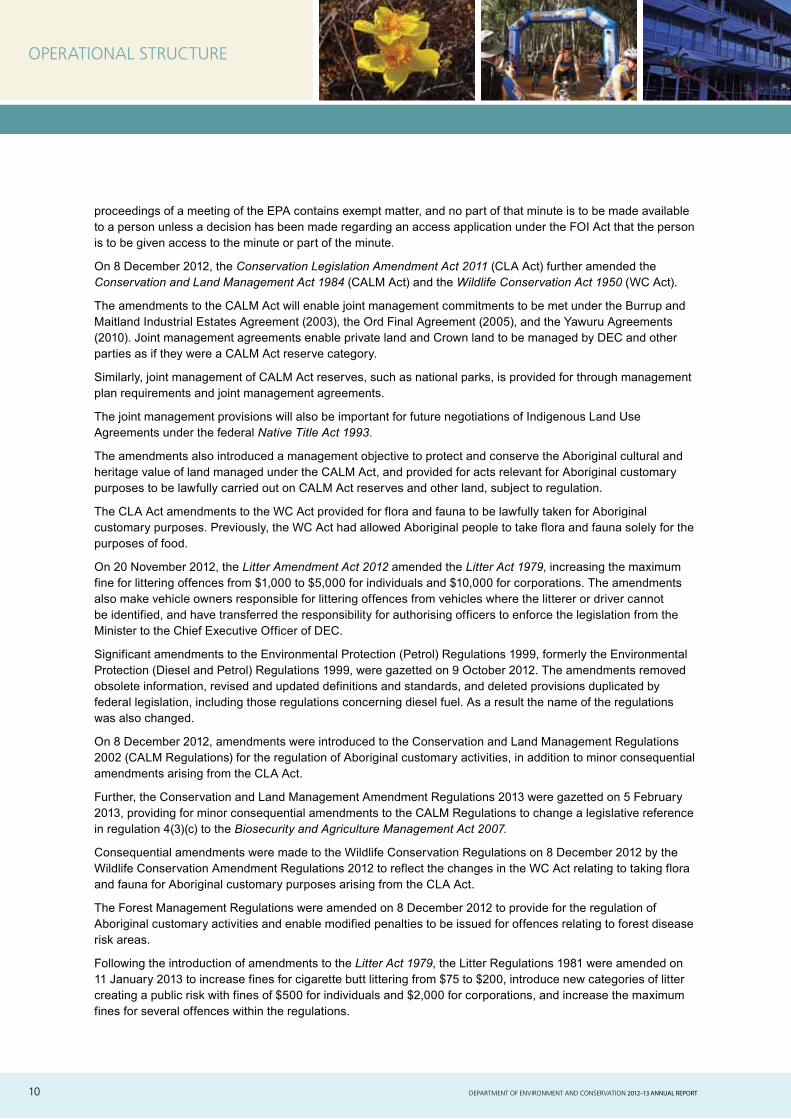
On 8 December 2012, the Conservation Legislation Amendment Act 2011 (CLA Act) further amended the Conservation and Land Management Act 1984 (CALM Act) and the Wildlife Conservation Act 1950 (WC Act).
The amendments to the CALM Act will enable joint management commitments to be met under the Burrup and Maitland Industrial Estates Agreement (2003), the Ord Final Agreement (2005), and the Yawuru Agreements (2010). Joint management agreements enable private land and Crown land to be managed by DEC and other parties as if they were a CALM Act reserve category.
Similarly, joint management of CALM Act reserves, such as national parks, is provided for through management plan requirements and joint management agreements.
The joint management provisions will also be important for future negotiations of Indigenous Land Use Agreements under the federal Native Title Act 1993.
The amendments also introduced a management objective to protect and conserve the Aboriginal cultural and heritage value of land managed under the CALM Act, and provided for acts relevant for Aboriginal customary purposes to be lawfully carried out on CALM Act reserves and other land, subject to regulation.
The CLA Act amendments to the WC Act provided for flora and fauna to be lawfully taken for Aboriginal customary purposes. Previously, the WC Act had allowed Aboriginal people to take flora and fauna solely for the purposes of food.
On 20 November 2012, the Litter Amendment Act 2012 amended the Litter Act 1979, increasing the maximum fine for littering offences from $1,000 to $5,000 for individuals and $10,000 for corporations. The amendments also make vehicle owners responsible for littering offences from vehicles where the litterer or driver cannot be identified, and have transferred the responsibility for authorising officers to enforce the legislation from the Minister to the Chief Executive Officer of DEC.
Significant amendments to the Environmental Protection (Petrol) Regulations 1999, formerly the Environmental Protection (Diesel and Petrol) Regulations 1999, were gazetted on 9 October 2012. The amendments removed obsolete information, revised and updated definitions and standards, and deleted provisions duplicated by federal legislation, including those regulations concerning diesel fuel. As a result the name of the regulations was also changed.
On 8 December 2012, amendments were introduced to the Conservation and Land Management Regulations 2002 (CALM Regulations) for the regulation of Aboriginal customary activities, in addition to minor consequential amendments arising from the CLA Act.
Further, the Conservation and Land Management Amendment Regulations 2013 were gazetted on 5 February 2013, providing for minor consequential amendments to the CALM Regulations to change a legislative reference in regulation 4(3)(c) to the Biosecurity and Agriculture Management Act 2007.
Consequential amendments were made to the Wildlife Conservation Regulations on 8 December 2012 by the Wildlife Conservation Amendment Regulations 2012 to reflect the changes in the WC Act relating to taking flora and fauna for Aboriginal customary purposes arising from the CLA Act.
The Forest Management Regulations were amended on 8 December 2012 to provide for the regulation of Aboriginal customary activities and enable modified penalties to be issued for offences relating to forest disease risk areas.
Following the introduction of amendments to the Litter Act 1979, the Litter Regulations 1981 were amended on 11 January 2013 to increase fines for cigarette butt littering from $75 to $200, introduce new categories of litter creating a public risk with fines of $500 for individuals and $2,000 for corporations, and increase the maximum fines for several offences within the regulations.
OPERATIONAL STRUCTURE

DEPARTMENT OF ENVIRONMENT AND CONSERVATION 2012–13 ANNUAL REPORT 11
Notices, Orders and Approvals During the 2012–13 reporting year, the following management plans were approved by the Minister for Environment under section 60 of the CALM Act:
• Parks and Reserves of Yanchep and Lake Neerabup Management Plan, gazetted 3 August 2012
• Ord River and Parry Lagoons Management Plan, gazetted 5 October 2012
• Murujuga National Park Management Plan, gazetted 18 January 2013
• Ngari Capes Marine Park Management Plan, gazetted 5 February 2013.
The following draft management plans were gazetted under the CALM Act:
• Draft Forest Management Plan 2014–2023, gazetted 17 August 2012
• Esperance and Recherche Parks and Reserves Draft Management Plan, gazetted 2 November 2012.
The Eighty Mile Beach Marine Park Order was gazetted on 29 January 2013, making it a Class A marine park.
On 9 November 2012, the Public Firewood Areas Order 2012 was gazetted, and on 3 May 2013 the Public Firewood Areas Order 2013 was gazetted. These orders identify particular areas of State forest where members of the public who hold a firewood permit may gather firewood for domestic use.
The Wildlife Conservation (Rare Flora) Notice 2012, gazetted on 6 November 2012, lists taxa of flora that are considered likely to become extinct or rare, or presumed to be extinct in the wild and therefore in need of special protection, and are declared to be rare flora under section 23F of the WC Act.
The Wildlife Conservation (Specially Protected Fauna) Notice 2012(2), gazetted on 6 November 2012, lists taxa of fauna that are rare or likely to become extinct, presumed to be extinct, birds that are subject to an agreement between the Government of Australia and the governments of Japan, China and the Republic of Korea relating to the protection of migratory birds, or taxa otherwise needing special protection, which are declared by the notice to be fauna in need of special protection.
On 17 July 2012, the Environmental Protection (Western Power Transmission Substation Noise Emissions) Approval Amendment 2012 was gazetted, removing 14 substations that are now complying with the noise regulations from the Environmental Protection (Western Power Transmission Substation Noise Emissions) Approval 2005. The amendment set new conditions for Western Power to mitigate the residue noise emissions from the remaining 20 substations.
The Environmental Protection (Dardanup Pine Log Sawmill Noise Emissions) Approval 2013 was gazetted on 17 May 2013. It renews Wespine’s approval, being the Environmental Protection (Dardanup Pine Log Sawmill Noise Emissions) Approval 2002, for its Dardanup Sawmill. The 2013 approval recognises that it is not practical for the Dardanup Pine Log Sawmill to meet the prescribed noise standard. The approval allows the Dardanup Sawmill to exceed the current limits in the noise regulations and sets approved levels that must not be exceeded. The 2013 approval also requires Wespine to take all reasonable measures to acquire noise-affected properties within 600 metres of the Dardanup Sawmill, as well as take all reasonable measures to reduce noise from the site.
Copies of the legislation administered by the department are available on the State Law Publisher’s website at: www.slp.wa.gov.au.
OPERATIONAL STRUCTURE

DEPARTMENT OF ENVIRONMENT AND CONSERVATION 2012–13 ANNUAL REPORT12
DEC Organisational Chart
OPERATIONAL STRUCTURE
Correct on 30 June 2013
Management Audit Office of the Director General
Deputy Director General Parks and Conservation
Gordon Wyre (A)
Deputy Director General Environment
Jason Banks (A)
Environmental Enforcement Unit
Legal Services Branch
Native Vegetation Conservation BranchNature
Conservation
Keith Claymore (A)
Species and Communities
Branch
Nature Protection
Branch
Marine Policy and Planning
Branch
Environmental Management
Branch
Natural Resources
Branch
Parks and Visitor Services
Peter Sharp
Planning and Estate Branch
Policy and Tourism Branch
Recreation, Interpretation
and Community Involvement
Branch
Infrastructure and Property
Branch
Aboriginal Heritage Unit
Sustainable Forest
Management
Geoff Stoneman
Forest Management
Branch
Forest Policy and Practices Branch
Environmental Regulation
Alan Sands
Industry Regulation
Support Branch
Industry Regulation Compliance
Branch
Industry Regulation Licensing Branch
Noise Regulation Branch
Contaminated Sites Branch
Environmental Hazards Branch
Strategic Policy and Programs
Stuart Cowie
Waste Management
Branch
Air Quality Management
Branch
Strategic Policy Branch
Climate Change Unit
Director General
Jim Sharp (A)
Science
Dr Margaret Byrne
Biogeography
Fauna Conservation
Flora Conservation and Herbarium
Landscape Conservation
Marine Science
Biodiversity and Climate Change
Science Support
Observatory
Regional Services
Peter Dans
Kimberley
Pilbara
Midwest
Wheatbelt
Swan
South West
Warren
South Coast
Goldfields
Fire Management Services Branch
Office for Information Management
Corporate Services
John Byrne
Financial Services Branch
People Services Branch
Geographic Information Services Branch
Corporate Information Services Branch
Strategic Development and Corporate Affairs
Zoran Jovanovic (A)
Community Education Branch
Corporate Communications Branch
Kensington Customer Service Section
Public Affairs Branch
WA Naturally Publications
DEPARTMENT OF ENVIRONMENT AND CONSERVATION 2012–13 ANNUAL REPORT 13
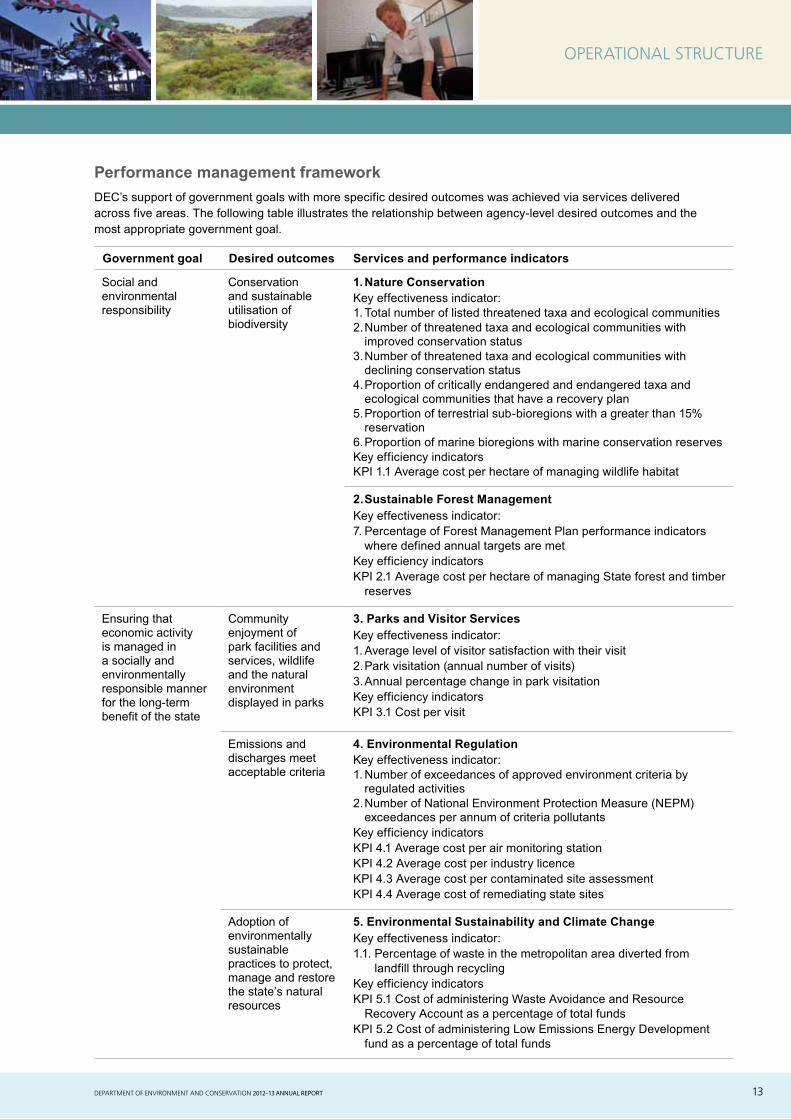
Performance management frameworkDEC’s support of government goals with more specific desired outcomes was achieved via services delivered across five areas. The following table illustrates the relationship between agency-level desired outcomes and the most appropriate government goal.
Government goal Desired outcomes Services and performance indicators
Social and environmental responsibility
Conservation and sustainable utilisation of biodiversity
1. Nature ConservationKey effectiveness indicator:1. Total number of listed threatened taxa and ecological communities2. Number of threatened taxa and ecological communities with
improved conservation status3. Number of threatened taxa and ecological communities with
declining conservation status4. Proportion of critically endangered and endangered taxa and
ecological communities that have a recovery plan5. Proportion of terrestrial sub-bioregions with a greater than 15%
reservation6. Proportion of marine bioregions with marine conservation reservesKey efficiency indicatorsKPI 1.1 Average cost per hectare of managing wildlife habitat
2. Sustainable Forest ManagementKey effectiveness indicator:7. Percentage of Forest Management Plan performance indicators
where defined annual targets are metKey efficiency indicatorsKPI 2.1 Average cost per hectare of managing State forest and timber
reserves
Ensuring that economic activity is managed in a socially and environmentally responsible manner for the long-term benefit of the state
Community enjoyment of park facilities and services, wildlife and the natural environment displayed in parks
3. Parks and Visitor ServicesKey effectiveness indicator:1. Average level of visitor satisfaction with their visit2. Park visitation (annual number of visits)3. Annual percentage change in park visitationKey efficiency indicatorsKPI 3.1 Cost per visit
Emissions and discharges meet acceptable criteria
4. Environmental RegulationKey effectiveness indicator:1. Number of exceedances of approved environment criteria by
regulated activities2. Number of National Environment Protection Measure (NEPM)
exceedances per annum of criteria pollutantsKey efficiency indicatorsKPI 4.1 Average cost per air monitoring stationKPI 4.2 Average cost per industry licenceKPI 4.3 Average cost per contaminated site assessmentKPI 4.4 Average cost of remediating state sites
Adoption of environmentally sustainable practices to protect, manage and restore the state’s natural resources
5. Environmental Sustainability and Climate ChangeKey effectiveness indicator:1.1. Percentage of waste in the metropolitan area diverted from
landfill through recycling Key efficiency indicatorsKPI 5.1 Cost of administering Waste Avoidance and Resource
Recovery Account as a percentage of total fundsKPI 5.2 Cost of administering Low Emissions Energy Development
fund as a percentage of total funds
OPERATIONAL STRUCTURE

DEPARTMENT OF ENVIRONMENT AND CONSERVATION 2012–13 ANNUAL REPORT14
Changes from the 2011–12 reporting yearDuring 2012–13, DEC’s performance management framework was changed. Service areas 5 and 6, Environmental Sustainability and Coordinate the response to climate change, were combined to form service area 5 Environmental Sustainability and Climate Change.
The performance indicators for the amended service area 5 are as follows:
Key effectiveness indicator:
1. Percentage of waste in the metropolitan area diverted from landfill through recycling
Key efficiency indicators
KPI 5.1 Cost of administering Waste Avoidance and Resource Recovery Account as a percentage of total funds
KPI 5.2 Cost of administering Low Emissions Energy Development fund as a percentage of total funds
The key effectiveness indicator ‘Percentage of Low Emissions Energy Development fund milestones achieved within the targeted timeframe’ that was previously reported against the climate change service is no longer reported as it no longer is considered to provide meaningful information on performance. It has not been possible to suggest a suitable replacement measure as the effectiveness of the state’s actions in providing leadership in adaptation to climate change cannot be readily quantified.
Shared responsibilities with other agenciesDuring the year, DEC contributed to whole-of-government reform initiatives including corporate services reform, implementation of efficiency and other targeted savings. The department also contributed to the following key cross-agency initiatives.
Initiative Contributing agencies Result for 2012–13
Responding to climate change DEC (lead agency), Department of Planning, Department of the Premier and Cabinet, Department of Transport, Department of Treasury, Public Utilities Office
Whole-of-government integrated response to climate change
Salinity Department of Agriculture and Food (lead agency), DEC
Continuing amelioration of the impacts of salinity
OPERATIONAL STRUCTURE

DEPARTMENT OF ENVIRONMENT AND CONSERVATION 2012–13 ANNUAL REPORT 15
AGENCY PERFORMANCE
The official opening of the Munda Biddi Trail coincided with the end of the first end-to-end ride of the 1,000 kilometre-long off-road cycle touring trail undertaken by 26 cyclists. Photo: Terry Goodlich/DEC

DEPARTMENT OF ENVIRONMENT AND CONSERVATION 2012–13 ANNUAL REPORT16
REPORT ON OPERATIONS
Service 1: Nature ConservationThe development and implementation of programs for the conservation of biodiversity, including:
• management of threatened species and ecological communities
• sustainable use of commercially exploited species
• acquisition, conservation and protection of representative ecosystems for the national reserve system and network of marine protected areas
• promotion of public awareness, understanding and support for nature conservation.
Functions through which the department delivered this service include:
1. Building biodiversity knowledge
Developing and maintaining a biological inventory of the state through strategic regional and area-based biological surveys, ecological and genetic research, taxonomic studies and the maintenance of biological data management systems, including the maintenance of the state’s flora collection.
2. Establishing a terrestrial and marine conservation reserve system
Providing expert advice and recommendations to the Minister for Environment, the Conservation Commission and the Marine Parks and Reserves Authority in developing and maintaining a conservation reserve system comprising national parks, nature reserves, conservation parks, miscellaneous conservation reserves, marine parks, marine nature reserves and marine management areas under the Conservation and Land Management Act 1984 (CALM Act).
3. Effective management of the conservation reserve system
In consultation with stakeholders, including the Western Australian public, developing, implementing and reviewing management plans for conservation reserves, including such operational programs as weed control, introduced animal control and fire management for biodiversity.
4. Recovery of threatened species and ecological communities, and management of other significant species and ecosystems
Recommending changes to the lists of threatened flora and fauna under the state Wildlife Conservation Act 1950 (WC Act) and the federal Environment Protection and Biodiversity Conservation Act 1999, maintaining a state list of threatened ecological communities, and developing and implementing recovery plans for threatened flora, fauna and ecological communities. Coordinating responses to whale and dolphin strandings and other incidents of injury or harm to marine fauna, and managing and regulating commercial activities, including the issuing of flora and fauna licences and wildlife interaction licences, and enforcing compliance under the WC Act. DEC also took a lead role for the state in conserving WA wetlands, including through the Convention on Wetlands of International Importance (Ramsar Convention).
5. Conserving landscapes and seascapes: integrating off and on-reserve conservation and managing threatening processes
Maintaining the state’s biodiversity through a range of strategies, including:
• providing advice on, and implementing, state legislation and policy
• participating in national working groups developing national policies and procedures
• developing and implementing five-year nature conservation plans for guiding biodiversity management in each DEC region
• taking the lead in establishing and promoting a scientifically robust regional marine planning framework
• addressing the system-wide threat of salinity and other impacts of altered hydrology through the management of natural diversity recovery catchments
REPORT ON OPERATIONS
REPORT ON OPERATIONS

DEPARTMENT OF ENVIRONMENT AND CONSERVATION 2012–13 ANNUAL REPORT 17
REPORT ON OPERATIONSREPORT ON OPERATIONS
• implementing strategies to manage feral animals and environmental weeds
• working in partnership with stakeholders to research and implement management measures to contain and counteract the effects of Phytophthora disease
• carrying out targeted fire preparedness and pest and weed control on unallocated Crown land and unmanaged reserves
• undertaking regional conservation planning activities in the Kimberley and Great Western Woodlands
• implementing the provisions of the Environmental Protection Act 1986 through the processing of applications to clear native vegetation and advising government on the effect of resource developments on conservation values and the integrity of the reserve system.
6. Encouraging public understanding and support for biodiversity conservation and other DEC programs and activities
Promoting public understanding and support through a number of functions, including:
• providing support for the Minister for Environment’s Environmental Community Grants program, which distributed grant money to community groups and individuals to support local conservation projects
• supporting private landholders on the Swan Coastal Plain by providing technical and financial assistance to manage wetlands of high conservation value through the Healthy Wetland Habitats program
• facilitating best-practice management of remnant vegetation in transport corridors through awareness-raising, liaison and cooperation with stakeholders via the Roadside Conservation Committee
• providing technical advice and support to stakeholders and land managers through the Urban Nature program
• providing biodiversity conservation support and advice for private land through a range of programs, including Land for Wildlife and the Nature Conservation Covenant program.
Performance summary
2012–13 Target $’000
2012–13 Actual $’000
Variation $’000
Expense by service 148,655 134,702 (13,953)
Key Efficiency Indicator 2012–13 Target
2012–13 Actual Variance
Average cost per hectare of managing wildlife habitat $5.42 $4.72 ($0.70)
Performance highlights
• The department continued to implement the Kimberley Science and Conservation Strategy, which was released in June 2011 with an initial implementation budget of $63 million over five years and a commitment to ongoing funding for key initiatives.
• A total of $12 million over six years was allocated for a Kimberley marine research program to be led by the department and implemented through the Western Australian Marine Science Institution. Twenty-five projects have been scoped in line with the science plan, with research designed to provide key information needed for the management of Kimberley marine parks across a range of themes and disciplines. Joint management of the marine parks in partnership with traditional owners is a focus for this research program. Several projects have started; however, the majority of the program will begin field work in the latter half of 2013 and into 2014.

DEPARTMENT OF ENVIRONMENT AND CONSERVATION 2012–13 ANNUAL REPORT18
REPORT ON OPERATIONS
• The creation of the Eighty Mile Beach Marine Park to provide for the conservation of marine biodiversity, the protection and conservation of Aboriginal culture and heritage, and managed recreational and commercial activities where appropriate. The marine park covers more than 200,000 hectares along 220 kilometres of remote coastline supporting a rich diversity of wildlife.
• A Biodiversity and Cultural Conservation Strategy for the Great Western Woodlands continued to be implemented with the support of a reference group and $3.8 million allocated over three years by the government to better manage and protect the area. During 2012–13, prescribed burning was undertaken as an operational-scale trial involving fire mosaics across the landscape to guide future planning and implementation of fire management. Collaborative research between the department and CSIRO provided important new insights into the longevity of gimlet (Eucalyptus salubris) woodlands, and the relationships between fire, woodland structure and floristic composition. The Guide to the Great Western Woodlands, with photographs and descriptions of more than 150 flora and fauna species, was published and the Great Western Woodlands Draft Strategic Weed and Feral Animal Management, identifying and mapping priority weed and feral animal populations, was released for public comment. In partnership with South Coast Natural Resource Management, DEC collated and standardised existing vegetation mapping data.
• The department continued to implement a range of programs and strategies for biodiversity conservation across the state, including those in keeping with the national framework set out in Australia’s Strategy for the Conservation of Biodiversity 2010–2030.
• The department contributed to the review and revision of Australia’s Native Vegetation Framework, which was published during the year. This framework sits under Australia’s Strategy for the Conservation of Biodiversity 2010–2030 to provide broad guidance on native vegetation management in Australia.
• A biodiversity audit was initiated to document the state of Western Australia’s biodiversity through a detailed bioregional analysis to update the 2002 A Biodiversity Audit of Western Australia’s 53 Bioregional Subregions.
• Through the Net Conservation Benefits (NCB) program, a further $2.99 million was awarded to the Dirk Hartog Island National Park ecological restoration project, taking its total NCB funding to $11.54 million. In 2011–12 the project was allocated $8.5 million as part of a $23.43 million allocation for four major projects. The funds were provided by the Gorgon Joint Venture partners following agreement with the state government prior to the approval of the Gorgon project to deliver long-term biodiversity conservation benefits to Western Australia in areas with similar values to Barrow Island. A biosecurity strategy has been prepared for Dirk Hartog Island and is being progressively implemented.
• The final round of funding under the Minister for Environment’s four-year, $6 million Environmental Community Grants program was distributed, with $1.6 million of grants awarded to 155 community groups and individuals.
• Marine park and threatened marine fauna monitoring, evaluation and reporting produced new and historical time-series information for nine marine parks. Individual status reports, including information about asset condition, pressure and management response, were provided to enable adaptive management planning and auditing.
• The ecological character descriptions for Western Australia’s 12 Ramsar-listed wetland systems were completed and submitted for endorsement at state and federal level. Nine Ramsar sites have completed the endorsement process of ecological character descriptions and a further three are awaiting final endorsement at either state or federal level.
• During 2012–13, the development of biodiversity management strategies for threatened species of the Pilbara made good progress. In March 2012, 60 participants attended a three-day workshop to identify the threats to biodiversity in the Pilbara and review the management actions available to mitigate these threats in a timely and efficient manner. This was followed by a workshop in June that focused on the Pilbara leaf-nosed bat. In collaboration with industry partners, DEC also started major research programs on the ecology and management of several threatened Pilbara fauna species.
• In partnership with the Central Desert Native Title Service and Kanyirninpa Jukurrpa, biological survey and fire ecology research was initiated to assist the Martu people manage their land and further protect cultural and natural assets in the Western Desert.
REPORT ON OPERATIONS

DEPARTMENT OF ENVIRONMENT AND CONSERVATION 2012–13 ANNUAL REPORT 19
REPORT ON OPERATIONS
• A guide to managing and restoring wetlands in Western Australia was published on the DEC website at: www.dec.wa.gov.au/management-and-protection/wetlands/publications.
• The Natural Diversity Recovery Catchment Program continued at Buntine-Marchagee, Drummond, Lake Bryde, Lake Muir-Unicup, Lake Warden and Toolibin Lake to slow degradation and recover high-value biodiversity assets at risk from altered hydrology. A collaborative project with Nottingham University in the United Kingdom is providing a valuable contribution to planning processes.
• A prototype mallee harvester developed last year received a Cooperative Research Centres (CRC) Association national award for innovation. The development of the harvester was part of a cooperative project that aimed to develop a new sustainable industry from mallee farming that would benefit biodiversity and salinity management. Additional funds for the project have been provided through the Future Farm Industries CRC to continue work on mallee planting designs to maximise biomass production. There has been an increase in interest among regional industries in using biomass to produce combined heat and power.
• The number of plant specimens held at the Western Australian Herbarium increased by 1.3 per cent (9,351 specimens), bringing the total number of specimens held to 742,929.
• A total of 283 vascular plant names was added to the Western Australian Plant Census, representing a net increase of 58 in the number of taxa recognised as occurring in the state, and 105 new names were formally published. Western Australia’s vascular flora (flowering plants, ferns, cycads and conifers) now comprises 13,539 species, subspecies and varieties (12,307 native and 1,232 introduced to the state).
• Seven new species of flora were added to the WC Act list of specially protected (threatened) flora. One species, pyramid mulla-mulla (Ptilotus pyramidatus), was moved from the presumed extinct list to the threatened flora list following its rediscovery in a wetland in the Perth metropolitan area. One species, Picris compacta, was added to the presumed extinct list as it has not been observed in the Perth metropolitan area since its original collection in 1941. The Yornaning wattle (Acacia insolita subsp. recurva) was regraded in threat ranking from endangered to critically endangered and Ricinocarpos brevis was regraded from critically endangered to endangered. At 30 June 2013, there were 413 extant threatened flora species (153 critically endangered, 118 endangered and 142 vulnerable), 14 listed as presumed to be extinct and 2,946 taxa on the department’s priority flora list.
• A major review of the threat status of bird species in Australia was included in the annual review of the threatened fauna list. A total of 16 species of fauna were added to the WC Act list of specially protected (threatened) fauna, including 14 species of birds, primarily migratory species that are suffering worldwide decline. Eight species of bird were delisted, including Muir’s corella (Cacatua pastinator pastinator), which has recovered in numbers due to management actions and was transferred to Schedule 4—otherwise specially protected fauna. The graceful sun moth (Synemon gratiosa), was also delisted following targeted survey work demonstrating that it no longer met the International Union for Conservation of Nature (IUCN) criteria for threatened. Seven species of birds were regraded in threat ranking from vulnerable to endangered, and the Tristan albatross (Diomedea dabbenena) was regraded from endangered to critically endangered. At 30 June 2013, there were 240 threatened fauna species (47 critically endangered, 44 endangered and 149 vulnerable), 18 listed as presumed to be extinct, 12 listed as otherwise specially protected, and 196 species on the department’s priority fauna list.
• During 2012–13, the Western Shield program continued through broadscale fox and feral cat baiting and the re-introduction of native mammals for native fauna conservation. About 3.9 million hectares of conservation reserves and State forest were baited, using more than 600,000 fox baits and 300,000 feral cat baits. A major internal review of the program started in March 2013 to provide direction to the program and improve the focus, integration and cost-effectiveness of fauna conservation outcomes. The program continued to be supported by corporate sponsors Alcoa World Alumina, BHP Billiton Worsley Alumina and Tronox.
• The Caring for our Country-funded exotic rodent eradication program confirmed the successful eradication of black rats on Direction Island, in the Cocos (Keeling) group, and house mice on Three Bays Island in the Shark Bay World Heritage Area.
REPORT ON OPERATIONS

DEPARTMENT OF ENVIRONMENT AND CONSERVATION 2012–13 ANNUAL REPORT20
REPORT ON OPERATIONS
• The Operation Rangelands Restoration project continued at Lorna Glen. Reintroduced populations of bilby, brushtail possum, mala, golden bandicoot, boodie and Shark Bay mice were monitored as was the effectiveness of feral cat control. An ongoing study of wedge-tailed eagles involved the successful attachment, for the first time, of satellite transmitters to two adult eagles. The eagles will be tracked for six months to obtain information on their nesting sites, feeding locations and diet.
• The monitoring of translocated fauna on the Montebello Islands continued under Gorgon Gas Development offset funding. Golden bandicoots, spectacled hare-wallabies, black and white fairy-wrens and spinifexbirds, translocated from Barrow Island, have established on Hermite Island and are breeding and spreading to occupy all available habitats. The boodies on Alpha Island have also established and the population is increasing.
• Following the department’s Threatened and Priority Flora database launch in March 2012, regional staff were trained in database entry. The data entry function allows regional and other DEC staff to input flora report forms directly into the database. A total of 620 report forms was submitted electronically during the 2012–13 financial year.
• A total of 386 populations, comprising 181 species of threatened and priority flora, was surveyed or monitored, and 48 new populations of threatened flora and 68 new populations of priority flora were located.
• Of the 770 records added to the Threatened and Priority Flora database, 128 were for new populations. There were 22,618 records of sightings, captures or evidence of threatened and priority fauna added to the Threatened and Priority Fauna database or the Fauna Survey Returns system.
• New occurrence information was added to the Threatened and Priority Ecological Communities database for 482 occurrences of 18 threatened ecological communities (TECs) and 20 priority ecological communities (PECs), helping resolve the status of the PECs and providing improved information for land-use planning.
• Surveys were completed in 134 occurrences of TECs and PECs throughout the state. Data collected about habitat, composition, condition, threats and recommended recovery actions were added to the TEC and PEC database and will help guide future management. Data from 145 floristic quadrats on the Swan Coastal Plain were statistically analysed to verify the presence of TECs and PECs.
• The department hosted a symposium attended by 70 local and international experts about the future conservation of Western Australia’s TECs and PECs that are built by microbes, such as the stromatolites of Hamelin Pool and the Lake Clifton thrombolites.
• Phosphite applications were carried out to contain the impacts of Phytophthora dieback targeting 19 threatened flora species, including 11 critically endangered taxa in the Stirling Range National Park and Albany coastal area.
• DEC’s project to advance eradication and containment strategies for Phytophthora dieback, with assistance from the State Natural Resource Management Program, was concluded. DEC successfully eradicated one infestation in Cape Arid National Park. This is believed to be the world’s first management-scale eradication of Phytophthora dieback. DEC is continuing to monitor the site and hopes to demonstrate that permanent eradication has been achieved.
• A total of 261 seed collections was banked at the Threatened Flora Seed Centre: 158 new seed collections were from threatened flora, 22 from priority-listed flora and the remainder from species being used in restoration projects. Seed bank staff provided technical advice and assistance to a major restoration project on the Swan Coastal Plain, and short-term storage for seed collections for future restoration. Seedlings of 14 critically endangered species from 23 collections were provided for DEC translocation projects.
• Sixty-two established translocation sites for 38 flora taxa were monitored and maintained and infill planting was undertaken at 14 previously established translocation sites.
• Ten threatened flora interim recovery plans, including four updated plans, were approved. Two interim recovery plans were approved for TECs: ‘Banksia attenuata and/or Eucalyptus marginata woodlands of the eastern side of the Swan Coastal Plain (type 20b)’ and ‘Stromatolite community of stratified hypersaline
REPORT ON OPERATIONS
DEPARTMENT OF ENVIRONMENT AND CONSERVATION 2012–13 ANNUAL REPORT 21
REPORT ON OPERATIONS
coastal lake—Lake Thetis’. Four new fauna recovery plans were approved, for: Carnaby’s cockatoo (Calyptorhynchus latirostris), chuditch (Dasyurus geoffroii), quokka (Setonix brachyurus) and five species of rock-wallaby (Petrogale spp.).
• The Land for Wildlife scheme registered 96 new properties, bringing the total area of registered sites managed privately for conservation to 326,712 hectares.
• The voluntary Nature Conservation Covenant Program entered into covenants in perpetuity on 15 land titles, protecting an additional 590 hectares of native vegetation.
• The Roadside Conservation Committee released an updated Roadside Environmental Weeds List, which helps resources for roadside weed control operations to be more effectively prioritised.
• In 2012–13, 21 prosecutions under the WC Act, the CALM Act, and associated regulations were taken to court, 40 reported offences were dealt with at the departmental level, and a further 36 matters were pending. A further 607 infringement notices and 523 caution notices were issued.
Native vegetation clearing permits
The department’s clearing permit system database records details of all clearing permit applications and decisions made for both DEC and the Department of Mines and Petroleum (DMP), and forms the basis of the published records available on DEC’s website.
DEC received 516 applications to clear native vegetation in 2012–13, and made 499 permit application decisions. Under delegation from DEC, DMP received 236 applications and made 235 decisions (some carried over from previous reporting periods).
During the year, 13,304 hectares were approved to be cleared, and 160 hectares were refused.
Sixty-four per cent of decisions on applications to clear native vegetation were made within 60 calendar days, a further 33 per cent within 90 days and three per cent of decisions took longer than 90 days.
Flora and fauna licences
In 2012–13, DEC issued 8,739 licences under the WC Act to take, collect, keep and breed, deal in, trap or export native fauna, and 1,990 licences to collect native flora. A further 405 licences were issued to scare, destroy, or trap and relocate nuisance wildlife and wildlife that was causing damage.
Service 2: Sustainable Forest ManagementProviding economic, social and cultural benefits from State forest and timber reserves while conserving biodiversity, maintaining soil and water values, and sustaining the health, vitality and productive capacity of the forest for current and future generations.
Functions through which the department delivered this service include:
1. Implementing approved forest management plans and government policies and programs:
• including implementing actions outlined in the Forest Management Plan 2004–2013.
2. Inventory, assessment and modelling of natural resources, including:
• acquiring and analysing wood inventory data to help DEC, the Conservation Commission and the Forest Products Commission in planning, managing and monitoring wood production in State forest and timber reserves
• mapping vegetation to inform silvicultural decisions, old-growth forest assessments, disease impact predictions, reserve analysis and planning, and the protection of poorly reserved forest ecosystems and less well-reserved vegetation complexes
• carrying out field measurement programs to monitor the yields and silvicultural standards realised in timber harvest operations
REPORT ON OPERATIONS
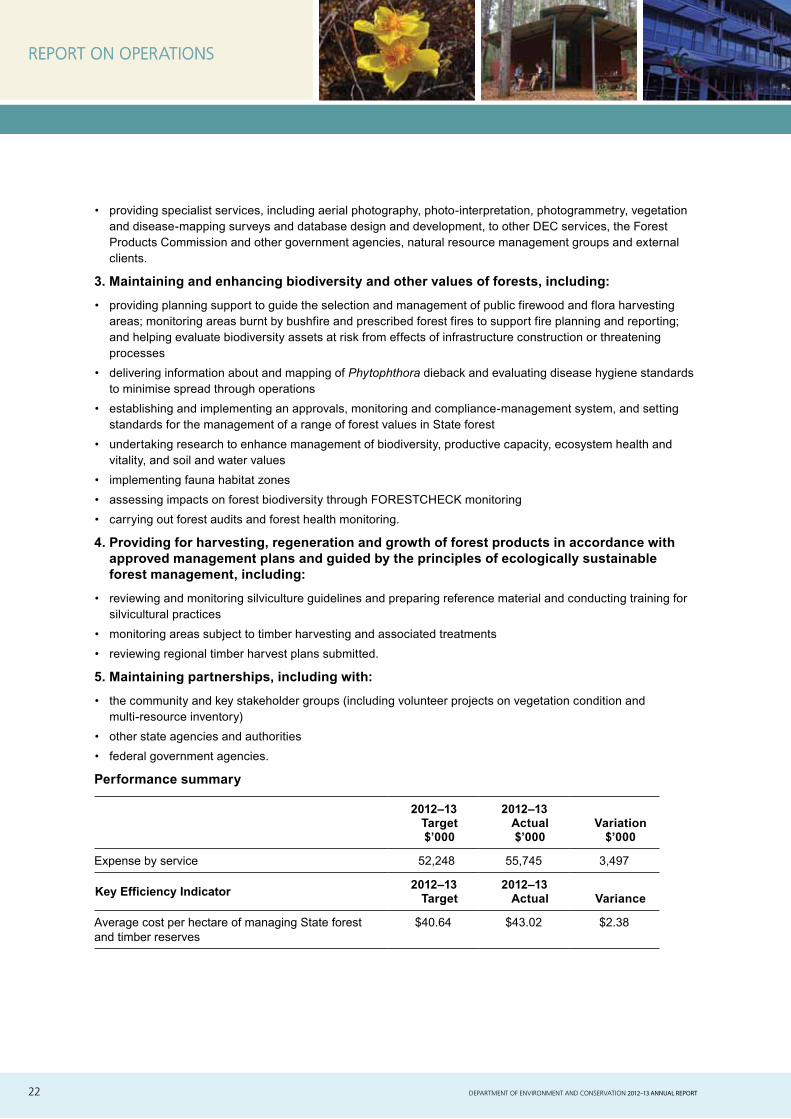
DEPARTMENT OF ENVIRONMENT AND CONSERVATION 2012–13 ANNUAL REPORT22
REPORT ON OPERATIONS
• providing specialist services, including aerial photography, photo-interpretation, photogrammetry, vegetation and disease-mapping surveys and database design and development, to other DEC services, the Forest Products Commission and other government agencies, natural resource management groups and external clients.
3. Maintaining and enhancing biodiversity and other values of forests, including:
• providing planning support to guide the selection and management of public firewood and flora harvesting areas; monitoring areas burnt by bushfire and prescribed forest fires to support fire planning and reporting; and helping evaluate biodiversity assets at risk from effects of infrastructure construction or threatening processes
• delivering information about and mapping of Phytophthora dieback and evaluating disease hygiene standards to minimise spread through operations
• establishing and implementing an approvals, monitoring and compliance-management system, and setting standards for the management of a range of forest values in State forest
• undertaking research to enhance management of biodiversity, productive capacity, ecosystem health and vitality, and soil and water values
• implementing fauna habitat zones
• assessing impacts on forest biodiversity through FORESTCHECK monitoring
• carrying out forest audits and forest health monitoring.
4. Providing for harvesting, regeneration and growth of forest products in accordance with approved management plans and guided by the principles of ecologically sustainable forest management, including:
• reviewing and monitoring silviculture guidelines and preparing reference material and conducting training for silvicultural practices
• monitoring areas subject to timber harvesting and associated treatments
• reviewing regional timber harvest plans submitted.
5. Maintaining partnerships, including with:
• the community and key stakeholder groups (including volunteer projects on vegetation condition and multi-resource inventory)
• other state agencies and authorities
• federal government agencies.
Performance summary
2012–13 Target $’000
2012–13 Actual $’000
Variation
$’000
Expense by service 52,248 55,745 3,497
Key Efficiency Indicator 2012–13 Target
2012–13 Actual
Variance
Average cost per hectare of managing State forest and timber reserves
$40.64 $43.02 $2.38
REPORT ON OPERATIONS

DEPARTMENT OF ENVIRONMENT AND CONSERVATION 2012–13 ANNUAL REPORT 23
REPORT ON OPERATIONSREPORT ON OPERATIONS
Performance highlights
• The Forest Management Plan 2004–2013 continued to be implemented.
• The Draft Forest Management Plan 2014–2023 was released for public comment.
• Public information sessions in Perth, Bunbury and Manjimup were held to engage the public and encourage comment on the Draft Forest Management Plan 2014–2023.
• Information sessions were also held with key stakeholders, including Aboriginal, industry and conservation groups and local government, as part of the release of the Draft Forest Management Plan 2014–2023 and to support the public comment process.
• A social and economic impact assessment of the Draft Forest Management Plan 2014–2023 was carried out and a report published.
• For the first time, estimates of carbon stocks and change in carbon stocks for State forest and conservation reserves were undertaken, and were incorporated into the Draft Forest Management Plan 2014–2023.
• A suite of supporting documents was released with the Draft Forest Management Plan 2014–2023, including: the Forest Management Plan 2004–2013 End-of-Term Audit of Performance Report, the Proposed Revised Jarrah Silvicultural Guidelines, Review of silviculture in south-west forests of Western Australia panel report, three information sheets explaining the sustained yield of wood products, an information sheet on estimating native forest carbon stocks and nine fact sheets summarising key aspects of the Draft Forest Management Plan 2014–2023.
• More than 5,000 submissions were received during the public comment period on the Draft Forest Management Plan 2014–2023. These were analysed to identify issues and a response to each issue was prepared.
• An independent expert panel reviewed the processes used to calculate the sustained yields of wood product available from south-west native forests.
• A Proposed Forest Management Plan 2014–2023 was prepared and transmitted to the Environmental Protection Authority for environmental impact assessment, supported by the Analysis of Public Comment on the Draft Forest Management Plan 2014–2023.
• Work was undertaken to improve modelling of the rate of spread of Phytophthora dieback to predict impact on sustained yields of wood product for the Proposed Forest Management Plan 2014–2023.
• The detection and mapping of Phytophthora dieback on 19,970 hectares of DEC-managed land was carried out to inform the planning and management of disturbance operations and the prioritisation of disease treatments.
• Fifty-eight disturbance operations, covering 7,930 hectares of State forest and timber reserves, were evaluated and monitored for compliance with the environmental outcomes sought in the Forest Management Plan 2004–2013.
• Eight new FORESTCHECK monitoring grids were installed in Donnelly District and sampling for macrofungi, terrestrial vertebrates, invertebrates and coarse woody debris was conducted in autumn 2013. Analysis of data from the 10-year monitoring period 2002–12 was started. The FORESTCHECK program monitors the effects of timber harvesting on biodiversity.
• Seed collection guidelines were revised for the Draft Forest Management Plan 2014–2023 based on analysis of genetic diversity in forest species.
• Fire management was implemented to protect the values of State forest and timber reserves within the south-west forests. A total of 17,301 hectares of State forest and timber reserves were subject to prescribed burns.
• New forest resource software (Woodstock™) was introduced to the department’s planning systems.
• A new forest vegetation mapping system based on digital photography was developed and implemented.
• A community forest inspection was undertaken in the Warren Region.

DEPARTMENT OF ENVIRONMENT AND CONSERVATION 2012–13 ANNUAL REPORT24
REPORT ON OPERATIONSREPORT ON OPERATIONS
Service 3: Parks and Visitor Services Managing lands and waters, dealing with public involvement in, and visitation and appreciation of, the natural environment on lands and waters managed by the department, including:
• preparing and implementing management plans in accordance with the Conservation and Land Management Act 1984 (CALM Act)
• preparing and implementing recreation master and site development plans
• providing, managing and maintaining appropriate access, recreation opportunities and visitor facilities
• protecting visitors, natural areas and facilities from bushfire
• training departmental staff and volunteers
• working with local tourist bureaux, regional tourism organisations and commercial tour operators
• involving Aboriginal people in park management and the provision of visitor facilities and services
• providing visitor information, and designing and initiating educational and interpretive activity programs that enrich visitor experience, and help develop greater community awareness and support for parks, natural areas, nature-based tourism, and recreation services and policies
• undertaking scientific, visitor and social research in cooperation with other research institutions
• providing services to the Conservation Commission and the Marine Parks and Reserves Authority.
Functions through which the department delivered this service include:
1. Planning for management
At 30 June 2013 there were:
• 54 final statutory terrestrial management plans in place
• five final terrestrial management plans in preparation
• five draft terrestrial management plans in preparation
• 10 final statutory marine management plans in place
• six marine indicative management plans in preparation
• one intertidal reserve indicative draft management plan in preparation.
2. Acquiring and administering protected areas, through:
• reserve creation and land acquisition
• leasing arrangements involving 185 formal lease agreements for activities such as recreation, tourism accommodation, utilities and sawmills
• apiary site management involving 3,272 current permits, of which 1,657 occurred on DEC-managed lands.
3. Park presentation and resource protection, including:
• improving and maintaining the department’s $309 million recreation and tourism assets on DEC-managed lands through capital funds
• managing 37,000 kilometres of roads through capital funds and grants
• recreation planning and design.
4. Visitor communication and management, through:
• interpretive planning and design
• community liaison, consultation and advisory services
• guided interpretive programs.

DEPARTMENT OF ENVIRONMENT AND CONSERVATION 2012–13 ANNUAL REPORT 25
REPORT ON OPERATIONSREPORT ON OPERATIONS
5. Aboriginal liaison, consultation and heritage, including:
• developing and implementing joint management agreements and initiatives
• providing for customary activities
• providing for heritage and culture protection
• relationship-building, education and training.
6. Business management, including:
• developing and disseminating communication, social media and promotional material, and establishing and maintaining relationships with reference groups and industry bodies
• selling and distributing park passes, and processing requests for fee waivers
• licensing commercial operations and communicating conditions to licence holders.
7. Legislation and policy for parks and visitor services, including:
• developing and amending legislation and regulations, and drafting and administering policies for visitor activities on DEC-managed lands.
8. Recreation activities and trails, including:
• managing outdoor recreation activities
• coordinating the management of the Bibbulmun Track and the Munda Biddi Trail
• working with associations and clubs such as the WA 4WD Association and Outdoors WA
• planning for better management of off-road vehicle use
• developing and implementing recreation plans.
9. Community involvement, including:
• enlisting community support by providing access to meaningful and interesting opportunities for involvement, and ongoing projects and programs
• engaging with community groups
• supporting and training volunteers.
10. Social and visitor research, through:
• monitoring visitor use in national parks, State forests and other reserves
• conducting a visitor survey program to assess visitor needs and expectations, and gauge visitor satisfaction with recreation and tourism facilities and services.
12. Support to the Conservation Commission and the Marine Parks and Reserves Authority (MPRA), through:
• staffing of the Conservation Commission Service Unit
• providing advice and information relating to the statutory functions of both bodies.
(As independent statutory authorities, the Conservation Commission and the MPRA report on their activities in separate annual reports, which are available on their websites at: www.conservation.wa.gov.au and www.dec.wa.gov.au/mpra.)
13. Other initiatives, including:
• formalising partnerships through memoranda of understanding
• progressing world and national heritage nominations.

DEPARTMENT OF ENVIRONMENT AND CONSERVATION 2012–13 ANNUAL REPORT26
REPORT ON OPERATIONS
14. Carrying out parks and visitor services through the nine DEC regions
Performance summary
2012–13 Target $’000
2012–13 Actual $’000
Variation $’000
Expense by service 88,404 96,117 7,713
Key Efficiency Indicator 2012–13 Target
2012–13 Actual Variance
Cost per visit $5.45 $6.00 $0.55
Performance highlights
• The state’s 100th national park, Murujuga National Park, was created on 17 January 2013. The park is jointly managed by DEC and the Murujuga Aboriginal Corporation. This was the first joint management agreement to be reached under the CALM Act, which was amended in March 2012 to provide a mechanism for joint management.
• On 8 December 2012, the CALM Act, Wildlife Conservation Act 1950, Conservation and Land Management Regulations, Wildlife Conservation Regulations and Forest Management Regulations were amended to enable Aboriginal people to undertake certain activities for customary purposes on reserves and other lands. These amendments built on earlier changes to the CALM Act, made in March 2012.
• During 2012–13, final management plans for Yanchep and Neerabup national parks and reserves, Ord River and Parry Lagoons nature reserve and Murujuga National Park were released. The Esperance and Recherche parks and reserves draft management plan was released for public comment and was one of 10 management plans in preparation.
• In April 2013, the Munda Biddi Trail was completed and officially opened. The state’s premier long-distance off-road cycle touring trail now extends more than 1,000 kilometres from Mundaring to Albany.
• Through the Naturebank program, the lease for the Wharncliffe Mill in Bramley National Park was awarded and expressions of interest were assessed for a site in François Péron National Park. Environmental and cultural clearance work was completed in Ngamoowalem Conservation Park and a site prospectus is being developed by Tourism WA prior to the site being released via an expression of interest process. The Naturebank sites in Windjana Gorge and Cape Le Grand national parks are the subject of negotiations with the traditional owners to formalise heritage agreements.
• DEC continued to make progress toward increasing the involvement of Aboriginal people in the management of parks and reserves through a variety of initiatives, including formal joint management arrangements, engagement with local Aboriginal communities and corporations, employment and training opportunities and fee-for-service arrangements.
• DEC also entered into a partnership with Fairbridge Western Australia Inc. to explore opportunities for cooperation between the two organisations to provide sustainable employment and life pathways for young Aboriginal people.
• DEC renewed its strong partnership links with stakeholders such as the Bibbulmun Track Foundation, the WA 4WD Association and Track Care WA, and with the Department of Corrective Services, with memoranda of understanding reviewed and re-signed.
• DEC worked closely with the Department of Sport and Recreation, Outdoors WA, WestCycle and other key stakeholders on important recreation initiatives including the WA State Mountain Bike Strategy, the South West Mountain Bike Master Plan and an outdoor strategy for Western Australia.
• Strong support continued for the DEC Campgrounds online camp site booking system, with 10,215 bookings made in 2012–13 for sites in Cape Range, Purnululu and Beelu national parks, and at Lane Poole Reserve, Dwellingup.
REPORT ON OPERATIONS

DEPARTMENT OF ENVIRONMENT AND CONSERVATION 2012–13 ANNUAL REPORT 27
REPORT ON OPERATIONS
• Significant progress was made on developing a new visitor-focused website to make it easier for visitors to find places to visit and things to do in parks and reserves across Western Australia. As part of DEC’s strategy to utilise smartphone applications, more electronic park guides were developed. There are now 33 downloadable guides and a Sharing the Dreaming application that provides information about Noongar culture and history has also been developed.
• DEC worked with Trails WA to develop a website that will showcase all the trails in Western Australia.
• Maintenance continued on DEC’s 37,000-kilometre statewide road network, with significant works completed to reseal Lucky Bay Road in Cape Le Grand National Park and to improve the road at Echidna Chasm in Purnululu National Park.
• In partnership with the Shire of Augusta-Margaret River, the remaining 470 metres of Lefthanders Road in Leeuwin-Naturaliste National Park were sealed. The newly sealed road provides safer and easier access to popular beaches and surf breaks south of Gracetown.
• In consultation with the Miriuwung and Gajerrong people, a new boardwalk and interpretive signage featuring cultural and scientific information were completed at Mirima National Park near Kununurra. New car parks and visitor facilities were completed at Echidna Chasm, Piccaninny Creek and Mini Palms Gorge in Purnululu National Park and entry roadworks for the park are nearing completion.
• At Karijini National Park, two new houses were built and the power and water services were improved at the staff headquarters. Work started on the installation of a new office and two new staff houses at Millstream Chichester National Park, funded by DEC and Rio Tinto.
• In Karijini National Park, the Hamersley Gorge car park, road and lookout works were completed, funded by DEC, Royalties for Regions and Rio Tinto.
• The redevelopment of Kurrajong campground in Cape Range National Park, funded by Royalties for Regions and DEC, was completed, with the construction of 22 new camp sites, a new gravel road, lookout points, a shelter and toilets. An additional 19 new camp sites were developed in other areas of the park.
• The new $2.1 million Baden Powell campground in Lane Poole Reserve, funded by Royalties for Regions, Alcoa Australia and DEC, was completed and officially opened by the Minister for Environment in June 2013. The campground caters for up to 180 campers, with 42 camp sites serviced by camp kitchens, toilets, gas barbecues, water tanks, paths and interpretation.
• Construction started on the $1.2 million redevelopment of Martins Tank campground in Yalgorup National Park. Funded by Royalties for Regions, the campground will be expanded with the addition of 18 new camp sites suitable for caravans.
• At Hangover Bay in Nambung National Park, a $1.67 million road and visitor infrastructure work project was completed. The facilities, developed in response to an increase in visitation associated with the completion of Indian Ocean Drive, were opened by the Minister for Environment in October 2012.
• In Kalbarri National Park, work started on improving the Loop–Z Bend Road and the construction of new visitor facilities at the Loop and West Loop sites at the Murchison Gorge. The project is funded through a Royalties for Regions infrastructure and roads initiative.
• At Barna Mia in Dryandra Woodland, nocturnal tours continued to give visitors a special wildlife encounter experience. Work was completed on a second viewing enclosure to enable additional tours to take place.
• Work was completed on pathways in Yellagonga Regional Park to improve drainage and visitor access. Conservation and stabilisation works were also finished at Perry’s Cottage and Stables in Perry’s Paddock in the park.
• Work progressed on the rehabilitation of land in Beeliar Regional Park and community-based conservation programs associated with the Fiona Stanley Hospital and Health Precinct.
• The installation of rail crossings, fencing and landscaping along Nyyerbup Circle in Woodman Point Regional Park was completed. The new section of dual-use path provides pedestrians and cyclists with safe access to John Graham Reserve.
REPORT ON OPERATIONS

DEPARTMENT OF ENVIRONMENT AND CONSERVATION 2012–13 ANNUAL REPORT28
REPORT ON OPERATIONS
• In collaboration with the Recreation Trail Bike Riders’ Association of WA and Department of Sport and Recreation, DEC continued developing and improving trails for family and novice riders in the gazetted off-road vehicle areas at Pinjar.
• In Margaret River, a number of mountain bike trails were developed in partnership with the Margaret River Off-Road Cycling Association and work has started on an area development plan for mountain biking in parts of Bramley National Park.
• In Leeuwin-Naturaliste National Park, the redevelopment of the Sugarloaf Rock day-use area was completed.
• The completion of the new Wilderness View boardwalk and lookout at Mount Frankland National Park marked the end of the final phase of the Walpole Wilderness Discovery Centre project that included the creation of the art loop at Swarbrick and construction of an outdoor classroom at the Valley of the Giants.
• The car park and finger jetty at Coalmine Beach boat ramp in Walpole-Nornalup National Park were completed. This project was jointly funded by DEC and a Department of Transport Recreational Boating Facilities Scheme grant.
• Work continued on the $40 million Fitzgerald River National Park Improvement Project, which is nearing completion. On the eastern side of the park the Four Mile Beach day-use area and campground reopened in July 2012 and Barrens Lookout opened in November 2012. The majority of the roadworks were completed and the remaining recreation site upgrades were well advanced. Construction started on the new coastal walk trail on the western and eastern sides of the park. The trails are expected to be opened in late 2013.
• Work was completed on the redevelopment of day-use and campground facilities at Peak Charles National Park, funded through the strategy for the Great Western Woodlands and by DEC.
• The number of DEC-registered volunteers increased to 16,446 people, 4,717 of whom contributed more than 564,350 hours to projects across Western Australia, a 23.3 per cent increase on the number of hours contributed in 2011–12. Volunteers took part in a wide range of activities including staffing the Wildcare Helpline, collecting seeds, clearing weeds and taking part in fauna surveys.
• The total number of visits to DEC-managed lands and waters increased slightly to 16.02 million from 15.65 million last year (see Figure 1).
• The 2012–13 visitor satisfaction index, averaged from visitor responses to a survey at selected parks, reserves and forest areas around the state, was 88 per cent. This outcome, with results from previous years of the survey program, is illustrated in Figure 2.
• Tragically, during 2012–13, 14 visitors died in the extensive areas managed by DEC; 12 deaths were due to drowning. Visitor safety is a high priority for the department which implements a statewide Visitor Risk Management Program. The department conducts reviews of fatal incidents and implements the key recommendations of those reviews.
• DEC continued to work on a broad range of issues regarding visitor safety, including remote camping, crocodile warning signs, walk trail classifications and redevelopments, and improvements to recreational sites and facilities.
• DEC committed to implementing a statewide approach to reduce the number of injuries and deaths associated with rock fishing in Western Australia, and continued to work with Recfishwest and other stakeholders to develop a strategy.
• During 2012–13, DEC also attended two coronial inquests arising out of the tragic deaths of visitors on DEC-managed lands or waters.
• In response to the Coroner’s recommendations regarding the drowning deaths of two visitors to Penguin Island on 28 December 2010, DEC formed a working group to implement the key recommendations before the start of the 2013–14 visitor season. The island is closed to visitors in winter. During the 2012–13 season, DEC, in partnership with Surf Life Saving WA, provided lifesaver patrols at Mersey Point during peak visitor periods and committed to the continuation of this service.
• In response to the Coroner’s recommendations regarding the death of a hiker in Stirling Range National Park on 13 December 2010, DEC started reviewing its publicly available information relating to the Eastern Peaks Ridge Walk.
REPORT ON OPERATIONS
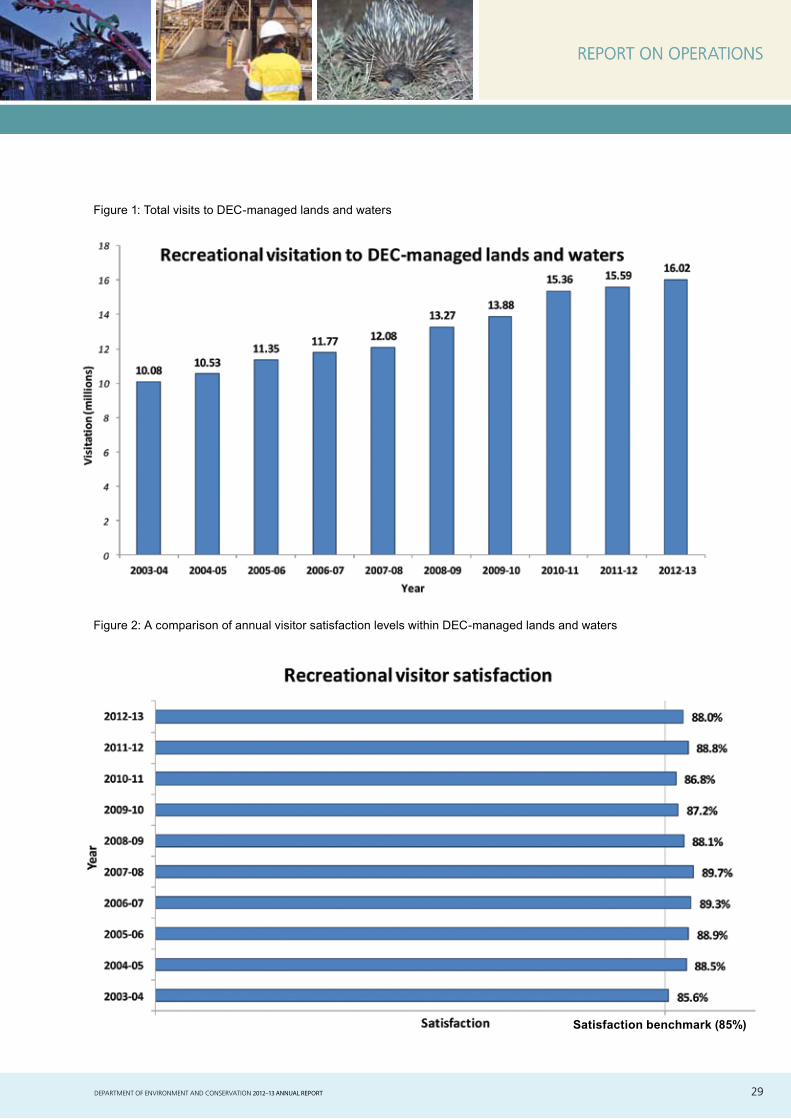
DEPARTMENT OF ENVIRONMENT AND CONSERVATION 2012–13 ANNUAL REPORT 29
REPORT ON OPERATIONS
Figure 1: Total visits to DEC-managed lands and waters
Figure 2: A comparison of annual visitor satisfaction levels within DEC-managed lands and waters
REPORT ON OPERATIONS
Satisfaction benchmark (85%)

DEPARTMENT OF ENVIRONMENT AND CONSERVATION 2012–13 ANNUAL REPORT30
REPORT ON OPERATIONS
Service 4: Environmental RegulationProtecting the environment and community by ensuring that emissions and discharges meet acceptable criteria, pollution incidents are responded to effectively, and contaminated sites are appropriately managed, and overseeing the monitoring of ambient air quality, providing technical and strategic advice and implementing air quality management programs.
The functions through which the department delivered this service include:
1. Industry regulation
Under Part V of the Environmental Protection Act 1986 (EP Act) DEC was responsible for the licensing and registration of prescribed premises, licensing of controlled waste transporters, and administration of a range of regulations in Western Australia. The department monitored and audited compliance with works approvals, licence conditions and regulations; took enforcement actions as appropriate; and developed and implemented departmental licensing and industry regulation policy and reform.
DEC was also responsible for overseeing works approvals and licensing of prescribed premises, including the provision of environmental regulatory operations, in Indian Ocean Territories, servicing Christmas Island and Cocos (Keeling) Islands as part of a formal arrangement with the federal government.
Key features and projects in this reporting period include:
• improving the consistency, quality and effectiveness of regulation of prescribed premises through the implementation of the reform program Re-Engineering for Industry Regulation and the Environment (REFIRE) licensing process
• implementing the department’s Industry Regulation Compliance Strategy, incorporating a range of risk-based proactive compliance management programs aimed at promoting best-practice environmental management across industry and ensuring compliance
• implementing the Environmental Protection (Controlled Waste) Regulations 2004 to ensure the safe and authorised transportation of controlled waste around the state from point of generation to point of disposal
• providing noise regulation technical advice to the Environmental Protection Authority (EPA) and planning and local government authorities, as well as policy, technical, enforcement and training support for DEC, police and local government officers
• finalising amendments to the Environmental Protection (Noise) Regulations 1997 to improve the regulation of noise
• amending industry regulation licensing fees to ensure ongoing full cost of service recovery for wage increases only
• identifying and resolving serious environmental hazards by responding to pollution incidents and hazardous material emergencies, supporting local governments in managing minor pollution issues by providing training and advice, and representing DEC on state hazardous materials emergency committees.
2. Contaminated sites
Under the Contaminated Sites Act 2003 (CS Act), the department regulated contaminated sites by receiving reports of known or suspected contaminated sites, assessing and classifying contaminated sites, maintaining public information on contaminated sites and, where indicated, ordering and monitoring remediation.
3. Implementing approvals reforms
DEC continued to progressively reform project approvals processes, and continued to steadily improve processing times for both large and small development project proposals.
REPORT ON OPERATIONS
DEPARTMENT OF ENVIRONMENT AND CONSERVATION 2012–13 ANNUAL REPORT 31
REPORT ON OPERATIONS
4. National Pollutant Inventory
The department worked with Western Australian industry to coordinate the provision of data to the National Pollutant Inventory, a publicly accessible internet database (www.npi.gov.au) that provides the community, industry and government with information on the emissions of 93 selected substances from industry, transport and commercial premises to air, land and water.
5. Air quality management
DEC provided technical, scientific and strategic advice on air quality to the EPA, state and federal government agencies and local government authorities. The department participated in national air quality policy development and implementation, including the development of a new National Plan for Clean Air. DEC led, advised and assisted with the implementation of the Perth Air Quality Management Plan, with a focus on motor vehicle emissions and haze from domestic wood heaters. The department continued investigation of ambient air quality in regional areas, with a focus on Kwinana, Port Hedland, Kalgoorlie and Collie. The department, in cooperation with major industries, monitored rock art on the Burrup Peninsula to ensure its protection against air pollutants. DEC continued to monitor ambient air quality via a network of fixed air quality monitoring stations to meet its obligations under the National Environment Protection (Ambient Air Quality) Measure. The department also conducted strategic campaign monitoring programs to investigate and inform local air quality issues. During 2012–13, DEC maintained and operated eight metropolitan and five regional fixed air quality monitoring stations to assess the presence of pollutants, including carbon monoxide, nitrogen dioxide, ozone, sulfur dioxide and particles. The ambient air quality index data are made publicly available through regular updates that can be accessed via the Department of Environment Regulation’s website at www.der.wa.gov.au/your-environment/air and within publications such as the annual Western Australia Air Monitoring report.
Performance summary
2012–13 Target $’000
2012–13 Actual $’000
Variation $’000
Expense by service 40,494 42,166 1,672
Key Efficiency Indicators 2012–13 Target
2012–13 Actual Variance
Average cost per air monitoring station $491,869 $531,319 $39,450
Average cost per industry licence $28,031 $28,954 $923
Average cost per contaminated site assessment $5,834 $6,922 $1,088
Average cost of remediating state sites $580,286 $104,630 ($475,656)
Performance highlights
• DEC started implementing its REFIRE licensing reform program to improve its regulatory efficiency, consistency, quality and effectiveness. All new works approvals and licences are now issued using the REFIRE approach and a strategic licensing team is converting all existing licences into the REFIRE format. This will provide a platform for ongoing programs to further improve regulation of prescribed premises.
• REFIRE products now in use include templates for licences and work approvals, an application package, decision documents, policies and procedures. Other products include a framework enabling consistent assessment for all emissions and discharges and new publications for external use, such as proponent guides. The reform aims to deliver greater clarity and transparency for stakeholders, improved consistency and quality, improved efficiency and effectiveness, and standardisation of compliance activities. The reform process is continuing in accordance with the Industry Regulation Licensing Branch Strategic Plan. A copy of the REFIRE Fact Sheet is available from the Department of Environment Regulation’s website at www.der.wa.gov.au/our-services/approvals-and-licences/refire.
REPORT ON OPERATIONS

DEPARTMENT OF ENVIRONMENT AND CONSERVATION 2012–13 ANNUAL REPORT32
REPORT ON OPERATIONS
• DEC delivered 99 per cent of its planned proactive compliance management programs in industry regulation in 2012–13, including:
• 480 inspections carried across premises licensed under Part V of the EP Act
• 135 inspections of controlled waste carrier and disposal sites
• asbestos management in the construction and demolition waste compliance program, targeting compliance with the department’s guidelines for managing asbestos at construction and demolition waste recycling facilities
• implementing the phase two compliance program for the Environmental Protection (Packaged Fertiliser) Regulations 2010.
• In 2012–13, DEC finalised its amendment program for the Environmental Protection (Controlled Waste) Regulations 2004, aimed at improving the workability, transparency and clarity of the regulations, with amendments anticipated to come into effect in early 2014.
• DEC reviewed its prescribed premises risk-assessment framework to ensure the risk presented by prescribed activities is adequately captured so that regulatory resources are targeted accordingly.
• The final draft of the proposed amendments to the Environmental Protection (Noise) Regulations 1997 was completed.
• DEC made progress on its broader ongoing regulatory reform program and identified further areas where duplication and overlap could be eliminated and existing regulations could be improved and streamlined. Where appropriate, stakeholders will be consulted on proposed changes. During 2012–13, DEC limited the increase in licensing fees to cover the cost of salary increases consistent with maintaining full cost of service recovery.
• Major resource project approvals were processed, on average, within the target time frame of 60 days. Approvals performance statistics are reported on the Department of Environment Regulation’s website at: www.der.wa.gov.au/our-services/major-initiatives/regulatory-performance-and-reporting.
• DEC continued to receive and process a high number of works approvals for major resource projects and other industry projects. During 2012–13, 140 major resource project works approvals were issued, following the trend set in 2010–11 when 150 were processed as compared to 71 in 2009–10 and 48 in 2008–09. In 2011–12, 148 works approvals were processed.
• During 2012–13, DEC classified 476 contaminated sites. The total number of sites classified under the CS Act is 2,517.
• DEC received 31 submissions in response to the first stage of consultation on the review of the operation and effectiveness of the CS Act, and published a summary of the responses in February 2013. A discussion paper has been prepared, focusing on identified issues and proposing potential solutions. The discussion paper will be released for further comment early in 2013–14.
• Since 2007, DEC has chaired the technical working group responsible for preparing an amendment to the National Environment Protection (Assessment of Site Contamination) Measure 1999 to update technical guidance. In April 2013, Australian Environment Ministers agreed to the amendment, and it was registered on the Federal Register of Legislative Instruments on 15 May 2013.
• Under a new licence issued by DEC in March 2012, Cockburn Cement Ltd, Munster, was required to install a baghouse filter on kiln five, to be in operation by 30 June 2013. The baghouse filter was commissioned by 17 May 2013, and there has been a significant reduction in emissions and improvement in air quality in the local area since the filter came into operation.
• In May 2012, DEC issued an amended licence to the Southern Metropolitan Regional Council’s Regional Resource Recovery Centre in Canning Vale that required the facility to install new humidifiers for the biofilters by 15 December 2012. The installation of the humidifiers was not completed by the deadline and the facility
REPORT ON OPERATIONS

DEPARTMENT OF ENVIRONMENT AND CONSERVATION 2012–13 ANNUAL REPORT 33
REPORT ON OPERATIONS
stopped receiving waste over the summer. On 4 March 2013, the facility recommenced receiving waste and, over six weeks, increased the throughput to the maximum allowed under the amended licence. The facility will continue to operate at the reduced throughput, as required by the amended licence, until its new pollution control equipment has been shown to be effective.
• On 9 October 2012, significant amendments to the Environmental Protection (Petrol) Regulations 1999 were gazetted. Key objectives of the amendments included improving air quality management legislation in WA and increasingly harmonising Western Australian fuel quality legislation with national fuel quality standards issued under the federal Fuel Quality Standards Act 2000. With the introduction of the Reid vapour pressure waiver in the amendments, ethanol blend petrol (E10) was introduced in Perth in early 2013.
• As part of ongoing initiatives to improve air quality, the BurnWise team conducted two-day workshops in Albany and Mundaring in September 2012 to introduce the draft version of the BurnWise Wood smoke management guide to participants from Local Government Authorities. The majority of attendees were environmental health officers from the Great Southern and Wheatbelt regions, Northampton and local councils in the metropolitan area. The workshops included a demonstration using the newly completed Wood Heater Demonstration Trailer, which enables participants to see the benefits of a compliant wood heater compared to a non-compliant wood heater.
• DEC’s Pollution Response Unit responded to 108 pollution incidents and hazardous materials emergencies, including fuel tanker rollovers, chemical spills and industrial fires. At each incident DEC officers assessed the risk to the environment and took action to minimise the impacts and the risk to public health. These incidents included 30 Department of Fire and Emergency Services call-outs. DEC conducted air quality monitoring to determine the risk to public health and provided advice.
• The Industry Regulation Officer Development Program was developed as a sustainable and cost-effective mechanism to build capacity and improve access to technical training opportunities for industry regulation officers. The competency-based program complements the existing Regulatory Training Program and uses a blended learning approach incorporating e-learning, classroom activities and structured on-the-job training.
• The Industry Regulation Information and Support (IRIS) document library and system, established as part of DEC’s industry reform regulation program, continued to support officers in performing more efficiently and effectively. The IRIS menu provides the user with instant access to authorised processes and information required for processing applications for a works approval or licence.
• Further software upgrading of the Industry Licensing System added new features to improve ease of use and workflow. Changes included an annual fees workflow, weekly tracking reports, restrictions and reporting on licence changes, inspection reports, new user roles (guest and inspector) and changes to fee terminology and explanatory notes.
• Work continued on upgrading infrastructure components of the Controlled Waste Tracking System’s computer software. Changes implemented during 2012–13 built on the system performance improvements achieved in the previous financial year, resulting in further reductions in lost time due to system problems.
REPORT ON OPERATIONS

DEPARTMENT OF ENVIRONMENT AND CONSERVATION 2012–13 ANNUAL REPORT34
REPORT ON OPERATIONS
Service 5: Environmental Sustainability and Climate ChangeDeveloping and implementing policies and strategies that promote environmentally sustainable practices in industry, government and the community, and providing leadership in the development and implementation of strategies to reduce the impact of climate change for Western Australia.
Functions through which the department delivered this service include:
1. Office of the Waste Authority
Based on recommendations of the 2009 Parliamentary Inquiry into Municipal Waste Management in Western Australia, an Office of the Waste Authority was established to support the operations of the Waste Authority.
2. Delivery of programs on behalf of the Waste Authority
The department’s Waste Management Branch provided program delivery support to the Waste Authority in accordance with a service level agreement established in 2009, including the Regional Funding Program for local government. The branch also administered various funding programs for Strategic Waste Management Plan initiatives and provided policy advice to government and other stakeholders on waste and recycling issues.
The branch implemented the Waste Avoidance and Resource Recovery Act 2007, the Waste Avoidance and Resource Recovery Levy Act 2007, the Waste Avoidance and Resource Recovery Regulations 2008, and the Waste Avoidance and Resource Recovery Levy Regulations 2008. Under this legislation, landfills in the Perth metropolitan area, and other landfills that receive waste from the metropolitan area, are obliged to pay a landfill levy on the waste received for disposal. DEC was responsible for administering receipt of landfill levy funds, payments from the Waste Avoidance and Resource Recovery Account and compliance with the legislation, and dealt with applications from local governments for the development of local laws.
3. Strategic Waste Initiatives Scheme and Community Grants Scheme
These two grant funding programs, overseen by the Waste Authority, are funded from the Waste Avoidance and Resource Recovery Account and were administered by DEC. Administration included advertising of funding rounds, assessment of applications, development of recommendations for grant funding, and administration of funding contracts and payments.
4. Support for participation in the Council of Australian Governments Standing Council on Environment and Water
DEC provided policy advice to the Minister for Environment on Standing Council on Environment and Water issues.
Western Australia participates in inter-jurisdictional working groups to implement national projects and is represented on the Standing Council on Environment and Water’s Thematic Oversight Groups for Seamless Environmental Regulation, National Waste Policy, Clean Air, and Landscape and Ecosystem Scale Biodiversity, and their working groups.
Western Australia is also represented on the Australian Packaging Covenant Council and, as part of the implementation of the Australian Packaging Covenant, the department administers a funding program.
5. Strategic policy
The Strategic Policy Branch was responsible for leading and coordinating high-level strategic policy and legislative review across DEC, including regulatory gatekeeping, approvals reform and promoting good environmental policy outcomes.
REPORT ON OPERATIONS

DEPARTMENT OF ENVIRONMENT AND CONSERVATION 2012–13 ANNUAL REPORT 35
REPORT ON OPERATIONS
6. Low Emissions Energy Development (LEED) Fund
This leveraged industry support fund is a state government initiative to invest in the development of low-emission technologies to cut greenhouse gas emissions from the energy sector. It is administered via an annual grants program.
Seven new projects were announced in June 2012, and the fund is now fully allocated. Six of these projects signed financial assistance agreements in 2012–13:
• Curtin University: for a project to simultaneously char and grind biomass so it can be efficiently burned with coal in existing coal generation infrastructure. Grinding the biomass as it is charred uses less energy and the resultant ground biomass is more compatible with coal-burning power plants.
• Morton Seed and Grain: to build a biomass project in the Wheatbelt using oat husks as fuel for cogeneration of electricity and heat.
• Biogass Renewables and Richgro: to build a commercial-scale anaerobic digester plant to convert solid waste to compost and biogas for electricity generation in thermally insulated tanks.
• Solastor, in consortium with Carbon Reduction Ventures: to build, near Morawa, a 1.5-megawatt grid-connected concentrated thermal power station incorporating heat storage technology.
• The University of Western Australia (UWA): to undertake research into recapturing methane from the nitrogen waste stream at liquefied natural gas production facilities. Capturing this methane economically could provide a significant source of abatement.
• UWA: to evaluate the pumping of carbon dioxide (CO2) underground to enhance natural gas recovery.
Enhanced gas recovery would use injected (and therefore sequestered) CO2 to increase natural gas
production and deliver CO2 sequestration.
7. Indian Ocean Climate Initiative (IOCI) Stage 3
This initiative was a $4 million investment by the state government in partnership with CSIRO and the Bureau of Meteorology to provide basic climate research in Western Australia which concluded with the release of reports in October 2012. Stage 3 built on the work already completed by earlier stages of IOCI to provide better understanding of the current and future climate and the impact of changes. The initiative enabled the development of better projections of regional weather in a policy-ready form to enable individuals and businesses, as well as state government agencies, to plan and adapt to a changing climate. A summary for policy makers and a technical synthesis report are available on the Department of Environment Regulation’s website at www.der.wa.gov.au/your-environment/climate-change.
8. Electric vehicles trial
The department continued its participation in a trial of electric vehicles managed by UWA and CO2 Smart Pty
Ltd. This trial aims to test the feasibility of converting standard internal combustion vehicles to run on electricity.
9. Climate change adaptation advice
DEC provided advice to state agencies, local governments and other stakeholders on undertaking climate change risk and vulnerability assessments and adaptation planning; integrating adaptation considerations into existing policies, programs and decision-making; implementing adaptation projects; and building adaptive capacity.
REPORT ON OPERATIONS

DEPARTMENT OF ENVIRONMENT AND CONSERVATION 2012–13 ANNUAL REPORT36
REPORT ON OPERATIONS
10. Climate change mitigation advice
DEC provided advice to state agencies, local governments and other stakeholders on measures to enhance efficiency and mitigate greenhouse gas emissions. The department also provided advice on the impact of national policies in the area of greenhouse gas mitigation.
11. Support for participation in the Select Council on Climate Change
The department participated in inter-jurisdictional working groups to develop national climate change policy. DEC provided policy advice to the Minister for Environment on Select Council on Climate Change matters and was represented on the Complementary Measures and Adaptation working groups. The Select Council concluded its work in 2012–13.
Performance summary
2012–13 Target $’000
2012–13 Actual $’000
Variation $’000
Expense by service 29,872 18,506 (11,366)
Key Efficiency Indicators 2012–13 Target
2012–13 Actual Variance
Cost of administering Waste Avoidance and Resource Recovery Account
9% 10% 1%
Cost of administering Low Emissions Energy Development fund as a percentage of total funds
0.66% 0.49% (0.17%)
Performance highlights
• The Litter Amendment Act 2012 amended the Litter Act 1979 to increase the maximum fine for littering from $1,000 to $5,000. The amendments also made vehicle owners responsible for littering offences from vehicles where the litterer or driver cannot be identified, and transferred the responsibility for authorising officers to enforce the legislation from the Minister to the Chief Executive Officer of DEC.
• The Litter Regulations 1981 were also amended to give effect to the amendments to the Litter Act 1979 and increase the fines for cigarette butt littering from $75 to $200. The amendments also increased the maximum fines for other offences within the regulations and introduced new categories of litter creating a public risk, with fines of $500 for individuals and $2,000 for corporations.
• DEC participated in working groups to support the Standing Council on Environment and Water, the Select Council on Climate Change and the Council of Australian Governments Working Group on Environmental Regulation Reform.
• The IOCI Stage 3 climate research initiative concluded with the release of reports. A technical synthesis report of the findings and summary for policymakers were published with CSIRO and the Bureau of Meteorology. The reports are available at the Department of Environment Regulation website: www.der.wa.gov.au/your-environment/climate-change.
• The state government’s climate change strategy, Adapting to Our Changing Climate, was released in October 2012. The strategy aims to secure the future prosperity of Western Australia and minimise the effects climate change will have on our environment, economy and community. The strategy is available at the Department of Environment Regulation website at: www.der.wa.gov.au/your-environment/climate-change.
• Six of seven new low emissions energy projects allocated LEED funding in June 2012 signed financial assistance agreements during 2012–13. Details about these projects are listed on the previous page at point six.
REPORT ON OPERATIONS

DEPARTMENT OF ENVIRONMENT AND CONSERVATION 2012–13 ANNUAL REPORT 37
REPORT ON OPERATIONS
• Aurora Algae’s LEED-funded biofuel demonstration project in Karratha was completed.
• In August 2012, the first business plan to be developed under the Western Australian Waste Strategy: Creating the Right Environment was approved by the Minister for Environment. The business plan identified eight key areas of investment and resulted in program expenditure of more than $11.2 million in 2012–13 across a wide range of waste initiatives.
• A Strategic Waste Infrastructure Planning Working Group was established and work started on developing a plan for waste infrastructure in the Perth and Peel regions to cater for a population of 3.5 million. The working group, which has representatives from government agencies, local government and industry, is also preparing advice on appropriate governance and financing models to support the implementation of the infrastructure plan.
• Two rounds of the Community Grants Scheme were run during 2012–13, with 14 projects being awarded grants totalling almost $170,000.
• Under the Strategic Waste Initiatives Scheme, the Electrical, Utilities and Public Administration Training Council was awarded a grant of $180,000 to deliver waste management workforce training.
REPORT ON OPERATIONS
DEPARTMENT OF ENVIRONMENT AND CONSERVATION 2012–13 ANNUAL REPORT38
SUPPORTING OUR DEPARTMENT
SUPPORTING OUR DEPARTMENT
Strategic Development and Corporate AffairsThe Strategic Development and Corporate Affairs Division (SDCA) enabled and coordinated departmental communications and community relations. Responsibilities included internal and external communications, education programs, media relations, publications, graphic design, photography and video production, online services, public participation planning, events coordination, advertising and a variety of corporate programs.
The division’s media unit provided communications support across the department through the preparation of communication plans, speeches, the release of media statements covering the full spectrum of the department’s activities, and providing information for the Minister’s office and responses to media enquiries. Unit staff performed a vital role in providing public information for incident management during the 2012–13 fire season and once again worked closely with colleagues from the Department of Fire and Emergency Services (DFES) as well as the emergency broadcasting team from ABC Local Radio. A more streamlined system for preparing and distributing bushfire advices and warnings was introduced and the increased automation enabled staff to provide information to the public and media more quickly. The system is also used by DFES which enables staff from either agency to work interchangeably during a major incident.
In 2012, the Western Australian Environment Awards program was once again well supported, with more than 90 entries received from businesses, local and state government agencies, community groups and individuals across the state. The program, which is organised by SDCA and supported by a diverse range of sponsors from industry and government, recognises projects and initiatives that set new benchmarks in protecting and conserving Western Australia’s environment. It is also an avenue to acknowledge, promote and celebrate community involvement in biodiversity conservation and environmental care. Nominated projects were honoured at a presentation dinner attended by the Minister for Environment and 350 guests.
The division coordinated publishing for the department, enabling the production of more than 500 reports, periodicals, management plans, books, brochures, magazines, manuals, field guides, newsletters and other information products each year. Notably, three new book titles focussed on increasing public engagement with parks and conservation areas were released in 2012–13: Rediscover Perth Outdoors, a guide to 37 natural areas in the metropolitan area; Discovering Mount Augustus, a pocket-sized summary of the history, geology, flora, fauna and walk trails of this distinctive national park in the state’s Gascoyne region; and Guide to the Great Western Woodlands, a field guide for visitors to this celebrated area, the largest remaining area of intact Mediterranean-climate woodland in the world.
In addition, the department produced four issues of LANDSCOPE magazine and 11 issues of the online newsletter Environment and Conservation News, which is distributed to staff and volunteers.
DEC’s range of saleable products, sold under the WA Naturally brand, was available from 363 retail outlets across the state, interstate and online. DEC publications, including park passes, are also available from DEC offices, visitor centres and through DEC’s online shop, which has continued to attract an increasing number of Western Australian, interstate and overseas buyers.
A stakeholder engagement process was started as part of the development of a three-year future directions plan for DEC’s saleable publishing program.
In 2012–13, the division continued to manage the department’s online presence through its various websites in accordance with the state government’s Website Governance Framework. Under the department’s online publishing policy, 29 social media activities from various DEC business areas were on the departmental register, including Facebook groups, Twitter accounts, YouTube information videos and blogs.
In addition, the division facilitated internal staff communications through the development and maintenance of the intranet, enabling staff dispersed across the state to collaborate and consolidate their business on a common platform.
SDCA continued to provide access to a range of internal and external library resources, and answered thousands of phone and visitor enquiries.
SUPPORTING OUR DEPARTMENT
DEPARTMENT OF ENVIRONMENT AND CONSERVATION 2012–13 ANNUAL REPORT 39
SUPPORTING OUR DEPARTMENT
The division’s education officers enabled thousands of young Western Australians to connect with the environment and explore environmental issues through programs such as Ribbons of Blue, Bush Rangers WA, Waste Wise Schools, EcoEducation, AirWatch, Outdoor Classrooms and by providing holiday activities through the Nearer to Nature program.
Waste Wise Schools saw 56 new schools join during 2012–13. More than 724 metropolitan and regional schools have participated in the program since its launch in 2002. Grants totalling $172,000 were provided to schools to help them implement Waste Wise strategies.
Nearer to Nature’s programs about Western Australia’s rich biodiversity and Aboriginal culture continued to be well supported, with the number of schools participating in excursions and incursions increasing from 329 to 397 and the total number of students, teachers and accompanying adults increasing by 4,585 to 18,151. Almost 2,000 children and adults participated in Nearer to Nature holiday programs.
Bush Rangers WA celebrated its 15th anniversary in 2013 and continued to support conservation initiatives and the social development of the young cadets involved in 60 units.
Environmental Enforcement UnitEnforcement support
The Environmental Enforcement Unit (EEU) contributed to effective administering of environmental regulation by providing the full spectrum of environmental investigative and enforcement support. Its responsibilties included providing legal quality assurance for enforcement, coordination and management of all environmental prosecutions commenced by the department, and taking the lead role in investigations into major environmental incidents. During the year, the unit successfully coordinated and concluded departmental investigations into a broad range of environmental incidents throughout the state in partnership with regional investigators and environmental staff.
The unit also continued to deliver the Authorised Officers Training Course in consultation with the department’s Regulatory Training Section. This course is offered as part of the department’s ongoing commitment to improve environmental enforcement outcomes through training and mentoring and providing investigative support through working partnerships with branch and regional staff who are responsible for responding to incidents.
Finalised environmental prosecutions for 2012–13
Fifteen environmental prosecutions were subject to final court determination during 2012–13, including cases relating to the Environmental Protection Act 1986, Litter Act 1979 and the Unauthorised Discharge Regulations 1987.
Environmental prosecutions currently before the courts
The department initiated 14 environmental prosecutions during 2012–13 , involving a broad range of charges including pollution, unauthorised clearing of native vegetation and illegal dumping.
At 30 June 2013, eight environmental prosecutions remained before the courts.
There were an additional 18 pending cases that, subject to the evidentiary standard being met, could result in prosecution or other sanction.
Modified penalty fines
Modified penalty fines are administered under Section 99A of the Environmental Protection Act 1986, which empowers the department to issue a fine where statutory conditions are met. These conditions include minimising and remedying the impacts of the incident and amending procedures to ensure a similar incident
SUPPORTING OUR DEPARTMENT

DEPARTMENT OF ENVIRONMENT AND CONSERVATION 2012–13 ANNUAL REPORT40
SUPPORTING OUR DEPARTMENT
does not reoccur. The amount of the fine is determined by legislation which directs that the first and second offences will be at 10 and 20 per cent respectively of the maximum penalty available. If the fine is not paid within the specified time, the department commences prosecution action.
DEC issued two Modified Penalty Notices in 2012–13.
DEC issued a $6,250 modified penalty fine (Modified Penalty Notice 1/2012) to Aleksander Fabo for allegedly illegally dumping waste. The penalty was issued after an investigation identified that on 18 May 2011, Fabo with another person, Waheed Ismail-Zai, dumped a trailer load of asbestos waste in Warbrook Road, Melaleuca (State Forest 65). The fine was paid.
DEC also issued a $6,250 modified penalty fine (Modified Penalty Notice 2/2012) to Waheed Ismail-Zai for allegedly illegally dumping waste. The fine was not paid. The department prosecuted, resulting in a $6,250 fine being imposed by the Perth Magistrates Court. An additional $338.50 in costs was ordered to be paid by the courts.
Legal Services BranchThe Legal Services Branch provided general legal advice to DEC in relation to legal issues of significance to the department, including issues relating to the legislation administered by the department and legislative reform.
Litigation
During 2012–13, the department received two writs issued out of the District Court of Western Australia in respect of public liability claims. One writ alleged breach of statutory duty causing death by drowning off Penguin Island in December 2010. The other writ involved multiple residents of the Margaret River area alleging breach of statutory duty arising out of bushfires in the locality in November 2011. Neither matter has been finalised.
In July 2012 the Supreme Court of Western Australia dismissed the application of a waste facility operator for orders that, among other things, DEC’s licensing decisions regarding the facility be quashed. The operator appealed against the Court’s decision. On 24 June 2012, the Court of Appeal dismissed the appeal.
Several other legal proceedings against DEC were in progress at the start of the reporting period, and continued during the period.
Freedom of Information
The Legal Services Branch managed the processes for the department under the Freedom of Information Act 1992. The department’s Information Statement 2011–12 (available on the Department of Environment Regulation and Department of Parks and Wildlife’s websites, www.der.wa.gov.au and www.dpaw.wa.gov.au) describes the functions of the department and its related agencies, the nature of the information held by the department and its related agencies, and the type of information which is made available to the public.
DEC received 216 applications for access to information, 13 of which were subsequently withdrawn. The average time taken to process each application was 32.5 days.
The department received two applications requesting an internal review of the department’s decision. One applicant requested an external review.
Fire Management Services BranchDEC continued to be involved in both the suppression of bushfires and the use of prescribed fire to achieve land management objectives in all the varied environments of the state. The department’s Fire Management Services Branch has developed comprehensive fire management systems and maintains state-of-the-art fire management equipment and technologies.

DEPARTMENT OF ENVIRONMENT AND CONSERVATION 2012–13 ANNUAL REPORT 41
SUPPORTING OUR DEPARTMENT
The department has numerous well-trained professional fire managers and undertakes scientific studies into fire-related topics to constantly expand the knowledge available to fire practitioners.
Fire season 2012–13
DEC staff attended and monitored 676 bushfires which burnt about 5,477,395 hectares in 2012–13, including:
• 590,104 hectares in the Pilbara Region
• 3,450,330 hectares in the Goldfields Region
• 1,309,013 hectares in the Kimberley Region
• 84,348 hectares in the South Coast Region
• 29,049 hectares in the Midwest Region
• 917 hectares in the Wheatbelt Region
• 13,634 hectares in the three forest regions (Swan, South West and Warren regions).
The causes of these fires were:
• lightning—28 per cent (above the 10-year average of about 24 per cent)
• deliberately lit or arson-caused fires—37 per cent (below the 10-year average of about 43 per cent)
• accidental fires—16 per cent
• escapes from private burns—4 per cent
• escapes from DEC burns—0 per cent
• other causes—4 per cent
• unknown—11 per cent.
During 2012–13, the most serious bushfires attended by DEC occurred in the South Coast and South West regions. Significant assistance was provided to local government authorities and the Department of Fire and Emergency Services (DFES) at fires in Bullsbrook and Lennard Brook. Other fires of significance occurred at Osmand Range, which threatened the World Heritage values of the Bungle Bungle Range in Purnululu National Park. Large fires also occurred in the South Coast Region near Norseman and Salmon Gums in the Dundas Nature Reserve and in Cape Arid National Park.
DEC pre-formed incident management teams were deployed, either in full or in part, to two fires during the 2012–13 fire season.
Prescribed burning
The indicative burn target for 2012–13 in the south-west forest regions was 200,000 hectares. DEC achieved 23,468 hectares, including about 410 hectares that were burnt for pine plantation protection.
The combination of unsuitable weather conditions, fuels remaining dry due to summer conditions extending into autumn, and enhanced requirements in prescribed burn planning and risk management as a result of the 2011 Margaret River bushfire contributed to a significant reduction of the area able to be prescribed burnt this year.
A further 6,023,884 hectares was burnt in the Kimberley, Pilbara, Goldfields, Midwest, Wheatbelt and South Coast regions. The burns were carried out on DEC-managed lands as well as on unallocated Crown lands and unmanaged reserves within these regions.
Aerial bushfire suppression operations
DEC contracted nine fixed-wing water bombers from late November 2012 to late April 2013. Two Air Tractor 602 aircraft were based at Manjimup; two Air Tractor 802 aircraft each were based at Albany and Bunbury. Two Air Tractor 802 aircraft were on contract and available at Jandakot airport for the bushfire season, with a third Air Tractor 802 available on request. For periods of severe bushfire weather an additional two Air Tractor 802 aircraft were available from Jandakot. The aircraft provided rapid aerial suppression capability in the South
DEPARTMENT OF ENVIRONMENT AND CONSERVATION 2012–13 ANNUAL REPORT42
SUPPORTING OUR DEPARTMENT
Coast, Midwest, Wheatbelt and south-west forest regions, including the Perth outer-metropolitan area, giving significant assistance to ground crews in the initial attack on bushfires.
Fixed-wing water bombers were used successfully on numerous bushfires that threatened residential areas across the south-west. These aircraft flew 757 operational hours in attending 188 bushfires, and dropped 1,396 loads, delivering 4.2 million litres of product. In 2011–12, the aircraft flew 979 hours and dropped 1,791 loads.
Bushfire detection
DEC provided an effective fire-detection system in the high bushfire risk zones of the south-west forest regions using single-engine fire detection aircraft and 11 fixed-lookout towers. DEC’s fleet of 10 ‘spotter’ aircraft flew 3,977 hours for aerial surveillance in pre-determined circuits. Flight schedules varied according to bushfire danger levels and fire activity. The aircraft also flew about 314 hours in support of aerial suppression operations during 2012–13. The detection aircraft were flown by three permanent senior pilots and 11 pilots filling seasonal positions.
Logistics support for bushfire response
Major works were completed on the department’s logistics warehouse in Bunbury, which is now in operation. Work is ongoing to enhance its capacity to function as both a management and storage hub for fire and emergency cache equipment, fire consumables, a logistics semi-trailer and sea containers, and a mobile communications facility.
Bushfire training and development
Fire Management Services Branch development and education staff conducted 39 formal fire training courses involving 495 participants. In addition, district and regional staff delivered five formal fire-training programs to 56 participants. Course participants were predominantly from DEC, including campground host volunteers, but also included personnel from the Forest Products Commission, DFES and local governments.
Aviation Section personnel provided training for 118 DEC aerial operations personnel. These courses included:
• Air Attack Supervisor Qualification
• Air Attack Supervisor Currency
• Air Observer
• Helitorch Ground Crew
• Incendiary Operations Supervisor
• Aerial Incendiary Bombardier
Air attack supervisor training was also provided to DFES staff.
In addition, water bomber reloading training was provided to 367 participants across 35 operational bases, with the majority of these participants from volunteer bushfire brigades and local State Emergency Service units. This training was also provided to Royal Australian Air Force staff at RAAF bases Pearce and Gin Gin.
Incendiary operations supervisor, aerial incendiary bombardier, air observer, airbase manager and aerial drip-torch operator training was provided to the Department of Environment, Water and Natural Resources in South Australia. Aerial incendiary bombardier training was provided to staff from the Kimberley Land Council and the Australian Wildlife Conservancy.
DEC and DFES continued to develop and promote common fire training programs and course materials under the auspices of the Interagency Bushfire Management Committee and with other agencies in Australia and New Zealand.

DEPARTMENT OF ENVIRONMENT AND CONSERVATION 2012–13 ANNUAL REPORT 43
SUPPORTING OUR DEPARTMENT
Bushfire preparedness on unallocated Crown lands
Since 1 July 2003, the department has been responsible for the coordination and on-ground management of bushfire risk prevention and bushfire preparedness works on 89 million hectares of unallocated Crown land and unmanaged reserves outside the Perth metropolitan area and town sites.
Work undertaken by DEC in 2012–13 included the construction and maintenance of firebreaks, modification of vegetation in strategic buffers, open-edge prescribed burning and large-scale aerial ignition.
In the Kimberley, Pilbara and Goldfields regions, DEC continued to engage and build partnerships with other stakeholders, including Aboriginal communities and neighbouring pastoralists. The use of planned fire for developing landscape-scale mosaics continued to yield benefits for mitigating large bushfires, protecting biodiversity and cultural values, and achieving designated nature conservation outcomes.
Prescribed fire planning and risk management
The Special Inquiry by Mr Mick Keelty AO into the Margaret River bushfire of November 2011 contained 10 recommendations, of which DEC had carriage of eight. The Department of the Premier and Cabinet had carriage of recommendations nine and 10. Of DEC’s eight recommendations, two are completed (recommendations two and six); five are well advanced and progressing steadily towards completion (recommendations one, three, five, seven and eight). One final recommendation (four) is also progressing. During 2012–13, particular attention was given to recommendation two, which advocated a review of risk management practices associated with prescribed burning. The State Emergency Management Committee continues to provide independent oversight of DEC’s implementation of the Special Inquiry’s recommendations.
Through the Bushfire Cooperative Research Centre two consultants were engaged to review DEC’s prescribed-burning processes and practices against the international standard for risk management (ISO 31000). Implementation of the findings of this review and the process of aligning departmental prescribed-burning activities with the standard are ongoing. Key reforms to date include:
• a new corporate policy on prescribed burning, with ISO 31000 risk management a central principle
• the inclusion in all prescribed fire plans of a risk management context statement and a context map showing surrounding fuels, major assets and access and egress, as well as a risk register in which risk assessment, evaluation and treatment processes are clearly documented for scrutiny, decision-making and approval
• the development of a new Prescribed Fire Manual 2013, with training provided to more than 200 staff. As part of the manual an application is being developed and will provide a platform for the preparation of prescribed fire plans to enable the plans to be created, stored and distributed electronically. It is expected to be rolled out during spring 2013.
The Office of Bushfire Risk Management (OBRM) endorsed the spring 2012 and autumn 2013 DEC burn plan programs and DEC continued to provide notifications to OBRM on the day of burn. OBRM also conducted audits of selected DEC burns to ensure compliance with standards.
Interagency Bushfire Management
During 2012–13, significant DEC fire management resources were dedicated to improving interagency bushfire management arrangements through the Interagency Bushfire Management Committee (IBMC) and associated sub-committees.
The sub-committees servicing the IBMC:
• Bushfire Research (chaired by DEC)
• Public Information (chaired by DFES)
• Training (chaired by DFES)
• Fire Operations (chaired by DEC)
• Aerial Fire Suppression (chaired by DFES).

DEPARTMENT OF ENVIRONMENT AND CONSERVATION 2012–13 ANNUAL REPORT44
SUPPORTING OUR DEPARTMENT
Outside the IBMC, DEC initiated and participated in substantial interagency liaison with DFES, local government and other departments on fire-management related matters.
Bushfire inquiries
WorkSafe Accident Investigation
On 12 October 2012, a burn-over during a bushfire in the South Coast Region resulted in the injury and tragic death of DEC firefighter Wendy Bearfoot, who was involved in the fire suppression efforts. The subsequent WorkSafe investigation resulted in nine Improvement Notices being issued to DEC on 25 January 2013, and a further notice on 3 April 2013. Details about these notices and action taken by DEC can be found on page 136 in the occupational safety, health and injury management section of this report.
Fire ecology education programs
Fire Management Services Branch continued to work with Strategic Development and Corporate Affairs (SDCA) Division to provide a fire education program. A total of 9,397 students, teachers and parents took part in fire-related education programs at Perth Hills Discovery Centre, Henderson Centre, Wellington Discovery Forest and Margaret River Eco-Discovery Centre. SDCA continues to update the Fire—a force of life program to meet geography and biology curriculum requirements as changes are introduced.
Detailed educational materials have now been released for the Kimberley fire education program and included in the Kimberley education manual.
Science DivisionThe Science Division is a prime source of new knowledge and information based on scientific research for the department. The work of this division reflected a significant investment by DEC in multi-disciplinary biodiversity conservation research, monitoring, and biogeography. In partnership with internal and external groups, the division strives to understand the composition, patterns and processes of Western Australian marine and terrestrial biota as a basis for its conservation and sustainable use. Science and information have a vital role in underpinning the department’s policies and practices, and an embedded science capacity provides direct alignment of priorities and transfer of knowledge and information into conservation practice.
The division comprises some 150 people based throughout the state, including scientists, technical officers and staff providing administrative support. Many of the division’s scientists are nationally and internationally recognised in their field of expertise, providing a high degree of credibility for the science undertaken. The division publishes two peer-reviewed science journals: Nuytsia and Conservation Science Western Australia.
The division is structured around seven outcome-based research and science application programs: Biogeography, Fauna Conservation, Flora Conservation and Herbarium, Landscape Conservation, Marine Science, Science Applications Unit and Biodiversity and Climate Change Unit.
Building strategic partnerships is vital for addressing Western Australia’s conservation and natural resource management needs. The division supports many PhD students and has more than 100 significant research partnerships with federal and state research institutions, universities, NRM groups, community groups, and the corporate sector, particularly the mining industry. The division is a key partner in the recently established Western Australian Biodiversity Research Institute, which aims to provide a coordinated approach to terrestrial biodiversity knowledge development in Western Australia.
The division publishes an annual report on its research activity that is available on the Department of Parks and Wildlife’s website: www.dpaw.wa.gov.au/about-us/science-and-research.

DEPARTMENT OF ENVIRONMENT AND CONSERVATION 2012–13 ANNUAL REPORT 45
SUPPORTING OUR DEPARTMENT
Office for Information ManagementThe Office for Information Management was responsible for the management of DEC’s information and of its information and communications technology (ICT) services, systems and resources, including risk and security, programs and projects, asset management, and legal compliance.
The office, under the leadership of the Chief Information Officer, coordinated DEC’s information management (IM) and ICT resources and services, including managing projects relating to these services. The office undertook several initiatives during the year to improve DEC’s information management and ICT framework, including:
• implementing an ICT governance framework
• establishing standard-based policies to support information security in line with the Office of the Auditor General’s recommendations
• progressing critical works to maintain business continuity and disaster recovery systems through a risk-management framework
• implementing additional mitigation strategies to target cyber intrusions to minimise DEC’s exposure to cyber threats.
Portfolio and project management
The Portfolio Management Section was established to ensure DEC’s information management and ICT projects were delivered successfully and were in line with DEC’s strategic objectives. As part of the focus for ongoing improvement, the section assessed stakeholder feedback on processes and project management methodology. This input will guide adjustments and ensure the project framework is scalable and meets the needs and capabilities of the department.
Knowledge and information management
Planning for the establishment of a knowledge management section continued. This section will aim to guarantee the confidentiality, integrity and availability of departmental information assets to internal and external stakeholders. Efforts continued through 2012–13 to raise the awareness of records management for sections of the department that create, manage and dispose of records.
Information systems and computer engineering
The work of the department was enabled 24 hours a day, 365 days a year by ICT systems. The IT Operations section managed DEC’s core ICT systems and services. It was also responsible for guiding the development of DEC’s ICT architecture. This included supporting business needs and the operational delivery of emergency services, scientific research, environmental monitoring and regulation, land and marine management, and parks and visitor services.
Major achievements in 2012–13 included:
• completing the program to upgrade regional voice and data communications infrastructure
• implementing a modular framework for an ICT standard operating environment that was scalable to meet DEC’s business needs and allows a level of customisation
• continuing the implementation of an ‘open ICT system’ to provide a collaborative and flexible environment for DEC’s core software and ICT infrastructure
• improving the development methodology for information systems in line with the project management framework.

DEPARTMENT OF ENVIRONMENT AND CONSERVATION 2012–13 ANNUAL REPORT46
Radio and sensor engineering
DEC owned, maintained and managed an extensive radio communications network that provided reliable and flexible communications for fire and other emergency operations as well as day-to-day business activities.
The Radio Communications Section (RCS) was responsible for a broad spectrum of telecommunications equipment, ranging from an extensive statewide land mobile VHF network to complex electronic switching systems including microwave, satellite and fibre optics. RCS coordinated the planning, design, commissioning and monitoring of DEC’s radio communications network and radio frequency management, and provided solutions to terrestrial, aviation and marine challenges. Solutions include automatic weather stations, automatic vehicle location, closed-circuit television, radio-over-internet-protocol and multi-agency interoperability.
The department continued to be involved in the Regional Mobile Communications Project, which will extend mobile phone coverage across remote areas of the state through the commissioning of more than 100 new mobile phone facilities. The project is scheduled to be completed in 2014.
The rollout of the Western Australian Emergency Radio Network (WAERN) project by the Department of Fire and Emergency Services (DFES) is now complete. As a result of its involvement in this high-band migration project, DEC’s radio network was upgraded and new radio infrastructure, such as towers and repeaters, were commissioned across the state. This enhanced radio communications interoperability with DFES, volunteer bushfire brigades, local authorities and other government agencies during emergency incidents and day-to-day operations.
Collaboration continued with Western Australia Police on infrastructure upgrades across the state and the testing of new digital radio technology. This project will further advance compatibility and interoperability with Western Australia Police ‘P25’ radio communication standard.
DEC participated as a stakeholder in the Public Safety Mobile Broadband Steering Committee; a federal government initiative for the development of a new nationally interoperable mobile broadband capability for Australia’s public safety agencies. The department also contributed to the alignment of government radio communications services in the 400 MHz band.
The annual radio communications preventative maintenance program was completed.
Geographic Information ServicesThe Geographic Information Services Branch increased the use of remote sensing technologies to provide monitoring information on various projects, ranging from the condition and extent of mangroves and threatened ecological species to the vegetation cover trends within rangelands, woodlands and forests. Methods were also developed for mapping various habitat extents within marine environments and for the location of historical fire boundaries in the Pilbara.
Ongoing tasks included the annual updating of imagery and derived products, locally and regionally, and the investigation of new and applicable imagery and technologies.
The branch continued to maintain EcoBase as the department’s corporate spatial data repository while providing parallel support for the spatial database used by the environment business systems. The branch also routinely distributed corporate geographic information systems (GIS) datasets to regional GIS software users.
The branch worked with Landgate to investigate how the new Google-based Shared Land Information Platform could be used to meet DEC’s data distribution requirements and other business needs. The branch also completed a collaborative project with Landgate to carry out DEC’s topographic data maintenance directly in the state topographic database hosted at Landgate.
SUPPORTING OUR DEPARTMENT

DEPARTMENT OF ENVIRONMENT AND CONSERVATION 2012–13 ANNUAL REPORT 47
SUPPORTING OUR DEPARTMENT
The branch completed the Midwest Gascoyne Emergency Services Directory during the year and started work on the Great Southern Inland Emergency Services Directory. The emergency services directories use road data that is captured from the department’s Strategic Roads Initiative project and reconciled with the state’s topographic database at Landgate.
Emergency management and field operations were supported with the revision of large-format coordination boards, aerial surveillance maps, Western Shield baiting maps and the Conservation Operations Graphic.
The branch maintained GIS data for a number of corporate datasets, including DEC-managed lands and waters (for which a tenure advisory service is also maintained), and supplied aerial photography and georeferenced versions of the department’s operations maps. During the year there was a significant increase in the number of specialised mapping and GIS data services required for native title negotiations.
The branch, in close collaboration with Forest Management Branch, completed draft maps for publication in the Proposed Forest Management Plan 2014–2023. It also continued to provide GIS support for the establishment of the national reserve system by providing analysis of native vegetation data and a number of GIS datasets. Results from this work were distributed within DEC and more widely via Landgate’s Shared Land Information Platform web portal. The branch also prepared statistical information derived from GIS datasets for each DEC region as part of annual regional snapshot of the department’s operations.
Modifications were made to the customised GIS software tools, including the Fire Incident Mapping tool, to improve usability and performance and to upgrade them to the new version 10.1 of ArcGIS software. Training in the use of the department’s new desktop GIS software (ArcGIS 10.1 and QGIS) was provided, with 121 people attending sessions at metropolitan and regional centres. During the year the branch embarked on a program to roll out QGIS desktop GIS software as a no-cost alternative to the licensed proprietary ArcGIS software. Ongoing products, such as the Environmentally Sensitive Areas and Schedule One datasets, the Regional Snapshot and the Comprehensive Adequate Representative reserve analysis statistics, were delivered and their processing methods further optimised.
Corporate Information Services Corporate Information Services continued to provide recordkeeping services and improve business recordkeeping processes, particularly in regard to electronic document management. Training sessions on the use of Inf0Base, the department’s electronic management system for documents and records, were made available to all staff, with group sessions and one-on-one training as required. The branch also provided records services to other agencies, including the Swan River Trust and the Conservation Commission.
Financial Services BranchThe department’s central Financial Services Branch continued to maintain core financial software and managed accounts payable, accounts receivable, asset records, tax reporting and remote area housing. The branch also managed the department’s light and heavy vehicle fleet and produced a range of statutory and management financial reports. Services were also provided to a number of client agencies.
People Services BranchDEC’s People Services Branch continued to provide client-focused human resource services including employee relations, workforce services, policy delivery, learning and development programs and initiatives, strategic planning, data analysis and reporting, and management of the safety, health and well-being of DEC employees. It also provided human resource services to other agencies on a fee-for-service arrangement.

DEPARTMENT OF ENVIRONMENT AND CONSERVATION 2012–13 ANNUAL REPORT48
DEC-managed lands and watersAt 30 June 2013, the total area under DEC’s care was 28,531,987 hectares, representing a net increase of 246,769 hectares during 2012–13.
The significant increases were 148,000 hectares due to the creation of Eighty Mile Beach Marine Park, 41,623 hectares due to the purchase of Ennuin pastoral lease in the Shire of Yilgarn and 37,973 hectares due to the creation of a section 5(1)(h) reserve in the Shire of Broome.
The terrestrial area managed (i.e. not including marine reserves) is approximately 10.3 per cent of the land area of Western Australia.
The table below provides a summary of all tenure classifications.
Managed lands and waters (ha) by region at 30 June 2013
Tenure Classification Goldfields Kimberley Midwest Pilbara South
CoastSouth West Swan Warren Wheatbelt Total
National park 153,177 1,406,089 568,943 2,432,132 861,417 143,987 117,196 562,459 1,292 6,246,692
Conservation park
183,020 459,942 15,008 149,348 677 13,560 24,388 76 1,559 847,578
Nature reserve 6,299,182 174,653 739,521 251,019 1,568,837 12,967 53,258 87,267 1,057,463 10,244,167
State forest 781 - - - 4,055 542,389 466,509 262,642 28,066 1,304,442
Timber reserve 28,509 - 26,224 - 5,231 26,474 28,501 8,216 - 123,155
Marine park - 866,700 868,860 330,215 - 123,000 16,391 1,446 - 2,206,612
Marine nature reserve
- - 132,000 - - - - - - 132,000
Marine management area
- - - 143,385 - - - - - 143,385
Sections 5(1)(g) & 5(1)(h) reserve
81,566 275,789 2,099 7,810 644 31,203 28,469 1,600 1,445 430,625
Miscellaneous reserve
<1 568,010 508 1,779 3,767 124 6,006 244 15 580,453
Freehold (CALM exec body)
- <1 1,550 <1 91 20,821 50 4,658 <1 27,170
Leasehold (CALM exec body)
- - - - - - - - - 0
Former leasehold
1,846,091 80,748 3,287,128 786,503 - - - - 41,623 6,042,093
Section 33(2) managed land
28,514 90,118 118,632
Sections 8 & 8a managed land
4,851 4,851
Sections 16 & 16a managed land
- 37,941 - - - 121 7,903 40 - 46,005
Freehold land acquired for conservation
- - 10,850 - 6,201 3,483 8,633 1,662 3,298 34,127
Totals 8,620,840 3,869,872 5,742,809 4,107,042 2,450,920 918,129 757,304 930,310 1,134,761 28,531,987
SUPPORTING OUR DEPARTMENT

DEPARTMENT OF ENVIRONMENT AND CONSERVATION 2012–13 ANNUAL REPORT 49
SUPPORTING OUR DEPARTMENT
National parks
The area of the 99 national parks vested in the Conservation Commission of Western Australia at 30 June 2013 was 6,246,692 hectares, a net increase of 17 hectares. There were no significant changes during the year.
Area of national parks vested in the Conservation Commission of Western Australia at 30 June 2013
Name Area (ha) Name Area (ha) Name Area (ha)Alexander Morrison 8,500 Greater Preston 12,665 Porongurup 2,621
Avon Valley 4,366 Greenmount 202Prince Regent National Park
576,400
Badgingarra 13,108 Gull Rock 2,104 Purnululu 239,723
Beelu 4,617 Hassell 1,265 Scott 3,273
Blackwood River 20,477 Helena 12,255 Serpentine 4,387
Boorabbin 28,153 Hilliger 16,962 Shannon 52,598
Boorara-Gardner 11,008 Jane 6,863 Sir James Mitchell 247
Boyndaminup 5,439 John Forrest 2,678 Stirling Range 115,921
Bramley 3,892 Kalamunda 375 Stokes 9,726
Brockman 52 Kalbarri 183,005 Tathra 4,322
Cape Arid 279,446 Karijini 627,442 Torndirrup 3,936
Cape Le Grand 31,801 Karlamilyi 1,283,706 Tuart Forest 2,049
Cape Range 47,655 Kennedy Range 141,660 Tunnel Creek 91
Collier Range 235,162 Korung 6,344 Un-named 1,571
D’Entrecasteaux 118,779 Lake Muir 9,625 Un-named 79
Dalgarup 2,377 Lawley River 17,572 Walpole-Nornalup 19,448
Dirk Hartog Island 62,928Leeuwin-Naturaliste
21,284 Walyunga 1,814
Drovers Cave 2,681 Lesmurdie Falls 56 Wandoo 46,493
Drysdale River 448,264 Lesueur 27,235 Warren 2,981
Easter 2,985 Midgegooroo 2,492 Watheroo 44,481
Eucla 3,560Millstream Chichester
238,167 Waychinicup 3,982
Fitzgerald River 297,244 Milyeannup 18,692 Wellington 17,415
Forest Grove 1,379 Mirima 2,068 West Cape Howe 3,605
Francois Peron 52,587 Mitchell River 115,325 Whicher 6,343
Frank Hann 67,539 Moore River 17,254 William Bay 1,734
Geikie Gorge 3,136 Mount Augustus 9,168 Wiltshire-Butler 11,645
Gloucester 878 Mount Frankland 37,359 Windjana Gorge 2,050
Goldfields Woodlands 64,628Mount Frankland North
22,053Wolfe Creek Meteorite Crater
1,460
Goongarrie 60,397Mount Frankland South
42,283 Yalgorup 13,141
Gooseberry Hill 33 Mount Lindesay 39,541 Yanchep 2,876
Greater Beedelup 19,379 Mount Roe 127,726 Yelverton 729
Greater Dordagup 6,408 Nambung 19,268
Greater Hawke 14,004 Neerabup 944
Greater Kingston 21,092 Peak Charles 39,959 TOTAL 6 246 692
Murujuga National Park is managed as national park under section 8A of the CALM Act with an area of 4851 ha. Names shown in italics are unofficial
DEPARTMENT OF ENVIRONMENT AND CONSERVATION 2012–13 ANNUAL REPORT50
Section 8A
Section 8A was introduced into the Conservation and Land Management Act 1984 (CALM Act) on 8 December 2012.
This section of the CALM Act empowered DEC to enter into agreements to jointly manage land with another party or parties, on land not vested in either the Conservation Commission of Western Australia or the Marine Parks and Reserves Authority, for example, private land, pastoral lease land and other Crown land. A section 8A agreement is managed in accordance with the CALM Act as if the land was State forest, timber reserve, national park, conservation park, nature reserve or managed for a public purpose consistent with that Act.
Murujuga National Park is freehold land owned by the Murujuga Aboriginal Corporation and is jointly managed as a national park under section 8A of the CALM Act by the Murujuga Aboriginal Corporation and the department. Murujuga National Park was proclaimed the 100th national park on 17 January 2013. The area of the national park is 4,851 hectares and is recorded in the section 8A tenure category in the tenure table.
Conservation parks
The area of conservation parks at 30 June 2013 was 847,578 hectares, a net increase of 266 hectares. The majority of the increase was due to a new conservation park being created in the Shire of Coolgardie.
Nature reserves
The area of nature reserves at 30 June 2013 was 10,244,167 hectares, representing a net decrease of 754 hectares. This was due to a resumption of land for mining purposes in the Shire of Leonora.
State forest
The area of State forest at 30 June 2013 was 1,304,442 hectares. There were no changes during the year.
Timber reserves
The area of timber reserves at 30 June 2013 was 123,155 hectares, representing a net decrease of 114 hectares. This was due to a resumption of land for railway purposes in the Shire of Morawa.
Marine reserves
The area of marine parks at 30 June 2013 was approximately 2,206,612 hectares, representing an increase of 148,000 hectares. The increase was due to the creation of Eighty Mile Beach Marine Park on 29 January 2013.
The area of marine nature reserves at 30 June 2013 was approximately 132,000 hectares. There were no changes during the year.
Marine management areas
The area of marine management areas at 30 June 2013 was approximately 143,385 hectares. There were no changes during the year.
SUPPORTING OUR DEPARTMENT

DEPARTMENT OF ENVIRONMENT AND CONSERVATION 2012–13 ANNUAL REPORT 51
SUPPORTING OUR DEPARTMENT
Marine reserves vested in the Marine Parks and Reserves Authority at 30 June 2013
Name Area (ha) approx
Barrow Island Marine Park 4,169
Barrow Island Marine Management Area 116,616
Camden Sound Marine Park 673,000
Eighty Mile Beach Marine Park 148,000
Hamelin Pool Marine Nature Reserve 132,000
Jurien Bay Marine Park 82,376
Marmion Marine Park 9,500
Montebello Islands Marine Park 58,375
Muiron Islands Marine Management Area 26,769
Ngari Capes Marine Park 123,000
Ningaloo Marine Park 263,313
Rowley Shoals Marine Park 87,807
Shark Bay Marine Park 748,735
Shoalwater Islands Marine Park 6,545
Swan Estuary Marine Park 346
Walpole and Nornalup Inlets Marine Park 1446
TOTAL 2,481,997
Area figures are approximate only.
Section 5(1)(g) and 5(1)(h) reserves
The area of CALM Act sections 5(1)(g) and 5(1)(h) reserves at 30 June 2013 was 430,625 hectares. This represents an increase of 38,069 hectares. The major addition was the creation of a section 5(1)(h) reserve in the Shire of Broome for the purpose of conservation, recreation, and traditional and customary use and enjoyment with a total area of 37,973 hectares.
Miscellaneous reserves
The area of miscellaneous reserves at 30 June 2013 was 580,453 hectares. This represents an increase of three hectares.
Other land
The area of freehold land held by the Conservation and Land Management (CALM) Executive Body at 30 June 2013 was 27,170 hectares. This represents an increase of 91 hectares.
The area of former pastoral lease land being held under an interim management arrangement prior to formal reservation is 6,042,093 hectares. This represents an increase of 41,623 hectares due to the purchase of Ennuin pastoral lease.

DEPARTMENT OF ENVIRONMENT AND CONSERVATION 2012–13 ANNUAL REPORT52
The area of Crown land placed under the management of the department under section 33(2) of the CALM Act at 30 June 2013 totalled 118,632 hectares. There were no changes during the year. This land is proposed for addition to the conservation estate, which is managed accordingly under an interim arrangement.
Areas currently managed under section 16A of the CALM Act by agreement between the lessees and the department at 30 June 2013 was 37,941 hectares. There were no changes during the year.
The area of freehold land managed by the department under section 16 of the CALM Act at 30 June 2013 was 8,064 hectares. There were no changes during the year. Most of this land falls within regional parks and is managed by agreement between the Western Australian Planning Commission and the department.
The area of freehold land acquired for addition to the conservation reserve system at 30 June 2013 was 34,127 hectares. This represents a net increase of 14,717 hectares. An audit was conducted during the year which added about 5,559 hectares of freehold land in addition to purchases made during the year. Reservation of these areas is pending on the completion of administrative processes.
Conservation land acquisitions
During the year DEC purchased 13 parcels of land of high conservation value covering a combined total area of about 51,000 hectares for future addition to the formal conservation reserve system. Twelve of the parcels were freehold; one was a pastoral lease.
The department’s priorities for purchases were those areas containing ecosystems not adequately represented in existing conservation reserves, areas containing threatened species and ecological communities, or additions to existing reserves that will greatly improve their diversity or facilitate their management.
The purchases were funded from a number of sources: DEC’s annual capital allocation for acquiring conservation land; proceeds of asset sales; and environmental offset funds (provided from a variety of sources as a result of approved development projects and land clearing). The total expenditure from all funding sources for the financial year was $3.727 million.
Purchases finalised during the year were:
• a 41,623-hectare pastoral lease north of Bullfinch in the Shire of Yilgarn
• a 1,381-hectare property east of Lancelin in the Shire of Gingin
• a 1,267-hectare property north of Gingin in the Shire of Gingin
• a 1,085-hectare property north of Ravensthorpe in the Shire of Ravensthorpe
• a 1,063-hectare property north of Gingin in the Shire of Gingin
• a 1,001-hectare property north-east of Lancelin in the Shire of Dandaragan
• a 931-hectare property north-east of Regans Ford in the Shire of Dandaragan
• a 647-hectare property north of Canna in the City of Greater Geraldton
• a 484-hectare property north-east of Regans Ford in the Shire of Dandaragan
• a 453-hectare property north-east of Albany in the City of Albany
• a 445-hectare property north of Gingin in the Shire of Gingin
• a 279-hectare property north of Gingin in the Shire of Gingin
• a 122-hectare property north-west of Wickepin in the Shire of Cuballing.
SUPPORTING OUR DEPARTMENT
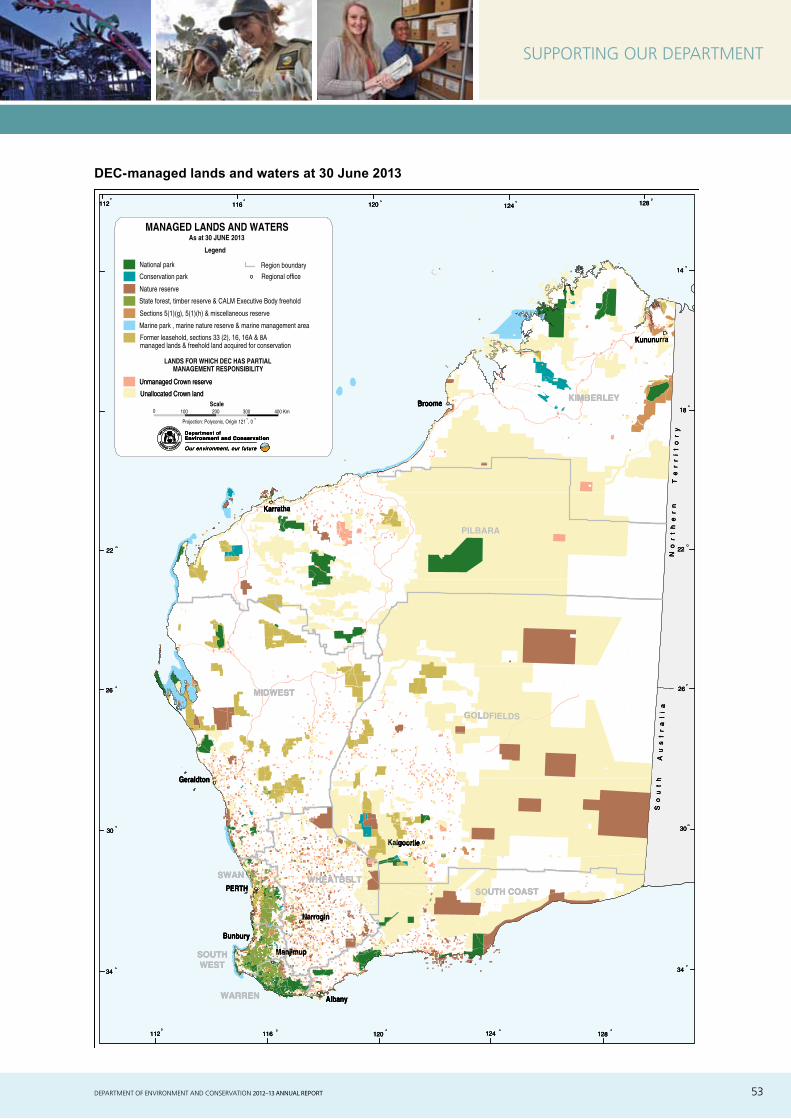
DEPARTMENT OF ENVIRONMENT AND CONSERVATION 2012–13 ANNUAL REPORT 53
SUPPORTING OUR DEPARTMENT
DEC-managed lands and waters at 30 June 2013
Kununurra
Geraldton
PERTH
Bunbury
Albany
Narrogin
Karratha
S o
u t
h
A u
s t
r a
l i
aN
o r
t h
e r
n
T e
r r
i t
o r
y
KIMBERLEY
PILBARA
GOLDFIELDS
SOUTH COASTWHEATBELTSWAN
l
MIDWEST
SOUTHWEST
WARREN
Manjimup
Kalgoorlie
26
30
22
34
112 116 120 124 128
34
30
26
22
18
14
128124120116112
Legend
Scale
As at 30 JUNE 2013MANAGED LANDS AND WATERS
Sections 5(1)(g), 5(1)(h) & miscellaneous reserve
Marine park , marine nature reserve & marine management area
State forest, timber reserve & CALM Executive Body freehold
Nature reserve
Conservation park
National park
0 100 200 300 400 Km
Projection: Polyconic, Origin 121 , 0
Region boundary
Regional office
LANDS FOR WHICH DEC HAS PARTIALMANAGEMENT RESPONSIBILITY
Unallocated Crown land
Unmanaged Crown reserve
Unallocated Crown land
Unmanaged Crown reserve
Broome
Former leasehold, sections 33 (2), 16, 16A & 8Amanaged lands & freehold land acquired for conservation
T
E
TT
Environment and ConservationDepartment ofH
E
GOVERNMNT
OF
WE
SE R RAL
IA
T
E
TT
Environment and ConservationDepartment of
Our environment, our future
HE
GOVERNMNT
OF
WE
SE RN A US RAL
IA
N A US Our environment, our future
Kununurra
Geraldton
PERTH
Bunbury
Albany
Narrogin
Karratha
S o
u t
h
A u
s t
r a
l i
aN
o r
t h
e r
n
T e
r r
i t
o r
y
KIMBERLEY
PILBARA
GOLDFIELDS
SOUTH COASTWHEATBELTSWAN
l
MIDWEST
SOUTHWEST
WARREN
Manjimup
Kalgoorlie
26
30
22
34
112 116 120 124 128
34
30
26
22
18
14
128124120116112
Broome
Kununurra
Geraldton
PERTH
Bunbury
Albany
Narrogin
Karratha
S o
u t
h
A u
s t
r a
l i
aN
o r
t h
e r
n
T e
r r
i t
o r
y
KIMBERLEY
PILBARA
GOLDFIELDS
SOUTH COASTWHEATBELTSWAN
l
MIDWEST
SOUTHWEST
WARREN
Manjimup
Kalgoorlie
26
30
22
34
112 116 120 124 128
34
30
26
22
18
14
128124120116112
Broome
T
E
TT
Environment and ConservationDepartment ofH
E
GOVERNMNT
OF
WE
SE R RAL
IA
T
E
TT
Environment and ConservationDepartment of
Our environment, our future
HE
GOVERNMNT
OF
WE
SE RN A US RAL
IA
N A US Our environment, our future

DEPARTMENT OF ENVIRONMENT AND CONSERVATION 2012–13 ANNUAL REPORT54

DEPARTMENT OF ENVIRONMENT AND CONSERVATION 2012–13 ANNUAL REPORT 55
SIGNIFICANT ISSUES AND TRENDS
Members of the Yawuru/DEC joint management team Yawuru Ranger coordinator Luke Puertollano and Yawuru Ranger Preston Manado in Roebuck Bay on the Kimberley coast. Parts of Roebuck Bay are proposed to become a marine park under the Kimberley Science and Conservation Strategy. Photo: Darren Stevens/DEC
DEPARTMENT OF ENVIRONMENT AND CONSERVATION 2012–13 ANNUAL REPORT56
SIGNIFICANT ISSUES AND TRENDS
SIGNIFICANT ISSUES AND TRENDS
Note: DEC was separated into the Department of Parks and Wildlife (DPaW) and the Department of Environment Regulation (DER) on 1 July 2013. The two new agencies have responsibility for undertaking operations that were previously undertaken by DEC. These are the issues and trends impacting on the operations of DPaW and DER.
• Western Australia has a unique and highly significant biodiversity that faces constant threats and complex challenges including pest animals, weeds, Phytophthora dieback and other plant diseases, salinity, altered fire regimes, habitat loss and climate change. Action to address these threats will continue, with a particular focus on the conservation of threatened species and ecological communities at the landscape scale. It is anticipated that there will be enhanced delivery of nature conservation, parks and forest management actions associated with the clearer focus on these areas by DPaW.
• DPaW will continue to implement the government’s expanded Kimberley Science and Conservation Strategy (KSCS) to provide the largest ever targeted investment in conservation of the Kimberley’s natural assets, the protection of Aboriginal cultural heritage and rock art, and the development of sustainable nature-based tourism.
• New marine reserves will be established under the KSCS at Horizontal Falls and in the North Kimberley, along with an extension to the proposed North Kimberley marine reserve to the Northern Territory border. Once the proposed Kimberley marine conservation reserves are in place, the umbrella Great Kimberley Marine Park will cover about 50 per cent of the Kimberley’s state waters and effectively protect unique and globally significant coral reefs, mangrove systems, mudflats, as well as dolphin, dugong, turtle and whale populations.
• Also under the KSCS, a new Horizontal Falls National Park will be established and a proposed additional national park, which will become one of Australia’s largest national parks, stretching over two million hectares, will be progressed in consultation with native title holders.
• Priority will be given to preparatory work for the proposed new Biodiversity Conservation Act to replace the Wildlife Conservation Act 1950.
• DPaW will continue to strengthen and expand its partnership approach to managing the State’s terrestrial and marine parks and reserves with volunteers, private conservation organisations, Aboriginal communities and the private sector using a new legislative framework. The provision of improved facilities in our parks will continue to be critical for public safety and appreciation of our natural areas.
• DPaW will work with other state agencies in the completion of the strategic assessment of the impact of development on matters of national environmental significance under the Commonwealth Environment Protection and Biodiversity Conservation Act 1999 to improve environmental outcomes and promote more efficient environmental assessment in the Perth metropolitan and Peel regions.
• The government’s new Parks for People initiative, directed at parks in the state’s south-west and mid-west, will expand the number of low-cost camping and caravanning facilities in those regions, promote the state’s world-class parks system, and help people enjoy their parks safely by providing a range of facilities and services. The initiative will provide better facilities for regional communities, boost regional tourism and recreation, and improve access to low-cost caravan and camping opportunities in natural areas.
• DPaW will continue to undertake an active fire management program in an increasingly complex operating environment, exacerbated by drying conditions in the South West of the state. Planning and implementation of prescribed burning has been improved to ensure alignment with the international risk management standard. The adoption of these significant changes to system and process for prescribed burning is progressing steadily.
• The Forest Management Plan 2014-2023 will come into effect from 1 January 2014. The plan proposes a number of new initiatives to be implemented by DPaW.
• In its first year of operation DER will focus on regulatory performance and reform.
• DER will work to finalise the Western Australian Environmental Offsets Register, which is a whole-of-government online record of all environmental offsets imposed by conditions under Western Australian legislation or agreements.

DEPARTMENT OF ENVIRONMENT AND CONSERVATION 2012–13 ANNUAL REPORT 57
DISCLOSURES AND LEGAL COMPLIANCE
Kultarr (Antechinomys laniger), Lorna Glen. Photo: July Dunlop/DEC
DEPARTMENT OF ENVIRONMENT AND CONSERVATION 2012–13 ANNUAL REPORT58
CERTIFICATION
CERTIFICATION
Certification of Financial Statements For the year ended 30 June 2013
The accompanying financial statements of the Department of Environment and Conservation have been prepared in compliance with the provisions of the Financial Management Act 2006 from proper accounts and records to present fairly the financial transactions for the financial year ended 30 June 2013 and the financial position as at 30 June 2013.
At the date of signing we are not aware of any circumstances which would render the particulars included in the financial statements misleading or inaccurate.
John Byrne Jim Sharp Chief Finance Officer Accountable Authority
2 September 2013 2 September 2013

DEPARTMENT OF ENVIRONMENT AND CONSERVATION 2012–13 ANNUAL REPORT 59
AUDITOR GENERAL’S OPINION
AUDITOR GENERAL’S OPINION
Auditor General
Page 1 of 3
7th Floor Albert Facey House 469 Wellington Street Perth MAIL TO: Perth BC PO Box 8489 Perth WA 6849 TEL: 08 6557 7500 FAX: 08 6557 7600
INDEPENDENT AUDITOR’S REPORT
To the Parliament of Western Australia
DEPARTMENT OF ENVIRONMENT AND CONSERVATION
Report on the Financial StatementsI have audited the accounts and financial statements of the Department of Environment and Conservation.
The financial statements comprise the Statement of Financial Position as at 30 June 2013, the Statement of Comprehensive Income, Statement of Changes in Equity, Statement of Cash Flows, Schedule of Income and Expenses by Service, Schedule of Assets and Liabilities by Service, and Summary of Consolidated Account Appropriations and Income Estimates for the year then ended, and Notes comprising a summary of significant accounting policies and other explanatory information, including Administered transactions and balances.
Director General’s Responsibility for the Financial StatementsThe Director General is responsible for keeping proper accounts, and the preparation and fair presentation of the financial statements in accordance with Australian Accounting Standards and the Treasurer’s Instructions, and for such internal control as the Director Generaldetermines is necessary to enable the preparation of financial statements that are free from material misstatement, whether due to fraud or error.
Auditor’s ResponsibilityAs required by the Auditor General Act 2006, my responsibility is to express an opinion on the financial statements based on my audit. The audit was conducted in accordance with Australian Auditing Standards. Those Standards require compliance with relevant ethical requirements relating to audit engagements and that the audit be planned and performed to obtain reasonable assurance about whether the financial statements are free from material misstatement.
An audit involves performing procedures to obtain audit evidence about the amounts and disclosures in the financial statements. The procedures selected depend on the auditor’s judgement, including the assessment of the risks of material misstatement of the financial statements, whether due to fraud or error. In making those risk assessments, the auditor considers internal control relevant to the Department’s preparation and fair presentation of the financial statements in order to design audit procedures that are appropriate in the circumstances. An audit also includes evaluating the appropriateness of the accounting policies used and the reasonableness of accounting estimates made by the Director General, as well as evaluating the overall presentation of the financial statements.
I believe that the audit evidence obtained is sufficient and appropriate to provide a basis for my audit opinion.
OpinionIn my opinion, the financial statements are based on proper accounts and present fairly, in all material respects, the financial position of the Department of Environment and Conservation at 30 June 2013 and its financial performance and cash flows for the year then ended. They are in accordance with Australian Accounting Standards and the Treasurer’s Instructions.

DEPARTMENT OF ENVIRONMENT AND CONSERVATION 2012–13 ANNUAL REPORT60
AUDITOR GENERAL’S OPINION
Page 2 of 3
Report on ControlsI have audited the controls exercised by the Department of Environment and Conservationduring the year ended 30 June 2013.
Controls exercised by the Department of Environment and Conservation are those policies and procedures established by the Director General to ensure that the receipt, expenditure and investment of money, the acquisition and disposal of property, and the incurring of liabilities have been in accordance with legislative provisions.
Director General’s Responsibility for ControlsThe Director General is responsible for maintaining an adequate system of internal control to ensure that the receipt, expenditure and investment of money, the acquisition and disposal of public and other property, and the incurring of liabilities are in accordance with the Financial Management Act 2006 and the Treasurer’s Instructions, and other relevant written law.
Auditor’s ResponsibilityAs required by the Auditor General Act 2006, my responsibility is to express an opinion on the controls exercised by the Department of Environment and Conservation based on my audit conducted in accordance with Australian Auditing and Assurance Standards.
An audit involves performing procedures to obtain audit evidence about the adequacy of controls to ensure that the Department complies with the legislative provisions. The procedures selected depend on the auditor’s judgement and include an evaluation of the design and implementation of relevant controls.
I believe that the audit evidence obtained is sufficient and appropriate to provide a basis for my audit opinion.
OpinionIn my opinion, the controls exercised by the Department of Environment and Conservation are sufficiently adequate to provide reasonable assurance that the receipt, expenditure and investment of money, the acquisition and disposal of property, and the incurring of liabilities have been in accordance with legislative provisions during the year ended 30 June 2013.
Report on the Key Performance IndicatorsI have audited the key performance indicators of the Department of Environment and Conservation for the year ended 30 June 2013.
The key performance indicators are the key effectiveness indicators and the key efficiency indicators that provide information on outcome achievement and service provision.
Director General’s Responsibility for the Key Performance IndicatorsThe Director General is responsible for the preparation and fair presentation of the key performance indicators in accordance with the Financial Management Act 2006 and the Treasurer’s Instructions and for such controls as the Director General determines necessary to ensure that the key performance indicators fairly represent indicated performance.
Auditor’s ResponsibilityAs required by the Auditor General Act 2006, my responsibility is to express an opinion on the key performance indicators based on my audit conducted in accordance with Australian Auditing and Assurance Standards.

DEPARTMENT OF ENVIRONMENT AND CONSERVATION 2012–13 ANNUAL REPORT 61
Page 3 of 3
An audit involves performing procedures to obtain audit evidence about the key performance indicators. The procedures selected depend on the auditor’s judgement, including the assessment of the risks of material misstatement of the key performance indicators. In making these risk assessments the auditor considers internal control relevant to the Director General’s preparation and fair presentation of the key performance indicators in order to design audit procedures that are appropriate in the circumstances. An audit also includes evaluating the relevance and appropriateness of the key performance indicators for measuring the extent of outcome achievement and service provision.
I believe that the audit evidence obtained is sufficient and appropriate to provide a basis for my audit opinion.
OpinionIn my opinion, the key performance indicators of the Department of Environment and Conservation are relevant and appropriate to assist users to assess the Department’s performance and fairly represent indicated performance for the year ended 30 June 2013.
IndependenceIn conducting this audit, I have complied with the independence requirements of the Auditor General Act 2006 and Australian Auditing and Assurance Standards, and other relevant ethical requirements.
Matters Relating to the Electronic Publication of the Audited Financial Statements and Key Performance IndicatorsThis auditor’s report relates to the financial statements and key performance indicators of the Department of Environment and Conservation for the year ended 30 June 2013 included on the Department’s website. The Department’s management is responsible for the integrity of the Department’s website. This audit does not provide assurance on the integrity of the Department’s website. The auditor’s report refers only to the financial statements and key performance indicators described above. It does not provide an opinion on any other information which may have been hyperlinked to/from these financial statements or key performance indicators. If users of the financial statements and key performance indicators are concerned with the inherent risks arising from publication on a website, they are advised to refer to the hard copy of the audited financial statements and key performance indicators to confirm the information contained in this website version of the financial statements and key performance indicators.
COLIN MURPHYAUDITOR GENERALFOR WESTERN AUSTRALIAPerth, Western Australia19 September 2013
AUDITOR GENERAL’S OPINION

DEPARTMENT OF ENVIRONMENT AND CONSERVATION 2012–13 ANNUAL REPORT62
FINANCIAL STATEMENTS
FINANCIAL STATEMENTS
Note 2013 2012$'000 $'000
COST OF SERVICES
ExpensesEmployee benefits expense 6 189,326 174,738Supplies and services 7 92,031 87,943Depreciation expense 8 21,413 22,778Accommodation expenses 9 8,662 8,409Grants and subsidies 10 10,457 9,673Other expenses 11 25,347 31,188Total cost of services 347,236 334,729
Income
RevenueUser charges and fees 12 103,919 98,340Commonwealth grants and contributions 13 2,061 2,811Other grants and contributions 14 31,193 37,077Interest revenue 3,855 4,488Other revenue 16 8,108 10,524Total Revenue 149,136 153,240
GainsGain on disposal of non-current assets 15 39 25Total Gains 39 25
Total income other than income from State Government 149,175 153,265
NET COST OF SERVICES 198,061 181,464
Income from State Government 17Service appropriation 194,208 200,265Assets assumed/(transferred) 720 0Services received free of charge 2,195 20,134Royalties for Regions Fund 2,675 1,616
Total income from State Government 199,798 222,015
SURPLUS FOR THE PERIOD 1,737 40,551
OTHER COMPREHENSIVE INCOMEChanges in asset revaluation surplus (597,032) (207,600)Gains recognised directly in equity - -Total other comprehensive income (597,032) (207,600)
TOTAL COMPREHENSIVE INCOME FOR THE PERIOD (595,295) (167,049)
The Statement of Comprehensive Income should be read in conjunction with the accompanying notes.
See also the 'Schedule of Income and Expenses by Service'.
For the year ended 30 June 2013Statement of Comprehensive Income

63DEPARTMENT OF ENVIRONMENT AND CONSERVATION 2012–13 ANNUAL REPORT 63
FINANCIAL STATEMENTS
Statement of Financial PositionAs at 30 June 2013
Note 2013 2012$'000 $'000
ASSETS
Current AssetsCash and cash equivalents 29 8,242 14,029Restricted cash and cash equivalents 18 & 29 92,884 92,051Inventories 19 1,969 1,888Receivables 20 28,371 24,425Amounts receivable for services 21 8,987 9,062Other current assets 22 2,301 852Total Current Assets 142,754 142,307
Non-Current AssetsRestricted cash and cash equivalents 18 5,067 4,337Amounts receivable for services 21 100,737 89,574Property, plant and equipment 23 3,635,182 4,227,604Total Non-Current Assets 3,740,986 4,321,515
TOTAL ASSETS 3,883,740 4,463,822
LIABILITIES
Current LiabilitiesPayables 25 13,078 11,459Provisions 26 34,811 27,804Other current liabilities 27 5,884 3,572
Total Current liabilities 53,773 42,835
Non-Current LiabilitiesProvisions 26 12,943 16,697Total Non-Current liabilities 12,943 16,697
TOTAL LIABILITIES 66,716 59,532
NET ASSETS 3,817,024 4,404,290
EQUITY 28
Contributed Equity 2,874,086 2,866,057Reserves 853,446 1,450,478Accumulated surplus 89,492 87,755TOTAL EQUITY 3,817,024 4,404,290
See also the 'Schedule of Assets and Liabilities by Service'.
The Statement of Financial Position should be read in conjunction with the accompanying notes.

DEPARTMENT OF ENVIRONMENT AND CONSERVATION 2012–13 ANNUAL REPORT64
FINANCIAL STATEMENTS
Note 28
Contributed Equity Reserves
Accumulated surplus / (deficit ) Total equity
$'000 $'000 $'000 $'000
Balance at 1 July 2011 2,851,025 1,658,078 47,204 4,556,307Changes in accounting policy or correction of prior period errors 0 0 0 0
Restated balance at 1 July 2011 2,851,025 1,658,078 47,204 4,556,307
Surplus/(deficit) 0 0 40,551 40,551
Other comprehensive income 0 (207,600) 0 (207,600)
Total comprehensive income for the period 0 (207,600) 40,551 (167,049)
Transactions with owners in their capacity as owners:
Capital appropriations 14,175 0 0 14,175
Other contributions by owners 1,078 0 0 1,078
Distributions to owners (221) 0 0 (221)
Total 15,032 0 0 15,032
Balance at 30 June 2012 2,866,057 1,450,478 87,755 4,404,290
Balance at 1 July 2012 2,866,057 1,450,478 87,755 4,404,290
Surplus/(deficit) 0 0 1,737 1,737
Other comprehensive income 0 (597,032) (597,032)
Total comprehensive income for the period 0 (597,032) 1,737 (595,295)
Transactions with owners in their capacity as owners:
Capital appropriations 7,079 0 0 7,079
Other contributions by owners 950 0 0 950
Distributions to owners 0 0 0 0
Total 8,029 0 0 8,029
Balance at 30 June 2013 2,874,086 853,446 89,492 3,817,024
The Statement of Changes in Equity should be read in conjunction with the accompanying notes.
Statement of Changes in EquityFor the year ended 30 June 2013

65DEPARTMENT OF ENVIRONMENT AND CONSERVATION 2012–13 ANNUAL REPORT 65
FINANCIAL STATEMENTS
Statement of Cash FlowsFor the year ended 30 June 2013
Note 2013 2012$'000 $'000
CASH FLOWS FROM STATE GOVERNMENTService appropriation 174,058 179,792Capital appropriations 3,371 8,805Holding account drawdowns 9,062 13,569Cash and cash equivalents distributed to owner 0 0Royalties for Regions Fund 6,383 6986
Net cash provided by State Government 192,874 209,152
Utilised as follows:
CASH FLOWS FROM OPERATING ACTIVITIES
PaymentsEmployee benefits (185,494) (177,216)Supplies and services (89,081) (87,580)Accommodation (8,662) (8,354)Grants and subsidies (9,999) (7,481)GST payments on purchases (13,993) (14,212)GST payments to taxation authority 0 (289)Other payments (27,818) (30,302)
ReceiptsUser charges and fees 101,722 94,203Commonweath grants and contributions 1,132 3,104Interest received 4,134 4,618GST receipts on sales 5,719 6,287GST receipts from taxation authority 7,893 8,187Other receipts 41,280 47,327
Net cash provided by/(used) in operating activities 29 (173,167) (161,708)
CASH FLOWS FROM INVESTING ACTIVITIES
PaymentsPurchase of non-current physical assets (24,339) (26,178)
ReceiptsProceeds from sale of non-current physical assets 408 673
Net cash provided by/(used) used in investing activities (23,931) (25,505)
Net increase/(decrease) in cash and cash equivalents (4,224) 21,939
Cash and cash equivalents at the beginning of the period 110,417 88,478
CASH AND CASH EQUIVALENTS AT THE END OF THE PERIOD 29 106,193 110,417
The Statement of Cash Flows should be read in conjunction with the accompanying notes.

DEPARTMENT OF ENVIRONMENT AND CONSERVATION 2012–13 ANNUAL REPORT66
FINANCIAL STATEMENTS
Nat
ure
Con
serv
atio
nSu
stai
nabl
e Fo
rest
M
anag
emen
t
Park
s an
d Vi
sito
r Se
rvic
esEn
viro
nmen
tal
Reg
ulat
ion
Envi
ronm
enta
l Su
stai
nabi
lity
and
Clim
ate
Cha
nge
2013
2012
2013
2012
2013
2012
2013
2012
2013
2012
2013
2012
$'00
0$'
000
$'00
0$'
000
$'00
0$'
000
$'00
0$'
000
$'00
0$'
000
$'00
0$'
000
CO
ST O
F SE
RVI
CES
Expe
nses
Em
ploy
ee b
enef
its e
xpen
se76
,849
69,2
6029
,103
26,3
6148
,026
47,3
9728
,147
24,7
797,
201
6,94
118
9,32
617
4,73
8S
uppl
ies
and
serv
ices
40,9
2537
,886
12,3
8811
,248
28,7
0827
,261
7,43
19,
270
2,57
92,
278
92,0
3187
,943
Dep
reci
atio
n ex
pens
e4,
587
4,17
54,
094
4,87
211
,771
13,0
6481
455
714
711
021
,413
22,7
78A
ccom
mod
atio
n ex
pens
es1,
992
1,78
249
249
51,
477
1,37
43,
865
3,92
683
683
28,
662
8,40
9G
rant
s &
sub
sidi
es2,
411
2,00
00
00
2,28
949
931
17,
547
5,07
310
,457
9,67
3
Oth
er e
xpen
ses
7,93
810
,839
9,66
810
,650
6,13
57,
764
1,41
01,
546
196
389
25,3
4731
,188
Tota
l cos
t of s
ervi
ces
134,
702
125,
942
55,7
4553
,626
96,1
1799
,149
42,1
6640
,389
18,5
0615
,623
347,
236
334,
729
Inco
me
Use
r ch
arge
s an
d fe
es
5,84
06,
273
10,6
159,
373
18,7
5817
,699
24,6
2123
,756
44,0
8541
,239
103,
919
98,3
40
Com
mon
wea
lth g
rant
s an
d co
ntrib
utio
ns1,
727
2,64
50
016
91
165
165
00
2,06
12,
811
Oth
er g
rant
s an
d co
ntrib
utio
ns22
,049
25,1
7625
918
48,
556
10,5
5824
41,
074
8585
31,1
9337
,077
Inte
rest
rev
enue
2,42
42,
834
5126
538
554
163
232
679
842
3,85
54,
488
Oth
er r
even
ue4,
088
3,22
946
73,
324
3,23
03,
639
297
323
269
8,10
810
,524
Gai
n/(lo
ss)
on d
ispo
sal o
f non
-cur
rent
ass
ets
(79)
2516
70
(33)
0(1
6)0
00
3925
Tota
l inc
ome
othe
r tha
n in
com
e fr
om S
tate
Gov
ernm
ent
36,0
4940
,182
11,5
5912
,907
31,2
1832
,451
25,4
7425
,550
44,8
7542
,175
149,
175
153,
265
NET
CO
ST O
F SE
RVI
CES
98,6
5385
,760
44,1
8640
,719
64,8
9966
,698
16,6
9214
,839
(26,
369)
(26,
552)
198,
061
181,
464
Inco
me
from
Sta
te G
over
nmen
tS
ervi
ce a
ppro
pria
tion
101,
385
105,
974
43,0
3041
,057
56,4
1158
,657
15,7
6616
,544
(22,
384)
(21,
967)
194,
208
200,
265
Ass
ets
assu
med
/(tr
ansf
erre
d)19
70
117
040
60
00
00
720
0
Res
ourc
es r
ecei
ved
free
of c
harg
e79
94,
429
381
6,56
970
48,
938
225
146
8652
2,19
520
,134
Roy
altie
s fo
r R
egio
ns F
und
1,26
965
011
121,
286
830
109
124
00
2,67
51,
616
Tota
l inc
ome
from
Sta
te G
over
nmen
t10
3,65
011
1,05
343
,539
47,6
3858
,807
68,4
2516
,100
16,8
14(2
2,29
8)(2
1,91
5)19
9,79
822
2,01
5
SUR
PLU
S/(D
EFIC
IT) f
or th
e pe
riod
4,99
725
,293
(647
)6,
919
(6,0
92)
1,72
7(5
92)
1,97
54,
071
4,63
71,
737
40,5
51
The
Sch
edul
e of
Inco
me
and
Exp
ense
s by
Ser
vice
sho
uld
be r
ead
in c
onju
nctio
n w
ith th
e ac
com
pany
ing
note
s.
Tota
l
Sche
dule
of I
ncom
e an
d Ex
pens
es b
y Se
rvic
eFo
r the
yea
r end
ed 3
0 Ju
ne 2
013
In 2
012-
13 th
e se
rvic
es 'E
nviro
nmen
tal S
usta
inab
ility
and
'Coo
rdin
ate
the
Res
pons
e to
Clim
ate
Cha
nge'
wer
e m
erge
d an
d th
e se
rvic
e is
title
d 'E
nviro
nmen
tal S
usta
inab
ility
and
Clim
ate
Cha
nge'
.

67DEPARTMENT OF ENVIRONMENT AND CONSERVATION 2012–13 ANNUAL REPORT 67
FINANCIAL STATEMENTS
Nat
ure
C
onse
rvat
ion
Sust
aina
ble
Fore
st
Man
agem
ent
Park
s an
d Vi
sito
r Se
rvic
esEn
viro
nmen
tal
Reg
ulat
ion
Envi
ronm
enta
l Su
stai
nabi
lity
and
Clim
ate
Cha
nge
Tota
l
2013
2012
2013
2012
2013
2012
2013
2012
2013
2012
2013
2012
$'00
0$'
000
$'00
0$'
000
$'00
0$'
000
$'00
0$'
000
$'00
0$'
000
$'00
0$'
000
ASS
ETS
Cur
rent
ass
ets
65,2
5669
,278
10,6
2510
,518
36,0
2825
,341
17,2
3117
,566
13,6
1419
,604
142,
754
142,
307
Non
-cur
rent
ass
ets
501,
171
647,
665
2,35
1,16
92,
675,
013
870,
967
979,
597
13,8
5314
,109
3,82
65,
131
3,74
0,98
64,
321,
515
Tota
l ass
ets
566,
427
716,
943
2,36
1,79
42,
685,
531
906,
995
1,00
4,93
831
,084
31,6
7517
,440
24,7
353,
883,
740
4,46
3,82
2
LIA
BIL
ITIE
SC
urre
nt li
abili
ties
17,8
3016
,683
11,7
987,
396
13,0
3012
,148
6,96
65,
078
4,14
91,
530
53,7
7342
,835
Non
-cur
rent
liab
ilitie
s5,
108
7,15
02,
050
2,18
03,
460
5,04
71,
856
1,80
846
951
212
,943
16,6
97To
tal l
iabi
litie
s22
,938
23,8
3313
,848
9,57
616
,490
17,1
958,
822
6,88
64,
618
2,04
266
,716
59,5
32
NET
ASS
ETS
543,
489
693,
110
2,34
7,94
62,
675,
955
890,
505
987,
743
22,2
6224
,789
12,8
2222
,693
3,81
7,02
44,
404,
290
The
Sch
edul
e of
Ass
ets
and
Liab
ilitie
s by
Ser
vice
sho
uld
be r
ead
in c
onju
nctio
n w
ith th
e ac
com
pany
ing
note
s.
Sche
dule
of A
sset
s an
d Li
abili
ties
by S
ervi
ceA
s at
30
June
201
3
In 2
012-
13 th
e se
rvic
es 'E
nviro
nmen
tal S
usta
inab
ility
and
'Coo
rdin
ate
the
Res
pons
e to
Clim
ate
Cha
nge'
wer
e m
erge
d an
d th
e se
rvic
e is
title
d 'E
nviro
nmen
tal S
usta
inab
ility
and
Clim
ate
Cha
nge'
.

DEPARTMENT OF ENVIRONMENT AND CONSERVATION 2012–13 ANNUAL REPORT68
FINANCIAL STATEMENTS
Summary of Consolidated Account Appropriations and Income EstimatesFor the year ended 30 June 2013
2013 2013 2013 2012Estimate Actual Variance Actual Actual Variance
$'000 $'000 $'000 $'000 $'000 $'000
Delivery of Services
Item 100 Net amount appropriated to deliver services 212,098 193,437 (18,661) 193,437 199,517 (6,080)
Royalties for Regions Fund - Regional Community Services Fund 3,678 2,675 (1,003) 2,675 1,616 1,059
Amount Authorised by Other Statutes
- Salaries and Allowances Act 1975 771 771 0 771 748 23
Total appropriations provided to deliver services 216,547 196,883 (19,664) 196,883 201,881 (4,998)
Capital
Item 160 Capital appropriations 3,581 3,371 (210) 3,371 8,805 (5,434)Royalties for Regions Fund - Regional Infrastructure andHeadworks Fund 8,845 3,708 (5,137) 3,708 5,370 (1,662)
Total capital 12,426 7,079 (5,347) 7,079 14,175 (7,096)
GRAND TOTAL 228,973 203,962 (25,011) 203,962 216,056 (12,094)
Details of Expenses by ServiceNature Conservation 148,655 134,702 (13,953) 134,702 125,942 8,760
Sustainable Forest Management 52,248 55,745 3,497 55,745 53,626 2,119
Parks and Visitor Services 88,404 96,117 7,713 96,117 99,149 (3,032)
Environmental Regulation 40,494 42,166 1,672 42,166 40,389 1,777
Environmental Sustainability and Climate Change 29,872 18,506 (11,366) 18,506 15,623 2,883
Total Cost of Services 359,673 347,236 (12,437) 347,236 334,729 12,507
Less Total Income (145,267) (149,175) (3,908) (149,175) (153,265) 4,090
Net Cost of Services 214,406 198,061 (16,345) 198,061 181,464 16,597
Adjustments 2,141 (1,178) (3,319) (1,178) 20,417 (21,595)
Total appropriations provided to deliver services 216,547 196,883 (19,664) 196,883 201,881 (4,998)
Capital Expenditure
Purchase of non-current physical assets 24,716 24,339 (377) 24,339 26,178 (1,839)
Adjustment for other funding sources 12,290 (17,260) (4,970) (17,260) (12,003) (5,257)
Capital appropriations 12,426 7,079 (5,347) 7,079 14,175 (7,096)
Details of Income Estimates
Income disclosed as Administered Income 120 86 (34) 86 94 (8)
120 86 (34) 86 94 8
Adjustments comprise movements in cash balances and other accrual items such as receivables, payables and superannuation.
In 2012-13 the services 'Environmental Sustainability and 'Coordinate the Response to Climate Change' were merged and the service is titled 'Environmental Sustainability and Climate Change'.
Note 34 "Explanatory statement" provides details of any significant variations between estimates and actual results.

69DEPARTMENT OF ENVIRONMENT AND CONSERVATION 2012–13 ANNUAL REPORT 69
FINANCIAL STATEMENTS
Notes to the Financial Statements
1. Australian Accounting StandardsGeneral
The Department of Environment and Conservation (DEC) financial statements for the year ended 30 June 2013 have been prepared in accordance with Australian Accounting Standards. The term ‘Australian Accounting Standards’ includes Standards and Interpretations issued by the Australian Accounting Standards Board (AASB).
DEC has adopted any applicable, new and revised Australian Accounting Standards from their operative dates.
Early adoption of standards
DEC cannot early adopt an Australian Accounting Standard unless specifically permitted by TI 1101 Application of Australian Accounting Standards and Other Pronouncements. There has been no early adoption of Australian Accounting Standards that have been issued or amended (but not operative) by DEC for the annual reporting period ended 30 June 2013.
2. Summary of significant accounting policies (a) General statement
DEC is a not-for-profit reporting entity that prepares general purpose financial statements in accordance with Australian Accounting Standards, the Framework, Statements of Accounting Concepts and other authoritative pronouncements of the AASB as applied by the Treasurer’s Instructions. Several of these are modified by the Treasurer’s Instructions to vary application, disclosure, format and wording.
The Financial Management Act and the Treasurer’s Instructions impose legislative provisions that govern the preparation of financial statements and take precedence over Australian Accounting Standards, the Framework, Statements of Accounting Concepts and other authoritative pronouncements of the AASB.
Where modification is required and has had a material or significant financial effect upon the reported results, details of that modification and the resulting financial effect are disclosed in the notes to the financial statements.
(b) Basis of preparation
The financial statements have been prepared on the accrual basis of accounting using the historical cost convention, except for land and buildings which have been measured at fair value.
The accounting policies adopted in the preparation of the financial statements have been consistently applied throughout all periods presented unless otherwise stated.
The financial statements are presented in Australian dollars and all values are rounded to the nearest thousand dollars ($’000).
Note 3 ‘Judgments made by management in applying accounting policies’ disclosesjudgments that have been made in the process of applying DEC’s accounting policies resulting in the most significant effect on amounts recognised in the financial statements.

DEPARTMENT OF ENVIRONMENT AND CONSERVATION 2012–13 ANNUAL REPORT70
FINANCIAL STATEMENTS
Note 4 ‘Key sources of estimation uncertainty’ discloses key assumptions made concerning the future, and other key sources of estimation uncertainty at the end of the reporting period, that have a significant risk of causing a material adjustment to the carrying amounts of assets and liabilities within the next financial year.
(c) Reporting entity
The reporting entity is the Department of Environment and Conservation.
Mission
Working with the community, we will ensure that Western Australia’s environment is valued, protected and conserved, for its intrinsic value, and for the appreciation and benefit of present and future generations.
DEC is predominantly funded by Parliamentary appropriations supplemented by fees received for the provision of services to the public. The financial statements encompass all funds through which DEC controls resources to carry on its functions.
Services
DEC provides the following services:
Service 1: Nature Conservation
Developing and implementing programs for the conservation of biodiversity (the variety of life forms: the different plants, animals and microorganisms, the genes they contain, and the ecosystems they form), including threatened species and ecological communities, and for sustainable use of commercially exploited species; the acquisition, conservation and protection of representative ecosystems; and encouraging public awareness, understanding and support for nature conservation.
Service 2: Sustainable Forest Management
Providing economic, social and cultural benefits from State forest and timber reserves whileconserving biodiversity, maintaining soil and water values and sustaining the health, vitality and productive capacity of the forest for current and future generations.
Service 3: Parks and Visitor Services
Managing land and waters; dealing with public involvement, visitation and appreciation of the natural environment on lands and waters managed by the department, including preparing and implementing management and recreation site development plans; providing, managing and maintaining appropriate access, recreation opportunities and visitor facilities; protecting natural areas, visitors and facilities from bushfire; training departmental staff and volunteers, working with local tourist bureaux and commercial tour operators; involving Aboriginal people in park management and the provision of visitor facilities and services; providing visitor information and designing and initiating educational and interpretive activity programs which enrich visitor experience and help develop greater community awareness and support for parks, natural areas, astronomy, nature-based tourism and recreation services and policies; undertaking scientific, visitor and social research, including astronomy in cooperation with other research institutions. Provision of services to, and performance of statutory functions by the Conservation Commission of Western Australia and Marine Parks and Reserves Authority.

71DEPARTMENT OF ENVIRONMENT AND CONSERVATION 2012–13 ANNUAL REPORT 71
FINANCIAL STATEMENTS
Service 4: Environmental Regulation
Regulation of emissions and discharges to the environment and the transport of hazardous wastes. Regulation of the investigation, classification and management of contaminated sites. Monitoring of ambient air quality and developing air quality management plans for priority airsheds (the air canopy surrounding population centres, industrial and other facilities, within which the impacts of air pollutants need to be considered from health and environmental viewpoints).
Service 5: Environmental Sustainability and Climate Change
Developing and implementing policies and strategies that promote environmentally sustainable practices in industry, government and the community. Providing leadership in developing and implementing strategies to reduce the impact of climate change for Western Australia.
DEC administers assets, liabilities, income and expenses on behalf of Government which are not controlled by, nor integral to the function of DEC. These administered balances andtransactions are not recognised in the principal financial statements of DEC but schedules are prepared using the same basis as the financial statements and are presented at note 42‘Disclosures of administered income and expenses by service’.
(d) Contributed equity
AASB Interpretation 1038 Contributions by Owners Made to Wholly-Owned Public Sector Entities requires transfers in the nature of equity contributions, other than as a result of a restructure of administrative arrangements, to be designated by the Government (the owner) as contributions by owners (at the time of, or prior to transfer) before such transfers can be recognised as equity contributions. Capital appropriations have been designated as contributions by owners by TI 955 Contributions by Owners made to Wholly Owned Public Sector Entities and have been credited directly to Contributed equity.
Transfer of net assets to/from other agencies, other than as a result of a restructure of administrative arrangements, are designated as contributions by owners where the transfers are non-discretionary and non reciprocal.
(e) Income
Revenue recognition
Revenue is recognised and measured at the fair value of consideration received or receivable. Revenue is recognised for the major business activities as follows:
Sale of goods
Revenue is recognised from the sale of goods and disposal of other assets when the significant risks and rewards of ownership transfer to the purchaser and can be measured reliably.
Provision of services
Revenue is recognised by reference to the stage of completion of the transaction.
Interest
Revenue is recognised as the interest accrues.

DEPARTMENT OF ENVIRONMENT AND CONSERVATION 2012–13 ANNUAL REPORT72
FINANCIAL STATEMENTS
Service appropriations
Service appropriations are recognised as revenues at nominal value in the period in which DEC gains control of the appropriated funds. DEC gains control of appropriated funds at the time those funds are deposited to DEC’s bank account or credited to the ‘Amounts receivable for services’ (holding account) held at Treasury.
Net appropriation determination
The Treasurer may make a determination providing for prescribed receipts to be retained for services under the control of DEC. In accordance with the determination specified in the 2012–2013 Budget Statements, DEC retained $154.467 million in 2013 ($153.265 million in 2012) from the following:
• proceeds from fees and charges• sale of goods• Commonwealth specific purpose grants and contributions• one-off gains derived from the sale of property other than real property• other departmental revenue.
Grants, donations, gifts and other non-reciprocal contributions
Revenue is recognised at fair value when DEC obtains control over the assets comprising the contributions, usually when cash is received.
Other non-reciprocal contributions that are not contributions by owners are recognised at their fair value. Contributions of services are only recognised when a fair value can be reliably determined and the services would be purchased if not donated.
Royalties for Regions funds are recognised as revenue at fair value in the period in which DEC obtains control over the funds. DEC obtains control of the funds at the time the funds are deposited into DEC’s bank account.
Gains
Realised or unrealised gains are usually recognised on a net basis. These include gains arising on the disposal of non-current assets and some revaluations of non-current assets.
(f) Property, plant and equipment
Capitalisation/expensing of assets
Items of property, plant and equipment costing $5,000 or more are recognised as assets and the cost of utilising assets is expensed (depreciated) over their useful lives. Items of property, plant and equipment costing less than $5,000 are immediately expensed direct to the Statement of Comprehensive Income.
Initial recognition and measurement
Property, plant and equipment are initially recognised at cost.
For items of property, plant and equipment acquired at no cost or for nominal cost, the cost is their fair value at the date of acquisition.

73DEPARTMENT OF ENVIRONMENT AND CONSERVATION 2012–13 ANNUAL REPORT 73
FINANCIAL STATEMENTS
Subsequent measurement
Subsequent to initial recognition as an asset, the revaluation model is used for the measurement of land and buildings and historical cost for all other property, plant and equipment. Land and buildings are carried at fair value less accumulated depreciation (buildings only) and accumulated impairment losses. All other items of property, plant and equipment are stated at historical cost less accumulated depreciation and accumulated impairment losses.
Where market-based evidence is available, the fair value of land and buildings is determined on the basis of current market buying values determined by reference to recent market transactions.
In the absence of market-based evidence, fair value of land and buildings is determined on the basis of existing use. This normally applies where buildings are specialised or where land use is restricted. Fair value for existing use assets is determined by reference to the cost of replacing the remaining future economic benefits embodied in the asset, ie. the depreciated replacement cost.
When buildings are revalued, the accumulated depreciation is eliminated against the gross carrying amount of the asset and the net amount restated to the revalued amount.
Land and buildings are independently valued annually by the Western Australian Land Information Authority (Valuation Services) and recognised annually to ensure that the carrying amount does not differ materially from the asset’s fair value at the end of the reporting period.
The most significant assumptions in estimating fair value are made in assessing whether to apply the existing use basis to assets and in determining estimated useful life. Professional judgment by the valuer is required where the evidence does not provide a clear distinction between market type assets and existing use assets.
Derecognition
Upon disposal or derecognition of an item of property, plant and equipment, any revaluation surplus relating to that asset is retained in the asset revaluation surplus.
Asset revaluation surplus
The asset revaluation surplus is used to record increments and decrements on the revaluation of non-current assets as described in note 23 ‘Property, plant and equipment’.
Depreciation
All non-current assets having a limited useful life are systematically depreciated over their estimated useful lives in a manner that reflects the consumption of their future economic benefits.
Depreciation is calculated using the straight-line method, using rates which are reviewed annually. Estimated useful lives for each class of depreciable asset are:
Buildings 20 years Furniture 10 years
Office equipment 6–7 yearsComputer equipment 4 yearsCommunication 5–20 yearsFire protection equipment 3–10 years

DEPARTMENT OF ENVIRONMENT AND CONSERVATION 2012–13 ANNUAL REPORT74
FINANCIAL STATEMENTS
Software (a) 4 yearsAircraft 5–13 yearsBoats 5–12 yearsPlant and machinery 4–20 yearsHeavy fleet vehicles 5–14 yearsParks and visitor facilities 10–33 years
(a) Software that is integral to the operation of related hardware.
Works of art controlled by DEC are classified as property, plant and equipment. These are anticipated to have indefinite useful lives. Their service potential has not, in any material sense, been consumed during the reporting period and consequently no depreciation has been recognised. Land is not depreciated.
(g) Impairment of assets
Property plant and equipment are tested for any indication of impairment at the end of each reporting period. Where there is an indication of impairment, the recoverable amount is estimated. Where the recoverable amount is less than the carrying amount, the asset is considered impaired and is written down to the recoverable amount and an impairment loss is recognised. Where an asset measured at cost is written down to recoverable amount, an impairment loss is recognised in profit or loss. Where a previously revalued asset is written down to recoverable amount, the loss is recognised as a revaluation decrement in other comprehensive income. As DEC is a not-for-profit entity, unless an asset has been identified as a surplus asset, the recoverable amount is the higher of an asset’s fair value less costs to sell and depreciated replacement cost.
The risk of impairment is generally limited to circumstances where an asset’s depreciation is materially understated, where the replacement cost is falling or where there is a significant change in useful life. Each relevant class of assets is reviewed annually to verify that the accumulated depreciation reflects the level of consumption or expiration of the asset’s future economic benefits and to evaluate any impairment risk from falling replacement costs.
The recoverable amount of assets identified as surplus assets is the higher of fair value less costs to sell and the present value of future cash flows expected to be derived from the asset. Surplus assets carried at fair value have no risk of material impairment where fair value is determined by reference to market-based evidence. Where fair value is determined by reference to depreciated replacement cost, surplus assets are at risk of impairment and the recoverable amount is measured. Surplus assets at cost are tested for indications of impairment at the end of each reporting period.
(h) Non-current assets (or disposal groups) classified as held for sale
Non-current assets (or disposal groups) held for sale are recognised at the lower of carryingamount or fair value less costs to sell, and are disclosed separately from other assets in the Statement of Financial Position. Assets classified as held for sale are not depreciated or amortised.
Most Crown land holdings are vested in Conservation Commission of Western Australia by the Government. The Department of Regional Development and Lands (DRDL) is the only agency with the power to sell Crown land. The Conservation Commission of Western Australia transfers Crown land and any attaching buildings to DRDL when the land becomes available for sale.

75DEPARTMENT OF ENVIRONMENT AND CONSERVATION 2012–13 ANNUAL REPORT 75
FINANCIAL STATEMENTS
(i) Leases
DEC holds operating leases for buildings, office equipment and motor vehicles. Lease payments are expensed on a straight-line basis over the lease term as this represents the pattern of benefits derived from the leased assets.
(j) Financial instruments
In addition to cash, DEC has two categories of financial instrument:
• loans and receivables; and
• financial liabilities measured at amortised cost.
Financial instruments have been disaggregated into the following classes:
• Financial Assets
- cash and cash equivalents
- restricted cash and cash equivalents
- receivables
- amounts receivable for services
• Financial Liabilities
- payables
Initial recognition and measurement of financial instruments is at fair value which normally equates to the transaction cost or the face value. Subsequent measurement is at amortised cost using the effective interest method.
The fair value of short-term receivables and payables is the transaction cost or the face value because there is no interest rate applicable and subsequent measurement is not required as the effect of discounting is not material.
(k) Cash and cash equivalents
For the purpose of the Statement of Cash Flows, cash and cash equivalents (and restricted cash and cash equivalent) assets comprise cash on hand and short-term deposits with original maturities of three months or less that are readily convertible to a known amount of cash and which are subject to insignificant risk of changes in value.
(l) Accrued salaries
Accrued salaries (refer to note 25 ‘Payables’) represent the amount due to staff but unpaid at the end of the financial year. Accrued salaries are settled within a fortnight of the financial year end. DEC considers the carrying amount of accrued salaries to be equivalent to its net fair value.
The accrued salaries suspense account (refer to note 18 ‘Restricted cash and cash equivalents’) consists of amounts paid annually into a suspense account over a period of 10 financial years to largely meet the additional cash outflow in each 11th year when 27 pay days occur instead of the normal 26. No interest is received on this account.

DEPARTMENT OF ENVIRONMENT AND CONSERVATION 2012–13 ANNUAL REPORT76
FINANCIAL STATEMENTS
(m) Amounts receivable for services (holding account)
DEC receives funding on an accrual basis. The appropriations are paid partly in cash and partly as an asset (holding account receivable). The accrued amount receivable is accessible on the emergence of the cash funding requirement to cover leave entitlements and asset replacement.
(n) Inventories
Inventories are measured at the lower of cost and net realisable value. Costs are assigned by the method most appropriate for each particular class of inventory, with the majority being measured on a first in first out basis.
Publications held for distribution are measured at cost.
(o) Receivables
Receivables are recognised at original invoice amount less an allowance for uncollectible amounts (i.e. impairment). The collectability of receivables is reviewed on an ongoing basis and any receivables identified as uncollectible are written off against the allowance account. The allowance for uncollectible amounts (doubtful debts) is raised when there is objective evidence that DEC will not be able to collect the debts. The carrying amount is equivalent to fair value as it is due for settlement within 30 days.
(p) Payables
Payables are recognised at the amount payable when DEC becomes obliged to make future payments as a result of a purchase of assets or services. The carrying amount is equivalent to fair value, as settlement is generally within 30 days.
(q) Provisions
Provisions are liabilities of uncertain timing or amount and are recognised where there is a present legal or constructive obligation as a result of a past event and when the outflow of resources embodying economic benefits is probable and a reliable estimate can be made of the amount of the obligation. Provisions are reviewed at the end of each reporting period.
Provisions – employee benefits
All annual leave and long service leave provisions are in respect of employees’ services up to the end of the reporting period.
Annual leave
The liability for annual leave expected to be settled within 12 months after the end of the reporting period is recognised and measured at the undiscounted amounts expected to be paid when the liability is settled.
Annual leave that is not expected to be settled within 12 months after the end of the reporting period is recognised and measured at the present value of amounts expected to be paid when the liabilities are settled using the remuneration rate expected to apply at the time of settlement.
When assessing expected future payments consideration is given to expected future wage and salary levels including non-salary components such as employer superannuation contributions, as well as the experience of employee departures and periods of service. The expected future payments are discounted using market yields at the end of the reporting period on national government bonds with terms to maturity that match, as closely as possible, the estimated future cash outflows.

77DEPARTMENT OF ENVIRONMENT AND CONSERVATION 2012–13 ANNUAL REPORT 77
FINANCIAL STATEMENTS
The provision for annual leave is classified as a current liability as DEC does not have an unconditional right to defer settlement of the liability for at least 12 months after the end of the reporting period.
Long service leave
The liability for long service leave expected to be settled within 12 months after the end of the reporting period is recognised and measured at the undiscounted amounts expected to be paid when the liability is settled.
Long service leave not expected to be settled within 12 months after the end of the reporting period is recognised and measured at the present value of amounts expected to be paid when the liabilities are settled using the remuneration rate expected to apply at the time of settlement.
When assessing expected future payments consideration is given to expected future wage and salary levels including non-salary components such as employer superannuation contributions, as well as the experience of employee departures and periods of service. The expected future payments are discounted using market yields at the end of the reporting period on national government bonds with terms to maturity that match, as closely as possible, the estimated future cash outflows.
Unconditional long service leave provisions are classified as current liabilities as DEC does not have an unconditional right to defer settlement of the liability for at least 12 months after the end of the reporting period. Pre-conditional and conditional long service leave provisions are classified as non-current liabilities because DEC has an unconditional right to defer the settlement of the liability until the employee has completed the requisite years of service.
Superannuation
The Government Employees Superannuation Board (GESB) and other funds administer public sector superannuation arrangements in Western Australia in accordance with legislative requirements. Eligibility criteria for membership in particular schemes for public sector employees varies according to commencement and implementation dates.
Eligible employees contribute to the Pension Scheme, a defined benefit pension scheme closed to new members since 1987, or the Gold State Superannuation Scheme (GSS), a defined benefit lump sum scheme closed to new members since 1995.
The GSS is a defined benefit scheme for the purposes of employees and whole-of-government reporting. However, it is a defined contribution plan for agency purposes because the concurrent contributions (defined contributions) made by the Department to GESB extinguishes the agency’s obligations to the related superannuation liability.
DEC has no liabilities under the Pension Scheme or the GSS. The liabilities for the unfunded Pension Scheme and the unfunded GSS transfer benefits attributable to members who transferred from the Pension Scheme, are assumed by the Treasurer. All other GSS obligations are funded by concurrent contributions made by DEC to GESB.
Employees commencing employment prior to 16 April 2007 who were not members of either the Pension Scheme or the GSS became non-contributory members of the West State Superannuation Scheme (WSS). Employees commencing employment on or after 16 April 2007 became members of the GESB Super Scheme (GESBS). From 30 March 2012, existing members of the WSS or GESBS and new employees became able to choose their preferred superannuation fund. DEC makes concurrent contributions to GESB or other funds on behalf ofemployees in compliance with the Commonwealth Government’s Superannuation Guarantee
DEPARTMENT OF ENVIRONMENT AND CONSERVATION 2012–13 ANNUAL REPORT78
FINANCIAL STATEMENTS
(Administration) Act 1992. Contributions to these accumulation schemes extinguish DEC’s liability for superannuation charges in respect of employees who are not members of the Pension Scheme or GSS.
GESB makes all benefit payments in respect of the Pension Scheme and GSS, and is recouped from the Treasurer for the employer’s share.
Provisions – other
Employment on-costs
Employment on-costs, including workers’ compensation insurance, are not employee benefits and are recognised separately as liabilities and expenses when the employment to which they relate has occurred. Employment on-costs are included as part of ‘Other expenses’ and are not included as part of DEC’s ‘Employee benefits expense’. The related liability is included in ‘Employment on-costs provision’.
(r) Superannuation expense
The superannuation expense in the Statement of Comprehensive Income comprises of employer contributions paid to the GSS (concurrent contributions), the WSS, the GESBS, or other superannuation funds. The employer contribution paid to GESB in respect of the GSS is paid back into the Consolidated Account by GESB.
(s) Assets and services received free of charge or for nominal cost
Assets or services received free of charge or for nominal cost are recognised as income at the fair value of the assets and /or the fair value of those services that can be reliably measured and DEC would otherwise pay for. A corresponding expense is recognised for services received. Receipts of assets are recognised in the Statement of Financial Position.
Assets or services received from other State Government agencies are separately disclosed under Income from State Government in the Statement of Comprehensive Income.
(t) Comparative figures
Comparative figures are, where appropriate, reclassified to be comparable with the figures presented in the current financial year.
3. Judgments made by management in applying accounting policies
The preparation of financial statements requires management to make judgments about the application of accounting policies that have a significant effect on the amounts recognised in the financial statements. DEC evaluates these judgments regularly.
Operating lease commitments
DEC has entered into a number of leases for buildings for branch office accommodation. Some of these leases relate to buildings of a temporary nature and it has been determined that the lessor retains substantially all the risks and rewards incidental to ownership. Accordingly, these leases have been classified as operating leases.
79DEPARTMENT OF ENVIRONMENT AND CONSERVATION 2012–13 ANNUAL REPORT 79
FINANCIAL STATEMENTS
4. Key sources of estimation uncertainty
Key estimates and assumptions concerning the future are based on historical experience and various other factors that have a significant risk of causing a material adjustment to the carrying amount of assets and liabilities within the next financial year.
Long Service Leave
Several estimations and assumptions used in calculating DEC’s long service leaveprovision include expected future salary rates, discount rates, employee retention rates and expected future payments. Changes in these estimations and assumptions may impact on the carrying amount of the long service leave provision.
5. Disclosure of changes in accounting policy and estimates
Initial application of an Australian Accounting Standard
DEC has applied the following Australian Accounting Standards effective for annual reporting periods beginning on or after 1 July 2012 that impacted on DEC.
AASB 2011-9 Amendments to Australian Accounting Standards Presentation of Items of Other Comprehensive Income [AASB 1, 5, 7, 101, 112, 120,121, 132, 133, 134,1039 & 1049]
This Standard requires DEC to group items presented in other comprehensive income on the basis of whether they are potentially reclassifiable to profit or loss subsequently (reclassification adjustments). There is no financial impact.
Future impact of Australian Accounting Standards not yet operative
DEC cannot early adopt an Australian Accounting Standard unless specifically permitted by TI 1101 Application of Australian Accounting Standards and Other Pronouncements.Consequently, DEC has not applied early any of the following Australian Accounting Standards that have been issued that may impact DEC. Where applicable, DEC plans to apply these Australian Accounting Standards from their application date.
Operativefor reporting periods beginning on/after
AASB 9 Financial Instruments
This Standard supersedes AASB 139 : Recognition and Measurement, introducing a number of changes to accounting treatments.
AASB 2012-6 Amendments to Australian Accounting Standards – Mandatory Effective Date of AASB 9 and Transition Disclosures amended the mandatory application date of this Standard to 1 January 2015. DEC has not yet determined the application or the potential impact of theStandard.
1 Jan 2015
DEPARTMENT OF ENVIRONMENT AND CONSERVATION 2012–13 ANNUAL REPORT80
FINANCIAL STATEMENTS
AASB 10 Consolidated Financial Statements
This Standard supersedes AASB 127Consolidated and Separate Financial Statements and Int 112 Consolidation –Special Purpose Entities, introducing a number of changes to accounting treatments.
Mandatory application of this Standard was deferred by one year for not-for-profit entities by AASB 2012-10 Amendments to Australian Accounting Standards –Transition Guidance and Other Amendments. DEC has not yet determined the application or the potential impact of the Standard.
1 Jan 2014
AASB 11 Joint Arrangements
This Standard supersedes AASB 131 Interests in Joint Ventures, introducing a number of changes to accounting treatments.
Mandatory application of this Standard was deferred by one year for not-for-profit entities by AASB 2012-10. DEC has not yet determined the application or the potential impact of the Standard.
1 Jan 2014
AASB 12 Disclosure of Interests in Other Entities
This Standard supersedes disclosure requirements under AASB 127 Consolidated and Separate Financial Statements and AASB 131 Interests in Joint Ventures.
Mandatory application of this Standard was deferred by one year for not-for –profit entities by AASB 2012-10. DEC has not yet determined the application or the potential impact of the Standard.
1 Jan 2014
AASB 13 Fair Value Measurement
This Standard defines fair value, sets out a framework for measuring fair value and requires disclosures about fair value measurements. There is no financial impact.
1 Jan 2013
AASB 119 Employee Benefits
This Standard supersedes AASB 119 (October 2010), making changes to the recognition, presentation and disclosure requirements.
DEC does not have any defined benefit plans, and therefore the financial impact will be limited to the effect of discounting annual leave and long service leave liabilities that were previously measured at the undiscounted amounts.
1 Jan 2013

81DEPARTMENT OF ENVIRONMENT AND CONSERVATION 2012–13 ANNUAL REPORT 81
FINANCIAL STATEMENTS
AASB 127 Separate Financial Statements
This Standard supersedes requirements under AASB 127 Consolidated and Separate Financial Statements,introducing a number of changes to accounting treatments.
Mandatory application of this Standard was deferred by one year for not-for-profit entities by AASB 2012-10. DEC has not yet determined the application or the potential impact of the Standard.
1 Jan 2014
AASB 128 Investments in Associates and Joint Ventures
This Standard supersedes AASB 128 Investments inAssociates, introducing a number of changes to accounting treatments.
Mandatory application of this Standard was deferred by one year for not-for-profit entities by AASB 2012-10. DEC has not yet determined the application or the potential impact of the Standard.
1 Jan 2014
AASB 1053 Application of Tiers of Australian Accounting Standards
This Standard establishes a differential financial reporting framework consisting of two tiers of reporting requirements for preparing general purpose financial statements. There is no financial impact.
1 Jul 2013
AASB 1055
AASB2010-2
Budgetary ReportingThis Standard specifies the nature of budgetary disclosures, the circumstances in which they are to be included in the general purpose financial statements of not-for-profit entities within the GGS. DEC will be required to disclose additional budgetary information and explanations of major variances between actual and budgeted amounts, though there is no financial impact.
Amendments to Australian Accounting Standards arisingfrom Reduced Disclosure Requirements [AASB 1, 2, 3, 5,7, 8, 101, 102, 107, 108, 110, 111, 112, 116, 117, 119, 121, 123, 124, 127, 128, 131,133, 134, 136, 137, 138, 140,141, 1050 & 1052 and Int 2, 4, 5, 15, 17, 127, 129 & 1052]
This Standard makes amendments to AustralianAccounting Standards and Interpretations to introduce reduced disclosure requirements for certain types of entities. There is no financial impact.
1 Jul 2014
1 Jul 2013

DEPARTMENT OF ENVIRONMENT AND CONSERVATION 2012–13 ANNUAL REPORT82
FINANCIAL STATEMENTS
AASB 2010-7
Amendments to Australian Accounting Standards arisingfrom AASB 9 (December 2010) [AASB 1, 3, 4, 5, 7, 101, 102, 108, 112, 118, 120, 121, 127, 128, 131, 132, 136, 137, 139, 1023 & 1038 and Int 2, 5, 10, 12, 19 & 127]
This Standard makes consequential amendments to other Australian Accounting Standards and Interpretations as aresult of issuing AASB 9 in December 2010.
AASB 2012-6 amended the mandatory application date of this Standard to 1 January 2015. DEC has not yet determined the application or the potential impact of the Standard.
1 Jan 2015
AASB 2011-2
Amendments to Australian Accounting Standards arising from the Trans-Tasman Convergence Project – Reduced Disclosure Requirements [AASB 101 & 1054]
This Standard removes disclosure requirements from other Standards and incorporates them in a single Standard to achieve convergence between Australian and New Zealand Accounting Standards for reduced disclosure reporting. There is no financial impact.
1 Jul 2013
AASB 2011-6
Amendments to Australian Accounting Standards –Extending Relief from Consolidation, the Equity Method and Proportionate Consolidation – Reduced Disclosure Requirements [AASB 127, 128 & 131]
This Standard extends the relief from consolidation, the equity method and proportionate consolidation by removing the requirement for the consolidated financial statements prepared by the ultimate or any intermediate parent entity to be IFRS compliant, provided that the parent entity, investor or venturer and the ultimate or intermediate parent entity comply with Australian Accounting Standards or Australian Accounting Standards – Reduced Disclosure Requirements. There is no financial impact.
1 Jul 2013
AASB2011-7
Amendments to Australian Accounting Standards arising from the Consolidation and Joint Arrangements Standards[AASB 1, 2, 3, 5, 7, 9, 2009-11, 101, 107, 112, 118, 121,
124, 132, 133, 136, 138, 139, 1023 & 1038 and Int 5, 9, 16& 17]
This Standard gives effect to consequential changes arising from the issuance of AASB 10, AASB 11, AASB 127 Separate Financial Statements and AASB 128 Investments in Associates and Joint Ventures. For not-for-profit entities it applies to annual reporting periods beginning on or after 1 January 2014. DEC has not yet determined the application or the potential impact of the Standard.
1 Jan 2013
83DEPARTMENT OF ENVIRONMENT AND CONSERVATION 2012–13 ANNUAL REPORT 83
FINANCIAL STATEMENTS
AASB 2011-8
Amendments to Australian Accounting Standards arising from AASB 13 [AASB 1, 2, 3, 4, 5, 7, 9, 2009-11, 2010-7,101, 102, 108, 110, 116, 117, 118, 119, 120, 121, 128, 131, 132, 133, 134, 136, 138, 139, 140, 141, 1004, 1023& 1038 and Int 2, 4, 12, 13, 14, 17, 19, 131 & 132]
This Standard replaces the existing definition and fair value guidance in other Australian Accounting Standardsand Interpretations as the result of issuing AASB 13 in September 2011. There is no financial impact.
1 Jan 2013
AASB2011-10
Amendments to Australian Accounting Standards arising from AASB 119 (September 2011) [AASB 1, 8, 101, 124,134, 1049 & 2011-8 and Int 14]
This Standard makes amendments to other Australian Accounting Standards and Interpretations as a result of issuing AASB 119 Employee Benefits in September 2011. DEC has not yet determined the application or the potential impact of the Standard.
1 Jan 2013
AASB 2011-11
Amendments to AASB 119 (September 2011) arising from Reduced Disclosure Requirements
This Standard gives effect to Australian Accounting Standards – Reduced Disclosure Requirements for AASB 119 (September 2011). There is no financial impact.
1 Jul 2013
AASB 2012-1
Amendments to Australian Accounting Standards – Fair Value Measurement – Reduced Disclosure Requirements [AASB 3, 7, 13, 140 & 141]
This Standard establishes and amends reduced disclosure requirements for additional and amended disclosures arising from AASB 13 and the consequential amendments implemented through AASB 2011-8. There is no financial impact.
1 Jul 2013
AASB 2012-2
Amendments to Australian Accounting Standards –Disclosures – Offsetting Financial Assets and Financial Liabilities [AASB 7 & 132]
This Standard amends the required disclosures in AASB 7 to include information that will enable users of an entity’s financial statements to evaluate the effect or potential effect of netting arrangements, including rights of set-off associated with the entity’s recognised financial assets and recognised financial liabilities, on the entity’s financial position. There is no financial impact.
1 Jan 2013

DEPARTMENT OF ENVIRONMENT AND CONSERVATION 2012–13 ANNUAL REPORT84
FINANCIAL STATEMENTS
AASB 2012-3
Amendments to Australian Accounting Standards –Offsetting Financial Assets and Financial Liabilities [AASB 132]
This Standard adds application guidance to AASB 132 to address inconsistencies identified in applying some of the offsetting criteria, including clarifying the meaning of “currently has a legally enforceable right of set-off” and that some gross settlement systems may be considered equivalent to net settlement. There is no financial impact.
1 Jan 2014
AASB 2012-5
Amendments to Australian Accounting Standards arising from Annual Improvements 2009-11 Cycle [AASB 1, 101, 116, 132 & 134 and Int 2]
This Standard makes amendments to the Australian Accounting Standards and Interpretations as a consequence of the annual improvements process. There is no financial impact.
1 Jan 2013
AASB 2012-6
Amendments to Australian Accounting Standards –Mandatory Effective Date of AASB 9 and Transition Disclosures [AASB 9, 2009-11, 2010-7, 2011-7 & 2011-8]
This Standard amends the mandatory effective date of AASB 9 Financial Instruments to 1 January 2015. Further amendments are also made to consequential amendments arising from AASB 9 that will now apply from 1 January 2015 and to consequential amendments arising out of the Standards that will still apply from 1 January 2013. There is no financial impact.
1 Jan 2013
AASB 2012-7
Amendments to Australian Accounting Standards arising from Reduced Disclosure Requirements [AASB 7, 12, 101 & 127]
This Standard adds to or amends the Australian Accounting Standards to provide further information regarding the differential reporting framework and the two tiers of reporting requirements for preparing general financial statement. There is no financial impact.
1 Jul 2013

85DEPARTMENT OF ENVIRONMENT AND CONSERVATION 2012–13 ANNUAL REPORT 85
FINANCIAL STATEMENTS
AASB 2012-10
Amendments to Australian Accounting Standards –Transition Guidance and Other Amendments [AASB 1, 5, 7, 8, 10, 11, 12, 13, 101, 102, 108, 112, 118, 119, 127, 128, 132, 133, 134, 137, 1023, 1038, 1039, 1049, & 2011-7 and Int 12]
This Standard makes amendments to AASB 10 and related Standards to revise the transition guidance relevant to the initial application of those Standards, and to clarify the circumstances in which adjustments to an entity’s previous accounting for its involvement with other entities are required and the timing of such adjustments.
The Standard was issued in December 2012. DEC has not yet determined the application or the potential impact of the Standard.
1 Jan 2013
AASB 2012-11
Amendments to Australian Accounting Standards –Reduced Disclosure Requirements and Other Amendments [AASB 1, 2, 8, 10, 107, 128, 133, 134 & 2011-4]
This Standard makes various editorial corrections to Australian Accounting Standards – Reduced DisclosureRequirements (Tier 2). These corrections ensure that the Standards reflect decisions of the AASB regarding the Tier 2 requirements.
This Standard also extends the relief from consolidation and the equity method (in the new Consolidation and Joint Arrangements Standards) to entities complying with Australian Accounting Standards – Reduced Disclosure Requirements. There is no financial impact.
1 Jul 2013
Changes in accounting estimates
From 1 July 2012 DEC extended the estimated useful lives for aircraft, boats and vehicles which equates to depreciation being $2.16 million lower in 2013.

DEPARTMENT OF ENVIRONMENT AND CONSERVATION 2012–13 ANNUAL REPORT86
FINANCIAL STATEMENTS
2013$’000
2012$’000
6. Employee benefits expense
Wages and salaries (a) 173,424 159,689
Superannuation – defined contribution plans (b) 15,902 15,049
189,326 174,738
(a) Includes the value of the fringe benefit to the employee plus the fringe benefits tax component and leave entitlements including superannuation contribution component.
(b) Defined contribution plans include West State, Gold State and GESB Super Scheme (contribution paid).
Employment on-costs such as workers’ compensation insurance are included at note 11‘Other expenses’.
The employment on-costs liability is included at note 26 ‘Provisions’.
7. Supplies and services
Communications 4,698 4,803
Consultants and contractors 13,625 8,797
Services and contracts 36,027 36,020
Materials 16,826 16,403
Repairs and maintenance 5,040 4,970
Travel 4,971 5,902
Regional employee housing 4,794 5,232
Other 6,050 5,816
92,031 87,943
8. Depreciation expense
Depreciation
Plant, equipment and vehicles 14,041 15,836
Buildings 7,372 6,942
Total depreciation 21,413 22,778
9. Accommodation expenses
Lease rentals 6,201 6,330
Electricity, power and water 2,461 2,079
8,662 8,409

87DEPARTMENT OF ENVIRONMENT AND CONSERVATION 2012–13 ANNUAL REPORT 87
FINANCIAL STATEMENTS
2013$’000
2012$’000
10. Grants and subsidies
Recurrent
Western Australian Local Government Association 2,076 1,460
Carnegie Wave Energy 1,620 145
Keep Australia Beautiful Council (WA) 904 1,044
Australian Wildlife Conservancy 468 0
Kimberley Toad Busters 300 162
Shire of Northam 274 0
City of Kalgoorlie-Boulder 257 48
Bunbury Harvey Regional Council 220 0
City of Bunbury 186 5
Richgro Garden Products 170 0
Southern Metropolitan Regional Council 167 0
Curtin University of Technology 152 0
Department of Regional Development and Lands 150 0
Aurora Algae Pty Ltd 135 14
Paraquad Industries 100 0
Motor Trade Association of WA 94 92
University of WA 90 0
Waste Management Association of Australia 89 136
Garage Sale Trail Foundation Ltd 85 0
Eastern Metropolitan Regional Council 75 67
Printing Industries Association 73 74
Cleanaway 70 173
City of Armadale 64 106
Western Metropolitan Regional Council 58 0
Midwest Regional Council 55 0
City of Stirling 54 0
Mindarie Regional Council 51 0
Conservation Council of WA Inc 45 215
City of Canning 40 2,129
Sercul 27 69
Munda Biddi Trail Foundation 17 150
Colmax Glass 0 585
Future Farm Industries Co-operative Research Centre 0 350
Landcorp 0 295
Department of the Premier and Cabinet 0 250
Various grants under $50,000 2,291 2,104
10,457 9,673

DEPARTMENT OF ENVIRONMENT AND CONSERVATION 2012–13 ANNUAL REPORT88
FINANCIAL STATEMENTS
2013$’000
2012$’000
11. Other expenses
Employment on-costs (a) 1,481 1,999
Operating lease – motor vehicle 10,985 12,051
Other lease, rental and hire expenses 12,881 17,138
25,347 31,188
(a) Includes workers’ compensation insurance and other employment on-costs. The on-costs liability associated with the recognition of annual and long service leave liability is included at note 26 ‘Provisions’. Superannuation contributions accrued as part of the provision for leave are employee benefits and are not included in employment on-costs.
12. User charges and fees
User charges 14,624 14,379
Fees 23,500 22,380
Landfill levy revenue 43,566 40,418
Emission and discharge licences 18,394 17,572
Waste control permits 3,835 3,591
103,919 98,340
13. Commonwealth grants and contributions
Recurrent 2,061 2,811
2,061 2,811
14. Other grants and contributions
Capital 2,389 9,428
Recurrent 28,804 27,649
31,193 37,077
15. Net gain/(loss) on disposal of non-current assets
Proceeds from Disposal of Non-Current Assets
Plant, property, equipment & vehicles 408 754
Costs of Disposal of Non-Current Assets
Plant, property, equipment & vehicles (369) (729)
Net gain/(loss) 39 25

89DEPARTMENT OF ENVIRONMENT AND CONSERVATION 2012–13 ANNUAL REPORT 89
FINANCIAL STATEMENTS
2013$’000
2012$’000
16. Other revenue
Publications revenue 394 426
Mining compensation revenue 1,869 6,301
Other revenues 5,845 3,797
8,108 10,524
17. Income from State Government
Appropriation received during the period: 194,208 200,265
194,208 200,265
Assets found during the period:
Buildings 380 0
Property, plant and equipment 340 0
Total assets found 720 0
Services received free of charge from other State government agencies during the period:- Water Corporation 0 18,562- Landgate 681 402
- State Solicitor’s Office 861 587
- Keep Australia Beautiful Council 206 0
- Department of Water 3 3
- Mainroads 1 0
- Department of Finance 311 291
- Department of Corrective Services 88 242
- Department of Agriculture and Food 44 47
2,195 20,134
Royalties for Regions Fund:
- Regional Community Services Account (c) 2,675 1,616
2,675 1,616
199,798 222,015
(a) Service appropriation fund the net cost of services delivered. Appropriation revenue comprises a cash component and a receivable (asset). The receivable (holding account) comprises the depreciation expense for the year and any agreed increase in leave liability during the year.

DEPARTMENT OF ENVIRONMENT AND CONSERVATION 2012–13 ANNUAL REPORT90
FINANCIAL STATEMENTS
(b) Discretionary transfers of assets (including grants) and liabilities between State Government agencies are reported under Income from State Government. Transfers of assets and liabilities in relation to a restructure of administrative arrangements are recognised as distribution to owners by the transferor and contribution by owners by the transferee under AASB 1004 in respect of net assets transferred. Other non-discretionary non- reciprocal transfers of assets and liabilities designated as contributions by owners under TI 955 are also recognised directly to equity.
(c) This is a sub-fund within the over-arching ‘Royalties for Regions Fund’. The recurrent funds are committed to projects and programs in WA regional areas.
2013$’000
2012$’000
18. Restricted cash and cash equivalents
Current
Cash amounts in suspense account (a) 92,884 92,051
92,884 92,051
Non Current
Accrued salaries suspense account (b) 5,067 4,337
5,067 4,337
(a) Cash held in the account is to fund the four special purpose accounts disclosed at note 39 ‘Special Purpose Accounts' and a range of specific purpose accounts.
(b) Amount held in the suspense account is only to be used for the purpose of meeting the 27th pay in a financial year that occurs every 11 years.
19. Inventories
Current
Inventories held for resale:
Souvenirs 506 504
Inventories held for distribution:
Publications 1,463 1,384
1,969 1,888
20. Receivables
Current
Receivables 15,940 12,142
Allowance for impairment of receivables (397) (307)
GST receivable 1,516 1,499
Accrued revenue 11,312 11,091
28,371 24,425

91DEPARTMENT OF ENVIRONMENT AND CONSERVATION 2012–13 ANNUAL REPORT 91
FINANCIAL STATEMENTS
2013$’000
2012$’000
Reconciliation of changes in the allowance for impairment of receivables:
Balance at start of year 307 324
Doubtful debts expense 106 3
Amounts written of during the year (16) (20)
Amounts recovered during the year 0 0
Balance at end of year 397 307
DEC does not hold any collateral or other credit enhancements as security for receivables.
21. Amounts receivable for services (Holding Account)
Current 8,987 9,062
Non-current 100,737 89,574
109,724 98,636
Represents the non-cash component of service appropriations. It is restricted in that it can only be used for asset replacement or payment of leave liability.
22. Other assets
Current
Prepayments 2,301 852
2,301 852
23. Property, plant and equipment
Land
At fair value (a) 3,394,640 4,002,101
3,394,640 4,002,101
Buildings
At fair value (a) 120,045 108,647
120,045 108,647
Plant and equipment
At cost 163,716 149,512
Accumulated depreciation (76,088) (64,091)
87,628 85,421
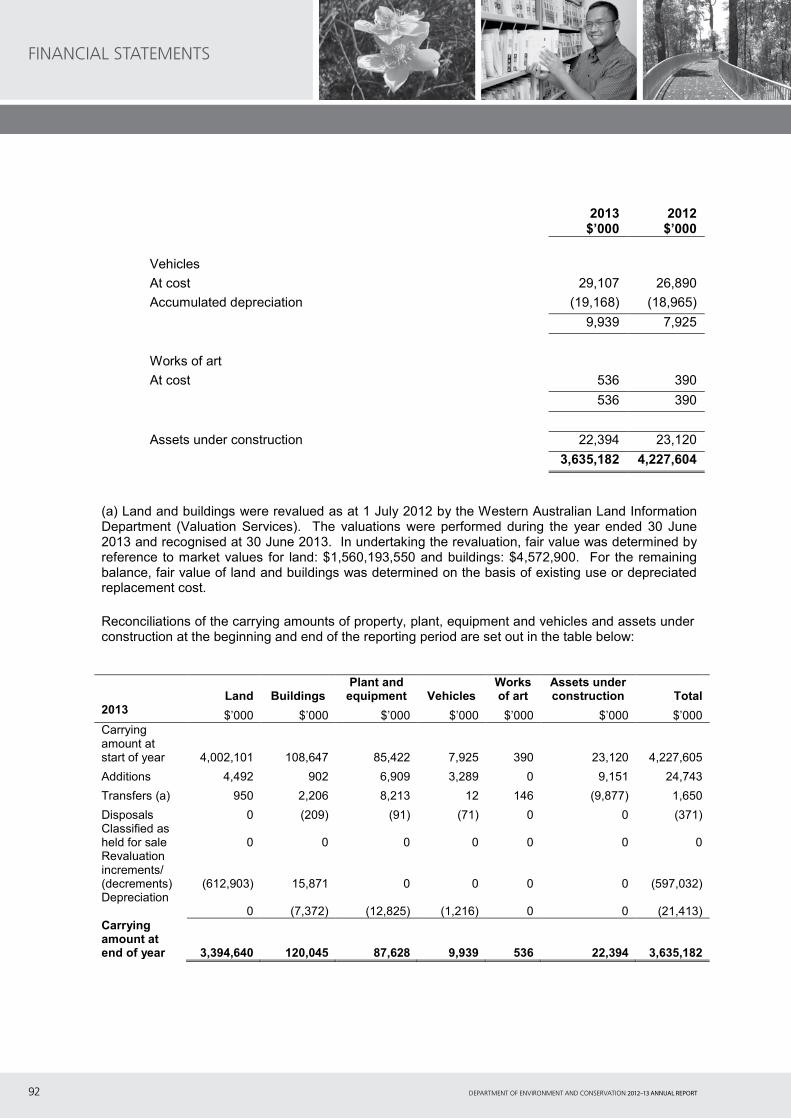
DEPARTMENT OF ENVIRONMENT AND CONSERVATION 2012–13 ANNUAL REPORT92
FINANCIAL STATEMENTS
2013$’000
2012$’000
Vehicles
At cost 29,107 26,890
Accumulated depreciation (19,168) (18,965)
9,939 7,925
Works of art
At cost 536 390
536 390
Assets under construction 22,394 23,120
3,635,182 4,227,604
(a) Land and buildings were revalued as at 1 July 2012 by the Western Australian Land Information Department (Valuation Services). The valuations were performed during the year ended 30 June 2013 and recognised at 30 June 2013. In undertaking the revaluation, fair value was determined by reference to market values for land: $1,560,193,550 and buildings: $4,572,900. For the remaining balance, fair value of land and buildings was determined on the basis of existing use or depreciated replacement cost.
Reconciliations of the carrying amounts of property, plant, equipment and vehicles and assets under construction at the beginning and end of the reporting period are set out in the table below:
Land BuildingsPlant and
equipment VehiclesWorks of art
Assets under construction Total
2013 $’000 $’000 $’000 $’000 $’000 $’000 $’000Carrying amount at start of year 4,002,101 108,647 85,422 7,925 390 23,120 4,227,605
Additions 4,492 902 6,909 3,289 0 9,151 24,743
Transfers (a) 950 2,206 8,213 12 146 (9,877) 1,650
Disposals 0 (209) (91) (71) 0 0 (371)Classified as held for sale 0 0 0 0 0 0 0Revaluation increments/ (decrements) (612,903) 15,871 0 0 0 0 (597,032)Depreciation
0 (7,372) (12,825) (1,216) 0 0 (21,413)Carrying amount at end of year 3,394,640 120,045 87,628 9,939 536 22,394 3,635,182

93DEPARTMENT OF ENVIRONMENT AND CONSERVATION 2012–13 ANNUAL REPORT 93
FINANCIAL STATEMENTS
Land BuildingsPlant and
equipment VehiclesWorks of art
Assets under construction Total
2012 $’000 $’000 $’000 $’000 $’000 $’000 $’000Carrying amount at start of year 4,206,382 98,153 86,321 7,747 388 16,390 4,415,381
Additions 3,442 402 6,640 3,511 2 12,190 26,187
Transfers (a) 1,078 18,562 5,254 3 0 (5,460) 19,437
Disposals (193) (2,536) (261) (33) 0 0 (3,023)Classified as held for sale 0 0 0 0 0 0 0Revaluation increments/ (decrements) (208,608) 1,008 0 0 0 0 (207,600)Depreciation
0 (6,942) (12,533) (3,303) 0 0 (22,778)Carrying amount at end of year 4,002,101 108,647 85,421 7,925 390 23,120 4,227,604
(a) The Department of Regional Development and Lands (DRDL) is the only agency with the power to sell Crown land. The land is transferred to DRDL for sale and DEC accounts for the transfer as a distribution to owner. DEC has received $0.95 M of assets from other agencies which has been accounted as contributed equity.
2013$’000
2012$’000
24. Impairment of assets
There were no indications of impairment to property, plant and equipment at 30 June 2013.
DEC held no goodwill or intangible assets with an indefinite useful life during the reporting period and at balance sheet date there were no intangible assets not yet available for use.
All surplus assets at 30 June 2013 have been written off.
25. Payables
Current
Trade payables 5,376 5,110
Accrued expenses 2,778 2,012
Accrued salaries 4,469 3,922
Accrued superannuation 429 397
Parental payment 26 18
13,078 11,459

DEPARTMENT OF ENVIRONMENT AND CONSERVATION 2012–13 ANNUAL REPORT94
FINANCIAL STATEMENTS
2013$’000
2012$’000
26. Provisions
Current
Employee benefits provision
Annual leave (a) 15,128 13,757
Long service leave (b) 19,390 13,793
34,518 27,550
Other provisions
Employment on-costs (c) 293 254
293 254
34,811 27,804
Non-current
Employee benefits provision
Long service leave (b) 12,825 16,544
Other provisions
Employment on-costs (c) 118 153
12,943 16,697
(a) Annual leave liabilities have been classified as current as there is no an unconditional right to defer settlement for at least 12 months after the reporting period. DEC anticipates annual leave to be taken within 12 months.
(b) Long service leave liabilities have been classified as current where there is no unconditional right to defer settlement for at least 12 months after the reporting period. Assessments indicate that actual settlement of the liabilities will occur as follows:
Within 12 months of the end of the reporting period 19,390 13,793
More than 12 months after the reporting period 12,825 16,544
32,215 30,337
(c) The settlement of annual and long service leave liabilities gives rise to the payment of employment on-costs including workers’ compensation insurance. The provision is the present value of expected future payments.
The associated expense, apart from the unwinding of the discount (finance cost), is included in note 11 ‘Other expenses’.

95DEPARTMENT OF ENVIRONMENT AND CONSERVATION 2012–13 ANNUAL REPORT 95
FINANCIAL STATEMENTS
2013$’000
2012$’000
Movements in Other ProvisionsMovements in each class of provisions during the financial year, other than employee benefits, are set out below.
Employment on-cost provision
Carrying amount at start of period 407 420
Additional provisions recognised 1,481 2,000
Payments/other sacrifices of economic benefits (1,477) (2,013)
Carrying amount at end of period 411 407
27. Current liabilities
Current
Unearned revenue 5,884 3,572
5,884 3,572
28. Equity
The Government holds the equity interest in DEC on behalf of the community. Equity represents the residual interest in the net assets of DEC. The asset revaluation surplus represents that portion of equity resulting from the revaluation of non-current assets.
Contributed equityBalance at start of period 2,866,057 2,851,025
Contributions by owners
Capital appropriation 3,371 8,805
Other contributions by owners
Royalties for Regions Fund – Regional Infrastructure and Headworks Account
3,708 5,370
Transfer of net assets from other agencies
Department of Water 950 0
Land transferred from Western Australian Planning Commission 0 1,078
Total contributions by owners 2,874,086 2,866,278
Distributions to owners
Transfer of net assets to other agencies and Government 0 (221)
Total distributions to owners 0 (221)
Balance at end of period 2,874,086 2,866,057

DEPARTMENT OF ENVIRONMENT AND CONSERVATION 2012–13 ANNUAL REPORT96
FINANCIAL STATEMENTS
2013$’000
2012$’000
ReservesAsset revaluation surplus:
Balance at start of period 1,450,478 1,658,078
Net revaluation increments/(decrements):
Land (612,903) (208,608)
Buildings 15,871 1,008
Balance at end of period 853,446 1,450,478
Accumulated surplus/(deficit)Balance at start of period 87,755 47,204
Result for the period 1,737 40,551
Balance at end of period 89,492 87,755
29. Notes to the Statement of Cash Flows
Reconciliation of cash
Cash at the end of the financial year as shown in the Statement of Cash Flows is reconciled to the related items in the Statement of Financial Position as follows:
Cash and cash equivalents 8,242 14,029
Restricted cash and cash equivalents (note 18 ‘Restricted cash and cash equivalents’)
97,951 96,388
106,193 110,417
Reconciliation of net cost of services to net cash flows provided by/(used in) operating activities
Net cost of services (198,061) (181,464)
Non-cash items:
Depreciation expense 21,413 22,778
Resources received free of charge 2,195 1,572
Gain on sale of property, plant and equipment (39) (25)
Adjustment of other non-cash items 0 2,101
(Increase)/decrease in assets:
Current receivables (a) (3,427) (3,215)
Inventories (81) 161
Prepayments (1,449) (133)
Other current assets (132) 304

97DEPARTMENT OF ENVIRONMENT AND CONSERVATION 2012–13 ANNUAL REPORT 97
FINANCIAL STATEMENTS
2013$’000
2012$’000
Increase/(decrease) in liabilities:
Current payables (a) 3,541 (1,161)
Provisions 3,253 (2,599)
Net GST receipts/(payments) (b) (380) (27)
Change in GST in receivables/payables (c)
Net cash used in operating activities (173,167) (161,708)
(a) Note that Australian Taxation Office (ATO) receivable/payable in respect of GST and the receivable/payable in respect of the sale/purchase of non-current assets are not included in these items as they do not form part of the reconciling items.
(b) This is the net GST paid/received, i.e. cash transactions.
(c) This reverses out the GST in receivables and payables.
30. Services provided free of charge
During the period the following services were provided to other agencies free of charge for functions outside the normal operations of DEC:
Keep Australia Beautiful Council – Finance, HR and IT 415 500
Office of the Environmental Protection Authority – Finance, HR and IT 535 525
950 1,025
31. Commitments
Non-cancellable operating lease commitments
Commitments for minimum lease payments are payable as follows:
Within 1 year 10,147 8,887
Later than 1 year and not later than 5 years 19,340 12,810
Later than 5 years 8,135 4,359
37,622 26,056
DEC’s fleet leases account for $7.7 million of the non cancellable operating lease commitmentsfor 2013. The lease term varies depending on the vehicle. The lease payments are fixed for the term of the lease and are payable monthly. There is no option to renew the lease at the end ofthe lease term.
The capital expenditure commitments below are inclusive of GST.
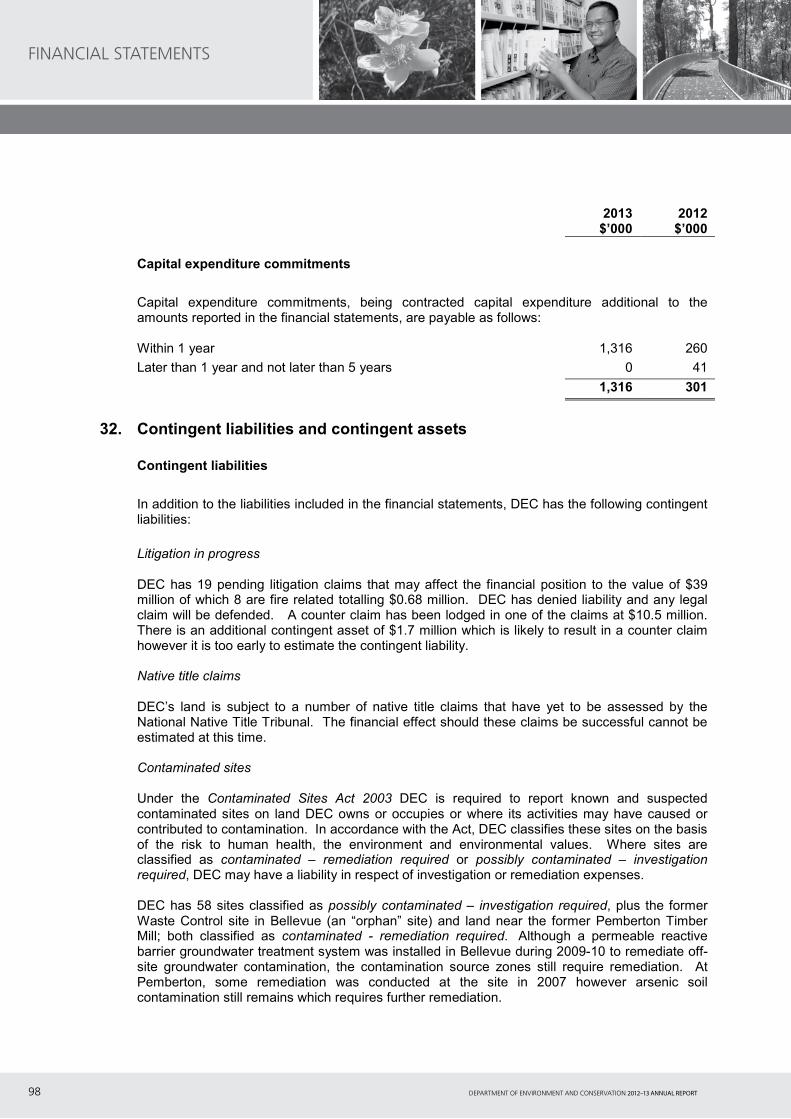
DEPARTMENT OF ENVIRONMENT AND CONSERVATION 2012–13 ANNUAL REPORT98
FINANCIAL STATEMENTS
2013$’000
2012$’000
Capital expenditure commitments
Capital expenditure commitments, being contracted capital expenditure additional to the amounts reported in the financial statements, are payable as follows:
Within 1 year 1,316 260
Later than 1 year and not later than 5 years 0 41
1,316 301
32. Contingent liabilities and contingent assets
Contingent liabilities
In addition to the liabilities included in the financial statements, DEC has the following contingent liabilities:
Litigation in progress
DEC has 19 pending litigation claims that may affect the financial position to the value of $39 million of which 8 are fire related totalling $0.68 million. DEC has denied liability and any legal claim will be defended. A counter claim has been lodged in one of the claims at $10.5 million. There is an additional contingent asset of $1.7 million which is likely to result in a counter claim however it is too early to estimate the contingent liability.
Native title claims
DEC’s land is subject to a number of native title claims that have yet to be assessed by the National Native Title Tribunal. The financial effect should these claims be successful cannot be estimated at this time.
Contaminated sites
Under the Contaminated Sites Act 2003 DEC is required to report known and suspected contaminated sites on land DEC owns or occupies or where its activities may have caused or contributed to contamination. In accordance with the Act, DEC classifies these sites on the basis of the risk to human health, the environment and environmental values. Where sites are classified as contaminated – remediation required or possibly contaminated – investigation required, DEC may have a liability in respect of investigation or remediation expenses.
DEC has 58 sites classified as possibly contaminated – investigation required, plus the former Waste Control site in Bellevue (an “orphan” site) and land near the former Pemberton Timber Mill; both classified as contaminated - remediation required. Although a permeable reactive barrier groundwater treatment system was installed in Bellevue during 2009-10 to remediate off-site groundwater contamination, the contamination source zones still require remediation. At Pemberton, some remediation was conducted at the site in 2007 however arsenic soil contamination still remains which requires further remediation.

99DEPARTMENT OF ENVIRONMENT AND CONSERVATION 2012–13 ANNUAL REPORT 99
FINANCIAL STATEMENTS
On 20 March 2013, the Contaminated Sites Committee made a decision on the responsibility for remediation of a f ormer service station in Midland classified as contaminated – remediation required. T he State of Western Australia was allocated a 1.5% share of responsibility for the remediation and DEC, as the State government agency responsible for administering the Act, is representing the State in matters relating to remediation of the site. DEC also has some responsibility for investigating and, where necessary, remediating the former Brookdale Liquid Waste Treatment Facility although this site plus four others have not yet been classified under the Act. The financial effect of these liabilities cannot be reliably estimated at this time. Funding from the Contaminated Sites Management Account has been approved for DEC to undertake investigation and/or remediation at six of these sites, and funding applications for other DEC sites are currently being assessed.
33. Events occurring after the end of the reporting period DEC had no adjusting or non-adjusting events after the reporting period. This will be DEC’s last annual report. From 1 July 2013 Department of Parks and Wildlife (DPaW) and Department of Environment Regulation (DER) will deliver the services previously offered by DEC.
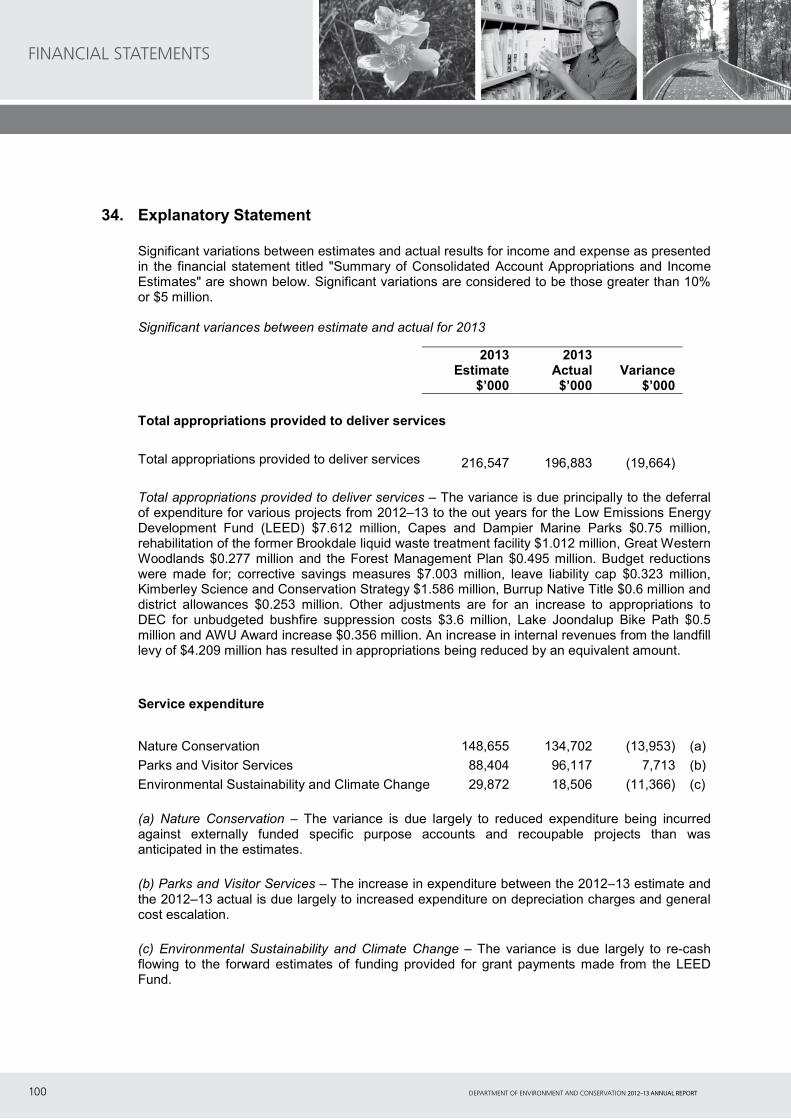
DEPARTMENT OF ENVIRONMENT AND CONSERVATION 2012–13 ANNUAL REPORT100
FINANCIAL STATEMENTS
34. Explanatory Statement Significant variations between estimates and actual results for income and expense as presented
in the financial statement titled "Summary of Consolidated Account Appropriations and Income Estimates" are shown below. Significant variations are considered to be those greater than 10% or $5 million.
Significant variances between estimate and actual for 2013
2013Estimate
$’000
2013 Actual $’000
Variance $’000
Total appropriations provided to deliver services Total appropriations provided to deliver services 216,547 196,883 (19,664) Total appropriations provided to deliver services – The variance is due principally to the deferral
of expenditure for various projects from 2012–13 to the out years for the Low Emissions Energy Development Fund (LEED) $7.612 million, Capes and Dampier Marine Parks $0.75 million, rehabilitation of the former Brookdale liquid waste treatment facility $1.012 million, Great Western Woodlands $0.277 million and the Forest Management Plan $0.495 million. Budget reductions were made for; corrective savings measures $7.003 million, leave liability cap $0.323 million, Kimberley Science and Conservation Strategy $1.586 million, Burrup Native Title $0.6 million and district allowances $0.253 million. Other adjustments are for an increase to appropriations to DEC for unbudgeted bushfire suppression costs $3.6 million, Lake Joondalup Bike Path $0.5 million and AWU Award increase $0.356 million. An increase in internal revenues from the landfill levy of $4.209 million has resulted in appropriations being reduced by an equivalent amount.
Service expenditure Nature Conservation 148,655 134,702 (13,953) (a) Parks and Visitor Services 88,404 96,117 7,713 (b) Environmental Sustainability and Climate Change 29,872 18,506 (11,366) (c) (a) Nature Conservation – The variance is due largely to reduced expenditure being incurred
against externally funded specific purpose accounts and recoupable projects than was anticipated in the estimates.
(b) Parks and Visitor Services – The increase in expenditure between the 2012–13 estimate and
the 2012–13 actual is due largely to increased expenditure on depreciation charges and general cost escalation.
(c) Environmental Sustainability and Climate Change – The variance is due largely to re-cash
flowing to the forward estimates of funding provided for grant payments made from the LEED Fund.

101DEPARTMENT OF ENVIRONMENT AND CONSERVATION 2012–13 ANNUAL REPORT 101
FINANCIAL STATEMENTS
Significant variances between actual results for 2013 and 2012
2013Actual$’000
2012 Actual $’000
Variance $’000
Service expenditure
Nature Conservation 134,702 125,942 8,760 (a)
Environmental Sustainability and Climate Change 18,506 15,623 2,883 (b)
(a) Nature Conservation – The variance is due largely to increased expenditure on externally funded specific purpose accounts at Dirk Hartog Island and for Barrow Island conservation programs.
(b) Environmental Sustainability and Climate Change – The variance is due to increased payments made from the Waste Avoidance and Resource Recovery Account.
Capital contribution
Significant variances between estimate and actual for 2013
2013Estimate
$’000
2013 Actual $’000
Variance $’000
Capital contribution 12,426 7,079 (5,347)
Capital contribution – The actual capital funding received was $5.347 million below the estimate and this was largely due to delays in the commencement of projects funded from the Royalties for Regions Regional Infrastructure and Headworks Fund.
Significant variances between actual results for 2013 and 2012
2013Actual$’000
2012 Actual $’000
Variance $’000
Capital contribution 7,079 14,175 (7,096)
Capital contribution – The reduction in total capital funding was due mainly to a decrease of $5 million for a one-off allocation for fire management equipment provided in 2011–12 and $1.662 million for projects funded by the Royalties for Regions Regional Infrastructure and Headworks Fund.

DEPARTMENT OF ENVIRONMENT AND CONSERVATION 2012–13 ANNUAL REPORT102
FINANCIAL STATEMENTS
35. Financial instruments
(a) Financial risk management objectives and policies
Financial instruments held by DEC are cash and cash equivalents, restricted cash and cash equivalents, receivables and payables. All of DEC’s cash is held in the public bank account (interest bearing) apart from restricted cash held in a special purpose account. DEC has limited exposure to financial risks. DEC’s overall risk management program focuses on managing the risks identified below.
Credit risk
Credit risk arises when there is the possibility of DEC’s receivables defaulting on their contractual obligations resulting in financial loss to DEC.
The maximum exposure to credit risk at end of the reporting period in relation to each class of recognised financial assets is the gross carrying amount of those assets inclusive of any allowance for impairment, as shown the table at note 35(c) ‘Financial Instruments Disclosures’ and note 20 ‘Receivables’.
Credit risk associated with DEC’s financial assets is minimal because the main receivable is the amounts receivable for services (holding account). For receivables other than government, DEC trades only with recognised, creditworthy third parties. DEC has policies in place to ensure that sales of products and services are made to customers with an appropriate credit history. In addition, receivable balances are monitored on an ongoing basis with the result that DEC’s exposure to bad debts is minimal. At the end of the reporting period there were no significant concentrations of credit risk.
Liquidity risk
Liquidity risk arises when DEC is unable to meet its financial obligations as they fall due. DEC is exposed to liquidity risk through its trading in the normal course of business.
DEC has appropriate procedures to manage cash flows including drawdowns of appropriations by monitoring forecast cash flows to ensure that sufficient funds are available to meet its commitments.
Market risk
Market risk is the risk that changes in market prices such as foreign exchange rates and interest rates will affect DEC’s income or the value of its holdings of financial instruments.DEC does not trade in foreign currency and is not materially exposed to other price risks.
Other than as detailed in the Interest rate sensitivity analysis table at note 35(c), DEC is not exposed to interest rate risk because DEC has no borrowings.

103DEPARTMENT OF ENVIRONMENT AND CONSERVATION 2012–13 ANNUAL REPORT 103
FINANCIAL STATEMENTS
2013$’000
2012$’000
(b) Categories of financial instruments
Financial Assets
Cash and cash equivalents 8,242 14,029
Restricted cash and cash equivalents 97,951 96,388
Loans and receivables (a) 136,579 121,562
Financial Liabilities
Financial liabilities measured at amortised cost 13,078 11,459
(a) The amount of loans and receivables excludes GST recoverable from the ATO (statutory receivable).
(c) Financial instrument disclosures
Credit Risk
The following table details DEC’s maximum exposure to credit risk and the ageing analysis of financial assets. DEC’s maximum exposure to credit risk at the end of the reporting period is the carrying amount of financial assets as shown below. The table discloses the ageing of financial assets that are past due but not impaired and impaired financial assets. The table is based on information provided to senior management of DEC.
DEC does not hold any collateral as security or other credit enhancements relating to the financial assets it holds.
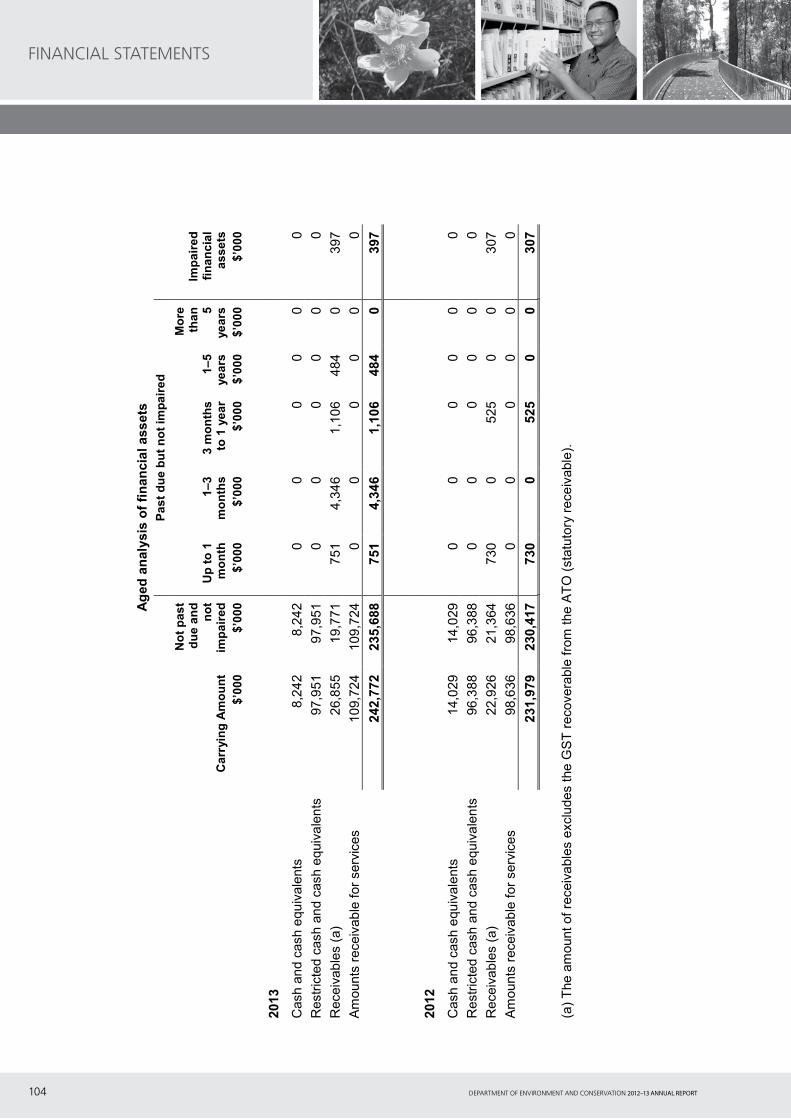
DEPARTMENT OF ENVIRONMENT AND CONSERVATION 2012–13 ANNUAL REPORT104
FINANCIAL STATEMENTS
Age
d an
alys
is o
f fin
anci
al a
sset
sPa
st d
ue b
ut n
ot im
paire
d
Car
ryin
g A
mou
nt
Not
pas
t du
e an
d no
t im
paire
dU
p to
1
mon
th1–
3m
onth
s3
mon
ths
to 1
yea
r1–
5ye
ars
Mor
e th
an 5
year
s
Impa
ired
finan
cial
as
sets
$’00
0$’
000
$’00
0$’
000
$’00
0$’
000
$’00
0$’
000
2013
Cas
h an
d ca
sh e
quiv
alen
ts8,
242
8,24
20
00
00
0
Res
tric
ted
cash
an
d ca
sh e
quiv
ale
nts
97,9
5197
,951
00
00
00
Rec
eiva
ble
s (a
)26
,855
19,7
7175
14,
346
1,10
648
40
397
Am
ount
s re
ceiv
able
for
ser
vice
s10
9,72
410
9,72
40
00
00
0
242,
772
235,
688
751
4,34
61,
106
484
039
7
2012
Cas
h an
d ca
sh e
quiv
alen
ts14
,029
14,0
290
00
00
0
Res
tric
ted
cash
an
dca
sh e
quiv
ale
nts
96,3
8896
,388
00
00
00
Rec
eiva
ble
s (a
)22
,926
21,3
6473
00
525
00
307
Am
ount
s re
ceiv
able
for
ser
vice
s98
,636
98,6
360
00
00
0
231,
979
230,
417
730
052
50
030
7
(a)
The
am
ount
of
rece
iva
bles
exc
lude
s th
e G
ST
rec
over
able
fro
m th
e A
TO
(st
atut
ory
rece
ivab
le).
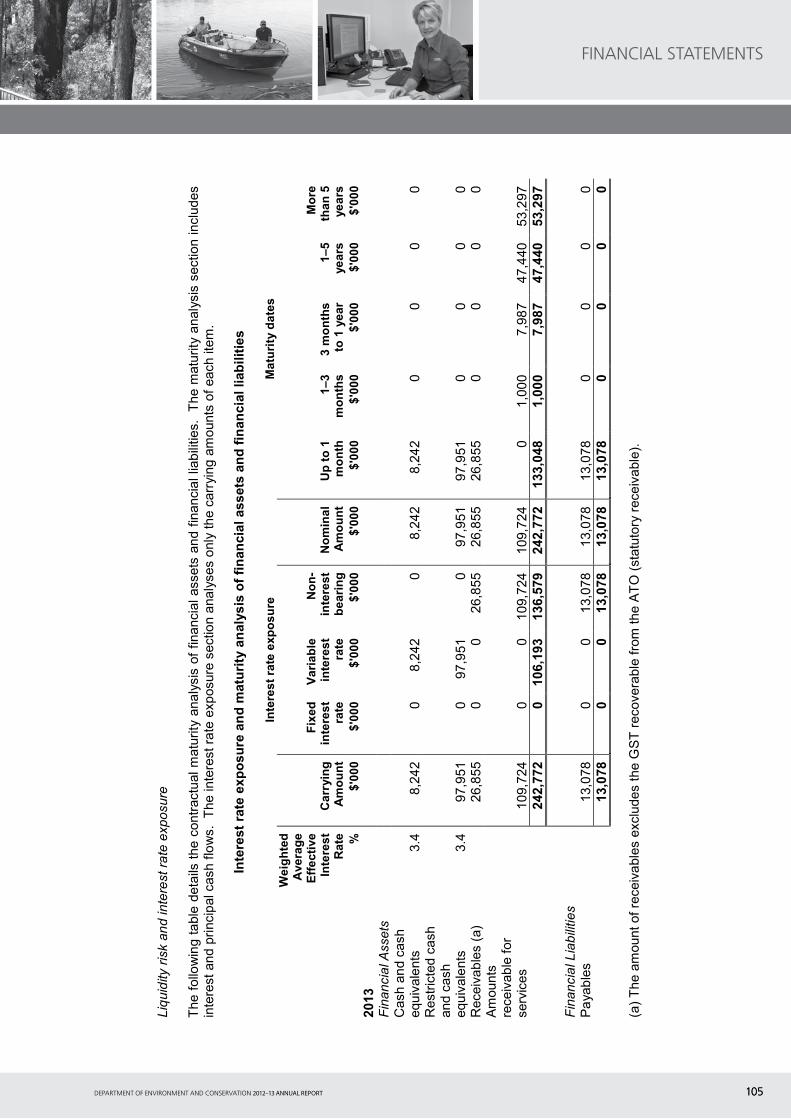
105DEPARTMENT OF ENVIRONMENT AND CONSERVATION 2012–13 ANNUAL REPORT 105
FINANCIAL STATEMENTS
Liq
uid
ity r
isk
and
inte
rest
ra
te e
xpos
ure
The
fol
low
ing
tabl
e de
tails
the
con
trac
tual
mat
urity
ana
lysi
sof
fin
anci
al a
sset
s an
d f
inan
cia
l lia
bili
ties.
T
he m
atur
ity a
naly
sis
sect
ion
incl
udes
in
tere
st a
ndpr
inci
pal
cas
h flo
ws.
The
inte
rest
ra
te e
xpos
ure
sect
ion
ana
lyse
s o
nly
the
carr
ying
am
ount
s of
eac
h ite
m.
Inte
rest
rate
exp
osur
e an
d m
atur
ity a
naly
sis
of fi
nanc
ial a
sset
s an
d fin
anci
al li
abili
ties
Inte
rest
rate
exp
osur
eM
atur
ity d
ates
Wei
ghte
d A
vera
ge
Effe
ctiv
e In
tere
st
Rat
eC
arry
ing
Am
ount
Fixe
d in
tere
st
rate
Varia
ble
inte
rest
ra
te
Non
-in
tere
st
bear
ing
Nom
inal
A
mou
ntU
p to
1
mon
th1–
3m
onth
s3
mon
ths
to 1
yea
r 1–
5ye
ars
Mor
e th
an 5
ye
ars
%$'
000
$'00
0$'
000
$'00
0$'
000
$'00
0$'
000
$'00
0$'
000
$'00
020
13F
inan
cia
l Ass
ets
Cas
h an
d ca
sh
equ
ival
ent
s3.
48,
242
08,
242
08,
242
8,24
20
00
0R
estr
icte
d ca
sh
and
cash
eq
uiv
ale
nts
3.4
97,9
510
97,9
510
97,9
5197
,951
00
00
Rec
eiva
ble
s (a
)26
,855
00
26,8
5526
,855
26,8
550
00
0A
mou
nts
rece
ivab
le f
or
serv
ices
109,
724
00
109,
724
109,
724
01,
000
7,98
747
,440
53,2
9724
2,77
20
106,
193
136,
579
242,
772
133,
048
1,00
07,
987
47,4
4053
,297
Fin
anci
al L
iab
ilitie
sP
aya
ble
s13
,078
00
13,0
7813
,078
13,0
780
00
013
,078
00
13,0
7813
,078
13,0
780
00
0
(a)
The
am
ount
of
rece
iva
bles
exc
lude
s th
e G
ST
rec
over
able
fro
m th
e A
TO
(st
atut
ory
rece
ivab
le).

DEPARTMENT OF ENVIRONMENT AND CONSERVATION 2012–13 ANNUAL REPORT106
FINANCIAL STATEMENTS
Inte
rest
rate
exp
osur
e an
d m
atur
ity a
naly
sis
of fi
nanc
ial a
sset
s an
d fin
anci
al li
abili
ties
Inte
rest
rate
exp
osur
eM
atur
ity d
ates
Wei
ghte
d A
vera
ge
Effe
ctiv
e In
tere
st
Rat
eC
arry
ing
Am
ount
Fixe
d in
tere
st
rate
Varia
ble
inte
rest
ra
te
Non
-in
tere
st
bear
ing
Nom
inal
A
mou
ntU
p to
1
mon
th1–
3m
onth
s3
mon
ths
to 1
yea
r 1–
5ye
ars
Mor
e th
an 5
ye
ars
%$'
000
$'00
0$'
000
$'00
0$'
000
$'00
0$'
000
$'00
0$'
000
$'00
020
12F
inan
cia
l Ass
ets
Cas
h an
d ca
sh
equ
ival
ent
s4.
814
,029
014
,029
014
,029
14,0
290
00
0R
estr
icte
d ca
sh
and
cash
eq
uiv
ale
nts
4.8
96,3
880
96,3
880
96,3
8896
,388
00
00
Rec
eiva
ble
s (a
)22
,926
00
22,9
2622
,926
22,9
260
00
0A
mou
nts
rece
ivab
le f
or
serv
ices
98,6
360
098
,636
98,6
360
1,00
08,
062
56,9
2432
,650
231,
979
011
0,41
712
1,56
223
1,97
913
3,34
31,
000
8.06
256
,924
32,6
50
Fin
anci
al L
iab
ilitie
sP
aya
ble
s11
,459
00
11,4
5911
,459
11,4
590
00
011
,459
00
11,4
5911
,459
11,4
590
00
0
(a)
The
am
ount
of
rece
iva
bles
exc
lude
s th
e G
ST
rec
over
able
fro
m th
e A
TO
(st
atut
ory
rece
ivab
le).

107DEPARTMENT OF ENVIRONMENT AND CONSERVATION 2012–13 ANNUAL REPORT 107
FINANCIAL STATEMENTS
Interest rate sensitivity analysis
The following table represents a summary of the interest rate sensitivity of DEC’s financial assets and liabilities at the end of the reporting period on the surplus for the period and equity for a 1% change in interest rates. It is assumed that the change in interest rates is held constant throughout the reporting period.
-100 basis points +100 basis points
2013
Carrying amount
$000Surplus
$000Equity
$000Surplus
$000Equity
$000Financial Assets
Restricted cash and cash equivalents 97,951 (980) (980) 980 980
Total Increase/(Decrease) (980) (980) 980 980
-100 basis points +100 basis points
2012
Carrying amount
$000Surplus
$000Equity
$000Surplus
$000Equity
$000Financial Assets
Restricted cash and cash equivalents 96,388 (964) (964) 964 964
Total Increase/(Decrease) (964) (964) 964 964
Fair Values
All financial assets and liabilities recognised in the statement of financial position, whether they are carried at cost or fair value, are recognised at amounts that represent a reasonable approximation of fair value unless otherwise stated in the applicable notes.
36. Remuneration of senior officers
The number of senior officers, whose total fees, salaries, superannuation, non-monetary benefits and other benefits for the financial year fall within the following bands are:
$ 2013 2012120,001 – 130,000 0 1130,001 – 140,000 0 1150,001 – 160,000 2 1160,001 – 170,000 0 1170,001 – 180,000 1 3180,001 – 190,000 4 1190,001 – 200,000 2 0200,001 – 210,000 0 1
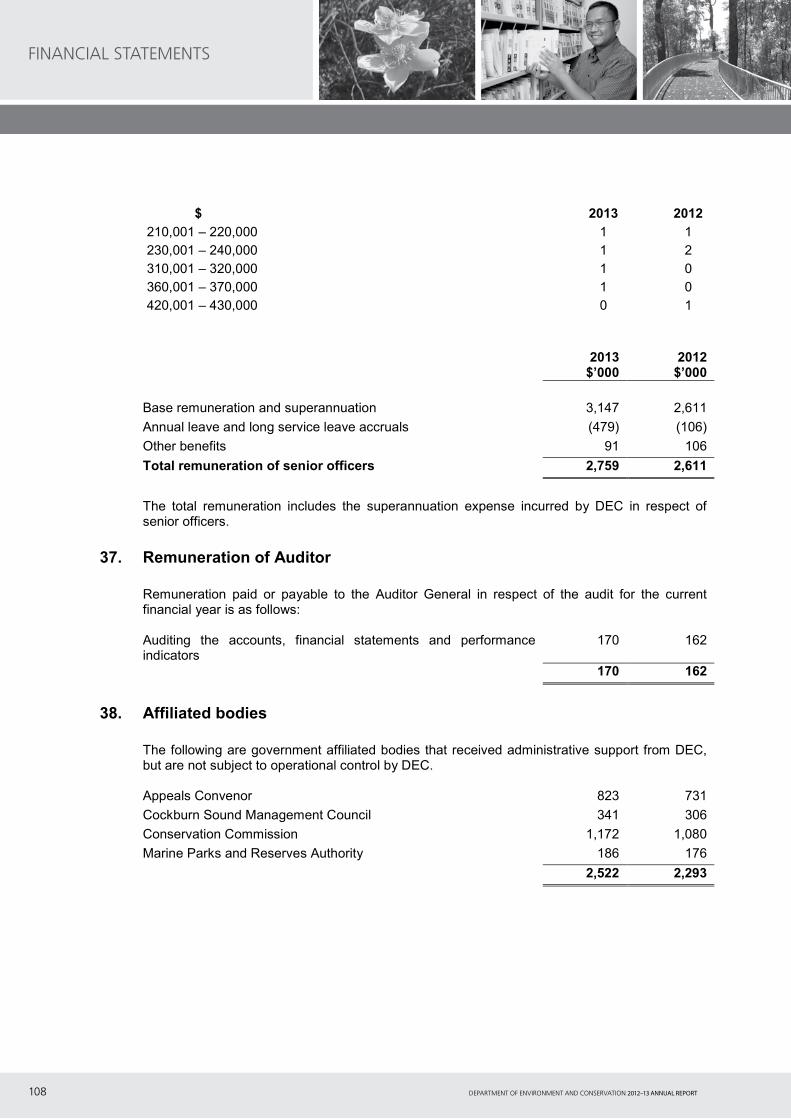
DEPARTMENT OF ENVIRONMENT AND CONSERVATION 2012–13 ANNUAL REPORT108
FINANCIAL STATEMENTS
$ 2013 2012210,001 – 220,000 1 1230,001 – 240,000 1 2310,001 – 320,000 1 0360,001 – 370,000 1 0420,001 – 430,000 0 1
2013$’000
2012$’000
Base remuneration and superannuation 3,147 2,611
Annual leave and long service leave accruals (479) (106)
Other benefits 91 106
Total remuneration of senior officers 2,759 2,611
The total remuneration includes the superannuation expense incurred by DEC in respect of senior officers.
37. Remuneration of Auditor
Remuneration paid or payable to the Auditor General in respect of the audit for the currentfinancial year is as follows:
Auditing the accounts, financial statements and performance indicators
170 162
170 162
38. Affiliated bodies
The following are government affiliated bodies that received administrative support from DEC, but are not subject to operational control by DEC.
Appeals Convenor 823 731
Cockburn Sound Management Council 341 306
Conservation Commission 1,172 1,080
Marine Parks and Reserves Authority 186 176
2,522 2,293
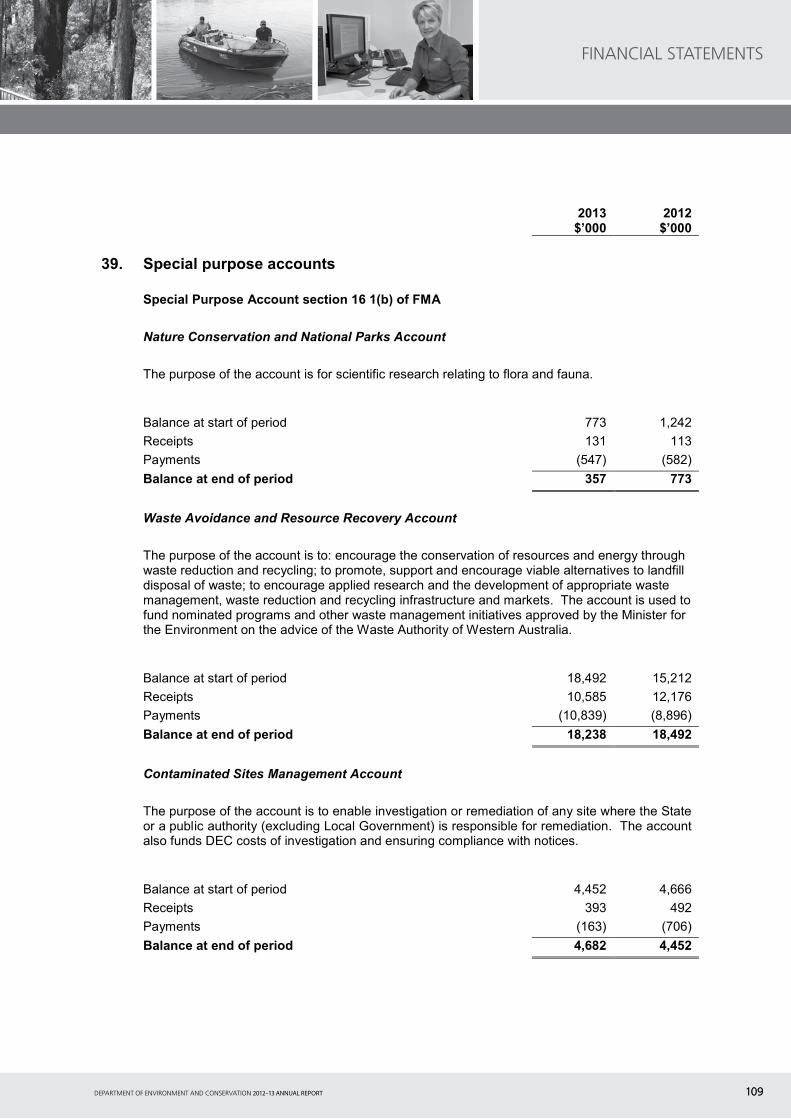
109DEPARTMENT OF ENVIRONMENT AND CONSERVATION 2012–13 ANNUAL REPORT 109
FINANCIAL STATEMENTS
2013$’000
2012$’000
39. Special purpose accounts Special Purpose Account section 16 1(b) of FMA Nature Conservation and National Parks Account The purpose of the account is for scientific research relating to flora and fauna.
Balance at start of period 773 1,242 Receipts 131 113 Payments (547) (582) Balance at end of period 357 773 Waste Avoidance and Resource Recovery Account The purpose of the account is to: encourage the conservation of resources and energy through
waste reduction and recycling; to promote, support and encourage viable alternatives to landfill disposal of waste; to encourage applied research and the development of appropriate waste management, waste reduction and recycling infrastructure and markets. The account is used to fund nominated programs and other waste management initiatives approved by the Minister for the Environment on the advice of the Waste Authority of Western Australia.
Balance at start of period 18,492 15,212 Receipts 10,585 12,176 Payments (10,839) (8,896) Balance at end of period 18,238 18,492 Contaminated Sites Management Account
The purpose of the account is to enable investigation or remediation of any site where the State
or a public authority (excluding Local Government) is responsible for remediation. The account also funds DEC costs of investigation and ensuring compliance with notices.
Balance at start of period 4,452 4,666 Receipts 393 492 Payments (163) (706) Balance at end of period 4,682 4,452

DEPARTMENT OF ENVIRONMENT AND CONSERVATION 2012–13 ANNUAL REPORT110
FINANCIAL STATEMENTS
2013 2012 $’000 $’000
Barrow Island Net Conservation Benefit Account The purpose of the account is for the funding of ongoing programs that will provide demonstrable and sustainable additions to or improvements in biodiversity conservation values of Western Australia targeting, where possible, the biodiversity conservation values affected or occurring in similar bioregions to Barrow Island.
Balance at start of period 13,191 10,757 Receipts 2,642 2,694 Payments (5,145) (260) Balance at end of period 10,688 13,191 National Parks Essential Works Account
The purpose of the account is to hold net proceeds in respect of forest produce taken or received under section 99A of the Conservation and Land Management Act 1984 and from which moneys shall be applied only for the purposes of land to which Division 2 of VIII of the Conservation and Land Management Act 1984 applies. There were no transaction through the account for the reporting period.
40. Supplementary financial information
(a) Write-offs During the financial year $15,861.20 was written off as bad debts, $8,645.28 for travel
advances, $2,250.05 for inventories and $ 80,407.10 of DEC’s asset and public property register under the authority of:
The Accountable Authority 107 67 The Minister 0 0 Executive Council 0 0 107 67 Of the $107,163.63 approved for write off during the year $92,192.51 relates to losses through
theft, defaults and other causes disclosed at note 40(b) below. (b) Losses through theft, defaults and other causes Losses of public money and, public and other property through
theft or default. 92 30
Amounts recovered (153) 0 (61) 30
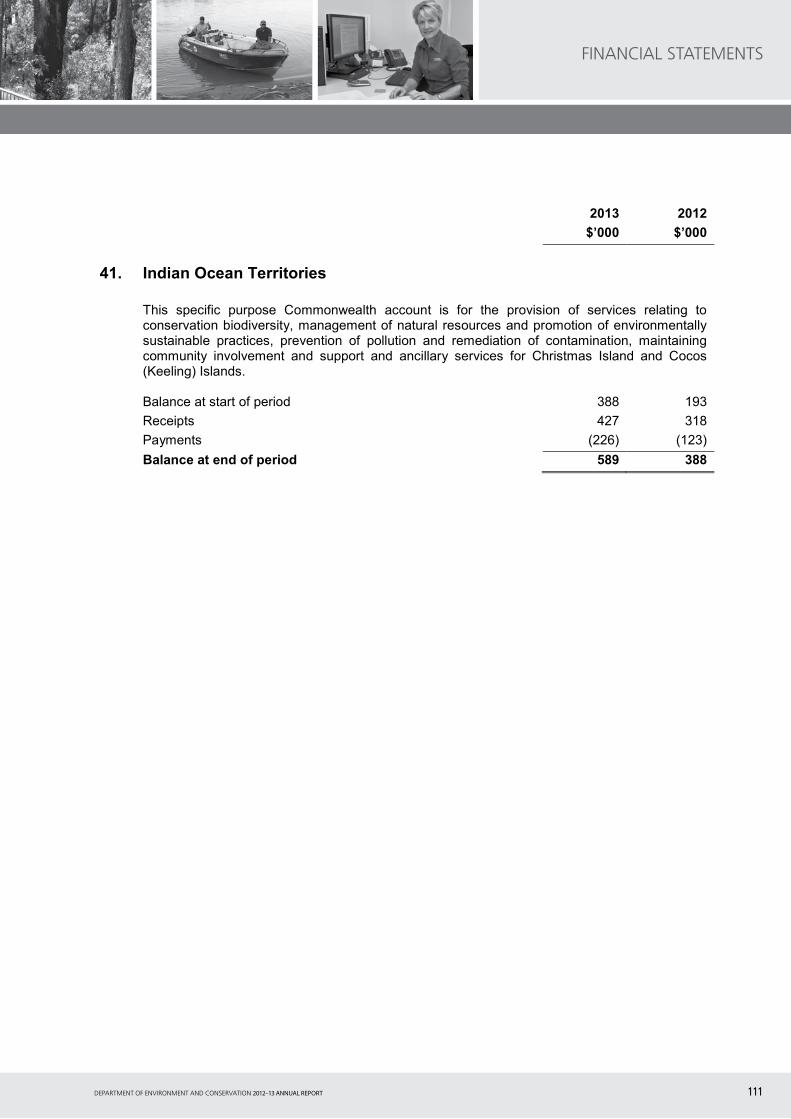
111DEPARTMENT OF ENVIRONMENT AND CONSERVATION 2012–13 ANNUAL REPORT 111
FINANCIAL STATEMENTS
2013 2012$’000 $’000
41. Indian Ocean Territories
This specific purpose Commonwealth account is for the provision of services relating to conservation biodiversity, management of natural resources and promotion of environmentally sustainable practices, prevention of pollution and remediation of contamination, maintaining community involvement and support and ancillary services for Christmas Island and Cocos (Keeling) Islands.
Balance at start of period 388 193
Receipts 427 318
Payments (226) (123)
Balance at end of period 589 388

DEPARTMENT OF ENVIRONMENT AND CONSERVATION 2012–13 ANNUAL REPORT112
42.
Dis
clos
ure
of a
dmin
iste
red
inco
me
and
expe
nses
by
serv
ice
Nat
ure
Con
serv
atio
nSu
stai
nabl
e Fo
rest
M
anag
emen
t
Park
s an
d Vi
sito
r Se
rvic
es
Envi
ronm
enta
l R
egul
atio
nEn
viro
nmen
tal
Sust
aina
bilit
yan
d C
limat
e C
hang
e
Tota
l
2013
2012
2013
2012
2013
2012
2013
2012
2013
2012
2013
2012
$'00
0$'
000
$'00
0$'
000
$'00
0$'
000
$'00
0$'
000
$'00
0$'
000
$'00
0$'
000
CO
ST O
F SE
RVI
CES
Exp
ense
sT
rans
fer
paym
ents
7374
00
00
1320
00
8694
Tota
l adm
inis
tere
d ex
pens
es73
740
00
013
200
086
94
Inco
me
Reg
ula
tory
fee
s a
nd c
harg
es31
330
00
013
200
044
53O
ther
rev
enu
e42
410
00
00
00
042
41
Tota
l adm
inis
tere
d in
com
e73
740
00
013
200
086
94
En
viro
nmen
tal S
usta
ina
bilit
y a
nd C
oord
inat
e th
e R
esp
onse
to C
limat
e C
han
ge h
ave
am
alga
mat
ed a
nd a
re r
efe
rred
to a
s E
nviro
nmen
tal
Sus
tain
abi
lity
and
Clim
ate
Cha
nge
.
FINANCIAL STATEMENTS
113DEPARTMENT OF ENVIRONMENT AND CONSERVATION 2012–13 ANNUAL REPORT 113
CERTIFICATION OF KEY PERFORMANCE INDICATORS
I hereby certify that the key performance indicators are based on proper records, are relevant and appropriate for assisting users to assess the Department of Environment and Conservation’s performance, and fairly represent the performance of the Department of Environment and Conservation for the financial year ended 30 June 2013.
Jim Sharp Accountable Authority
2 September 2013
CERTIFICATION

DEPARTMENT OF ENVIRONMENT AND CONSERVATION 2012–13 ANNUAL REPORT114
KEY PERFORMANCE INDICATORS
Outcome Based Management Structure
Government goal Desired outcomes Services and performance indicators
Social and environmental responsibility
Conservation and sustainable utilisation of biodiversity
1.Nature Conservation
Key effectiveness indicator:1.Total number of listed threatened taxa and ecological communities2.Number of threatened taxa and ecological communities with
improved conservation status3.Number of threatened taxa and ecological communities with
declining conservation status4.Proportion of critically endangered and endangered taxa and
ecological communities that have a recovery plan5.Proportion of terrestrial sub-bioregions with a greater than 15%
reservation6.Proportion of marine bioregions with marine conservation reserves
Key efficiency indicatorsKPI 1.1 Average cost per hectare of managing wildlife habitat
2.Sustainable Forest Management
Key effectiveness indicator:7.Percentage of Forest Management Plan performance indicators
where defined annual targets are met
Key efficiency indicatorsKPI 2.1 Average cost per hectare of managing State forest and
timber reserves
Ensuring that economic activity is managed in a socially and environmentally responsible manner for the long-term benefit of the state
Community enjoyment of park facilities and services, wildlife and the natural environment displayed in parks
3. Parks and Visitor Services
Key effectiveness indicator:1.Average level of visitor satisfaction with their visit2.Park visitation (annual number of visits)3.Annual percentage change in park visitation
Key efficiency indicatorsKPI 3.1 Cost per visit
Emissions and discharges meet acceptable criteria
4. Environmental Regulation
Key effectiveness indicator:1.Number of exceedances of approved environment criteria by
regulated activities2.Number of National Environment Protection Measure (NEPM)
exceedances per annum of criteria pollutants
Key efficiency indicatorsKPI 4.1 Average cost per air monitoring stationKPI 4.2 Average cost per industry licenceKPI 4.3 Average cost per contaminated site assessmentKPI 4.4 Average cost of remediating state sites
KEY PERFORMANCE INDICATORS
KEY PERFORMANCE INDICATORS

115DEPARTMENT OF ENVIRONMENT AND CONSERVATION 2012–13 ANNUAL REPORT 115
Adoption of environmentally sustainable practices to protect, manage and restore the state’s natural resources
5. Environmental Sustainability and Climate Change
Key effectiveness indicator:1.Percentage of waste in the metropolitan area diverted from landfill
through recycling
Key efficiency indicatorsKPI 5.1 Cost of administering Waste Avoidance and Resource
Recovery Account as a percentage of total fundsKPI 5.2 Cost of administering Low Emissions Energy Development
fund as a percentage of total funds
During 2012–13, DEC’s outcome based management structure was changed. Service areas 5 and 6, Environmental Sustainability and Coordinate the response to climate change, were combined to form service area 5 Environmental Sustainability and Climate Change.
The performance indicators remained the same with the exception of the key effectiveness indicator ‘Percentage of Low Emissions Energy Development fund milestones achieved within the targeted timeframe’ which is no longer reported as it is not considered to provide meaningful information on performance. It has not been possible to suggest a suitable replacement measure as the effectiveness of the state’s actions in providing leadership in adaptation to climate change cannot be readily quantified.
KEY PERFORMANCE INDICATORS
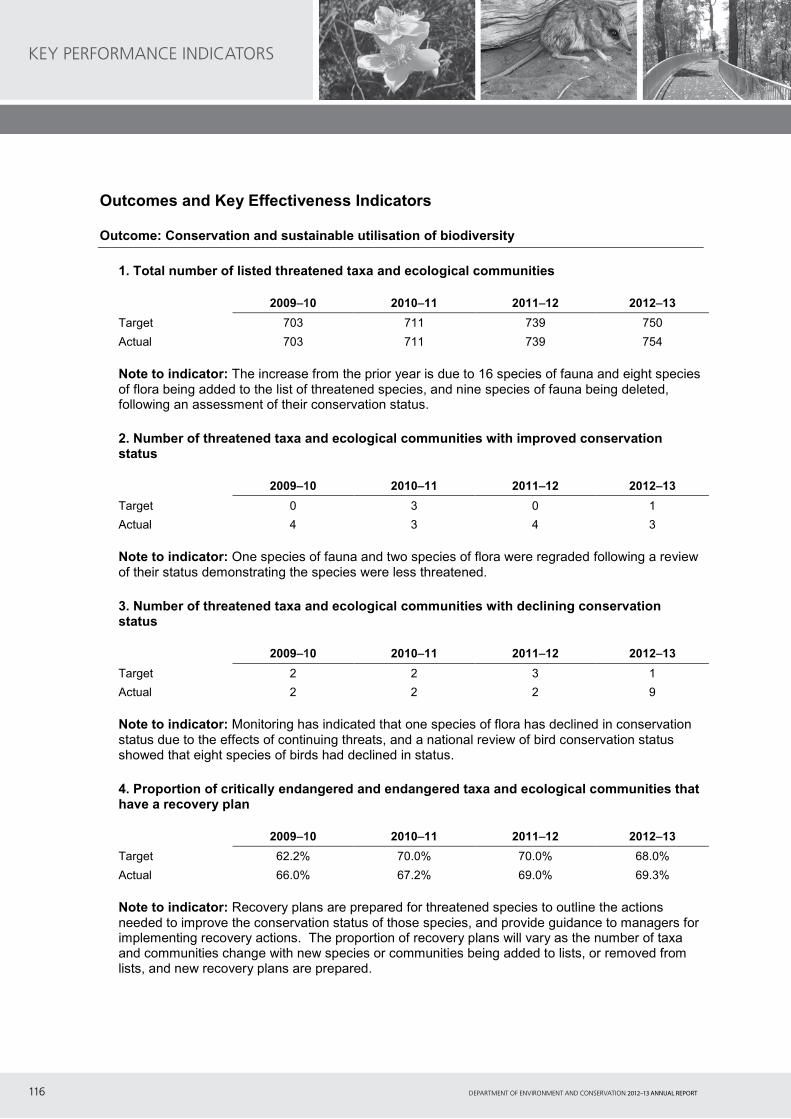
DEPARTMENT OF ENVIRONMENT AND CONSERVATION 2012–13 ANNUAL REPORT116
Outcomes and Key Effectiveness Indicators
Outcome: Conservation and sustainable utilisation of biodiversity
1. Total number of listed threatened taxa and ecological communities
2009–10 2010–11 2011–12 2012–13Target 703 711 739 750
Actual 703 711 739 754
Note to indicator: The increase from the prior year is due to 16 species of fauna and eight species of flora being added to the list of threatened species, and nine species of fauna being deleted, following an assessment of their conservation status.
2. Number of threatened taxa and ecological communities with improved conservation status
2009–10 2010–11 2011–12 2012–13Target 0 3 0 1
Actual 4 3 4 3
Note to indicator: One species of fauna and two species of flora were regraded following a review of their status demonstrating the species were less threatened.
3. Number of threatened taxa and ecological communities with declining conservation status
2009–10 2010–11 2011–12 2012–13Target 2 2 3 1
Actual 2 2 2 9
Note to indicator: Monitoring has indicated that one species of flora has declined in conservation status due to the effects of continuing threats, and a national review of bird conservation status showed that eight species of birds had declined in status.
4. Proportion of critically endangered and endangered taxa and ecological communities that have a recovery plan
2009–10 2010–11 2011–12 2012–13Target 62.2% 70.0% 70.0% 68.0%
Actual 66.0% 67.2% 69.0% 69.3%
Note to indicator: Recovery plans are prepared for threatened species to outline the actions needed to improve the conservation status of those species, and provide guidance to managers for implementing recovery actions. The proportion of recovery plans will vary as the number of taxa and communities change with new species or communities being added to lists, or removed from lists, and new recovery plans are prepared.
KEY PERFORMANCE INDICATORS

117DEPARTMENT OF ENVIRONMENT AND CONSERVATION 2012–13 ANNUAL REPORT 117
5. Proportion of terrestrial sub-bioregions with greater than 15% reservation
2009–10 2010–11 2011–12 2012–13Target 20.4% 20.4% 20.4% 20.4%
Actual 20.4% 22.2% 22.2% 22.2%
Note to indicator: Terrestrial sub-bioregions are areas of the state with similar biogeographic characteristics as determined by the Australian government through the Interim Biogeographic Regionalisation of Australia. An objective of the comprehensive, adequate and representative (CAR) conservation reserve system is to achieve a minimum reservation status (15%) of lands reserved and managed for biodiversity conservation across the range of sub-regions.
6. Proportion of marine bioregions with marine conservation reserves
2009–10 2010–11 2011–12 2012–13Target 42.1% 47.3% 63.2% 57.9%
Actual 42.1% 42.1% 47.4% 52.6%
Note to indicator: The coastal waters of Western Australia have been divided into marine bioregions – regions with similar biogeographical characteristics. The indicator seeks to achieveconservation reserves in each marine bioregion to achieve a representative marine conservation reserve system. The increase from the prior year is because the Eighty Mile Beach Marine Park was gazetted in a new marine bioregion. The decrease from the Target value is because the Roebuck Bay Marine Park was not gazetted during the year as was anticipated.
7. Percentage of Forest Management Plan performance indicators where defined annual targets are met
DEC aims to achieve a high level of compliance with standards for management of forests.
2009–10 2010–11 2011–12 2012–13Target 75% 78% 81% 78%
Actual 80% 73% 75% 70%
Note to indicator: The Effectiveness Indicator is derived by determining the degree to which selected key performance indicators in the Forest Management Plan 2004–2013 (FMP) achieved the related performance target, where data is made available from relevant custodians. The KPIs are intended to be a true measure of the SFM service as they have been selected from each of the modified Montreal Criteria used to develop the FMP. The Effectiveness Indicator percentage is derived by:
Sum of measures calculated from nominated KPIs = X
Total number of KPIs = Y
(X / Y) x 100 = Effectiveness Indicator (n%)
KEY PERFORMANCE INDICATORS

DEPARTMENT OF ENVIRONMENT AND CONSERVATION 2012–13 ANNUAL REPORT118
Outcome: Community enjoyment of park facilities and services, wildlife and the natural environment displayed in parks
1. Average level of visitor satisfaction with their visit
The average level of customer satisfaction with their visit is a key indicator of the department’s effectiveness in delivering parks and other natural areas that allow the community to understand, enjoy and appreciate the natural environment. Visitor satisfaction levels are consistently high.
2009–10 2010–11 2011–12 2012–13
Target 85.0% 85.0% 85.0% 85.0%
Actual 87.2% 86.8% 88.8% 88.0%
Note to indicator: A benchmark visitor satisfaction index has been adopted to compare visitor satisfaction levels each year. The index is averaged from visitor responses (n=623 in 2012–13) to the statewide visitor survey conducted at selected parks, reserves and forest areas around the state. Surveys are distributed on-site by a DEC officer or volunteer at major recreation areas within parks such as picnic areas and campgrounds. The target population are members of the general public who visit DEC-managed land and waters of a park or protected area for purposes mandated for the area. The average level of visitor satisfaction is based upon the average response of two survey questions: (1) ‘How would you rate your visit overall’? and (2) ‘How did you feel about your visit today’?
2. Park visitation (annual number of visits)
2009–10 2010–11 2011–12 2012–13Target 13,340,000 15,422,000 16,085,146 16,500,581
Actual 14,619,171 15,418,169 15,649,385 16,015,890
Note to indicator: Visitor use was monitored at 646 sites using a variety of methods including traffic classifier (43.4% of visits), traffic counters (0.2% of visits), pedestrian counters (0.8% of visits), ticket sales (1% of visits) and informed estimates (54.7% of visits). Informed estimates are generally only considered acceptable for sites where a detailed annual survey has recently been performed or for sites of presumed low visitation where the region has determined that there are insufficient resources available for more accurate estimates supplemented by technological means. Where detailed surveys have not been recently performed, informed estimations are provided by regional staff such as rangers with experience in the area.
For traffic classifiers/counters, the number of vehicles returned by the device is multiplied up by an average number of visitors per vehicle passing that point. Cars are estimated to have from 2.18 to 3.7 (average 2.57) passengers per vehicle and buses are estimated to have from 1 to 35 (average 12.41) passengers per vehicle. The passengers per vehicle number will vary from site to site depending on calibration studies conducted for a site. In the absence of a calibration study the state average of 2.72 is used.
Annual park visitation figures come from a live database system, and as such may be subject to change if errors are identified and improvements/corrections are made to figures for earlier reporting periods.
KEY PERFORMANCE INDICATORS

119DEPARTMENT OF ENVIRONMENT AND CONSERVATION 2012–13 ANNUAL REPORT 119
3. Annual percentage change in park visitation
2009–10 2010–11 2011–12 2012–13Target 2.7% 4.3% 4.3% 2.6%
Actual 5.7% 5.5% 1.5% 2.3%
Note to indicator: The target is calculated utilising best available trending data for selected parks(vehicle counters/ticketing/pedestrian counters) at the time of the estimate request. This visitation estimate target predicted a 2.6% increase. Budgeting forward estimates are based on the estimated actual of the previous year, determined after reviewing population growth trends and tourism projections. The final visitation figure increase of 2.3% is in line with the Tourism Research Australian Quarterly snapshot. There is a continuing trend of Western Australians (our largest market) travelling out of the country to Indonesia, Thailand, Singapore and Malaysia. There have also been declines in the holiday/leisure segment for international travellers into Western Australia.
Outcome: Emissions and discharges meet acceptable criteria
1. Number of exceedances of approved environment criteria by regulated activities
The number of exceedances of approved environment criteria is a key indicator of the department’s effectiveness in setting and monitoring environmental standards.
2009–10 2010–11 2011–12 2012–13Target 60 50 38 38
Actual 30 33 37 21
Note to indicator: There has been an increase in the level of departmental compliance activityover the last two years, increasing the potential for non-compliance to be detected and also for increased industry recognition of the need for compliance. The small variation in actual numbers in the years up to 2012 is not significant. It is noted however, that 2012–13 figures show a considerable improvement from previous years, showing that industry continues to improve its environmental performance. This may in part relate to DEC’s increased compliance activity.
2. Number of air National Environment Protection Measure (NEPM) exceedances per annum of criteria pollutants
Monitoring of air quality against criteria pollutants enables: assessment of compliance with NEPM standards and goals set to protect human health, evaluation of the effectiveness of long term air quality management strategies and tools, and evaluation of the effectiveness of industry emission controls and management strategies.
2009–10 2010–11 2011–12 2012–13Target 20 24 35 35
Actual 25 14 32 11
Note to indicator: It is not possible to associate any trends in the above figures as they are heavily influenced by unpredictable natural events and meteorological conditions. There were less smoke events detected at the NEPM ambient air monitoring network sites in 2012–13 than in the previous year 2011–12.
KEY PERFORMANCE INDICATORS
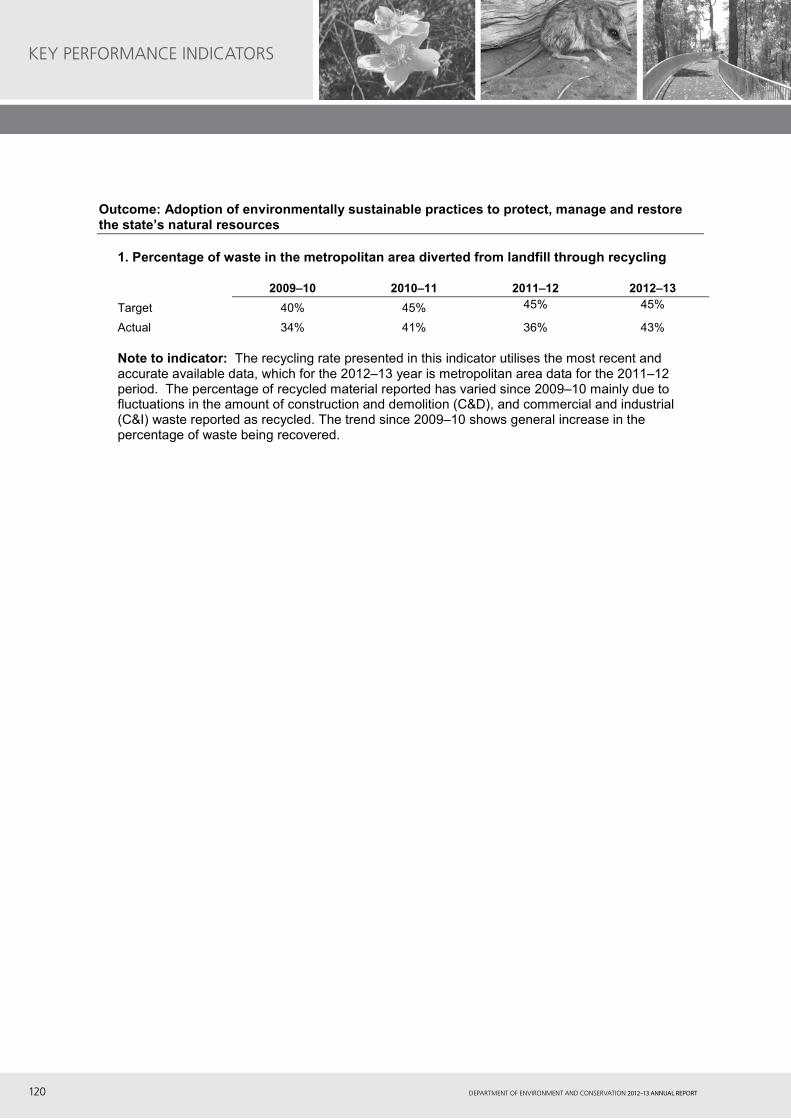
DEPARTMENT OF ENVIRONMENT AND CONSERVATION 2012–13 ANNUAL REPORT120
Outcome: Adoption of environmentally sustainable practices to protect, manage and restore the state’s natural resources
1. Percentage of waste in the metropolitan area diverted from landfill through recycling
2009–10 2010–11 2011–12 2012–13Target 40% 45% 45% 45%
Actual 34% 41% 36% 43%
Note to indicator: The recycling rate presented in this indicator utilises the most recent and accurate available data, which for the 2012–13 year is metropolitan area data for the 2011–12period. The percentage of recycled material reported has varied since 2009–10 mainly due to fluctuations in the amount of construction and demolition (C&D), and commercial and industrial (C&I) waste reported as recycled. The trend since 2009–10 shows general increase in the percentage of waste being recovered.
KEY PERFORMANCE INDICATORS
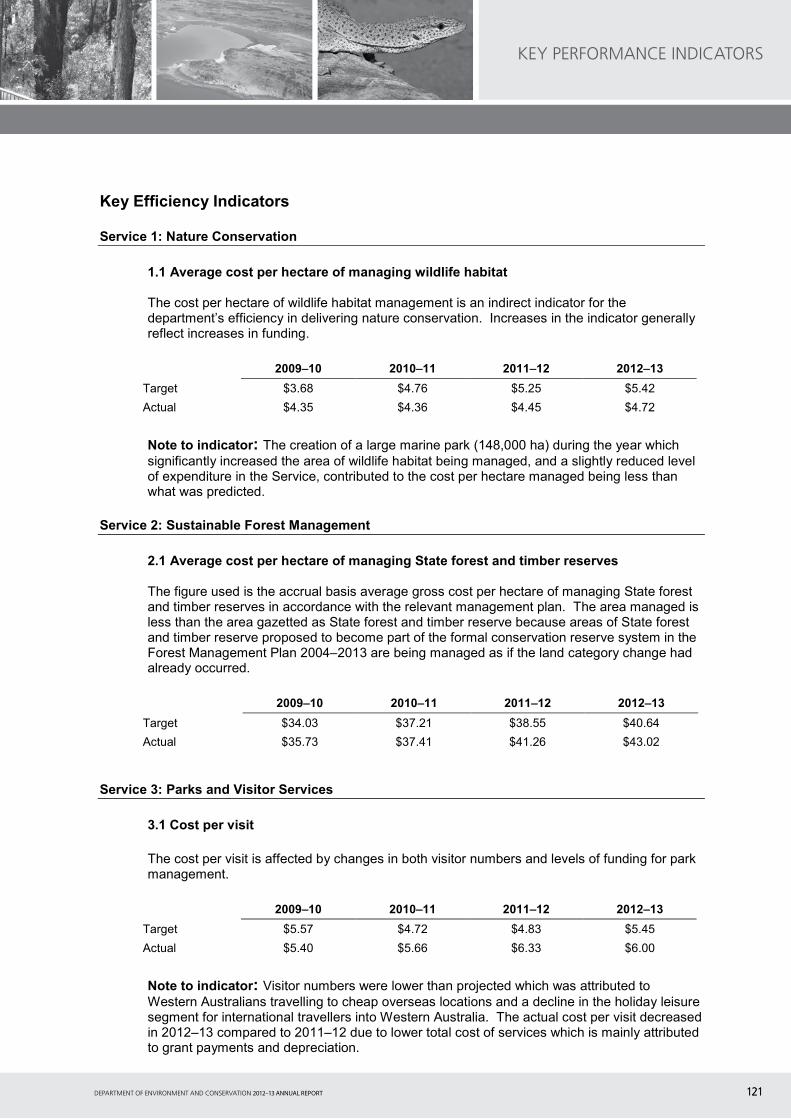
121DEPARTMENT OF ENVIRONMENT AND CONSERVATION 2012–13 ANNUAL REPORT 121
Key Efficiency Indicators
Service 1: Nature Conservation
1.1 Average cost per hectare of managing wildlife habitat
The cost per hectare of wildlife habitat management is an indirect indicator for the department’s efficiency in delivering nature conservation. Increases in the indicator generally reflect increases in funding.
2009–10 2010–11 2011–12 2012–13Target $3.68 $4.76 $5.25 $5.42
Actual $4.35 $4.36 $4.45 $4.72
Note to indicator: The creation of a large marine park (148,000 ha) during the year which significantly increased the area of wildlife habitat being managed, and a slightly reduced level of expenditure in the Service, contributed to the cost per hectare managed being less than what was predicted.
Service 2: Sustainable Forest Management
2.1 Average cost per hectare of managing State forest and timber reserves
The figure used is the accrual basis average gross cost per hectare of managing State forest and timber reserves in accordance with the relevant management plan. The area managed is less than the area gazetted as State forest and timber reserve because areas of State forest and timber reserve proposed to become part of the formal conservation reserve system in the Forest Management Plan 2004–2013 are being managed as if the land category change had already occurred.
2009–10 2010–11 2011–12 2012–13Target $34.03 $37.21 $38.55 $40.64
Actual $35.73 $37.41 $41.26 $43.02
Service 3: Parks and Visitor Services
3.1 Cost per visit
The cost per visit is affected by changes in both visitor numbers and levels of funding for park management.
2009–10 2010–11 2011–12 2012–13Target $5.57 $4.72 $4.83 $5.45
Actual $5.40 $5.66 $6.33 $6.00
Note to indicator: Visitor numbers were lower than projected which was attributed to Western Australians travelling to cheap overseas locations and a decline in the holiday leisure segment for international travellers into Western Australia. The actual cost per visit decreased in 2012–13 compared to 2011–12 due to lower total cost of services which is mainly attributed to grant payments and depreciation.
KEY PERFORMANCE INDICATORS

DEPARTMENT OF ENVIRONMENT AND CONSERVATION 2012–13 ANNUAL REPORT122
Service 4: Environmental Regulation
4.1 Average cost per air monitoring station
The average cost per air monitoring station is affected by the air quality programs and additional air quality monitoring completed during the year. Targeted air quality monitoring for specialised pollutants increases the average cost per air monitoring station.
2009–10 2010–11 2011–12 2012–13Target $383,167 $363,288 $478,338 $491,869
Actual $418,500 $441,585 $510,504 $531,319
4.2 Average cost per industry licence
DEC assesses applications for works approvals and licences under Part V of the Environmental Protection Act 1986, undertakes compliance and inspection activities of those premises and takes enforcement action in accordance with its Enforcement and Prosecutions Policy 2008. The total cost of these services together with supporting functions and corporate overheads is then compared to the number of active licences at the end of the financial year to produce a cost of service per industry licence. This cost can be compared across time.
2009–10 2010–11 2011–12 2012–13Target $16,208 $15,691 $23,971 $28,031
Actual $23,638 $26,657 $27,040 $28,954
Note to indicator: The actual cost per licence was almost the same as the predicted target cost. Increased compliance and inspection activities together with regulatory reforms being undertaken has contributed to a small increase in costs for this year marginally higher than actual salary costs.
4.3 Average cost per contaminated site assessment
This indicator is affected by the number of contaminated site assessments carried out each year.
2009–10 2010–11 2011–12 2012–13Target $14,574 $9,002 $5,051 $5,834
Actual $6,011 $8,297 $6,797 $6,922
Note to indicator: The number of contaminated site assessments carried out each year varies according to the complexity of the contamination issues, with more complex sites taking longer to assess.
KEY PERFORMANCE INDICATORS

123DEPARTMENT OF ENVIRONMENT AND CONSERVATION 2012–13 ANNUAL REPORT 123
4.4 Average cost of remediating state sites
This indicator reflects average costs in remediating state sites. Costs can be affected by a range of variables but mainly reflect the number of sites, the nature and extent of contamination and the consequent costs of investigation and remediation.
2009–10 2010–11 2011–12 2012–13Target $795,417 $1,063,728 $496,035 $580,286
Actual $626,000 $164,182 $705,891 $104,630
Note to indicator: Funding from the Contaminated Sites Management Account was transferred for six state sites in 2012–13, generally to carry out small scale site investigations. The average cost was lower than the target as slower progress than anticipated on the remediation of the former Waste Control site, Bellevue meant that additional funds were notrequired for this project.
Service 5: Environmental Sustainability and Climate Change
5.1 Cost of administering Waste Avoidance and Resource Recovery Account as a percentage of total funds
The Waste Avoidance and Resource Recovery Account includes programs which provide grants to a range of waste reduction and recycling activities. Managing the administration costs associated with the fund is important so as to ensure that maximum levels of funding are available for waste reduction and recycling initiatives. This indicator measures the cost of administering the WARR legislation as a percentage of the total expenditure.
2009–10 2010–11 2011–12 2012–13Target 5.0% 6.0% 6.0% 9.0%
Actual 6.1% 6.0% 8.0% 10.0%
Note to indicator: The increase in 2011–12 of 2% was due to a higher administration cost with the introduction of a new functionality in administering the levy and an unexpected lower total expenditure than the budget estimate.
In the same way, the increase of 1% in 2012–13 was due in higher administration cost due to an increase in compliance staffing levels and associated equipment and an unexpected lower total expenditure than the budget estimate.
5.2 Cost of administering Low Emissions Energy Development fund as a percentage of total funds
The Low Emissions Energy Development fund supports innovative technology projects at the commercial demonstration, commercialisation and local adaptation stages. Decisions on funded projects are made jointly by the Ministers for Environment and Energy.
2009–10 2010–11 2011–12 2012–13Target 0.41% 0.48% 0.52% 0.66%
Actual 0.49% 0.52% 0.58% 0.49%
Note to indicator: The 2012–13 actual is less than the target as no new funding round was held, so costs were lower.
KEY PERFORMANCE INDICATORS

DEPARTMENT OF ENVIRONMENT AND CONSERVATION 2012–13 ANNUAL REPORT124
MINISTERIAL DIRECTIVES
No Ministerial directives were received during the financial year.
MINISTERIAL DIRECTIVES

125DEPARTMENT OF ENVIRONMENT AND CONSERVATION 2012–13 ANNUAL REPORT 125
Pricing policies The department is largely funded by appropriations; however, fees are charged for a range of goods, services and licensing arrangements on a full or partial cost recovery basis. Fees and charges are determined in accordance with Costing and Pricing Government Services: Guidelines for Use by Agencies in the Western Australian Public Sectors published by Treasury. Fees are reviewed annually.
Capital works: incomplete and completedThe department’s planned capital works program of $24.716 million for 2012–13 provided funds for buildings, tourism roads and park facilities, plant and equipment, conservation estate land purchase and firefighting fleet replacement.
Summary of major capital works 2012–13
DETAILS OF MAJOR CAPITAL PROJECTS UNDERTAKEN
WORKS IN PROGRESSExpected
Year of Completion
Estimated Expenditure
Remaining $’000
Estimated Total Project Cost
$’000
Camden Sound and Eighty Mile Beach marine parks 2013–14 720 740
Conservation parks infrastructure and roads 2013–14 12,489 20,000
Kimberley Science and Conservation Strategy tourism initiatives
2013–14 2,437 3,115
RECURRING CAPITAL PROGRAMSExpected
Year of Completion
2012–13 Expenditure
$’000
Conservation land acquisition Ongoing 4,492
Firefighting fleet and equipment Ongoing 4,301
Plant and equipment purchase and replacement Ongoing 3,072
Tourism road improvements Ongoing 967
Parks improvement program Ongoing 8,497
Employment and industrial relationsStaff profile
2012–13 2011–12
Full-time permanent 1,353 1,335
Full-time contract 298 310
Part-time measured on a FTE basis 282 268
On secondment 6 11
Total 1,939 1,924
OTHER FINANCIAL DISCLOSURES
OTHER FINANCIAL DISCLOSURES

DEPARTMENT OF ENVIRONMENT AND CONSERVATION 2012–13 ANNUAL REPORT126
Industrial relations
The People Services Branch provides strategic industrial relations advice, manages employee relations issues and represents the department in industrial relations tribunals. The focus for 2012–13 was to negotiate replacement agreements for rangers and conservation employees with their respective unions and to continue to educate staff on the terms of the award and agreements and the responsibilities of being a public sector employee.
Workforce planning
DEC’s Equity and diversity management plan 2011–14 has been integrated as an addendum into DEC’s Workforce plan 2011–14, to form DEC’s Workforce and diversity plan 2011–14. This plan sets the agenda for meeting current and future workforce needs. It outlines strategies to attract, retain and engage appropriately skilled and diverse staff, plan succession in key areas and provide ongoing development and motivational opportunities.
Developing management and leadership skills is a key strategy in DEC’s Workforce and diversity plan 2011–14. The strategy has been implemented, with 24 participants starting the Executive Leadership program in 2013, 24 participants starting the Aspiring Leaders program for middle managers, and 97 participants completing the three-day Effective Supervision Skills course for new supervisors during 2012–13.
Twelve employees were awarded scholarships for further tertiary studies or development opportunities in 2013. Scholarships are awarded under the categories of women, leadership, science and career development.
DEC sponsored one Aboriginal student in tertiary studies, and work experience placements with DEC during university breaks were arranged. Aboriginal cadetships were funded in partnership with the Department of Education, Employment and Workplace Relations as part of a federal government initiative to improve the professional employment prospects of Aboriginal people.
In December 2012, 11 graduates completed a 12-month Graduate development program with DEC. The Certificate IV in Government qualification formed the basis for this program, which was developed in response to a comprehensive review undertaken in 2010.
Staff development
During 2012–13, a range of internal and external short courses as well as nationally accredited training programs were provided to staff across the state.
DEC is a Registered Training Organisation, and in 2012–13 more than 500 Statements of Attainment were issued and more than 100 staff graduated from a range of accredited qualifications in Conservation and Land Management, Frontline Management, and Government (Statutory Compliance and Investigations).
Conservation and Land Management qualifications have been tailored to suit the needs of DEC’s conservation employees through the Pathways program; this includes offering specialist streams in Parks and Visitor Services/Ranger, Crew Leader/Overseer, Nature Conservation and Sustainable Forest Management. The program focuses on developing and maintaining a sustainable and effective conservation employee workforce.
DEC supports Aboriginal trainees through the Mentored Aboriginal Training and Employment Scheme (MATES) program. The MATES program has a strong focus on joint management agreements, with many trainees participating as part of wider joint management agreements between DEC and Aboriginal Corporations and community groups.
OTHER FINANCIAL DISCLOSURES

127DEPARTMENT OF ENVIRONMENT AND CONSERVATION 2012–13 ANNUAL REPORT 127
DEC has training partnerships with the following organisations:
• Chamber of Commerce and Industry Employfast
• Department of Training and Workforce Development
• Miriuwung Gajerrong Corporation
• Cliffs Asia Pacific Iron Ore Pty Ltd
• Yawuru Native Title Holders Aboriginal Corporation RNTBC
• BHP Billiton.
During a 36-month period, each trainee undertakes Certificate II and III in Conservation and Land Management. Trainees are supported on an operational level by local work centre supervisors, managers and workplace assessors in achieving study and work performance goals that assist their career development.
Within and across DEC’s five service areas, training is provided as required to support changes in operations, processes or computer software and to cater for the specific needs of staff in particular roles. Major ongoing programs include:
• Regulatory training. This program provides a competency-based training framework through the Certificate IV in Government (Statutory Compliance) and Certificate IV in Government (Investigations) for environmental enforcement and investigation officers. It allows officers employed in a regulatory capacity to ensure statutory compliance with the requirements of the legislation, regulations and policies administered.
• Bushfire training and development. During 2012–13, 44 formal fire training courses involving 551 participants were conducted by DEC across the state. Course participants were predominantly from DEC, including campground host volunteers, but also included personnel from the Forest Products Commission, DFES and local governments. Aviation Section staff provided training for 118 DEC aerial operations personnel. These courses included: Air Attack Supervisor, Qualification, Air Attack Supervisor Currency, Air Observer, Helitorch Ground Crew, Incendiary Operations Supervisor and Aerial Incendiary Bombardier.
During 2012–13 additional bushfire training, focusing on safety and protection, was provided in response to a WorkSafe Accident Investigation. Details about this training can be found on page 136 in the Occupational safety, health and injury management section of this report.
Workers’ compensation
The department recognises that there is a direct relationship between occupational safety and health and workers’ compensation and injury management. If there is an increase in the number or severity of incidents then there are increased costs. Equally relevant is the strong link between a safe and healthy workplace and performance. Although the major objective is caring for employees and looking after their safety and health, there is a return on investment in implementing an effective workers’ compensation and injury management system and related procedures to minimise insurance premium and associated costs.
In 2012–13, DEC’s workers’ compensation contribution was $1,421,693 compared with $1,054,038 for the previous year. The number of lost time injuries in 2012–13 was 37 (up from 26 in 2011–12), with 49 medical treatment injuries (down from 68 in 2011–12).
OTHER FINANCIAL DISCLOSURES

DEPARTMENT OF ENVIRONMENT AND CONSERVATION 2012–13 ANNUAL REPORT128
GOVERNANCE DISCLOSURES
GOVERNANCE DISCLOSURES
Contracts with senior officersAt the date of reporting, senior officers of the department held no contracts with the department other than normal employment contracts. No senior officers of the department had substantial interests in entities with existing or proposed contracts or agreements with the department.
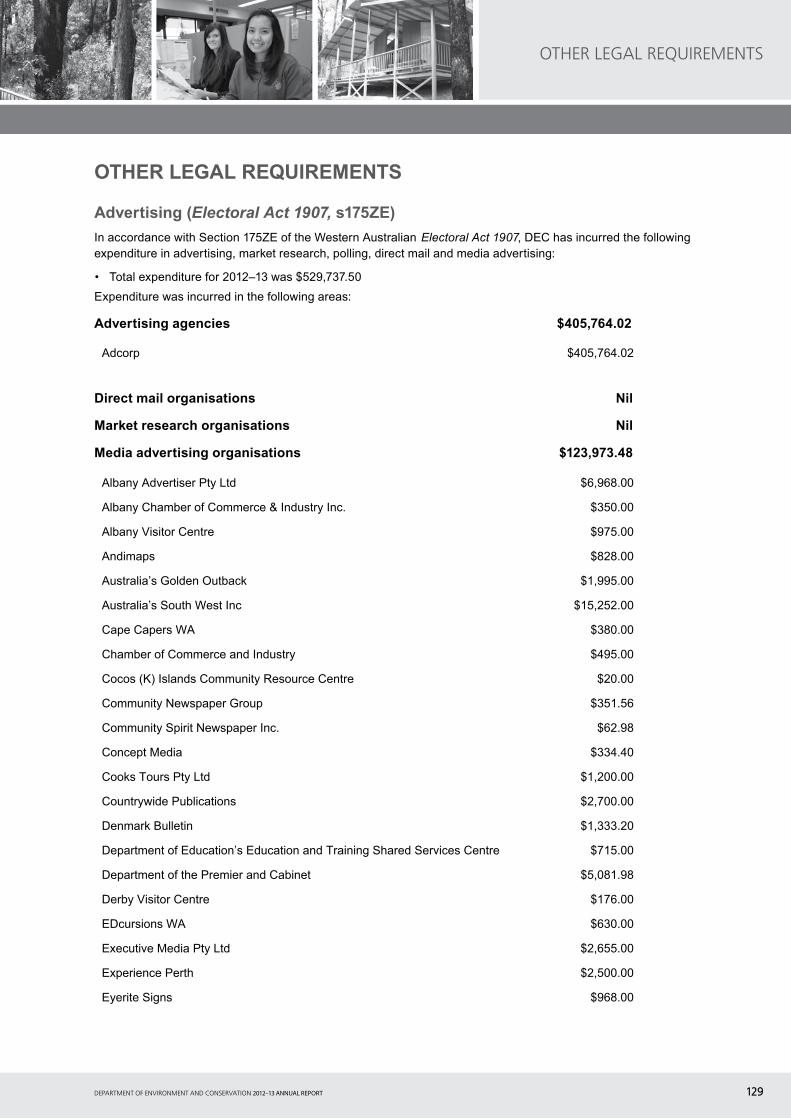
129DEPARTMENT OF ENVIRONMENT AND CONSERVATION 2012–13 ANNUAL REPORT 129
OTHER LEGAL REQUIREMENTS
Advertising (Electoral Act 1907, s175ZE)In accordance with Section 175ZE of the Western Australian Electoral Act 1907, DEC has incurred the following expenditure in advertising, market research, polling, direct mail and media advertising:
• Total expenditure for 2012–13 was $529,737.50
Expenditure was incurred in the following areas:
Advertising agencies $405,764.02
Adcorp $405,764.02
Direct mail organisations Nil
Market research organisations Nil
Media advertising organisations $123,973.48
Albany Advertiser Pty Ltd $6,968.00
Albany Chamber of Commerce & Industry Inc. $350.00
Albany Visitor Centre $975.00
Andimaps $828.00
Australia’s Golden Outback $1,995.00
Australia’s South West Inc $15,252.00
Cape Capers WA $380.00
Chamber of Commerce and Industry $495.00
Cocos (K) Islands Community Resource Centre $20.00
Community Newspaper Group $351.56
Community Spirit Newspaper Inc. $62.98
Concept Media $334.40
Cooks Tours Pty Ltd $1,200.00
Countrywide Publications $2,700.00
Denmark Bulletin $1,333.20
Department of Education’s Education and Training Shared Services Centre $715.00
Department of the Premier and Cabinet $5,081.98
Derby Visitor Centre $176.00
EDcursions WA $630.00
Executive Media Pty Ltd $2,655.00
Experience Perth $2,500.00
Eyerite Signs $968.00
OTHER LEGAL REQUIREMENTS

DEPARTMENT OF ENVIRONMENT AND CONSERVATION 2012–13 ANNUAL REPORT130
OTHER LEGAL REQUIREMENTS
Eyezon Pty Ltd $5,333.00
Jack in the Box $451.00
Kids in Perth $484.00
Kununurra District High School $880.00
Kununurra Visitor Centre $600.00
LetsGoKids Pty Ltd $528.00
Lizart Production $735.00
Margaret River Visitor Centre $970.00
Marsh Agencies Pty Ltd $2,283.00
Optimum Media Decision (WA) Ltd $26,411.12
Penguin Island Cruises PTD Ltd $8,413.41
Pre-emptive Strike Pty $165.00
Shire of Christmas Island $690.80
South West Printing & Publishing $243.00
Southern Metropolitan Regional Council $660.00
State Law Publisher $9,647.53
The West Australian, West Australian Newspapers Ltd $10,000.00
Touring Australia $1,879.50
Travelwest Publications $2,497.00
Turquoise Coast Tourism $1,347.50
Walpole Community Resource Centre $489.00
Walsh Media $3,294.50
Polling organisations Nil
Disability access and inclusion plan outcomes (Disability Services Act 1993, s29) DEC is committed to ongoing improvements in making the department an accessible and inclusive environment for its staff and the public it serves, and continues to be a leading proponent of universal access, which is based on the principles of equal opportunity and equity, and access and inclusion.
The department’s policy is to ensure that everyone in the community can access, use and enjoy Western Australia’s natural areas and the associated facilities, services and programs provided by the department.
DEC has a process for lodging complaints that is accessible for people with disability. DEC also ensures that consultations with the public are held in an accessible manner.
Under the department’s Disability Access and Inclusion Plan (DAIP) 2012–2017, DEC continues to improve access to facilities and services to ensure they meet the needs of the public and staff, with participatory inclusion being the primary and ongoing aim.

131DEPARTMENT OF ENVIRONMENT AND CONSERVATION 2012–13 ANNUAL REPORT 131
The plan is monitored by the Disability Access and Inclusion Committee, which meets biannually. Committee members include representatives from five divisions and two Corporate Executive representatives.
As a major provider of outdoor recreation locations and facilities in natural areas, DEC continues to ensure that all site plans consider access requirements and are developed in accordance with DEC’s Policy 18 (Recreation, Tourism and Visitor Services).
During 2012–13, there were a number of noteworthy works in progress or completed by the department to improve access to visitor facilities:
• In Mirima National Park, a new boardwalk with interpretation was completed, providing an accessible trail.
• In Karijini National Park, the redevelopment of Hamersley Gorge day-use area was completed, providing better parking, accessible toilets and an easily accessible lookout over the spectacular gorge.
• New day-use facilities were completed at Hangover Bay in Nambung National Park. These include accessible toilets, interpretation, picnic areas, shade shelters, lookouts over the ocean and paths to the beach.
• Work started on the redevelopment of Martins Tank campground in Yalgorup National Park to improve access to camp sites, toilets, paths and camp kitchens.
• Baden Powell campground in Lane Poole Reserve near Dwellingup was completed, with new camp sites, toilets, walk trails and camp kitchens.
• On the South Coast, work continued on improvements to recreation sites in the Fitzgerald River National Park. Recreation sites on the east side of the park are being progressively upgraded with new parking areas, picnic facilities, interpretation and lookouts. The Four Mile campground was completed and has better access to camp sites, toilets, picnic facilities and the beach. Design was completed for upgrading Point Ann on the western side of the park with better access to the beach, interpretation and picnic facilities.
• A new picnic shelter was completed at Lake Jasper in D’Entrecasteaux National Park, with better path access to the lake.
• Planning was started for the replacement of lookouts at The Gap and Natural Bridge in Torndirrup National Park to enable visitors with disabilities to experience the impressive ocean and coastal views.
Additional key initiatives and achievements from the DAIP include:
• promoting the use of the Disability Services Commission’s Creating Accessible Events checklist, which has been incorporated in DEC’s events planning process
• funding of access improvements for employees and volunteers with disability. In particular:
• access to the Warren Region building was improved, with paving and steps replaced by a ramp
• a bathroom was added to a unit in Frankland district for an employee who had been injured at work
• a footpath from the car park to the office entrance was repaired in Moora district, allowing for improved access
• three wheelchair ramps and soft-closers on doors improved access for staff and visitors in the Pilbara region
• a ramp was installed at the Perth Hills Discovery Centre to assist an employee and volunteers who required improved access to the building
• selection panel training for staff interviewing people with disabilities
• meeting contemporary good practice and government guidelines for website accessibility and making documents available in other formats on request
• affiliation to the Companion Card Program
• disseminating the Disability (Access to Premises—Buildings) Standards 2010 for incorporation in the planning of all premises and building.
OTHER LEGAL REQUIREMENTS
DEPARTMENT OF ENVIRONMENT AND CONSERVATION 2012–13 ANNUAL REPORT132
Compliance statementsPublic Sector Commission reporting under s31 of the Public Sector Management Act 1994 for 2012–13.
Compliance issue Significant action taken to monitor and ensure compliance
Public sector standards
Five breach claims were lodged in 2012–13. All breach claims were against the Employment Standard. Two of the claims were withdrawn. Three of the claims were referred to the Public Sector Commission (PSC); however, no breach of standard was found by the PSC for two of them. The third is still under consideration by the PSC.
• The department’s People Services Branch intranet site has information on the Public Sector Standards including a hyperlink to the Public Sector Commission’s website.
• Ongoing training is provided to grievance officers and made available to officers required to participate on recruitment panels to ensure that the relevant standard is complied with.
• Human Resources Awareness Raising refresher sessions have continued.
• Management Audit completed an internal audit of the department’s compliance with the Public Sector Standards and is of the view that, ‘The department is continuing to take appropriate action to ensure compliance with the Public Sector Standards’.
Code of Ethics
There were no reports of non-compliance with the Western Australian Code of Ethics.
• The Code of Ethics is contained within DEC’s Code of Conduct. The Code of Conduct was revised and released in April 2011, and includes a hyperlink to the PSC website for the Public Sector of Western Australia and its Code of Ethics.
Department’s Code of Conduct
Ten allegations raised in 2011–12 were carried into 2012–13 and finalised.
Eight allegations of breaches of the Code of Conduct were raised in 2012–13.
Five of the eight allegations raised in 2012–13 werefinalised in 2012–13.
Three alleged breaches have been carried over to2013–14.
• The department continues to hold Conflict of Interest, Code of Conduct, Accountable and Ethical Decision Making and Public Interest Disclosure awareness briefings for all staff.
OTHER LEGAL REQUIREMENTS
133DEPARTMENT OF ENVIRONMENT AND CONSERVATION 2012–13 ANNUAL REPORT 133
Recordkeeping plans (State Records Act 2000, s61, State Records Commission Standards)The department’s compliance with the State Records Act 2000 is supported by the Corporate Information Services (CIS) Branch within the Corporate Services Division.
Management of corporate documents and information is specified in the department’s recordkeeping plan, and mandatory records and document management training for employees is part of the induction process. In addition, further training is available to employees on request and is tailored to meet business unit needs.
Recordkeeping roles and responsibilities are also included in the department’s Code of Conduct and ethical and accountable decision-making training.
CIS regularly reviews the department’s recordkeeping policy and operational documents such as the department’s recordkeeping manual. The electronic document and records management system, Inf0Base, is deployed to all staff throughout the agency.
OTHER LEGAL REQUIREMENTS

DEPARTMENT OF ENVIRONMENT AND CONSERVATION 2012–13 ANNUAL REPORT134
GOVERNMENT POLICY REQUIREMENTS
Substantive equalityThe department implements the state government’s Policy Framework for Substantive Equality primarily through management planning processes associated with the Conservation and Land Management Act 1984.
Management plans cover a 10-year period over specific conservation areas, and must contain a statement of policies or proposed guidelines to be followed and a summary of the operations proposed to be undertaken in the area. Public participation in management planning is achieved through public and peak stakeholder meetings, formal advisory committees and community advisory committees, newsletters and broad public invitations to comment on draft plans.
The department has a longstanding practice of involving Aboriginal groups in managing conservation lands and waters in order to protect the value of the land to the culture and heritage of Aboriginal people. In 2012–13, DEC:
• strengthened partnerships with Aboriginal stakeholders including through Aboriginal employment and training opportunities
• progressed native title negotiations including the preparation and implementation of Indigenous Land Use Agreements in accordance with government priorities
• established joint management and customary activity frameworks
• liaised and consulted with Aboriginal organisations and people including park councils.
The department further ensures that:
• Cross-cultural training is routinely provided to DEC staff and updated regularly, and Aboriginal culture and multicultural values are promoted within the department by using Aboriginal names for parks, locations, meeting rooms and other installations.
• Welcome to Country is routinely part of DEC events and gatherings.
• Public participation facilitators are trained to be sensitive and responsive to the needs of age, gender, religion, cultural background and disability.
The department also seeks information on the cultural background of visitors to parks and recreation areas it manages to assist it in its efforts to provide for diverse needs and interests.
Occupational safety, health and injury managementThe department promotes a strong culture of workplace occupational safety and health (OSH). This commitment is shared across all levels of the agency to ensure the highest achievable performance.
DEC’s OSH policy, Policy Statement No. 60, requires managers to demonstrate, maintain, monitor and review OSH in the workplace and places a responsibility on employees to implement a cycle of continuous improvement.
The Director General and Corporate Executive are committed to providing, maintaining and promoting a safe working environment. To this end, DEC’s OSH committees, OSH representatives, directors, managers, supervisors and all employees are responsible for ensuring that DEC OSH policies, programs and procedures are followed.
Consultation with employees
The department recognises that continuous improvement of the OSH systems can only be achieved by consulting employees as part of a proactive approach.
The department’s OSH policy and procedures guide the consultation process, which is facilitated by DEC’s well-established network of OSH team leaders who focus on ensuring a safe and healthy work environment for all employees in their work centre.
GOVERNMENT POLICY REQUIREMENTS

135DEPARTMENT OF ENVIRONMENT AND CONSERVATION 2012–13 ANNUAL REPORT 135
DEC employees are encouraged to participate in the consultation process via interaction with OSH team leaders, health and safety representatives, managers, supervisors and the Risk Management Section. To ensure a best-practice approach towards OSH, this is an ongoing process. OSH committees meet quarterly and minutes are sent to the Director Regional Services and the Risk Management Section.
Formal consultation with employees on health and well-being matters was undertaken through a Health and Wellbeing Survey in December 2012. The survey was designed to provide insight into the health of employees, as well as identify priorities for each worksite. It also provided staff with an opportunity to influence future health and wellbeing initiatives.
The survey gathered information regarding the need for:
• policy development and review
• creating supportive work environments that are conducive to good health
• awareness and/or education
• programs and/or services.
The results and recommendations were used to develop a 12-month operational plan that aims to ensure that appropriate health and wellbeing initiatives are implemented.
Injury management
DEC is committed to providing best-practice injury management for its employees by complying with the requirements of the Workers’ Compensation and Injury Management Act 1981 and the Workers’ Compensation Code of Practice (Injury Management) 2005.
Together with effective OSH practices and health and wellbeing initiatives, DEC’s injury management system strives for an early return to work for employees who are medically fit to do so.
It is acknowledged that an effective injury management system benefits the employee through comprehensive assistance in times of injury, and DEC through potential reduction in insurance premiums and associated costs. An effective process has been established through the local management of employee’s injuries and liaison with the treating GP.
When required, external rehabilitation providers are appointed to further aid an employee’s recovery.
Assessment of the OSH management system
Following an external audit of DEC’s OSH systems, an internal annual audit process was implemented. Although the external audit found DEC to be compliant with the requirements of the Occupational Safety and Health Act 1984, the internal annual audit aims to review each work centre’s Work Health and Safety Management Plan in order to promote continuous improvement.
The internal audit framework is based on one developed by WorkSafe that enables work centres to rate their safety and health systems and directs attention to areas for improvement.
The framework provides a consistent approach across the department and aims to reduce injury, disability, lost productivity and workers’ compensation costs.
DEC is also committed to ensuring staff across the state are provided with appropriate, evidence-based health and well-being initiatives that encompass a whole-of-workplace approach where policy and the environment are considered alongside awareness and education.
GOVERNMENT POLICY REQUIREMENTS

DEPARTMENT OF ENVIRONMENT AND CONSERVATION 2012–13 ANNUAL REPORT136
Other initiatives in work health and safety
The department continued implementing initiatives to raise awareness of the importance of physical fitness, healthy eating and mental health, and through programs aimed at encouraging and assisting employees to adopt a healthy lifestyle.
DEC also continued, and expanded, wellbeing support available to employees through the Peer Support Program, Employee Assistance Program and by appointing a fulltime chaplain. DEC’s chaplaincy program is based on the successful model used in a number of other agencies and was developed following consultation with Western Australia Police, Department of Fire and Emergency Services and The Salvation Army. The chaplain supports staff in difficult times to help them regain a sense of normalcy.
DEC strongly supports the state government’s ‘One Life’ Suicide Prevention Strategy, a significant program that aims to prevent suicide and self-harm. It highlights the need to raise awareness and reduce the stigma associated with mental health issues leading to suicide. DEC made a silver pledge commitment to the program and Peer Supporter facilitators have received suicide prevention training, and staff awareness of the issue has been raised through messages and information.
In addition to the Peer Support network, DEC offers employees and members of their immediate family access to a professional counselling service through the Employee Assistance Program.
DEC has also created a working group to investigate critical-incident response, including undertaking a review of best practice in emergency management and staff welfare.
Prevention of injury and illness
On 12 October 2012, a burn-over during a bushfire in the South Coast Region resulted in the injury and tragic death of DEC firefighter Wendy Bearfoot, who was involved in the fire suppression effort. Three other DEC firefighters were injured during the same burn-over and received medical attention. One of these firefighters was severely injured and remained in hospital for several weeks and required ongoing treatment as a result of the burns she sustained. The subsequent WorkSafe investigation resulted in nine Improvement Notices being issued to DEC on 25 January 2013, and a further notice on 3 April 2013. The 10 notices were categorised into two main streams: crew protection and vehicle modifications, and training and information.
A crew protection and vehicle modifications working group has begun addressing matters covered by three of the notices. These notices cover the provision and storage of personal protective equipment (specifically fire blankets), and the installation of vehicle radiant heat shields and vehicle water spray/deluge systems. To date, the working group has engaged the help of national subject matter experts, delivered a workshop on 26 and 27 March to internal and external participants (including Australian Workers’ Union, Community and Public Sector Union/Civil Service Association and United Voice members and representatives), conducted a literature review and modified seven new trucks to trial the proposed modifications.
A training and information working group has begun addressing matters covered by the other seven notices. These matters include the provision of training for the correct use, storage and access to fire blankets; scenario-based training for burn-over or entrapment situations; interpreting spot weather forecasts; and operation of radio communications equipment. The notices also specified that DEC must provide information to frontline firefighters on wearing personal protective equipment and escape and fallback routes, and set up mechanisms for the timely distribution of critical information such as forecast wind changes.
GOVERNMENT POLICY REQUIREMENTS

137DEPARTMENT OF ENVIRONMENT AND CONSERVATION 2012–13 ANNUAL REPORT 137
The working group has trained more than 800 DEC staff in bushfire readiness, staying safe at fires and awareness of the ‘dead man zone’. Training in burn-over drills/exercises started in June 2013 and a standard for these drills has been developed for inclusion in pre-season briefings. Recording attendance at all fire management-related training events has been improved through collaboration with the Organisational Learning and Development section and integration of the records into the corporate VetTrack database system.
In May 2013, DEC participated in a coronial inquest held in response to the deaths of two people following a collision between a helicopter and a fixed-wing aircraft in the Kennedy Range National Park on 13 February 2008. The accident occurred during a goat culling operation. The Coroner made findings on aircraft separation, collision avoidance, lack of evasive action and fatigue management. DEC undertook to work with the Department of Agriculture and Food to address the Coroner’s recommendations, namely putting in place guidelines for aerial work covering feral animal culling to ensure a minimum 500 foot vertical buffer between spotter and shooter aircraft, in addition to any horizontal buffer; and ensuring there is ongoing consideration of the possible use of anti-collision systems.
Occupational safety and health performance indicators
MeasureActual results Results against target
2010–11 2012–13 Target Target achieved
Number of fatalities 0 1 0 No
Lost-time injury and/or disease incident rate
1.57 1.880 or 10% reduction
No
Lost-time injury and/or disease severity rate
3.22 13.510 or 10% reduction
No
Percentage of injured workers returned to work:
i) within 13 weeks
Not applicable
89% Greater than or equal to
80%
Yes
ii) within 26 weeks 100% 97% Yes
Percentage of managers trained in occupational safety, health and injury management responsibilities
>50% >80%
Greater than or equal to
80%
Yes
* In accordance with the Public Sector Commissioner’s Circular 2012-05
GOVERNMENT POLICY REQUIREMENTS

Cochlospermum
macnamarae, a Pilbara
shrub named in honour
of DEC’s Director
General, the late Keiran
McNamara. Photo: Daniel
Brassington/Western
Botanical
Munda Biddi Trail
opening. Photo: Terry
Goodlich/DEC
Western Australian
Conservation Science
Centre which houses
the Western Australian
Herbarium. Photo: Peter
Nicholas/DEC
Burrup Peninsula
landscape. Photo: Cliff
Winfield/DEC
Pat Collins. Photo: Peter
Nicholas/DEC
Bidgar Ngoulin camp site,
near Dwellingup, on the
Munda Biddi Trail.
An environmental officer
conducts an on-site
inspection.
Echidna (Tachyglossus
aculeatus) on the Burrup
Peninsula. Photo: Cliff
Winfield/DEC
Renee Phillips and Andita
Sugiatno. Photo: Peter
Nicholas/DEC
Aboriginal heritage and
liaison officers. Photo:
Peter Nicholas/DEC
Karri forest near Walpole.
Sundew (Drosera), the
winning entry in the
2012 Flora Conservation
Course Photo
Competition. Photo:
Janine Kuels
Duncraig Senior High
School bushranger
cadets Susanne Lee and
Charlie-Jane Williams.
Photo: Peter Nicholas/
DEC
Daisy Weir and Vincent
Cueva. Photo: Peter
Nicholas/DEC
Midline knob-tailed gecko
(Nephrurus vertebralis)
captured during a
biosurvey at Lorna Glen.
Photo: Judy Dunlop/DEC
Yawuru Rangers
and other DEC joint
management staff,
Roebuck Bay. Photo:
Darren Stevens/DEC
Environmental officers
conducting an on-site
inspection.
Valley of the Giants Tree
Top Walk.
Wilderness View Walk in
Mount Frankland National
Park. Photo: Tim Folely/
DEC
Boodie (Bettongia
lesueur) at a boodie
warren in Lorna Glen.
Photo: Judy Dunlop/DEC
Photographs on page headers, in order of appearance.
North-west Burrup
Peninsula beach. Photo:
Laurina Bullen/DEC
Sunny Ashar. Photo:
Peter Nicholas/DEC
Vincent Cueva. Photo:
Peter Nicholas/DEC
MATES trainees at work
in the Kimberley.
Amanda Klenke. Photo:
Peter Nicholas/DEC
Kultarr (Antechinomys
laniger), Lorna Glen.
Photo: July Dunlop/DEC
Burrup Peninsula
aerial view. Photo: Cliff
Winfield/DEC
Stripe-tailed pygmy
monitor (Varanus
caudolineatus). Photo:
July Dunlop/DEC
Glenn Urquhart. Photo:
Peter Nicholas/DEC
Yarri camp site, near
Collie, on the Munda
Biddi Trail.

20130151-0913-80