Embed Size (px)
Citation preview
Department of Electrical Engineering
Cullen College of Engineering
University of Houston
(NASA-CR-189537) SELF-ORGANIZATION VIAACTIVE EXPLORATION IN ROBOTIC APPLICATIONSFinal Report (Houston Univ.) 59 p CSCL 131
G3/37
N92-19289
Unc]as0075762
https://ntrs.nasa.gov/search.jsp?R=19920010047 2020-06-05T00:41:00+00:00Z
Self-organization via Active Explorationin Robotic Applications
jijti/z <?— V"Z-3F I N A L PROGRESS REPORT fwi f
submitted to NASA-JSC
byH. Ogmen. Principal Investigator
R. V. Prakash. Research Assistant
Department of Electrical Engineering
University of. Houston
Houston. TX 11204-4193 .
-February. 1991
Contents
1 Introduction 2
2 General principles 3
3 Reinforcement learning and habits for reinforcement filtering 4
3.1 Neurophysiological basis 4
3.2 Significance 8
3.3 Neural models 8
3.4 Modifications 13
3.5 Simulation Results 17
3.5.1 ART network 17
3.5.2 Reinforcement-habit network 17
4 Novelty and Reinforcement 21
4.1 Neurophysiological basis 21
4.2 Significance . 24
4.3 Neural models 24
4.4 Modifications 28
4.5 Simulation Results ' 34
4.5.1 Simulations on Gated Dipole • 34
4.5.2 Simulations on the new modified model 34
5 The combined model 38
5.1 Ambiguity in decision making 46
5.2 Combined neural model 46
5.3- Simulation Results- .... . . . ... . . . . . ... . -. ,.., . .*_....., ...... 5 2..
6 Conclusion- 54
1 Introduction
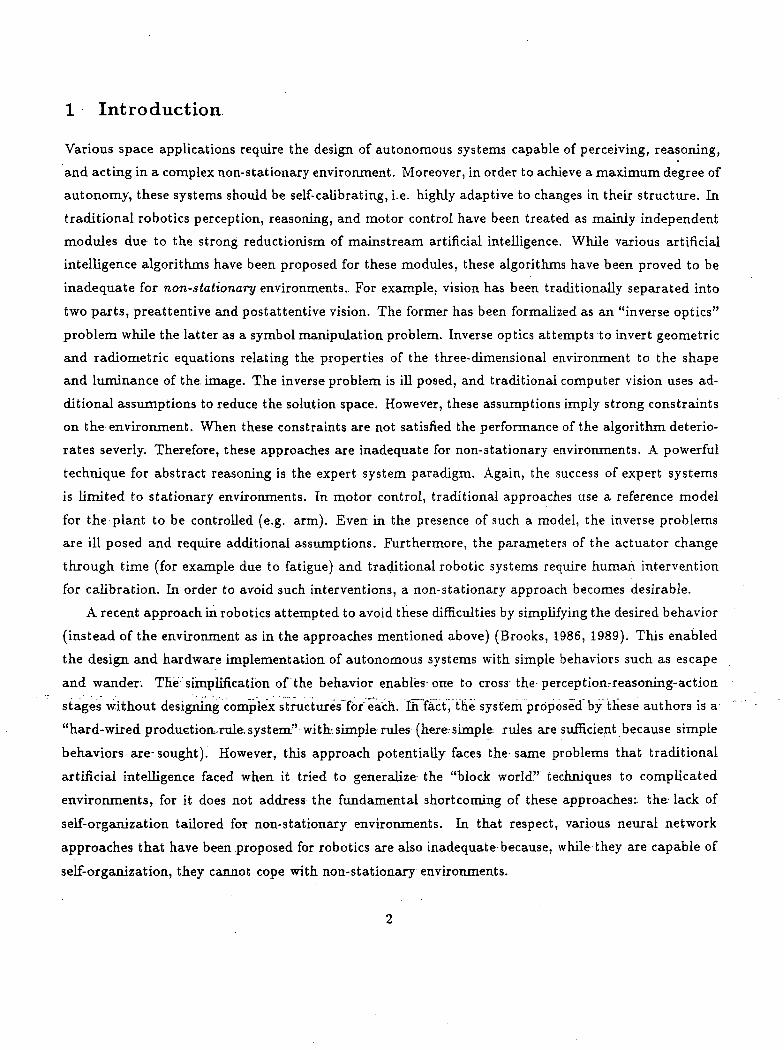
Various space applications require the design of autonomous systems capable of perceiving, reasoning,
and acting in a complex non-stationary environment. Moreover, in order to achieve a maximum degree of
autonomy, these systems should be self-calibrating, i.e. highly adaptive to changes in their structure. In
traditional robotics perception, reasoning, and motor control have been treated as mainly independent
modules due to the strong reductionism of mainstream artificial intelligence. While various artificial
intelligence algorithms have been proposed for these modules, these algorithms have been proved to be
inadequate for non-stationary environments. For example, vision has been traditionally separated into
two parts, preattentive and postattentive vision. The former has been formalized as an "inverse optics"
problem while the latter as a symbol manipulation problem. Inverse optics attempts to invert geometric
and radiometric equations relating the properties of the three-dimensional environment to the shape
and luminance of the. image. The inverse problem is ill posed, and traditional computer vision uses ad-
ditional assumptions to reduce the solution space. However, these assumptions imply strong constraints
on the environment. When these constraints are not satisfied the performance of the algorithm deterio-
rates severly. Therefore, these approaches are inadequate for non-stationary environments. A powerful
technique for abstract reasoning is the expert system paradigm. Again, the success of expert systems
is limited to stationary environments. In motor control, traditional approaches use a reference model
for the plant to be controlled (e.g. arm). Even in the presence of such a model, the inverse problems
are ill posed and require additional assumptions. Furthermore, the parameters of the actuator change
through time (for example due to fatigue) and traditional robotic systems require human intervention
for calibration. In order to avoid such interventions, a non-stationary approach becomes desirable.
A recent approach in robotics attempted to avoid these difficulties by simplifying the desired behavior
(instead of the environment as in the approaches mentioned above) (Brooks, 1986, 1989). This enabled
the design and hardware implementation of autonomous systems with simple behaviors such as escape
and wander. The simplification of the behavior enables-one to cross the perception-reasoning-action
stages without designing complex structures for each. In fact, the system proposed by these authors is a-
"hard-wired produetion,-rule. system" with: simple rules (here, simple rules are sufficient because simple
behaviors are-sought). However, this approach potentially faces the-same problems that traditional
artificial intelligence faced when it tried to generalize the "block world" techniques to complicated
environments, for it does not address the fundamental shortcoming of these approaches: the- lack of
self-organization tailored for non-stationary environments. In that respect, various neural network
approaches that have been proposed for robotics are also inadequate because, while they are capable of
self-organization, they cannot cope with non-stationary environments.
In this report, we describe a neural network robotic system designed to self-adapt in non-stationary
environments. As we will discuss, active exploration plays an essential role in our approach. This
steins from our conceptualization of intelligence as a process rather than a fact. Consequently, the
understanding and the emulation of intelligent behavior requires the characterization of its dynamics
rather than just its equilibria. This led us to study minimal systems with active exploratory capabilities.
The system has been implemented and tested in software. We also describe the details of various
implementations.
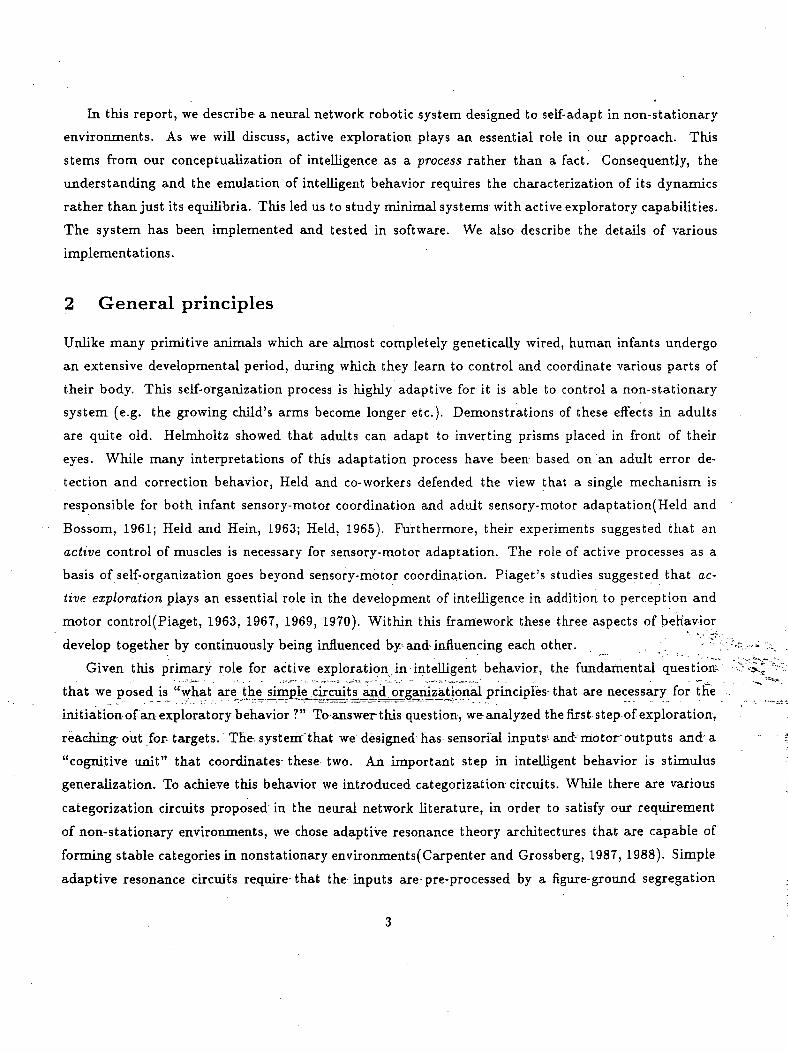
2 General principles
Unlike many primitive animals which are almost completely genetically wired, human infants undergo
an extensive developmental period, during which they learn to control and coordinate various parts of
their body. This self-organization process is highly adaptive for it is able to control a non-stationary
system (e.g. the growing child's arms become longer etc.). Demonstrations of these effects in adults
are quite old. Helmholtz showed that adults can adapt to inverting prisms placed in front of their
eyes. While many interpretations of this adaptation process have been based on an adult error de-
tection and correction behavior, Held and co-workers defended the view that a single mechanism is
responsible for both infant sensory-motor coordination and adult sensory-motor adaptation(Held and
Bossom, 1961; Held and Hein, 1963; Held, 1965). Furthermore, their experiments suggested that an
active control of muscles is necessary for sensory-motor adaptation. The role of active processes as a
basis of self-organization goes beyond sensory-motor coordination. Piaget's studies suggested that ac-
tive exploration plays an essential role in the development of intelligence in addition to perception and
motor control(Piaget, 1963, 1967, 1969, 1970). Within this framework these three aspects of behavior
develop together by continuously being influenced by-and-influencing each other. . . -• *; :
Given this primary role for active exploration in intelligent behavior, the fundamental question-
that we posed is "what are the simple .circuits and organizational principles-that are necessary for trie
initiation of an exploratory behavior ?." To answer this question, weanalyzed thefirst step of exploration,
reaching- out for- targets. The systenr that we designed has- sensorial inputs' andrmotor outputs andj a
"cognitive unit" that coordinates- these two. An important step in intelligent behavior is stimulus
generalization. To achieve this behavior we introduced categorization circuits. While there are various
categorization circuits proposed in the neural network literature, in order to satisfy our requirement
of non-stationary environments, we chose adaptive resonance theory architectures that are capable of
forming stable categories in nonstationary environments(Carpenter and Grossberg, 1987, 1988). Simple
adaptive resonance circuits require-that the inputs are pre-processed by a figure-ground segregation
network. To achieve a very simple figure-ground segregation, we introduced anon-homogeneous retina
consisting of a high resolution fovea and a periphery. The figure-ground segregation is achieved by
directing the fovea to parts of the image such that the-foveal signal is treated as figure and the peripheral
signal as ground. This in turn required that we introduce a circuit for controlling eye movements. The
basic circuit for eye movements should be flexible to operate under both sensorial and cognitive control
to allow an exploratory behavior that accommodates both sensorial and cognitive cues. For that task,
we modified some neural circuits proposed for optokinetik behavior in lower animals as the seed of the
eye movement system(0gmen and Gange 1990a, 1990b). An important characteristic of this circuit is its
sensitivity to novelty which is also crucial for exploration. In addition to sensitivity to spatial novelty, the
system should be able to recognize the novelty of abstract stimuli representations (categories). Another
important property for exploration is the success of behaviors. In simple developing systems the success
of behaviors are determined by reinforcement signals and thus the system should be capable of operant
conditioning. However like any signal in an uncontrolled environment, reinforcement signals can also be
noisy. In order to filter the transients in the reinforcement signals another property is required: habits.
In sum, a simple neural network should have stimulus generalization, novelty, reinforcement learning
and habit formation properties. Whether these properties are sufficient is the question we attempt to
answer by building and analyzing neural network architectures having these properties. The complete
systems contains various interacting sub-architectures. We will first start describing these architectures
and the modifications to each architecture for the needs of the present application. We will then present
the combined model that integrates these architectures into a global system. We finally conclude by
discussing future directions in this research.
3 Reinforcement learning and habits for reinforcement filtering
3.1 Neurophysiological basis
Assimilation and avoidance of a behavioris-higMy=correlated^w4th^reward^andpnjnisrnmen1rsignals^-Aiii=-
mals and humans generally tend to favor rewarding events to punishing ones. Moreover, in certain cases
the absence of reward could act as punishment and vice versa i.e., not receiving punishment can aet as
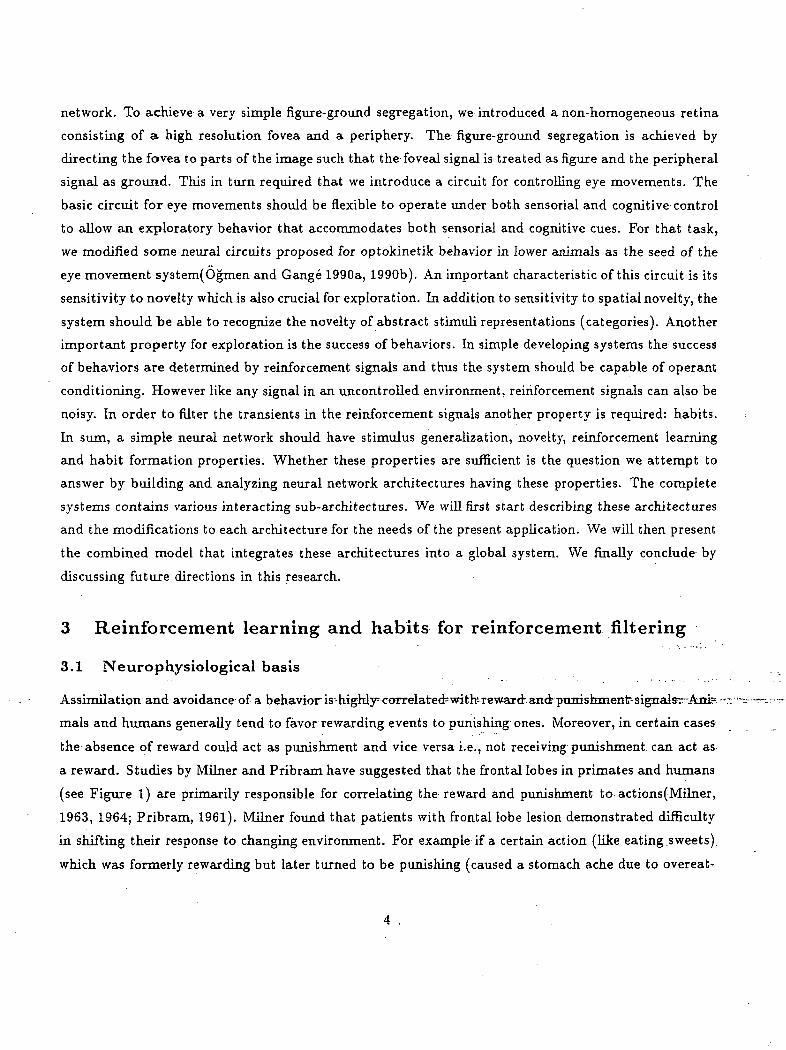
a reward. Studies by Milner and Pribram have suggested that the frontal lobes in primates and humans
(see Figure 1) are primarily responsible for correlating the reward and punishment to actions (Milner,
1963, 1964; Pribram, 1961). Milner found that patients with frontal lobe lesion demonstrated difficulty
in shifting their response to changing environment. For example-if a certain action (like eating .sweets),
which was formerly rewarding but later turned to be punishing (caused a stomach ache due to overeat-
4 .
Parietal Lobe
Occipital Lobe Jl
Cerebellum
Frontal Lobe
Temporal Lobe
Krairt Stem
Figure i: The human brain can be divided externally in to four lobes, the occipital lobe (responsible for
visual activity), the parietal lobe (responsible for abstract thinking e.g logic, math: etc.,),, the temporal
lobe (responsible for hearing and memory) and the frontal lobe (responsible for goal- directed behavior,,articulation of speech and control of discrete movement of the body).
Locus of lesion
Dorsolateral frontal
Control:
Orbitofrontal + temporal
Inferior frontal
Bilateral hippocampal
Posterior cortex
No. of
cases
25
7
1
1
60
Categories
achieved
1.372
4.9
6
4
4.52
Total
errors
75.44
27.6
13
48
32.96
Per-
severative-
56.932
12.0
4
11
16.64
Nonper-
severative
18.5
15.6
9
37
16:32
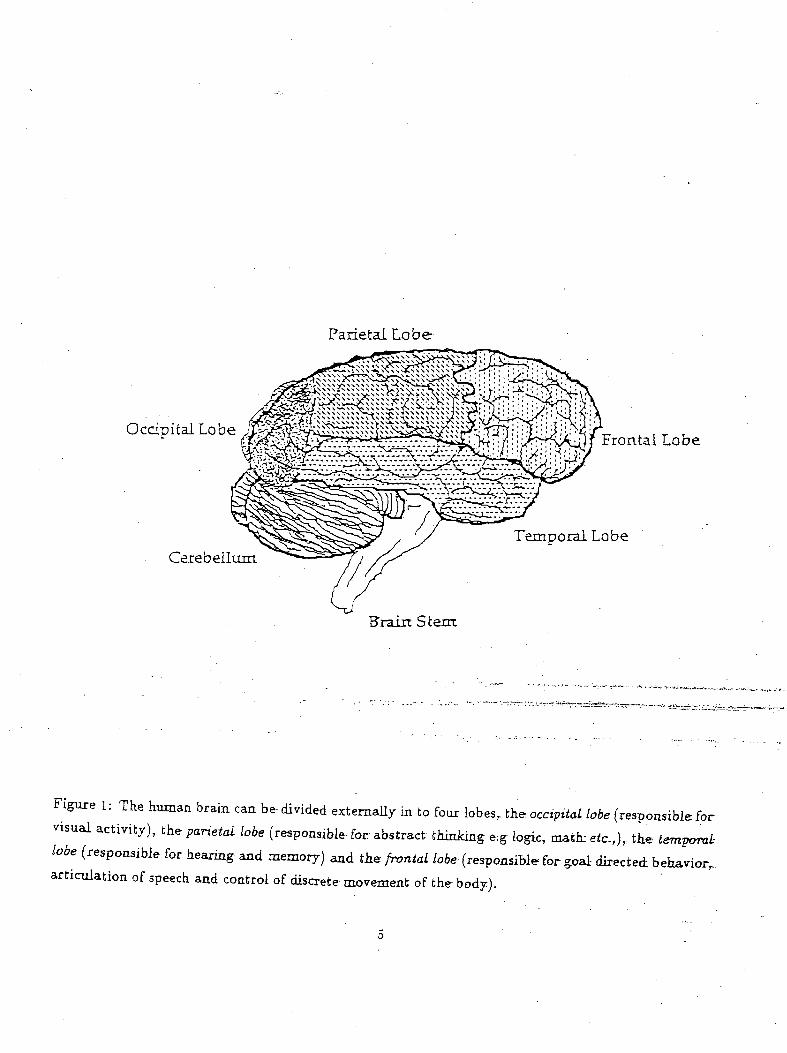
Table 1: Milner's summarized results
ing), then these patients found it hard to change their original behavior. Her test group consisted of
71 patients who were tested both before and after frontal lobectomy (removal of the frontal lobe for
relief from some kinds of seizures). Her test group also included 23 patients who had previously re-
ceived frontal lobectomies (in some cases years ago). The test which she used on these subjects dealt
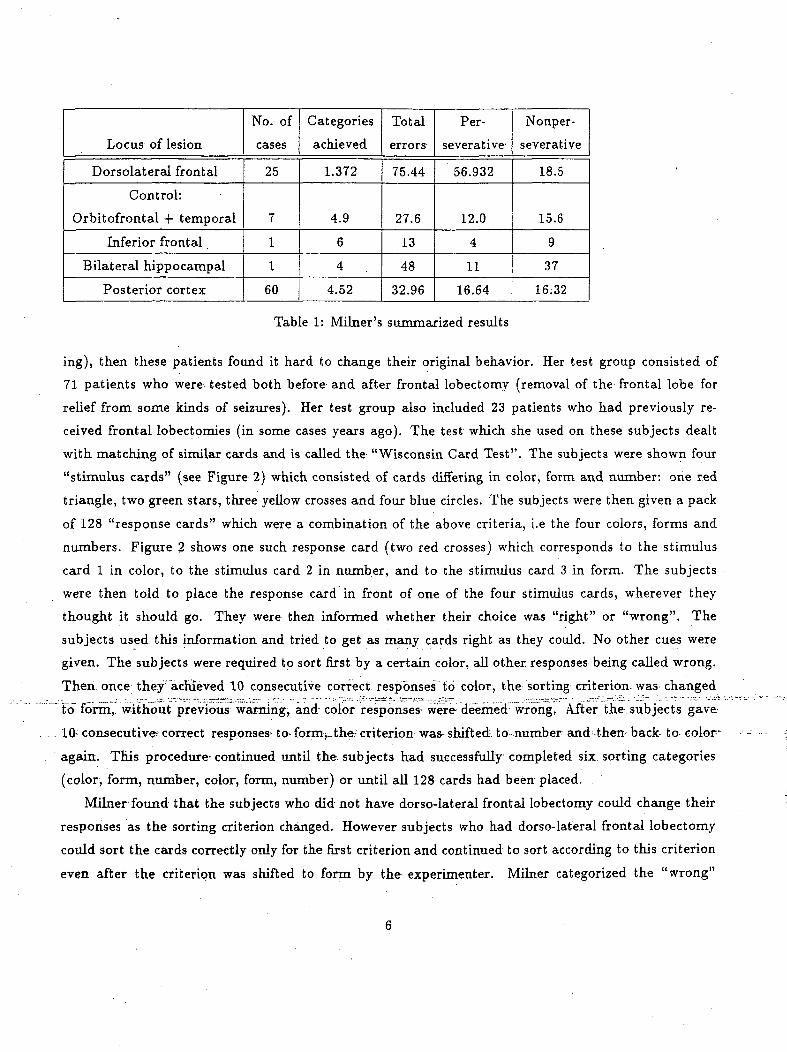
with matching of similar cards and is called the "Wisconsin Card Test". The subjects were shown four
"stimulus cards" (see Figure 2) which consisted of cards differing in color, form and number: one red
triangle, two green stars, three yellow crosses and four blue circles. The subjects were then given a pack
of 128 "response cards" which were a combination of the above criteria, i.e the four colors, forms and
numbers. Figure 2 shows one such response card (two red crosses) which corresponds to the stimulus
card 1 in color, to the stimulus card 2 in number, and to the stimulus card 3 in form. The subjects
were then told to place the response card in front of one of the four stimulus cards, wherever they
thought it should go. They were then informed whether their choice was "right" or "wrong". The
subjects used this information and tried to get as many cards right as they could. No other cues were
given. The subjects were required to sort first by a certain color, all other responses being called wrong.
Then once they" achieved 10 consecutive correct responses to color, the sorting criterion was changed
to form, without, previous warning, and color responses were deemed wrong. After the subjects gave
10- consecutive? correct responses- to- form>..the-criterion was- shifted: to number and then back- to color
again. This procedure-continued until the subjects had successfully completed six sorting categories
(color, form, number, color, form, number) or until all 128 cards had been placed.
Milner found that the subjects who did not have dorso-lateral frontal lobectomy could change their
responses as the sorting criterion changed. However subjects who had dorso-lateral frontal lobectomy
could sort the cards correctly only for the first criterion and continued to sort according to this criterion
even after the criterion was shifted to form by the experimenter. Milner categorized the "wrong"
I N P U TC A R D
w1 • »
Red
G ree-rt
Y e l l o w
Blae:
Figure 2: Tte-cards used in the Wisconsin, card sorting test. The four cards represent the four "stimulus
(template) cards"! A sample-response card is also shown in the figure
responses given by subjects into two categories. The first was the "perseverative errors" which consisted
of responses which would have been correct on the immediately preceding stage of the test, or, in the
first stage as a continued response in terms of the subject's initial preference (which is incorrect now).
All other errors were lumped together and called as "non-perseverative errors". Table 1 summarizes
the findings of Milner. As can be seen from Table 1, subjects with dorso-lateral frontal lobectomy were
unable to shift from one sorting principle to another. They committed an average of 57 perseverative
errors. Milner reported that in some cases these subjects were unable to shift their criterion throughout
the entire experiment. The control subjects on the other hand could change their criterion and had about
15 perseverative errors. Non-perseverative errors in general were- not as pronounced as perseverative
errors except in the case of subjects who had bilateral hippocampal lesions. This anomaly is attributed
to a profound memory loss.
3.2 Significance
Thus Milner's experiment suggests that frontal lobes play a major role in enabling one to shift his/her
response to meet changing environment. This is essential for successful performance in nonstationary
environment. Yet, as mentioned earlier, reinforcement signals can be noisy and normal humans filter
those signals by mixing reinforcement and habit tendencies. Milner's result suggest that if the gain of the
reinforcement signal are diminished (due to frontal lobe damage) then habit filters become dominant and
cause extreme persevaration of behavior. While Milner's study is directed to anamolous brain function,
it reveals an important aspect of reinforcement filtering (habits) which is otherwise transparent to the
observer.
3.3 Neural models
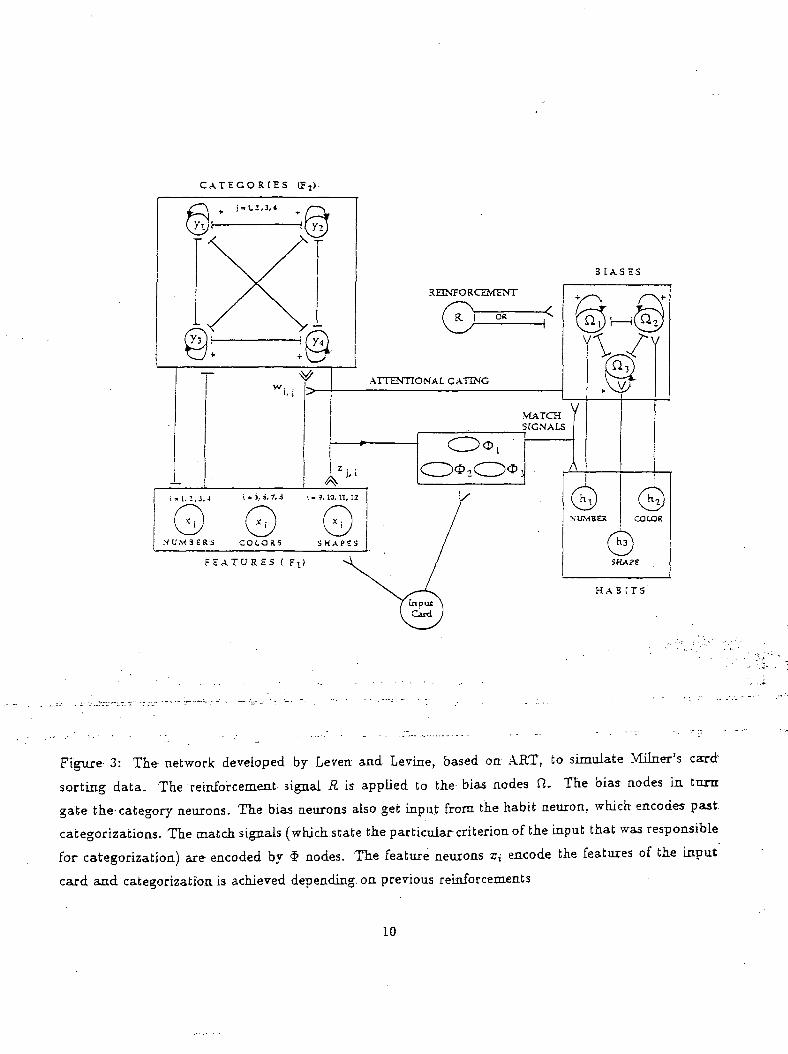
Leven and Levine proposed a neural network to model some roles of frontal lobes in the decision making
'process(Leven and Levine, 1987). Their-model comprised^ of two parts as shown in Figure-3. The
left hand side comprises of the'categoriza'tion network wHich-is responsible for choosing the "correct""
category for the given input-."response-card" and the network,on-the right hand side comprises of the
habit and bias network.
The categorization network comprises of an Adaptive Resonance Theory (ART) network. ART
has of two layers: the input layer consisting of feature neurons and the categorization (output layer)
consisting of category neurons. Each of the feature neurons codes a particular criterion: color, shape
or number of the input "response card". There are a total of twelve neurons in this layer and each
criterion is represented by four neurons (one for each of the four attributes in a given criterion). Hence
8
a particular response card, say two red crosses, is represented by the input vector (0100 1000 0010) where
the first four from the left digits represent the number criterion: one, two, three and four, the next four
digits represent the color criterion: red, green, yellow and blue and the final four digits represent the
form criterion: triangle, stars, crosses and circles respectively. Any response card would activate one
of the four neurons of a given criterion. The above input would activate the x[2], x[5] and the x[ll]
neurons of the input layer.
The categorization layer comprises of four neurons which represent the four "stimulus cards". They
are one red triangle, two green stars, three yellow crosses and four blue circles. A given input "response
card" would match one of the four "stimulus card" category neurons depending on reward input. Ini-
tially, when a "response card" is shown to the categorization network the feature neurons which code
the attributes of this response card become active. The activity of a feature neuron is given by the
following differential equation.
dt l * • * _ _
where /{ is the input vector given to the feature layer (e.g: two red crosses would be represented as
(010010000010) = (/1,/2,....,/i2) = I), Xi represents the activity of the z'— feature neuron,^- is the
activity of the j— category neuron, and Zj,{ represents the top down weights connecting the j— category
neuron with the i— feature neuron.A, B, C and D are positive constants and "/" is a sigmoid function
which is defined as follows.
/(z) = arctan(x - 1) + - (2)
Equation (1) is a shunting equation(Grossberg, 1988) and the activity of feature neurons is bounded
(in this case between zero and -^). The first term — Ax{ in the above differential equation is responsible .
for the passive decay of activity at rate A. The second term.(B — C:c,-)(/t- -f Hj=i /(^r)^j,») is-thev/^
excitatory term and it consists of the input /{.and the excitation-from the category nodes1 weighted
by the top downr weight zjj. The- third"and"'flnarternT^/?ri~^j^-1/(yy)'is:the-*inhir>itbry"'partrwhich'
comprises of inhibition from the categorization neurons- This inhibition allows the network to distinguish
between bottom up and top down signals.
The activity of the category neurons represent the possibility that the input "response card" belongs
to that "stimulus card" category. This activity is represented by equation (3).
12
-g = .-Ayj + (B-C y i)(f(yj)
1 "node" and "neuron" have been used synonymously
C A T E G O R I E S 0?,).
0 0 ©N U M B E R ' S C O L O R S S H A P E S
Figure 3: The network developed by Leven and Levine, based on ART, to simulate Milner's card'
sorting data. The reinforcement signal R is applied to the bias nodes ft. The bias nodes in turn
gate the-category neurons. The bias neurons also get input from the habit neuron, which encodes past
categorizations. The match signals (which state the particular criterion of the input that was responsible
for categorization) are encoded by § nodes. The feature neurons z,- encode the features of the input
caxd and categorization is achieved depending, on previous reinforcements
10
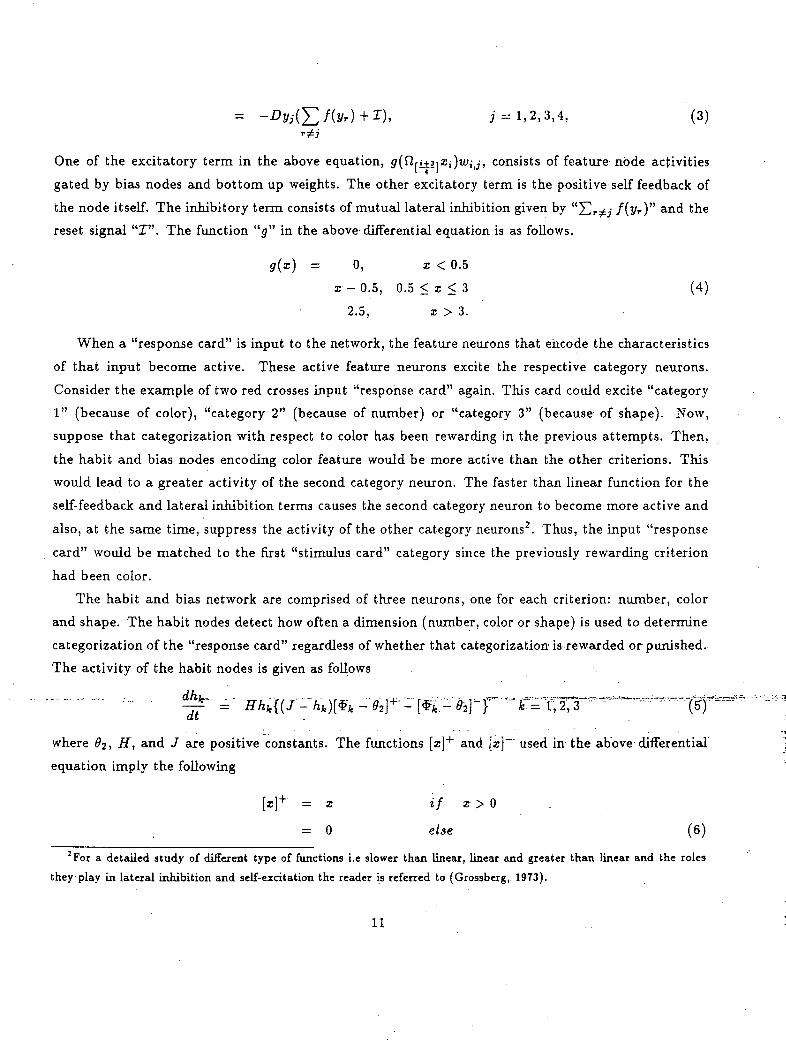
+ I), j = l ,2 ,3 ,4 , (3)
One of the excitatory term in the above equation, <7(firi±3,z,-)u>,-j, consists of feature- node activities
gated by bias nodes and bottom up weights. The other excitatory term is the positive self feedback of
the node itself. The inhibitory term consists of mutual lateral inhibition given by "X)r/j f(Vr)" a^d the
reset signal "I". The function "g" in the above differential equation is as follows.
g(x) 0, x < 0.5
z - 0.5, 0.5 < z < 3 (4)
2.5, z > 3.
When a "response card" is input to the network, the feature neurons that encode the characteristics
of that input become active. These active feature neurons excite the respective category neurons.
Consider the example of two red crosses input "response card" again. This card could excite "category
1" (because of color), "category 2" (because of number) or "category 3" (because of shape). Now,
suppose that categorization with respect to color has been rewarding in the previous attempts. Then,
the habit and bias nodes encoding color feature would be more active than the other criterions. This
would lead to a greater activity of the second category neuron. The faster than linear function for the
self-feedback and lateral inhibition terms causes the second category neuron to become more active and
also, at the same time, suppress the activity of the other category neurons2. Thus, the input "response
card" would be matched to the first "stimulus card" category since the previously rewarding criterion
had been color.
The habit and bias network are comprised of three neurons, one for each criterion: number, color
and shape. The habit nodes detect how often a dimension (number, color or shape) is used to determine
categorization of the "response card" regardless of whether that categorization is rewarded or punished.
The activity of the habit nodes is given as follows
at
where #2) H, and / are positive constants. The functions [x}+ and [x]~ used in the above differential
equation imply the following
[z]+ = z if x > 0
= 0 else (6)
2For a detailed study of different type of functions i.e slower than linear, linear and greater than linear and the roles
they play in lateral inhibition and self-excitation the reader is referred to (Grossberg,. 1973).
11
[z] = -x- if x < 0
= 0 else (7)
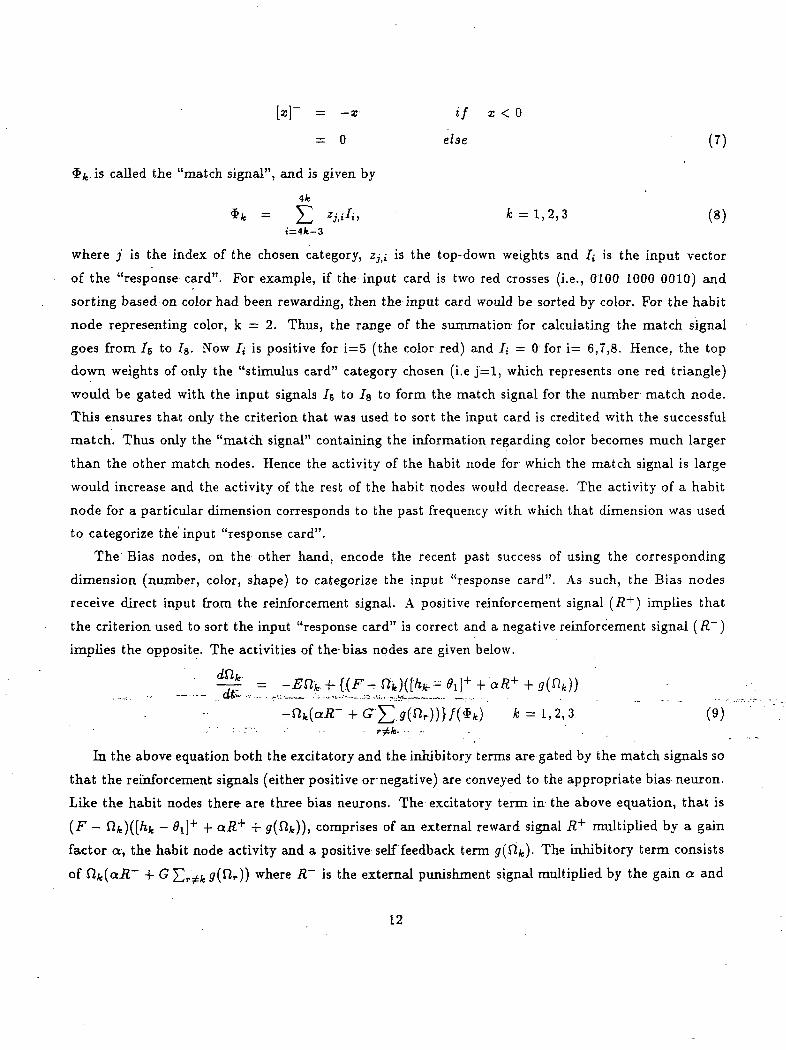
is called the "match signal", and is given by
z^1" k = 1,2,3 (8)i=4fc-3
where j is the index of the chosen category, Zjti is the top-down weights and /; is the input vector
of the "response card". For example, if the input card is two red crosses (i.e., 0100 1000 0010) and
sorting based on color had been rewarding, then the input card would be sorted by color. For the habit
node representing color, k = 2. Thus, the range of the summation for calculating the match signal
goes from Is to J8. Now /,• is positive for i=5 (the color red) and Ii = 0 for i= 6,7,8. Hence, the top
down weights of only the "stimulus card" category chosen (i.e j = l, which represents one red triangle)
would be gated with the input signals Is to Jg to form the match signal for the number match node.
This ensures that only the criterion that was used to sort the input card is credited with the successful
match. Thus only the "match signal" containing the information regarding color becomes much larger
than the other match nodes. Hence the activity of the habit node for which the match signal is large
would increase and the activity of the rest of the habit nodes would decrease. The activity of a habit
node for a particular dimension corresponds to the past frequency with which that dimension was used
to categorize the input "response card".
The Bias nodes, on the other hand, encode the recent past success of using the corresponding
dimension (number, color, shape) to categorize the input "response card". As such, the Bias nodes
receive direct input from the reinforcement signal. A positive reinforcement signal (R+) implies that
the criterion used to sort the input "response card" is correct and a negative reinforcement signal (R~)
implies the opposite. The activities of the bias nodes are given below.
' aR+
* = 1,2,3. (9)• . • .:.:-- •-• •- • r*k* •• .- • .
In the above equation both the excitatory and the inhibitory terms are-gated by the match signals so
that the reinforcement signals (either positive or negative) are conveyed to the appropriate bias neuron.
Like the habit nodes there are three bias neurons. The excitatory term in the above equation, that is
(F - fife)([/ifc - GI]+ 4- aR+ + (/(fife)), comprises of an external reward signal R^ multiplied by a gain
factor a,, the habit node activity and a positive self feedback term g(f tk)- The inhibitory term consists
of Qfe(aJZ~ 4- G £P?ifc ff(^r)) where R~ is the external punishment signal multiplied by the gain a and
12
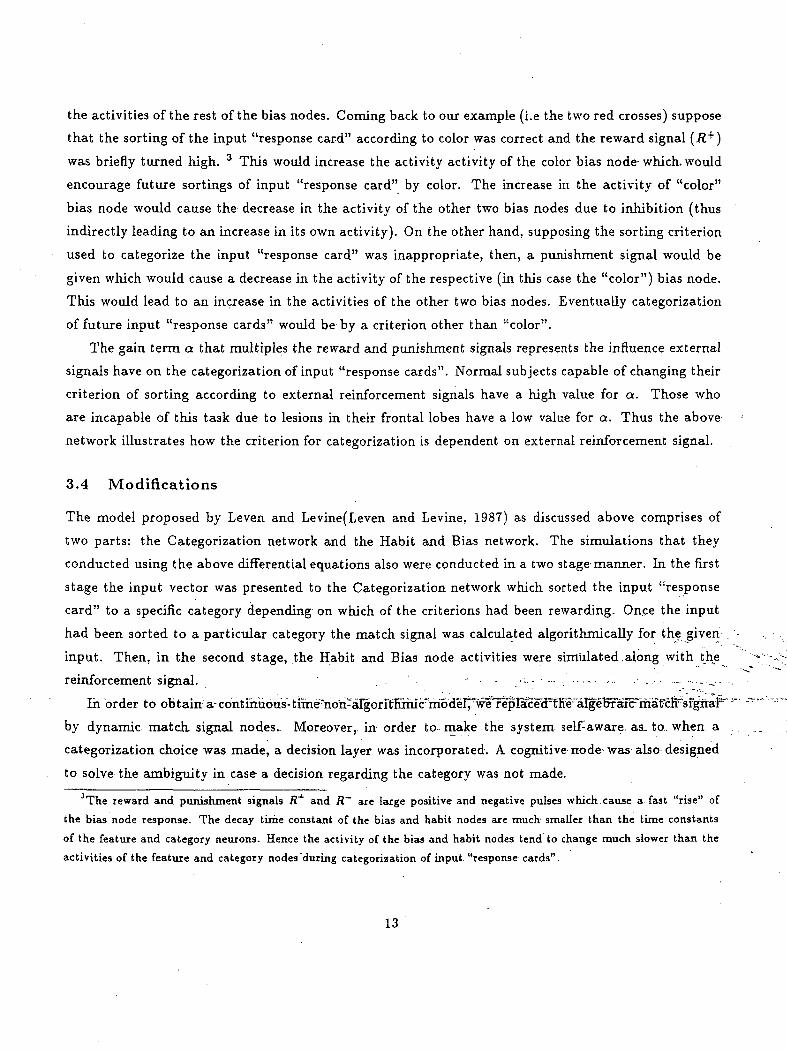
the activities of the rest of the bias nodes. Coming back to our example (i.e the two red crosses) suppose
that the sorting of the input "response card" according to color was correct and the reward signal (R+)
was briefly turned high. 3 This would increase the activity activity of the color bias node which, would
encourage future sortings of input "response card" by color. The increase in the activity of "color"
bias node would cause the decrease in the activity of the other two bias nodes due to inhibition (thus
indirectly leading to an increase in its own activity). On the other hand, supposing the sorting criterion
used to categorize the input "response card" was inappropriate, then, a punishment signal would be
given which would cause a decrease in the activity of the respective (in this case the "color") bias node.
This would lead to an increase in the activities of the other two bias nodes. Eventually categorization
of future input "response cards" would be by a criterion other than "color".
The gain term a that multiples the reward and punishment signals represents the influence external
signals have on the categorization of input "response cards". Normal subjects capable of changing their
criterion of sorting according to external reinforcement signals have a high value for a. Those who
are incapable of this task due to lesions in their frontal lobes have a low value for a. Thus the above
network illustrates how the criterion for categorization is dependent on external reinforcement signal.
3.4 Modifications
The model proposed by Leven and Levine(Leven and Levine, 1987) as discussed above comprises of
two parts: the Categorization network and the Habit and Bias network. The simulations that they
conducted using the above differential equations also were conducted in a two stage manner. In the first
stage the input vector was presented to the Categorization network which sorted the input "response
card" to a specific category depending on which of the criterions had been rewarding. Once the input
had been sorted to a particular category the match signal was calculated algorithmically for the given
input. Then, in the second stage, the Habit and Bias node activities were simulated along with the
reinforcement signal. . . . ; . . . . . •-. . ._.. .
In order to obtain a- continuous-time'non-'argori'tn^
by dynamic match- signal nodes- Moreover,, in order to make the system self:aware. as_ to. when, a
categorization choice was made, a decision layer was incorporated. A cognitive-node was also-designed
to solve the ambiguity in case a decision regarding the category was not made.3The reward and punishment signals R+ and R~ are large positive and negative pulses which.cause a fast "rise" of
the bias node response. The decay time constant of the bias and habit nodes are much smaller than the time constants
of the feature and category neurons. Hence the activity of the bias and habit nodes tend to change much slower than the
activities of the feature and category nodes "during categorization of input "response cards".
13
AMBIGUITY VETOON-
i=I ,2 ,3 ,4 1=5,4,7,3 1» 9,10,11,12
N U M B E R S C O L O R S S H A P E S
F E A T U R E S - ! FT.)
iVtIMBER COLOR
eSHAPE
H A B I T S
Synapses notation
<
(
«
1 \• • • r > •
Type
Excitatory
Inhibitory
Plastic Excitatory Synapse
Represents [
"- ExaUtocy-Salf-feedKack: '
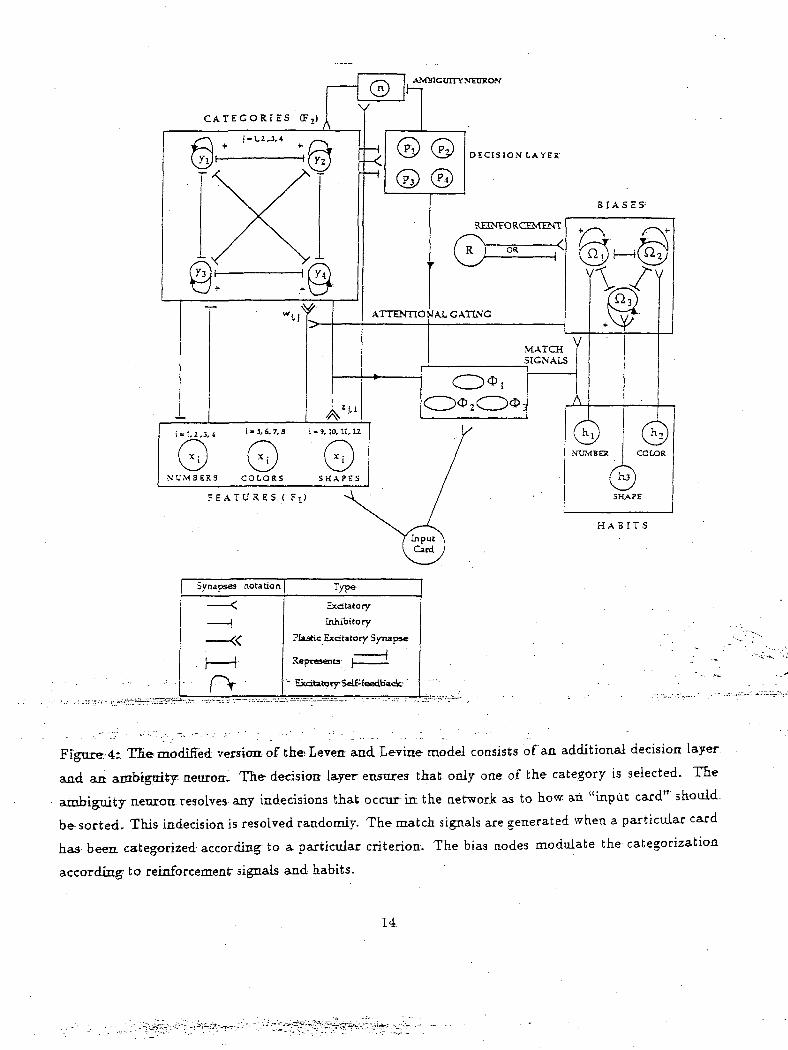
Figure;'4r TEe modified version.-of theEeveit andLevine model consists of an additional decision layer
and an ambiguity neuron-. The decision layer enstires that only one of the category is selected. The
ambiguity neuron resolves any indecisions that occur in the network as to how an "input card" should-
be sorted. This indecision is resolved randomly. The match signals are generated when a particular card
has been, categorized according to a partictdar criterion. The bias nodes modulate the categorization
according to reinforcement signals and habits.
14
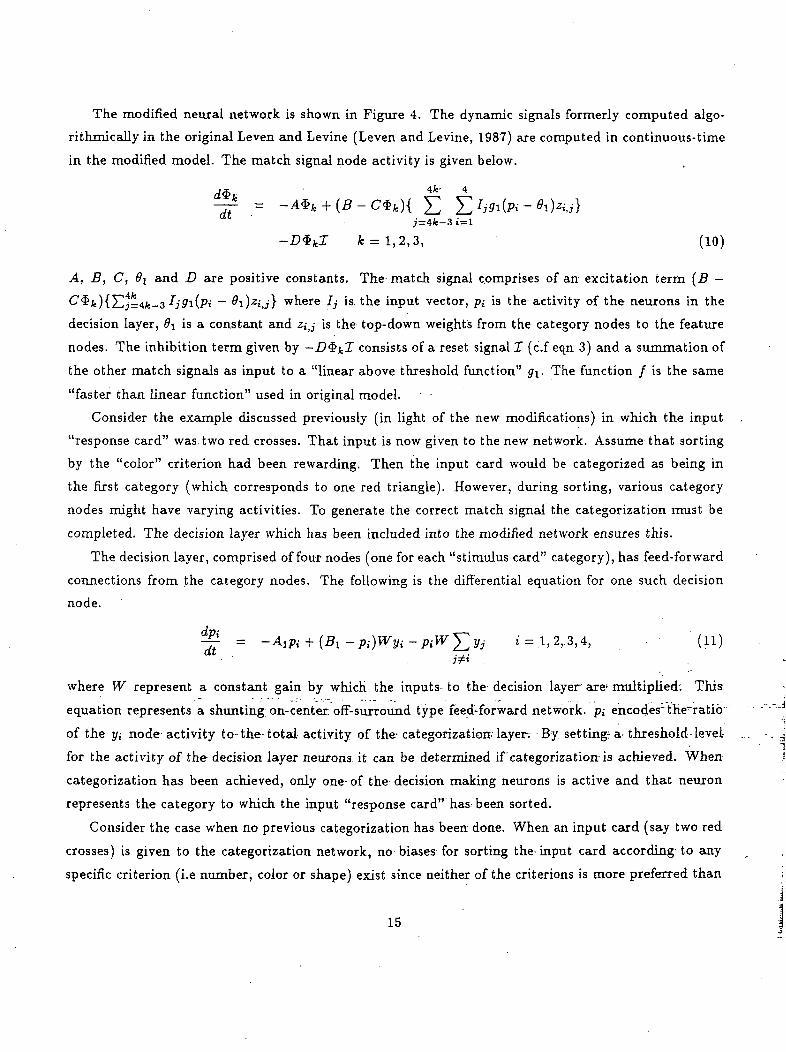
The modified neural network is shown in Figure 4. The dynamic signals formerly computed algo-
rithrnically in the original Leven and Levine (Leven and Levine, 1987) are computed in continuous-time
in the modified model. The match signal node activity is given below.
j=4fc-3i=l
= 1,2,3, (10)
A, B, C, #1 and D are positive constants. The match signal comprises of an excitation term (B —
C^k){lL,j=4k-3 Ij9i(Pi ~ Qi)zi,j} where Ij is the input vector, pi is the activity of the neurons in the
decision layer, 9\ is a constant and z,-,j is the top-down weights from the category nodes to the feature
nodes. The inhibition term given by -D$kl consists of a reset signal 1 (c.f eqn 3) and a summation of
the other match signals as input to a "linear above threshold function" g\. The function / is the same
"faster than linear function" used in original model.
Consider the example discussed previously (in light of the new modifications) in which the input
"response card" was two red crosses. That input is now given to the new network. Assume that sorting
by the "color" criterion had been rewarding. Then the input card would be categorized as being in
the first category (which corresponds to one red triangle). However, during sorting, various category
nodes might have varying activities. To generate the correct match signal the categorization must be
completed. The decision layer which has been included into the modified network ensures this.
The decision layer, comprised of four nodes (one for each "stimulus card" category), has feed-forward
connections from the category nodes. The following is the differential equation for one such decision
node.
i=. l ,2 , .3 ,4, • (11).
where W represent a constant gain by which the inputs- to the decision layer are1 multiplied: This
equation represents a shunting; on-center off-surround type feedrforward network, p; encodes" tne~ratid
of the j/j node activity to the total activity of the- categorization- layer. By setting: a- threshold level
for the activity of the decision layer neurons it can be determined if 'categorization is achieved. When
categorization has been achieved, only one- of the decision making neurons is active and that neuron
represents the category to which the input "response card" has been sorted.
Consider the case when no previous categorization has been done. When an input card (say two red
crosses) is given to the categorization network, no biases for sorting the input card according to any
specific criterion (i.e number, color or shape) exist since neither of the criterions is more preferred than
15
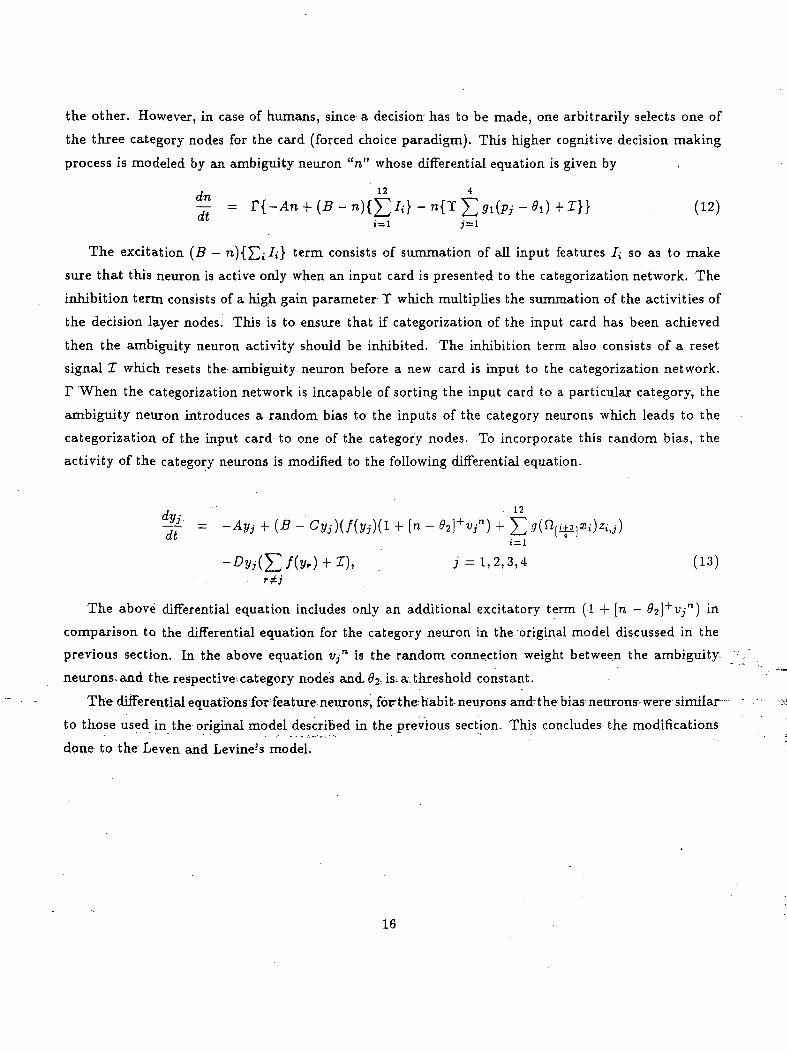
the other. However, in case of humans, since a decision has to be made, one arbitrarily selects one of
the three category nodes for the card (forced choice paradigm). This higher cognitive decision making
process is modeled by an ambiguity neuron "n" whose differential equation is given by
, (12)
The excitation (B — n){J^/t-} term consists of summation of all input features /; so as to make
sure that this neuron is active only when an input card is presented to the categorization network. The
inhibition term consists of a high gain parameter T which multiplies the summation of the activities of
the decision layer nodes. This is to ensure that if categorization of the input card has been achieved
then the ambiguity neuron activity should be inhibited. The inhibition terra also consists of a reset
signal I which resets the ambiguity neuron before a new card is input to the categorization network.
T When the categorization network is incapable of sorting the input card to a particular category, the
ambiguity neuron introduces a random bias to the inputs of the category neurons which leads to the
categorization of the input card to one of the category nodes. To incorporate this random bias, the
activity of the category neurons is modified to the following differential equation.
yr)+1), j = 1,2,3,4 (13)
The above differential equation includes only an additional excitatory term (1 + [n - 0-i\ + Vjn} in
comparison to the differential equation for the category neuron in the original model discussed in the
previous section. In the above equation Vjn is the random connection weight between the ambiguity
neurons, and the respective-category nodes and 62- is^ athreshold constant.
The differentialequations for^feature neuronsyforthehabit neurons and-thebias neuron?were similar-
to those used in the original model described in the previous section. This concludes the modifications
done to the Leven and Levine-'smodel.
16
3.5 Simulation Results
3.5.1 ART network
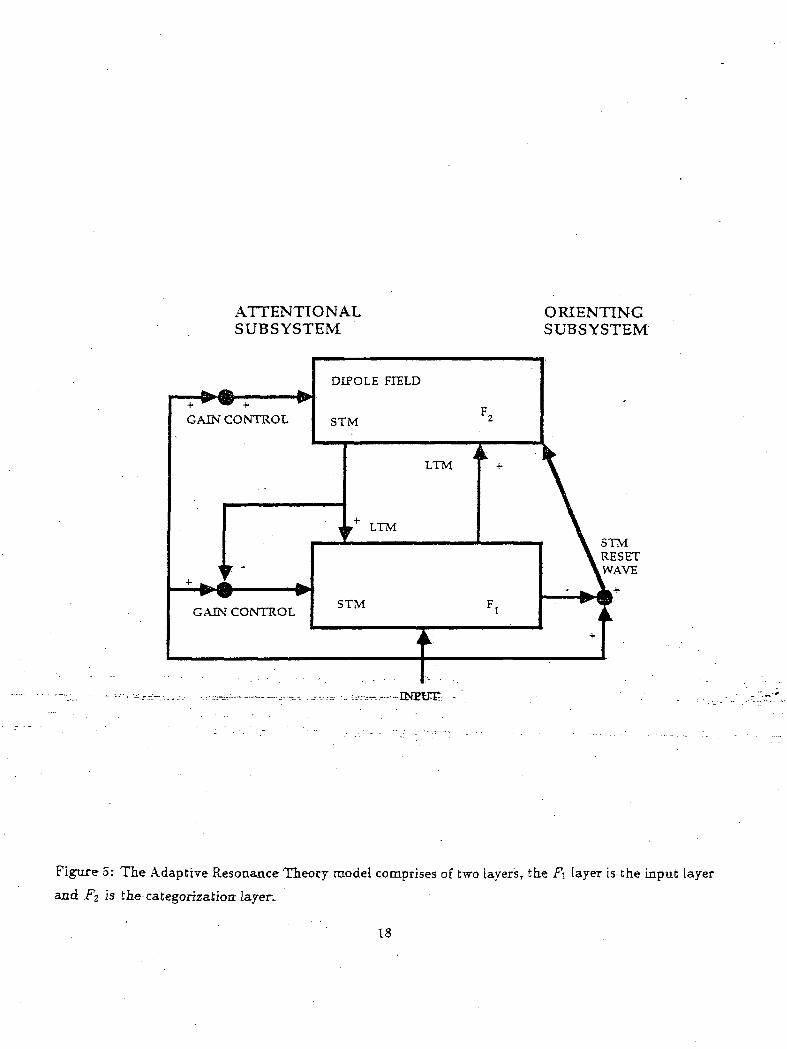
An ART-1 network designed by Carpenter and Grossberg was simulated 4 to categorize alphabets(Carpenter
and Grossberg, 1987). The ART-1 network is shown in Figure 5 and it comprises of two layers, the FI
and F2 which encode patterns of activation in short-term memory (STM). The bottom-up and top-down
pathways between FI and F2 contain adaptive long-term memory (LTM) traces. Various handwritten
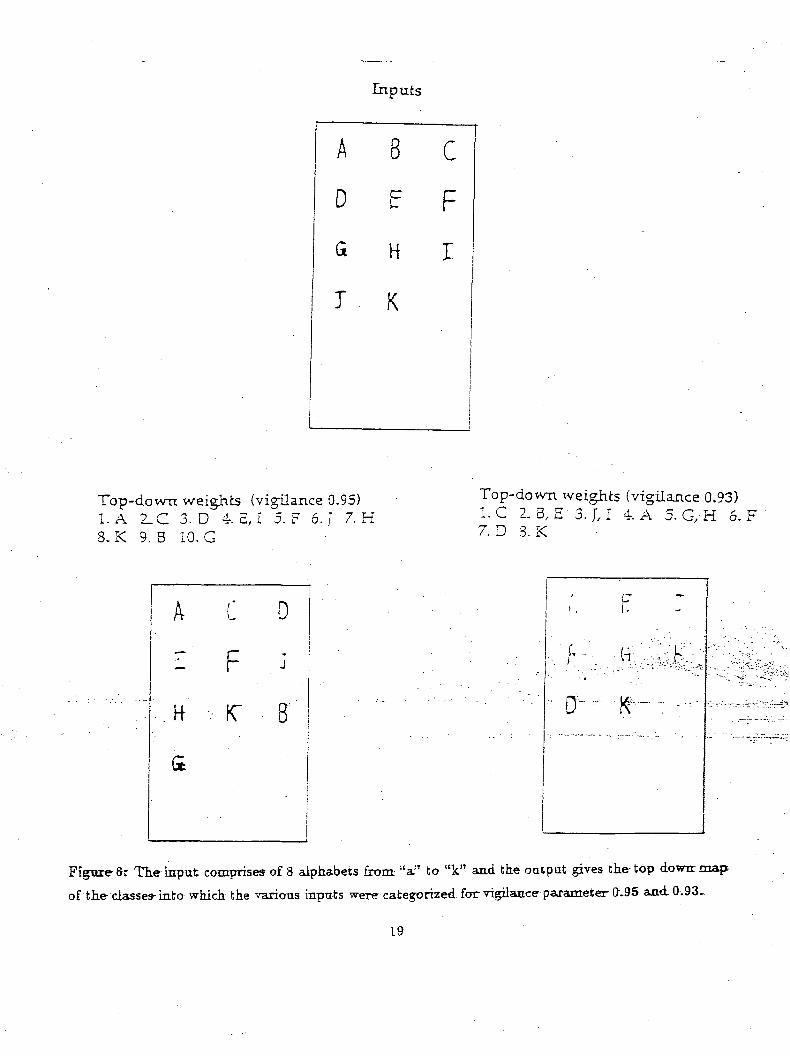
alphabets were captured using a vision system and converted to binary images. These alphabets were
then used as inputs to the ART-1 network and the various categorizations were observed for different
vigilance parameters. Figure 6 shows such categorization of alphabets for a vigilance coefficient of 0.95
and 0.93. The left hand side shows the set of images used to train the network. The figure on the
right shows the top down weights of the category into which the input was categorized for vigilance
parameter 0.95 and 0.93.
3.5.2 Reinforcement-habit network
Milner(Milner, 1963,1964) using a modified Wisconsin card sorting test, showed that people with frontal
damage were incapable of shifting their decision making criterion dynamically in presence of reward and
punishment. Leven and Levine(Leven and Levine, 1987) modeled this scenario using a neural network
which was capable of replicating the behavior of both frontally damaged and normal human depending
on the gain constant a. Figure 4 shows the modified version of the Leven-Levine model. As discussed
previously the modified model comprises of a decision layer which ascertains whether the category
neurons have come up with a decision regarding the category to which the input belongs. Figure 7
demonstrates the case when a category choice is made for a given input. In this simulation the input
consisted of two red crosses (i.e 0100 1000 0010). The categorization in the previous cases done according
4 All the simulations were-initially conducted on an- Ultrix Workstation. The X-window environment was used- for theinteractive- graphics in the- simulations. All the1 code- was-written-.iru Cl and''the operating-system used*-was*Unix: The
simulations were conducted in a continuous-mode so as to model real' life situations. The differential equation* were
solved using Runge-Kutta-Falsberg algorithm which was obtained from the Oak-Ridge-lab: These simulations were then
ported to the Spare Station at NASA-JSC on which they are running. Parallel implementation of these simulation was
also-conducted on the Amdahl at NASA-JSC. Each of the simulations consist of a pair of window called the input and
the output windows. They represent respectively the input to and the response of the modeled neural- network. Other
windows represent the activity of the various neurons and the strengths of the signals. The simulation once evoked begins
running continuously and can be interrupted any time by typing Ctrl-C. On doing this a menu pops up listing the various
options that can be chosen. The various options range from input of a new object to the network, to quitting, of the entire
simulations.
17
ATTENTIONALSUBSYSTEM
ORIENTINGSUBSYSTEM
GAIN CONTROL
DIPOLE FIELD
STM
GAIN CONTROL
LTM
LTM
STM
STMRESETWAVE
Figure 5: The Adaptive Resonance Theory model comprises of two layers, the FI layer is the input layer
and FI is the categorization- layers
18
Inputs
A 8
D £
a H
I K
C
F
rI
Top-down weights (vigilance 0.95)1. A 2_C 3. D 4. E, I 5. F 6. J 7. H8.K 9. 3 10. G
Top-down weights (vigilance 0.93)l.C 2. B , E - 3 . r , I 4. A 5.G/H 6.F '7. D 8. K
A
—
" . H
C D
F .J
- K" 3
. iIi
P:
Figure 6r Tie input comprises of 8 alphabets from "a)T to "k" and the output gives the top down map
of the classes- into which the various inputs were- categorized for vigilance parameter 0-95 and. 0.93-
19
•-•' 1 M 1 1 1 M i
L i~ L
• >- "U^ t /5 • - /2 I . /~<u 1 / •
o n 1 1 1 i H M•J
19 20Lime
— i i i 1 ! i 1
• n R '^ , u . o .,11 Aa M
I j ' \*• O -1 \O U.4 • y
I £X, 1
% 0-2 1—
tA rv! i 1 ' I ! , i 1
i ! i i I 1 i 1 i "•'•' j— 1 I ! i Ml!.1
— i;Cn n -MU.4 i
^ i ^ E/• ' y i—/ n ^ ' A
0 U'J L- \h \
- % - 1 \i . -n. o o r~ i \, o t j x
-j n C1) A 1 1•L. ^ ' ^ '< '
Mi! M M~! n n h ! M I 1 1 1u .u21 22 23 19 20 2
uniLs . time
o °nI 1 M ! M l i — J.-U _, , ! , , , ,
i ~1 ~~1 —
^ - n • = ~1 . fl u- i 0 _CJ - _
—1
v j . y O . L O ,
^ H - r-- 2 ' - ' ' ' \
d « 0.05 1 " .X
M ! ! ! i M M • -n-nn i"1 ' ' ' ' '' ' '
1 i M M M_
z
-
^_ -• -
M M M i r1 22 . 2un.iLs-
M M M l l _
-
_
IH
4-
MM ! M l~
',
3
- 19 20 Zl 22 23time, units'
19 20 21- ' 22- -23--.' " Lirrter: onits? -•.-- • - ":
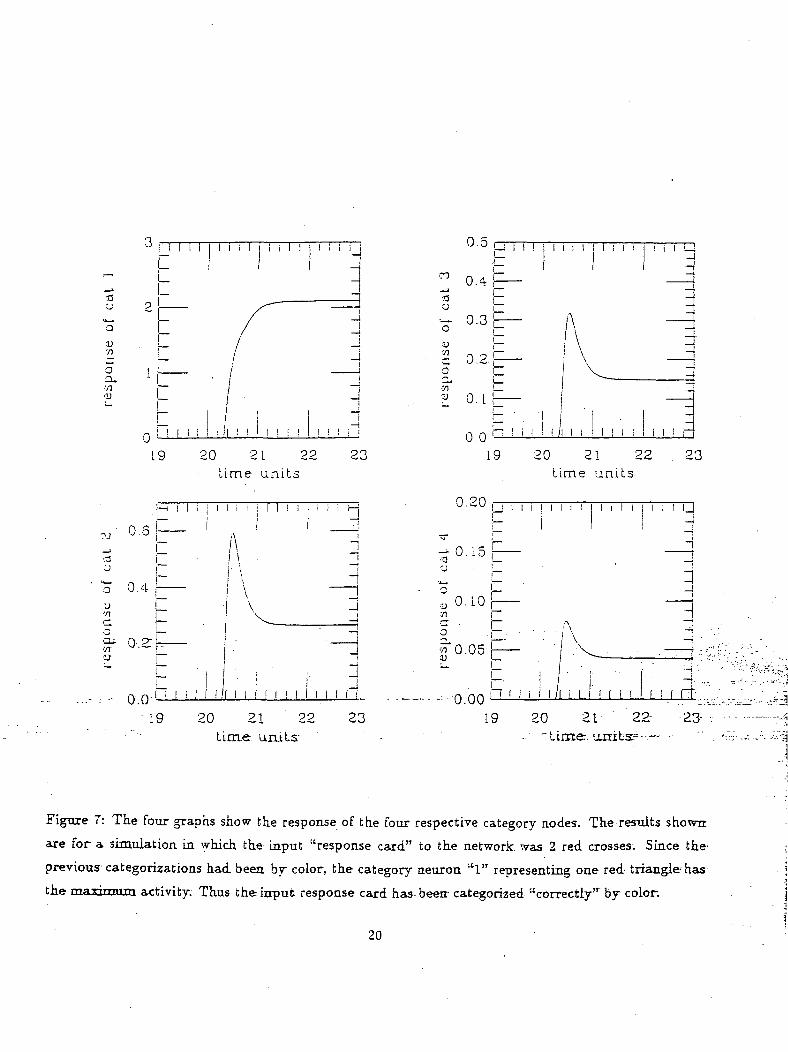
Figure 7: The four graphs show the response of the four respective category nodes. The results shower
are for a simulation in which the input "response card" to the network was 2 red crosses. Since the
previous categorizations had been by color, the category neuron "1" representing one red triangle'has
the maximum activity. Thus the input response card has- been- categorized "correctly"' by color.
20
to color had been rewarding and in this case the network should categorize according to color. The
graph shown in figure 7 consists of the activity of the four, category neurons. As can be'seen from
the graphs, the category neuron "1" has the highest activity (which represents the one-red triangle)
implying that the input card was matched according to color.
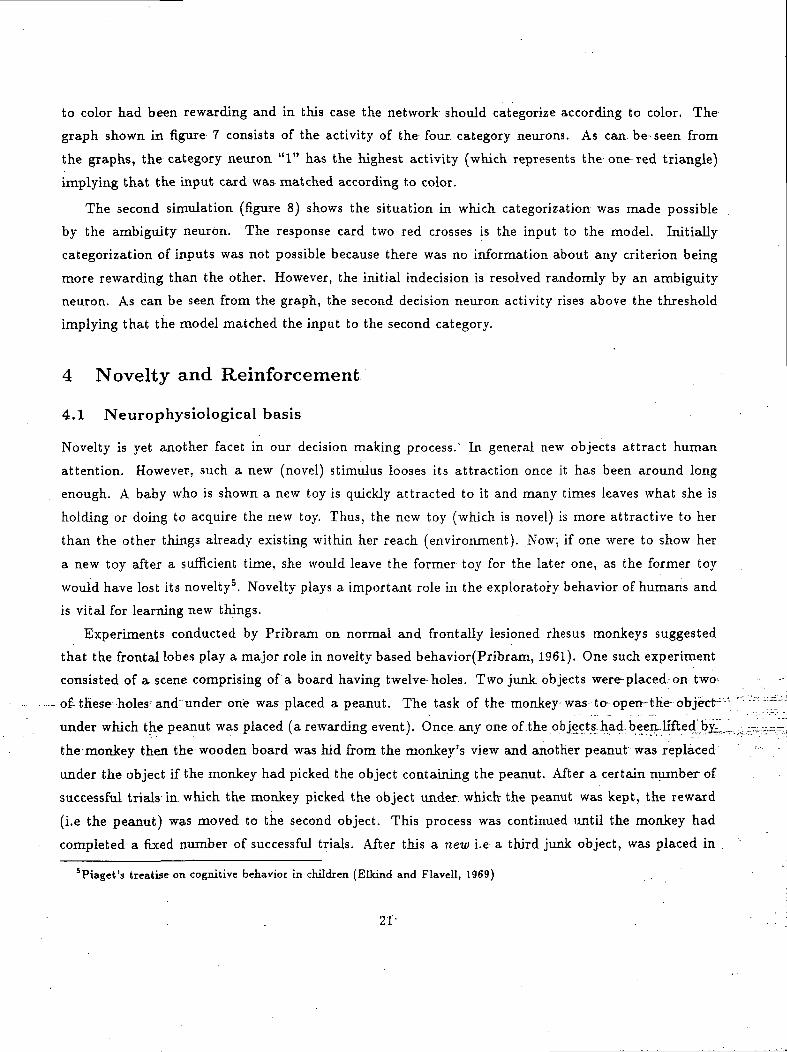
The second simulation (figure 8) shows the situation in which categorization was made possible
by the ambiguity neuron. The response card two red crosses is the input to the model. Initially
categorization of inputs was not possible because there was no information about any criterion being
more rewarding than the other. However, the initial indecision is resolved randomly by an ambiguity
neuron. As can be seen from the graph, the second decision neuron activity rises above the threshold
implying that the model matched the input to the second category.
4 Novelty and Reinforcement
4.1 Neurophysiological basis
Novelty is yet another facet in our decision making process.' In general new objects attract human
attention. However, such a new (novel) stimulus looses its attraction once it has been around long
enough. A baby who is shown a new toy is quickly attracted to it and many times leaves what she is
holding or doing to acquire the new toy. Thus, the new toy (which is novel) is more attractive to her
than the other things already existing within her reach (environment). Now, if one were to show her
a new toy after a sufficient time, she would leave the former toy for the later one, as the former toy
would have lost its novelty5. Novelty plays a important role in the exploratory behavior of humans and
is vital for learning new things.
Experiments conducted by Pribram on normal and frontally lesioned rhesus monkeys suggested
that the frontal lobes play a major role in novelty based behavior(Pribram, 1961). One such experiment
consisted of a scene comprising of a board having twelve-holes. Two junk: objects were-placed^ on two^
of-these holes"and"under one was placed a peanut. The task of the monkey- was to- open- the object--'
under which the peanut was placed (a rewarding event). Once any one of .the objects, had. been-.lifted:by^
the monkey then the wooden board was hid from the monkey's view and another peanut was replaced
under the object if the monkey had picked the object containing the peanut. After a certain number of
successful trials in which the monkey picked the object under, which the peanut was kept, the reward
(i.e the peanut) was moved to the second object. This process was continued until the monkey had
completed a. fixed number of successful trials. After this a new i.e a third junk object, was placed in .
5Piaget's treatise on cognitive behavior in children (Elkind and Flavell, 1969)
21-
0.2
L . 2
100 200t ime units
a
-3. .O 1 -
aaj.
S 0.6"o-a*.
0.8 Kj—I
Q..2>' .' ' !
300
i 1 i 1 _)
-i
d
._-:--,•-'-_ i.Q- .....100. 200
time- units-300.
CO
D.71r;
OCU71•i)
i .^ 1 1 1
1 -0 i
n a !~U.w [_
j i i i i i ii_
V \I
0.4
0.2
1.2
1.0
0.3
11W
•77'U
1 ! lH
100 200 300time units
i l l i
0 100 ... 200 , _ 300,time
Figure 8: The four graphs shown in this figure represent the activities of the four decision layer neu-
rons. When, an response card was initially input to the ART network it was not able to categorize it.
Eventually categorization^ was, randomly achieved as the-input card-was categorized to category "3".
22
o
(U<f\0)
a,0)
0 5 10 15. of cues in preset! La-Uon-
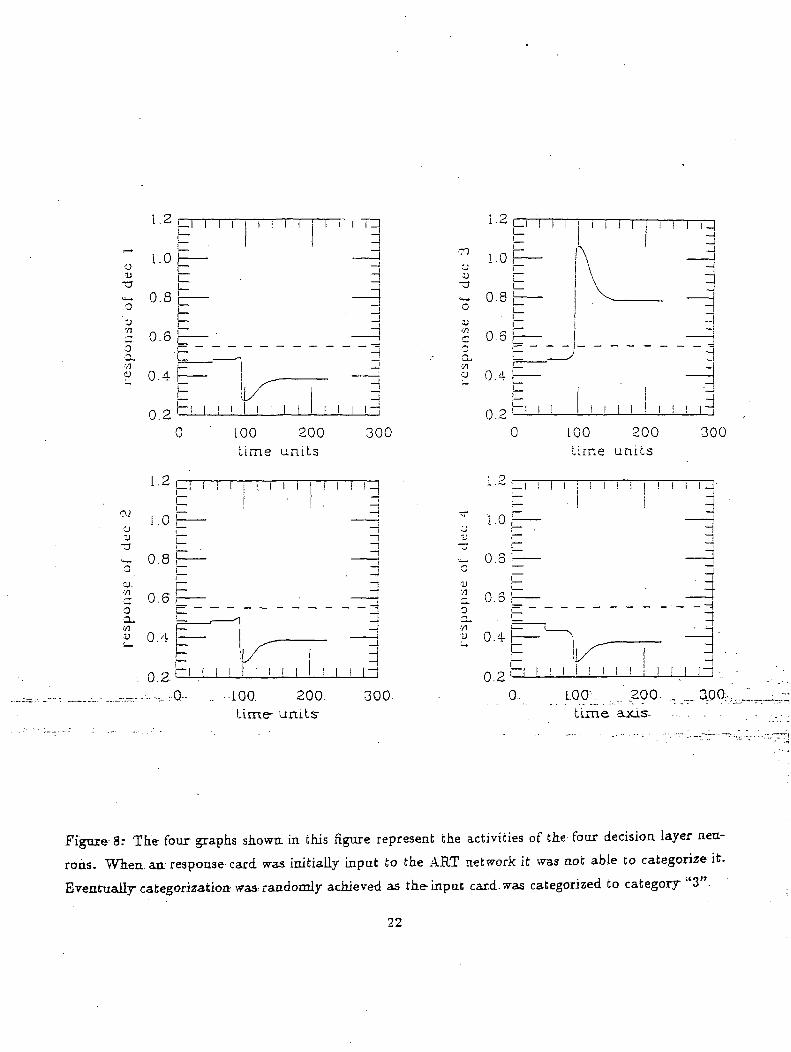
Figure 9: The- experimental data shown above represents the- number of repetitive- trials, required by
frontal monkeys (straight lines) and normal monkeys (dashed lines) to pick up a-novel-object in Pribram's
experiment.
23
the scene. Under this new object was kept the peanut. Thereafter the number of junk objects were
increased after a fixed number of successful picks by the monkey, until all the-12 wooden holes were-
covered.
Figure 9 shows the results of Pribram's experiment. The number of repetitive errors (lifting of
previously rewarding objects) until it picked the new object containing the reward is plotted against
the number of junk objects. In general it can be seen that frontally damaged monkeys make fewer
errors than normals, being more-attracted to novel objects6. Thus, Pribram concluded that in normal
monkeys the frontal cortex was responsible for suppression of novelty driven behavior. As in the rhesus
monkey, the human the frontal lobes also seem to be responsible for gating novelty based cognitive
decision making.
4.2 Significance
Attraction to novelty is essential for exploration and learning new things. However, extreme attraction
to novelty in a changing environment can be disastrous and should be weighted by reinforcement sig-
nals. Pribram's experiment show that if this balance is disturbed (by a damage to frontal lobes that
would weaken the effect of reinforcement signals), pathological behavior results. Again, comparison of
pathological and normal subjects reveal "transparent" aspect in decision making.
4.3 Neural models
Levine and Praeitt(Levine and Prueitt, 1989) modeled Pribram's psychological findings with a neural
network comprising of gated dipoles. Gated dipoles are devices using transmitter mechanisms for
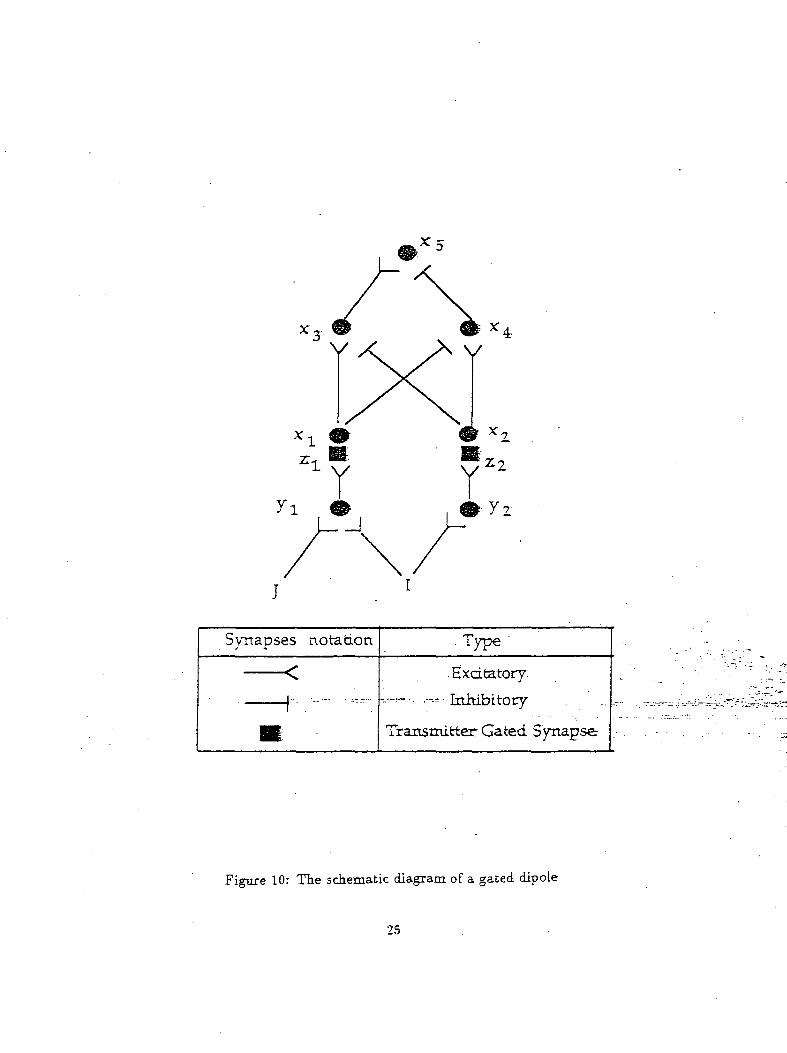
comparing present and past signal values. An example of .a gated dipole is shown in figure 10. The
square synapses in this figure signify such transmitter packages and their activities are giv.en by,the
following equations. . . . . . . . . . . ::/:
•— =~ &i(P-zi )at
—^ - ai((3 - z-i] - a-2y2z2 (15)at
where Z-L and z? are the amounts of available transmitter at the. ON and OFF channels respectively,
is the rate of accumulation of the transmitter to the maximum value of /? (the total amount of
6Details regarding improved performance of normal monkeys in case of larger number of objects and worse performance
of frontally damaged monkeys in case of few objects have been discussed by Levine and Prueitt k Pribram( Levine and
Prueitt 1989; Pribram, 1961)
24
Synapses notation Type
• Excitatory:
-•.-•<"••••. ----- Inhibitory
Transmitter Gated Synapse
Figure 10: The schematic diagram of a. gated dipole
25
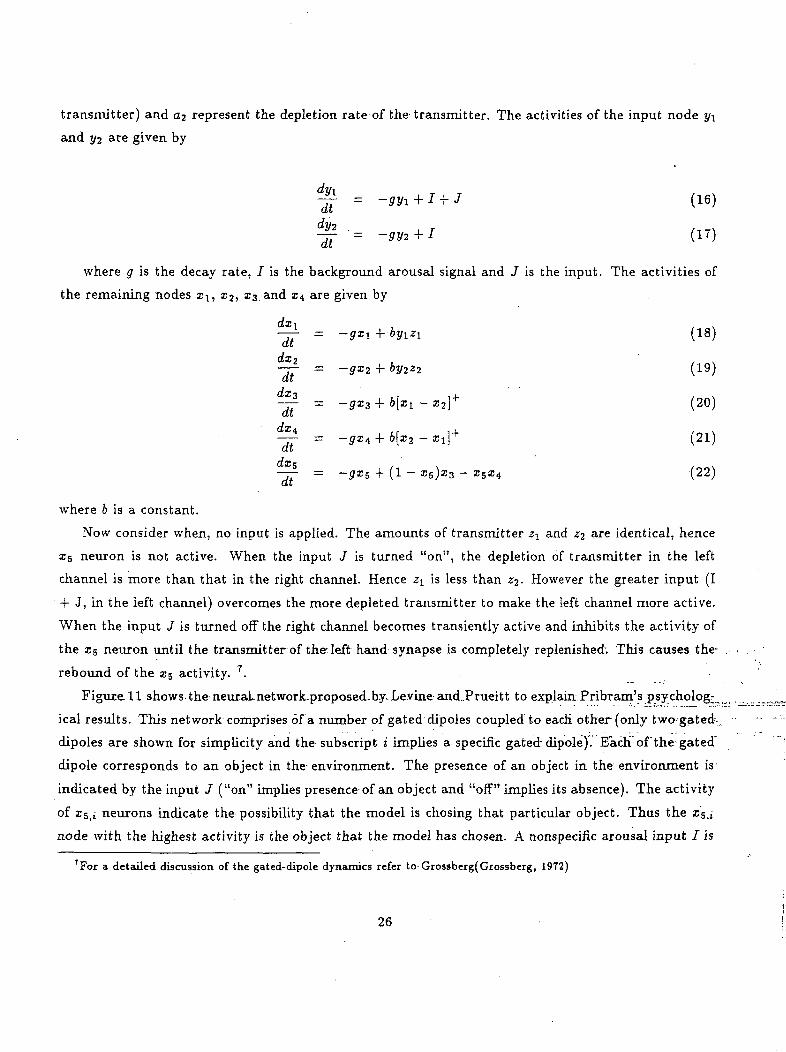
transmitter) and a2 represent the depletion rate of the transmitter. The activities of the input node
and 1/2 are given by
= -gyi+I + J (16)
lU = -9V2 + I (I?)
where g is the decay rate, / is the background arousal signal and J is the input. The activities of
the remaining nodes x\, x2, z3.and x$ are given by
— - = -gxi + -byizi (18)at
dx2-j- - -9^2 -f by2zi (19)at
= -gx3 + b[Xl - z2]+ (20)
xl}+ (21)
-^ = -gx5 + (1 - xs)x3 - z5z4 (22)
where 6 is a constant.
Now consider when, no input is applied. The amounts of transmitter z\ and z2 are identical, hence
x5 neuron is not active. When the input J is turned "on", the depletion of transmitter in the left
channel is more than that in the right channel. Hence z\ is less than z2. However the greater input (I
+ J, in the left channel) overcomes the more depleted transmitter to make the left channel more active.
When the input J is turned off the right channel becomes transiently active and inhibits the activity of
the x5 neuron until the transmitter of the left hand synapse is completely replenished; This causes the-
rebound of the x5 activity. 7.
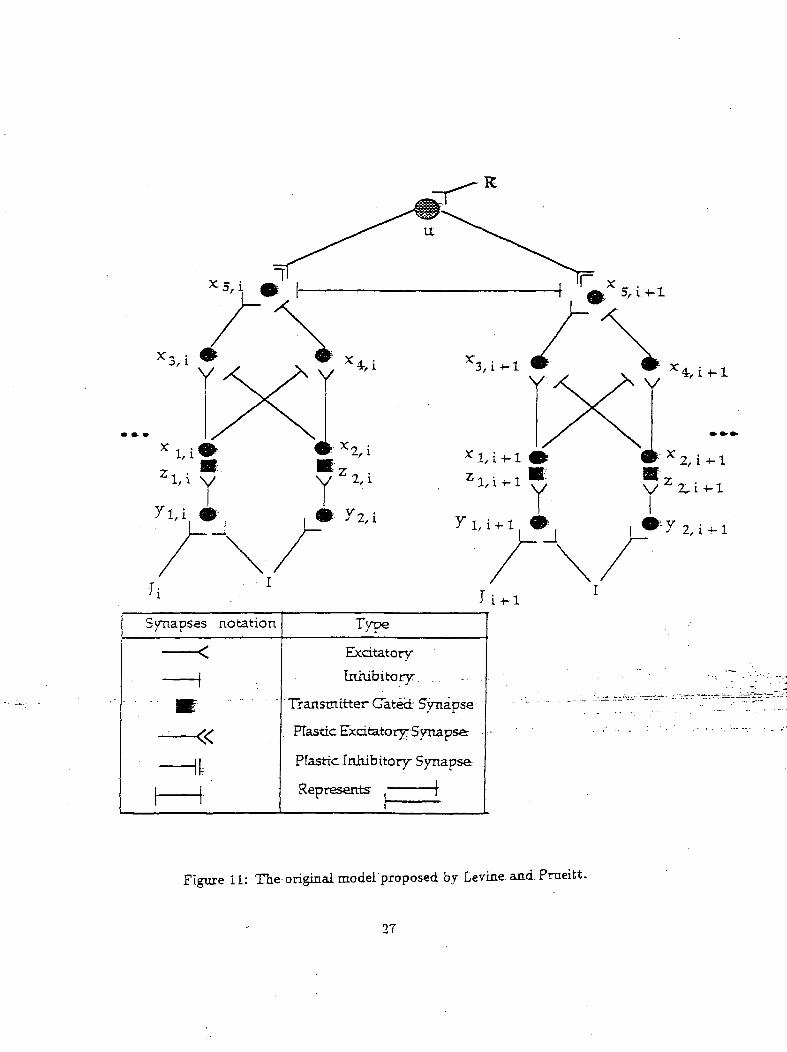
Figurell shows the neuraLnetwork-proposed.b.y_Levine and.Prueitt to explain Pribram's psychology
ical results. This network comprises of a number of gated dipoles coupled to each other (only two-gated ,
dipoles are shown for simplicity and the subscript i implies a specific gated" dipole). Each" of "the- gated
dipole corresponds to an object in the environment. The presence of an object in the environment is
indicated by the input J ("on" implies presence of an object and "off" implies its absence). The activity
of z5ii neurons indicate the possibility that the model is chosing that particular object. Thus the zg,i
node with the highest activity is the object that the model has chosen. A nonspecific arousal input / is
7For a detailed discussion of the gated-dipole dynamics refer to-Grossberg(Grossberg, 1972)
26
Synapses notation Type
Excitatory
Inhibitory ... ...
Transmitter Catect Synapse
PTastic Excitatory; Synapse:
Plastic Inhibitory Synapse-
Represents •—\
Figure 11: The-original model proposed by Eevine and Prueitt.
27
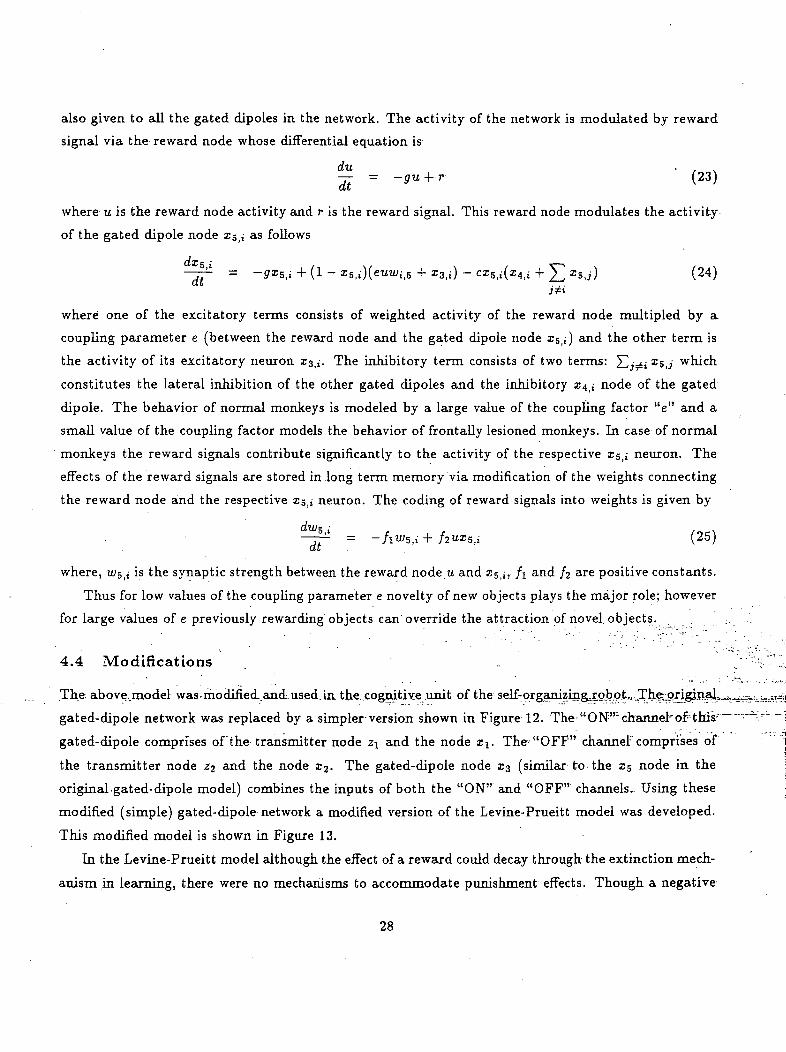
also given to all the gated dipoles in the network. The activity of the network is modulated by reward
signal via the reward node whose differential equation is
Iti = -gu + r ' (23)
where u is the reward node activity and r is the reward signal. This reward node modulates the activity
of the gated dipole node x$:i as follows
(1 J* e '
—(tt(24)
where one of the excitatory terms consists of weighted activity of the reward node multipled by a
coupling parameter e (between the reward node and the gated dipole node z5|i) and the other term is
the activity of its excitatory neuron x$^. The inhibitory term consists of two terms: S^ zsj which
constitutes the lateral inhibition of the other gated dipoles and the inhibitory z4i; node of the gated
dipole. The behavior of normal monkeys is modeled by a large value of the coupling factor "e" and a
small value of the coupling factor models the behavior of frontally lesioned monkeys. In case of normal
monkeys the reward signals contribute significantly to the activity of the respective Zs,; neuron. The
effects of the reward signals are stored in long term memory via modification of the weights connecting
the reward node and the respective ZB,; neuron. The coding of reward signals into weights is given by
—~ i , (25)
where, w5ii is the synaptic strength between the reward node u and z5|;, /j and /2 are positive constants.
Thus for low values of the coupling parameter e novelty of new objects plays the major role; however
for large values of e previously rewarding objects can override the attraction of novel objects. . ,
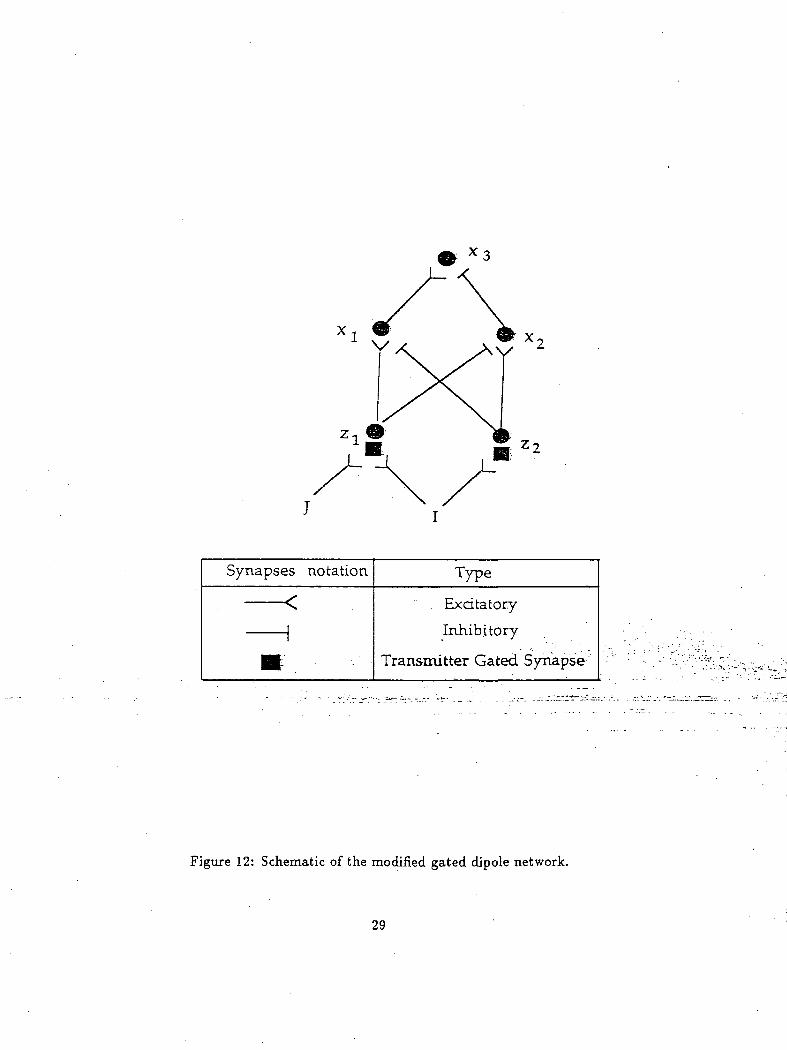
4.4 Modifications ..
The above, .model was.modified.and.used.in the cognitive .unit of the self-organizmger5_b.9til,JThe^p.rigjn.al^
gated-dipole network was replaced by a simpler version shown in Figure 12. The- "ON"1 channel" of1 this1"
gated-dipole comprises of the transmitter node z\. and the node x\. The "OFF" channel" comprises of
the transmitter node z^ and the node z2. The gated-dipole node za (similar to the xs node in the
original -gated- dipole model) combines the inputs of both the "ON" and "OFF" channels.. Using these
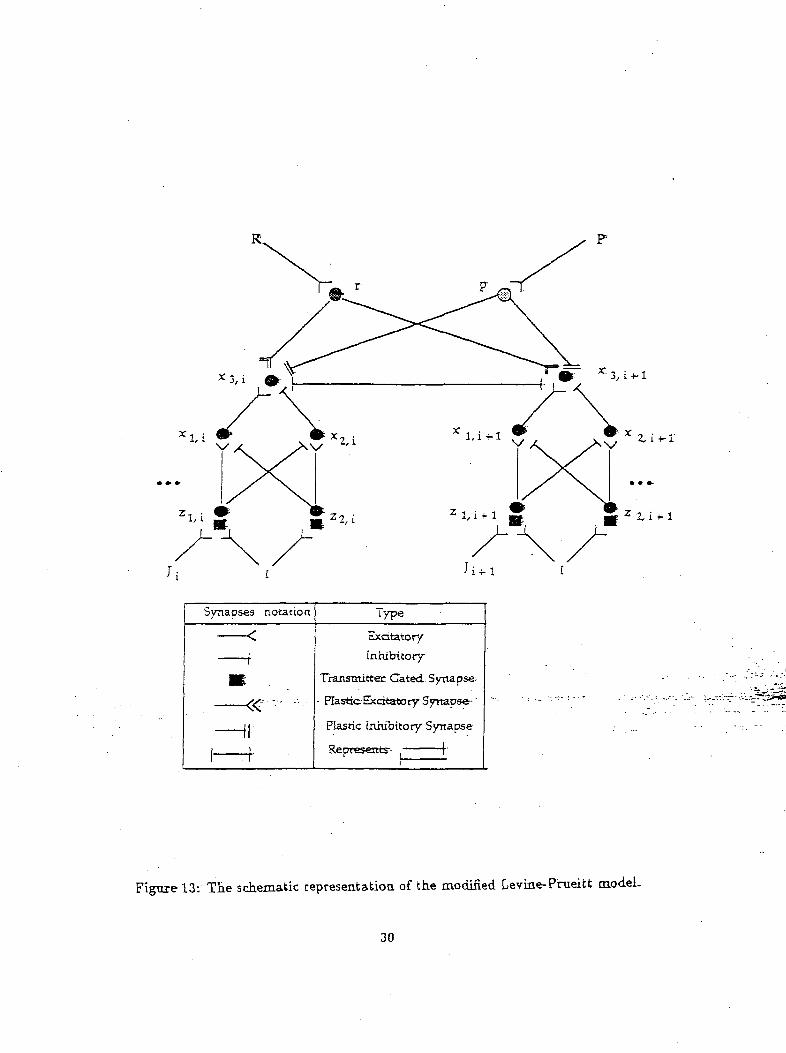
modified (simple) gated-dipole network a modified version of the Levine-Prueitt model was developed.
This modified model is shown in Figure 13.
In the Levine-Prueitt model although the effect of a reward could decay through the extinction mech-
anism in learning, there were no mechanisms to accommodate punishment effects. Though a negative
28
Synapses notation Type
Excitatory
Inhibitory
Transmitter Gated Synapse'
Figure 12: Schematic of the modified gated dipole network.
29
3,1-1-1
Synapses notation
<
\
m— «
(|;
1 -f
Type
Excitatory
Inhibitory
Transmitter Gated Synapse;
- Plastic Excitatory Synapse^"
Plastic Inhibitory Synapse
Represents-- ( [•
2,1-1-1
Figure-13: Tie schematic representatioa of the modified Levine-Pnieitt model.
30
reward input may seem to enable the model to incorporate punishment by using the same connection,
a closer examination reveals that such a strategy would create an ambiguity due to the asymmetry of
reward and punishment signals. Assume that a synaptic weight has been increased due to a repetitive
application of reward signals for a particular object. Such a. reinforcement would indirectly increase
the effect of punishment input as well. The single LTM scheme cannot independently store-in LTM
reward and punishment signals and thus creates an ambiguity. In order to achieve an independent LTM
storage, we introduce separate LTM traces using separate reward and punishment synapses. However,
this solution implies a subtle asymmetry property for encoding reward and punishment by Hebbian
synapses. A reward signal causes an increase in the post-synaptic neuron activity and thus the LTM
trace correlates increases in pre and post synaptic activities and reinforces this increase. An asymme-
try arises in punishment: A punishment signal depresses the post-synaptic activity. The LTM trace
of punishment correlates increasing pre-synaptic activity with decreasing post-synaptic activity. In a
Hebbian synapse this asymmetry causes a major problem since the inhibiting synapse cannot effectively
code the STM traces. Moreover such a coding would also be relatively insensitive to punishment with
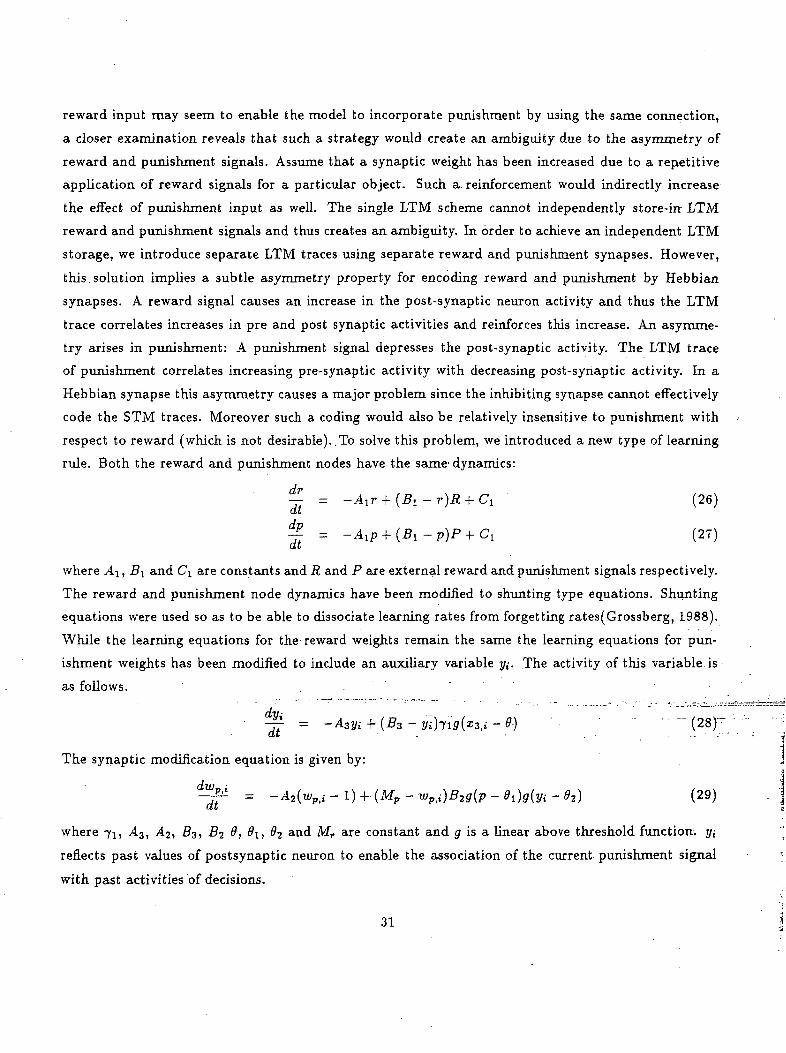
respect to reward (which is not desirable). ,To solve this problem, we introduced a new type of learning
rule. Both the reward and punishment nodes have the same- dynamics:
f£ = -A1r + (B l - r )R + Cl (26)at
Cl (27)at
where A\ , B\ and C\ are constants and R and P are external reward and punishment signals respectively.
The reward and punishment node dynamics have been modified to shunting type equations. Shunting
equations were used so as to be able to dissociate learning rates from forgetting rates(Grossberg, 1988).
While the learning equations for the reward weights remain the same the learning equations for pun-
ishment weights has been modified to include an auxiliary variable j/,-. The activity of this variable is
a s follows. . . ' " ' '
(53-2Khi'ff(*3,i-0-) ' - (28)-a . . . . . - . -
The synaptic modification equation is given by:
9i} (29)
where -yi, A3, A^, 83, By 9, #1, #2 and Mr are constant and g is a linear above threshold function, yi
reflects past values of postsynaptic neuron to enable the association of the current punishment signal
with past activities of decisions.
31
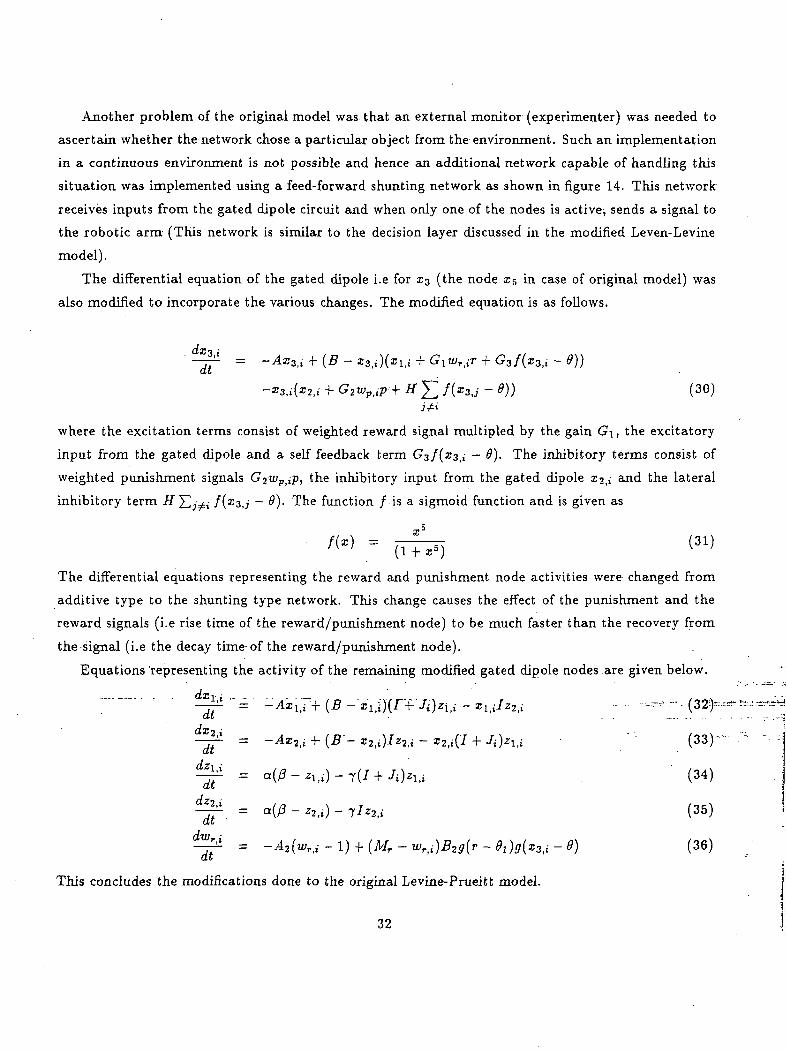
Another problem of the original model was that an external monitor (experimenter) was needed to
ascertain whether the network chose a particular object from the environment. Such an implementation
in a continuous environment is not possible and hence an additional network capable of handling this
situation was implemented using a feed-forward shunting network as shown in figure 14. This network
receives inputs from the gated dipole circuit and when only one of the nodes is active-, sends a signal to
the robotic arm (This network is similar to the decision layer discussed in the modified Leven-Levine
model).
The differential equation of the gated dipole i.e for 0:3 (the node x5 in case of original model) was
also modified to incorporate the various changes. The modified equation is as follows.
i r + G3f(x3ii ~ *))
-*3,,-(*2,i + G,wpiiP"+ H £ f(x3i j - 8)} (30)i&
where the excitation terms consist of weighted reward signal multipled by the gain GI, the excitatory
input from the gated dipole and a self feedback term G3f(x3>i — 8). The inhibitory terms consist of
weighted punishment signals G2typ,ip, the inhibitory input from the gated dipole z2|; and the lateral
inhibitory term H^j^i f(x3,j ~ #)• The function /is a sigmoid function and is given as
The differential equations representing the reward and punishment node activities were changed from
additive type to the shunting type network. This change causes the effect of the punishment and the
reward signals (i.e rise time of the reward/punishment node) to be much faster than the recovery from
the signal (i.e the decay time of the reward/punishment node).
Equations 'representing the activity of the remaining modified gated dipole nodes are given below.
dt
- Ji)zlti (34)
(33)-: •-
dt ^ ll"
^i = a(/3-z, t i)-fIz3 i i (35)
\ TJ f Q \ fi( *rt Q\ f Tft ^
dt ^ ' '
This concludes the modifications done to the original Levine-Prueitt model j32 1
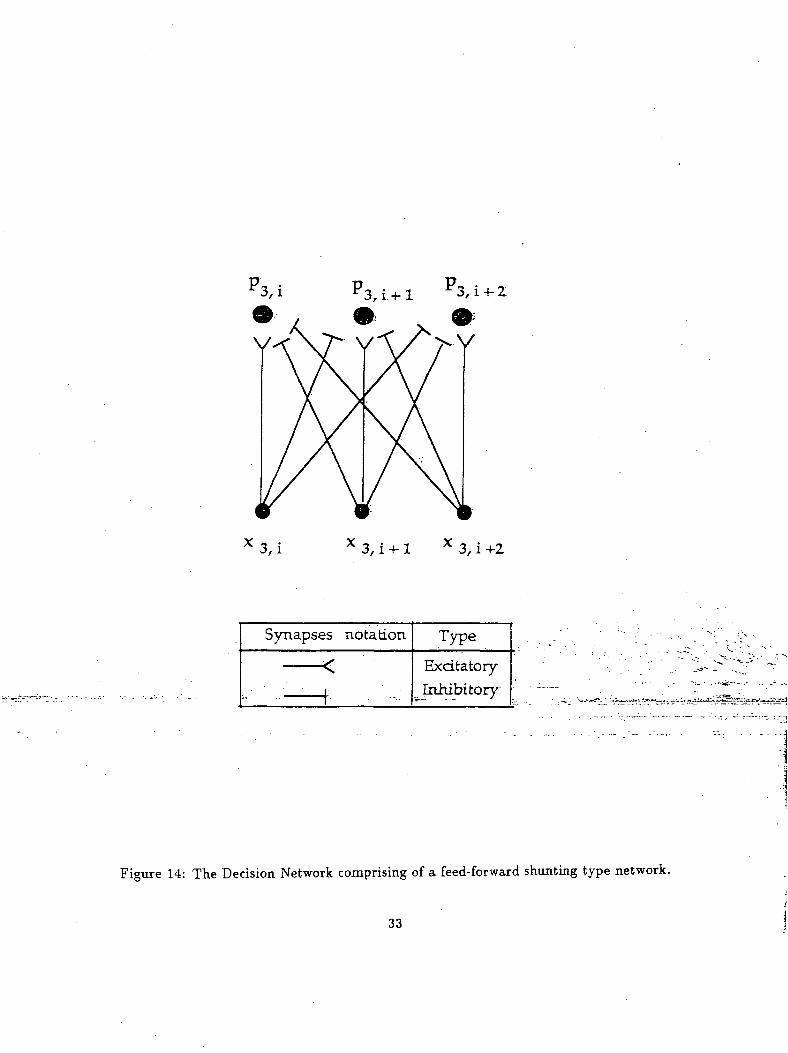
3, i -l- 1 x 3, i +2
Synapses notation
. . ~ ^ - .Type
ExcitatoryInhibitory
Figure 14: The Decision Network comprising of a feed-forward shunting type network.
33
4.5 Simulation Results
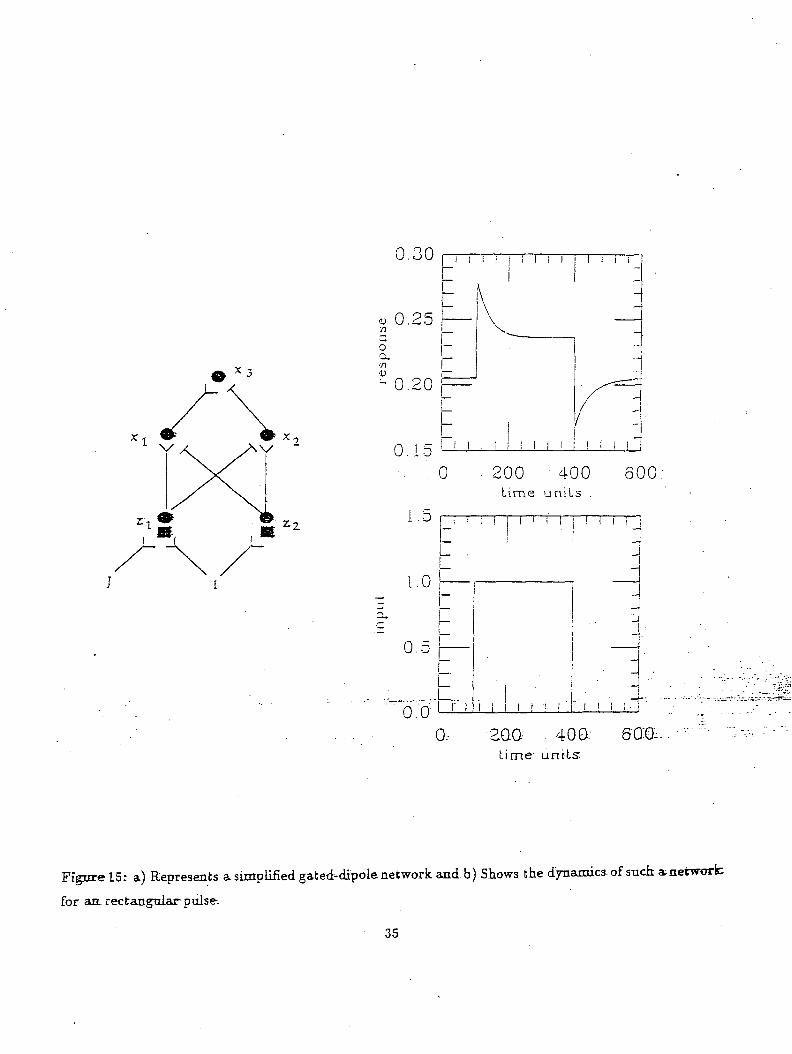
4.5.1 Simulations on Gated Dipole
Figure 15a shows a gated dipole neural network. As can be seen from the figure there are two competing
channels. A nonspecific arousal input "I" is given to both the channels. When the input "J" to the
gated dipole turns on, the greater input to the left of the channel causes x3 to be excited. Turning off
the input J causes a rebound activity to the right channel. The graph showing the input J and output
activity of the x$ neuron are give in Fig 15b.
Each of the gated dipole in the modified model represents an object in the scene. Turning "on" a
particular J; (i.e input to gated dipole) implies that a new object represented by the gated dipole has
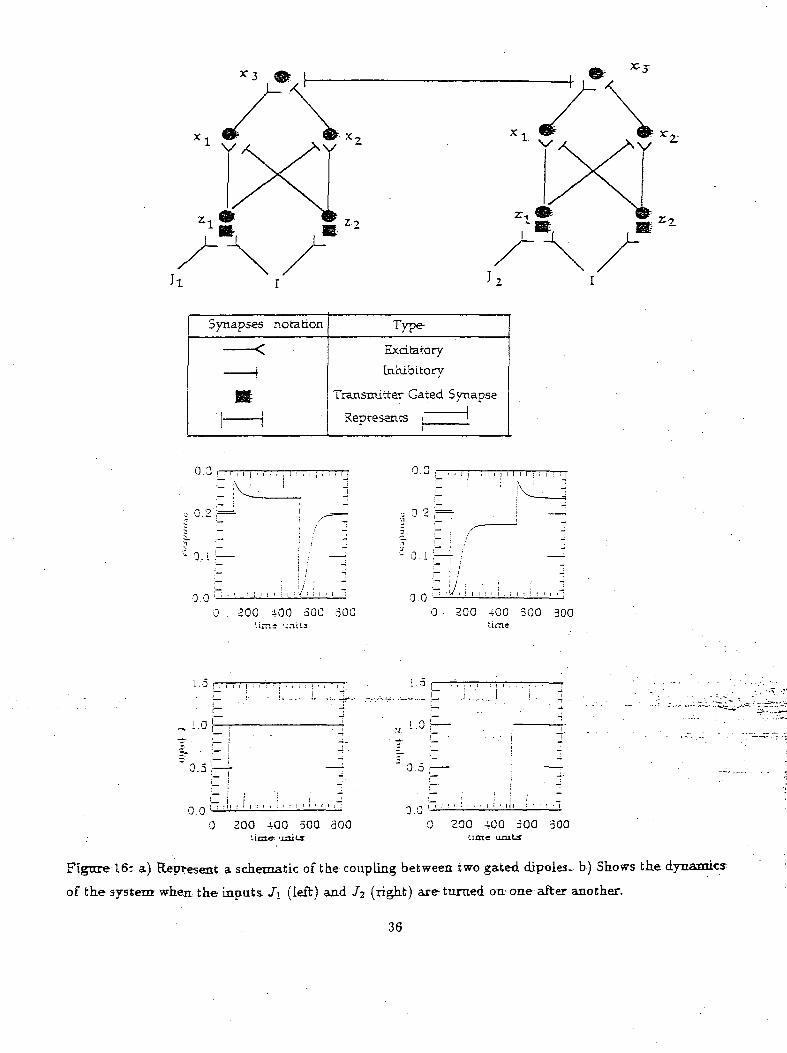
been introduced in the scene. Figure 16a shows the coupling of two gated dipoles in a lateral inhibitory
fashion. In the simulation (of Figure 16b), one object is input (i.e J\ is turned "on") and after a while
a second object is introduced (i.e J2 is turned on) into the environment. The output graph indicates
the activity of the x^,i node of the gated dipoles which represents the choice made by the model. The
gated dipole node z3i,- having the highest activity implies that, that object was chosen by the model.
The input graphs represent when a particular object was introduced in the scene. As can be seen from
the graph, initially when the first object was input the activity of the x3 neuron of the first gated dipole
increased causing a drop in the activity of 13 node of the second gated dipole thus suggesting that the
model chose the first object. When the second object was input at time "£;" the activity of 13 node of
the second gated dipole increased causing the activity of z3 node of the first gated dipole to drop. The
greater activity of the second gated dipole implied that the model had chosen the new object over the
other. Thus these simulation demonstrates a competing situation between input objects in which the
most recently "input" object was chosen.
4.5.2 Simulations on the new modified model . • ••' '/;-^..:-: •'-•
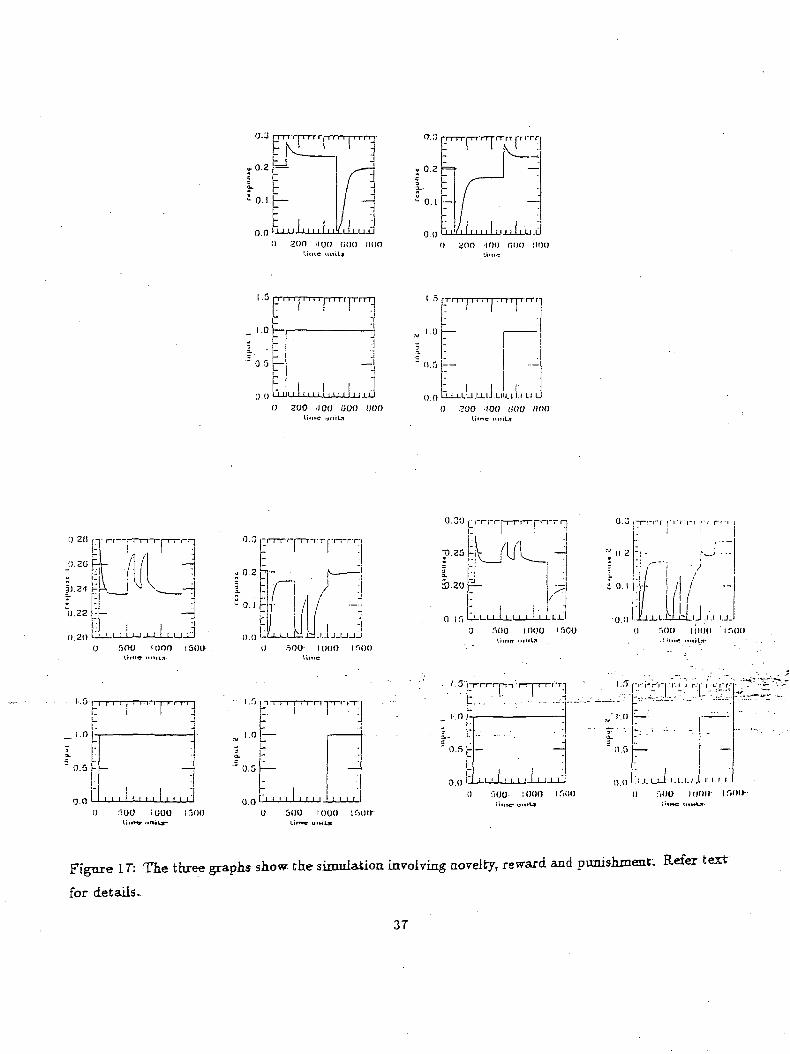
Figure: 17 illustrates- three- simulations conducted*, onfrthe* new modified. modeL shown^ir^Eig^e^-l;2J.-.
Simulation results shown are for a model comprising of two interacting gated dipoles coupled~to: reward1'
and punishment nodes. Similar to the above simulation^ each of the gated dipoles represents an. object'
in the- scene. For each pair of graphs shown, the graph on the left represents the activity of the xj node
of the first gated dipole and the graph on the right represents the activity of the 13 node of the-second
gated dipole. The gated dipole with the highest activity implies, that particular object has been chosen
by the model. The first graph illustrates how the model handles novel objects. Initially at I00timeunit3s
8The units of time is not crucial however the relative units of time between different time constants are-important hence
we have refrained from using any specific time units (e.g sees, msecs etc) and just referred to it as "time units".
34
0.30
FL
« 0.25 I7) I
•71•1)
- 0.20
L
0.15 <- d0 200 400 600.
time u n i t s .
i .5
L .
L.L
0, 2QO- . 400:Lime unttsr
Figure 15: a) Represents a simplified gated-dipole network and b) Shows tke dynasties, of such a,network
for an rectangtdar pulse.
35
Synapses notation Type
Excitatory
Inhibitory
Transmitter Gated Synapse
Represents i '
0.2',=
0.00 . 200 400 500 300
Urns units
L!/ j: ' '. '*/ i ! [ I I i I I I I i I I i i >~0.00 . 200 400 300 300
1.5 n-r
-. 1.0;—r
0.5 ;—
o . o l l ! . • . • • • • " = .0 200 4-QO 50Q 300
0.00 200 400 300 300
Figure 16: a) Represent a schematic of the coupling between two gated dipoles- b) Shows the dynamics:
of the system when the inputs /i (left) and /2 (right) are turned on one after another.
36
O.J rrrr-rrrrrrirm-rr| i n i I i i rr
'
o.o n 1 1 1 1 iu
rrn rrrrr
0 2(10 .IOO COO 1100
g (J I I I'f I I I I I M I I IJ 1 I LI I
i) ano -ion tion MOII(.imc
:''°t-I- -t-0.3t-
0.0 U-L
|
L...I....L.;!o 200 .100 uuo (joo
U»itc uniLfl
, i ,.Uj-LIJ.LllLtl.l LI L
0 300 -100 (i()0 H<IOlime nniU
0.2U [-i- i-fr-pn-n-i i i rr-j
-j0.2O I'l I I 1 I J-J LI I L-UJJ
0 fiOO K1OO I5OO-
0.0 ,-rI-
i 0.2h-
-r^r'r'r
0 500 I (H)Oli.llC
0.3U
T5.2G
33.20
n.ir, I I I I ... I 1 I'l I Ll ' l
0 .100 1000 ISOO
: o.i
- .
.M H.J .i'.i u.0.0 JUJL.U
0 :'iOO lilOO
o.n
I""1""1' :
^ -
" •" l.f)
3Q.
" 0.5
(i n
.; ... | . . . .
*- Ii i i i i i i i i
-n- IT
—
- ; . 1.5-
1.0
I.C
' 0.5 -
o.o t
r ~~1~\ 1 1 '{ 1 f"T"
1 :
1 1 1 1 1 1 1 1 1 1 1 1 1SOU- :ooo ifi
I..T
3-
n.oID
prm1;:.-1 :r ..
!l..LLJ_i I.L.LJ.
0 5OO III
• i i-' r r-
l 1 l. l
nr ir.c
f) fiOO 1 000 1 5OO 0 500 1000
Figure IT: The three graphs show the simulation involving novelty, reward and punishment. Refer textigore
for details..
37
an object is introduced.. This causes the first gated dipole's activity to rise above threshold implying
that the model selected this new object. At SOOtimeunits a second object is introduced. By this time
the first object has lost its novelty. This leads to the activation of the second gated dipole and which in
turn overrides the activity of the first gated dipole. Thus the higher activity of the second gated dipole
indicates that the model chose the second object (Note that this occurred when no reinforcement either
positive or negative was applied). This simulation shows how most recent input is more attractive than
previously unrewarded inputs (novelty).
The second pair of graphs demonstrates how previously rewarded objects are more attractive than
recently input objects. The simulation begins similar to the previous case i.e an object is input to the
scene at IQOtimeunits. However at 500 and 750 timeunits the choice of the first object by the model
is rewarded. Now when the second object is input at 1000 timeunits it fails to drive the second gated
dipole above the activity of the first gated dipole implying that the model preferred the first object over
the second (novel) object.
The third pair of graphs is a further extension of the previous simulation to include punishment sig-
nals. The simulation is similar to the previous case until 1200 timeunits.At 1200 timeunits punishment
signal is given for the choice made by the model. This lowers the activity of the first gated dipole and
the second gated dipole response rises above that of the first gated dipole. Thus punishing the initial
choice made by the model cause it to change its choice. In the above cases the punishment and reward
signals were brief pulses which lasted for 100 timeunits.
5 The combined model
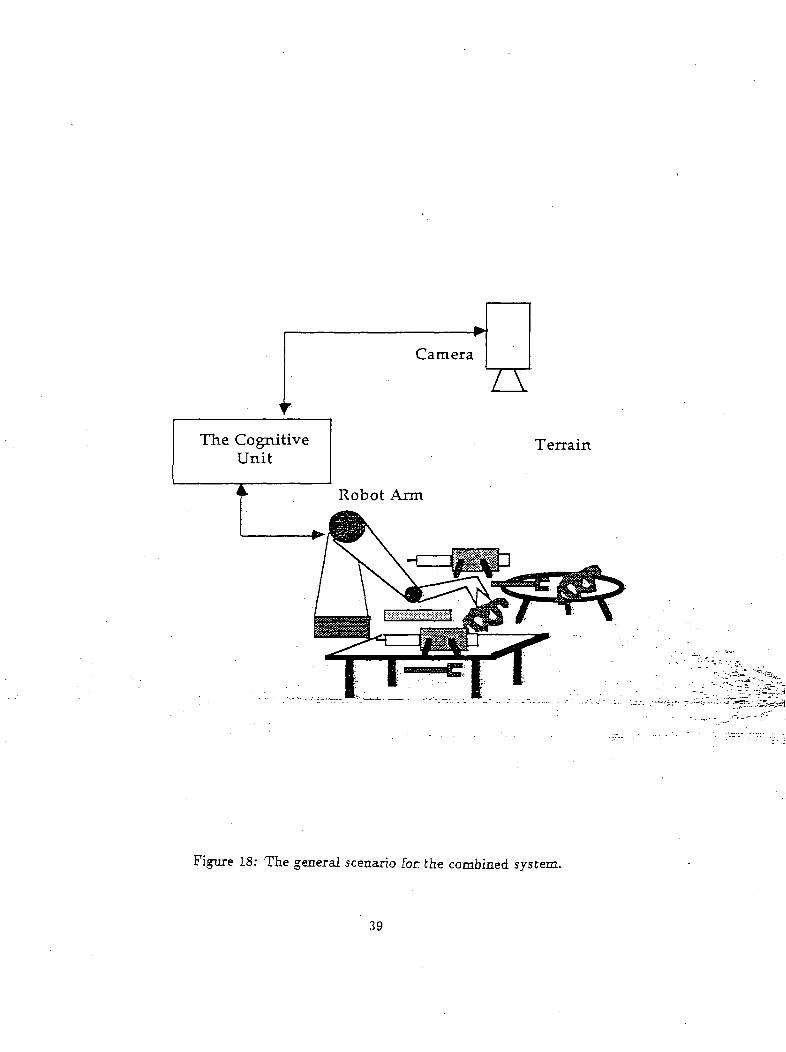
We will now describe the combination of these modules with a vision module. .For convenience of
presentation we will consider a general scenario dealing with the initiation bf the exploratory behavior.
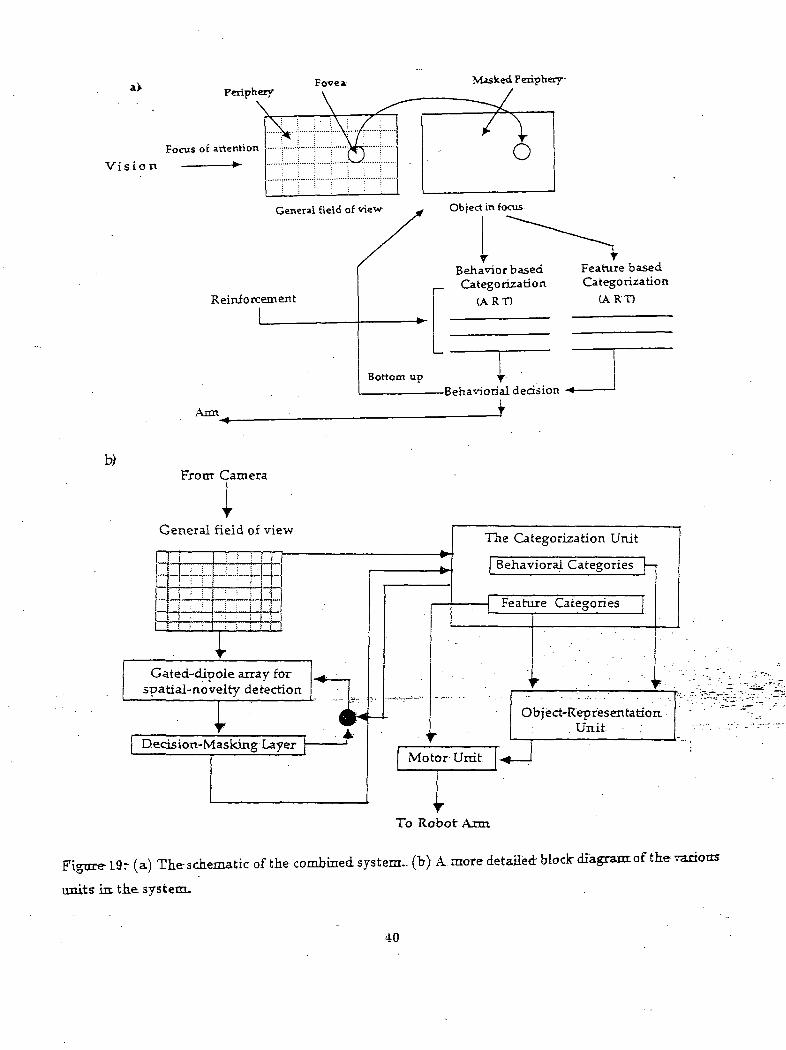
Such a scenario (Figure 18) is given.below. A-vision unit is-represented by the camera whielv is--looking? .f^-'K^/.D:
over a two dimensional'terrain; a rbbbtic'artri"performs- certain/actions-on- this"terram7and^a~c6g^tiVe'- "T** ""- "*v-
unit coordinates the camera and the-robotic arm. The camera concentrates, on a particular region and __ ---
identifies a given object in its region of focus. The cognitive unit categorizes various input objects into a .
hierarchy of categories, and makes behavioral decisions regarding, the object in focus. These^ behavioral j
decisions are modulated by novelty, habits and external reinforcement signals. Behavioral decision units j
interact with object-representation units and a signal is send to the arm as to "reach" for the object ;
whenever appropriate. The schematic view of the various process involved and the interactions between j
them are given in Figure 19a. Figure 19b gives a more detailed block diagram of this system. All further
discussions are related to Figure 19. We begin first from the vision unit. . I
I38
Camera
The CognitiveUnit
Robot Arm
Terrain
Figure 18: The general scenario for the combined system.
39
a> Periphery
\
Fovea.-
Focus of attention
Vis io n
General field of view
Reinforcement
Aim
Masked. Periphery
Object in focus
Behavior basedCategorization
(ART)
Feature basedCategorization
(ART)
Bottom up L-Behaviorial decision -4-
i7
b)Frorrr Camera
General field of view
...J....L...UJ.
Gated-dipole array forspatial-novelty detection
Decision-Masking Layer
The Categorization Unit
Behavioral Categories
Feature Categories
Object-RepresentationUnit-
To Robot Ann
Figure 19? (a) The schematic of the combined system., (h) A. more detailed block diagram of the various
units in the system.
40
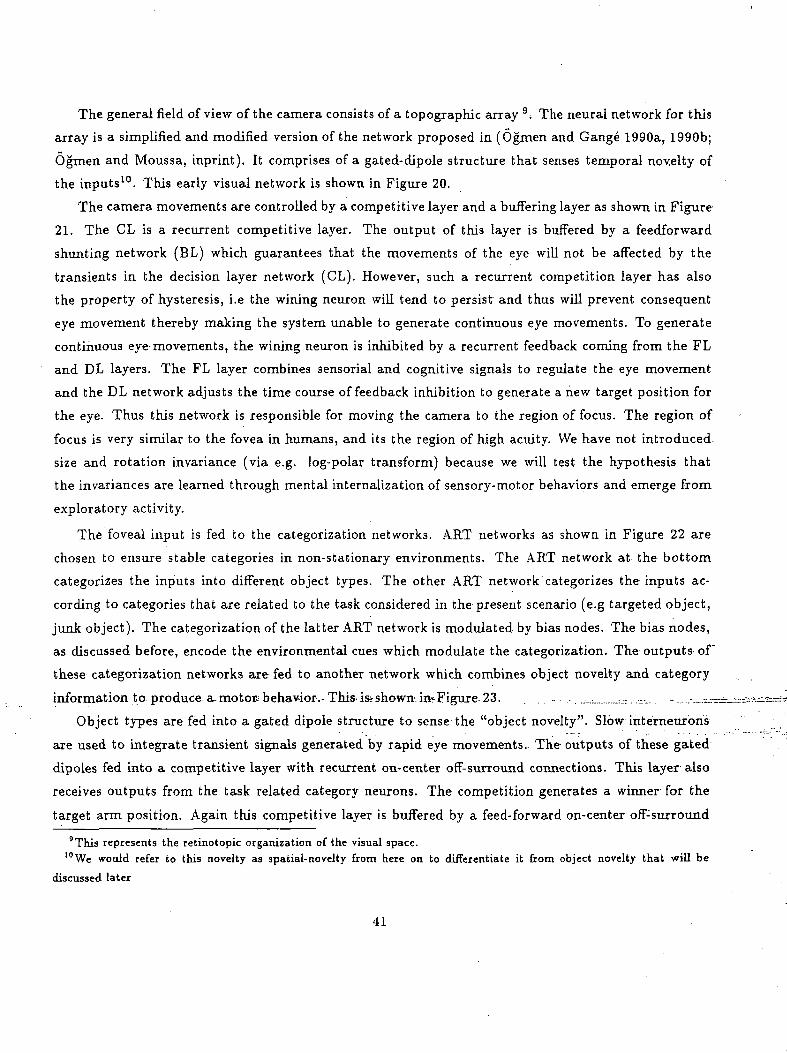
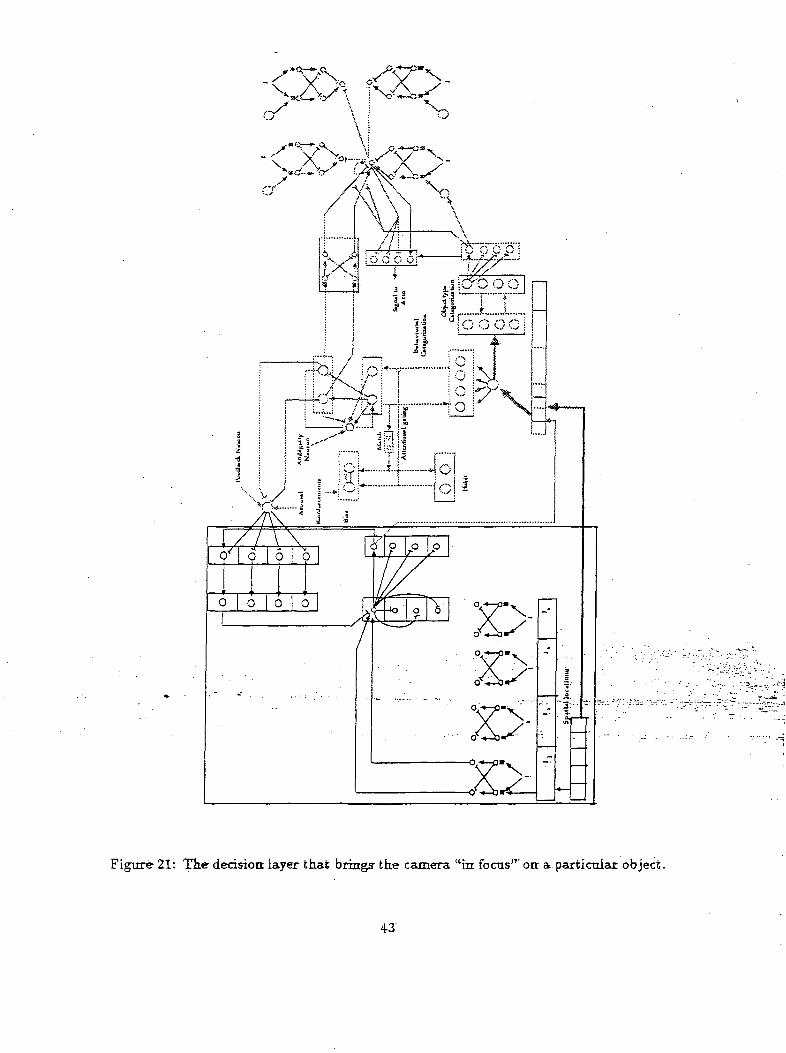
The general field of view of the camera consists of a topographic array 9. The neural network for this
array is a simplified and modified version of the network proposed in (Ogmen and Gange 1990a, 1990b;
Ogmen and Moussa, inprint). It comprises of a gated-dipole structure that senses temporal nov.elty of
the inputs10. This early visual network is shown in Figure 20.
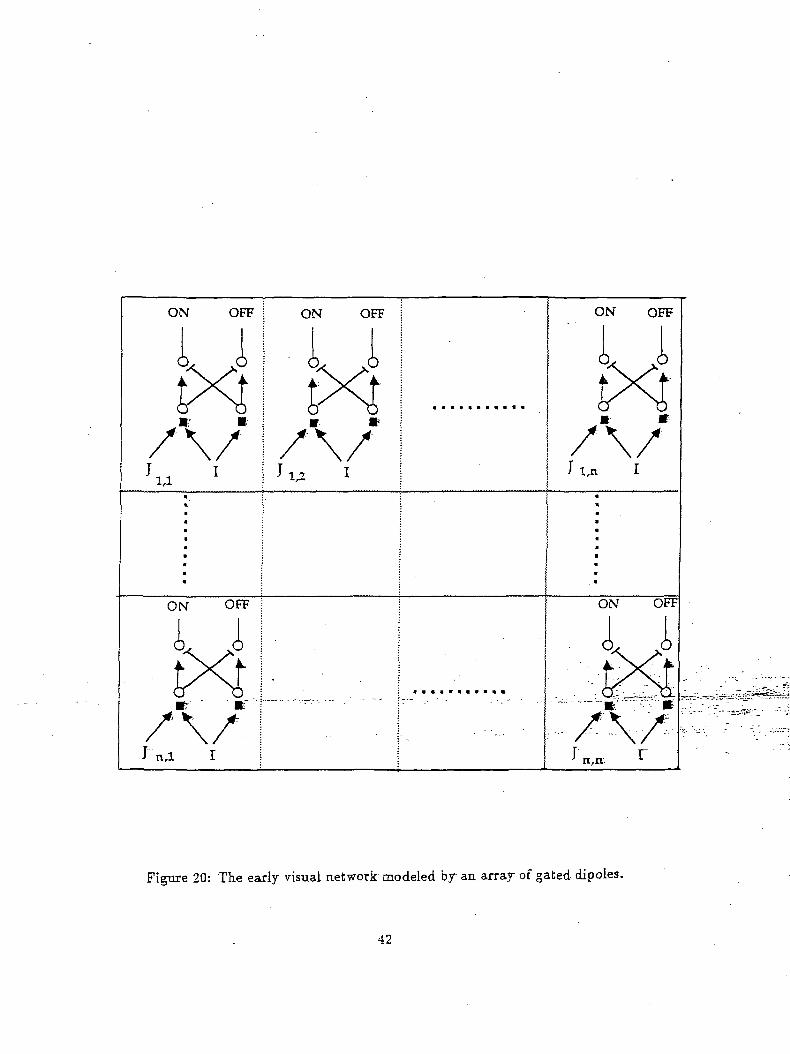
The camera movements are controlled by a competitive layer and a buffering layer as shown in Figure
21. The CL is a recurrent competitive layer. The output of this layer is buffered by a feedforward
shunting network (BL) which guarantees that the movements of the eye will not be affected by the
transients in the decision layer network (CL). However, such a recurrent competition layer has also
the property of hysteresis, i.e the wining neuron will tend to persist and thus will prevent consequent
eye movement thereby making the system unable to generate continuous eye movements. To generate
continuous eye movements, the wining neuron is inhibited by a recurrent feedback coming from the FL
and DL layers. The FL layer combines sensorial and cognitive signals to regulate the eye movement
and the DL network adjusts the time course of feedback inhibition to generate a new target position for
the eye. Thus this network is responsible for moving the camera to the region of focus. The region of
focus is very similar to the fovea in humans, and its the region of high acuity. We have not introduced
size and rotation invariance (via e.g. log-polar transform) because we will test the hypothesis that
the invariances are learned through mental internalization of sensory-motor behaviors and emerge from
exploratory activity.
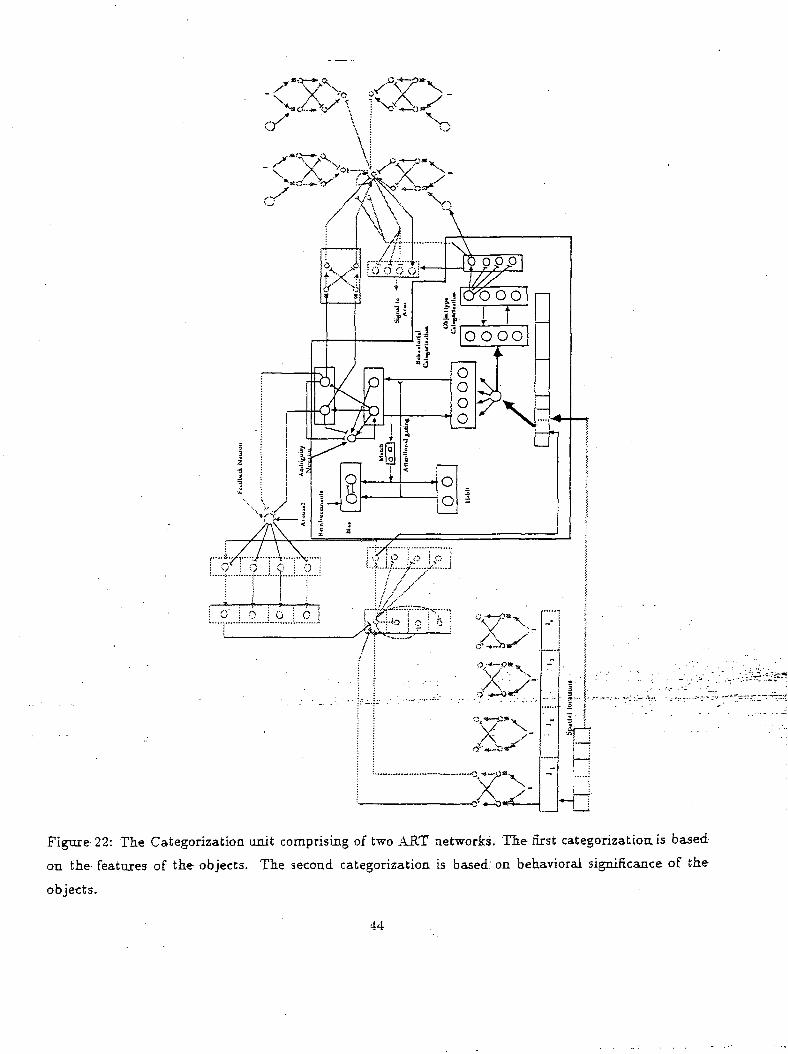
The foveal input is fed to the categorization networks. ART networks as shown in Figure 22 are
chosen to ensure stable categories in non-stationary environments. The ART network at the bottom
categorizes the inputs into different object types. The other ART network categorizes the inputs ac-
cording to categories that are related to the task considered in the present scenario (e.g targeted object,
junk object). The categorization of the latter ART network is modulated by bias nodes. The bias nodes,
as discussed before, encode the environmental cues which modulate the categorization. The outputs of"
these categorization networks are fed to another network which combines object novelty and category
information to produce a~motoE behavior. This-i&-shown.in*Figure 23. . . ...„.: -..-.-.:-.•..- -...---.~-
Object types are fed into a gated dipole structure to sense-the "object novelty". Slow interaeurons
are used to integrate transient signals generated by rapid eye movements. The outputs of these gated
dipoles fed into a competitive layer with recurrent on-center off-surround connections. This layer also
receives outputs from the task related category neurons. The competition generates a winner for the
target arm position. Again this competitive layer is buffered by a feed-forward on-center off:surround9This represents the retinotopic organization of the visual space.
'"We would refer to this novelty as spatial-novelty from here on to differentiate it from object novelty that will be
discussed later
41
ON OFF | ON OFF
.• •
ON OFF
Jl,n I
ON OFF ON OFF
J"rU I
Figure 20: The early visual network modeled by an array of gated dipoles.
42
y 77W-K>-x-\
(
c
f-,<
)
!i
i
//
C
' \^
7iii•<-)
)
1\\\
0
*y
>*
\
<:
• I<
\I
1!
c
;.
e
Z
'
a
D
/
^ I\.A}f^v a
-i— : //-•- : /'Q«./
/N'•<-* —7f4t>
^^•"v"
I,-,
; .--*; '•— ':
J
\\\N AM i •>
\ .'"'!• \\
! d O O Oi"1 :.X.Jy7 ii.J
i ' '/S" '• ' ' \ |-~'i .-"N 1 r
^ , M 1" ^ J ° f
^ 3i *3n^r57q3| i •-' ••-' ^ -' ;4* $-
• — ; ^ /•> i i' A ^"' ' •»
$ f ^i?X I^T.-' :..,...; _ *.. • ' >.
*" F i 1 1 i-]R j3-0 j•] !i j
I . 1 ^ 1* 1 0 =[ ;
!-•''" 1
1 ? ° fI / /
.<£-io o ^o °<*~/p"Vx,-iAT r ° V \.
/ ' oOb-*^/
V N-cA^
~1
-
...
•T
J~~
J
|
X~3' ^
VI
•*—
~
Figure 21: 'The decision: layer that brings' the camera "in focus" oit a particular object.
i 0 i 0 i 0
L
f"
A
:J.£..];:L ::.J
Ij L^ • .Ci.J0 | ~ ; r^ i °\~7"'*\\ •• i r ; ; V
iXy/\ /"
O' i*™ ) ^
,_,r*' «. -rmt -- ,,, —
I j.rr
Figure 22: The Categorization unit comprising of two AB.T networks. The first categorization, is based
on the features of the objects. The second categorization is based: on behavioral significance of the
objects.
44
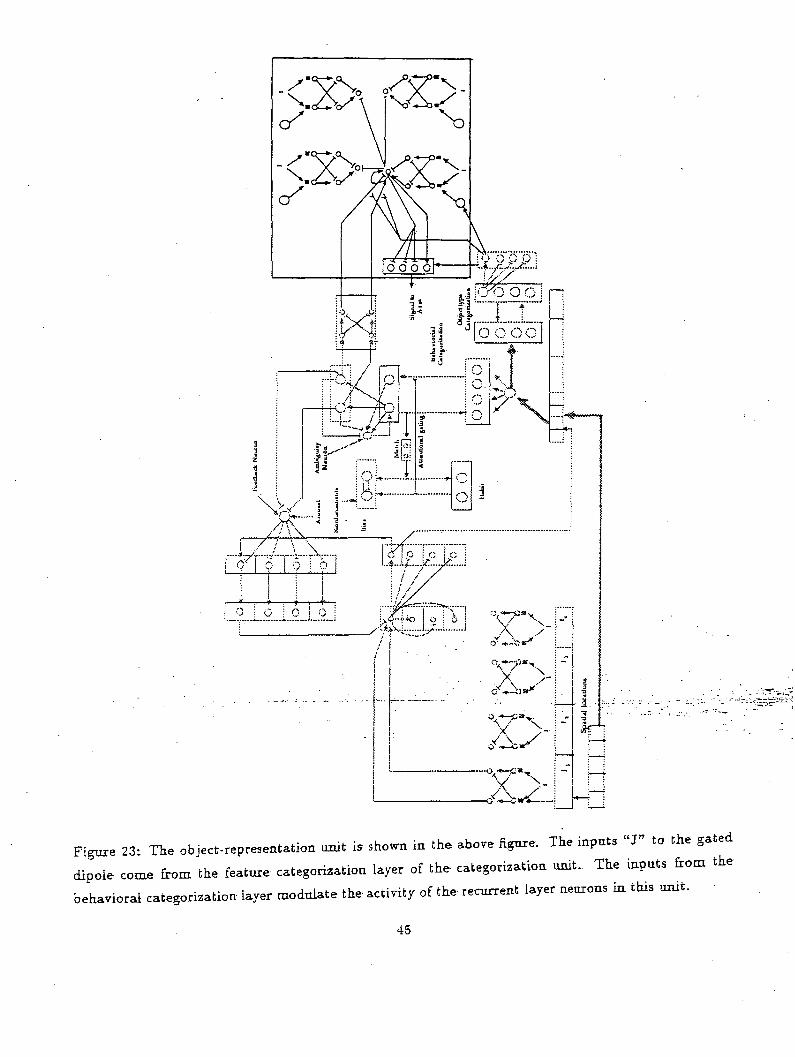
Figure 23: The object-representation unit is shown in the above figure. The input. «J» to the gated
dipole come from the feature categorization layer of the categorization unit. The inputs from the
behavioral categorization layer modulate the activity of the recurrent layer neurons in this unit.
45
network to filter the transients. This buffering layer is gated by an eye position signal to transfer eye
position to arm position via a eye-hand coordination network. Thus the combined model would be
capable of dynamically locating objects present in its environment and to issue a signal to the robot
arm to pick up the object if it is a "targeted object".
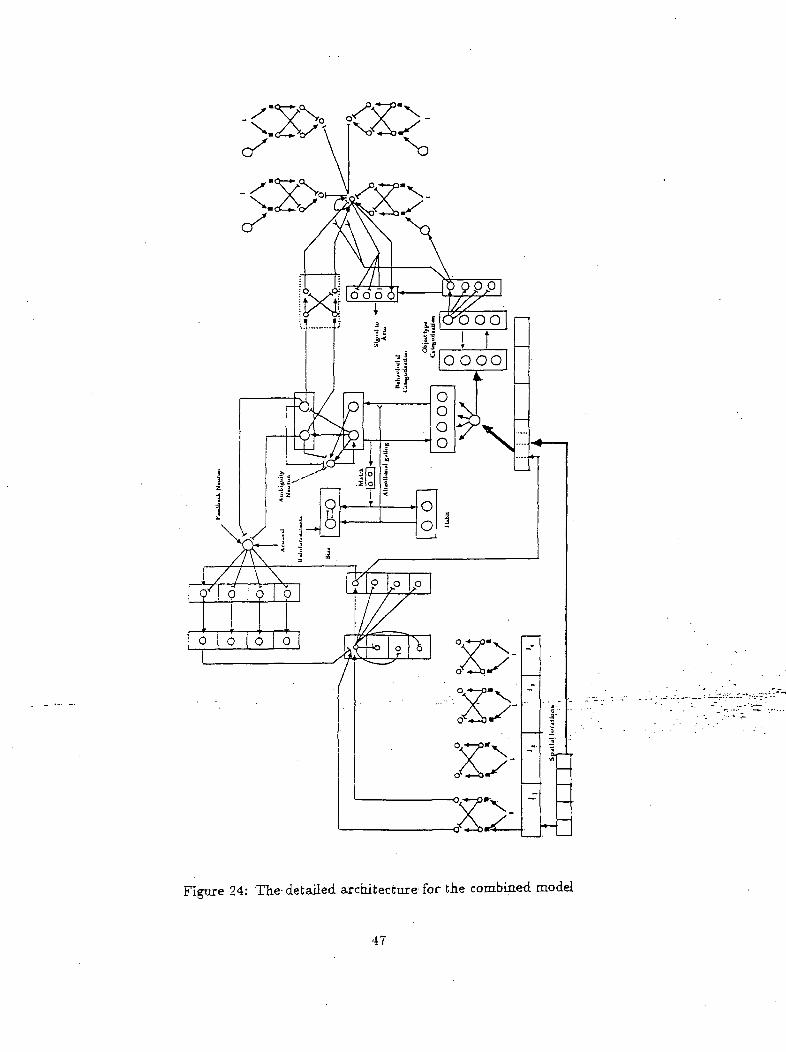
5.1 Ambiguity in decision making
In this section we will discuss two combined networks that resolve decisional ambiguities. The first,
combined architecture is shown in Figure 24. As discussed before, input features of the object in focus
are fed to the ART networks. Initially when an object is present in the- environment, no behavioral
significance is attached to it and an ambiguity exists for the classification of the object as targeted
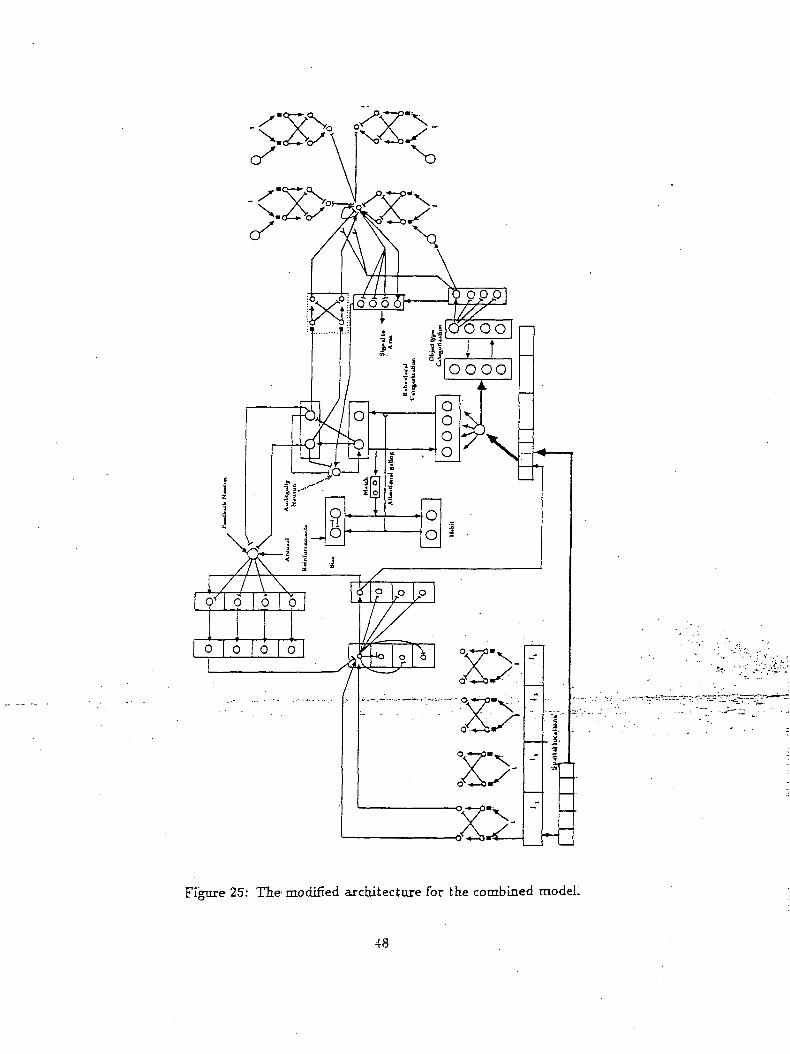
or non-targeted object. The architecture of Figure 25 resolves this ambiguity by biasing the targeted
object via the ambiguity neuron. This "positive bias" is used whenever there is insufficient evidence to
reach a decision. On the other hand, such a bias forces the system to make a decision for all inputs. A
consequence of this, is that novelty plays no role in the decision making, since it is always overridden
by the task related decision.
A modification to the above architecture is presented in Figure 26. Note that the inputs that drive
the ambiguity neuron in this case come from the decision layer neurons of the object representation
network. This modification enables the novelty of the object to play a part in the behavioral decision
making process. Now consider the same situation as stated before where an ambiguous object is placed
in the environment. In the present situation when a behavioral indecision occurs, the competitive layer
feeding to the motor circuits receive their major inputs from the gated dipoles representing object
novelty. This signal in turn drives the ambiguity neuron which in turn biases the "targeted" category
neuron thus proclaiming the object in focus to be a targeted object. Thus in this modified combined
architecture novelty play an important role in cognitive decision making. . • •
In the next subsection we will present the various differential equations that describe the combined
model-.. , , . . - . . . . . ._-- . . ._. „.., . . . . . . . . _-....,. ^u_.^.^^^_..,_
5.2 Combined neural model
As mentioned above the combined model comprises of three-major'networks: the visual scanning net-
work, the cognitive network and the object representation network. The two models discussed above
differ only in the implementation of the ambiguity neuron. Hence we will first discuss the differential
equations common to both models and finally discuss the ambiguity neuron equation for each case.
46
) pp;p
|(3rt)0
iO
33
0\.
OOOj
\
k.
c
c
/
>
(
c
3 U
5 | C
3
)
<
C
D
) |
X
x
Figure 24: The detailed architecture for the combined model
47
. /7K < 3 JrTTT0* O
O
oA>X
HI
Figure 25: The modified architecture for the combined model.
48
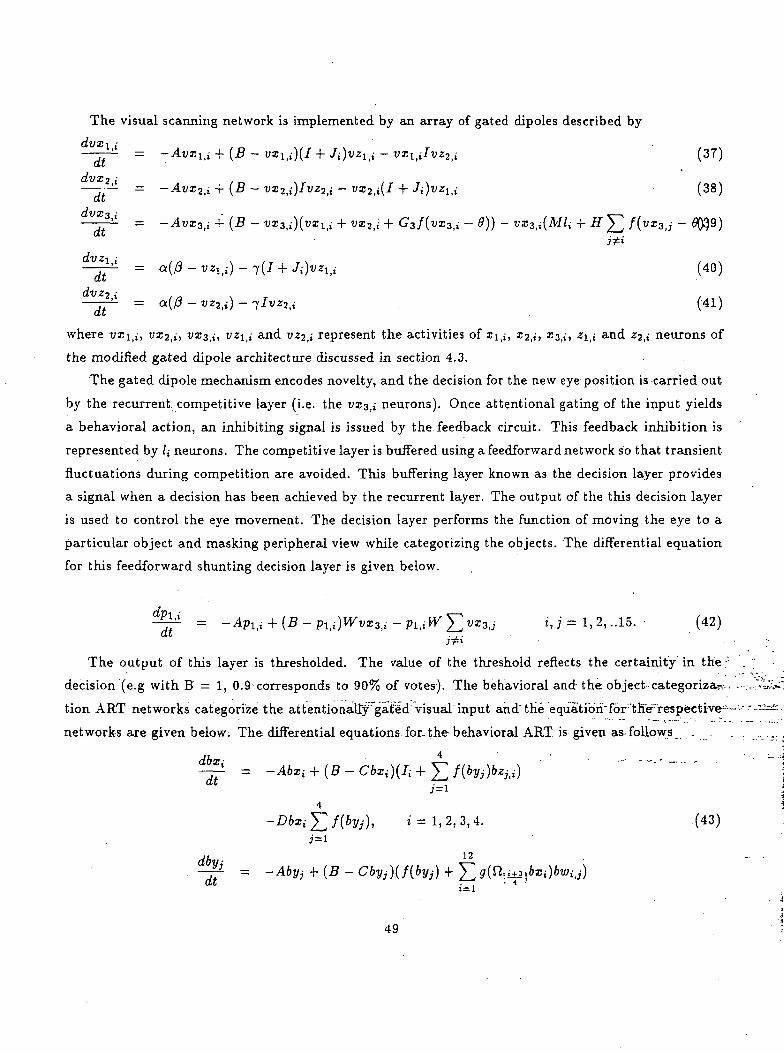
The visual scanning network is implemented by an array of gated dipoles described by
'' ti + (B - vxij)(I + Ji)vzlii - vxliilvz-i,i (37)
{- = ~AvX2,i + (B - l/Zj.iKvZj.j - VX2,i(I + Ji)vZi ti (38)
(40)dt ^ l'"
- = a(/3 — uz2,i) — 7/uz2,i (41)
where vx\ t{, ui2,i> ^^3ii, vz\^ and u22|i represent the activities of zi,;, Z2,i, Z3,i, ^i,i and zj^ neurons of
the modified gated dipole architecture discussed in section 4.3.
The gated dipole mechanism encodes novelty, and the decision for the new eye position is carried out
by the recurrent competitive layer (i.e. the ^13,1 neurons). Once attentional gating of the input yields
a behavioral action, an inhibiting signal is issued by the. feedback circuit. This feedback inhibition is
represented by li neurons. The competitive layer is buffered using a feedforward network so that transient
fluctuations during competition are avoided. This buffering layer known as the decision layer provides
a signal when a decision has been achieved by the recurrent layer. The output of the this decision layer
is used to control the eye movement. The decision layer performs the function of moving the eye to a
particular object and masking peripheral view while categorizing the objects. The differential equation
for this feedforward shunting decision layer is given below.
(B-p l , i)Wvx3 t i-p l , iW'£ ivx3 , j i, j = 1,2,. .15. (42)
The output of this layer is thresholded. The value of the threshold reflects the certainity in the:' , "
decision (e.g with B = 1, 0.9 corresponds to 90% of votes). The behavioral and the object categoriza,-,, . -,:-^i-
tion ART networks categorize the attentionaily'rgat:ed visual'input and'the equatirori"f6r'th"e~respectivei--:-''-"——
networks are given below. The differential equations for-the behavioral ART. is given as- follows . . .... . ....
= 1,2,3,4. (43)
12
49
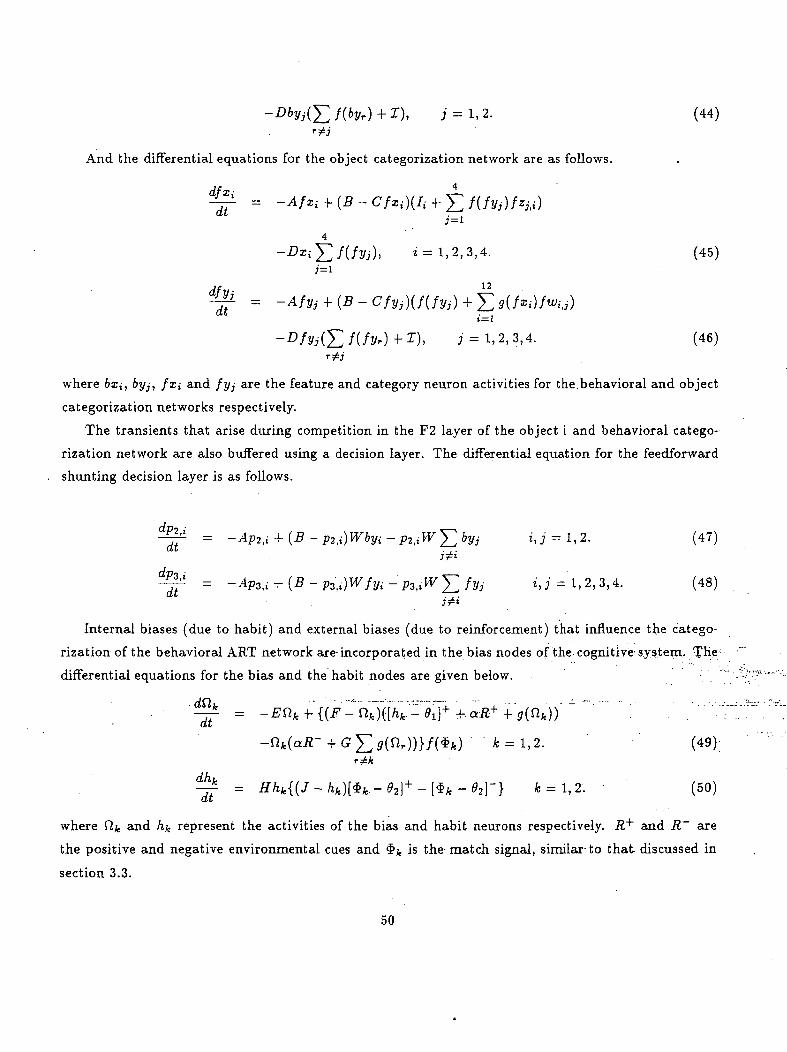
+I), j = l,2. (44)
And the differential equations for the object categorization network are as follows.
-£>*,- E/(/0j). 1=1 ,2 ,3 ,4 . (45)
+I), 3 = 1,2,3,4. (46)
where &z;, byj, fx{ and /t/j are the feature and category neuron activities for the. behavioral and object
categorization networks respectively.
The transients that arise during competition in the F2 layer of the object i and behavioral catego-
rization network are also buffered using a decision layer. The differential equation for the feedforward
shunting decision layer is as follows.
p t> iW^ iby i i, j = l,2. (47)
= -Ap3,i + (B-p 3 i i )Wfy i -p 3 t i Wj2fy j i,j' = 1,2,3,4. (48)j/«
Internal biases (due to habit) and external biases (due to reinforcement) that influence the catego-
rization of the behavioral ART network are- incorporated in the bias nodes of the cognitive system. The-
differential equations for the bias and the habit nodes are given below.
(49)
l,2. (50)
where fi^ and h^ represent the activities of the bias and habit neurons respectively. R+ and R~ are
the positive and negative environmental cues and $j. is the- match signal, similar- to that discussed in
section 3.3.
50
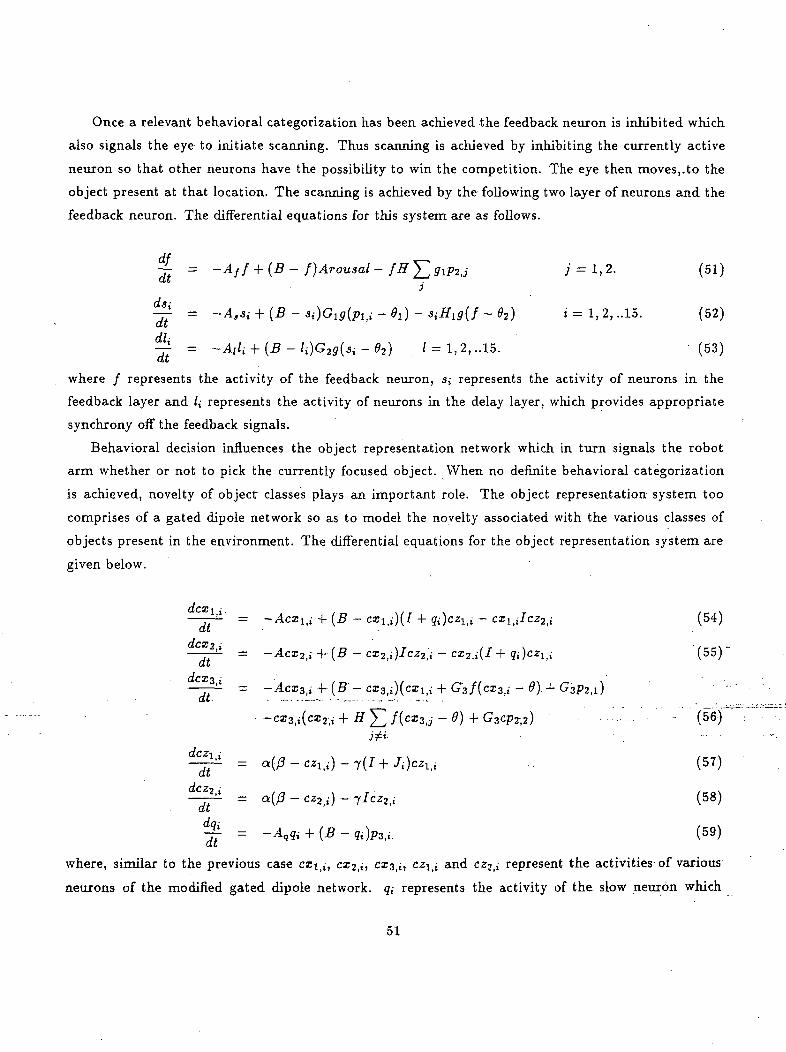
Once a relevant behavioral categorization has been achieved the feedback neuron is inhibited which
also signals the eye to initiate scanning. Thus scanning is achieved by inhibiting the currently active
neuron so that other neurons have the possibility to win the competition. The eye then moves, .to the
object present at that location. The scanning is achieved by the following two layer of neurons and the
feedback neuron. The differential equations for this system are as follows.
(B-f)Arousal-fHY,9iPi, j j = 1,2. (51)i
e2) t = l,2,..15. (52)tat
-± = ~Aili + (B-l i )G,g(3i-e 2 ) / = 1,2,..15. (53)
where / represents the activity of the feedback neuron, 3; represents the activity of neurons in the
feedback layer and ^ represents the activity of neurons in the delay layer, which provides appropriate
synchrony off the feedback signals.
Behavioral decision influences the object representation network which in turn signals the robot
arm whether or not to pick the currently focused object. When no definite behavioral categorization
is achieved, novelty of object classes plays an important role. The object representation system too
comprises of a gated dipole network so as to model the novelty associated with the various classes of
objects present in the environment. The differential equations for the object representation system are
given below.
'' i + (B - cxi t i)(I + qi)cz-iti - cz1,;Icz2,; (54)
—~ ~ + (B - cx2,i)Icz2,i - cx2ii(I + qi)cz l i i (55)
~cx3ti(cxrii + H £ f(cx3,j -9) + G3cp2-2) ....... .... -" ' (56)
dt ^ 1>"!,; (58)dt ^ *'1'
~ = —Aqqi -f (B — qi)p2,i. (59)
where, similar to the previous case cx\^ cx2ii, cx^^, c.z\^ and cz2,i represent the activities-of various
neurons of the modified gated dipole network, g,- represents the activity of the; slow neuron which
51
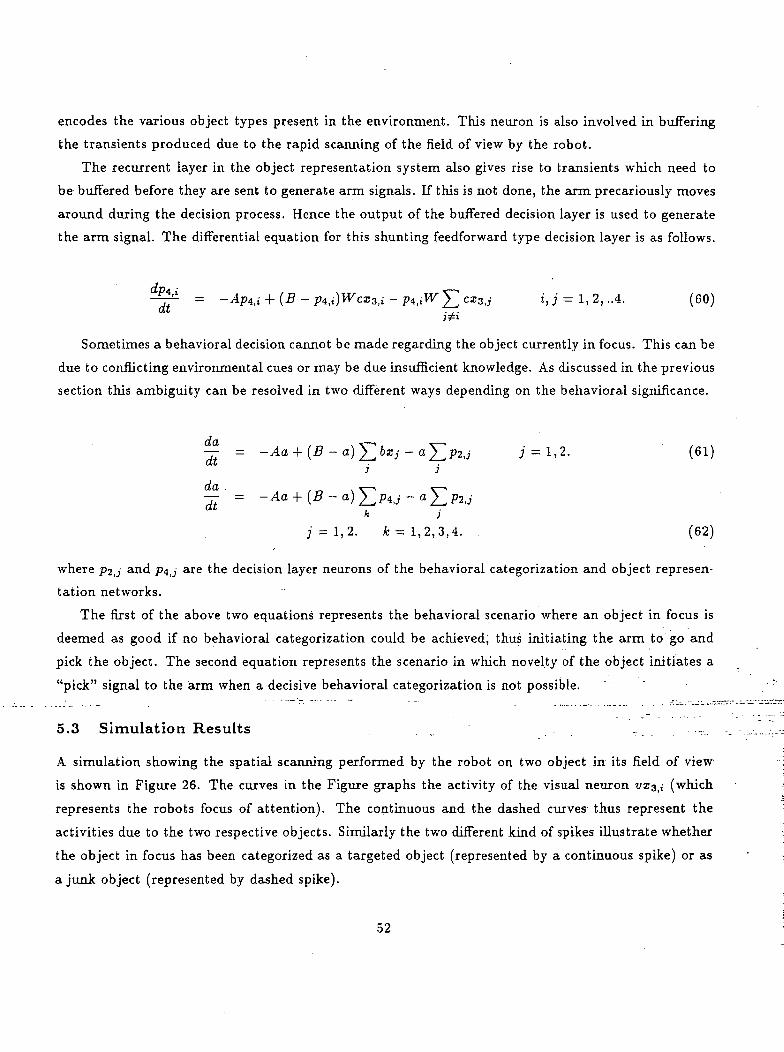
encodes the various object types present in the environment. This neuron is also involved in buffering
the transients produced due to the rapid scanning of the field of view by the robot.
The recurrent layer in the object representation system also gives rise to transients which need to
be buffered before they are sent to generate arm signals. If this is not done, the arm. precariously moves
around during the decision process. Hence the output of the buffered decision layer is used to generate
the arm signal. The differential equation for this shunting feedforward type decision layer is as follows.
(60)
Sometimes a behavioral decision cannot be made regarding the object currently in focus. This can be
due to conflicting environmental cues or may be due insufficient knowledge. As discussed in the previous
section this ambiguity can be resolved in two different ways depending on the behavioral significance.
da— = -Aa
j = 1,2. (61)
(62)
where p?j and p^j are the decision layer neurons of the behavioral categorization and object represen-
tation networks.
The first of the above two equations represents the behavioral scenario where an object in focus is
deemed as good if no behavioral categorization could be achieved, thus initiating the arm to go and
pick the object. The second equation represents the scenario in which novelty of the object initiates a
"pick" signal to the arm when a decisive behavioral categorization is not possible.
5.3 Simulation Results .. -.
A simulation showing the spatial scanning performed by the robot on two object in its field of view
is shown in Figure 26. The curves in the Figure graphs the activity of the visual neuron vx3ii (which
represents the robots focus of attention). The continuous and the dashed curves thus represent the
activities due to the two respective objects. Similarly the two different kind of spikes illustrate whether
the object in focus has been categorized as a targeted object (represented by a continuous spike) or as
a junk object (represented by dashed spike).
52
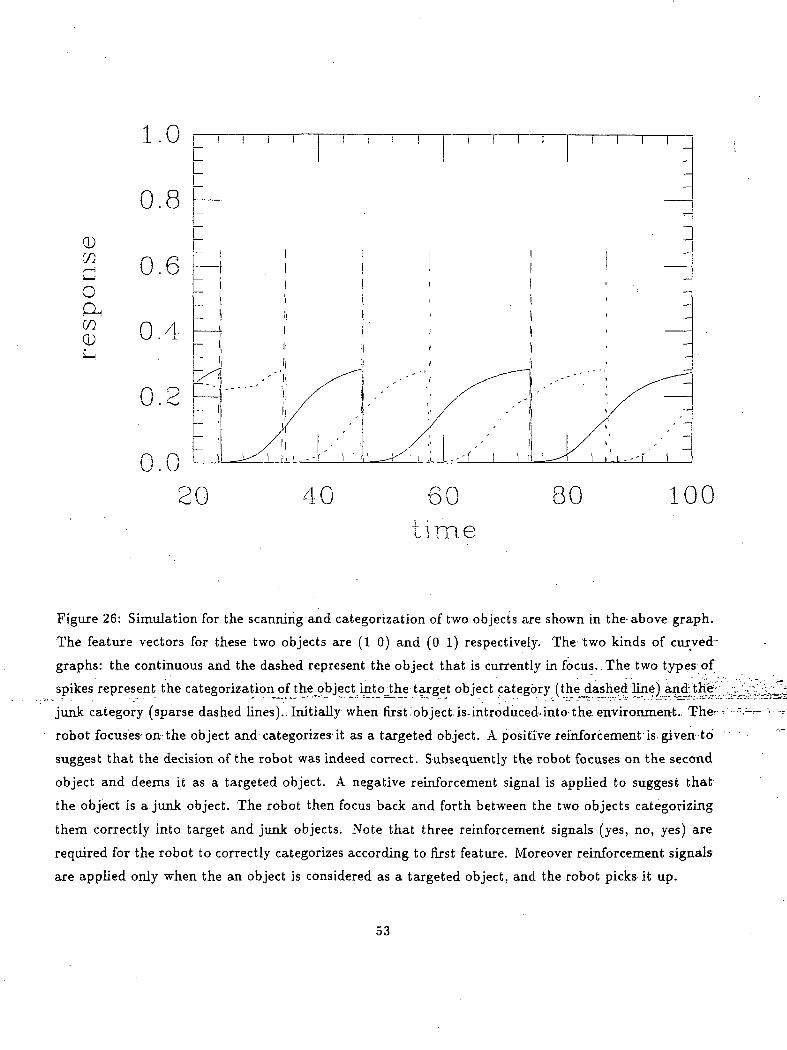
CDOQr->±—i
oex(73CD
1.0
0.8
0.6
0.4
0.2
0.020 40 60
time80 100
Figure 26: Simulation for the scanning and categorization of two objects are shown in the above graph.
The feature vectors for these two objects are (1 0) and (0 1) respectively. The two kinds of curved-
graphs: the continuous and the dashed represent the object that is currently in focus..The two types of
spikes represent the categorization of the_pbject intothe target object category (the dashed Une) and: the^
junk category (sparse dashed lines).. Initially when first object is-introduced-into-the environment. Ther-
robot focuses--on: the object and-categorizes-it as a targeted object. A positive reinforcement is-given-to
suggest that the decision of the robot was indeed correct. Subsequently the robot focuses on the second
object and deems it as a targeted object. A negative reinforcement signal is applied to suggest that
the object is a junk object. The robot then focus back and forth between the two objects categorizing
them correctly into target and junk objects. Note that three reinforcement signals (yes, no, yes) are
required for the robot to correctly categorizes according to first feature. Moreover reinforcement signals
are applied only when the an object is considered as a targeted object, and the robot picks it up.
53
The scenario consists of two objects introduced one after another in the field of view of the robot.
Both the objects have complementary types of features i.e one of the objects is a grey wrench and
the other is a pink spring. The feature vectors describing the two objects are (1001) and .(0110)
respectively n. Initially a grey wrench is introduced, the robot zeros in on it and categorizes it as a
good object. The robot is rewarded for its action. Consequently the spring appears in the robot field of
view causing it to focus on this new object. Since there is insufficient evidence regarding the behavioral
quality of the object, the robot picks this new object up. Subsequently the robot is punished for its
decision 12. The scanning mechanism then focuses on to the first object and categorizes it as a targeted
object. It then scans back to the pink spring but does not pick it up because it too is categorized
correctly as an junk object. Thus after three reinforcements the robot learnt to categorize object target
object or a junk object depending on whether it is tool or not.
6 Conclusiondf . ' • »'
We descrrb'ed-in-t-his-repor.t a neural network based robotic system. Unlike traditional robotic systems,
our approach focussed on non-stationary problems. We indicate'd that self-organization capability is
necessary for any system to operate successfully in a non-stationary environment. We suggested*'that
self-organization should be based on an active exploration process. We investigated neural architectures
having novelty sensitivity, selective attention, reinforcement learning, habit formation, flexible criteria
categorization properties and analyzed the resulting behavior (consisting of an intelligent initiation of
exploration) by computer simulations.
While various computer vision researchers acknowledged recently the importance of active pro-
cesses(Swain and Strieker, 1991) the proposed approaches within the new framework still suffer from a
lack of self-organization(Aloimonos and Bandyopadhyay, 1987; Bajcsy, 1988). •-.. - ••. • '^. , "-."
A- self-organizing, neural network based robot (MAVIN) has been recently proposed- (Balpch and-
Waxman, 1991). This robot has the capability of position, size-, rotation-invariant patt'erri cafegoriza--:-
tion, recognition and pavlovian conditioning. Our robot does not have initially invariant processing
properties. The reason for this is the-emphasis we put on active exploration. We maintain the point of
view that such invariant properties emerge from an internalization of exploratory sensory-motor activity.
Rather than coding the equilibria of such mental capabilities we are seeking: to capture its dynamics to
understand on the one hand how the emergence of such invariances is possible and on the other hand
11 (fi fa) represents the features of the input object wherev/i implies whether the object is a tool (10) ornot(OI) and-fa-
states whether it is pink (10) or grey (01) in color. /\12Note that the robot is rewarded or punished only when;/it picks an object. '
54
the dynamics that lead to these invariances. The second point is crucial for an adaptive robot to acquire
new invariances in non-stationary environments as. demonstrated by the inverting glass experiments of
Helmholtz j3'.
We will introduce Pavlovian conditioning circuits in our future work for the precise objective of
achieving the generation, coordination and internalization of sequence of actions./ From"this perspective,_. Jf /
our system differs from MAVIN in that MAVIN passively associates stimuli (as the passive cat of Held's
experiment (Held, 1963, 1965)) while our system, in addition to passive association, acquires active
association (as the active cat in Held's experiment (Held, 1963, 1965)).
In our future work we will implement this system in hardware.^ Such an implementation will lead
to long term tests of the system. The natural theoretical extension of the work is the integration of/
associative learning circuits for the generation of sequences enactions and their intelligent coordination,
and mental internalization.
13 A similar phenomenon is experienced by many of us who try glasses for the first time. Initially we, are exposed to a
distorted perception which is consequently corrected by the brain
55
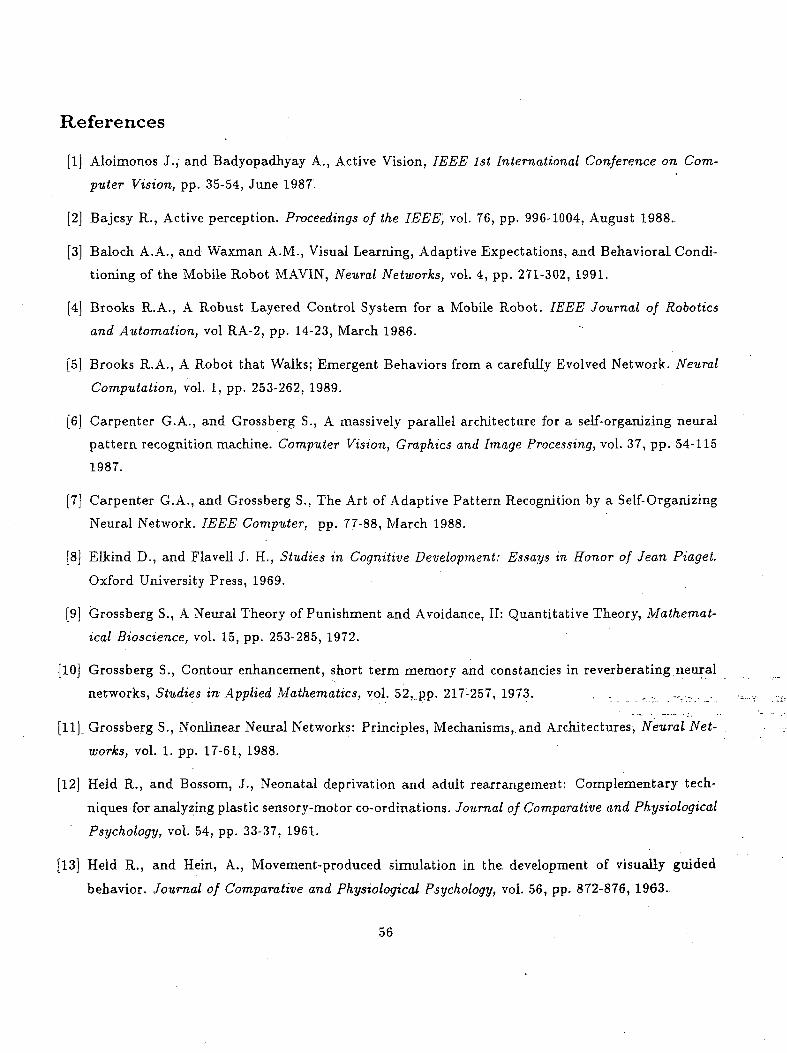
References
[l] Aloimonos J., and Badyopadhyay A., Active Vision, IEEE 1st International Conference on Com-
puter Vision, pp. 35-54, June 1987.
[2] Bajcsy R., Active perception. Proceedings of the IEEE, vol. 76, pp. 996-1004, August 1988.
[3] Baloch A.A., and Waxman A.M., Visual Learning, Adaptive Expectations, and Behavioral Condi-
tioning of the Mobile Robot MAVIN, Neural Networks, vol. 4, pp. 271-302, 1991.
[4] Brooks R.A., A Robust Layered Control System for a Mobile Robot. IEEE Journal of Robotics
and Automation, vol RA-2, pp. 14-23, March 1986.
[5] Brooks R.A., A Robot that Walks; Emergent Behaviors from a carefully Evolved Network. Neural
Computation, vol. 1, pp. 253-262, 1989.
[6] Carpenter G.A., and Grossberg S., A massively parallel architecture for a self-organizing neural
pattern recognition machine. Computer Vision, Graphics and Image Processing, vol. 37, pp. 54-115
1987.
[7] Carpenter G.A., and Grossberg S., The Art of Adaptive Pattern Recognition by a Self-Organizing
Neural Network. IEEE Computer, pp. 77-88, March 1988.
[8] Elkind D., and Flavell J. H., Studies in Cognitive Development: Essays in Honor of Jean Piaget.
Oxford University Press, 1969.
[9] Grossberg S., A Neural Theory of Punishment and Avoidance, II: Quantitative Theory, Mathemat-
ical Bioscience, vol. 15, pp. 253-285, 1972.
[10] Grossberg S., Contour enhancement, short term memory and constancies in reverberating neural
networks, Studies in Applied Mathematics, vol. 52, pp. 217-257, 1973. . .• . , .. . - . - . . .
[!!]„ Grossberg S., Nonlinear Neural Networks: Principles, Mechanisms,.and Architectures, Neural Net-
works, vol. 1. pp. 17-61, 1988.
[12] Held R., and Bossom, J., Neonatal deprivation and adult rearrangement: Complementary tech-
niques for analyzing plastic sensory-motor co-ordinations. Journal of Comparative and Physiological
Psychology, vol. 54, pp. 33-37, 1961.
[13] Held R., and Hein, A., Movement-produced simulation in the, development of visually guided
behavior. Journal of Comparative and Physiological Psychology, vol. 56, pp; 872-876, 1963.
56
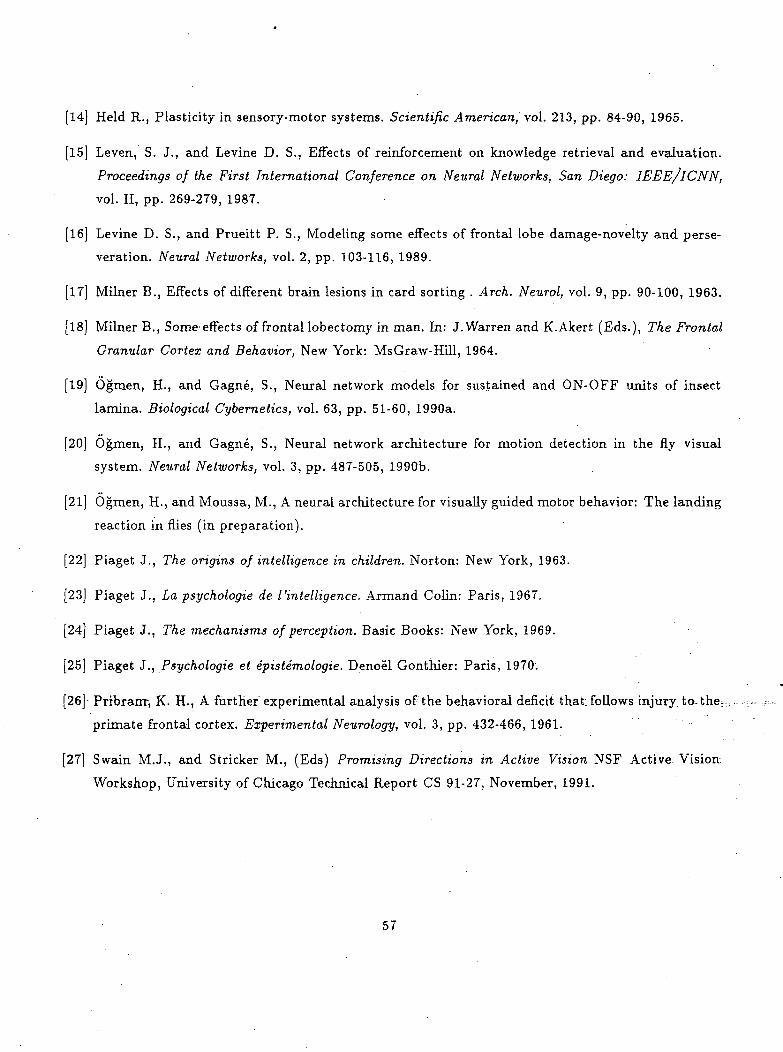
[14] Held R., Plasticity in sensory-motor systems. Scientific American, vol. 213, pp. 84-90, 1965.
[15] Leven, S. J., and Levine D. S., Effects of reinforcement on knowledge retrieval and evaluation.
Proceedings of the First International Conference on Neural Networks, San Diego: IEEE/ICNN,
vol. II, pp. 269-279, 1987.
[16] Levine D. S., and Prueitt P. S., Modeling some effects of frontal lobe damage-novelty and perse-
veration. Neural Networks, vol. 2, pp. 103-116, 1989.
[17] Milner B., Effects of different brain lesions in card sorting . Arch. Neurol, vol. 9, pp. 90-100, 1963.
[18] Milner B., Some effects of frontal lobectomy in man. In: J. Warren and K.Akert (Eds.), The Frontal
Granular Cortex and Behavior, New York: MsGraw-Hill, 1964.
[19] Ogmen, H., and Gagne, S., Neural network models for sustained and ON-OFF units of insect
lamina. Biological Cybernetics, vol. 63, pp. 51-60, 1990a.
[20] Ogmen, H., and Gagne, S., Neural network architecture for motion detection in the fly visual
system. Neural Networks, vol. 3, pp. 487-505, 1990b.
[21] Ogmen, H., and Moussa, M., A neural architecture for visually guided motor behavior: The landing
reaction in flies (in preparation).
[22] Piaget J., The origins of intelligence in children. Norton: New York, 1963.
[23] Piaget J., La psychologic de I'intelligence. Armand Colin: Paris, 1967.
[24] Piaget J., The mechanisms of perception. Basic Books: New York, 1969.
[25] Piaget J., Psychologic et epistemologie. Denoel Gonthier: Paris, 1970.
[26] Pribrarrr, K. H., A further experimental analysis of the behavioral deficit that: follows injury, to^the-
primate frontal cortex. Experimental Neurology, vol. 3, pp. 432-466, 1961.
[27] Swain M.J., and Strieker M., (Eds) Promising Directions in Active Vision NSF Active: Vision
Workshop, University of Chicago Technical Report CS 91-27, November, 1991.
57