Embed Size (px)
Citation preview
Department of Electrical & Computer Engineering
Auditory Perception
Meena Ramani
04/09/2004
Department of Electrical & Computer Engineering
NoteFor this lecture many of the slides will be
accompanied by scanned pictures shown on the OHP from Zwicker and Fastl’s
“Psycho-acoustics facts and models” 2nd edition
Department of Electrical & Computer Engineering
Main Outline
• Anatomy of the Ear and Hearing DONE
• Auditory perception• Hearing aids and Cochlear implants.
Extra: Direction of Arrival Estimation
Department of Electrical & Computer Engineering
Auditory perception
• Shepard Tones
• Masking <Detailed look>
• Ohms Acoustic Law
• Critical Bands
• Webers law
• Just Noticeable Frequency
Department of Electrical & Computer Engineering
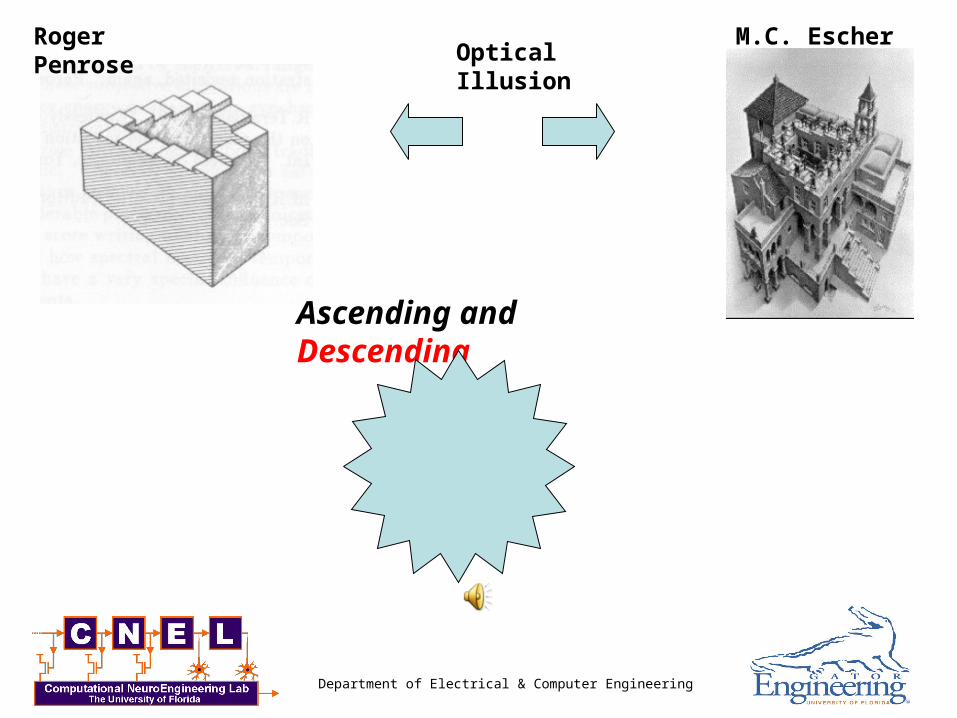
Roger Penrose M.C. Escher
Ascending and Descending
Optical Illusion
Audio
Illusion
Department of Electrical & Computer Engineering
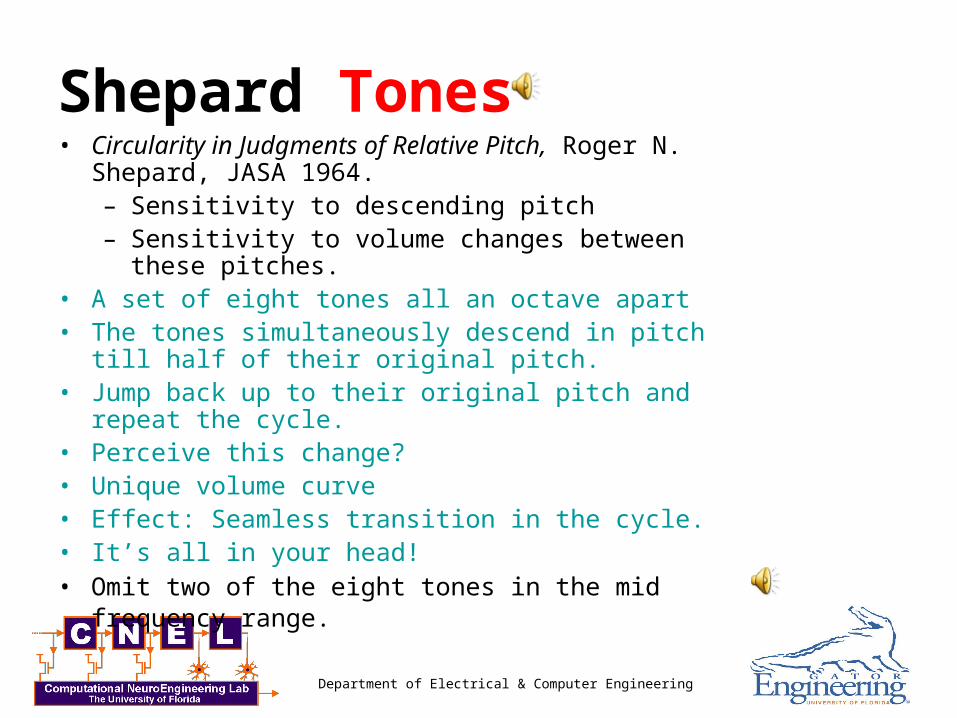
Shepard Tones• Circularity in Judgments of Relative Pitch, Roger N. Shepard,
JASA 1964.– Sensitivity to descending pitch – Sensitivity to volume changes between these
pitches.• A set of eight tones all an octave apart • The tones simultaneously descend in pitch till half of
their original pitch.• Jump back up to their original pitch and repeat the cycle.• Perceive this change?• Unique volume curve• Effect: Seamless transition in the cycle.• It’s all in your head!
• Omit two of the eight tones in the mid frequency range.
Department of Electrical & Computer Engineering
You know I can't hear you when the water is running!
MASKING
Department of Electrical & Computer Engineering
Masking
• Low-frequency, broad banded sounds (like water running) will mask higher frequency sounds which are softer at the listener's ear (a conversational tone from across the room).– Example 2: Truck in street
• Masking occurs because two frequencies lie within a critical band and the higher amplitude one masks the lower amplitude signal.
• Masking can be because of broad band, narrowband noise, pure and complex tones.
• Masking threshold– Amount of dB for test tone to be just audible in presence of noise
See OHP Figure
Department of Electrical & Computer Engineering
Masking by Broad band noise
• White noise- frequency independent PSD• Masked thresholds are a function of frequency.• Low and very high frequency almost same as TOQ.• Above 500Hz, thresholds increase with increase in frequency• Increasing white noise by 10dB increases masked threshold up by
10dB for frequencies >500Hz.• =>Linear behavior of masking• NOTE: TOQ’s frequency dependence almost completely
disappears Ear’s frequency selectivity and critical bands.
See OHP Figure
Department of Electrical & Computer Engineering
Masking by Narrow band noise
• Narrow band <=Critical BW• Noise (constant Amplitude, Different Frequency)
– 0.25,1,4KHz – BW: 100, 160, 700Hz– 60dB
• Frequency dependence of threshold masked by 250Hz seems to be broader
• Maximum value of masked threshold is lower for higher frequencies.• Steep increase but flatter decrease
See OHP Figure
Department of Electrical & Computer Engineering
Masking by Narrow band noise (cont)
• Noise (Varying Amplitude, Fixed Frequency)– 1KHz noise– 20-100dB
• Slope of rise seems independent of Amplitude• But slope of fall is dependent on amplitude• Non-Linear frequency dependence• Strange effect at high masker amplitudes:
– At high amplitudes ear begins to listen to anything audible!!– Begin to hear difference noise (noise and testing tone)
See OHP Figure
Department of Electrical & Computer Engineering
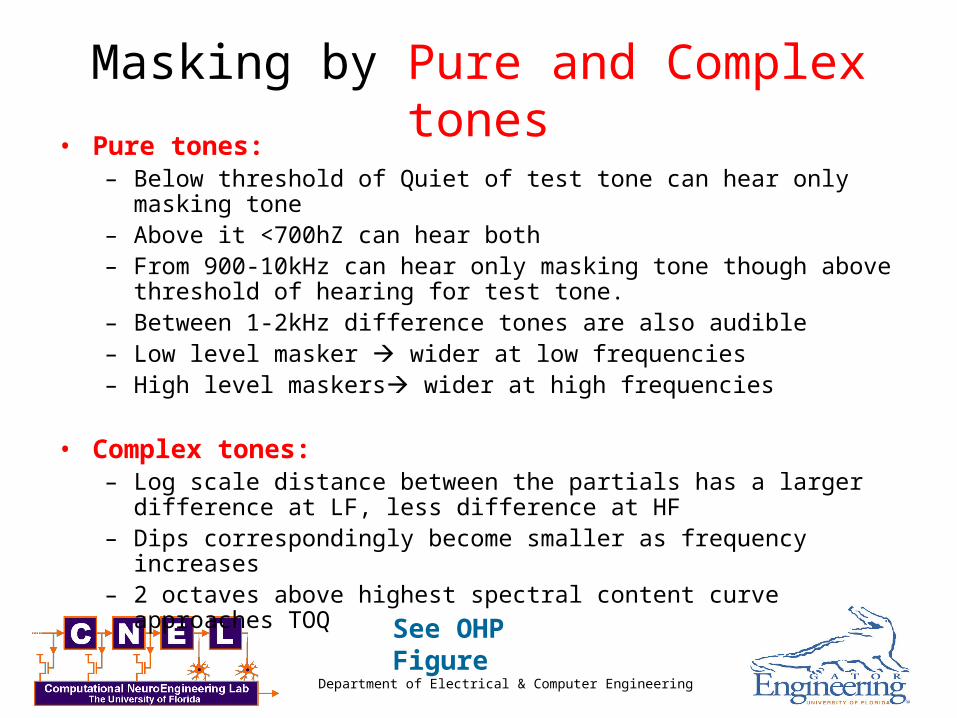
Masking by Pure and Complex tones• Pure tones:
– Below threshold of Quiet of test tone can hear only masking tone– Above it <700hZ can hear both– From 900-10kHz can hear only masking tone though above threshold of
hearing for test tone.– Between 1-2kHz difference tones are also audible– Low level masker wider at low frequencies– High level maskers wider at high frequencies
• Complex tones:– Log scale distance between the partials has a larger difference at LF,
less difference at HF– Dips correspondingly become smaller as frequency increases– 2 octaves above highest spectral content curve approaches TOQ
See OHP Figure
Department of Electrical & Computer Engineering
Temporal Aspects of Masking
• Previously assume long lasting test and masking sounds• Speech has a strong temporal structure• Vowels --loudest parts• Consonants faint• Often plosive consonants are masked by preceding loud vowel
Department of Electrical & Computer Engineering
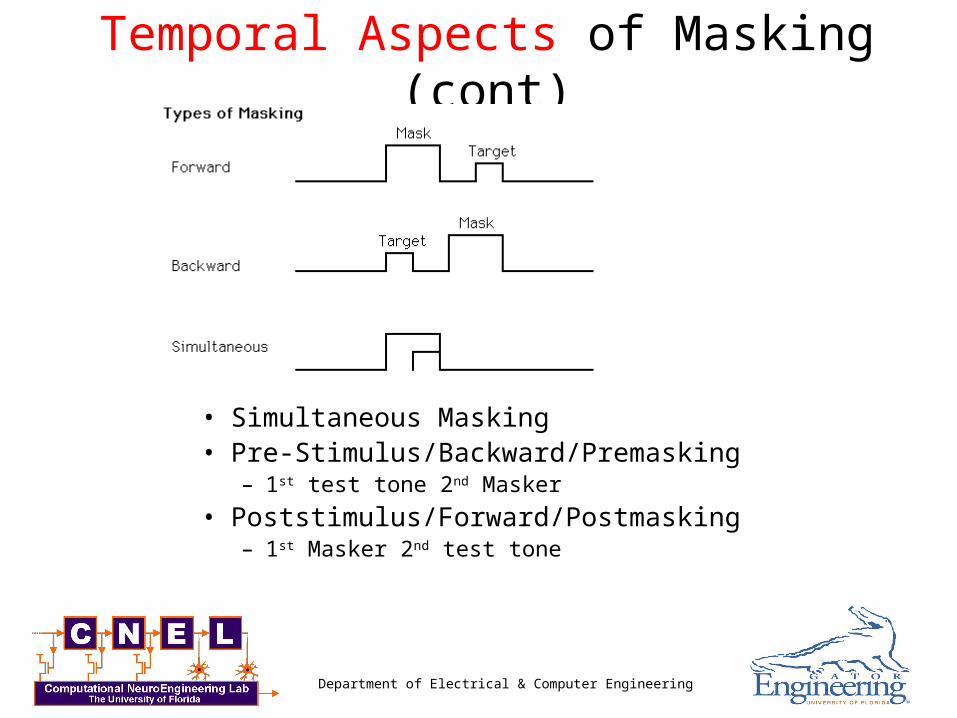
Temporal Aspects of Masking (cont)
• Simultaneous Masking• Pre-Stimulus/Backward/Premasking
– 1st test tone 2nd Masker
• Poststimulus/Forward/Postmasking– 1st Masker 2nd test tone
Department of Electrical & Computer Engineering
Types of MaskingSimultaneous masking
– Duration less than 200ms test tone threshold increases with decrease in duration.
– Duration >200ms constant test tone threshold– Assume hearing system integrates over a period of 200ms
Postmasking (100ms)– Decay in effect of masker 100ms– More dominant
Premasking (20ms)– Takes place before masker is on!!– Each sensation is not instantaneous , requires build-up time
• Quick build up for loud maskers• Slower build up for softer maskers
– Less dominant effect
See OHP Figure
Department of Electrical & Computer Engineering
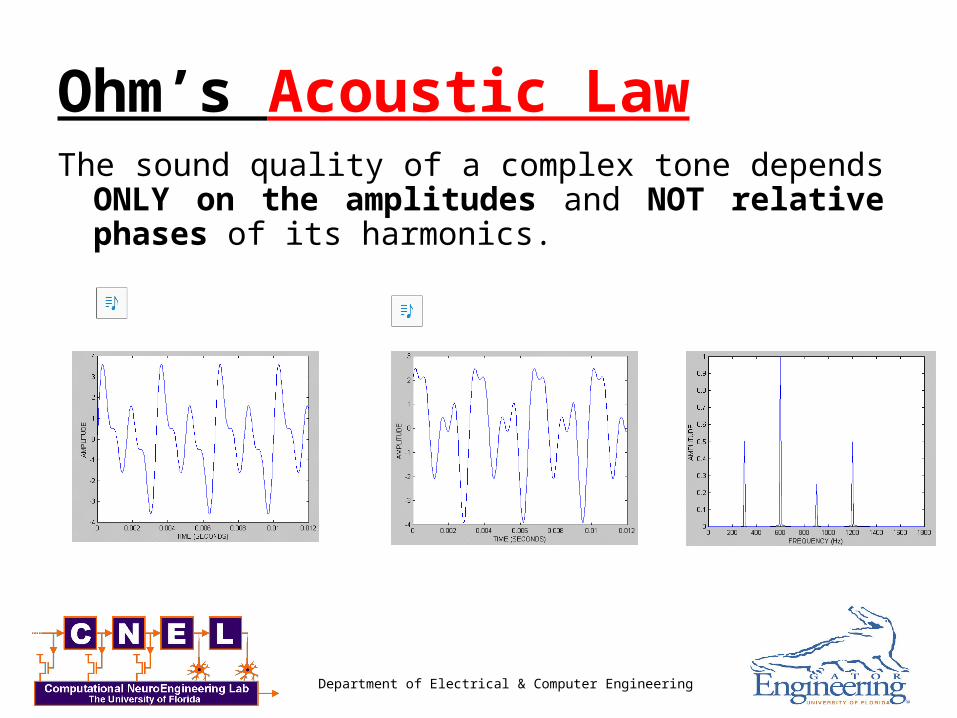
Ohm’s Acoustic LawThe sound quality of a complex tone depends ONLY on the
amplitudes and NOT relative phases of its harmonics.
Department of Electrical & Computer Engineering
Critical Bands• Proposed by Fletcher• Noise which masks a test tone is the part of its spectrum which lies
near the tone
• Masking is achieved when the power of the tone and the power of the noise spectrum lying near the tone and masking it are the same.
• Bands defined this way have a BW which produces same acoustic power in the tone and in the noise in the band when the tone is masked. CRITICAL BANDS
See OHP Figure
Department of Electrical & Computer Engineering
Critical Band (cont.)
• How to measure?– Masking of a band pass noise using 2 tones
• CB corresponds with1.5mm spacing on BM.• 24 such band pass filters• BW of the filters increases with increasing center frequency• Logarithmic relationship Weber’s law example.• Bark scale
See OHP Figure
Department of Electrical & Computer Engineering
Webers law
• Weber's Law states that the ratio of the increment threshold to the background intensity is a constant.
• So when you are in a noisy environment you must shout to be heard while a whisper works in a quiet room.
• when you measure increment thresholds on various intensity backgrounds, the thresholds increase in proportion to the background.
Department of Electrical & Computer Engineering
Just noticeable change in Frequency• (Pg:183)
• Similar to variation in the critical band structure• This is because it depends on number of BPFs• More BPF better resolution• Till about 500Hz JND is about 3.6Hz.• After 500Hz it varies as 0.007f
See OHP Figure
Department of Electrical & Computer Engineering
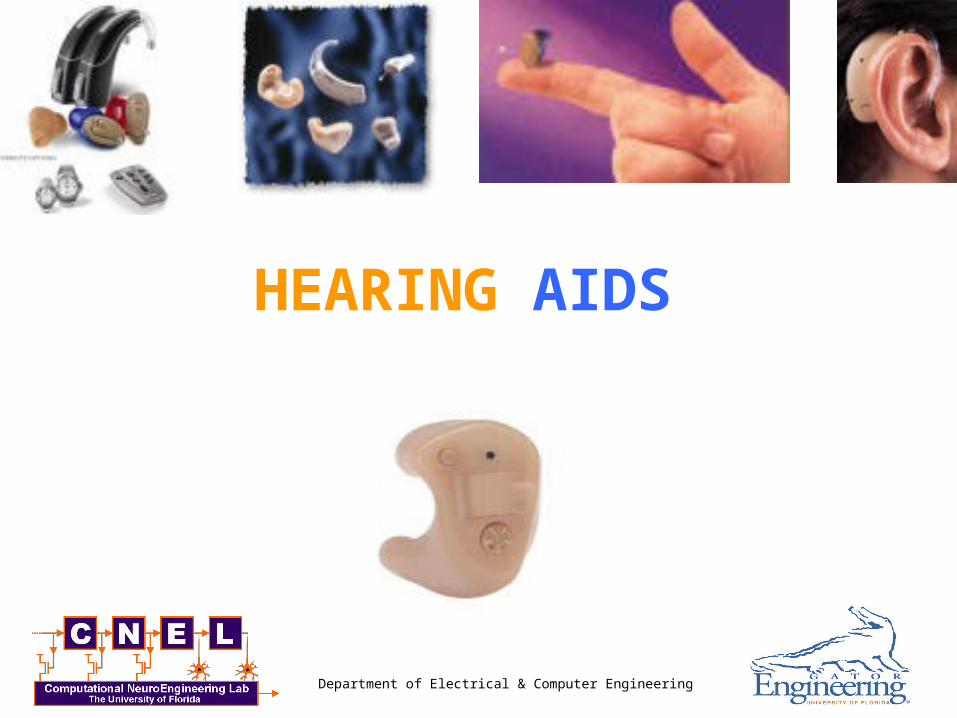
HEARING AIDS
Department of Electrical & Computer Engineering
Outline
• Facts on hearing loss
• Cell phones and hearing loss
• Types of Hearing aid
• Inside a hearing aid
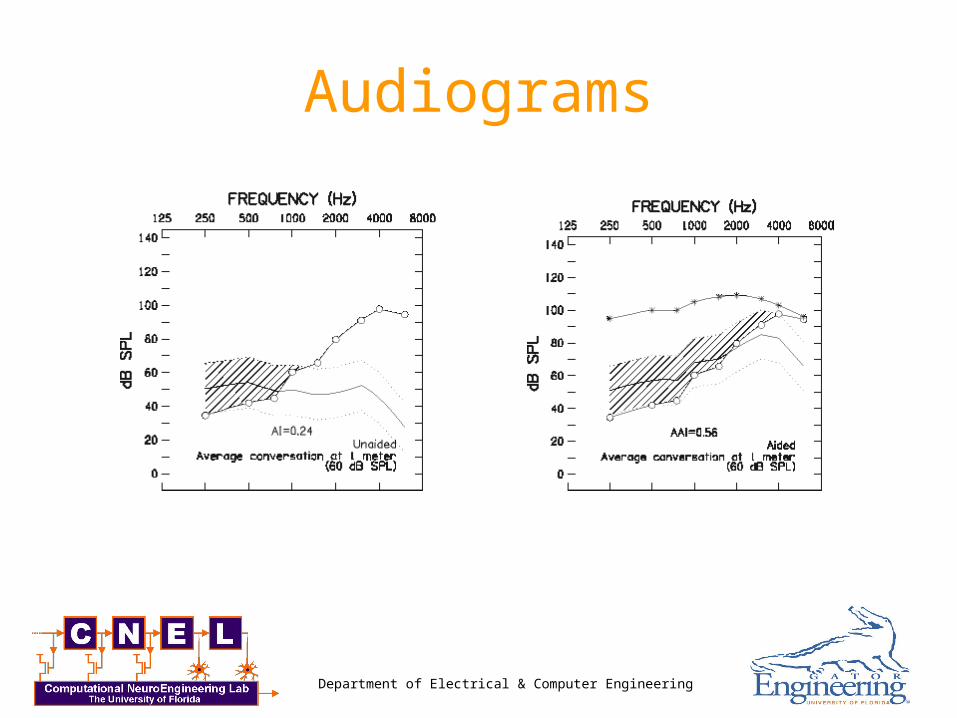
• Audiogram
Department of Electrical & Computer Engineering
Facts on Hearing Loss in Adults
• One in every ten (28 million) Americans has hearing loss.
• The vast majority of Americans (95% or 26 million) with hearing loss can have their hearing loss treated with hearing aids.
• Only 5% of hearing loss in adults can be improved through medical or surgical treatment
• Millions of Americans with hearing loss could benefit from hearing aids but avoid them because of the stigma.
Department of Electrical & Computer Engineering
Cell phones and Hearing aids
• Cell Phones emit a type of electromagnetic energy that interferes with the operation of hearing aids.
• The Federal Communications Commission in mid-July 2003 ordered the cell phone industry to help out the hard-of-hearing.
“Within two years, cell-phone manufacturers must offer at least two phones with reduced interference for each type of cellular technology used, or ensure that one-fourth of phones the carriers sell produce less interference.”
• The FCC’s final milestone is February 2008.
Department of Electrical & Computer Engineering
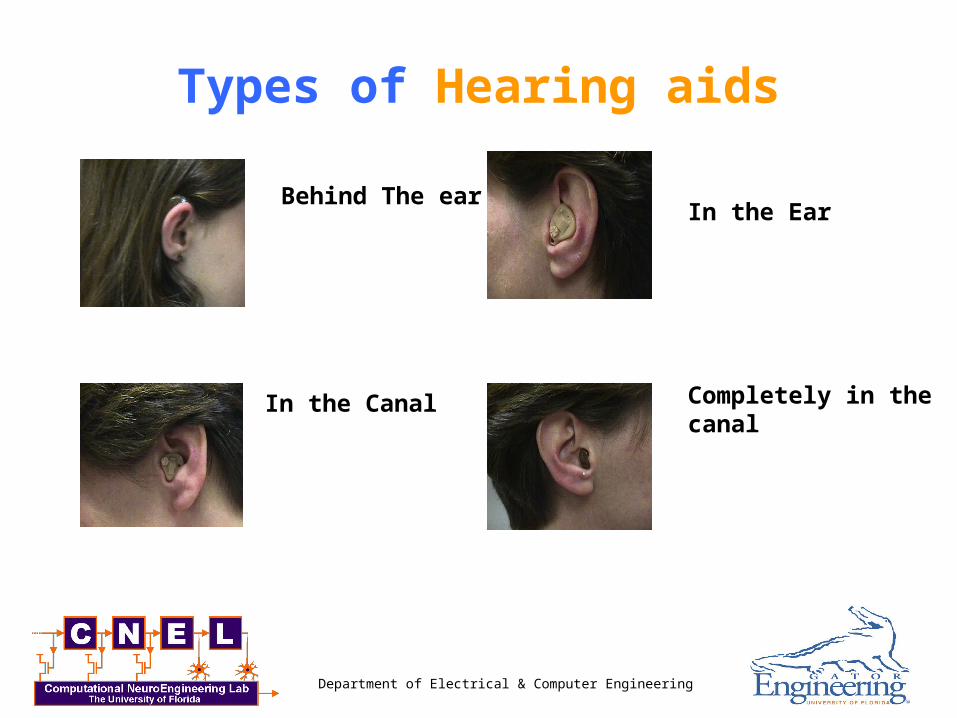
Types of Hearing aids
Behind The earIn the Ear
In the Canal Completely in the canal
Department of Electrical & Computer Engineering
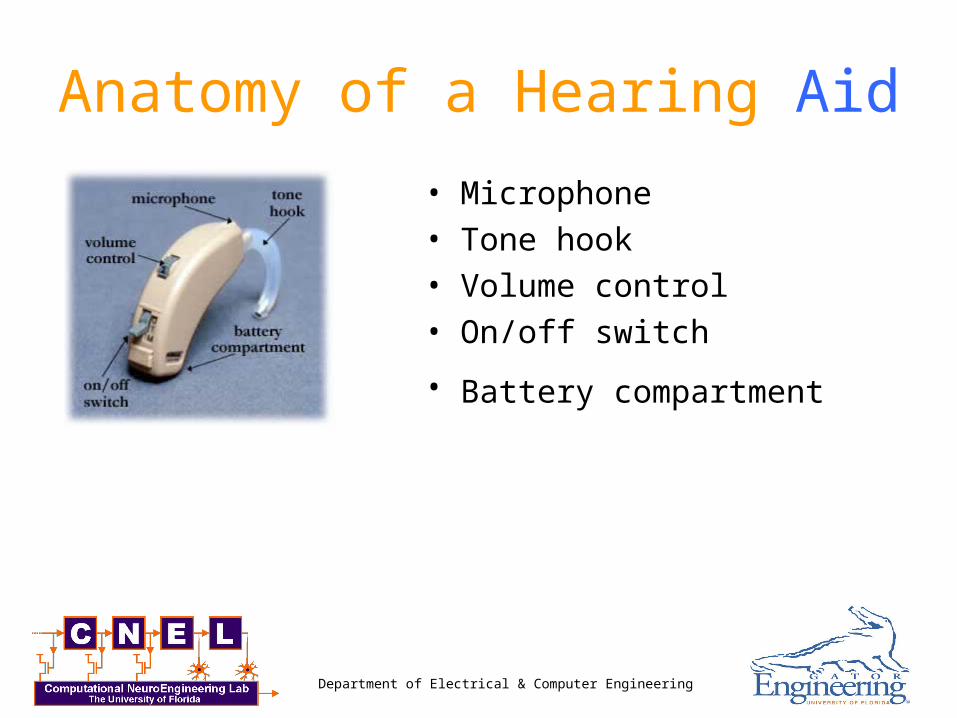
Anatomy of a Hearing Aid
• Microphone• Tone hook• Volume control• On/off switch
• Battery compartment
Department of Electrical & Computer Engineering
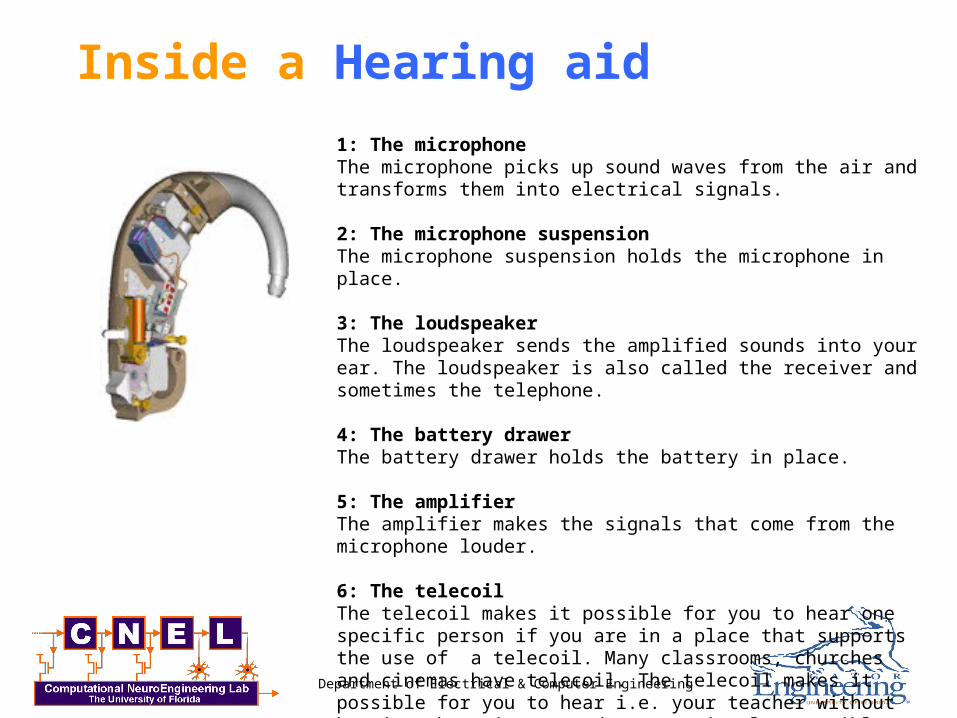
Inside a Hearing aid
1: The microphone The microphone picks up sound waves from the air and transforms them into electrical signals.
2: The microphone suspension The microphone suspension holds the microphone in place.
3: The loudspeaker The loudspeaker sends the amplified sounds into your ear. The loudspeaker is also called the receiver and sometimes the telephone.
4: The battery drawer The battery drawer holds the battery in place.
5: The amplifier The amplifier makes the signals that come from the microphone louder.
6: The telecoil The telecoil makes it possible for you to hear one specific person if you are in a place that supports the use of a telecoil. Many classrooms, churches and cinemas have telecoil. The telecoil makes it possible for you to hear i.e. your teacher without hearing the noise around you. It is also possible to use the telecoil at home - with the TV or the radio.
Department of Electrical & Computer Engineering
Audiograms
Department of Electrical & Computer Engineering
Direction of Arrival (DOA) estimation algorithm
<Useful for class project ideas>
Department of Electrical & Computer Engineering
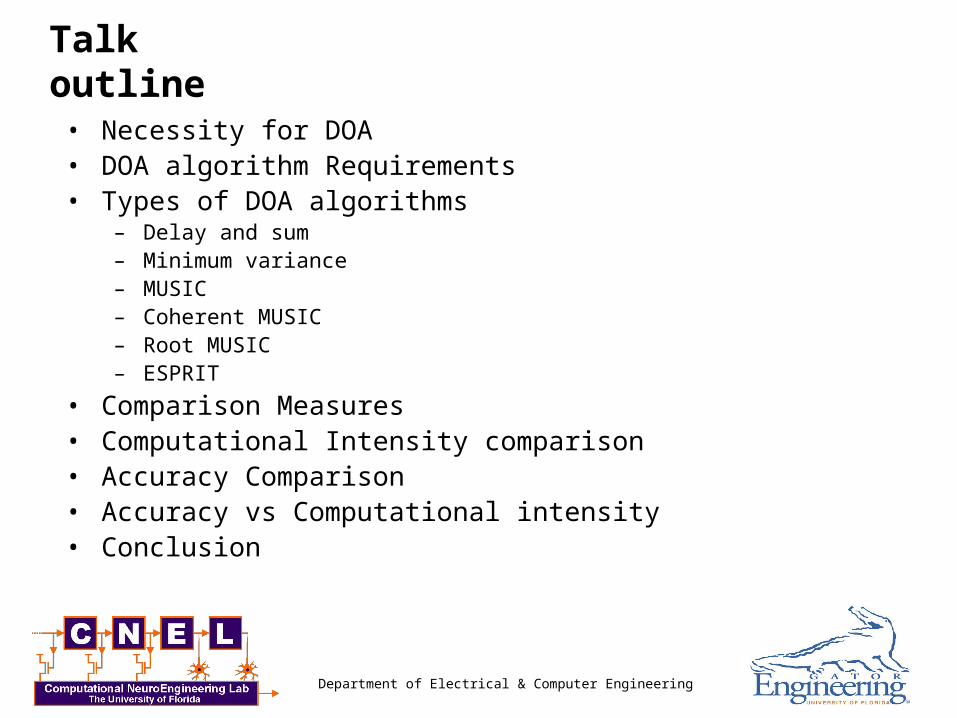
Talk outline
• Necessity for DOA• DOA algorithm Requirements• Types of DOA algorithms
– Delay and sum– Minimum variance– MUSIC– Coherent MUSIC– Root MUSIC– ESPRIT
• Comparison Measures• Computational Intensity comparison• Accuracy Comparison• Accuracy vs Computational intensity• Conclusion
Department of Electrical & Computer Engineering
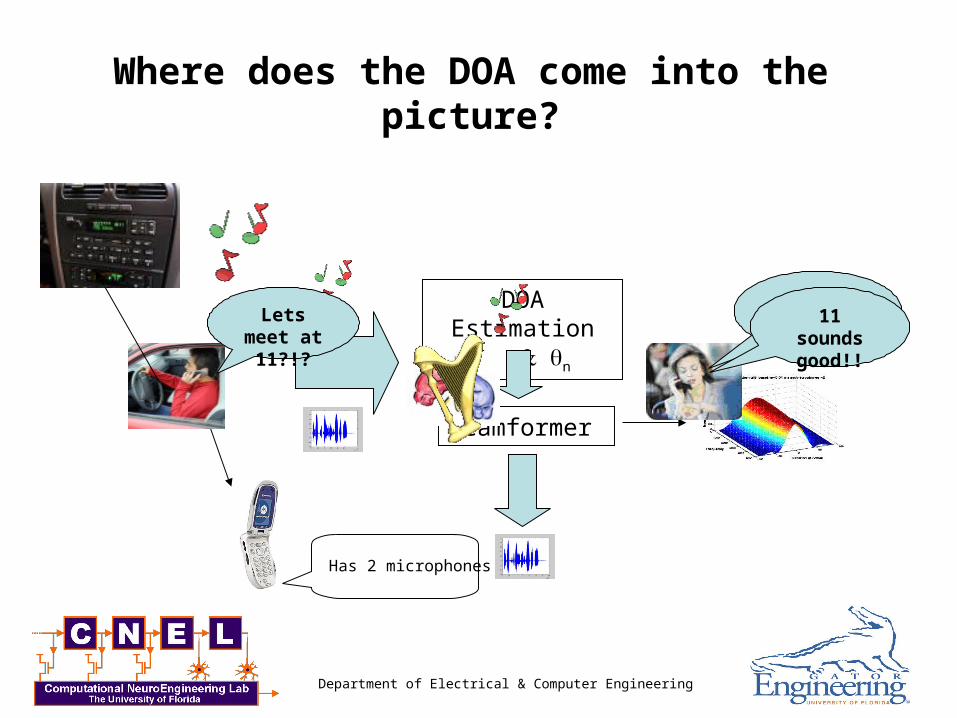
Where does the DOA come into the picture?
Has 2 microphones
DOA Estimation sn
Beamformer
Lets meet at 11?!?
7 is good for me too!!
11 sounds good!!
Department of Electrical & Computer Engineering
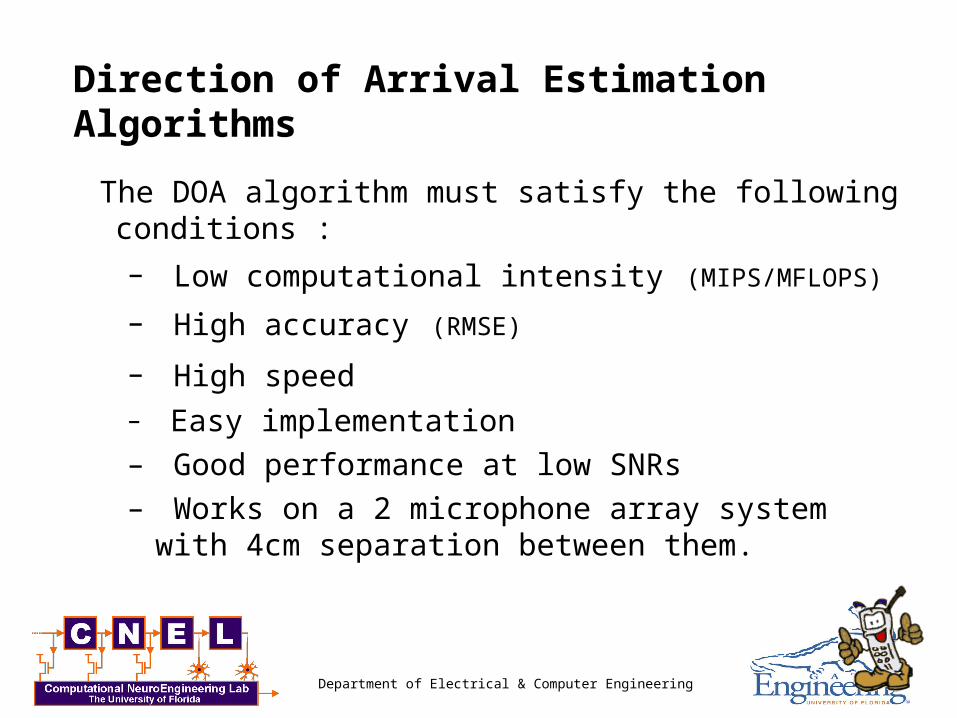
Direction of Arrival Estimation Algorithms
The DOA algorithm must satisfy the following conditions :
– Low computational intensity (MIPS/MFLOPS)
– High accuracy (RMSE)
– High speed – Easy implementation– Good performance at low SNRs– Works on a 2 microphone array system with 4cm
separation between them.
Department of Electrical & Computer Engineering
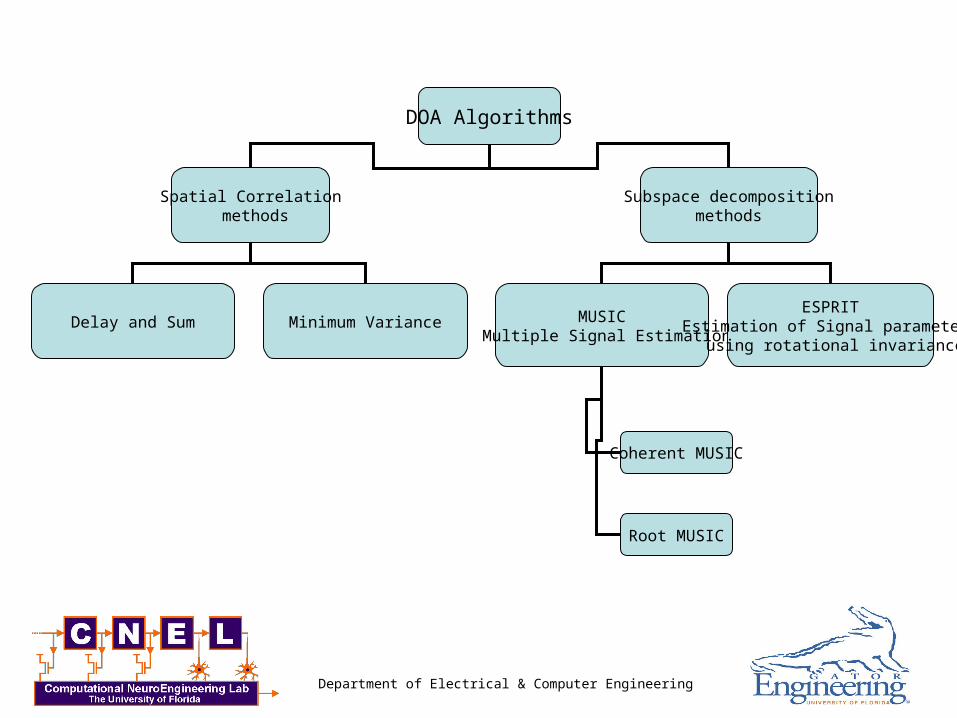
DOA Algorithms
Spatial Correlation methods
Subspace decompositionmethods
MUSIC Multiple Signal Estimation
ESPRITEstimation of Signal parameters
using rotational invariance
Delay and Sum Minimum Variance
Coherent MUSIC
Root MUSIC
Department of Electrical & Computer Engineering
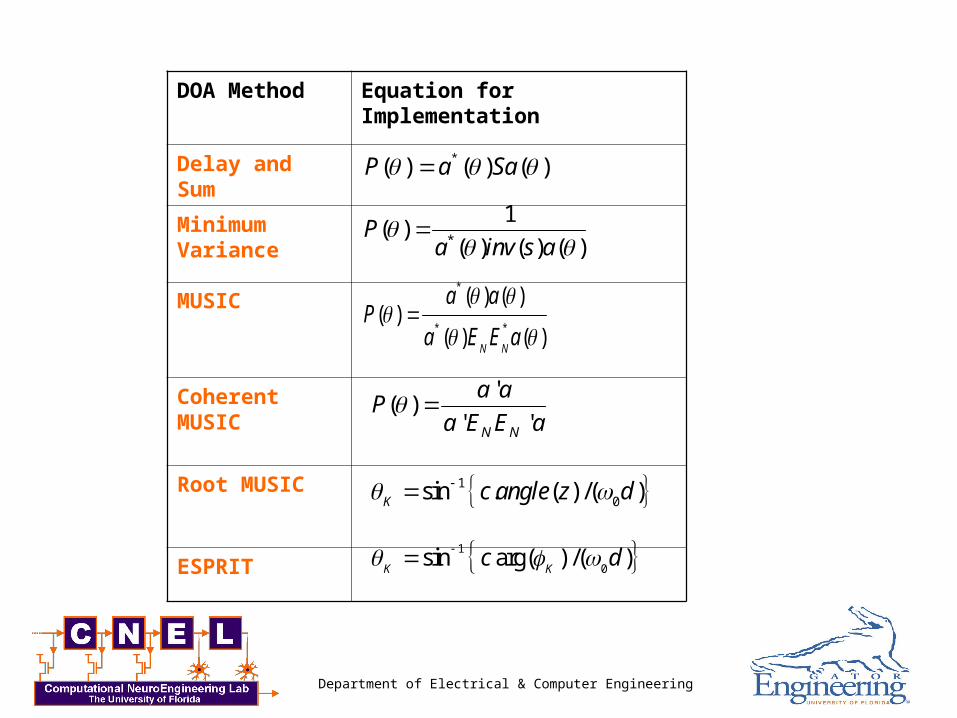
DOA Method Equation for Implementation
Delay and Sum
Minimum Variance
MUSIC
Coherent MUSIC
Root MUSIC
ESPRIT
*( ) ( ) ( )P a Sa
*
1( )
( ) ( ) ( )P
a inv s a
*
* *
( ) ( )( )
( ) ( )N N
a aP
a E E a
'( )
' 'N N
a aP
a E E a
1
0sin . ( ) /( )K c angle z d
1
0sin arg( ) /( )
K Kc d
Department of Electrical & Computer Engineering
Comparison Measures
• To evaluate the computational intensity– MFLOPS comparison plot
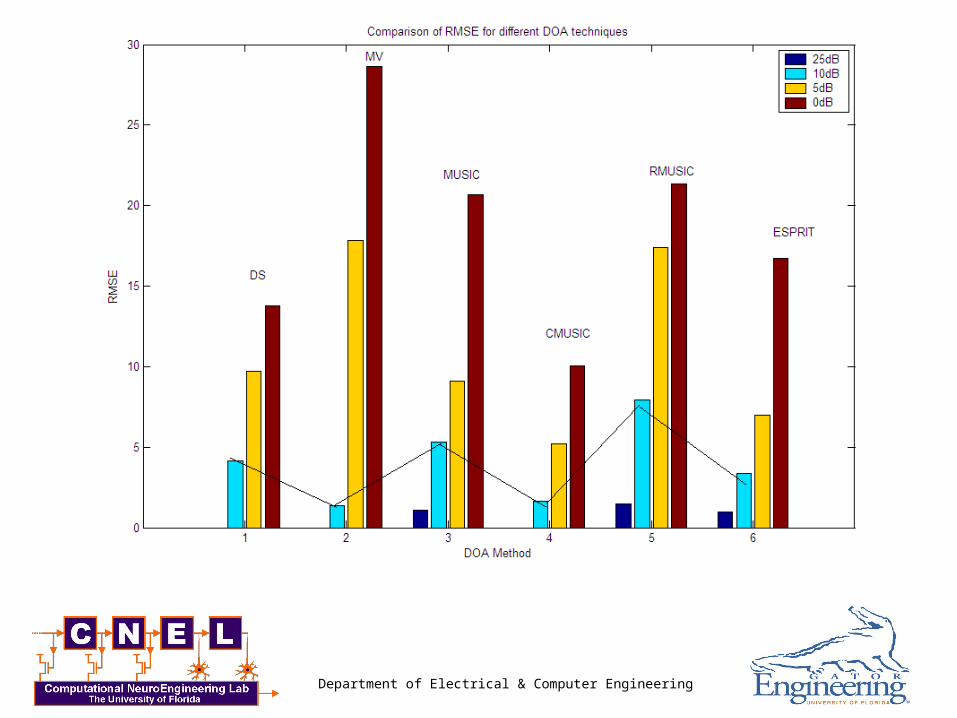
• To evaluate the accuracy– Root Mean Square Error comparison plot
• To evaluate the effect at low SNRs– SNR vs Estimated angle plot
• To evaluate overall performance– Accuracy vs computational intensity
Department of Electrical & Computer Engineering
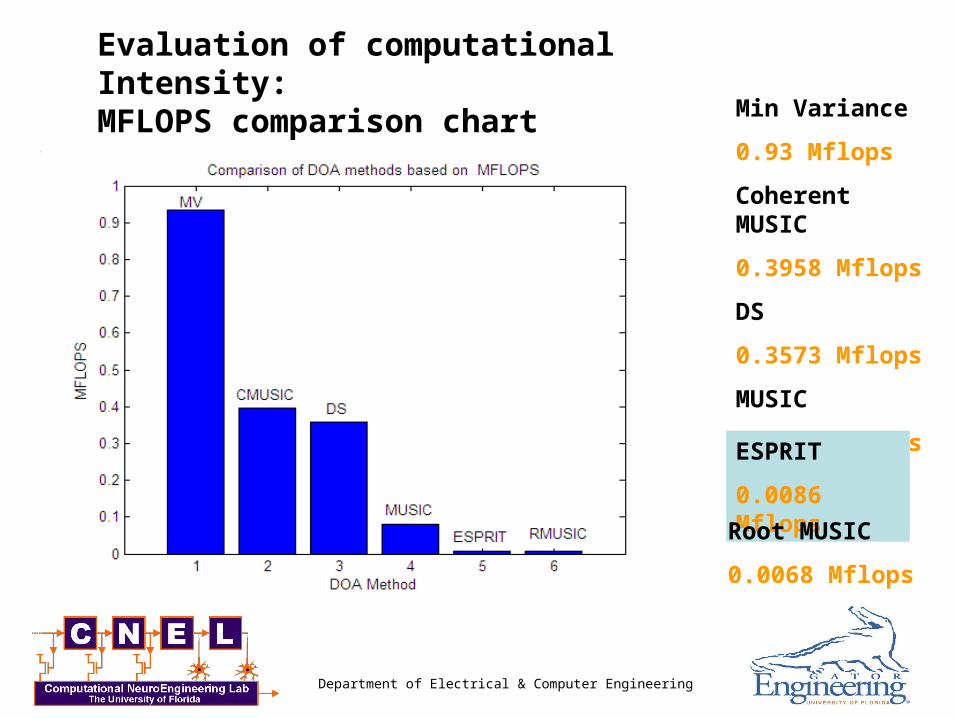
Evaluation of computational Intensity:MFLOPS comparison chart Min Variance
0.93 Mflops
Coherent MUSIC
0.3958 Mflops
DS
0.3573 Mflops
MUSIC
0.0813 Mflops
ESPRIT
0.0086 Mflops
Root MUSIC
0.0068 Mflops
Department of Electrical & Computer Engineering
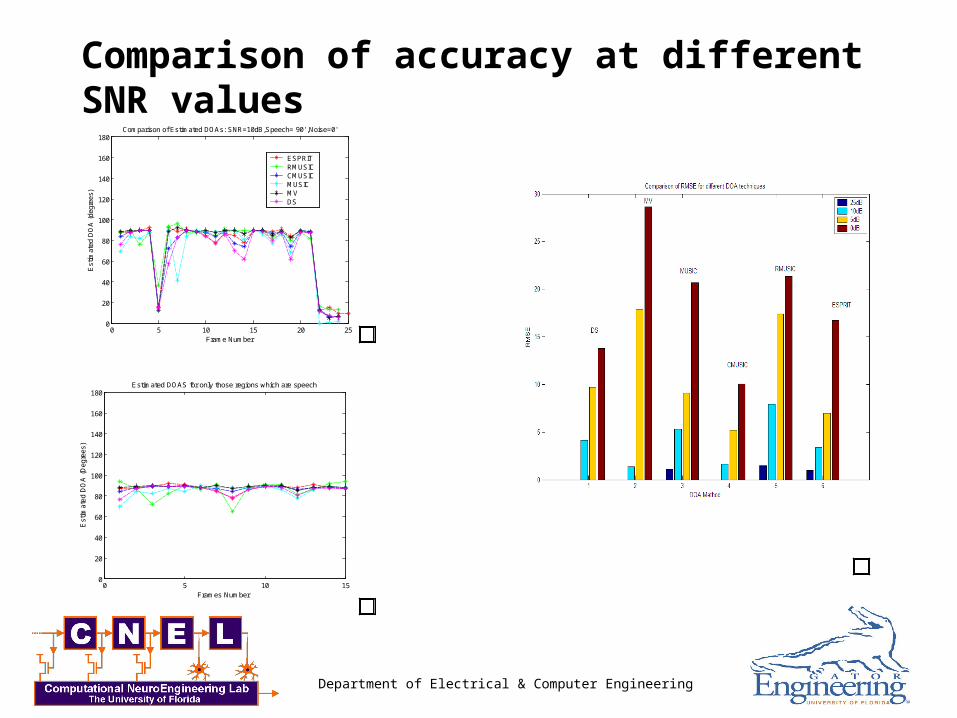
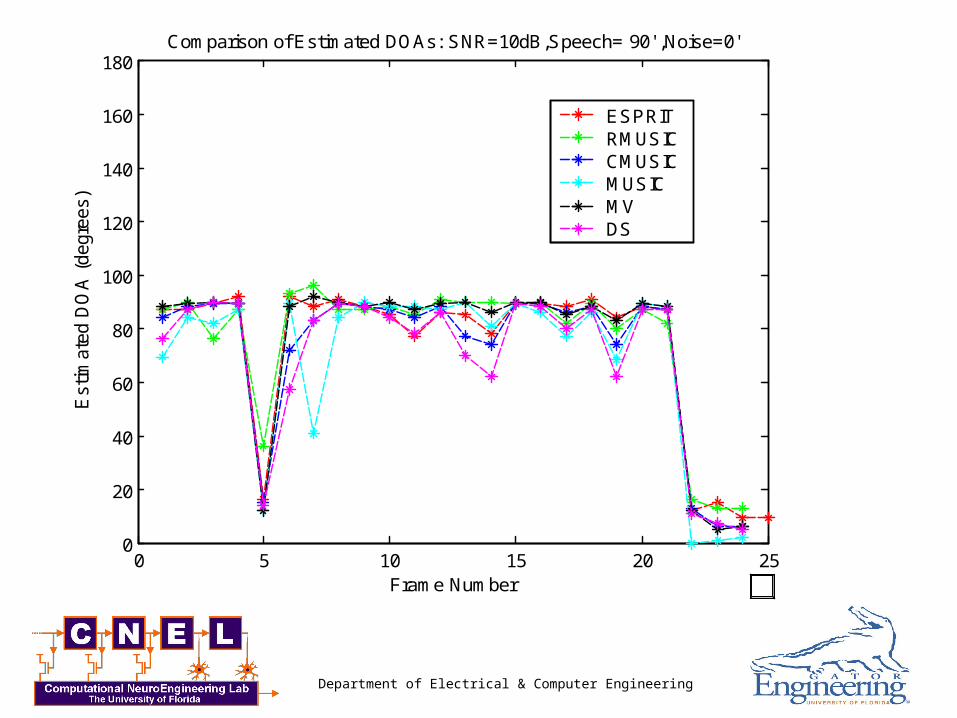
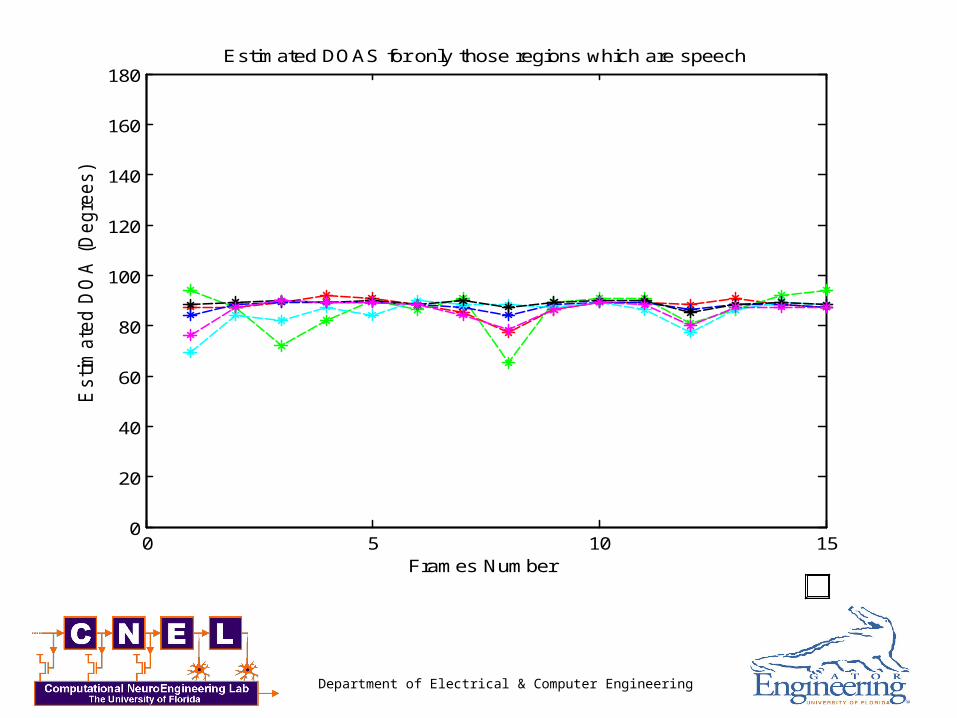
Comparison of accuracy at different SNR values
0 5 10 15 20 250
20
40
60
80
100
120
140
160
180
Frame Number
Est
imat
ed D
OA
(de
gree
s)
Comparison of Estimated DOAs: SNR=10dB,Speech= 90' ,Noise=0'
ESPRITRMUSICCMUSICMUSICMVDS
0 5 10 150
20
40
60
80
100
120
140
160
180Estimated DOAS for only those regions which are speech
Frames Number
Est
imat
ed D
OA
(D
egre
es)
Department of Electrical & Computer Engineering
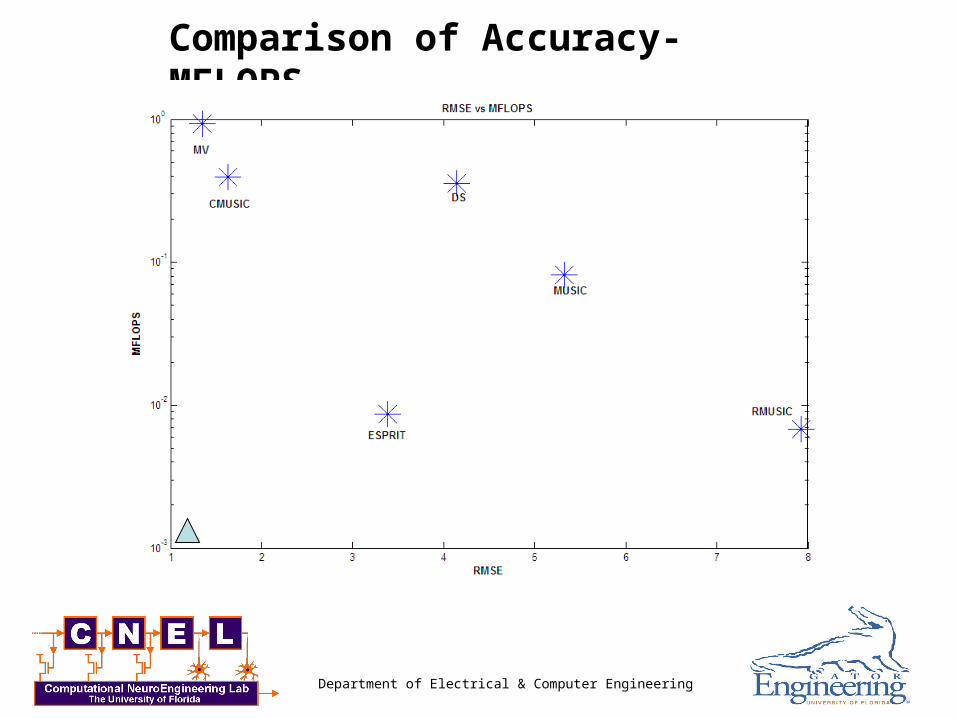
Comparison of Accuracy-MFLOPS
Department of Electrical & Computer Engineering
Conclusion
• Tradeoff between Accuracy and Computational intensity leads to the conclusion that ESPRIT is the Direction of arrival estimation algorithm best suited for our purpose
• MFLOPS value: 0.0086 • RMSE value:~3 (at 10dB)
Department of Electrical & Computer Engineering
0 5 10 15 20 250
20
40
60
80
100
120
140
160
180
Frame Number
Est
imat
ed D
OA
(de
gree
s)
Comparison of Estimated DOAs: SNR=10dB,Speech= 90' ,Noise=0'
ESPRITRMUSICCMUSICMUSICMVDS
Department of Electrical & Computer Engineering
0 5 10 150
20
40
60
80
100
120
140
160
180Estimated DOAS for only those regions which are speech
Frames Number
Estim
ate
d D
OA
(D
egre
es)
Department of Electrical & Computer Engineering


![[XLS] · Web viewSunita Meena w/o Mahender Meena 9.81 M 1.17 L Tukda 106.45 M Baldev Nagar Pepalda 315.28 H Geeta Meena Dwarikalal Meena Pevat 119.56 M Narbda Meena Nathulal Meena](https://img.pdfslide.us/doc/110x75/5acd9f4e7f8b9a73128e39e6/xls-viewsunita-meena-wo-mahender-meena-981-m-117-l-tukda-10645-m-baldev-nagar.jpg)