Embed Size (px)
Citation preview

Background Briefing
DEPARTMENT OF EDUCATION
Samuel Christensen, Fiscal Analyst
December 2014
State Board of Education
“Leadership and general supervision over all public education, including adult
education and instructional programs in state institutions…is vested in a state
board of education. It shall serve as the general planning and coordinating body
for all public education, including higher education, and shall advise the
Legislature as to the financial requirements in connection therewith.”
“The state board of education shall appoint a superintendent of public instruction
whose term of office shall be determined by the board. He shall be chairman of
the board without the right to vote, and shall be responsible for the execution of
its policies. He shall be the principal executive officer of a state department of
education which shall have powers and duties as provided by law.”
-- The Michigan Constitution
Article VIII, Section 8
House Fiscal Agency: December 2014 2

Education: Gross Appropriations
$65 $68 $71 $82
$121
$89 $100
$124 $115
$126
$337
$313 $304
$287
FY 2006 FY 2007 FY 2008 FY 2009 FY 2010 FY 2011 FY 2012 FY 2013 FY 2014 FY 2015
Mil
lio
ns
House Fiscal Agency: December 2014 3
Gross
GF/GP
The Department of Education appropriations have undergone significant change due to program transfers both
in and out of the department. These transfers include, most recently, the state’s child development and care
program (CDC) (FY 2011-12) and the Library of Michigan (FY 2009-10). Recent reductions are due to declining
CDC caseloads.
Note: FY 2009 figures do not include $925 million in one-time federal American Recovery and Reinvestment Act (ARRA) grants that were
distributed to school districts through the Department of Education budget.

Education Share of State GF/GP
Community Health$3,239,701,400
32.0%
Corrections$1,980,798,400
19.6%
Other$1,615,519,300
16.0%
Higher Education / Community
Colleges$1,382,012,800
13.7%
Human Services$995,452,600
9.8%
State Police$414,171,000
4.1%
Debt Service /SBA Rent
$406,965,600 4.0%
Education$82,083,000
0.8%
House Fiscal Agency: December 2014 4
The Department of Education makes up 0.8% of the total state GF/GP budget
FY 2014-15 GF/GP Total = $10,116,704,100

SOURCES OF FUNDING
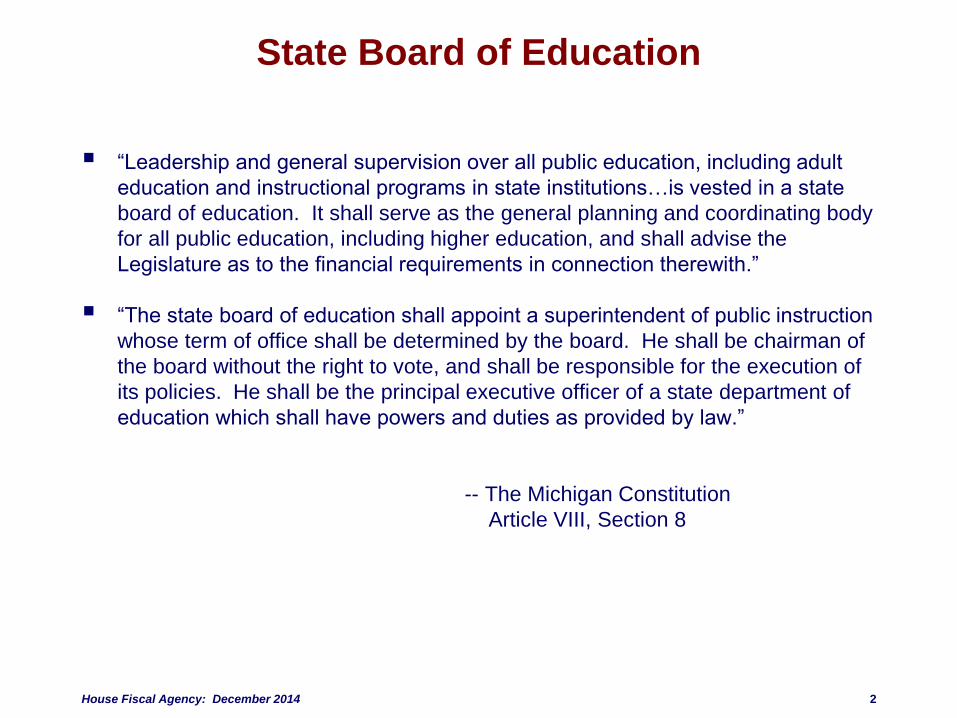
Department of Education Funding Sources
Federal$189,473,500
66.0%
State GF/GP$82,083,000
28.6%
State Restricted$7,972,600
2.8%
Local$5,633,700
2.0%
Private$1,933,300
0.7%
House Fiscal Agency: December 2014 6
Federal funds are the largest revenue source in the Department of Education budget.
FY 2014-15 Education Budget = $287,096,100
DEPARTMENT
APPROPRIATIONS

Department of Education Appropriations
The Department of Education provides:
Technical assistance to schools
Curriculum and grade level content standards
School accreditation standards
Administration of state aid to school districts
Education assessments development and administration
Compliance with federal “No Child Left Behind” Act
Teacher certification and professional development
Grants to schools and local educational organizations
Clearinghouse for school safety issues
Library of Michigan services to state government and the public
Administration of state aid to public libraries
Child day care subsidies
Total School Aid and Education Grant Appropriations: $14,012.6 million
MDE Administration Appropriations: $144.8 million (1% of total)
House Fiscal Agency: December 2014 8
Department of Education Appropriations
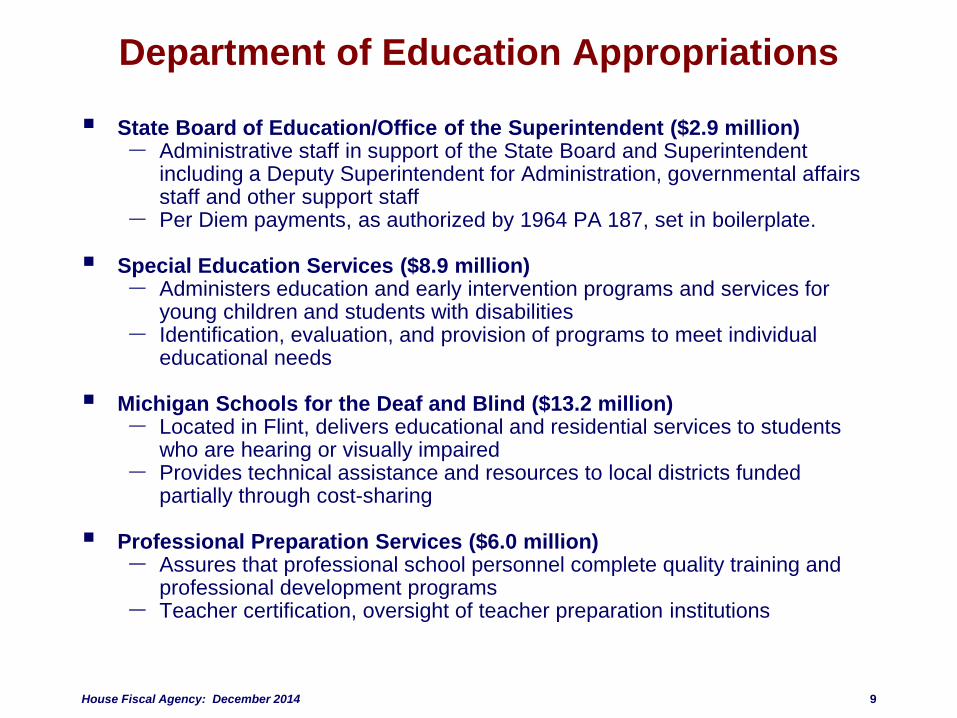
State Board of Education/Office of the Superintendent ($2.9 million)‒ Administrative staff in support of the State Board and Superintendent
including a Deputy Superintendent for Administration, governmental affairs staff and other support staff
‒ Per Diem payments, as authorized by 1964 PA 187, set in boilerplate.
Special Education Services ($8.9 million)‒ Administers education and early intervention programs and services for
young children and students with disabilities‒ Identification, evaluation, and provision of programs to meet individual
educational needs
Michigan Schools for the Deaf and Blind ($13.2 million)‒ Located in Flint, delivers educational and residential services to students
who are hearing or visually impaired‒ Provides technical assistance and resources to local districts funded
partially through cost-sharing
Professional Preparation Services ($6.0 million)‒ Assures that professional school personnel complete quality training and
professional development programs‒ Teacher certification, oversight of teacher preparation institutions
House Fiscal Agency: December 2014 9

Department of Education Appropriations
Great Start ($151.2 million)
‒ Consolidates early child education programs (MDE) and child care and
development programs (formerly DHS)
‒ Includes child care assistance payments
State Aid and School Finance ($1.9 million)
‒ Administers School Aid funding to districts
‒ Counsels districts on school finance and tax policy issues, financial
accounting, and pupil accounting
‒ Oversees school district deficit elimination plans
Audit Services ($0.6 million)
‒ Auditing and technical assistance to districts on financial and pupil
accounting
‒ Conducts desk reviews and quality control reviews of audit reports.
Administrative Law Services ($1.3 million)
‒ Hearings concerning teacher tenure, property transfer, teacher certification,
pupil membership audits
‒ Selection and training of special education hearing officers
House Fiscal Agency: December 2014 10
Department of Education Appropriations
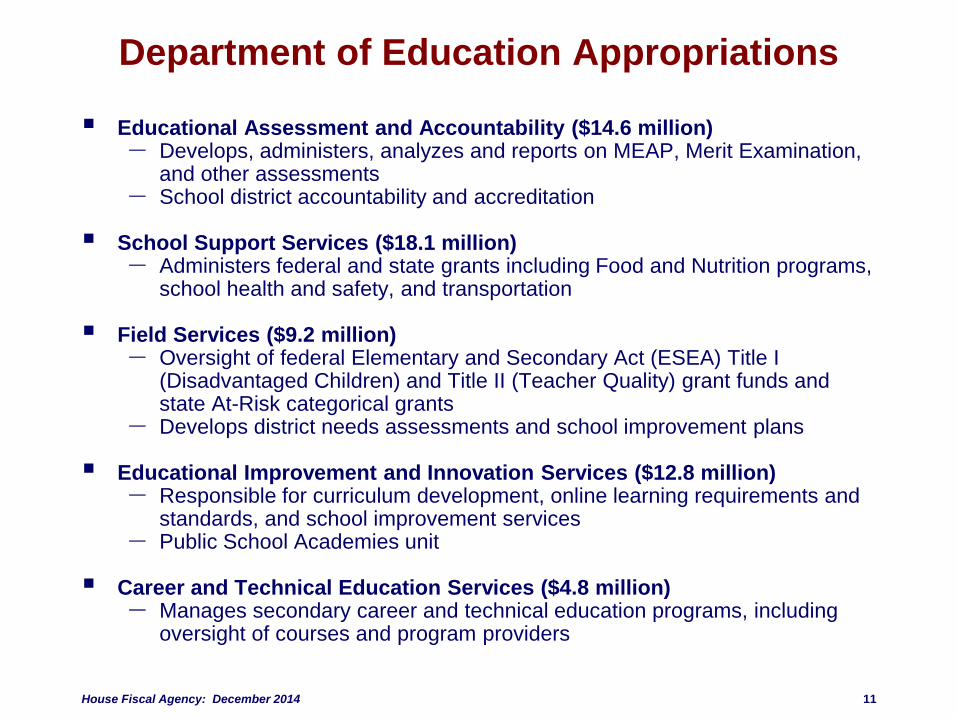
Educational Assessment and Accountability ($14.6 million)‒ Develops, administers, analyzes and reports on MEAP, Merit Examination,
and other assessments‒ School district accountability and accreditation
School Support Services ($18.1 million)‒ Administers federal and state grants including Food and Nutrition programs,
school health and safety, and transportation
Field Services ($9.2 million)‒ Oversight of federal Elementary and Secondary Act (ESEA) Title I
(Disadvantaged Children) and Title II (Teacher Quality) grant funds and state At-Risk categorical grants
‒ Develops district needs assessments and school improvement plans
Educational Improvement and Innovation Services ($12.8 million) ‒ Responsible for curriculum development, online learning requirements and
standards, and school improvement services‒ Public School Academies unit
Career and Technical Education Services ($4.8 million)‒ Manages secondary career and technical education programs, including
oversight of courses and program providers
House Fiscal Agency: December 2014 11

Department of Education Appropriations
CDC Public Assistance
$110,292,00038.4%
Other$31,459,600
11.0%
Library of Michigan$27,552,700
9.6%
Great Start$23,138,000
8.1%
Field Services/OEII$21,991,000
7.7%
Support Services/Grants
Coordination$18,111,700
6.3%
CDC Support (DHS)$17,766,500
6.2%
Assessment/Accountability
$14,637,7005.1%
Schools for Deaf/Blind$13,209,600
4.6%Special Education$8,937,300
3.1%House Fiscal Agency: December 2014 12
FY 2014-15 Education Budget = $287,096,100

MAJOR BUDGET TOPICS

FY 2014-15 Budget Highlights
Child Development and Care (CDC)—Hours Increase:
‒ An increase of $6.9 million in federal Child Care Development Fund (CCDF)
for the CDC Program to increase the maximum allowable reimbursable
hours for subsidized child care from 80 to 90 hours in a two-week period.
Child Development and Care (CDC)—Tiered Reimbursement:
‒ An increase of $3.7 million in federal CCDF to reimburse high quality
childcare providers at higher hourly rates per a tiered reimbursement
system based on quality ratings.
Child Development and Care (CDC)—Caseload Reduction:
‒ A decrease of $36.6 million related to an estimated reduction in CDC
caseload for a FY 2014-15 estimate of 18,200 cases per month.
Office of Great Start:
‒ Increases administrative support by 3.0 FTEs and $404,000 GF/GP to
provide additional administrative support for the Great Start Readiness
Program (funded in the School Aid Budget), which has been more than
doubled over the last two fiscal years.
House Fiscal Agency: December 2014 14

FY 2014-15 Budget Highlights (cont.)
Financial Independence Team (FIT):
‒ Creates a new financial independence team tasked with implementing early
warning systems for distressed schools in need of financial attention.
‒ Includes $778,100 GF/GP and 4.0 FTEs, to be utilized in conjunction with
$4.5 million and 9.0 FTEs in the Department of Treasury.
Low Achieving Schools—School Reform:
‒ Provides $918,600 GF/GP and 6.0 FTEs for resources to help the lowest
achieving schools to improve their academic programs and performance.
Library Funding—Renaissance Zone Reimbursements:
‒ Transfers 3.2 million in Renaissance Zone Reimbursements from the
School Aid budget.
Library Funding—MPSERS Payments:
‒ Transfers $1.3 million state share for MPSERS payments to Libraries from
the School Aid budget.
‒ Provides $900,000 for the required increase in the state share for MPSERS
payments.
House Fiscal Agency: December 2014 15

LIBRARIES

Library of Michigan/State Aid to Libraries
Transferred from the Department of History, Arts, and Libraries in
FY 2009-10
Supports the operation of the Library of Michigan ($4.4 million GF/GP)
Supports State Aid to Libraries ($8.9 million GF/GP), based on:
‒ $0.50 per capita to public libraries meeting minimum standards
‒ $0.50 per capita to public libraries for cooperative services
‒ $0.50 per capita to cooperative libraries
‒ $10/mi2 to cooperative libraries with low population density
‒ Reimbursement of up to $4,800 for the director’s salary for county libraries
serving populations of less than 50,000.
Minimum Standards for Public Libraries
‒ “Lawfully established” as a public library
‒ Maintain local support equal to 3/10 mill
‒ Personnel certification requirements set by Library of Michigan
State Aid payments are subject to proration based on available
appropriations.
House Fiscal Agency: December 2014 17
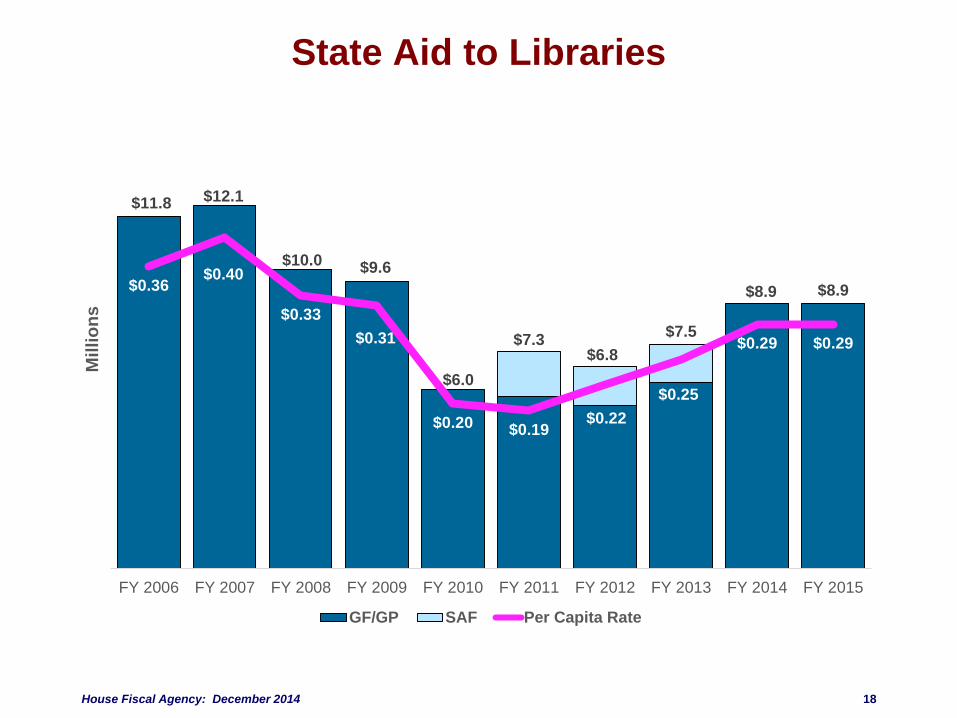
State Aid to Libraries
$11.8 $12.1
$10.0 $9.6
$6.0
$7.3$6.8
$7.5
$8.9 $8.9$0.36 $0.40
$0.33
$0.31
$0.20 $0.19 $0.22
$0.25
$0.29 $0.29
FY 2006 FY 2007 FY 2008 FY 2009 FY 2010 FY 2011 FY 2012 FY 2013 FY 2014 FY 2015
Mil
lio
ns
GF/GP SAF Per Capita Rate
House Fiscal Agency: December 2014 18

Public Libraries’ Operating Income
Millage Income$298,774,332
76.6%
Apportioned Tax Income
$27,154,4867.0%
Other Local Income$28,091,836
7.2%
Penal Fine Revenue$24,681,545
6.3%
State Income$7,229,489
1.9%
Contract Fees$3,270,501
0.8%
Federal Income$775,252
0.2%
House Fiscal Agency: December 2014 19
FY 2012-13 Total Operating Income = $389,977,441

Public Libraries’ Operating Income
$0.0
$50.0
$100.0
$150.0
$200.0
$250.0
$300.0
$350.0
$400.0
$450.0
$500.0
2002-03 2003-04 2004-05 2005-06 2006-07 2007-08 2008-09 2009-10 2010-11 2011-12 2012-13
Mill
ion
s
Penal Fine Revenue Millage Income Apportioned Tax Income
Contract Fee Income Other Local Income State Operating Income
House Fiscal Agency: December 2014 20

Public Libraries’ Operating Expenditures
Staff Wages$172,849,953
46.8%
Other Expenditures$91,078,322
24.7%
Staff Benefits$64,308,687
17.4%
Print Materials$25,437,495
6.9%
Non-Print Materials$9,529,107
2.6%
Electronic Materials$6,107,279
1.7%
House Fiscal Agency: December 2014 21
FY 2012-13 Total Operating Expenditures = $369,310,843
CHILD DEVELOPMENT AND
CARE (CDC) SERVICES
Child Development and Care (CDC) Services
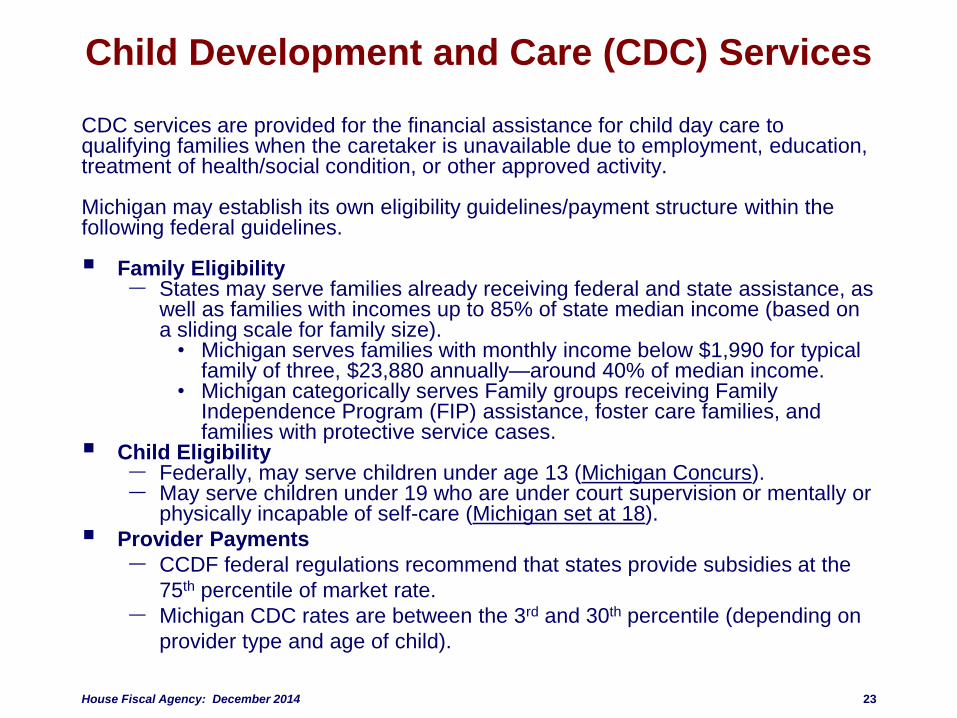
CDC services are provided for the financial assistance for child day care to qualifying families when the caretaker is unavailable due to employment, education, treatment of health/social condition, or other approved activity.
Michigan may establish its own eligibility guidelines/payment structure within the following federal guidelines.
Family Eligibility‒ States may serve families already receiving federal and state assistance, as
well as families with incomes up to 85% of state median income (based on a sliding scale for family size).
• Michigan serves families with monthly income below $1,990 for typical family of three, $23,880 annually—around 40% of median income.
• Michigan categorically serves Family groups receiving Family Independence Program (FIP) assistance, foster care families, and families with protective service cases.
Child Eligibility‒ Federally, may serve children under age 13 (Michigan Concurs).‒ May serve children under 19 who are under court supervision or mentally or
physically incapable of self-care (Michigan set at 18).
Provider Payments
‒ CCDF federal regulations recommend that states provide subsidies at the
75th percentile of market rate.
‒ Michigan CDC rates are between the 3rd and 30th percentile (depending on
provider type and age of child).
House Fiscal Agency: December 2014 23

Child Development and Care (CDC)
Provider Types
Licensed Centers
‒ A facility, other than a private home, licensed to care for one or more
children.
Licensed Group Homes
‒ A private home licensed to care for up to 12 children at a time.
Registered Family Homes
‒ A private home registered to care for up to six children at a time.
Unlicensed Providers
‒ An adult who is 18 years or older and enrolled to provide child care for up to
four children at a time (or six children, if all children are siblings or living at
the same address).
House Fiscal Agency: December 2014 24

Child Development and Care (CDC)
Provider Tiered Reimbursement
House Fiscal Agency: December 2014 25
Infant/Toddler (Birth to 2 ½) Preschool/School-Age
(Over 2 ½)
Child Care &
Preschool
Centers
Group and
Family Child
Care Homes
Child Care &
Preschool
Centers
Group and
Family Care
Homes
Base Rate $3.75 $2.90 $2.50 $2.40
3 Star Rate
Additional$0.25/hour $4.00 $3.15 $2.75 $2.65
4 Star Rate
Additional $0.50/hour $4.25 $3.40 $3.00 $2.90
5 Star Rate
Additional $0.75/hour $4.50 $3.65 $3.25 $3.15

Child Development and Care (CDC) ServicesProvider Type
House Fiscal Agency: December 2014 26
0
5,000
10,000
15,000
20,000
25,000
30,000
35,000
40,000
45,000
50,000
Providers Providers Providers Providers Providers Providers
FY09 FY10 FY11 FY12 FY13 FY14
Pro
vid
ers
Licensed Centers Licensed Group Homes
Registered Family Homes Unlicensed Providers

Child Development and Care (CDC) Services
Child Care Development Fund (CCDF)
‒ Mandatory Funds ($32.1 million)
• Social Security Act, Section 418
• Based on amount received for child care prior to 1996 welfare law
• No match or maintenance of effort (MOE) required
‒ Matching Funds and MOE Level ($100 million)
• Matched at current Medicaid match (FMAP) rates (65.54% in FY 2014-
15)
• Federal match ($50.3 million)
• State match ($25.3 million)
• MOE required ($24.4 million)
• School Aid Budget At-Risk Program (Sec. 31a) and Great Start
Readiness Program (GSRP) (Sec. 32d) funding used as match
‒ Discretionary Funds ($73.2 million)
• Federal Child Care Development Block Grant (CCDBG)
• No match or MOE required
• Based on federal appropriation
• Allocated based on children under age 5, children receiving free or
reduced-price lunch, and state per-capita income
House Fiscal Agency: December 2014 27

Child Care Development Fund (CCDF)
$0.0
$50.0
$100.0
$150.0
$200.0
$250.0
FY97 FY98 FY99 FY00 FY01 FY02 FY03 FY04 FY05 FY06 FY07 FY08 FY09 FY10 FY11 FY12 FY13 FY14
Mill
ion
s
State Match Fed Match State MOE Mandatory Discretionary
House Fiscal Agency: December 2014 28
Source: Dept. of Health and Human Services
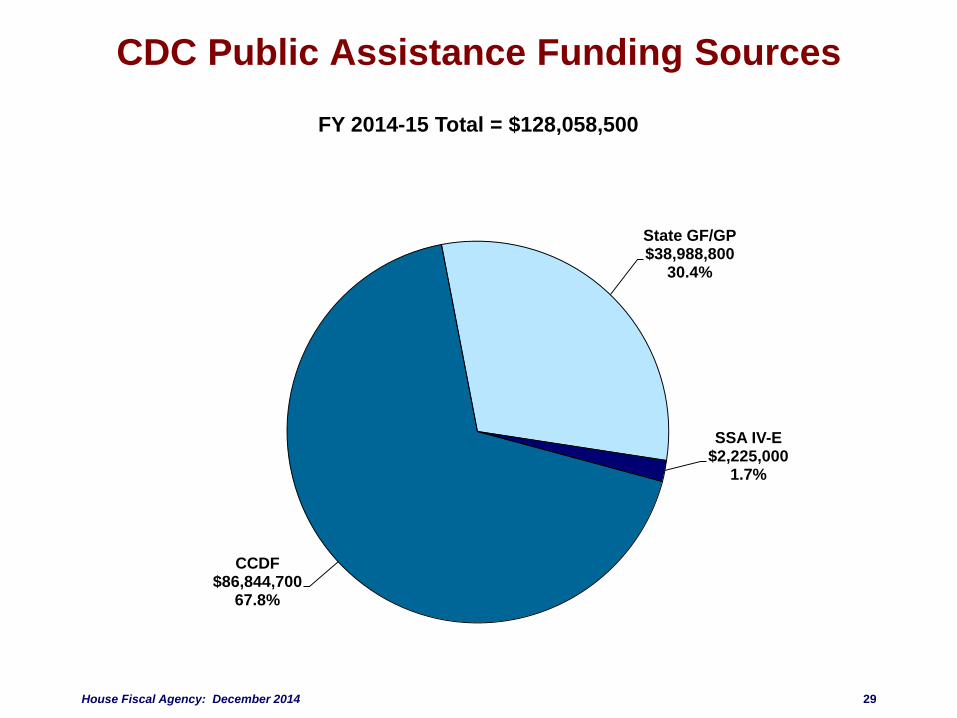
CDC Public Assistance Funding Sources
CCDF$86,844,700
67.8%
State GF/GP$38,988,800
30.4%
SSA IV-E$2,225,000
1.7%
House Fiscal Agency: December 2014 29
FY 2014-15 Total = $128,058,500
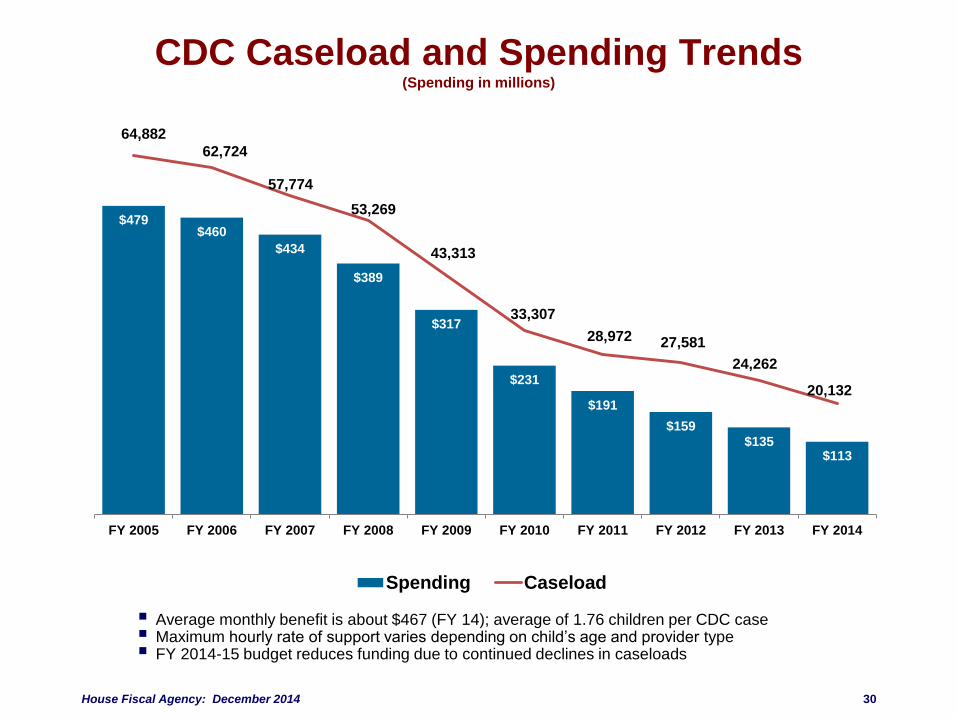
CDC Caseload and Spending Trends(Spending in millions)
Average monthly benefit is about $467 (FY 14); average of 1.76 children per CDC case Maximum hourly rate of support varies depending on child’s age and provider type FY 2014-15 budget reduces funding due to continued declines in caseloads
House Fiscal Agency: December 2014 30
$479$460
$434
$389
$317
$231
$191
$159$135
$113
64,882
62,724
57,774
53,269
43,313
33,307
28,972 27,581
24,262
20,132
FY 2005 FY 2006 FY 2007 FY 2008 FY 2009 FY 2010 FY 2011 FY 2012 FY 2013 FY 2014
Spending Caseload

For more information about the
Department of Education budget,
contact:
Samuel Christensen
(517) 373-8080


![8.9 Supervision Users Guide[1]](https://img.pdfslide.us/doc/110x75/545d7fafb0af9fa42c8b5164/89-supervision-users-guide1.jpg)