Embed Size (px)
Citation preview

Department of Economics Appalachian State University Boone, NC 28608 Phone: (828) 262-2148 Fax: (828) 262-6105 www.business.appstate.edu/economics
Department of Economics Working Paper
Number 21-09| July 2021
Unethical Decision Making and Sleep Restriction:
Experimental Evidence
David L. Dickinson Appalachian State University
David Masclet
University of Rennes

1
Unethical Decision Making and Sleep Restriction: Experimental Evidence
David L Dickinson
David Masclet
June 2021
Abstract: Recent examinations into the cognitive underpinnings of ethical decision making has focused on understanding whether honesty is more likely to result from deliberative or unconscious decision processes. We randomly assigned participants to a multi-night sleep manipulation, after which they completed 3 tasks of interest: imperfectly identifiable dishonesty (the Coin Flip task), identifiable dishonesty (the Matrix task), and anti-social allocation choices (the Money Burning game). We document the validity of the sleep protocol via significantly reduced nightly sleep levels (objectively measured using validated instrumentation) and significantly higher sleepiness ratings in the sleep-restricted (SR) group compared to the well-rested (WR) group. We report that money burning decisions are not statistically different between SR and WR participants. However, regarding honesty, we find significant and robust effects of SR on honesty. In total, given the connection between sleepiness and deliberation, these results add to the literature that has identified conditions under which deliberation impacts ethical choice. When dishonesty harms an abstract “other” person (e.g., the researcher’s budget), reduced deliberation more likely increases dishonesty compared to when harm is done to someone at closer social distance (e.g., another subject).
JEL Codes: C91, D91, D63
Key words: Ethical choice, dishonesty, antisocial behavior, sleep.
Acknowledgements: This grant was support by National Science Foundation grant SES-1734137. The authors are grateful for valuable comments from seminar participants in the department of economics at the University of Arkansas. The protocol, to include the sleep manipulation and decision tasks, was approved by the Institutional Review Board at Appalachian State University on January 19, 2017 (IRB approval #17-0177).

2
1. Introduction
Understanding the factors that influence unethical behaviors is crucial, and economists have
been working on the determinants of unethical activities for decades. Indeed unethical activities
constitute a major concern for firms and organizational research has shed light on the the
importance and pervasiveness of such deviant behavior within firms.1 Unethical activities
generate large costs to the affected organizations. For instance, yearly losses due to theft are
estimated at over $40 billion (Coffin, 2003), and the annual cost of absenteeism in the United
States is estimated at approximately $30 billion (Steers and Rhodes, 1984). In the aggregate,
deviant behavior costs organizations as much as $200 billion annually (Murphy, 1993).
Moreover, employees’exposure to other employees’ deviance can lead to low morale, damaged
self-esteem, increased fear at work, create uncertainty, eroded trust among workers, impaired
collaborations, and increased turnover (Giacalone, Riordan, & Rosenfeld, 1997).
Traditionally, it is assumed that cheating results from a comparison of the expected pecuniary
costs and benefits associated with honest and dishonest behavior. According to the standard
economic model of crime, an individual maximizes the expected material payoff when choosing
between honest and dishonest behavior (e.g., Becker, 1968). However standard models do a
poor job in explaining unethical activities, and a large body of experimental research has found
that individuals do not fully exploit opportunities to cheat (e.g., Gneezy, 2005; Sutter, 2008;
Dreber and Johannesson, 2008; Kajackaite and Gneezy, 2017; Gneezy et al., 2013; Gneezy et
al, 2018; Mazar et al., 2008; Cohn et al. 2019; Balasubramanian et al., 2017).
Previous studies suggest heterogeneity across individuals regarding morality
preferences. Some people incur high intrinsic costs of unethical behavior such that they may
always behave honestly even when this means foregone material benefits (homo moralis)2. In
contrast, others may always cheat unless extrinsic costs are present and outweight the material
benefits of dishonesty (homo economicus). Between these two extremes cases, many
individuals may be conditionally honest and cheat only if the benefits outweigh the intrinsic
1 Unethical behaviors in firms can be defined as behavior that violate significantly organizational norms and legal rules, and can therefore threaten performance and well-being of the organization and/or its members (Robinson and Bennett, 1995). Examples of unethical activities are many: theft (Coffins, 2003), sabotage (Lazear, 1989; Chen, 2003; Harbring and Irlenbusch, 2008; Harbring et al., 2007; Abbink and Hermann, 2011), false performance reports or doping (see Schwieren and Weichselbaumer; 2010; Charness et al., 2014), forgery (List et al. 2001; Enders and Hoover, 2004), excessive absenteeism, leaving early or arriving late to work (Robinson & Bennett, 1995), inter-personal rudeness (Robinson and Bennett, 1995), resource destruction (Abbink and Sadrieh, 2009; Abbink and Hermann, 2011; Zizzo and Oswald, 2001; Zizzo, 2010). Schwieren and Weichselbaumer (2010) show experimentally that a competitive environment encourages people to cheat to improve their own performance, and others have found that competition may increase sabotage (Lazear, 1989; Chen, 2003; Harbring and Irlenbusch, 2008; Harbring et al., 2007; Abbink and Hermann, 2011) 2 This is in line with Augustine (421) and Kant (1787) who advocated such a categorical approach to morality.

3
costs.3 Another strand of literature suggests that unethical behavior may often result from non-
rational processes (Bazerman, 2014; Bazerman and Tenbrunsel, 2011; Pittarello et al., 2015;
Elfenbein, 2007). An on-going debate worth more attention is whether (a)morality is stable
feature of behavior or whether it may be influenced by factors such as the environment or mood.
A growing body of research has attempted to identify various contextual factors such as social
influence, organizational features or choices in moral dilemmas as determinants of unethical
activities (e.g., Fox, Spector, & Miles, 2001; Diekmann et al., 2015; Kroher and Wolbring,
2015; Rauhut, 2013; Fortin et al., 2007; Figuieres et al.2013; Kebede and Zizzo, 2015).4 Other
studies have examined how state-level emotions impact dishonesty (Gaudine and Thorne,
2001).
One particular domain that has not received as much attention in the midst of this
research is the relationship between insufficient sleep and unethical decision making. In this
current paper we use experimental methodology to investigate how sleep restriction may affect
unethical behaviors. Precisely, we attempt to explore how a commonplace cognitive state
(insufficient sleep) may contribute to unethical behaviors in simple and consequential decision
environments. Given the prevalence of insufficient sleep in society, estimated to affect roughly
1/3 of adults in numerous countries (Hafner et al, 2017), this research is timely and has broad
implications for understanding unethical behavior in the workplace as well as elsewhere.
We conjecture that individuals will be less likely to resist the temptation to engage in
unethical behavior when they are sleep restricted, and we test this hypothesis using validated
laboratory decision tasks. There is previous evidence supporting this conjecture (e.g., Barnes et
al, 2011; Christian and Ellis, 2011; Barnes et al, 2015; Welsh et al, 2018). Some previous
studies have shown that sleep-deprived individuals often act impulsively, express irritability,
hostility, anger and may engage in interpersonally inappropriate behaviors (e.g. Harrison and
Horne, 2000; Reynolds and Schiffbauer, 2004; Zohar, et al., 2005). In our experiment, we
administrated a validated at-home sleep restriction protocol to over 200 participants who then
3 Some other studies have examined the role of individual differences or organizational characteristics as antecedents of unethical behavior (Kish-Gephart, Harrison, & Trevino, 2010), such gender, age, education, work experience, personality, ethical climate, and culture. 4 Using a two-period lab experiment, Diekmann et al. (2015) found that confronting subjects with others’ cheating in the first round increases cheating in the second round. In sharp contrast, Kroher and Wolbring (2015) did not find any significant effect of showing subjects the prevalence of cheating in other experiments. Rauhut (2013) found that, on average, cheating did not change over four rounds if participants received information on others’ behavior in the previous round. However, when distinguishing subjects by their beliefs about others’ dishonesty in the respective period, Rauhut (2013) showed that over-estimators reduced dishonesty when they are informed about others’ behavior while under-estimators increasde dishonesty. In the context of a tax evasion game, Fortin et al. (2007) investigated whether cheating was influenced by the information about average tax evasion in the previous round. No evidence for dynamic social learning effects was found.

4
made decisions focused on honesty and antisocial choice. Our full-week sleep restriction
protocol approximated the levels of insufficient sleep common in society such that findings are
more likely to transfer to real world decision making.
A first contribution of our study is that we test the relationship between sleep restriction
and unethical activities by reporting results from three different decision tasks: the money
burning task (Zizzo and Oswald, 2001, the coin flip task (Bucciol and Piovesan, 2011; Houser
et al, 2012), and the matrix task (Mazar et al, 2008). The money burning game is commonly
used to study anti-social preferences (Zizzo and Oswald, 2001; Zizzo, 2004; Abbink and
Sadrieh, 2009; Abbink and Herrmann, 2011; Prediger et al., 2014; Dickinson and Masclet,
2019; Zhang et al., 2020), while the coin flip and matrix tasks involve honesty. The second
contribution of our work is that we provide an original theoretical framework for decision
making with moral concerns that may help identify key pathways through which sleep
restriction may affect choices.
To preview our findings, we observe that sleep restriction increases dishonesty but not
antisocial choice. We discuss how these findings fit into the literature on ethical choice.
Specifically, the social distance between the decision making and the individual impacted by
the choice likely mediates the path connecting deliberation and dishonesty. Models of decision
making that incorporate ethical concerns into one’s utility function may wish to consider social
influences, as well as factors that may dilute the disutility of immoral choice, within their
frameworks.
The paper is organized as follows. Section 2 presents the existing literature. Section 3
describes our experimental design and procedures. Section 4 discusses the theoretical
predictions and behavioral hypotheses that we propose for evaluation. Section 5 reports our
findings. Finally, section 6 discusses our main findings and concludes this paper.
2. Background on the effects of sleep deprivation
A large body of research has shed light on the importance of sleep for various outcomes, and
the focus on how insufficient sleep affects decision making has been of significant interest in
this literature (e.g., Pilcher and Huffcutt, 1996; Harrison and Horne, 2000; McKenna et al, 2007;
Barnes and Hollenbeck, 2009; Dickinson and McElroy, 2017). Sleep deprived individuals tend
to perform normally on standardized tests (Blagrove, et al. 1995; Harrison and Horne, 2000),
and they may not suffer from poor decisions if the choice environement is not complex
(McElroy and Dickinson, 2019). However, for more complex decision tasks requiring
executive function, the lack of sleep likely harm decision quality (Harrison and Horne, 2000;

5
McElroy and Dickinson, 2019; Dickinson and McElroy, 2019). In the neuroscientific literature,
it has been shown that the effects of sleep deprivation on human behavior result from decreased
brain functioning, particularly in the prefrontal cortex, a region that contains a critical set of
neocortical structures related to executive function and self-control (Harrison and Horne, 2000;
Jennings, et al., 2003; Durmer and Dinges, 2005).5
Research on how sleep affects moral choice or ethical decision making is relatively new.
Barnes et al (2011) highlighted the positive relationship between sleep and self-control. Their
study showed increased sleep reduced unethical choices in a laboratory choice task, although
sleep levels were observations and not manipulated. Another paper used a proper sleep
manipulation and showed that sleep deprivation increased antisocial deviant behaviors, and this
effect was mediated by hostility of the individual (Christian and Ellis, 2011). A focus area of
the existing research on sleep and ethical behavior has been on workplace behaviors, where
reduced sleep has been shown to increase cyberloafing (Wagner et al, 2012), increase
workplace deviant behaviors (Christian and Ellis, 2011), and increase abusive supervisory
behavior (Barnes et al, 2015b), among other workplace relevant findings (Barber and Budnick,
2016). Still others have connected lack of sleep and to reduced moral awareness (Barnes et al,
2015a) or suggested that morning versus evening times may impact morality (Kouchaki and
Smith, 2014). The research on morality in the morning by Kouchaki and Smith (2014),
however, is likely more focused on the idea that resources needed to control unethical urges are
depleted over the course of the day and therefore at their highest in the morning. Some have
suggested factors that either moderate (e.g, “contemplation”, see Welsh et al., 2018) or
strengthen this effect (e.g., social influence, see Welsh et al, 2014). As a whole, the state of
this literature suggests that sleep deprivation or insufficient sleep likely leads to more unethical
or deviant behaviors, although relatively little of this evidence uses direct and incentivized
measures of dishonesty.
Most of the aforementioned literature connecting sleep to ethical choice relies heavily on
theories of self-control resource depletion (Baumeister et al, 2000). Within this literature,
5 This region have been implicated in the ability to control emotions and inhibit behaviors (Damasio, 1994; Miller, 2000). Other authors have shown that prefrontal impairment leads to increased negative emotions and poor emotion regulation (Davidson et al., 2000). Furthermore some studies have shown that individuals who have depleted self-control are less able to inhibit aggressive or destructive impulses (DeWall et al., 2007; Tangney, Baumeister, & Boone, 2004). Other studies have shed light on the fact that when self-regulatory resources are depleted, self-control is reduced (DeWall et al., 2007; Gailliot et al, 2006). Self-control has also been linked to an increase in impulsive and risky decisions (Leith and Baumeister, 1996). Of relevance here, one study also found that self-control depleted individuals were more likely to take advantage of the opportunity to cheat (Mead et al., 2009).

6
dishonesty is often considered the more automatic behavior (see survey in Bereby-Meyer and
Shalvi, 2015). Depletion of self-control resources, as might be the case with sleep restriction,
has been shown to increase impulsive cheating (Mead et al, 2009; Gino et al, 2011). However,
not all have come to the same conclusion. Capraro (2017) found that time pressure, which
presumably promotes more automatic choices, increased honesty in a deception game. This
result was supportive of the Social Heuristics Hypothesis (Rand et al, 2014) that argues honesty
is more intuitive because it serves one better evolutionarily in everyday life. A recent meta-
analysis that reviewed the literature on intuitive honesty versus intuitive dishonesty (Köbis et
al, 2019) is perhaps helpful. These authors concluded that when dishonesty harms abstract
“others” or those at increased social distance (e.g., the researcher’s budget), then dishonesty
increases when automatic or intuitive choice is promoted. Conversely, when dishonesty harms
other subjects in the lab (i.e., those at reduced social distance), then being honest is more
automatic.
3. Methodology and experimental design
3.1 Sleep Protocol Methods
Our research method started with an at-home sleep protocol designed to be ecologically valid
in its approach to sleep manipulation, while at the same time preserving experimental feature
of random assignment and objective measurement of sleep levels resulting from the protocol.
First, an online sleep survey was administered to random samples of university students at one
of the author’s institution. This took place regularly (e.g., every semester) to establish a viable
database from which to draw potential experiment participants. The sleep survey database
included basic sleep measures, a validated morningness-eveningness questionnaire, and
screeners for anxiety, depressive, and sleep disorders. Exclusion criteria for the main study
were: age outside the 18-40 years of age range, extreme morning- or evening-type preference,
significant risk of major depressive or anxiety disorder, and self-reported sleep disorder or
insomnia. Those individuals in the database who passed the screening criteria were then
randomly assigned, ex ante, to a restricted sleep (SR) or well-rested (WR) treatment week prior
to being sent an email invitation to participate in the week-long study.
The week-long protocol required the participant to visit the lab for each of two sessions
exactly one week apart. Sessions were either on a Tuesday, Wednesday, or Thursday (to avoid
weekend sleep effects) and between 10am and 6pm to avoid extreme times of day. For example,

7
a cohort of subjects would be scheduled for Tuesday 11am sessions, which meant the
recruitment email described that they must come to the experiment lab for a 1.5 hour lab session
on Tuesday from 11am-12:30 as well the following Tuesday from 11am-12:30. The email
invitation explained to the potential subject the treatment week to which he/she had been
randomly assigned, the time/day of the two experiment sessions, and the fact that she was
expected to wear an actigraphy device (a.k.a., the sleep watch) that would objectively measure
the subject’s sleep levels throughout the entire week. Additionally, it was explained that she
must keep a sleep diary during the week and email her bed/wake times to the experimenter each
day (these complementary data were used as part of the standard actigraphy data scoring
protocol). Subjects assigned to the SR treatment were asked to attempt sleep each night within
the 5-6 hrs/night window, while WR treatment subjects were asked to attempt 8-9 hrs/night
sleep. Subjects were cautioned against drinking alcohol if assigned to the SR treatment, but
otherwise they were free to carry on their usual activities during the sleep treatment week.
The at-home nature of the protocol is what gives our design high ecological validity.
Additionally, the protocol manages risk to the sleep subject by allowing all forms of
compensatory strategies deemed useful by the subject (other than sleeping more). Below, we
shall discuss degree of compliance and issues surrounding subject attrition within the one-week
protocol. In short, the protocol was intended to produce subjects who have undergone a full
week of SR or WR sleep levels prior to administration of decision tasks during Session 2 (the
decision experiment lab session). One of the tasks reported below (the “coin flip” task) was
administered as part of a voluntary additional online survey that participants could choose to
complete after night 5 of the protocol for additional compensation—each was allowed to
complete the survey at any point after night 5 but before Session 2, which implies the subject
may have been in the protocol 5, 6, or 7 nights at the time of decision making in that task.
The objective measurement of sleep levels means we have more than one way in which
we can control for sleep restriction in the analysis. An alternative to a dichotomous indicator
for SR assignment would be to use the continuous (and objective) measure of one’s nightly
sleep average (in minutes per night). Yet another option is to combine the nightly sleep average
measures with the subject assessment of one’s personal sleep need, which was elicited at an
earlier point in time during the online sleep survey. This measure, which we call Personal SD,
is a hybrid of subjective and objective measures that may be useful in trying to assessing the
level of sleep restriction in a more personalized way. Though these continuous measures allow
for full exploitation of the continuously measured nightly sleep time, it is important to
remember that only the binary assignment to SR=0 or 1 was dictated by the experimenters (i.e.,

8
variation in nightly sleep or Personal SD, within the sleep assignment groups may be due to
factors beyond the experimenter control). As we will see, our results are largely robust cross
all potential sleep control measures, with perhaps some exceptions in the case of Personal SD.
3.2 Decision Task Methods
As noted above, our methods included the administration of 3 decision tasks of interest:
the money burning task (Zizzo and Oswald, 2001, the coin flip task (Bucciol and Piovesan,
2011; Houser et al, 2012), and the matrix task (Mazar et al, 2008). In our current study, the
money burning task asks one to consider several possible allocations of payoffs between oneself
and another participant, and it then gives one the ability to pay money to destroy even more
resources of the other (and the other participant cannot retaliate). While such money burning,
in general, can be viewed as anti-social given that resources are destroyed, choices to burn may
be considered acts to reduce inequality or acts of pure nastiness depending on the allocation
being considered (see Table 2). As such, the money burning task is not about honesty, but
could be considered within the domain of ethical choice if one considers nastiness as unethical.
Table 2 shows the stimulus of the money burning task. This task was administered in the lab
session at the end of the sleep protocol and key details of the task were summarized in the
stimulus itself. The full instructions informed participants that allocations represented payoffs
(in cents), that they must make an allocation choice for each of 9 different scenarios, and that
random (anonymous) counterpart and role assignments, as well as the scenario randomly
selected for real payoff, would only be determined after all decisions had been made at the end
of the experiment (see Appendix B for full instructions).
Our version of the coin flip task measured honesty by asking participants to report the
number of HEADS flipped out of 15 total coin flips when payoffs are known to increase in the
number of HEADS reported.6 This short task was not administered in the lab session but rather
was offered as an optional addition experiment task to be taken online by the participant after
the 5th night of the sleep protocol (but before the end of the study). Specifically, in the online
task participants were asked to locate a coin, flip it 15 times, and report the number of HEADS
flipped in total. The temptation for dishonesty was induced by indicating in the instructions
that the participant would be paid $0.25 per HEAD flipped (see Appendix B). This payment
6 This variant of the task in Houser et al (2012) that asks for the outcome of multiple flips is another way to introduce additional richness to the outcome measure relative to a single coin flip report. The die-roll task (Fischbacher & Föllmi-Heusi, 2013) does this in a different way given the potential for multiple outcomes that allow varied degree of cheating.

9
was given via Amazon gift-code and was in addition to a fixed payment received for the
additional online survey offered to participants in this study—this online survey contained other
unrelated tasks. Coin flips in the online task were obviously conducted in private and so certain
outcomes (HEADS reports) may be statistically unlikely but not verifiably dishonest at the
individual subject level.
The matrix task, like the money burning task, was conducted in the laboratory decision
session after the sleep treatment week. For the matrix task, participants were presented a sheet
containing 15 distinct 3x3 matrices and told the goal with each matrix was to identify a pair of
cells whose numbers summed to exactly 10.00. Participants were told they would be given
exactly 4 minutes to solve as many matrix problems as possible. Participants were told they
would earn $1 for each matrix correctly solved, but they would pay themselves from a blank
and unmarked envelope at their lab station that contained 15 $1 bills. Task details were such
that decisions and payments separated and ostensibly anonymous (no subject codes, names, and
no payment receipts for this task), and completed matrix sheets were collected separately by
the experimenter—any remaining bills left in the unmarked envelope at the lab station would
only be retrieved after all participants had left the lab. However, while the participant’s
assigned sleep study subject code was not used in any materials for this task, the experimenter
could match outcomes with payments at the individual level via the participant’s lab station
location and a secondary coding of the lab station number obfuscated within the experimental
laboratory name printed in the footer of the backside of the decision sheet (see Appendix B).
As such, honesty at the individual level was identifiable in the matrix task.
4. Theoretical predictions
Here, we aim to explain how sleep deprivation can be linked to self-control, which can in turn
be linked to unethical behavior. A framework for decision making with moral concerns may
help identify key pathways through which sleep restriction may affect choices. Consider the
framework in Masclet and Dickinson (2019). They define utility as: 𝑈𝑈(𝑎𝑎) = 𝑏𝑏(𝑎𝑎) − 𝑐𝑐(𝑎𝑎) −
𝑣𝑣(𝑎𝑎 − 𝑎𝑎�), where a is an action that generates both benefits, b, and costs, c. Morality is captured
by 𝑣𝑣(𝑎𝑎 − 𝑎𝑎�), which subtracts from utility for actions that deviate from one’s moral imperative,
𝑎𝑎�. In this framework, social influences may impact one’s moral imperative such that reduced
social distance between the decision maker and those affected by one’s actions may be
important. One practical extension of the model may be as follows:
𝑈𝑈(𝑎𝑎) = 𝑏𝑏(𝑎𝑎) − 𝑐𝑐(𝑎𝑎) − ʎ𝑣𝑣(𝑎𝑎 − 𝑎𝑎�)

10
Here, consider that ʎ ∈ [0,1] is a weight that can blunt the utility cost of deviation from
one’s moral target. In other words, ʎ decreases in sleep deprivation due to reduction prefrontal
resources necessary for moral choice. In this way, the full disutility of deviation from one’s
moral target is only felt by someone fully alert (or, without any cognitive resource depletion, in
general). Given that the pre-frontal cortex plays a key role in executive functioning (Nilsson et
al., 2005), or conscious decision making, lack of sleep may produce a diminished ability to
control impulsive and potentially deviant behaviors. Such a framework can also be used to
explain how any temporal or environmental factor, no just sleep, may impact utility in a way
that affect moral choice (e.g., Lu et al, 2018).
Though Masclet and Dickinson (2019) consider that social influences one’s moral target
via the parameter 𝑎𝑎�, here we can also consider social influences via the ʎ weight (see Gino et
al, 2009, on social influences on unethical choice). A more anonymous decision environment,
or one where decision impacts on others are more abstract and hard to identify, may reduce the
disutility of deviations from one’s moral target. This specification would then imply that more
unethical choice may result from depletion of cognitive resources via ʎ, all else equal.
Alternatively, there is evidence in the sleep literature that may indicate sleep deprivation blunts
the impact of an action’s costs in one’s utility and/or magnifies the anticipation of potential
gains from a particular choice (e.g., Venkatraman et al, 2007, 2011). Thus, it is also conceivable
that our hypotheses derive from the prediction that sleep deprivation will enhance the expected
marginal benefit, b(a), of an action and/or reduce the expected marginal cost, c(a), of that
action. All three of the potential mechanisms, which we cannot disentangle in this paper would
lead us to the same hypotheses we enumerate below. In addition, for a given level of sleepiness
(or cognitive resource depletion) a more direct impact of unethical choices on others would
sharpen the utility consequences of a deviation from one’s moral target (i.e., increased ʎ, all
else equal), which motivates a hypothesis focused on one’s social distance to those impacted
by a decision.
In formulating our hypotheses, we therefore take into account the prior literature identifying
sleep and moral choice, as well as the qualitative predictions of ethical behavior differences that
likely appear when decisions impact individuals at reduced social distance to the decision
maker, such as considered in the framework above. In doing so, we are also mindful of the fact
that antisocial choices in the Money Burning game are not equivalent to “dishonesty”, but it is
also the case that it is common knowledge that Money Burning will impact another subject in
the experiment (i.e., reduced social distance of impact). In contrast, dishonesty in the Coin Flip

11
or Matrix tasks impact the more abstract “experimenter budget”, which may be seen as similar
to affecting someone at greater social distance to the decision maker than another subject in the
experiment.
Hypothesis 1a: Sleep Restriction (SR) will increase resource destruction in the Money
Burning task
Hypothesis 1b: SR will not just increase money burning that reduces disadvantageous
inequality but also money burning that is considered nasty.
Hypothesis 2: SR will increase the number of HEADS reported in the Coin Flip task.
Hypothesis 3: SR will increase dishonest payments in the Matrix task.
Hypothesis 4: SR will more strongly predict dishonesty in the Coin Flip and Matrix tasks
than anti-social choice in the Money Burning game.
5. Results
A total of n=237 participants completed the protocol (though task data were incomplete on an
additional 4 participants, depending on the task, and sleep watch data were incomplete or
corrupted for another 2 participants). As such, the final data set is a total of n=231 for the
Money Burning task, and n=233 for the Matrix task. The sample size is somewhat smaller
(n=197) for Coin Flip task given that this was administered online after night 5 of the protocol
but was a supplementary task that was not required of the participants. Thus, the 197
participants who completed the Coin Flip task represents a completion rate of 83%-84% for this
task.
Assessment of the sleep protocol is an important first step in evaluating the validity of
the sleep manipulation methodology. Figure 2 and Table 1 summarize the protocol validity.
Figure 2 shows the kernel density estimates of nightly sleep level distributions by treatment
assignment. As can be seen, actigraphy measured sleep levels were approximately 117 min
less per night for those in the SR group compared to the WR group. As discussed below, one
may choose to examine all data as an intent-to-treat approach in the analysis, or an alternative
is to score some subjects as being noncompliant with the assigned sleep prescription. Here,
when coding the variable Compliant we consider a subject noncompliant if SR-assigned and
sleep level is greater than 375 min/night or WR-assigned with sleep levels of <405 min/night.7
7 While this is a somewhat arbitrary cutoff, we consider it reasonable in the sense that it eliminates those with nightly sleep levels near average self-regulated levels (of around 6.5 hrs/night) in young adults. And, as can be

12
In general, we will report results from both the full sample and restricted sample of “compliant”
subjects. The full sample captures the benefits of random assignment without the same
selection bias concerns that are present in considering the reasons behind noncompliance.
The protocol was successful at generating significant differences in nightly sleep levels
and, as shown in Table 1, tests on self-report measures of sleepiness, irritability, and alertness
present no significant differences on Day 1 of the 7-day protocol (prior to treatment) but
significant differences in the expected directions on Day 7 (i.e., SR increases sleepiness,
irritability, and reduces alertness). Additionally, because some participants were recruited for
the one-week study but failed to complete the protocol, we considered the issue of sample
selection in our estimations. Specifically, we estimated a probability of protocol completion
equation from the entire set of participants who signed up for the study, whether or not the
participant completed the protocol and appear in our decision task sample. This estimation
model is shown in Appendix Table A1. From these completion probabilities we constructed
the inverse probability weight (IPW) to estimated a weighted regression for all model
specifications that corrects for selection into the final sample. As we will see, both our null and
non-null results are similar whether or not we correct for sample selection.
We first evaluate results from the Money Burning task in using panel methods of the
choices over the 9 allocation scenarios shown in Table 2, which were administered via the
strategy method. In other words, subjects made decisions in all 9 scenarios prior to being
randomly matched with another participant in the cohort, prior to random assignment of the
roles of Player A and B, and prior to random selection of one scenario to play out for payoff
(payoff values represented cents, such that a payoff of 400 was $4.00, for example). We
considered demographic and allocation descriptors in all panel estimations in Table 2.
Important descriptors of the allocation scenario involve the payoff difference between the two
individual, whether the start distribution income is equal between the participants, the cost of
burning money relative to the Player A payoff. Demographic characteristics included age,
gender, minority status, the treatment assignment (SR = 0 or 1), and a chronic daytime
sleepiness score relating to the previous two weeks called the Epworth sleepiness scale (=0-24)
that may represent an adverse sleep indication unrelated to the treatment assignment.
Panel estimations of the probability a subject choose to burn money in a given scenario
are shown for both the full intent-to-treat sample of 231 subjects, as well as the subsample of
203 subjects deemed compliant with the sleep treatment prescription. Scenarios 1-5 in Table 2
seen in Figure 2, it removes those within the density function overlap that may be statistically harder to classify as belonging to one distribution or the other.

13
are rather different from scenarios 6-9 in the sense that the decision maker is at a payoff
advantage in the Start Distribution. As such, a money burning choice would be considered
somewhat “nasty” (see Zizzo and Oswald, 2001; Abbink and Sadrieh, 2009; Abbink and
Hermann, 2011). We therefore conduct separate estimations of scenarios 1-5 and 5-9 data (with
a dummy variable for the payoff equal start distributions scenario 5) to more clearly identify
money burning that likely derives from a disadvantageous inequality aversion (Fehr and
Schmidt, 1999) versus a preference for nastiness.
Marginal effects of the probability of burning money are reported in the Table 3, which
are based on robust standard errors clustered at the individual subject level.8 As can be seen in
Table 3, the sleep treatment assignment is not a significant predictor of money burning choices
in our data. In fact, the only robust predictor of money burning is the equal start distribution
allocation scenario 5. In this scenario, compared to scenarios 1-4 where one is at a payoff
disadvantage, subjects are about 19 percentage points less likely to burn resources. This is
consistent with an overall preference for payoff equality by our subjects, and this does not differ
based on SR assignment.9 This null result is robust with respect to a sample selection correction
as well (see Appendix Table A2). Thus, our data fail to support Hypotheses 1a and 1b.
We next examine results from the Coin Flip experiment. Mann-Whitney tests of the
median number of HEADS reported in the SR versus WR groups shows more HEADS reported
in the SR group, which is consistent with our Hypothesis 2. However, the result of the
appropriate one-tailed test is only marginally significant for the full sample (p = .061) for the
full sample. The precision of the test increases when examining the restricted sample of
compliant (n=174) participants (p = .039). Table 4 shows results from the multivariate analysis
of Coin Flip determinants, which includes specifications both with and without demographic
controls and with a correction for sample selection using the inverse probability weights (IPW)
from the selection equation the predicts completing this task condition on enrollment in the 1-
week study (Appendix Table A1). For this set of estimations, we estimated separate regression
models on the intent-to-treat (all subjects) and compliant-only data sets. The negative and
8 Models without demographic controls yield the same qualitative results in terms of sign and significance the sleep and allocation descriptor variables in all models. Also, results remain unchanged if using a continuous sleep quantity variable or the Personal SD measure in place of the dichotomous treatment assignment variable, SR. Our preference is to use the dichotomous SR indicator given it defines the random treatment assignment, whereas level of sleep (or, degree of compliance) may vary due to factors unrelated to the treatment assignment itself. 9 If one includes an interaction term Equal Income*SR, it is a statistically insignificant predictor (p > .10) of money burning, and its inclusion does not impact the sign or significance of the other coefficient estimates in the probit estimations.

14
statistically significant coefficient estimates on the SR indicator variable across specifications
in Table 4 support Hypothesis 2 that sleep restriction increases the number of HEADS reported.
Additional sensitivity analysis for Hypothesis 2 is shown in the coefficient plots of the
Coin Flip task analysis. This Figure 3 shows the estimates of the key sleep effect results on coin
flip outcomes using alternative measures to capture the sleep restriction effect. In addition to
using the dichotomous indicator for sleep restriction, SR, we also estimated models that
included the continuous actigraphy-measured Average Nightly Sleep Time and a hybrid variable
where average nightly sleep time is subtracted from one’s self-reported sleep need to create a
variable that describes how personally sleep deprived the individual may be, Personal SD (see
Appendix Tables A3 and A4 for full estimation details of these additional models). While these
two alternative approaches to controlling for sleep impacts in the data more fully exploit the
continuous nature of the data we have from the actigraphy measures, it is worth noting again
that variations in the degree of sleep restriction or well-restedness may be due to factors not
under experimenter control. Only the SR indicator reflects the random assignment of sleep
condition for the participant. Thus, our preferred specification uses the binary SR indicator,
with Personal SD perhaps being open to some additional criticism due to the combination of
the objective sleep and subjective sleep need in its construction
In contrast to our money burning estimates, which failed to support Hypotheses 1a and
1b, results in Table 4 and Figure 3 (see also Appendix Tables A3 and A4) indicate robust
evidence that assignment to the SR treatment predicts significantly higher number of HEADS
reported in the only coin flip experiment. It should be noted that both WR and SR individuals
reported, on average, significantly more HEADS than what is statistically expected (p < .01 in
both instances, based on simple one-sample z-tests). However, the fact that SR-assignment
predicts almost an additional HEAD reported (over a total of 15 flips reported) is suggestive of
an even higher level of dishonesty in the SR group (or those with lower levels of total sleep
time). The Female indicator is also a highlight significant predictor of fewer HEADS reported,
although if one includes an interaction term Female*SR, the interaction is not statistically
significant (this additional estimation result available on request). Regarding independent
variables used to control for sleep, Figure 3 shows that this support for Hypothesis 2 is robust
to the use of the objective and continuous measure of Avg Nightly Sleep, but the finding is not
precisely estimated when using Personal SD to control for participant sleep. Overall, these
results support Hypothesis 2 and, to some extent, Hypothesis 4, although they fall short of
providing definitive evidence of increased dishonesty when sleep restricted because of the

15
nature of the coin flip task—the experimenter cannot definitively claim cheating due to
increased HEADS reported above the statistical expectation.
Finally, we turn to the results from the Matrix Task, which allows identification of
dishonest overpayment at the individual participant level. Table 5 shows results of several
specifications estimating the predictors of the number of matrices for which one paid oneself,
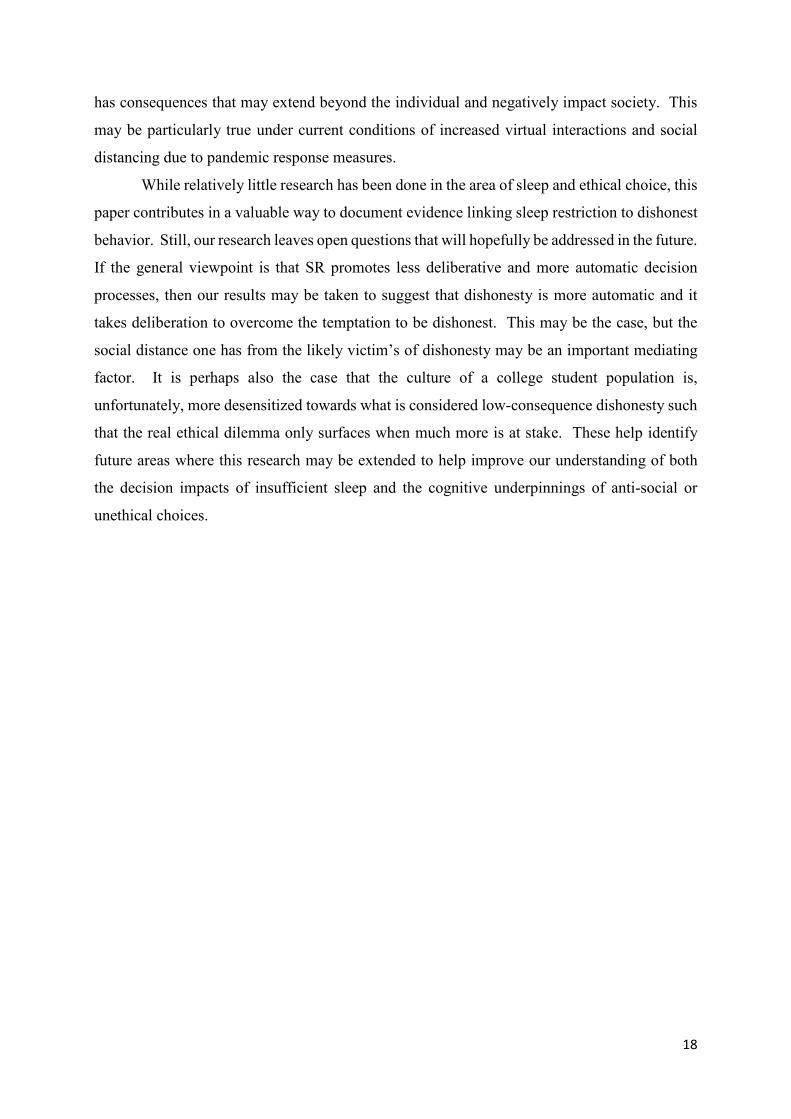
Matrix Pay. Figure 4 summarizes the results from these are even more specifications using
alternative controls for sleep (see Appendix Tables A5 and A6 for their full estimation results).
It is worth highlighting that the matrix task involves a cognitive component that may be
impacted by SR and that may also lead to some accidental overpayments. We consider it an
accidental overpayment if the subjects indicated a correctly solved matrix but was mistaken,
and yet made a self-payment based on that mistaken number of correct matrices reported. To
account for this, we include an additional control in the estimations for Matrix Report, which
captures the total number of matrices the subject reportedly solved. Self-payments that are not
tied to differences in Matrix Report are an indication of dishonesty that we can link directly to
the individual subject. Coefficient estimates on Matrix Report are all significantly different
from zero and not statically different from 1 (Wald tests: p > .10 in each instance), which is
consistent with subjects self-payment increasing by $1 for each additional matrix reportedly
solved (whether that is correct or not).
As can be seen from Table 5 and Figure 4 (see also Appendix Tables A5 and A6), we
find robust evidence that, even after controlling for the number of matrices reportedly solved,
SR increases Matrix Pay by about an extra $1. Given average value of Matrix Report of about
3.91, this represents an increase of approximately 25% in average dishonest payments,
identifiable at the individual subject level. The left panel coefficient estimates derived from
Appendix Table A5 using the binary assignment SR control show robust evidence level that
sleep restriction increases the amount of payoff one takes in the Matrix task. The right and
bottom panels of Figure 4 show sensitivity analysis of the same set of models that use the
continuous Avg Nightly Sleep or Personal SD measure as the sleep control in place of the SR
indicator, respectively. While estimation precision is reduced slightly when using these
continuous sleep measures, in general, for the models estimated on compliant participants the
statistical significance remains (p < .05). For the models estimated on the full sample, statistical
significance remains at least marginal for the specifications using Avg Nightly Sleep or Personal
SD (p < .10 or better).
It is likely the case that SR assignment does not impact all subjects the same, and the
Matrix Task generate a measure of the severity of one’s dishonsesty. To investigate this further,

16
we also coded separate variables to arbitrarily separate MODERATE CHEATERS who self-
paid themselves at least $5 more than what they themselves reported, versus the MILD
CHEATERS who self-paid between $1 and $4 more than what they should have. Results of
these estimations are reported in Table 6. Here, we find that SR assignment does not impact
the probability of being a Matrix task cheater, in general. However, if one conducts separate
estimations of the SR impact on mild versus moderate cheating, we find that SR significantly
predicts moderate but not mild cheating. The far-right column of Table 6 also examines the
impact of SR on being a SUPER cheater, which we define as one who self-paid at least $10
more than what he/she reported as solved. It is clear from these estimations that our data show
support for Hypothesis 3, and somewhat support Hypothesis 4 (given the lack of SR impact on
Money Burning). These results from Table 6 estimations are robust to controlling for
demographic and sample selection using the IPW correct, but they lose significance when using
the Avg Nightly Sleep or Personal SD measure in place of the SR indicator (additional results
available on request). Taken as a whole, our data show robust evidence of increased dishonesty
in the Matrix task among SR-assigned subjects, and the effect is significant in magnitude and,
overall, robust across model specifications.
6. Discussion and conclusion
Insufficient sleep is an important concern in many modern societies. Several studies have shown
across the globe that one-third or more of adults likely do not get the recommended seven hours
or more of nightly sleep (Ford et al, 2015; Hafner et al, 2017; Hirschkowitz et al, 2015; Jones,
2013; Watson et al, 2015). According to the National Sleep Foundation, the number of
Americans who sleep fewer than six hours per night increased from 13 to 20 percent between
1999 and 2009 (NSF, 2009). Sleep research is also relevant to organizational scholars and
economists, as organizations often contribute to a growing incidence on sleep deprivation. For
instance, according to the National Institute for Occupational Safety and Health [NIOSH],
2004, the number of hours worked annually in the United States has increased steadily over the
past several decades.
Sleep deprivation may have disastrous consequences in several domains (Bonnet and
Arand,1995; Ferrara and De Gennaro, 2001) including effects on alertness (Thomas et al.,
2000), impaired decision-making capacity (Harrison and Horne, 2000), reduced occupational
safety (Barnes and Wagner, 2009), increased abusive supervision (Barnes et al, 2015), increased
workplace accidents (Barnes and Wagner, 2009; Caruso et al., 2006; Scott & Judge, 2006), and
worker well-being (NIOSH,2004). According to National Center on Sleep Disorders Research

17
(2003) sleep deprivation costs approximately $150 billion annually in terms of accidents and
lost productivity for the U.S. economy. Beyond these direct negative consequences of sleep
deprivation in term of workplace accidents and lost productivity, a few recent studies have tried
to further our understanding of how sleep deprivation affects moral choice and dishonesty (e.g.,
Barnes et al, 2011; Christian and Ellis, 2011; Barnes et al, 2015; Welsh et al, 2018).
Though the literature has suggested that insufficient sleep likely increases unethical
behavior, very little of this evidence uses direct measures or incentivized tasks in coming to
these conclusions. We help fill a void in the literature by presenting new evidence from
experimentally sleep restricted participants who completed incentivized tasks that can identify
anti-social choices, likely (though not provable) dishonesty, and individual-level identifiable
and provable dishonesty.
Our results generally support our hypotheses that sleep restriction (SR) leads to
increased dishonesty, at least in environments where other subjects are not harmed by the
dishonest behavior. The one environment (Money Burning) where antisocial choices were
measured, as opposed to dishonesty, was the one environment where SR did not affect choices.
From our particular experimental design, we are not able to identify whether this represents a
fundamental difference in anti-social versus dishonesty choice domains, or whether the harm
to other participants that would have resulted from money burning choices is the key factor in
these differences. Future research will have to address this key variable in a more systematic
way.
In most instances, but not all, we showed that our results are robust with respect to
whether we control for sleep using the binary SR assignment indicator, an objectively measured
(via actigraphy devices) Average Nightly Sleep measure, or a hybrid measure we called
Personal SD. In general, because the binary SR assignment was randomized in our design, we
have some preference for the model specifications presented in the main text that use the SR
contro. The presentation of results using alternative measures available from our methodology
is meant to help convince the reader that our key results with respect to the Coin Flip and Matrix
Tasks are fairly robust to alternative measures of the key sleep control variable.
Overall, we feel this research is an important step in our understanding of how
insufficient sleep affects specific and consequential areas of decision making. Previous
research has consistently supported the hypothesis that sleepy individuals make decisions using
less deliberative thought processes. If reduced deliberation leads to increased dishonesty in
areas where individuals feel others are not harmed (or, those harmed are at great social distance
and therefore more “abstract”), then this implies that the current state of sleep-deprived societies
18
has consequences that may extend beyond the individual and negatively impact society. This
may be particularly true under current conditions of increased virtual interactions and social
distancing due to pandemic response measures.
While relatively little research has been done in the area of sleep and ethical choice, this
paper contributes in a valuable way to document evidence linking sleep restriction to dishonest
behavior. Still, our research leaves open questions that will hopefully be addressed in the future.
If the general viewpoint is that SR promotes less deliberative and more automatic decision
processes, then our results may be taken to suggest that dishonesty is more automatic and it
takes deliberation to overcome the temptation to be dishonest. This may be the case, but the
social distance one has from the likely victim’s of dishonesty may be an important mediating
factor. It is perhaps also the case that the culture of a college student population is,
unfortunately, more desensitized towards what is considered low-consequence dishonesty such
that the real ethical dilemma only surfaces when much more is at stake. These help identify
future areas where this research may be extended to help improve our understanding of both
the decision impacts of insufficient sleep and the cognitive underpinnings of anti-social or
unethical choices.

19
REFERENCES
Abbink, K., & Herrmann, B. (2011). The moral costs of nastiness. Economic Inquiry, 49(2), 631-633.
Abbink, K., & Sadrieh, A. (2009). The pleasure of being nasty. Economics letters, 105(3), 306-308.
Balasubramanian, P., Bennett, V. M., & Pierce, L. (2017). The wages of dishonesty: The supply of cheating under high-powered incentives. Journal of Economic Behavior & Organization, 137, 428-444.
Barber, L. K., & Budnick, C. J. (2016). Sleep and unethical behavior. In Work and Sleep: Research insights for the workplace, 125-146. Editors Barling J, Barnes CM, Carleton EL, and Wagner DT: Oxford University Press
Barnes, C. M., & Wagner, D. T. (2009). Changing to daylight saving time cuts into sleep and
increases workplace injuries. Journal of Applied Psychology, 94, 1305–1317.
Barnes, C. M., & Hollenbeck, J. R. (2009). Sleep deprivation and decision-making teams:
Burning the midnight oil or playing with fire? Academy of Management Review, 34, 56–66.
Barnes, C. M., Gunia, B. C., & Wagner, D. T. (2015a). Sleep and moral awareness. Journal of Sleep Research, 24(2), 181-188
Barnes, C. M., Lucianetti, L., Bhave, D. P., & Christian, M. S. (2015b). “You wouldn’t like me when I’m sleepy”: Leaders’ sleep, daily abusive supervision, and work unit engagement. Academy of Management Journal, 58(5), 1419-1437.
Barnes, C. M., Schaubroeck, J., Huth, M., & Ghumman, S. (2011). Lack of sleep and unethical conduct. Organizational Behavior and Human Decision Processes, 115(2), 169-180.
Baumeister, R. F., Bratslavsky, E., Muraven, M., & Tice, D. M. (1998). Ego depletion: Is the active self a limited resource? Journal of Personality and Social Psychology, 74(5), 1252.
Baumeister, R. F., Muraven, M., & Tice, D. M. (2000). Ego depletion: A resource model of
volition, self-regulation, and controlled response. Social Cognition, 18, 130–150.
Bazerman, M. (2014). The power of noticing: What the best leaders see. Simon and Schuster.
Bazerman, M. H., & Tenbrunsel, A. E, (2011). Blindspots: Why we fail to do what’s right and
what to do about it. Princeton University Press
Becker, G. S. (1968). Crime and Punishment: An Economic Approach. Journal of Political Economy 76(2), 169–217.
Bereby‐Meyer, Y., Hayakawa, S., Shalvi, S., Corey, J. D., Costa, A., & Keysar, B. (2018). Honesty speaks a second language. Topics in Cognitive Science July 1.
Bereby-Meyer, Y., & Shalvi, S. (2015). Deliberate honesty. Current Opinion in Psychology, 6, 195-198.

20
Blagrove, M., Alexander, C., & Horne, J. A. (1995). The effects of chronic sleep reduction on
the performance of cognitive tasks sensitive to sleep deprivation. Applied Cognitive
Psychology, 9(1), 21-40.
Bonnet, M. H., & Arand, D. L. (1995). We are chronically sleep deprived. Sleep, 18(10), 908-911.
Bucciol, A., & Piovesan, M. (2011). Luck or cheating? A field experiment on honesty with children. Journal of Economic Psychology, 32(1), 73-78.
Caruso, C. C., Bushnell, T., Eggerth, D., Heitmann, A., et al. (2006). Long working hours, safety, and health: Toward a national research agenda. American Journal of Industrial Medicine, 49, 930–942.
Capraro, V. (2017). Does the truth come naturally? Time pressure increases honesty in one-shot deception games. Economics Letters, 158, 54-57.
Chen, K. (2003). "Sabotage in Promotion Tournaments," Journal of Law, Economics, and
Organization, 19(1), 119-139.
Christian, M. S., & Ellis, A. P. (2011). Examining the effects of sleep deprivation on workplace deviance: A self-regulatory perspective. Academy of Management Journal, 54(5), 913-93.
Coffin, B. (2003). Breaking the silence on white collar crime. Risk Management, 50(9), 8-9.
Cohn, A., Maréchal, M. A., Tannenbaum, D., & Zünd, C. L. (2019). Civic honesty around the
globe. Science, 365(6448), 70-73.
Davidson, R. J., Putnam, K. M., & Larson, C. L. (2000). Dysfunction in the neural circuitry of
emotion regulation--a possible prelude to violence. Science, 289(5479), 591-594.
Dewall, C. N., Baumeister, R. F., Stillman, T. F., & Gailliot, M. T. (2005). Violence restrained:
Effects of self-regulatory capacity and its depletion on aggressive behaviour. Journal of
Experimental Social Psychology, 43: 62–76.
Dickinson, D. L., & McElroy, T. (2019). Bayesian versus heuristic-based choice under sleep
restriction and suboptimal times of day. Games and Economic Behavior, 115, 48-59.
Dickinson, D. L., & McElroy, T. (2017). Sleep restriction and circadian effects on social
decisions. European Economic Review, 97, 57-71.
Dickinson, D. L., & Masclet, D. (2019). Using ethical dilemmas to predict anti-social choices
with real payoff consequences: An experimental study. Journal of Economic Behavior &
Organization, 166, 195–215.
Diekmann, A., Przepiorka, W., & Rauhut, H. (2015). Lifting the veil of ignorance: An
experiment on the contagiousness of norm violations. Rationality and Society, 27(3), 309-
333.

21
Dreber, A., & Johannesson, M. (2008). Gender differences in deception. Economics
Letters, 99(1), 197-199.
Durmer, J. S., & Dinges, D. F. (2005, March). Neurocognitive consequences of sleep
deprivation. Seminars in Neurology, 25, 117–129.
Elfenbein, H. A. (2007). 7 Emotion in organizations: a review and theoretical integration. Academy of Management Annals, 1(1), 315-386.
Enders, W., & Hoover, G. A. (2004). Whose line is it? Plagiarism in economics. Journal of Economic Literature, 42(2), 487–493
Evans, J. S. B. (2008). Dual-processing accounts of reasoning, judgment, and social
cognition. Annual Review of Psychology, 59, 255-278.
Ferrara, M., & De Gennaro, L. (2001). How much sleep do we need?. Sleep Medicine
Reviews, 5(2), 155-179.
Figuieres, C., Masclet, D., & Willinger, M. (2013). Weak moral motivation leads to the decline of voluntary contributions. Journal of Public Economic Theory, 15(5), 745-772.
Fischbacher, U. & Föllmi-Heusi, F. (2013). Lies in disguise—an experimental study on
cheating. Journal of the European Economic Association, 11(3), 525-547. Ford, E. S., Cunningham, T. J., & Croft, J. B. (2015). Trends in self-reported sleep duration
among US adults from 1985 to 2012. Sleep, 38(5), 829-832.
Fortin, B., G. Lacroix, G., & M.-C. Villeval (2007). Tax evasion and social interactions. Journal of Public Economics, 91(11), 2089–2112.
Fox, S., Spector, P. E., & Miles, D. (2001). Counterproductive work behavior (CWB) in response to job stressors and organizational justice: Some mediator and moderator tests for autonomy and emotions. Journal of Vocational Behavior, 59(3), 291-309.
Gailliot, M. T., Schmeichel, B. J., & Baumeister, R. F. 2006. Self-regulatory processes defend against the threat of death: Effects of self-control depletion and trait self-control on thoughts and fears of dying. Journal of Personality and Social Psychology, 91: 49–62.
Gaudine, A., & Thorne, L. (2001). Emotion and ethical decision-making in organizations. Journal of Business Ethics, 31(2), 175-187.
Giacalone, R., Riordan, C., & Rosenfeld, P. 1997. Employee sabotage: Toward a practitioner-scholar understanding. In R. Giacalone & J. Greenberg (Eds.), Antisocial behavior in organizations: 109–129. Thousand Oaks, CA: Sage.
Gino, F., Ayal, S., & Ariely, D. (2009). Contagion and differentiation in unethical behavior: The effect of one bad apple on the barrel. Psychological Science, 20(3), 393-398.
Gino, F., Schweitzer, M. E., Mead, N. L., & Ariely, D. (2011). Unable to resist temptation: How self-control depletion promotes unethical behavior. Organizational Behavior and Human Decision Processes, 115(2), 191-203.
Gneezy, U. (2005). Deception: The role of consequences. American Economic Review, 95(1), 384–394.

22
Gneezy, U., Kajackaite, A., & Sobel, J. (2018). Lying aversion and the size of the lie. American Economic Review, 108(2), 419-53.
Gneezy, U., Rockenbach, B., & Serra-Garcia, M. (2013). Measuring lying aversion. Journal of Economic Behavior & Organization, 93, 293-300.
Greenberg, J. (1990). Employee theft as a reaction to underpayment inequity: The hidden cost of pay cuts. Journal of Applied Psychology, 75(5), 561.
Hafner, M., Stepanek, M., Taylor, J., Troxel, W. M., & Van Stolk, C. (2017). Why sleep matters—the economic costs of insufficient sleep: a cross-country comparative analysis. Rand Health Quarterly, 6(4).
Harbring, C., Irlenbusch, B., Kräkel, M., & Selten, R. (2007). Sabotage in corporate contests–an experimental analysis. International Journal of the Economics of Business, 14(3), 367-392.
Harbring, C., & Irlenbusch, B. (2008). How many winners are good to have?: On tournaments with sabotage. Journal of Economic Behavior & Organization, 65(3-4), 682-702.
Harrison, Y., & Horne, J. A. (2000). The impact of sleep deprivation on decision making: a review. Journal of Experimental Psychology: Applied, 6(3), 236.
Hirshkowitz, M., Whiton, K., Albert, S. M., Alessi, C., Bruni, O., DonCarlos, L., ... & Kheirandish-Gozal, L. (2015). National Sleep Foundation’s updated sleep duration recommendations. Sleep Health, 1(4), 233-243.
Houser, D., Vetter, S., & Winter, J. (2012). Fairness and cheating. European Economic Review, 56(8), 1645-1655.
Jennings, J. R., Monk, T. H., & Van der Molen, M. W. (2003). Sleep deprivation influences
some but not all processes of supervisory attention. Psychological Science, 14, 473–479.
Jones, J. M. (2013). In US, 40% get less than recommended amount of sleep. Well Being, 19.
Kajackaite, A., & Gneezy, U. (2017). Incentives and cheating. Games and Economic Behavior, 102, 433–444.
Kebede, B., & Zizzo, D. J. (2015). Social preferences and agricultural innovation: An experimental case study from ethiopia. World Development, 67, 267–280
Kroher, M., & Wolbring, T. (2015). Social control, social learning, and cheating: Evidence from lab and online experiments on dishonesty. Social Science Research, 53, 311-324.
Killgore, W. D., Killgore, D. B., Day, L. M., Li, C., Kamimori, G. H., & Balkin, T. J. (2007). The effects of 53 hours of sleep deprivation on moral judgment. Sleep, 30(3), 345-352.
Kish-Gephart, J. J., Harrison, D. A., & Trevino, L. K. (2010). Bad apples, bad cases, and bad barrels: Meta-analytic evidence about sources of unethical decisions atwork. Journal of Applied Psychology, 95, 1–31
Köbis, N. C., Verschuere, B., Bereby-Meyer, Y., Rand, D., & Shalvi, S. (2019). Intuitive honesty versus dishonesty: Meta-analytic evidence. Perspectives on Psychological Science, 14(5), 778-796.
23
Kouchaki, M., & Smith, I. H. (2014). The morning morality effect: The influence of time of day on unethical behavior. Psychological Science, 25(1), 95-102.
Lazear, E. (1989). Pay equality and industrial politics. Journal of Political Economy, 97(3), 561-580.
Leith, K. P., & Baumeister, R. F. (1996). Why do bad moods increase self-defeating behavior? Emotion, risk tasking, and self-regulation. Journal of Personality and Social Psychology, 71(6), 1250.
List, J. A., Bailey, C. D., Euzent, P. J., & Martin, T. L. (2001). Academic economists behaving badly? A survey on three areas of unethical behavior. Economic Inquiry, 39(1), 162-170.
Lu, J. G., Lee, J. J., Gino, F., & Galinsky, A. D. (2018). Polluted morality: Air pollution predicts criminal activity and unethical behavior. Psychological Science, 29(3), 340-355.
Masclet, D. & Dickinson, D. L. (2019). Incorporating conditional morality into economic decisions. IZA Discussion Paper No. 12872
Mazar, N., Amir, O., & Ariely, D. (2008). The Dishonesty of Honest People: A Theory of Self-
Concept Maintenance. Journal of Marketing Research, 45, 633–644.
McElroy, T., & Dickinson, D. L. (2019). Thinking about complex decisions: How sleep and time-of-day influence complex choices. Consciousness and Cognition, 76, 102824.
McElroy, T., Dickinson, D. L., & Levin, I. P. (2020). Thinking about decisions: An integrative approach of person and task factors. Journal of Behavioral Decision Making, 33(4), 538-555.
McKenna, B. S., Dickinson, D. L., Orff, H. J., & Drummond, S. P. 2007. The effects of one night of sleep deprivation on known-risk and ambiguous-risk decisions. Journal of Sleep Research, 16: 245–252.
Mead, N. L., Baumeister, R. F., Gino, F., Schweitzer, M. E., & Ariely, D. (2009). Too tired to tell the truth: Self-control resource depletion and dishonesty. Journal of Experimental Social Psychology, 45(3), 594-597.
Miller, E. K. (2000). The prefontral cortex and cognitive control. Nature Reviews Neuroscience, 1(1), 59-65.
Murphy, K. R. (1993). Honesty in the workplace. Thomson Brooks/Cole Publishing Co.
Muraven, M., & Baumeister, R. F. (2000). Self-regulation and depletion of limited resources: Does self-control resemble a muscle? Psychological Bulletin, 126, 247–259.
National Sleep Foundation (2005). Sleep in America poll. Washington, DC: National Sleep Foundation.
Nilsson, J. P., Soderstrom, M., Karlsson, A. U., Lekander, M., Akerstedt, T., Lindroth, N.E., et al. (2005). Less effective executive functioning after one night’s sleep deprivation. Journal of Sleep Research, 14, 1–6.

24
Pilcher, J. J., & Huffcutt, A. I. (1996). Effects of sleep deprivation on performance: A meta-analysis. Sleep, 19, 318–326.
Pittarello, A., Leib, M., Gordon-Hecker, T., & Shalvi, S. (2015). Justifications shape ethical blind spots. Psychological Science, 26(6), 794-804.
Prediger, S., Vollan, B., & Herrmann, B. (2014). Resource scarcity and antisocial behavior. Journal of Public Economics, 119, 1–9.
Rand, D. G., Peysakhovich, A., Kraft-Todd, G. T., Newman, G. E., Wurzbacher, O., Nowak, M. A., & Greene, J. D. (2014). Social heuristics shape intuitive cooperation. Nature Communications, 5, 3677.
Rauhut, H. (2013). Beliefs about lying and spreading of dishonesty: Undetected lies and their constructive and destructive social dynamics in dice experiments. PloS One, 8(11), e77878.
Reynolds, B., & Schiffbauer, R. (2004). Measuring state changes in human delay discounting: an experiential discounting task. Behavioural Processes, 67(3), 343-356.
Robinson, S. L., & Bennett, R. J. (1995). A typology of deviant workplace behaviors: A multidimensional scaling study. Academy of Management Journal, 38(2), 555-572.
Schwieren, C., & Weichselbaumer, D. (2010). Does competition enhance performance or cheating? A laboratory experiment. Journal of Economic Psychology, 31(3), 241-253.
Scott, B. A., & Judge, T. A. (2006). Insomnia, emotions, and job satisfaction: A multilevel study. Journal of Management, 32, 622–645
Steers, R., & Rhodes, S. (1984). Knowledge and speculation about absenteeism. In P. Goodman & R. Atkin (Eds.), Absenteeism, vol. 1: 229–275. San Francisco: Jossey-Bass.
Sutter, M. (2008). Deception through telling the truth?! experimental evidence from individuals and teams. The Economic Journal 119(534), 47–60.
Thomas, M., Sing, H., Belenky, G., Holcomb, H., Mayberg, H., Dannals, R., ... & Redmond, D. (2000). Neural basis of alertness and cognitive performance impairments during sleepiness. I. Effects of 24 h of sleep deprivation on waking human regional brain activity. Journal of Sleep Research, 9(4), 335-352.
Usmani, S., Kalpina, K., & Husain, J. (2013). Sleep Deprivation and workplace deviance: a mediation approach. Journal of Business and Management, 13(2), 50-63.
Venkatraman, V., Huettel, S. A., Chuah, L. Y., Payne, J. W., & Chee, M. W. (2011). Sleep deprivation biases the neural mechanisms underlying economic preferences. Journal of Neuroscience, 31(10), 3712-3718.
Venkatraman, V., Chuah, Y. L., Huettel, S. A., & Chee, M. W. (2007). Sleep deprivation elevates expectation of gains and attenuates response to losses following risky decisions. Sleep, 30(5), 603-609.
Wagner, D. T., Barnes, C. M., Lim, V. K., & Ferris, D. L. (2012). Lost sleep and cyberloafing: Evidence from the laboratory and a daylight saving time quasi-experiment. Journal of Applied Psychology, 97(5), 1068.

25
Watson, N. F., Badr, M. S., Belenky, G., Bliwise, D. L., Buxton, O. M., ... & Heald, J. L. (2015). Joint consensus statement of the American Academy of Sleep Medicine and Sleep Research Society on the recommended amount of sleep for a healthy adult: methodology and discussion. Sleep, 38(8), 1161-1183.
Welsh, D. T., Ellis, A. P., Christian, M. S., & Mai, K. M. (2014). Building a self-regulatory model of sleep deprivation and deception: The role of caffeine and social influence. Journal of Applied Psychology, 99(6), 1268.
Welsh, D. T., Mai, K. M., Ellis, A. P., & Christian, M. S. (2018). Overcoming the effects of sleep deprivation on unethical behavior: An extension of integrated self-control theory. Journal of Experimental Social Psychology, 76, 142-154
Zhang, J., Brown, E., & Xie, H. (2020). Effect of religious priming in prosocial and destructive behaviour. Pacific Economic Review, 25(1), 47-68.
Zizzo, D. J., & Oswald, A. J. (2001). Are people willing to pay to reduce others' incomes?. Annales d'Economie et de Statistique, 39-65.
Zizzo, D. J. (2004). Inequality and procedural fairness in a money-burning and stealing
experiment. Emerald Group Publishing Limited. Zizzo, D. J. (2010). Experimenter demand effects in economic experiments. Experimental
Economics, 13(1), 75-98.
Zohar, D., Tzischinsky, O., Epstein, R., & Lavie, P. (2005). The effects of sleep loss on medical residents' emotional reactions to work events: a cognitive-energy model. Sleep, 28(1), 47-54.

26
FIGURE 1: The Matrix Game task
2.10 1.97 4.27 5.76 8.31 8.09
7.22 3.80 0.99 6.41 6.89 9.45
5.74 4.13 3.75 7.43 1.26 5.47
1.52 6.32 3.56 3.59 5.79 4.40
Got it
Got it
Notes : Example of 2 of the matrix task items. Participants were asked to find and circle two cells in the matrix whose numbers summed to exactly 10.00. The matrix on the left has no solution, while the matrix on the right has a solution. Out of the total of 15 matrices given (all at once on a sheet of paper, such that participants could work on matrices in any order), 11 of them had solutions.
FIGURE 2: Nightly sleep levels by treatment
0.0
05.0
1.0
15.0
2Ke
rnel
den
sity
of T
otal
Sle
ep T
ime
200 300 400 500 600min sleep/night (actigraphy measured)
Sleep Restricted (n=105) Well Rested (n=130)
Nightly Sleep (by treatment assignment)
SR: 327.67 ± 39.85 hrs/night
WR: 434.89 ± 41.57 hrs/night

27
FIGURE 3: HEADS outcomes (sensitivity analysis)
Notes: Thick (thin) lines represent the 90% (95%) confidence intervals for the 1-tailed test of the ex ante hypothesis. IPW (inverse probability weight) regression correction for dropout (attrition) from recruitment to final sample (i.e., completing the protocol). These weights are derived from selection equation using sample of all participants recruited into the study (using demographics and sleep characteristics from the online screening response database, along with treatment assignment, to predict likelihood of being in the final sample).
-1 -.5 0 .5 1 1.5 -.01 -.005 0 .005
-.006 -.003 0 .003 .006
SRTotal Nightly Sleep Time(Actigraphy measured)
Personal SleepDeprivation
Binary ControlsControls+IPW correction Binary (compliant)Controls (compliant) Controls+IPW correction (compliant)
Sleep Impact on HEADS reported

28
FIGURE 4: Matrix reports (sensitivity analysis)
Notes: Thick (thin) lines represent the 90% (95%) confidence intervals for the 1-tailed test of the ex ante hypothesis. IPW (inverse probability weight) regression correction for dropout (attrition) from recruitment to final sample (i.e., completing the protocol). These weights are derived from selection equation using sample of all participants recruited into the study (using demographics and sleep characteristics from the online screening response database, along with treatment assignment, to predict likelihood of being in the final sample).
A
AA
AAA
A
AA
AAA
-1 0 1 2 -.015 -.01 -.005 0 .005
-.005 0 .005 .01
SRTotal Nightly Sleep Time(Actigraphy measured)
Personal SleepDeprivation
Binary ControlsControls+IPW correction Binary (compliant)Controls (compliant) Controls+IPW correction (compliant)
Sleep Impact on Matrix Reports

29
TABLE 1: Protocol validity tests
Nightly Sleep Time
Perceived Treatment
Effect
Session 1 Measure
(before treatment week)
Session 2 Measure
(after treatment week) Measure
Karolinska Sleepiness
Irritability
Alertness
Karolinska Sleepiness
Irritability
Alertness
SR-WR difference (Z-stat)
12.699
11.993
1.211
0.212
0.103
10.299
6.740
9.043
p-value < .001 < .001 = .226 = .832 = .918 < .001 < .001 < .001 Note: Test are non-parametric Mann Whitney tests of medians. Session 2 measures reported are at the beginning of Session 2. Sleepiness and mood ratings were also assessed at the end of Session 2. Statistically significant difference in Sleepiness, irritability, and alertness between SR and WR groups remain at the end of Session 2, though the effect sizes are reduced.
TABLE 2: Money Burning task decision sheet Please make your decision as Player A for each of the following scenarios: S1-S9
(recall, one of these will be randomly selected for real payoff) Payoffs are listed at ( Player A payoff , Player B payoff ) You are randomly assigned to counterpart and role only after decisions are made
Which Distribution do you choose?
Scenario
Start Distribution
Damage (to Player B payoff)
Burning Costs (paid by Player A)
End Distribution
Circle your choice (for each Scenario)
S1 ( 500 , 100 ) 100 20 ( 480 , 0 ) Start End S2 ( 400 , 100 ) 100 20 ( 380 , 0 ) Start End S3 ( 300 , 100 ) 100 20 ( 280 , 0 ) Start End S4 ( 200 , 100 ) 100 20 ( 180 , 0 ) Start End S5 ( 100 , 100 ) 100 20 ( 80 , 0 ) Start End S6 ( 100 , 200 ) 100 20 ( 80 , 100 ) Start End S7 ( 100 , 300 ) 100 20 ( 80 , 200 ) Start End S8 ( 100 , 400 ) 100 20 ( 80 , 300 ) Start End S9 ( 100 , 500 ) 100 20 ( 80 , 400 ) Start End

30
TABLE 4: Probability of Burning Money Marginal Effect (SE) displayed
Independent Variable
All Subjects Compliant Subjects
Income ≤ Other’s
Income ≥ Other’s
Income ≤ Other’s
Income ≥ Other’s
|Diff Income| 0.0001 (0.0001)
0.0001 (0.0001)
0.0001 (0.0001)
0.0001 (0.0002)
Equal Income (x = y) -0.189 (0.026)***
-0.043 (0.037)
-0.191 (0.027)***
-0.048 (0.034)
Relative Cost (of burning) ---
0.554 (0.7629)
--- 0.649 (0.843)
SR 0.042 (0.037)
-0.013 (0.019)
0.056 (0.037)
-0.001 (0.019)
Epworth 0.009 (0.005)*
-0.003 (0.002)
0.007 (0.005)
-0.002 (0.002)
Age 0.006 (0.006)
-0.002 (0.003)
0.009 (0.006)
0.0004 (0.002)
Female 0.039 (0.037)
0.019 (0.019)
0.038 (0.038)
0.025 (0.018)
Minority 0.060 (0.043)
0.037 (0.024)*
-.072 (0.045)*
0.023 (0.023)
Observations 1155 1155 1015 1015 # subjects 231 231 203 203
Log Pseudo-Likelihood -529.23 -205.34 -456.96 -167.07 Notes: *.10, **.05, ***.01 for the 1-tailed test on the hypothesized sleep effect (other tests are 2-tailed). Standard Errors clustered at the individual subject level. The null result (lack of support for Hypotheses 1a and 1b) is unchanged if using alternative sleep measure controls of Avg Nightly Sleep or Personal SD (results available on request).

31
TABLE 4: Coin Flip task regressions—Binary SR indicator (see Figure 3 coefficient plots) Dependent Variable = # Reported Heads flipped (out of 15)
Independent
Variable
All Subjects Compliant-Only Subjects (1)
Coef (SE) (2)
Coef (SE) (3)
Coef (SE) (4)
Coef (SE) (5)
Coef (SE) (6)
Coef (SE) Constant 8.804
(0.225)*** 10.981
(1.234)*** 11.179
(1.039)*** 8.622
(0.248)*** 10.745
(1.300)*** 10.971
(1.087)***
SR 0.718 (0.332)**
0.706 (0.325)**
0.640 (.329)**
0.854 (0.357)***
0.781 (0.354)**
0.716 (0.356)**
Epworth --- 0.042 (0.046)
0.045 (.050)
--- 0.032 (0.049)
0.037 (0.053)
Age --- -0.099 (0.058)*
-0.112 (.045)**
--- -0.092 (0.060)
-0.107 (0.045)**
Female --- -1.147 (0.335)***
-1.092 (.354)
--- -1.029 (0.369)***
-0.971 (0.399)**
Minority --- 0.465 (0.383)
0.457 (.409)
--- 0.371 (0.414)
0.356 (0.442)
IPW correction for sample selection
No
No
Yes
No
No
Yes
Observations 197 197 193 174 174 170 R-squared .023 .093 .091 .032 .086 .083
Notes: *.10, **.05, ***.01 for the 1-tailed test on the hypothesized sleep effect (other tests are 2-tailed). Sample size reduced by those who chose not to complete this additional (voluntary) online task for extra compensation. Robust standard efforts shown for models using the inverse-probability weight (IPW) correction for selection. These IPW-correction models have sample size reduced by 4 observations in models (3) and (6) due to uncertainties regarding inclusion of these participants in the selection equation estimation missing data on selection equation regressors (e.g., one withdrew at less than 24 hers from completion due to military orders, another preferred to withdraw but was asked to continue so that we would have an even number of participants for a paired task not reported here).

32
TABLE 5: Matrix Task regressions—Binary SR Indicator See Figure 4 coefficient plots Dependent Variable = Matrix Pay (= $ amount self-paid in the matrix task)
Independent
Variable
All Subjects Compliant-Only Subjects (1)
Coef (SE) (2)
Coef (SE) (3)
Coef (SE) (4)
Coef (SE) (5)
Coef (SE) (6)
Coef (SE) Constant 1.304
(0.407)*** 3.567
(1.770)** 3.673
(1.251)*** 1.248
(0.44)*** 3.547
(1.893)* 3.685
(1.345)***
Matrix Report 0.914 (0.071)***
0.901 (0.073)***
0.895 (0.068)***
0.931 (0.075)***
0.918 (0.077)***
0.907 (0.069)***
SR 1.014 (0.442)**
0.964 (0.446)**
0.973 (0.441)**
0.976 (0.476)**
0.917 (0.483)**
0.964 (0.474)**
Epworth --- 0.026 (0.062)
0.016 (0.073)
--- 0.015 (0.066)
0.005 (0.077)
Age --- -0.112 (0.078)
-0.114 (0.037)***
--- -0.110 (0.083)
-0.114 (0.039)***
Female --- -0.298 (0.461)
-0.206 (.500)
--- -0.249 (0.503)
-0.140 (0.548)
Minority --- -0.177 (0.540)
-0.270 (0.481)
--- -0.179 (0.576)
-0.286 (0.519)
IPW correction for sample selection
No
No
Yes
No
No
Yes
Observations 233 233 233 204 204 204 R-squared .427 .433 .421 .441 .447 .431
Notes: *.10, **.05, ***.01 for the 1-tailed test on the hypothesized sleep effect (other tests are 2-tailed). Matrix Report measures the number of matrices the subject reported correctly completing. Two subjects failed to complete the matrix task though we had complete sleep data on the participant. Robust standard efforts shown for models using the inverse-probability weight (IPW) correction for selection.

33
TABLE 6: Probability of Matrix task dishonesty Dependent Variable = Indicator variable of various levels of dishonest
Dep Var
Independent Variable
Cheat=1 if Over-pay > 0
(1)
Mild-Cheat=1 if 0 < Over-pay < $5
(2)
Moderate-Cheat=1 if Over-pay > $5
(3)
Super-Cheat=1 if Over-pay > $10
(4)
SR 0.064 (0.056)
-0.014 (0.043)
0.078 (0.043)**
0.059 (0.034)**
Observations 233 233 233 233 Log Likelihood -126.679 -87.490 -79.736 -54.013
Notes: *.10, **.05, ***.01 for the 1-tailed test on the hypothesized sleep effect (other tests are 2-tailed). Marginal Effects (st. error) displayed. As defined, there are 55 (of 233) Cheat=1 subjects, 29 Mild-Cheat=1, 26 Moderate-Cheat=1, and 15 Super-Cheat=1 subjects. Results are similar (sign and significance of coefficient on SR indicator) if adding controls, estimating a linear probability model version, or using the IPW correction with a weighted linear probability regression (all available on request).

34
APPENDIX A: Additional estimation details
TABLE A1: Sample Selection and Attrition Analysis (used for IPW estimations)
Probit Estimation
Variable
Dep Var = Finished Protocol (=1)
(Conditional on being recruited)
Coefficient (SE) SR (=1) -.568 (.192)***
Female (=1) -.156 (.203) Minority (=1) .096 (.248)
Age -.047 (.030) Optimal Sleep -.117 (.095) Anxiety Risk -.035 (.039)
Depression Risk .138 (.131) Epworth .062 (.030)**
Reduced-MEQ .039 (.031) Observations N=279
Log Likelihood -115.01616 Notes: Full recruited sample of n=279 participants, n=258 started the protocol (i.e., showed up for Session 1) and n=237 finished the protocol (a small number lacked complete sleep data or failed to complete a task, as reflected in sample sizes for individual tasks). *p<.10, **p<.05, ***p<.01 for the 2-tailed test. Predicted likelihood of protocol completion for each participant used to determine weights for selection correction based on inverse probability weighting (IPW) in individual outcomes analysis.
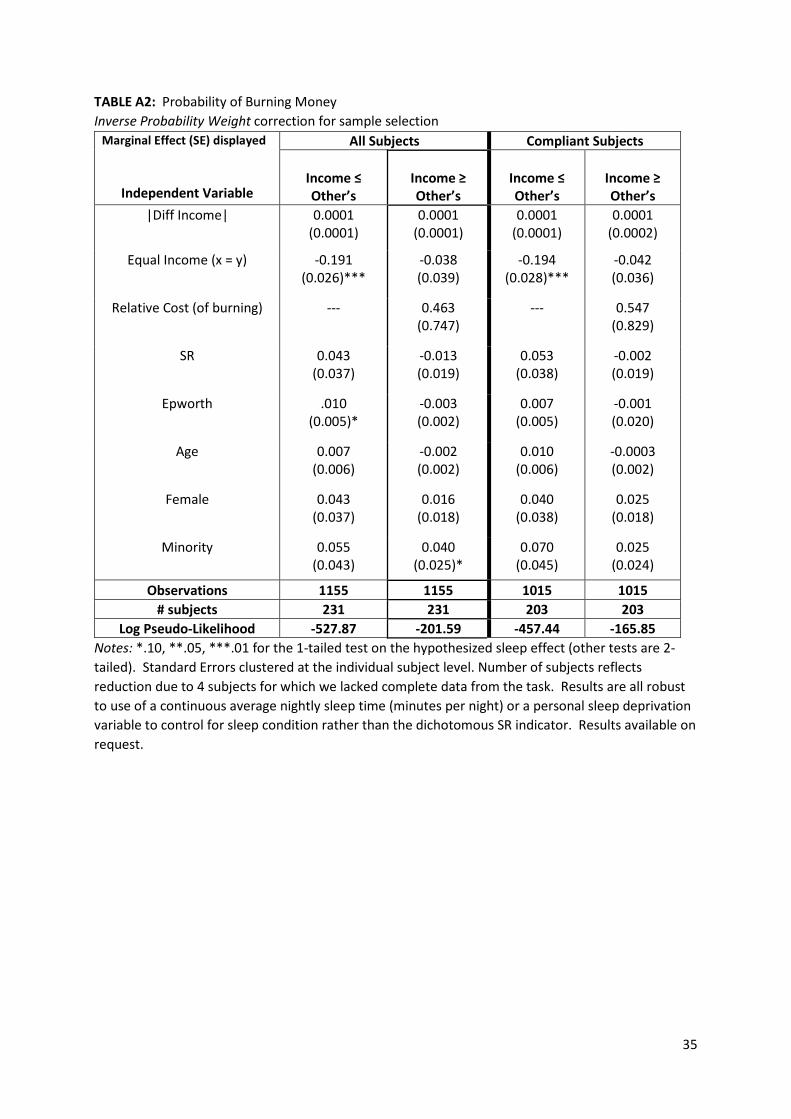
35
TABLE A2: Probability of Burning Money Inverse Probability Weight correction for sample selection
Marginal Effect (SE) displayed
Independent Variable
All Subjects Compliant Subjects
Income ≤ Other’s
Income ≥ Other’s
Income ≤ Other’s
Income ≥ Other’s
|Diff Income| 0.0001 (0.0001)
0.0001 (0.0001)
0.0001 (0.0001)
0.0001 (0.0002)
Equal Income (x = y) -0.191 (0.026)***
-0.038 (0.039)
-0.194 (0.028)***
-0.042 (0.036)
Relative Cost (of burning) --- 0.463 (0.747)
--- 0.547 (0.829)
SR 0.043 (0.037)
-0.013 (0.019)
0.053 (0.038)
-0.002 (0.019)
Epworth .010 (0.005)*
-0.003 (0.002)
0.007 (0.005)
-0.001 (0.020)
Age 0.007 (0.006)
-0.002 (0.002)
0.010 (0.006)
-0.0003 (0.002)
Female 0.043 (0.037)
0.016 (0.018)
0.040 (0.038)
0.025 (0.018)
Minority 0.055 (0.043)
0.040 (0.025)*
0.070 (0.045)
0.025 (0.024)
Observations 1155 1155 1015 1015 # subjects 231 231 203 203
Log Pseudo-Likelihood -527.87 -201.59 -457.44 -165.85 Notes: *.10, **.05, ***.01 for the 1-tailed test on the hypothesized sleep effect (other tests are 2-tailed). Standard Errors clustered at the individual subject level. Number of subjects reflects reduction due to 4 subjects for which we lacked complete data from the task. Results are all robust to use of a continuous average nightly sleep time (minutes per night) or a personal sleep deprivation variable to control for sleep condition rather than the dichotomous SR indicator. Results available on request.

36
TABLE A3: Coin Flip task regressions—Continuous Aveage Nightly Sleep Time measure see Figure 3 coefficient plots Dependent Variable = # Reported Heads flipped (out of 15)
Independent
Variable
All Subjects Compliant-Only Subjects (1)
Coef (SE) (2)
Coef (SE) (3)
Coef (SE) (4)
Coef (SE) (5)
Coef (SE) (6)
Coef (SE) Constant 11.166
(0.967)*** 13.039
(1.521)*** 13.012
(1.465)*** 11.401
(1.002)*** 13.268
(1.585)*** 13.247
(1.517)***
Avg Sleep Time (min/night)
-0.005 (0.002)**
-0.004 (0.002)**
-0.004 (0.003)*
-0.006 (0.003)***
-0.005 (0.003)**
-0.005 (0.003)**
Epworth --- 0.040 (0.046)
0.044 (0.051)
--- 0.031 (0.049)
0.036 (0.053)
Age --- -0.100 (0.058)*
-0.112 (0.046)**
--- -0.095 (0.060)
-0.108 (0.047)**
Female --- -1.098 (0.338)***
-1.040 (0.361)***
--- -1.007 (0.371)***
-0.040 (0.405)**
Minority --- 0.411 (0.384)
0.401 (0.412)
--- 0.031 (0.049)
0.298 (0.053)
IPW correction for sample selection
No
No
Yes
No
No
Yes
Observations 196 196 192 173 173 169 R-squared .023 .086 .085 .032 .084 .082
Notes: *.10, **.05, ***.01 for the 1-tailed test on the hypothesized sleep effect (other tests are 2-tailed). Sample size reduced by those who chose not to complete this additional (voluntary) online task for extra compensation and one additional participant with corrupted actigraphy data. Robust standard efforts shown for models using the inverse-probability weight (IPW) correction for selection. These IPW-correction models have sample size reduced by 4 observations in models (3) and (6) due to uncertainties regarding inclusion of these participants in the selection equation estimation missing data on selection equation regressors (e.g., one withdrew at less than 24 hrs from completion due to military orders, another preferred to withdraw but was asked to continue so that we would have an even number of participants for a paired task not reported here).

37
TABLE A4: Coin Flip task regressions—Continuous Personal Sleep Deprivation measure see Figure 3 coefficient plots Dependent Variable = # Reported Heads flipped (out of 15)
Independent
Variable
All Subjects Compliant-Only Subjects (1)
Coef (SE) (2)
Coef (SE) (3)
Coef (SE) (4)
Coef (SE) (5)
Coef (SE) (6)
Coef (SE) Constant 8.978
(0.259)*** 11.740
(1.308)*** 11.451
(1.071)*** 8.802
(0.277)*** 11.573
(1.370)*** 11.274
(1.130)***
Personal SD (min/night)
.002 (0.002)
.002 (.002)
.001 (.002)
.003 (.002)
.003 (.002)
.002 (.002)
Epworth --- .036 (0.047)
.043 (0.051)
--- .028 (0.050)
.036 (0.054)
Age --- -0.127 (0.062)**
-.116 (0.046)**
--- -.125 (0.064)*
-.113 (0.047)**
Female --- -1.129 (0.344)***
-1.082 (0.360)***
--- -1.050 (0.379)***
-1.002 (0.406)**
Minority --- .430 (0.401)
.432 (0.3413)
--- .349 (0.435)
.353 (0.447)
IPW correction for sample selection
No
No
Yes
No
No
Yes
Observations 192 192 192 174 174 170 R-squared .0037 .0765 .0739 .0080 .0704 .0665
Notes: *.10, **.05, ***.01 for the 1-tailed test on the hypothesized sleep effect (other tests are 2-tailed). Sample size reduced by those who chose not to complete this additional (voluntary) online task for extra compensation, 1 participant whose actigraphy data were corrupted, and 4 participants for whom we did not have the self-perceived sleep need measure (needed to construction the Personal SD variable—these participants were also those dropped from the IPW estimations when using the SR indicator or Avg Sleep Time measure). Robust standard efforts shown for models using the inverse-probability weight (IPW) correction for selection.

38
TABLE A5: Matrix Task regressions— Continuous Average Nightly Sleep Time measure See Figure 4 coefficient plots Dependent Variable = Matrix Pay (= $ amount self-paid in the matrix task)
Independent
Variable
All Subjects Compliant-Only Subjects (1)
Coef (SE) (2)
Coef (SE) (3)
Coef (SE) (4)
Coef (SE) (5)
Coef (SE) (6)
Coef (SE) Constant 3.638
(1.331)*** 5.725
(2.107)*** 6.020
(2.240)*** 4.243
(1.389)*** 6.393
(2.223)*** 6.672
(2.369)***
Matrix Report 0.915 (0.071)***
0.904 (0.073)***
0.897 (0.079)***
0.925 (0.075)***
0.913 (0.077)***
0.902 (0.070)***
Avg Sleep Time (min/night)
-0.005 (0.003)*
-0.004 (0.003)*
-0.005 (0.004)*
-0.006 (0.003)**
-0.006 (0.003)**
-0.006 (0.004)**
Epworth --- 0.026 (0.062)
0.015 (0.074)
--- 0.011 (0.066)
0.001 (0.078)
Age --- -0.115 (0.078)
-0.115 (0.037)***
--- -0.111 (0.083)
-0.113 (0.039)***
Female --- -0.260 (0.469)
-0.141 (0.520)
--- -0.220 (0.506)
-0.106 (0.548)
Minority --- -0.235 (0.541)
-0.342 (0.492)
--- -0.246 (0.576)
-0.363 (0.534)
IPW correction for sample selection
No
No
Yes
No
No
Yes
Observations 232 232 232 204 204 204 R-squared .423 .430 .418 .439 .445 .430
Notes: *.10, **.05, ***.01 for the 1-tailed test on the hypothesized sleep effect (other tests are 2-tailed). Matrix Report measures the number of matrices the subject reported correctly completing. Two subjects failed to complete the matrix task though we had complete sleep data on the participant. One participant completing the task had corrupted sleep watch data and had missing Total Sleep Time data (but could still be used for estimation based on binary SR assignment. Robust standard efforts shown for models using the inverse-probability weight (IPW) correction for selection.

39
TABLE A6: Matrix Task regressions— Continuous Personal Sleep Deprivation measure See Figure 4 coefficient plots Dependent Variable = Matrix Pay (= $ amount self-paid in the matrix task)
Independent
Variable
All Subjects Compliant-Only Subjects (1)
Coef (SE) (2)
Coef (SE) (3)
Coef (SE) (4)
Coef (SE) (5)
Coef (SE) (6)
Coef (SE) Constant 1.251
(0.434)*** 3.519
(1.791)* 3.607
(1.283)*** 1.201
(0.459)*** 3.522
(1.904)* 3.673
(1.369)***
Matrix Report 0.918 (0.071)***
.906 (0.073)***
.899 (0.069)***
.929 (0.075)***
.916 (0.077)***
.905 (0.069)***
Personal SD (min/night)
.005 (.003)**
.004 (.002)**
.005 (.003)*
.005 (0.003)**
.005 (0.003)**
.005 (.003)**
Epworth --- .023 (0.062)
.012 (0.075)
--- .011 (0.066)
.001 (0.078)
Age --- -.111 (0.078)
-.112 (0.036)***
--- -.111 (0.083)
-.114 (.039)***
Female --- -272 (0.465)
-.166 (0.507)
--- -.244 (.504)
-.138 (0.541)
Minority --- -.115 (0.545)
-.218 (0.472)
--- -.093 (0.583)
-.209 (0.510)
IPW correction for sample selection
No
No
Yes
No
No
Yes
Observations 232 232 232 204 204 204 R-squared .4263 .4325 .4201 .4398 .4454 .4293
Notes: *.10, **.05, ***.01 for the 1-tailed test on the hypothesized sleep effect (other tests are 2-tailed). Matrix Report measures the number of matrices the subject reported correctly completing. Two subjects failed to complete the matrix task though we had complete sleep data on the participant. One participant completing the task had corrupted sleep watch data and had missing Total Sleep Time data such that the Personal SD variable could not be constructed (but could still be used for estimation based on binary SR assignment. Robust standard efforts shown for models using the inverse-probability weight (IPW) correction for selection.

40
Appendix B : Experiment Instructions
THE MONEY BURNING TASK:
Instructions
In this task you will be randomly assigned with another subject in the room today. Your counterpart will remain anonymous to you and you will remain anonymous to your counterpart. There are two roles in this task: Player A and Player B. There are also several decision scenarios (S1-S9) where you are asked to make a decision, as seen in the table below. For each of these 9 scenarios, you are asked to choose between either the “Start Distribution” of payoffs or the “End Distribution” of payoffs. Payoffs (in cents) are listed in parenthesis, and the payoff amount you would receive is listed first, while the payoff listed second would be the payoff received by your counterpart for that distribution of payoffs. For example, if you choose a payoff distribution of ( Y , Z ), then your payoff would be Y cents, and your counterpart would be Z cents. The difference between the “Start Distribution” and the “End Distribution” is that the “End Distribution” subtracts 100 cents off of Player B’s payoff, and 20 cents off of Player A’s payoff. So, if you choose the “End Distribution” in a particular decision scenario, then you as Player A are choosing to “burn” 100 cents of the counterpart’s payoff (i.e., the “damage”) at a cost to you (Player A) of 20 cents (i.e., the “burning costs”). It is completely up to you as Player A to choose the “Start” or “End” Distribution for none, some, or all of the decision scenarios shown below.
You will notice that the counterpart has no decision to make in this task and is simply a passive recipient of your decision. However, all subjects in the room today will make decisions as if he/she may be assigned as Player A. Only after all decisions are made will we randomly match you with a counterpart, then we will randomly assign one of you as Player A (the other is Player B), and we will also then randomly select one of the nine scenarios, S1-S9, to count for both you and your counterpart’s payoff in this task. In other words, every subject is equally likely to be a Player A or a Player B in this task, and you will not know your assigned role until all decisions are made. Therefore, you should carefully make your decisions as Player A as if each one may be the one that determines your payoff (because it might!), but it is also possible that you will be assigned as the Player B in your pair such that your payoff will be determined by your counterpart’s decision for the randomly selected payoff scenario. Remember, you will not know your assignment as Player A or B until after all decisions are made and after a single payoff Scenario is randomly drawn. Also remember that neither you or your counterpart will know of the other’s decision before you must make your own decision, and you will never know the identity of your randomly matched counterpart (and vice versa).
Do you have any questions before you start?

41
NOTE: These payoffs are in “cents” (not “tokens”). So, 100 cents=$1.00 payoff, for example.
Please make your decision as Player A for each of the following scenarios: S1-S9 (recall, one of these will be randomly selected for real payoff)
Payoffs are listed at ( Player A payoff , Player B payoff ) You are randomly assigned to counterpart and role only after decisions are made
Which Distribution do you choose?
Scenario
Start Distribution
Damage (to Player B payoff)
Burning Costs (paid by Player A)
End Distribution
Circle your choice (for each Scenario)
S1 ( 500 , 100 ) 100 20 ( 480 , 0 ) Start End S2 ( 400 , 100 ) 100 20 ( 380 , 0 ) Start End S3 ( 300 , 100 ) 100 20 ( 280 , 0 ) Start End S4 ( 200 , 100 ) 100 20 ( 180 , 0 ) Start End S5 ( 100 , 100 ) 100 20 ( 80 , 0 ) Start End S6 ( 100 , 200 ) 100 20 ( 80 , 100 ) Start End S7 ( 100 , 300 ) 100 20 ( 80 , 200 ) Start End S8 ( 100 , 400 ) 100 20 ( 80 , 300 ) Start End S9 ( 100 , 500 ) 100 20 ( 80 , 400 ) Start End
THE COIN FLIP TASK :
(highlights shown were included in survey text)
This question offers you the chance for additional compensation, so please read carefully. Please find a coin (any coin with Heads and Tails sides to it). Flip the coin 15 times and record the number of HEADS you flip. Please only perform the 15 coin flips once. Your payoff for this task will be $0.25 (i.e., 25 cents) for each HEADS outcome from these coin flips, and this payment will be added to your Amazon gift code compensation for this survey. For example, if you flip HEADS 3 times, your additional compensation (on top of the flat $5 for completing the survey) will be another $.75. Similarly, if you flip HEADS 6 times you will receive an additional $1.50, if you flip HEADS 11 times you will receive an additional $2.75, etc. Please tell us below how many times you flipped HEADS out of the 15 coin flips, and we will add 25 cents for each HEADs flipped to your survey payoff when you receive your Amazon gift code.
0 1 2 3 4 5 6 7 8 9 10 11 12 13 14 15 Number of HEADS outcomes
from flipping coin 15 times

42
THE MATRIX TASK:
INSTRUCTIONS:
Thank you for agreeing to take part in this experiment. Please read along as the instructions are read aloud. A clear understanding of the instructions will help you make better decisions and increase your earnings. Your earnings will be determined only by your own decisions in this task. Do not communicate with the other participants. If you have any questions, please ask us. Although there are many people participating in today’s experiment, everyone is working independently. This means that your earnings in this task are based entirely on your decisions and what others decide has no effect on you.
All decisions that you make today are recorded only by an anonymous subject number (not your sleep study code) and will only be used for research purposes. Your decisions will remain completely anonymous.
Please read the following instructions on the task specifics before we start. In the large envelope at your station, you will find a sheet with 15 matrices like the one below (front and back side of sheet). Do not open the envelope until we start the experiment. Example
3.91 0.82 3.75 1.11 1.69 7.94 3.28 2.52 6.25 9.81 6.09 2.46
In each matrix, you should look for a unique pair of numbers that sum up exactly to 10. In some matrices there may not be a solution. When you find a pair, circle the numbers, and mark the corresponding “Got It” box, as in the following example: Example
3.91 0.82 3.75 1.11 1.69 7.94 3.28 2.52 6.25 9.81 6.09 2.46
Got It X
For each correct matrix solution, you will receive $1.00.
You will have 4 minutes to complete this task. After the 4 minutes is up, you will need to do the following: • Count the number of correctly solved matrices and indicate that number on the back side of the
matrix sheet. This will be your earnings. • Also inside the large envelope is a smaller envelope containing 15 one-dollar bills. Now pay
yourself from this money (stick your earnings in your pocket, wallet, purse, whatever). Leave the extra one-dollar bills in the envelope, seal the envelope, and leave it at your computer station. You will not have to sign any receipt for your earnings on this task. That envelope with the remaining

43
one-dollar bills will remain sealed until after all participants have left the lab, and will be separated from your matrix task sheet.
• Put your matrix task sheet and these instructions (i.e., everything except your earnings and the
sealed small envelope with the extra $1 bills) in the large envelope and seal the large envelope. It will remain sealed until after all participants have left the lab. • A box will be brought around to each station. Drop the large envelope in the box (shuffle its
location in the box….we do not care). These large envelopes containing the matrix task outcomes will not be opened until after all participants have left the lab, and you will note they have been separated from the small envelope.
---------------------------------------------------------------------- Matrix Task indentification method: Example of the footers on front and back side of duplexed decision sheet (15 matrices on sheet were split across front and back side of sheet, with space on back side to report total number of matrices solved). AppEEL is the name of the experimental economics laboratory used. Footer on front side of page:
Appalachian State UniversityEconomics & AppEELCenter for Economic Research and Policy Analysis
Footer on back side of page (with station #7 indicated between “Economics” and “AppEEL”): Appalachian State UniversityEconomics 7 AppEELCenter for Economic Research and Policy Analysis