Embed Size (px)
Citation preview

DEPARTMENT OF ECONOMICS
Working Paper
Guard Labor: An Essay in Honor of Pranab Bardhan
by
Samuel Bowles and Arjun Jayadev
Working Paper 2004-15
UNIVERSITY OF MASSACHUSETTS AMHERST

Guard Labor: An Essay in Honor of Pranab
Bardhan
Samuel Bowles∗ and Arjun Jayadev†
December 2nd, 2004‡
∗Santa Fe Institute and University of Siena†Department of Economics and Political Economy Research Institute, University of Massachusetts
at Amherst‡We would like to thank Phillip Aghion, Pranab Bardhan, Abhijit Banerjee, Marcel Fafchamps,
Michael Kremer, Torben Iversen, Suresh Naidu, Hannah Roditi, Erik Olin Wright and participantsat a workshop at Harvard University for their contributions to this paper, and the MacArthurFoundation, the Russell Sage Foundation and the Behavioral Sciences Program of the Santa FeInstitute for financial support.
1

Political economy critically involves the distribution of power...To avoid
descriptions taking the place of explanations one needs to specify in ad-
vance the institutional conditions and the range of tactics which are most
likely to result in the successful conversion of resources into power and
then empirically test predictions of systematic outcomes.
Pranab Bardhan, Scarcity, Conflicts, and Cooperation. (Bardhan(2005)[5])
For Pranab Bardhan, whose contributions to science and to society we honor
in these pages, power is an essential analytical tool. Its exercise – for better or
worse – redirects the course of development and affects the livelihoods of those whose
voices and interests are never absent in Bardhan’s work: the world’s least well off
(Bardhan (1984)[3], Bardhan (1989)[4]). We here explore the economic importance
of the exercise of power and the resources devoted to this end.
In the next section we give empirical examples of the economic importance of
power and offer a definition of this elusive term. We then investigate the role of power
in an abstract modern capitalist economy, borrowing ideas from the classical econo-
mists (unproductive labor, profit-driven investment), Marx (the labor-disciplining
effect of unemployment) and the contemporary theory of incomplete contracts (the
role of monitoring and enforcement rents). We will see that a significant portion of
an economy‘s productive potential may be devoted to the exercise of power and to
the perpetuation of social relationships of domination and subordination. We then
measure these resources in labor units using the concept of guard labor, finding it
to be a significant fraction of the U.S. labor force. Turning to evidence from other
economies, we document substantial country-differences in the extent of guard labor
and a strong statistical association between the extent of income inequality and the
fraction of the labor force that is constituted by guard labor. We close with some
observations on the role of guard labor in the process of economic development, and
some speculations concerning how economies might function better with more carrot
and less stick.
§
[Lending money] is profitable for those who enforce their authority with
the stick.
Harpal, a money lender in Palanpur,Uttar Pradesh.
(Lanjouw and Stern(1998):552)[35]
Historians have never doubted the economic importance of power. Indeed, the en-
tire content of the PhD oral exam in economic history set by Alexander Gerschenkron
2
for one of the authors of this paper required an extemporaneous half hour lecture on
the role of power in economic development! Whatever may be said of the quality
of that performance years ago, historical material for such a presentation is now
abundant.
An instructive example is the answer offered by Kenneth Pomeranz (2000) to the
question: why was it England that was poised for economic take off in the 18th century
and not the Yangzi River delta or perhaps Gujarat or some other part of the world?
On the eve of its economic takeoff, according to Pomeranz, England’s advantage
relative to the Yangzi delta was not that its institutions resembled the modern day
mainstream economist’s ideal of secure individual property, effective competition and
limited government. England did indeed have institutional advantages but “they
seem applicable to very few endeavors in the pre-1800 world besides war, armed long-
distance trade and colonization.”(Pomeranz (2000)[42]:166 )According to Pomeranz,
by contrast to the resource-constrained Yangzi delta, England’s military prowess had
been honed in centuries of continental warfare, a benefit of which was cheap access to
the raw materials of the New World. The Yangzi delta did not have the political or
military wherewithal to break out of the Ricardian constraints and escape the profit
squeeze associated with the resource demands of rapid growth ( for a skeptical view,
see Brenner and Isset(2002)).
Similar themes appear in studies by Frederic Lane (1973)[34] of twelfth- and
thirteenth-century Venice, whose fleet was devoted to mercantile trade in some years
and in others was deployed as a navy to secure tariff exemptions and other advantages
from the Byzantine Emperor (sometimes fighting on behalf of the Emperor, some-
times against him): “The government decided whether in a given year ships should
be allowed to sail as usual or whether certain trades should be suspended and a fleet
prepared for war...Venetian policy from 1082 to 1204 appears an unusually successful
use of force to increase national income.” (Lane (1966)[33]:391-2).
Power, when it is deployed by private economic actors, also has demonstrable
economic effects. In Bangladesh, for example, the government grants rights to fish in
the inland waters to cooperatives of fishermen (Touiqye (1997)[47]. But few fishermen
have the defacto power to exclude others and to collect rents from other users. As
a result, they commonly sell the fishing rights to wealthier and politically connected
money lenders and fish merchants. These ‘water lords’ deploy their network of clients
to monitor the waters, and their impunity from legal redress allows the extra-legal
enforcement of the rights through seizure of fishing gear and more serious threats.
The conforms to the Coasean expectation: the fishing rights are held by those for
whom the rights are worth the most. But the waterlords’ ownership of the rights
3

results not from any productive advantage they enjoy vis a vis the fishermen, but
rather from their superior property rights enforcement capabilities. Braguinsky and
Myerson (2004)[18] suggest that a similar system of ‘oligarchic property rights’ exists
in contemporary Russia.
Additional insight into the exercise of power in private economic transactions is
given by the crop lien system which came to prominence in the post-Emancipation
U.S. South. It was an ingenious solution to the problem of providing credit to asset-
poor borrowers, as it substituted the farmer’s unenforceable promise to repay the loan
in the future by an action observable by the lender prior to the granting of credit,
namely the farmers’ having already planted cotton, a crop that was readily seized by
the merchant and on which the merchant had first claim. The result, according to
Ransom and Sutch (1977)[43]:170 was that
“A southern tenant was neither owner of his land nor manager of his
business ..his independent decision making was limited to the mundane
and menial aspects of farming. The larger decisions concerning land use,
investments in the farm’s productivity, the choice of technology, and the
scale of production were all made for him.”
The merchant’s power to dictate to the farmer did not explain the distribution of
property rights (as in the case of Bangladesh fishing), but rather the planting of
cotton rather than food crops, on which the returns to the farmer would have been
substantially greater, but which could not serve as collateral.
Contemporary studies of the economics of power also suggest its importance.
Econometric explorations of the labor discipline problem have developed measures
of “enforcement rents” (Bowles and Gintis (1988)[13])–the value of the current trans-
action in excess of the agent’s next best alternative – sometimes called the ‘cost of job
loss’. The agent’s vulnerability to the loss of this rent is the source of the principal’s
power to induce the agent to carry out the wishes of the principal, hence the term ‘en-
forcement’. For example variation over time in the rents enjoyed by employed workers
have been found to be robust predictors strikes (inversely), movements in the rate of
profit and investment, and of the rate of productivity growth, in the latter case ac-
counting for a significant fraction of the productivity slowdown in the U.S. economy
during the late 60s and early 70s. (Schor and Bowles (1987)[46], Bowles, Gordon,
and Weisskopf (1983)[15] and the essays in Bowles and Weisskopf (1998)[17].) An
estimate the profit maximizing wage based on exogenous elements in the measure of
the ‘cost of job loss’ is a strong predictor of real wage movements in the U.S. economy
(Bowles (1991)[10]).
4

Technologies may also be chosen with the objective of improving an employer’s
bargaining power vis a vis his employees, reducing monitoring costs, or otherwise
improving the labor discipline environment.
Here is an example. When U.S. trucking companies installed on-board computers
during the 1980s, they vastly improved their ability to monitor the actions of the
drivers (Baker and Hubbard(2003))[2]. Trip recorders provided the company with
verifiable information on the speed, idle time, and other details of the operation of
the truck about which there was a conflict of interest between the driver and the
company. For example, the cost of operating the trucks (paid by the company) was
increasing and convex in the speed of the truck. Drivers preferred to drive faster than
the cost minimizing speed, and to take longer breaks. Drivers who owned their trucks
were residual claimants on their revenues minus these and other costs, and hence, of
course, internalized the costs of fuel and depreciation, realizing significant savings as
a result. For this reason, prior to the introduction of trip recorders, owner- operators
successfully competed with company fleets on those runs for which the conflicts of
interest between drivers and companies were particularly strong.
Using the trip recorders, companies were able to write contracts based on the
speed at which the truck was driven, and to provide drivers other incentives to act
in the companies’ interests. Unlike other on board computers, (the electronic vehicle
managements systems, or EVMSs), the trip recorders provided no improvement in
coordination between truckers and dispatchers, as the information was available to the
company only on the completion of the trip The sole function of the trip recorders
was to improve the contractibility of aspects of drivers behaviors in which there
was a conflicting interest between the drivers and the companies. By improving the
companies contractual opportunities, the trip recorders had two effects. First, they
brought about a significant decline in the market share of owner-operators. Second,
drivers in trucks with recorders drove slower.
Thus both historical and contemporary evidence suggests the economic relevance
of power. But at least until recently,the economics of power has been pursued only
by modern day mercantilists, Marxists and other mavericks, the latter including
not only Bardhan, but also Jack Hirshleifer (2001)[31], Phillip Aghion and Jean
Tirole(1997)[1], Kaushik Basu (2000)[7], Shelly Lundberg and Robert Pollak (1994)[37],
Oliver Hart (1995)[30].With no disrespect intended to that illustrious list and others
who have worked on it, power has not made into the economic mainstream. Why has
power remained a boutique item rather than being available at the mall?
Bardhan’s warning of “descriptions taking the place of explanation” may provide
a partial explanation. In the same spirit, a distinguished line of economists, from Eu-
5

gen Bohm-Bawerk, through Joseph Schumpeter, to Oliver Williamson have pointedly
eschewed the term power as being irreparably vague. Even the author of the most
famous definition of power, Robert Dahl, expressed similar concerns1 Yet the term
seems difficult to dispense with and is increasingly widely used, even in economics.
Common usage suggests several characteristics that must be present in any plau-
sible definition of power. First, power is interpersonal, an aspect of a relationship
among people, not a characteristic of a solitary individual. Second, the exercise of
power involves the threat and use of sanctions2. Third the concept of power should
be normatively indeterminate, allowing for Pareto-improving outcomes (as has been
stressed by students of power from Thomas Hobbes to Talcott Parsons), but also
susceptible to arbitrary use to the detriment of others and in violation of ethical
principles. Finally, to be relevant to economic analysis, power must be sustainable
as a Nash equilibrium of an appropriately defined game. Power may be exercised in
disequilibrium situations of course, but as an enduring aspect of social structure, it
should be a characteristic of an equilibrium. The fact that sanctions are essential to
the exercise of power makes it distinct from other means of securing advantage, in-
cluding those like wealth, that may operate even in the complete absence of strategic
interaction, as in a Walrasian market setting.
The following sufficient condition for the exercise of power captures these four
desiderata: For B to have power over A, it sufficient that, by imposing or threatening
to impose sanctions on A, B is capable of affecting A’s actions in ways that further A’s
interests, while A lacks this capacity with respect to B (Bowles and Gintis (1992)[14]
§
[T]he efforts of men are utilized in two different ways: they are di-
rected to the production or transformation of economic goods, or else to
the appropriation of goods produced by others.
Vilfredo Pareto, Manual of Political Economy (1905) (Pareto (1971)[40]:341)
1Dahl’s definition (1957)[20]:202-203: “A has power over B to the extent that he can get B to dosomething that B would not otherwise do.”.
2Many political theorists regard sanctions as the defining characteristic of power. Lasswell andKaplan (1950)[36]:75) make the use of “severe sanctions ... to sustain a policy against opposition” adefining characteristic of a power relationship, and Parsons (1967):308) regards “the presumption ofenforcement by negative sanctions in the case of recalcitrance” a necessary condition for the exerciseof power. The definition below limits ‘power’ to a particular way of affecting the behavior of others,namely through the use of sanctions, and in this respect it differs from Dahl’s (which encompassesgeneral equilibrium effects through market interactions, as when A purchases a commodity from B.)
6

To understand the dynamics of an economy we need to study not only the produc-
tion of goods and services as conventionally defined but two aspects of reproduction
as well. The first is the process of procreation and development of new individuals
to replace those retiring from active economic life. The second is the reproduction
(or alteration) of the economic institutions governing the process of production. Like
production, reproduction is resource-using, and, taken together, the two reproduc-
tion processes just mentioned –individual and institutional–account for something
like half the work done in most societies. The way that reproduction is organized
matters critically for the dynamics of the economy and the trajectory through time
of the livelihoods of its members. Here we abstract from individual reproduction to
focus on the process by which an economy’s institutions are reproduced.
Institutions (as we use the term) are the laws, informal rules, and conventions
which give a durable structure to social interactions among the members of a pop-
ulation. Conformity to the behaviors prescribed by institutions may be secured by
a combination of centrally deployed coercion (laws), social sanction (informal rules),
internalized norms, and mutual expectations (conventions) which make conformity a
best response for virtually all members of the relevant group.
The insight we wish to develop is that securing conformity to institutions can
be quite costly, and the cost differs among institutions and across time and space.
Conformity achieved through the coordination of expectations or the internalization
of norms, for example, may not be very costly, as in the case of driving on one side of
the road or the other, or the voluntary compliance with tax laws in some countries.
However,where conformity to a society’s institutions is secured primarily through
governmental coercion or privately deployed sanctions,the resource costs may be sub-
stantial. Examples include some authoritarian political systems, colonial regimes,
and as we will see, highly unequal capitalist economies.
Consider a closed economy in which owners of firms, acting non-cooperatively,
maximize the rate of growth of their wealth by hiring (identical) workers to produce
a single output that is sold on competitive markets. Owners individually set wages
and hire supervisors to monitor workers so as to minimize the cost of an effective
labor unit, taking account of the fact that workers select the (non-contractible) level
of work effort. Workers choose an effort level that maximizes the present value of their
lifetime expected utility, given both the likelihood of job loss (which is decreasing in
the level of effort) and the expected duration of a spell of unemployment, should their
employment be terminated.
The following summarizes the employer-employee interaction. The principal (the
employer) knows the agent’s (worker’s) best effort response, e(w,m;z): given each
7

wage rate (w) and level of monitoring (m), with an exogenously determined worker’s
fallback position z. At the beginning of a period, the employer selects (so as to
maximize profits) and announces: i) a termination probability t(e,m) ε [0,1] with
te <0 and tm> 0 over the economically relevant ranges; ii) a wage rate, w, and iii)
a level of monitoring per hour of labor hired m. Both the wage and the monitoring
inputs are measured in the same units as per period output. Following the employer’s
announcement of her effort incentive strategy, and hence knowing the above, the
worker selects e so as to maximize his expected present value of utility,which depends
on the wage, the level of effort, and the likelihood of job termination. Finally, at the
end of the period, the worker is paid, experiences the utility he incurs as a result of
his effort and pay, and his employment is renewed or terminated, the latter occurring
with probability t(e,m). If the worker’s job is terminated, he obtains a present value
of lifetime utility of z and is replaced by an identical worker from the unemployment
pool. The worker selects e so as to set ve = 0 which requires:
ue = te(e,m)(v-z) (1)
Thus the worker will choose the level of effort that equates the marginal cost of effort
(uethe marginal disutility of effort) to the marginal benefit of effort, the latter being
the product of the effect of greater effort on the likelihood of retaining the job (recall
te is negative) times the employment rent associated with the job (v-z).
Knowing the worker’s best response function given by (1), the firm then maximizes
profits by setting the wage and monitoring intensity so that
ew =e
(w + m)= em (2)
so that the marginal effect on effort of variations in wages and monitoring expen-
ditures are equal to the average level of effort per unit of expenditure on hiring and
disciplining labor.
We know that under quite general conditions, the competitive equilibrium of this
economy is characterized by positive levels of monitoring, employment rents, and
unemployment, and that the effective cost of labor effort is rising in the level of em-
ployment(Bowles (2004)[11], chapter 8). The before-tax profit rate (π) will generally
be inverted U-shaped in the level of employment (h) because the positive effects of
enhanced capacity utilization associated with higher levels of employment will even-
tually be more than offset by the profit squeeze associated with the rise in the cost
of effort. (See, for example, the empirical studies in Bowles, Gordon, and Weisskopf
8

(1989)[16] and Bowles, Edwards, and Roosevelt (2005)[12]). Thus we have π(h) with
πh > 0 for low levels of hand πh < 0 for h close to full employment.
The effect of unemployment clearly extends beyond the labor discipline environ-
ment. In many countries, property crime increases with the level of unemployment
(e.g. Gould, Weinberg, and Mustard (2002)[28], Fougere, Kramarz, and Pouget
(2003)[25], Raphael and Winter-Ember (2001[44]), Edmark (2003)[21]) It is plau-
sible to assume, further, that the owner’s risk of loss of wealth by means other than
crime (confiscation, governmental imposed populist restrictions of wealth-making e.g)
is also increasing in the level of unemployment. Property lost in this way is assumed
to simply disappear. The government imposes a linear tax on profits at rate τ , the
proceeds of which are devoted to protecting property, incarcerating those convicted
of property crimes, and defending the national borders.
We assume that all realized profits (after taxes and net of depreciation) are in-
vested (and that wage and theft income is not invested), so that the rate of growth
of wealth(k) is just the after-tax rate of profit minus the rate of losses (per period, as
a fraction of the capital stock) through theft or confiscation, δ. Making explicit the
relationships of the above variables to the level of employment (h) and the tax rate
(τ) we have
k(h,τ) = (1- τ)π(h) - δ(h,τ) (3)
Where δ is decreasing in both of its arguments. The government determines both τ
and h (the latter through monetary policy).
Suppose some entity (the owning class, for example, acting cooperatively, or the
state acting on its behalf) sought to adopt policies to maximize k given the (known)
best response functions of workers and the resulting profit-maximizing labor-discipline
strategies of owners. The resulting first order conditions for a maximum are:
π(h) = - δτ (4)
π(1- τ) = δh (5)
9

The first, (4), instructs the entity to raise taxes to the point where the deterrence-of-
confiscation effect of the resulting governmental property rights enforcement activities
(marginal benefits) equals the profit rate (which is the marginal cost associated with
increases in the tax rate). The second,(5),instructs the entity to set employment at a
level higher than that which maximizes before- tax profits, trading off the (negative)
effect of greater employment on the profit rate (marginal cost) against the (also
negative) effect of higher employment on the probability of wealth loss (marginal
benefit). We assume that there is at least one allocation meeting these conditions; if
there is more than one, the entity should choose that yielding a higher level of k.
Abstracting from the owners (and from those engaged in raising the next genera-
tion), the adult population in this economy consists of employed workers, monitors,
unemployed workers, prisoners, guards, and military personnel. The first (employed
workers) are productive in the sense that their effort is an argument of the firms’s
production functions. The efforts of the monitors, guards, and military personnel, by
contrast, are directed not toward production, but toward the enforcement of claims
arising from exchanges and the pursuit or prevention of unilateral transfers of prop-
erty ownership.
These workers might be called (in the classical sense) unproductive, a term that
does not suggest that they are unnecessary, but only that their efforts are directed
towards the second kind of activity to which Pareto refers in the headquote to this
section, somewhat expanded to include not only the appropriation of goods produced
by others, but also preventing such appropriation. Prisoners and the unemployed
represent a distinct category. They are unproductive not in the classical but in the
everyday sense; but they are not without a function. Their extent results from the
entity’s selection of the τ and h that maximizes the rate of growth of the owners
wealth, and their presence is part of the incentive structures entailed by this solution
to the entity’s maximum problem.
To emphasize their role in sustaining the status quo distribution of property rights
and claims, we call all but the employed workers guard labor 3. Supervisors, guards,
and military personnel exercise power in the sanction-based sense just defined, while
prisoners and the unemployed are the necessary concomitants of the public and private
sanctioning systems, respectively.
3Guard labor bears no obvious relationship to transactions costs. In a standard labor disciplinemodel, for example, monitors are guard labor, and the cost of employing them are transactionscosts. But what of that wages are paid in excess of the workers’ next best alternative to elicit higherlevels of labor effort? Is this excess also not part of transactions costs? And while prison guards ormilitary personnel represent guard labor, its is unclear which transactions their costs underwrite.
10

§
An industrial army of workers under the command of a capitalist re-
quires, like a real army, officers (managers), and N.C.O.’s (foremen, over-
seers) who command during the labor process in the name of capital. The
work of supervision becomes their established and exclusive function. ...
The leadership of industry is an attribute of capital, just as in feudal times
the functions of general and judge were attributes of landed property.
Karl Marx, Capital, I (Marx(1976)[38]:450-451)
We have deliberately constructed a model in which productive and guard labor are
readily distinguished, because, in the case of supervisors, as Marx put it, “the work of
supervision becomes their established and exclusive function.” This world is fictional,
in that most types of work combine some of both aspects. Foremen monitor workers
and also solve technical or coordination problems that are clearly productive in the
sense just defined. Teachers instruct the next generation in essential productive skills;
and they also socialize them to internalize the norms contributing to conformity to
the society’s institutions. And so on.
Nonetheless it may be of interest to count the fraction of the labor force occu-
pying the roles of guard labor identified in the model: supervisory labor, private
guards, police, judicial and prison employees, military and civilian employees of the
department of defense (and those producing military equipment), the unemployed,
and prisoners. Some supervisors work in segments of the economy for which all em-
ployees are counted as guard labor –a supervisor of guards in a prison– and to avoid
double counting we have accounted for these as supervisors rather than as employees
in a “guard industry”. Ideally we would also include those producing guns for private
use, locks, security systems and the like, but we are not able to do so because of the
lack of data. To abstract from cyclical effects we have measured guard labor at the
peak of the business cycle (and for the last year, 2002, used the unemployment rate
of the previous peak, in 2000). We include an estimate of the number of full time
equivalent discouraged workers among the unemployed. Jayadev (2004)[32] gives the
details of our calculations.
While most of the measurements are straightforward, estimating the number of
supervisors in the relevant sense is not. however. Following Gordon (1994)[27], we use
the codes in the Dictionary of Occupational Titles which provides detailed information
on the nature of each of over a thousand jobs, distinguishing those in which the
individual deals primarily with people (as opposed to things or data)and in which
their relationship to people is “supervisory”.We find that in 1979, for example, by this
11
definition, supervisors constituted 11.7 percent of the labor force. A partial check on
this estimate is possible using Wright (1995)[50] and Wright (1990)[49], which present
detailed information on the types and extent of supervisory tasks undertaken by large
samples of U.S. and other nations’ labor forces. According to these data for the year
1980, 19.7 percent of the labor force report that they exercise task supervision. They
have more than one subordinate and they decide one or more of the following: the
tasks, the tools or procedures to be used, and the pace of work of their subordinates.
A slightly smaller fraction (15.4 percent) reported having more than one subordinate
whom they can sanction (or cause to be sanctioned) with respect to pay, promotions,
or job termination.
The fraction exercising both the task supervision of the first group and the sanc-
tioning supervision of the second were 10.6 per cent of the labor force. Supervisors
with ‘unrestrained’ sanctioning power (meaning those who can take sanctioning ac-
tion without approval by others) were 12.4 percent 0f the labor force. The U.S census
categories “Managers and administrators” constitute 11.2 percent of the labor force
in the same year. These three numbers are very similar to our estimate of 11.7 per-
cent based on the Dictionary of Occupational Titles. (The Census managers and
administrators category is very close to the DOT estimate in other years as well, and
we use it to estimate the level of supervision in 2002, and for the pre World War II
years).
The fact that these various estimates are similar occurs despite the somewhat sur-
prising fact that many who are not managers or administrators exercise supervisory
functions, while many who are managers and administrators do not. Ninety-three
percent of foremen and eighty-five percent of managers report that they have super-
visory authority. But more than half of professionals and technicians and two-fifth’s
of craft workers report the same.
Figure 1 gives our estimates for the total and subcategories of guard labor-
supervisors, guards, military, prisoners, and unemployment-expressed as a fraction
of the labor force.
[Figure 1 about here]
A substantial increase in the guard labor fraction of the labor force is evident,
with supervisory labor and the military growing most rapidly over the period 1890-
1948, and the growth of prisoners and guards (police, corrections officials and private
security personnel) being more rapid during the latter period. The latter period
witnessed a substantial decline in the military fraction, which peaked at 5.4 percent
12

in 1966 and fell to 1.5 percent in 2002. About half of those classified as guards (47
percent) were privately employed in 2002, up from 28 percent in 1890.
Our measures of guard labor in the U.S. are necessarily incomplete. While we do
not think we have overestimated the extent of supervision, we have certainly missed
some types of work that could be termed guard labor. Activities similar to the
enforcement of property rights by the waterlords in Bangladesh, or the imposition
of cotton on southern farmers by the merchant lenders, or the workers producing
the trip recorders monitoring the movement of truckers all fall beyond our purview.
Nonetheless differences across nations in the extent of guard labor (measured as this
simple model recommends) suggests that the concept may illuminate an aspect of
economic structure that is crucial for the process of growth and stagnation.
§
..A population can be very successful in spite of a surprising diversion
of time and energy into aggressive displays, squabbling and outright fights.
The examples range from bumble bees to European nations.
William Hamilton, “Innate Social Aptitudes of Man: an Approach
from Evolutionary Genetics.” (Hamilton (1975)[29]: )
In a world described by the model in the third section, we would not expect any
particular relationship between the extent of guard labor and the rate of accumula-
tion or any other measure of economic performance. The reason is that the entity has
determined the level of guard labor in order to maximize the rate of growth of the
capital stock, so that small differences in the use of guard labor should have second
order effects on the rate of accumulation. Differences in the extent of guard labor
would be expected to reflect nation-specific levels of legitimacy of economic institu-
tions, work ethic, and other aspects of adherence to social norms. Countries whose
institutions were less costly to maintain would be advantaged, of course, because a
larger fraction of the labor force could be devoted to productive labor.
In order to assess the degree of supervisory labor in a cross-country context,
we use the data on occupational classifications derived from labor force surveys
and available in the International Labor Organizations SEGREGAT database (see
http://laborsta.ilo.org/).These data are collected from the labor force surveys of the
respective countries using definitions based on the International Standard Classifica-
tion of Occupations 1988(ISCO-88). Specifically, we use the category “Major Group
1: Legislators, senior officials and managers” as a percentage of all employees as our
13

measure of supervisory labor. Further details of the methods are described in Jayadev
(2004)[32].
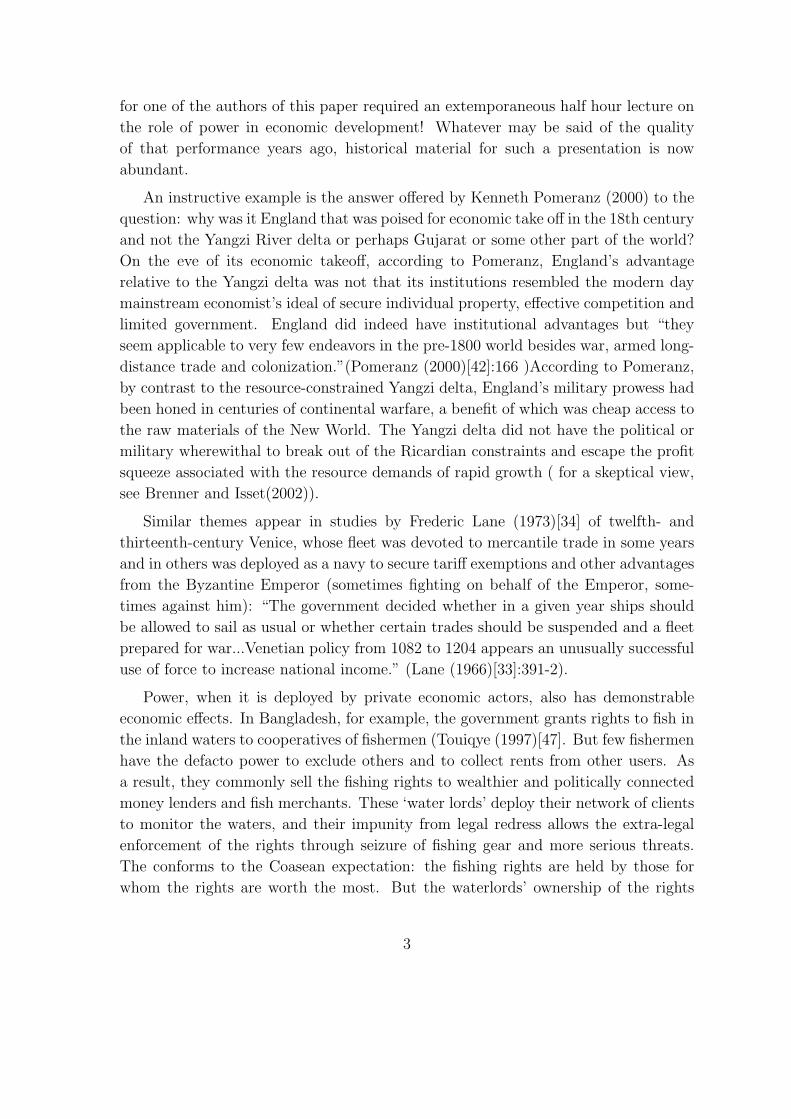
Using these data, we were able to estimate the numbers of all types of guard labor
except the category of guards (police and private security personnel) for seventeen
advanced economies (for details see Jayadev ( 2004)[32])4. The results appear in
Figure 2.
[Figure 2 about here]
Certain aspects of the data are striking. First, the differences in the extent of
guard labor among countries are substantial, ranging from a tenth of the labor force in
Switzerland to over a fifth in the U.K and the U.S. Broadly, three groups are evident.
Social Democratic countries which display low levels of guard labor, English-Speaking
countries which display high levels of guard labor (with substantial supervision), and
Southern European economies which exhibit unusually high unemployment rates and
thus,large amounts of guard labor.
Second, differences in the extent of supervisory labor are especially striking rang-
ing from a low of 4.4 percent in Sweden to the U.S. with 3 times that number. Ac-
cording to the Wright data set referred to above, while 39.2 percent of craft workers
in the U.S. exercise supervisory authority, only 9.7 percent of Swedish craft workers
do. 26 percent of clerks in the U.S. exercise supervisory authority, while half that
fraction do in Sweden.
Third, the composition of guard labor differs substantially among the nations,
especially in the proportions of the two largest components: supervision and unem-
ployment. In the labor discipline model sketched in section 3, these two types of
guard labor provide incentives for the workers’ choice of an effort level. From the first
order condition that determines the worker’s choice of effort (equation (1) above), we
can see that increased monitoring or increased unemployment will increase effort (the
former by raising te and the latter by raising the rent associated with the job (v-z ).
The top four in guard labor –Spain, the U.K., the U.S. and Greece– for example,
devote about a fifth of their labor force to supervision and unemployment combined.
But the U.S. is distinctive, with less than half the amount of unemployment as either
Spain or Greece and 50 percent more supervisory labor. A comparison between the
English speaking countries suggests a similar story. The U.S displays between 90
and 50 percent more supervisory labor than Canada, Australia and New Zealand,
4In contrast to the U.S. historical estimates our measure of supervisory labor is restricted tocivilians; military supervisors are counted as military personnel
14

but about 50 percent less unemployment than these countries.The U.K. is interme-
diate between these countries. Comparing the two paradigmatic social democratic
economies – Sweden and Norway – the same pattern emerges. Sweden exhibits two-
fifths less supervisory labor than Norway, combined with an unemployment rate that
one and a half times that of Norway.
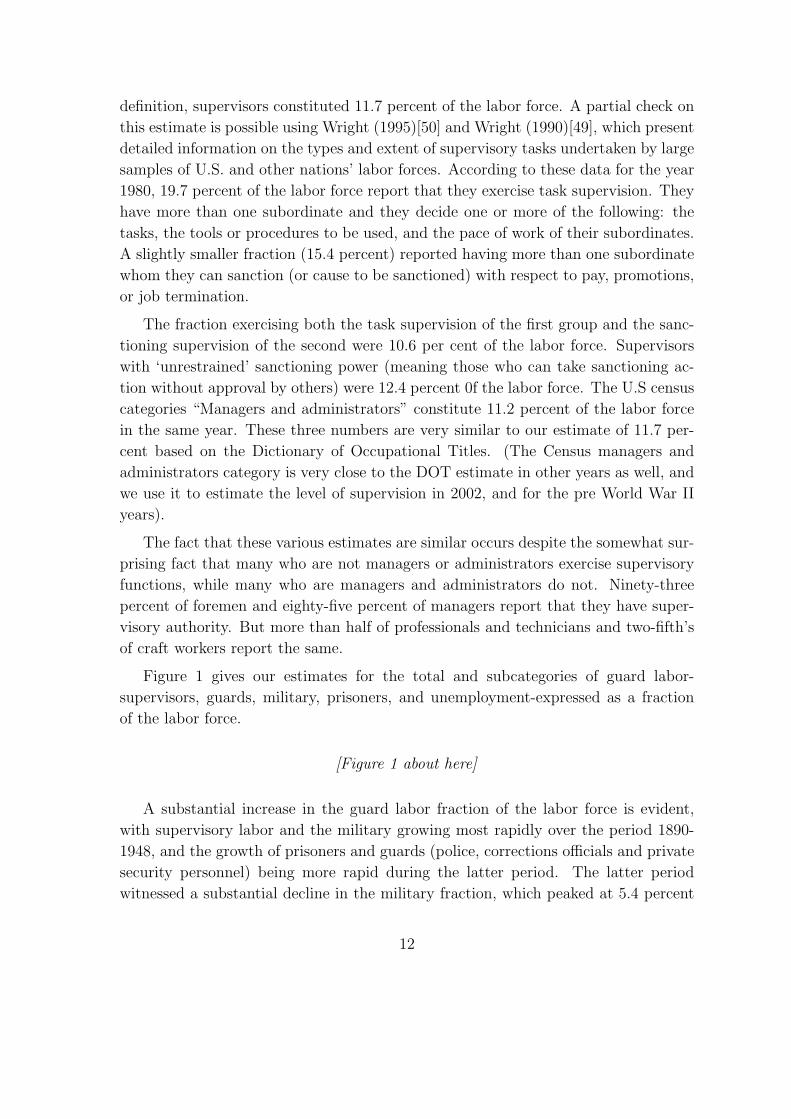
Figure 3 shows that the extent of guard labor varies with the degree of post tax
and transfer income inequality and the measure of income polarization in 1995 due
to Duclos, Esteban and Ray (2003)5. Their measure of polarization is intended to
capture two aspects of an income distribution which Duclos,Esteban and Ray term
identity and alienation. Identity is measured by how close one is to one’s nearest
neighbors. Alienation is measured by how far one and ones neighbors are from others
more distant in the income distribution. The close statistical association between the
extent of guard labor on the one hand and income inequality and polarization on the
other ( r=0.91 r=0.94, respectively) is due almost entirely to the covariation of the
intensity of supervision with income inequality and polarization ( r = 0.71 and r =
.70 respectively).
[Figure 3 about here]
Data limitations preclude the estimation of all of the components of guard la-
bor for other countries. However, using the ILO SEGREGAT data again, we are
able to compare supervision intensity across a sample of 27 low- and middle-income
countries. Figure 4 shows a remarkable diversity in the ratio of supervisory labor to
employed labor. Botswana, Romania, and Mexico exhibit supervision intensities akin
to those observed in Denmark, Sweden and Switzerland, the low-supervision OECD
economies. By contrast, supervision intensities in Estonia, Latvia and Egypt are al-
most at the level of the United States. Notice that the 13 ex-Communist economies
are themselves highly diverse.
[Figure 4 about here]
Some of the diversity of supervisory intensity across countries may reflect differ-
ences in the composition of output. One check on this possibility in the context of low
income countries is afforded by analyzing occupational data from the World Bank’s
survey of manufacturing firms that it conducted as part of its Regional Program
5The figure shows only those countries for which we have data on both inequality and incomepolarization. Adding all the advanced economies to either scatter plot, however, does not changethe basic result
15
on Enterprise Development (RPED) in Africa. The data on supervision intensity by
manufacturing sector in five sub-Saharan African countries shown in Figure 5 suggests
large country effect independent of the composition of output. Supervisory intensities
in Zambia’s ‘wood and furniture’ and ‘food processing’industries, are twice and five
times Ghana’s respectively.A country and industry fixed effects regression indicates
that Zambia’s supervision intensity conditioned on industrial structure is two and a
half times Ghana’s.
[Figure 5 about here]
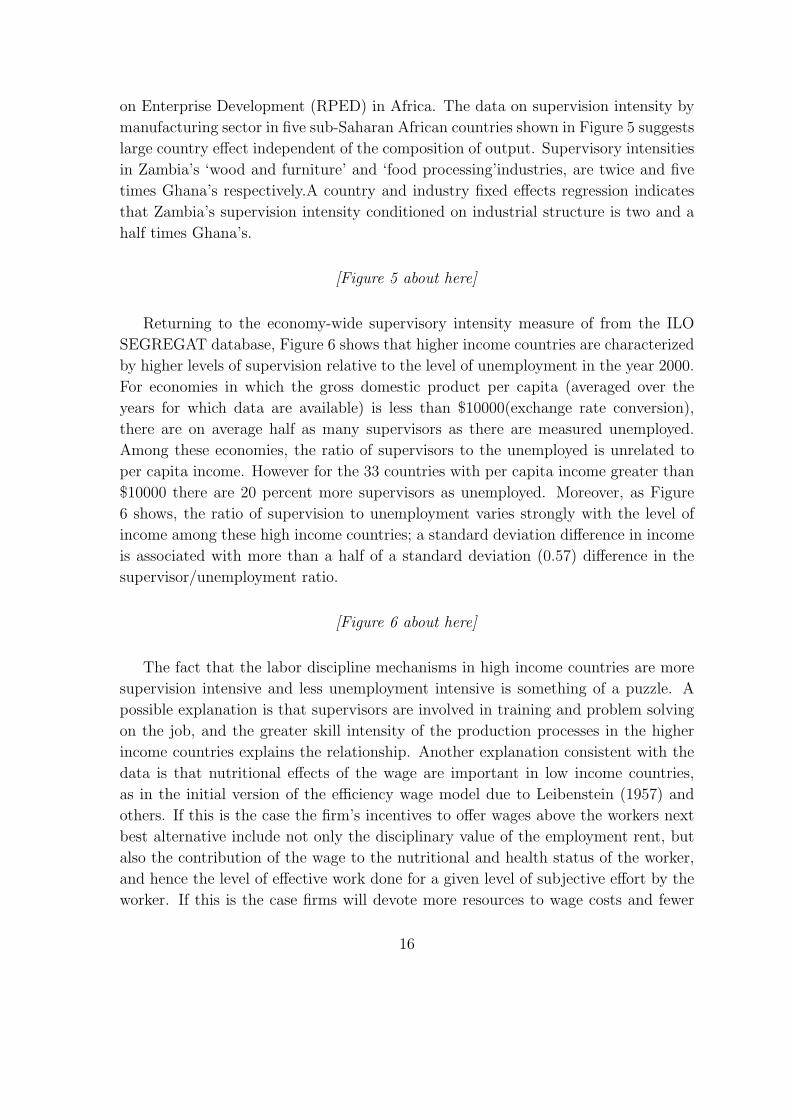
Returning to the economy-wide supervisory intensity measure of from the ILO
SEGREGAT database, Figure 6 shows that higher income countries are characterized
by higher levels of supervision relative to the level of unemployment in the year 2000.
For economies in which the gross domestic product per capita (averaged over the
years for which data are available) is less than $10000(exchange rate conversion),
there are on average half as many supervisors as there are measured unemployed.
Among these economies, the ratio of supervisors to the unemployed is unrelated to
per capita income. However for the 33 countries with per capita income greater than
$10000 there are 20 percent more supervisors as unemployed. Moreover, as Figure
6 shows, the ratio of supervision to unemployment varies strongly with the level of
income among these high income countries; a standard deviation difference in income
is associated with more than a half of a standard deviation (0.57) difference in the
supervisor/unemployment ratio.
[Figure 6 about here]
The fact that the labor discipline mechanisms in high income countries are more
supervision intensive and less unemployment intensive is something of a puzzle. A
possible explanation is that supervisors are involved in training and problem solving
on the job, and the greater skill intensity of the production processes in the higher
income countries explains the relationship. Another explanation consistent with the
data is that nutritional effects of the wage are important in low income countries,
as in the initial version of the efficiency wage model due to Leibenstein (1957) and
others. If this is the case the firm’s incentives to offer wages above the workers next
best alternative include not only the disciplinary value of the employment rent, but
also the contribution of the wage to the nutritional and health status of the worker,
and hence the level of effective work done for a given level of subjective effort by the
worker. If this is the case firms will devote more resources to wage costs and fewer
16

to monitoring costs than in an economy in which variations in the wage have less
significant effects on worker strength and health.
None of the statistical associations we have presented are properly identified causal
relationships, of course, because the determination of all of the correlates of guard
labor (excepting the English language, arguably) are endogenous, as the model in
section 3 makes clear. The empirical patterns we have identified are sufficient to
suggest questions, not answers.
§
...it is lamentable to think how a great proportion of all efforts and
talents in the world are employed in merely neutralizing one another. It is
the proper end of government to reduce this wretched waste to the smallest
possible amount, by taking such measures as shall cause the energies now
spent by mankind in injuring one another, or in protecting themselves
against injury, to be turned to the legitimate employment of the human
faculties...
J.S. Mill, Principles of Political Economy (1848) (Mill(1965):979)
Why do economies exhibit such different levels of guard labor? Could its real-
location to productive employment promote economic development and enhance the
livelihoods of the least well off? We cannot answer these questions in any definitive
way; but the following speculative conclusions may point towards partial answers.
First, the costs of reproducing an economy’s institutions arise in large measure
because conflicts of interest over things that cannot specified in complete contracts
enforceable at low cost. These conflicts provide incentives for the costly exercise
of power by private economic actors. Policies that result in more fully and clearly
defined property rights and attenuated conflicts of interest would reduce the cost of
institutional reproduction.
Second, conflicts over non-contractible goods and services are exacerbated when
many economic actors lack the assets necessary to become residual claimants on the
results of their own non-contractible actions or to engage in other efficient contracts
(Bardhan, Bowles, and Gintis (2000)[6]).
Third, enforcement strategies adopted by wealthy principals facing wealth-poor
agents typically confer a rent on the agent, who is then monitored by the principal.
Both the rent and the resources devoted to monitoring are private costs, but only
17

monitoring involves a social cost (the rent is a transfer, not an additional claim on
resources that have alternative uses). As a result, private enforcement strategies are
technically inefficient:if a larger rent were paid the same output could be accomplished
with less monitoring inputs and not more of any other input. Thus private enforce-
ment exhibits an endemic ‘too much stick, not enough carrot’ technical inefficiency
(Bowles (1986)[9]).
Fourth, illegitimate inequalities are costly to sustain. While cultures often justify
vast differences in power and access to valued resources, the mind is not a blank
slate on which such ideas as the divine right of kings or the superiority of the ‘white
race’ can be etched at will. Two decades of behavioral experiments have provided
convincing evidence that humans in dozens of cultures are inequality averse, and that
violations of norms or reciprocity often lead to costly conflicts (Fehr and Gaechter
(2000)[24], Falk, Fehr, and Fischbacher (2003)[23] )
We conclude with two observations on the relationship between guard labor and
the process of economic development.
First, economic development proceeds through a process of specialization and
increasing division of labor; the work of perpetuating a society’s institutions is no
exception to this truism. Over history’s long sweep, the tasks of punishing those who
violate norms, defending a people’s territory and one’s own property, and inducing
hard work towards common ends have become increasingly specialized. Gossip, os-
tracism, shunning, and (sometimes violent) group level collective sanctioning played
a larger part in maintaining earlier social orders (Boehm 2001[8]). Most if not all
engaged in these activities at least some of the time. The fact that these functions
are increasingly specialized in occupations that we have termed guard labor allows
us to measure their extent. But it should also caution against too literal an interpre-
tation these measures. Our data indicate that the United States devotes well over
twice as large a fraction of its labor force to guard labor as does Switzerland. Peer
monitoring and informal sanctioning may play a larger role in Switzerland. The ex-
tent of the difference between the two countries may reflect the fact, at least in part,
that in the U.S. when one’s neighbor’s boisterous party is disturbing the sleep of the
neighborhood one is more likely to call the police than to call the neighbor.
Second, when accounting for the depreciation of capital goods we typically define
net income as the maximum one could consume in a given time period without reduc-
ing the value of one’s assets. If restoring capital assets to a status quo value through
depreciation expenditures motivates a deduction from gross income, should not the
same principle apply to the costs of sustaining the institutional structure of society?
In light of the national differences in the extent of guard labor (even taking account
18

of the caution immediately above), a positive answer would suggest a considerable
downward revision in net income in many countries, and a reordering of per capita
guard-labor-adjusted net incomes. This is especially true of the U.S. were roughly
one in five employees (that is not counting the prisoners and the unemployed) are per-
forming guard labor, while roughly one tenth of gross domestic product is accounted
for by capital consumption.
19

0.8%1.4%
9.8% 9.9%
11.7%
13.2%
15.7%
0.3%0.9%
1.7% 1.8%2.2%
3.3%
5.4%
3.0% 3.1%
1.8%
0.4% 0.2% 0.3% 0.3%
1.5%
4.2%3.8%
4.7% 4.5%
6.7%6.3%
4.8%
6.0%
6.9%
18.9%
20.9%
23.4%
24.9%
26.1%
0.7%
0.8%
0.8%
0.3%0.2%
0.5%
0%
5%
10%
15%
20%
25%
30%
1890 1929 1948 1966 1979 1989 2002
perc
enta
ge o
f lab
or fo
rce
Supervisors Guards Military Prisoners Unemployed Total
Figure 1: Guard Labor in the United States, 1890-2002. For methods and sources
see Jayadev (2004)[32]
20

0%
5%
10%
15%
20%
25%
30%
Switzer
land
Icelan
d
Sweden
Denmar
k
Norway
Austria
Portug
alIta
ly
Nether
lands
Irelan
d
Canad
a
Belgium
Austra
lia
New Z
ealan
dSpa
in
United
King
dom
United
Stat
es
Greec
e
Gua
rd L
abor
as
a P
erce
ntag
e of
Lab
or F
orce
Supervisory Ratio in 2002 Unemployment average of 2001- 2003 Military Personnel Prisoners
Figure 2: Guard Labor as a Percent of the Labor Force, Seventeen Advanced
Economies, 2002. For methods and sources see Jayadev (2004)[32]
0%
5%
10%
15%
20%
25%
20 25 30 35
Average Post Tax Gini ( 1970-1990)
Gua
rd L
abor
as
Per
cent
age
of L
abor
For
ce
Netherlands
0%
5%
10%
15%
20%
25%
0.15 0.16 0.17 0.18 0.19 0.2
Polarization Index
Australia
Canada
Netherlands
Norway
DenmarkSweden
United Kingdom
USA
SwedenDenmark
Norway
Canada
Australia
United Kingdom
USA
Figure 3: Guard Labor, Inequality and Polarization. The polarization measures are
from Duclos,Esteban and Ray ( 2003) and are estimated with α = 1. The post tax
and transfer gini coefficients are from Rehme (2003)
21

1.8%2.1% 2.2% 2.3%
2.8%3.0% 3.2%
3.3%
4.9% 4.9%
5.7% 5.8% 5.8%6.1% 6.1% 6.2% 6.3%
6.7% 6.7%6.9%
7.1% 7.2%7.5%
8.3%
9.7%
10.3%
12.6%
0%
2%
4%
6%
8%
10%
12%
14%
Namibi
a
Bolivia
Roman
ia
Mexico
Ecuad
or
Botswan
a
Oman
Moldov
a
Georg
ia
Mongo
lia
Costa
Rica
South
Africa
Bulgar
ia
Poland
Czech
Rep
ublic
Urugu
ay
Slovak
ia
Argen
tina
Croati
a
Hunga
ry
Ukraine
Trinida
d and
Tob
ago
Barba
dos
Lithu
ania
Egypt
Latvi
a
Estonia
Figure 4: Supervisors as a Fraction of Employment; 27 Low- and Middle-Income
Economies Source:Derived from International Labor Organization Laborsta Segregat
Database (www.laborsta.ilo.org) The data are for the year 2000.For methods and
sources see Jayadev (2004)[32]
22

2.0%
3.1%
4.3% 4.4%
5.3%
2.5%
3.5%
5.4%
3.3%
4.9%
3.6%
4.5% 4.4%
5.8%
4.9%
3.1%
4.7%
5.1%
6.7%
4.6%
1.8%
2.7%
4.4%4.2%
9.5%
0%
2%
4%
6%
8%
10%
12%
Ghana Kenya Zimbabwe Cameroon Zambia
Sup
ervi
sors
as
Per
cent
age
of E
mpl
oyee
s
Predicted value of supervisors to employees conditioned on industry dummies
Wood & Furniture
Textile & Garments
Metal & Machinery
Food Processing
Figure 5: Supervisors as a Percentage of Employment by Manufacturing Sector in Five
African Economies. Note: The first bar is the predicted country average abstracting
from national differences in the structure of output. Source Center for the Study
of African Economies. The data are obtained from surveys of 626 firms undertaken
in three waves during the 1990s by the regional program of enterprise development
project of the World Bank (RPED), and are described in detail in Fafchamps and
Soderbom (2004). The data are available at http://www.csae.ox.ac.uk/datasets/cfld-
edcc/cfld-main.html
23

0
0.5
1
1.5
2
2.5
3
3.5
4
0 5000 10000 15000 20000 25000 30000
Average Per Capita GDP
Ave
rage
Rat
io o
f Sup
ervi
sory
Lab
or to
Une
mpl
oym
ent Singapore
Norway
Botswana
Spain
Italy
Portugal
Sweden
Argentina
UruguayMexico
Moldova
Bolivia
Ireland
Hong KongNetherlands
Iceland
U.K
Figure 6: Supervisors Relative to the Unemployed by Per Capita Income in 2000, 55
Countries. For methods and sources see Jayadev (2004)[32]
References
[1] Aghion, Philippe and Jean Tirole. 1997. ”Formal and Real Authority in Organi-
zations.” Journal of Political Economy, 105:1, pp. 1-29.
[2] Baker, G. and T. Hubbard. 2003. ”Make versus buy in trucking: Asset ownership,
job design and information.” American Economic Review, 93:3, pp. 551-572.
[3] Bardhan, Pranab. 1984. Land, Labor and Rural Poverty: Essays in Development
Economics. New York: Columbia University Press.
[4] Bardhan, Pranab. 1989. “Alternative Approaches to the Theory of Institutions
in Economic Development,” in The Economic Theory of Agrarian Institutions.
Pranab Bardhan ed. Oxford: Clarendon Press, pp. 3-17.
[5] Bardhan, Pranab. 2005. Scarcity, Conflicts and Cooperation. Cambridge: MIT
Press.
[6] Bardhan, Pranab, Samuel Bowles, and Herbert Gintis. 2000. “Wealth Inequality,
Credit Constraints, and Economic Performance,” in Handbook of Income Dis-
tribution. Anthony Atkinson and Francois Bourguignon eds. Dortrecht: North-
Holland, pp. 541-603.
24

[7] Basu, Kaushik. 2000. Prelude to Political Economy: A Study of the Social and
Political Foundations of Economics. Oxford: Oxford University Press.
[8] Boehm, Christopher. 2000. Hierachy in the Forest. Cambridge: Harvard Univer-
sity Press.
[9] Bowles, Samuel. 1986. “The production process in a competitive economy-reply”
American Economic Review 76(5) 1203-1204 1986
[10] Bowles, Samuel. 1991. “The Reserve Army Effect on Wages in a Labour Disci-
pline Model: U.S., 1954-1987,” in Making Economies More Efficient and More
Equitable: Factors Determining Income Distribution. T. Mizoguchi ed. Oxford:
Oxford University Press, pp. 385-406.
[11] Bowles, Samuel. 2004. Microeconomics: Behavior, Institutions, and Evolution.
Princeton: Princeton University Press.
[12] Bowles, Samuel, Richard Edwards, and Frank Roosevelt. 2005. Understanding
Capitalism: Competition, Command, and Change. New York: Oxford University
Press.
[13] Bowles, Samuel and Herbert Gintis. 1988. “Contested Exchange: Political Econ-
omy and Modern Economic Theory.” American Economic Review, 78:2, pp. 145-
50.
[14] Bowles, Samuel and Herbert Gintis. 1992. “Power and Wealth in a Competitive
Capitalist Economy.” Philosophy and Public Affairs, 21:4, pp. 324-53.
[15] Bowles, Samuel, David M. Gordon, and Thomas E. Weisskopf. 1989. “Business
Ascendancy and Economic Impasse.” Journal of Economic Perspectives, 3:1, pp.
107-34.
[16] Bowles, Samuel, David Gordon, and Thomas Weisskopf. 1983. “Hearts and
Minds: A Social Model of U.S. Productivity Growth.” Brookings Papers on
Economic Activity:2, pp. 381-450.
[17] Bowles, Samuel and Thomas. Weisskopf eds. 1998. Economics and Social Justice:
Essays on Power, Labor and Institutional Change. Cheltenham: Edward Elgar.
[18] Braguinsky, Serguey and Roger Myerson. 2004. “Oligarchic Property Rights and
Investment.”
25

[19] Brenner, Robert and Christopher Isset.2002. “England’s divergence from China’s
Yangzi Delta: property relations, microeconomics, and patterns of development.
(criticism of Kenneth Pomeranz)(Statistical Data Included) Journal of Asian
Studies v61, 2002
[20] Dahl, Robert. 1957. “The Concept of Power”. Behavioral Science,2,pp.201-15
[21] Edmark, Karin. 2003. “The Effects of Unemployment on Property Crime.” Work-
ing Paper 2003:14, Uppsala University, Department of Economics.
[22] Fafchamps, Marcel and Mans Soderbom. 2004. “Wages and Labor Management
in African Manufacturing”, Center for the Study of African Economies, Oxford
University
[23] Falk, Armin, Ernst Fehr, and Urs Fischbacher. 2003. “On the Nature of Fair
Behavior.” Economic Inquiry, 41:1, pp. 20-26.
[24] Fehr, Ernst and Simon Gaechter. 2000. “Fairness and Retaliation: The Eco-
nomics of Reciprocity.” Journal of Economic Perspectives, 14:3, pp. 159-81.
[25] Fougere, Denis, Francis Kramarz, and Julien Pouget. 2003. “Crime and Unem-
ployment in France.” CREST-INSEE.
[26] Gordon, David M. 1994. “Bosses of Different Stripes: A Cross-National Per-
spective on Monitoring and Supervision.” American Economic Review, 84:2, pp.
375-79.
[27] Gordon, David M. 1990. “Who Bosses Whom: The Intensity of Supervision and
the Division of Labor.” American Economic Review, 80:2, pp. 28-32.
[28] Gould, Eric, Bruce Weinberg, and David Mustard. 2002. “Crime Rates and Lo-
cal Labor Market Opportunities in the United States, 1979-1997.” Review of
Economics and Statisitcs, 84:1, pp. 45-61.
[29] Hamilton, W. D. 1975. “Innate Social Aptitudes of Man: an Approach from
Evolutionary Genetics,” in Biosocial Anthropology. Robin Fox ed. New York:
John Wiley and Sons, pp. 133-55.
[30] Hart, Oliver. 1995. Firms, Contracts, and Financial Structure. Oxford: Claren-
don Press.
[31] Hirshleifer, Jack. 2001. The Dark Side of the Force: Economic Foundations of
Conflict Theory. Cambridge: Cambridge University Press.
26

[32] Jayadev, Arjun. 2004. “Estimating Guard Labor.” Political Economy Research
Institute, University of Massachusetts at Amherst.
[33] Lane, Frederic C. 1966. Venice and History: The Collected Papers of Frederic C.
Lane. Baltimore: Johns Hopkins Press.
[34] Lane, Frederic C. 1973. Venice. A maritime republic. Baltimore: Johns Hopkins
University Press.
[35] Lanjouw, Peter and Nicholas Stern eds. 1998. Economic Development in Palan-
pur Over Five Decades. Delhi: Oxford University Press.
[36] Lasswell, Harold and Abraham Kaplan. 1950. Power and Society: A Framework
for Political Enquiry. New Haven: Yale University Press.
[37] Lundberg, Shelly and Robert Pollak. 1993.”Separate spheres bargaining and the
marriage market.” Journal of Political Economy, 101:6, pp. 988-1011.
[38] Marx, Karl. 1976. Capital: A critique of political economy, Volume I. Har-
mondsworth: Penguin (original publication, 1867).
[39] Mill, John Stuart. 1965. Principles of Political Economy. New York: Kelley.
[40] Pareto, V. 1971. Manual of Political Economy. New York: Augustus Kelley (orig-
inal Italian edition published 1905).
[41] Parsons, Talcott. 1967. “On the Concept of Political Power,” in Sociological
Theory and Modern Society. Talcott Parsons ed. New York: Free Press, pp.
297-354.
[42] Pomeranz, Kenneth. 2000. The Great Divergence: China, Europe, and the Mak-
ing of the Modern World Economy. Princeton: Princeton University Press.
[43] Ransom, Roger L. and Richard Sutch. 1977. One Kind of Freedom: The Eco-
nomic Consequences of Emancipation. Cambridge: Cambridge University Press.
[44] Raphael, Steven and Rudolf Winter-Ember. 2001. “Identifying the Effect of Un-
employment on Crime.” Journal of Law and Economics, 44:1, pp. 259-83.
[45] Rehme, Gunther. 2003.“(Re-) distribution of personal incomes, education and
economic performance across countries” Luxembourg Income Study Working Pa-
per No. 299
27

[46] Schor, Juliet B. and Samuel Bowles. 1987. “Employment Rents and the Incidence
of Strikes.” Review of Economics and Statistics, 64:4, pp. 584-91.
[47] Touiqye, Kazi Ali. 1997. “Some Observations on Power and Property Rights in
the Inland Fisheries of Bangladesh.” World Development, 25:3, pp. 457-67.
[48] Walmsley , Roy(2003) “A World Prison Population List” Research, Development
and Statistics Directorate, Home Office, UK.
[49] Wright, Erik Olin. 1990. “Class structure and class consciousness: Merged multi-
nation file.” Interuniversity consortium for political and social research.
[50] Wright, Erik Olin. 1995. Class Counts: Comparative Studies in Class Analysis.
Cambridge: Cambridge University Press.
28

Appendix
Guard Labor in the cross country sample comprises supervisory labor, the unem-
ployed, military personnel and the prison population. Supervisory labor is obtained
from the International Labor Organization’s Laborsta Segregat dataset. This dataset
classifies respondents according to International Standard Classification of Occupa-
tions(1988) categories. Within these categories, the subgroup consisting of “Legisla-
tors, Senior Officials and Managers” are taken to be supervisory labor. For the United
States the data are not available, and instead for the value for the cross country fig-
ure for 2002 we use the estimate of the same category from the International Social
Survey Program (ISSP) dataset. This nationally representative dataset classifies re-
spondents according to International Standard Classification of Occupations (1988)
categories as well. The unemployment rate was obtained from the world development
indicators. Although unemployment measures vary across countries, a comparison
between the BLS’s series of a consistently defined unemployment rate and the series
showed that there is little significant differences in the measures, and the former pro-
vided us with a larger dataset. The data on military personnel as a percentage of the
labor force were obtained from the World Bank’s World Development Indicators CD
ROM (2003). Finally, data on the prison population was obtained from Walmsley ,
Roy(2003) “A World Prison Population List” Research, Development and Statistics
Directorate, Home Office, UK. The data vary in terms of the year for which the data
was collected. For the most part, however, the prison population is for the years
between 1998 and 2001.
Post tax gini coefficients were obtained from Gunther Rehme “(Re-) distribution
of personal incomes, education and economic performance across countries” Luxem-
bourg Income Study Working Paper No. 299 (2003),and is measured as the Average
Gini coefficient for net income of households (adjusted for household size by the square
root of the number of household members) for the period 1970-1990.
The measure of polarization is obtained from Duclos, Esteban and Ray (2003)
“Polarization: Concepts, Measurement, Estimation”
29