Embed Size (px)
Citation preview
DEPARTMENT OF ECONOMICS
COMPETITIVENESS OF FIRMS
IN INDIAN AUTOMOBILE INDUSTRY
BY
L. G. Burange
Shruti Yamini
WORKING PAPER UDE (CAS) 23/ (8)/1/2008
FEBRUARY 2008

1
DEPARTMENT OF ECONOMICS UNIVERSITY OF MUMBAI
Vidyanagari, Mumbai 400 098.
Documentation Sheet
Title:
COMPETITIVENESS OF FIRMS
IN INDIAN AUTOMOBILE INDUSTRY
Author(s):
L. G. Burange
Shruti Yamini
External Participation:
-----
WP. No.: UDE (CAS) 23/ (8)/1/2008
Date of Issue: February 2008
Contents: 29 P, 8 T, 5 F, 31 R.
No. of Copies: 100
Abstract
Although opening up of the economy in early 1990‟s gave the much-awaited
impetus, the Indian automobile industry has grown in last five years as never before.
Well supported by the changing economic conditions particularly in the financial sector
and in foreign direct investment, increasing number of global players are entering Indian
economy by way of joint ventures, collaborations with the domestic firms or wholly
owned subsidiary, which has led to increase in competition among firms in the industry.
The competitiveness among the firms in Indian automobile industry has been
assessed by understanding the factors that determine its competitive advantage. The
efforts have been made to construct a competitiveness index for a sample of fourteen
firms for the year 2005-06, which represents around 85% of each segment of the industry
namely passenger vehicles, commercial vehicles, three-wheelers and two-wheelers.
About 50% of the sample firms have recorded above industry average performance from
all the segments of the automobile industry. The marginal difference between the
competitiveness of different firms reveals the tough competition among the firms in the
automobile industry in India.
Key Words: Automobile, Evolution, Liberalization, Current Status, Competitiveness,
Financial- Non Financial.
JEL Code(s): L62

2
COMPETITIVENESS OF FIRMS
IN INDIAN AUTOMOBILE INDUSTRY
L. G. Burange
Shruti Yamini
1. INTRODUCTION:
Automotive industry, globally, as well as in India, is one of the key sectors of
the economy. Due to its deep forward and backward linkages with several major
segments of the economy, the industry has a strong multiplier effect of industrial
growth. The rise in efficiency and productivity helps directly and indirectly to
accelerate the efficiency of other sectors through factor movements of goods and
people in the economy. Therefore the industry is recognized as one of the drivers of
economic growth contributing significantly to the overall GDP of the nation. It has
been identified at different forums as a sector with a high potential to increase exports
and employment. It also helps in attaining two critical goals of the common minimum
programme that of increasing manufacturing output and of providing employment.
Although indirectly but it also facilitates the third objective of increasing agricultural
productivity through farm mechanization and the needs of agro-produce
transportation (Ministry of Heavy Industries and Public Enterprises 2006 b).
The Indian automotive industry has flourished after economic liberalisation in
1990s like never before. This extra-ordinary growth of the industry is mainly due to
higher disposable incomes of the middle class and resultant increase in their living
standards. This is well supported by the economic conditions particularly in the
financial sector, which has played a big role in boosting the demand and sustaining a
long-term growth in the industry.
India has several competitive advantages over the world in the automobile
sector. The competitive landscape of the industry has been developed using the
Porter‟s (1990) Diamond Framework by India Brand Equity Foundation (2006) as
shown in Figure 1.

3
Figure 1: Competitive Picture of Indian Automobile Industry
The present paper has tried to bring out the competitive flavour of the Indian
automobile industry. Intense competition has gripped the industry in recent years with
major world players entering the market bringing better technology and experience.
Therefore the study on competitiveness of firms in the industry in domestic market, in
the present state is interesting to examine. With this objective, an effort has been
made to construct an index, which can benchmark the firms according to their
competitive position in the industry.
The paper is organized in five sections where the second section discusses the
structure and evolution of Indian automobile industry throwing some light on its
current status too. The third section deals with the methodology. Section four has the
results and analysis, followed by conclusion.
Factor Conditions:
India‟s comparatively cheaper and
skilled workforce can be
effectively utilised to setup large
low–cost production bases
Huge investments from the firms
for capacity expansion, R&D etc
Demand Conditions:
High demanding consumers
Rapid urbanization, increases liter
and rising per capita income, have
caused rapid growth and changes
demand patterns
Firm Strategy, Structure and Rivalry:
A large number of domestic as well as
multi-national players
Highly competitive industry
Related and Supporting Industries:
Strong industry associations to
promote the industry‟s interests
Well-established components industry
supports OEMs
Government:
Liberalized policy regime
Automatic approval for up to
100% FDI
The customs duty on inputs
and raw materials has been
reduced from 20 per cent to 15
per cent

4
2. OVERVIEW OF THE INDIAN AUTOMOBILE INDUSTRY:
The automotive industry in India is poised for a giant leap forward as it is
being rapidly integrated into the global automotive supply chain. Global automotive
firms are looking towards India not only for its growing market but also as an
efficient supplier base.
2.1. Structure of Automobile Industry in India:
The Indian automotive sector has a presence across all vehicle segments and
comprises of key component manufactures, concentrated in regional clusters.
The Indian automobile market is still in its evolutionary stage. Therefore, no
fixed or widely accepted method of segmenting the market has evolved as yet.
Segmentation has mostly been done on the basis of product types, its weight/size or
product uses. It is categorized into following four segments namely; Commercial
Vehicles, Passenger Vehicles, Two Wheeler and Three Wheelers, which covers 5%,
14%, 77% and 4% of the total market share of the industry respectively (Society of
Indian Automobile Manufacturers 2007).
It has been noticed that due to its strong backward and forward linkages, the
auto industry has grown in clusters of inter-connected companies, which are linked by
commonalities and complementarities (Ministry of Heavy Industries and Public
Enterprises 2006a). While automobile manufacturing units are located in all regions
of the country, there have been certain concentrations in some pockets. Following
global trends, the Indian automotive sector also has most auto suppliers located close
to the manufacturing locations of Original Equipment Manufacturers (OEMs),
forming regional automotive clusters. Broadly, the three main clusters are centered
around Chennai, Mumbai and Delhi. However, Pune is also developing as a new
cluster in the country.
The efficiency of vehicle production is closely linked to that of the supplier
base (Singh 2004). In India the auto component industry is one of the important key
sectors of the auto industry.

5
The freeing of the industry from restrictive environment has on the one hand
helped it to restructure, absorb newer technologies, align itself to the global
developments and realize its potential; on the other hand, this has significantly
increased industry‟s contribution to overall industrial growth in the economy. The
firms have resorted to common platforms, modular assemblies and systems
integration of component suppliers and e-commerce (CII-DSIR-IIFT 2004). The total
numbers of auto component companies, which are member of Automotive
Component Manufacturers Association (ACMA), are 536 at present and more than
10,000 firms in unorganized small sector, in tierized format (Ministry of Heavy
Industries and Public Enterprises 2006b). The industry is however dominated by a
few industrial business houses. The industry in the country has made rapid strides and
is growing at a fast pace, which may be summarized in the following Figure 2. The
industry has grown at an annual compound growth rate of 17% over the last few years
from 2000-01 to reach a size of around US $10 billion in 2005-06, while component
exports have grown at around 25 % per annum (IBEF 2006).
Figure 2: Size and Export of Indian Auto Component Industry
(In US $ billion)
Source: ACMA 2007
The auto component industry has the potential of becoming export driver of
the auto industry due to increasing globalization of the supply chains and cost
advantage in many component groups supported by relatively (compared to other
developing markets) well-developed labour skills and engineering base (Khisty
2000). This will help the industry to mark its global presence.
6
2.2. Evolution of Indian Automobile Industry:
The history of the automobile actually began 5,000 years ago when the first
wheel was used for transportation, probably on Mesopotamian chariots in 3200 BC
(The Great Idea Finder 2005). The dawn of automobile in India actually goes back to
4000 BC when wheel was first used for movement in India in form of chariots. Since
then it has traveled a long way, from chariots to bullock cart, to the jet-age.
It was in 1898 that the first motorcar rode down India‟s roads in Mumbai.
Mumbai had its first taxicabs in the early 1900. Then for the next many years, cars
were imported to satisfy domestic demand. Till the First World War, about 4,000 cars
were directly imported to India from foreign manufacturers (Auto India Mart 2007).
The growing demand for these cars established the underlying requirements of the
Indian auto market that these merchants were quick to pounce upon. Between 1910
and 1920 the automobile industry made a humble beginning by setting up assembly
plants in Mumbai, Calcutta and Chennai. The import/assembly of vehicles grew
consistently after the 1920s, crossing the 30,000 mark in 1930 (India Infoline 2007).
The Hindustan Motors (HM) was set up in 1942 and in 1944; Premier
Autobackmobile (PAL) was established to manufacture automobiles in India.
However, it was PAL who produced the first car in India in 1946 by assembling
'Dodge De Soto' and 'Plymouth' cars at its Kurla plant in Mumbai, as HM
concentrated on auto components and could produce their first car only in 1949. After
a short period of time, it was another company, Mahindra and Mahindra, which
manufactured sturdier utility vehicles, namely the American Jeep.
In 1950s, Government of India granted approval to only 7 car dealers to
operate in India. The1960s witnessed establishment of two and three wheeler industry
in India, and in the 1970s, things remained much the same. Since the 1980s, the
Indian car industry has seen a major resurgence with the opening up of Indian shores
to foreign manufacturers and collaborators. The 1990s became the melting point for
the industry here when large number of foreign players came into the country through
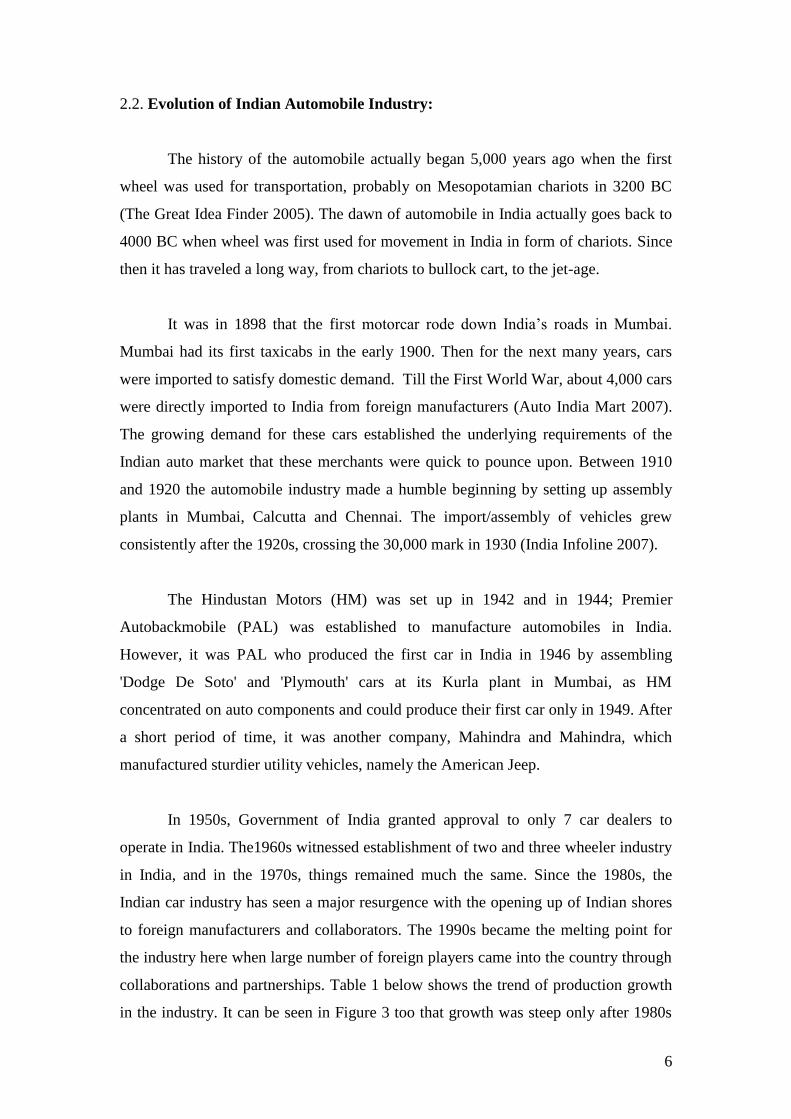
collaborations and partnerships. Table 1 below shows the trend of production growth
in the industry. It can be seen in Figure 3 too that growth was steep only after 1980s
7
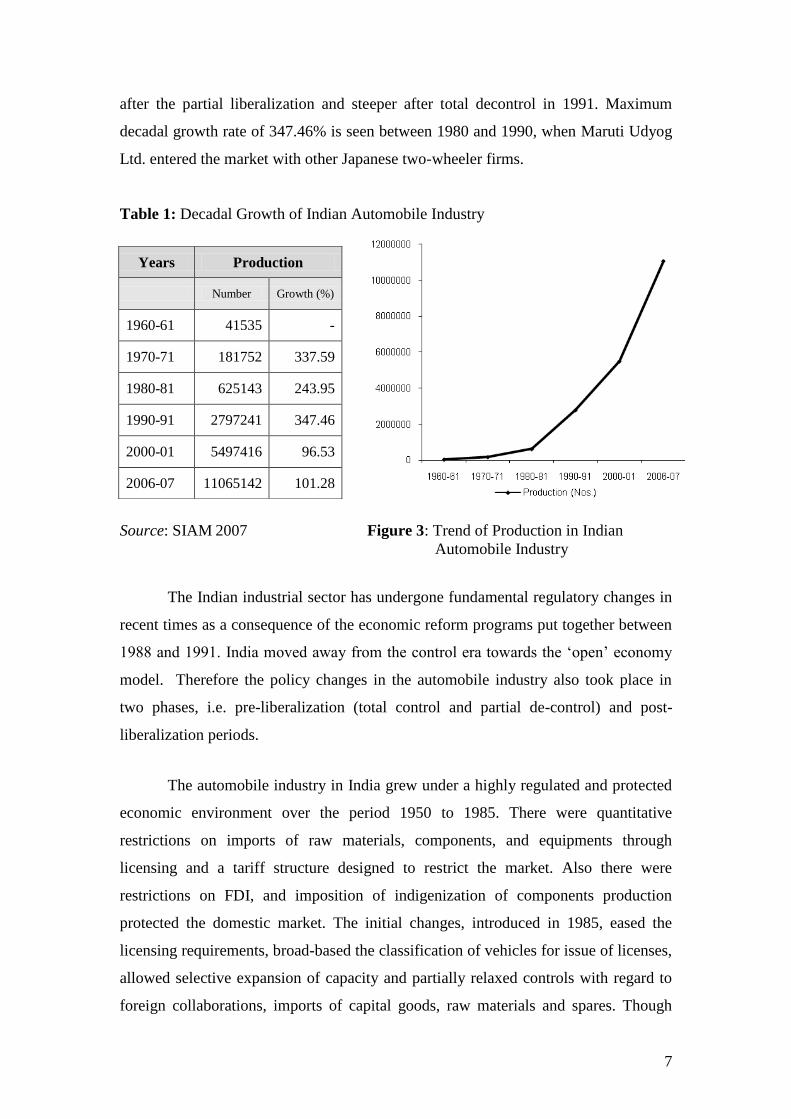
after the partial liberalization and steeper after total decontrol in 1991. Maximum
decadal growth rate of 347.46% is seen between 1980 and 1990, when Maruti Udyog
Ltd. entered the market with other Japanese two-wheeler firms.
Table 1: Decadal Growth of Indian Automobile Industry
Source: SIAM 2007 Figure 3: Trend of Production in Indian
Automobile Industry
The Indian industrial sector has undergone fundamental regulatory changes in
recent times as a consequence of the economic reform programs put together between
1988 and 1991. India moved away from the control era towards the „open‟ economy
model. Therefore the policy changes in the automobile industry also took place in
two phases, i.e. pre-liberalization (total control and partial de-control) and post-
liberalization periods.
The automobile industry in India grew under a highly regulated and protected
economic environment over the period 1950 to 1985. There were quantitative
restrictions on imports of raw materials, components, and equipments through
licensing and a tariff structure designed to restrict the market. Also there were
restrictions on FDI, and imposition of indigenization of components production
protected the domestic market. The initial changes, introduced in 1985, eased the
licensing requirements, broad-based the classification of vehicles for issue of licenses,
allowed selective expansion of capacity and partially relaxed controls with regard to
foreign collaborations, imports of capital goods, raw materials and spares. Though
Years Production
Number Growth (%)
1960-61 41535 -
1970-71 181752 337.59
1980-81 625143 243.95
1990-91 2797241 347.46
2000-01 5497416 96.53
2006-07 11065142 101.28

8
these measures represented a „domestic liberalisation‟, the policy environment
continued being geared towards imposing trade and investment regulations,
constraining the growth of big business houses and regulating exchange rates
(Narayanan 2001).
Liberalisation of economic policies and the outward orientation introduced
since 1991 brought about a dramatic change in this industry. These new measures
effectively dismantled the license raj, which had made it difficult for Indian firms to
import machinery and know-how, and had disallowed equity ownerships by foreign
firms (Krishnan 2002). In July 1991, approval of foreign technology agreements and
upto 51% foreign equity investment was allowed for the automotive sector. Further in
1997, some more reforms were made where new foreign entrants required
establishing actual production facilities, the minimum foreign equity was raised to
$50 million, and the minimum indigenization was to be 50% in the third year and
70% in the fifth year. The Auto policy announced by the government in 2002
(Ministry of Heavy Industries and Public Enterprises 2002) permitted 100% foreign
equity on an automatic basis. The Automotive Mission Plan 2006-2016 was released
in 2007, which visualizes India emerging as a destination of choice in the world for
design and manufacture of automobiles and auto components with output reaching a
level of $ 145 billion accounting for more than 10% of the GDP and providing
additional employment to 25 million people by 2016.
2.3. Current Status of the Indian Automobile Industry:
Growth trends of key industry indicators are improving every year as seen in
Table 2. Industry volumes, export performance as well as domestic sales are
increasing on a steady rate. Although there is a potential for much higher growth in
the domestic market due to the fact that the current car penetration level in India is
just 7 cars per thousand persons compared to 12 in Sri Lanka and Pakistan and over
100 in Europe and US.
Domestic manufacturers acting as a global hub for exports is also gaining
acceptance. Though exports are not necessarily lucrative, it will enable domestic

9
players to increase exposure and maintain capacity utilisation at a healthy level.
Expansion of auto component industry is also evident today.
Table 2: Growth Trends of Key Variables of the Industry
YEARS PRODUCTION DOMESTIC SALES EXPORT
Number Growth (%) Number Growth (%) Number Growth (%)
2001-02 5316302 - 5225788 - 184680 -
2002-03 6279967 18.13 5941535 13.70 307308 66.40
2003-04 7243564 15.34 6810537 14.63 479919 56.17
2004-05 8467853 16.90 7897629 15.96 629544 31.18
2005-06 9743503 15.06 8906428 12.77 806222 28.06
2006-07 11065142 13.56 10109037 13.50 1011278 25.43
Source: SIAM 2007
Consolidation of the industry has gained momentum. Foreign automotive
firms have arrived and are in queue. There is a long list of foreign companies that are
forging alliances with their Indian counterparts. Corporate participation in these
alliances varies from 10 to 100 percent of equities (i.e. wholly owned foreign
subsidiaries) (Nath 2006). India is becoming an important destination for automobile
research and development as it is fully equipped to take up design, engineering and
components manufacture. Armed with higher buying power and an ever-increasing
expectation from products and services, the customer is undoubtedly the king and has
propelled a fierce competition among the major players in the market.
The following trends can be seen in the various segments of the industry
today. In case of commercial vehicles, the importance of large-tonnage multi-axle
vehicles and light commercial vehicles is on the rise and likely to increase further on
account of superior economies in transportation they offer. The dominant basis of
competition in the Indian car industry has changed from price to price-value,
especially in the passenger car segment. The market for multi-utility vehicles has also
been redefined. The recent years have witnessed a robust growth in motorcycle sales
and a decline in the share of scooters in the overall Indian two-wheelers market hence
a demand shift.

10
3. THE METHODOLOGY:
There are numerous methodological choices encountered in the problem of
construction of composite indices, which can measure competitiveness at any level of
aggregation. The technique used for construction of competitiveness index for Indian
automobile industry at the firm level has been discussed below.
3.1. Competitiveness Index:
One of the immediate problems in analyzing competitiveness is that despite
widespread acceptance of its importance for economic performance and growth, no
consensus exists on its definition and measurement. The Oxford Dictionary of
Economics defines the term competitiveness as „the ability to compete in markets for
goods or services‟ and The Free Dictionary explains it as „an aggressive willingness
to compete‟. These are the most fundamental definitions of competitiveness, although
are deceptive ignoring the ambiguity of the concept.
There are several interpretations to the concept of competitiveness for which
some distinctions have to be made. The most fundamental being the difference
between microeconomic and macroeconomic concepts. Competitiveness can be
observed from different perspectives, through products, firms, industry and branches
of the economy or national economies. At each level of aggregation, there are
different measures or indicators of competitiveness. The second issue relating to
competitiveness is the distinction between one-dimensional and multi-dimensional
concepts, relating to the number of dimensions it integrates and measures. The
number of dimensions included in its measurement can be seen as a mark of
complexity of the concept (Siggel 2003). We are mainly concerned with the firm-
level multidimensional concept of competitiveness in the domestic market.
One of the interesting attempts to capture more than one dimension of firm
competitiveness was made by Buckley et al. (1988). According to him, “a firm is
competitive if it can produce products and services of superior quality and at lower
costs than its domestic and international competitors. Competitiveness is synonymous
with a firm's long-run profit performance and its ability to compensate its employees

11
and provide superior returns to its owners”. Of the micro indicators assessing the
multi-dimensionality of the concept of competitiveness, the best known attempt was
made by Porter (1990) in his „Diamond Framework‟. He identified four main
determinants of competitiveness of enterprises as their strategy, structure and rivalry,
the demand conditions they face, the factor supply conditions they encounter, and the
conditions of related industries. Although there are a multitude of factors that
influence the competitiveness of firms, Porter classified those under four above-
mentioned facets only.
Gelei (2003) has used the definition of firm competitiveness as „the basic
capability of perceiving changes in both the external and internal environment and the
capability of adapting to these changes in a way that the profit flow generated
guarantees the long term operation of the firm‟. As to him, firm competitiveness is
basically a function of two factors. First, it is determined by the extent a company can
identify those value dimensions that are important for their customers. These are the
main features of the firm‟s complex product and service package a customer expects.
The second factor of firm competitiveness is the sum of resources and capabilities that
make a firm capable to create and deliver the identified important value dimensions
for the customer. Prahalad and Hamel (1990) call these core competences.
A White Paper on competitiveness by the UK Government (Department of
Trade and Industry 1994) offers a multi-notion definition at the company level, which
says, „for a firm, competitiveness is the ability to produce the right goods and services
of the right quality, at the right price, at the right time. It means meeting customers‟
needs more efficiently and more effectively than other firms‟.
Another significant discussion on the concept of competitiveness of firms was
published by ADB (2003). It states that competitiveness can be defined as a firm‟s
ability to survive under competition and being competitive implies succeeding in an
environment where firms try to stay ahead of each other by reducing prices, by
increasing the quality of their current products and services, and by creating new
ones. A firm‟s competitiveness can thus be examined as a function of factors such as
(i) its own resources (ii) its market power; (iii) its behavior toward rivals and other
economic agents; (iv) its capability to adapt to changing circumstances; (v) its

12
capability to create new markets; and (vi) the institutional environment, largely
provided by the government, including physical infrastructure and the quality of
government policies.
As competitiveness is linked to a large number of variables, defining it is in
itself a research problem. So is measuring competitiveness, it being a broad, relative
concept without bearing any direct relationship with economic performance
indicators. The multi-dimensionality in the definition of competitiveness has made the
construction of a composite index, which can measure it in some mathematical
fashion, very important. Keeping this in mind, an effort has been made to build up a
competitiveness composite index that can measure a firm‟s competitive position in the
industry which it can sustain in medium to long run.
A composite indicator is the mathematical combination of individual
indicators that represent different dimensions of a concept whose description is the
objective of the analysis (Saisana 2002). Composite index represents aggregate
measures of a combination of complex phenomena (Booysen 2002). Composite
indicators can be used to summarise complex or multidimensional issues, in view of
supporting decision-makers (Saisana 2005). In the context of policy analysis,
indicators are useful in identifying trends and drawing attention to particular issues.
They can also be helpful in benchmarking or monitoring performance.
3.2. Data- Coverage and Adjustments:
Variables are included in an index if they are relevant to the concept that is
being measured (Salzman 2003). The variables that compose the competitiveness
composite index for Indian auto industry have been identified on the basis of factors
related to competitiveness at the firm level, considering the specific issues peculiar to
the Indian automobile industry.
Total number of sub-indicators used for the competitiveness index are 62 out
of which 38 (61%) are taken from PROWESS database of Centre for Monitoring
Indian Economy (CMIE) and 24 (39%) from other data sources. Other data sources
include a questionnaire survey, which was carried out for all sample firms. Some of
13
the other sources used for preparing the database are company websites, SIAM and
ACMA websites and other publications.
For consumer satisfaction index, J. D. Power scores of Consumer Satisfaction
Index (J.D. Power Asia Pacific 2007) have been used because of non-availability of
data. The two sub-indicators for which this substitute has been used are number of
customer complaints in a year and customer complaint response time. Industry
averages are used for those firms not included in the J. D. Power study. One of the
sub-indicators used for technological index, is environmental indicator, which
includes total emissions from plants, product disposal expenditure and environmental
management expenditure. Due to lack of response from the sample firms, we used
Centre for Science and Environment (CSE) scores of Green Rating Project (CSE
2001), which include similar indicators.
The sub-indicators, which are used to construct the competitiveness index of
the firm, are listed in Table 3. All of these sub-indicators are grouped into ten main
indicators that clearly describe its components.
3.3. Sample Selection:
The sample of firms has been chosen on the basis of market share data given
by SIAM (2007) for the year 2005-06. Efforts have been made to include a
representative sample, which covers at least 85% of the market share in each of the
segment of the industry.
Other important consideration was availability of data. As about 61% of the
data has been taken from Prowess Database, listing of companies on the portal
become very important. This forced the exclusion of some firms not listed on National
Stock Exchange (NSE) and hence on the database, even with greater market share
than others. The companies of this sort in passenger car segment are Toyota Kirloskar
Motor Pvt. Ltd. (4.05%), General Motors India Ltd. (2.70%) and Ford India Pvt. Ltd.
(2.53%). However, Honda Seil Motors and Hyundai Motors are two companies,
which are also not listed on NSE, but still they are on PROWESS hence included in
the study. Piaggio Vehicles with 30.26% of market share in three-wheeler segment

14
had to be excluded from sample because of non-availability of data. In the two-
wheeler segment Honda Motorcycle & Scooter (7.97%) and Yamaha Motor India Pvt.
Ltd. (2.91%) are also excluded from the study. The details of the sample and their
respective market share are given in Table 4.
Table 3: Description of the Sub-indicators in the Competitiveness Index
for Indian Automobile Industry
INDICATORS SUB- INDICATORS
1. PRODUCTIVE
PERFORMANCE
o Capacity Utilization
o Labour Productivity
2. FINANCIAL PERFORMANCE Liquidity Ratio:
o Current Ratio
o Quick Ratio
Leverage Ratio:
o Debt-Equity Ratio
o Interest Coverage Ratio
Efficiency Ratio:
o Inventory Management
o Debtors Turnover Ratio
Profitability Ratio:
o Net Margin Ratio
o Return on Assets Ratio
o Return on Net Worth (ROE)
o Return on Capital Employed (ROCE)
Other Ratios:
o Net Working Capital Cycle
o Solvency Ratio
o Asset Turnover Ratio
3. COST EFFECTIVENESS o Cost As % of Gross Sales
Other Cost Indicators:
o Raw Materials, Stores etc.
o Financial Charges
4. SALES AND MARKETING
STRATEGY
o Market Share
o Department for Brand Management
o Number of Dealers
o Expenditure on Marketing
o Expenditure on Advertising
o Expenditure on Distribution
5. STOCK MARKET
PERFORMANCE
o Earnings Per Share
o Price- Earning Ratio
o Book Value Per Share
6. CONSUMER SATISFACTION o Number of Years of Warranty
o Number of Authorized Service Stations or
Workshops
o Average Number of Free Servicing to the Vehicle
o Customer Complaint Response Time
o Number of Customer Complaints

15
7. TECHNOLOGY AND
ENVIRONMENTAL
INDICATORS
Technology Acquisition:
o Technology Strategy: Import or In-House
Development
o Foreign Exchange Spending on Capital Goods
o Royalty know how expenses
o R & D Expenditure
Technology Management:
o Expansion of Production Base to other Segments
o Number of Production Plants
o Product Differentiation
o Power and Fuel Expenses
o Alternative Fuel Models
Environmental Indicators:
o Total Emissions
o Product Disposal Expenditure
o Environmental Management Expenditure
8. HUMAN RESOURCE
DEVELOPMENTAND
SOCIAL INDICATORS
o Employment Generation
o Expenditure on Salaries and Wages as % of Total
Cost
o Performance Incentives to Employees
o Skill Enhancing Training
o Certification to Plants (Health And Safety)
o Safety Awareness Training
o Loss Due to Labour Unrest
9. FOREIGN TRADE MEASURE o Net Foreign Exchange Earned
o Exports as % of Gross Sales
10. GROWTH VARIABLES AND
POTENTIAL
Growth Variables (over previous year):
o Total Assets
o PAT (NNRT)
o Net Sales
o Total Exports
Future Plans:
o Firm‟s Investment Plans over the Next 2 Years
o Plans to Launch any New Models in Next 2 Years
Contingency Planning:
o Insurance Premium Expenses
o Any Department for Disaster Management
o Maintenance- Plant and Machinery Repairs
Expenditure
3.4. Normalizing Technique, Weighting and Aggregation of Indicators:
Normalisation is required prior to any data aggregation to render them
comparable as the indicators in a raw data often have different characteristics.
Therefore this has to be transformed in pure, dimensionless numbers. For this, number
of normalisation methods can be used (Freudenberg 2003; Jacobs 2004).

16
Table 4: Market Share of Sample Firms in Automobile Industry in 2005-06
FIRM MARKET SHARE (%)
Passenger Vehicle Segment
1. Maruti Udyog Ltd 46.11
2. Tata Motors Ltd 16.52
3. Hyundai Motor India Ltd 13.91
4. Mahindra & Mahindra 7.35
5. Honda Siel Cars India Ltd 3.74
Total Market Share 87.63
Commercial Vehicle Segment
Tata Motors Ltd 62.04
6. Ashok Leyland Ltd 27.00
7. Eicher Motors Ltd 7.44
8. Swaraj Mazda Ltd 3.03
Total Market Share 99.51
Three Wheeler Segment
9. Bajaj Auto Ltd 49.11
Mahindra & Mahindra 6.23
10. Force Motors Ltd 5.72
11. Scooters India 4.22
Total Market Share 65.28
Two Wheeler Segment
12. Hero Honda Motors Ltd 41.24
Bajaj Auto Ltd 26.29
13. TVS Motor Company Ltd 17.90
14. Kinetic Motor Co Ltd 1.08
Total Market Share 86.51
Source: SIAM 2007
The normalisation method used should take into account the data properties, as
well as the objectives of the study (Giovannini 2005). Considering this we used Range
Equalisation Method where variables are re-scaled between 0 to 100 with the help of
equation 1. This requires points of reference relative to which indicators can be
scaled. A minimum and a maximum value are identified for each of the variables.
Subtracting the minimum value of the particular variable from its actual value and
dividing it by the difference between the selected maximum and minimum values
determine the values of the indicators. Then we multiplied this value of the indicators
by 100, so that it ranges between 0 (worst performer) and 100 (best performer). This
method of re-scaling the data widens the range of indicators, which makes the
differences more distinct.
100
ValueMinimumValueMaximum
ValueMinimumValueActualionNormalisat ………….…. (1)

17
Different factors of competitiveness have different impact on the
competitiveness index, both negative and positive. For this reverse of the value i.e.
„100- value‟ of the index is taken, which solves the issue of directionality.
For benchmarking, weights can have a significant effect on the overall
composite index and the rankings. Different weights may be assigned to indicators to
reflect their economic significance, statistical adequacy, cyclical conformity, speed of
available of data, etc. A number of weighting techniques are available of which some
are derived from statistical models, such as factor analysis, data envelopment analysis
and unobserved components models or from participatory methods like budget
allocation, analytic hierarchy processes and conjoint analysis.
The statistical methods could not be used for the purpose as most of them are
based on the correlations between the indicators. Correlations do not necessarily
represent the real influence of the sub-indicators on the phenomenon being measured
(Nardo et al. 2005). Also there must be sufficiently large size of the sample to use
most popular methods such as factor analysis and principal component analysis.
Considering the nature of the problem budget allocation method for weighting
has been used. Budget allocation is a participatory method in which experts are given
a „budget‟ of N points, to be distributed over a number of sub-indicators, „paying‟
more for those indicators whose importance they want to stress. In this experts‟
opinions are likely to increase the legitimacy of the composite and create a forum of
discussion around which to form a consensus for policy action (Nardo et al. 2005).
In the present study, the ten broad categories of indicators were listed in the
questionnaires itself so that experts in the field could assign weights to them out of
100 as per their relative importance in the competitiveness of the firm. This reduced
the subjectivity in the index as officials already working in the industry have clear
insight into the problem of competitiveness. The weights then were averaged across
the sample firms. However, for sub-indicators, equal weights have been used as
asking relative importance of 62 sub-indicators to the officials of the firm was not
possible due to their unwillingness as it involved too much time.

18
Table 5: Weights of the Indicators
INDICATORS AVERAGE WEIGHT
1. Productive Performance 14
2. Financial Performance 12
3. Cost Effectiveness 7
4. Sales and Marketing Strategy 12
5. Stock Market Performance 4
6. Consumer Satisfaction 14
7. Technological and Environmental Factors 11
8. Human Resource Development and Social Indicators 10
9. Foreign trade: Export and Import 8
10. Growth Performance and Potential 8
Total 100
After weight allocation to each component index, these scores are aggregated
into a composite score. The aggregation of indices tends to be of either an additive or
a functional nature (Booysen, 2002). The most widespread method of linear
aggregation is used in the index construction where the mere summation of weighted
and normalised indicators is done.
The aggregate index for each of the ten indicators is derived first using
relevant variables (sub-indicators). The formula used for this is given below:
n
i
ii xn 1
1V ………………………………………… (2)
where, Vi is ith
indicator, xi is the ith
sub-indicator , n is the number of sub-indicators
within the indicators.
The next step is of aggregating these ten indicator indices into one
competitiveness index for a firm in the automobile industry. This is done in the same
manner as in equation 2.
n
i
n
ij
Wi
WiVi
C
1
1 ………………………………………... (3)
where, Cj is the competitiveness index of jth
firm, Wi is weight of the ith
indicator, Vi
is ith
indicator ( i=1 to 10) and n is the number of indicators.
Then the ten indicators are grouped in two groups namely Financial and Non-
financial Indicators and constructed both the indices for the purpose of analysis. We

19
have also averaged the scores of the sample firms to benchmark the average
competitiveness in the industry.
4. RESULTS AND ANALYSIS:
Industry average score of competitiveness index has been calculated at 40.98,
which is used to analyse the competitive performance of firms above and below it. It
is hence used to benchmark the firms‟ competitive standings in the industry. Seven
firms from the sample of fourteen firms i.e. 50% of the total sample size, show
performance above industry average and remaining seven are below this average. The
firms that showed better performance comprise from all the segments of the industry.
Out of these seven, 4 of them namely Maruti Udyog Ltd., Tata Motors Ltd., Hyundai
Motor India Ltd. and Mahindra & Mahindra Ltd. manufactured passenger vehicles in
2005-06. Firms like Bajaj Auto Ltd., Hero Honda Motors Ltd. and TVS Motors Ltd.
produces two-wheeler vehicles, whereas Bajaj Auto Ltd. and Mahindra & Mahindra
Ltd. also manufacture three-wheeler vehicles. Of course Tata Motors Ltd. is the only
firm, which manufactures commercial vehicles also. This indicates the competition in
passenger vehicle segment and in two-wheeler segment is relatively more intense.
The firms, which recorded performance below industry average, are mainly
from commercial vehicles such as Ashok Leyland Ltd., Eicher Motors Ltd. and
Swaraj Mazda Ltd. Honda Siel Cars India Ltd. is the only passenger vehicle producer
that is below industry average during 2005-06. Force Motors Ltd. and Scooters India
Ltd. are three-wheeler manufacturers below industry average and Kinetic Motors Co.
Ltd. is the only two-wheeler producer below industry average in the ranking of
competitiveness index during 2005-06.
4.1. Competitiveness of the Firm:
In the overall competitiveness rankings, Maruti Udyog Limited comes first
with 64.06 score. This result is largely due to its position in the productive
performance and consumer satisfaction indicator. The good competitive position it
enjoys in productive performance is because of its highest capacity utilization and
labour productivity in the automobile industry. In case of consumer satisfaction it

20
holds the highest position in the industry. However the company‟s performance in
foreign trade is scored very low and is on 12th
position in the list of sample firms.
This is mainly because of its negative net foreign exchange earnings due to high
imports (mainly of components). The percentage of exports in total sales basket is
also very low at only 3.85% where the highest is 27.32%. In all the other indicators, it
has performed above average of the industry.
Table 6: Overall Rankings and Scores of Automobile Firms
COMPANY RANK SCORE
Maruti Udyog Ltd. 1 64.06
Bajaj Auto Ltd. 2 57.52
Hero Honda Motors Ltd. 3 54.89
Tata Motors Ltd. 4 48.80
Hyundai Motor India Ltd. 5 47.77
Mahindra & Mahindra Ltd. 6 46.44
T V S Motor Co. Ltd. 7 43.67
Industry Average 40.98
Ashok Leyland Ltd. 8 39.21
Honda Siel Cars India Ltd. 9 33.55
Eicher Motors Ltd. 10 31.03
Force Motors Ltd. 11 29.32
Scooters India Ltd. 12 28.42
Swaraj Mazda Ltd. 13 28.14
Kinetic Motors Co. Ltd. 14 20.97
Figure 4: Scores of Automobile Firms in Competitiveness Index

21
Table 7: Scores and Ranks of the Firms for Indicators
Firm
Productive
Performance
Financial
Performance
Cost
Effective-
ness
Sales and
Marketing
Strategy
Stock
Market
Performance
Consumer
Satisfaction
Technology
and
Environmen-
tal Indicators
Human
Resource
Development
Foreign
Trade
Measure
Growth
Variable
and
Potential
Score Rank Score Rank Score Rank Score Rank Score Rank Score Rank Score Rank Score Rank Score Rank Score Rank
Maruti Udyog
Ltd. 14.00 1 7.97 3 6.44 3 5.41 6 2.17 2 11.38 1 4.28 3 6.88 5 0.55 12 4.97 4
Bajaj Auto Ltd. 1.61 13 8.93 1 6.38 4 7.52 1 3.38 1 6.82 3 3.20 7 7.55 3 6.34 1 5.78 1
Hero Honda
Motors Ltd. 6.59 2 8.63 2 6.90 1 6.93 2 1.81 6 8.85 2 4.05 4 5.42 9 1.75 11 3.96 7
Tata Motors
Ltd. 3.01 6 5.32 11 5.74 6 6.03 4 1.98 3 3.92 6 5.25 1 7.33 4 4.91 3 5.30 2
Hyundai Motor
India Ltd. 3.96 5 7.04 4 5.76 5 4.54 8 0.85 10 3.87 7 3.64 6 7.72 2 5.89 2 4.51 5
Mahindra &
Mahindra Ltd. 4.01 4 5.73 10 6.54 2 6.23 3 1.86 5 3.41 8 3.85 5 6.32 6 3.35 5 5.14 3
T V S Motor
Co. Ltd. 2.17 12 5.72 11 5.27 8 5.76 5 1.94 4 5.07 5 2.91 8 8.56 1 2.88 7 3.38 10
Ashok Leyland
Ltd. 2.72 8 6.54 7 5.04 9 3.68 10 1.17 9 1.52 13 4.80 2 6.30 7 3.55 4 3.89 8
Honda Siel
Cars India Ltd. 2.44 8 6.88 5 5.71 7 0.72 14 0.85 10 5.18 4 2.25 10 5.53 8 0.42 13 3.56 9
Eicher Motors
Ltd. 2.35 11 5.79 9 4.22 12 5.13 7 1.73 7 3.04 11 1.17 12 2.10 13 3.19 6 2.31 11
Force Motors
Ltd. 0.04 14 5.09 12 4.55 11 4.20 9 0.57 11 3.05 10 2.33 9 3.05 11 2.14 10 4.30 6
Scooters India
Ltd. 2.73 7 6.56 6 5.29 8 1.97 13 0.57 11 3.05 10 0.46 14 3.40 10 2.34 9 2.06 12
Swaraj Mazda
Ltd. 4.62 3 6.21 8 3.87 13 2.07 12 1.47 8 2.13 12 1.57 11 1.80 14 2.68 8 1.72 13
Kinetic Motors
Co. Ltd. 2.40 10 2.96 13 0.80 14 3.05 11 0.51 12 3.35 9 1.01 13 2.49 12 2.68 8 1.72 13
Industry
Average 3.76 - 6.38 - 5.18 - 4.52 - 1.49 - 4.62 - 2.91 - 5.20 - 3.05 - 3.76 -
Note: Shaded scores of firms indicate above industry average performance in that particular indicato

22
Bajaj Auto Limited is at the second position in the competitiveness index and
1st in the financial index as it gets 8.93 score there. It can be noted here that this
company has 1st ranks in five indicators; still it has got second ranking in the overall
index mainly because of poor performance in productivity where it stands 13th
. The
difference in the total productivity score is very wide where Maruti Udyog has got 14
and Bajaj Auto gets only 1.61 score due to its low capacity utilization of 56% and low
labour productivity, which is only 0.74 as compared to 3.61 in case of Maruti Udyog.
Low foreign exchange spending on technology acquisition, R & D expenditure and
royalty know-how expenses has led the company to 7th
ranking in technological
indicators too, further pulling down the total score.
The difference of total score between Hero Honda and Bajaj Auto is only of
about 2 points (both two-wheelers); hence performance wise the company is doing
well as it stands at number 3 position. The company holds 1st position in cost
effectiveness as it has lowest cost component in its gross sales. Also raw materials etc
and financial charges are the lowest. Human resource, growth variables and foreign
trade measure have pulled it down to this position although it is 2nd
in other 4 sub-
indicators such as productive and financial performance, sales and marketing strategy
and customer satisfaction.
The overall score of Tata Motors is 48.80 on the basis of technology; the
company tops the list mainly because of highest R&D expenditure and good product
differentiation, as it caters to two segments in the industry namely passenger vehicles
and commercial vehicles. In terms of growth, the company performs well, as sales and
profits both showed good growth and also their plans to launch new models in future.
However, the company‟s performance in other indicators is average and exceptionally
poor in financial indicators such as liquidity ratios and interest coverage ratio.
In the list of competitive performance, 5th
, 6th
and 7th
positions are held by
Hyundai, Mahindra & Mahindra and TVS Motors, with very little difference in their
total scores. Nevertheless, strength of Hyundai is its second highest rank in human
resource and foreign trade indicator with 27.32% of export in total sales. But it lags

23
behind in the stock market performance as is not listed on NSE and hence its score is
zero for the indicator. Mahindra & Mahindra is doing well in cost effectiveness and
sales and marketing strategy whereas financial performance is relatively very poor.
Human resource performance is strongest for TVS Motor Co. Limited where it is
ranked first, which is offset by poor productive and financial performance.
All the firms discussed above in terms of their competitive performance in
various indicators are above the industry average and hence showing good
competitive behavior. The remaining other firms, which are below the industry
average, are discussed below.
Ashok Leyland, Honda Siel Cars India and Eicher Motors are 8th
, 9th
and 10th
in the list of competitive rankings getting 39.21, 33.55 and 31.03 scores respectively.
All are very close with each other although Ashok Leyland is exceptionally good in
technological indicators and average in other indicators. Honda Siel‟s strength seems
to be consumer satisfaction where it has 3rd
position but because of poor performance
in sales and foreign trade the overall score is very low. Whereas, Eicher Motors has
below average performance in all the indicators of competitiveness.
Firms such as Force Motors, Scooter India and Swaraj Mazda are on the 11th
,
12th
, and 13th
rankings respectively in the list of index of competitiveness being very
close in scoring except Kinetic Motors, which is 14th
with very low score. Scooters
India at 11th
has done above average performance in financial and productive
variables. Swaraj Mazda is ranked 3rd
in productive performance because of 99%
capacity utilization. Kinetic Motors has consistently been in the last two in four
indicators, only doing better in foreign trade measure as net foreign exchange
earnings has positive value. In case of other indicators, all these four firms show
below industry average performance.
If we divide the industry in segments then it can be seen that the two-wheeler
segment and three-wheeler segments is dominated by Bajaj Auto as it is the most
competitive as reflected by its high scores. The passenger vehicle segment is
obviously ruled by Maruti Udyog whereas the commercial vehicles segment is
dominated by Tata Motors.

24
The pattern of difference of scores can be observed from the overall index of
all the sample firms. It is seen that maximum difference is between the 13th
and 14th
positions i.e. Swaraj Mazda and Kinetic Motors (7.17) which shows exceptional
relatively poor performance of the later in terms of competitiveness. Next is the
difference between Maruti Udyog and Bajaj Auto (6.54) showing the dominance of
the former on the automobile industry. The gap between Hero Honda and Tata motors
(6.09) is also large, which is followed by Ashok Leyland and Honda Seil (5.65). All
the other firms are very close in competitive scores, which show close competition
among them.
4.2. Financial and Non-Financial Indices:
Competitiveness is concerned with the ability of firms to perform better than
rivals, where performance is dependent on both financial and non-financial conditions
of the firm. For the purpose of analysis, competitiveness index has been divided into
financial index and non-financial index. The objective is to ascertain which of the two
indices has more effect on the overall competitiveness index of a firm.
For the purpose financial indicators such as different financial ratios, cost
effectiveness, stock market performance and foreign trade indicators are grouped
under financial index and other indicators such as productive performance, sales and
marketing strategy, consumer satisfaction, technological issues, human resource and
growth variables are grouped under non-financial indicators. The former has 31% of
the total weights whereas the later gets remaining 69%. Importance to non-financial
factors is given visibly more by the industry experts in the survey of sample firms
(Table 5). Using the weighted average of the sub-indicator indices, financial and non-
financial indices are constructed.
It can be seen that although Maruti Udyog stands first in non- financial index,
it is on sixth position in financial index reflecting its weakness in four of the financial
indicators such as foreign trade and financial ratios (Table 8). It is way ahead of all
other firms in non-financial indicators as reflected by the score of the index. It can
hence be said that the company can dominate the industry completely if it tries to

25
improve its financial performance. This is the only firm from the sample firms whose
non-financial performance is superior to financial performance (Figure 5).
However, opposite is the case with Bajaj Auto as it has highest score in
financial and is third highest in non- financial index. It has ranked 1st in all of the
financial indicators except in cost effectiveness where it stands 4th
. But the company
has got 3rd
highest rank in non-financial performance because of its relatively poor
performance in productivity and technological indicators.
Performance of Hero Honda is marginally better in non-financial than in
financial index. However, Tata Motors and Mahindra & Mahindra are the two
firms, which have same ranks in both the indices, but the performance of Tata Motors
is much superior to Mahindra & Mahindra because Tata Motors could maintain the
same rank in overall index but Mahindra & Mahindra went down by one rank i.e.
from 5th
to 6th
(Table 8). Hyundai despite of being very strong in financial
performance has lagged behind due to weakness in non-financial index. There is very
marginal unevenness in the comparative position of other firms, which has altered
Table 8: Comparison of Rankings in Financial and Non-financial Indicators
FIRM OVERALL
INDEX
FINANCIAL
INDEX
NON-
FINANCIAL
INDEX
Score Rank Score Rank Score Rank
Maruti Udyog Ltd. 64.06 1 55.27 6 68.00 1
Bajaj Auto Ltd. 57.52 2 80.75 1 47.08 3
Hero Honda Motors Ltd. 54.89 3 61.59 3 51.88 2
Tata Motors Ltd. 48.80 4 57.92 4 44.70 4
Hyundai Motor India Ltd. 47.77 5 63.02 2 40.92 6
Mahindra & Mahindra Ltd. 46.44 6 56.38 5 41.97 5
T V S Motor Co. Ltd. 43.71 7 51.03 8 40.36 7
Ashok Leyland Ltd. 39.21 8 52.59 7 33.20 8
Honda Siel Cars India Ltd. 33.55 9 44.70 12 28.55 9
Eicher Motors Ltd. 31.03 10 48.16 9 23.34 11
Force Motors Ltd. 29.32 11 39.80 13 24.61 10
Scooters India Ltd. 28.42 12 47.61 10 19.80 14
Swaraj Mazda Ltd. 28.14 13 45.90 11 20.16 13
Kinetic Motors Co. Ltd. 20.97 14 22.41 14 20.32 12

26
Figure 5: Comparison of Financial and Non-financial Indices
their overall rankings in the competitive index. However, exceptions to this are Honda
Seil and Eicher Motors who have inter-changed their positions in the two indices.
Kinetic Motors although has poor performance in both the indices, its relative
weakness is much higher in financial than in non-financial index.
5. CONCLUSION:
The efforts have been made to build up an index that reflects the
competitiveness of firms in the Indian automobile industry. In the process an attempt
has also been made to study the current status and evolution of the industry. A
composite competitiveness index is defined as the mathematical combination of
individual indicators that represent different dimensions of the concept whose
description is the objective of the analysis.
The finding of the study reflects the relative competitive position of the
sample firms and also the overall picture of the industry. Out of fourteen sample
firms, performance of seven firms was above the industry average. Maruti Udyog
Limited scored highest in the group getting top most ranking mainly because of non-
financial indicators such as productive performance, customer satisfaction etc. This is
followed by Bajaj Auto, which has scored second rank due to better financial

27
performance in terms of stock market performance, financial ratios and foreign trade.
Looking at the financial and non-financial index separately, it is seen that the rankings
differ slightly as some firms perform better in one than the other.
It is also observed that out of first seven firms, only two are from three-
wheeler segment. This shows that competition is more intense in the passenger
vehicle and two-wheeler segments. The commercial vehicle segment seems to be
dominated by Tata Motors.
It can be hoped that the overall index, sub-indicator index and financial/ non-
financial index prove to be helpful in framing competitive policies by the firms. It will
also be useful to consumers to judge the competitive performance of these firms from
the product quality and investment point of view.
REFERENCES
1. Asian Development Bank (2003), Asian Development Outlook, Competitiveness
in Developing Asia: Taking Advantage of Globalization, Technology, and
Competition in Part 3, Manila.
http://www.adb.org/Documents/Books/ADO/2003/part3.asp
2. Automotive Component Manufacturers Association (2007), Engine of Growth
Driving the Indian Manufacturing Sector, Status Report of Indian Automotive
Component Industry.
3. Booysen, Frederik (2002), An Overview and Evaluation of Composite Indices of
Development, Social Indicators Research 59, pp. 115–151.
4. Buckley, Peter J., Christopher L. Pass, and Kate Prescott (1988), Measures of
International Competitiveness: A Critical Survey, Journal of Marketing
Management 4 (2).
5. Centre for Science and Environment (2001), Mileage: Environmental Rating of
Indian Automobile Sector, Green Rating Project, New Delhi.
6. CII-DSIR-IIFT (2004), Technology Financing for SMEs, A Survey Report on
Auto Component SMEs, CII, DSIR and IIFT, New Delhi.
7. Department of Trade and Industry (1994), Competitiveness, White Paper, Cm
2563, London, HMSO.

28
8. Freudenberg, M. (2003), Composite Indicators of Country Performance: A
Critical Assessment, Directorate for Science, Technology and Industry, Working
Paper 2003/16, Organization for Economic Cooperation and Development
(OECD), Paris.
9. Gelei, Andrea (2003), Competitiveness: A Match between Value Drivers and
Competencies In The Hungarian Automotive Supply Chain, Budapest University
of Economic Sciences and Public Administration, Hungary.
10. Giovannini, E. et al. (2005), Handbook on Constructing Composite Indicators:
Methodology and User Guide, OECD Statistics Working Paper, STD/DOC
(2005)3, OECD Publishing. Paris, France.
11. Gooroochurn, Nishaal and Guntur Sugiyarto (2004), Measuring Competitiveness
in the Travel and Tourism Industry, Discussion Paper 7, Tourism and Travel
Research Institute, Nottingham University, U. K.
12. India Brand Equity Foundation (2006), Automotive, Report by KPMG for IBEF,
Gurgaon.
13. Jacobs, Rowena, Peter Smith and Maria Goddard (2004), Measuring
Performance: An Examination of Composite Performance Indicators, Technical
Paper Series 29, Centre for Health Economics, University of York, United
Kingdom.
14. J. D. Power Asia Pacific (2007), India Customer Satisfaction Index (CSI) Study,
Press Release, J.D. Power and Associates, McGraw-Hill Companies, Singapore.
15. Khisty, Vasant (2000), Globalization and Competitiveness of Indian Auto
Component Industry, Associated with RAHA - World Independent Writers' Home
in Exile, World News, Kabul Press.
16. Krishnan, Viswanathan (2002), Indian Automotive Industry: Opportunities and
Challenges Posed by Recent Developments, IMV Publication No. 0104a,
International Motor Vehicle Program at the Massachusetts Institute of
Technology, Cambridge.
17. Ministry of Heavy Industries and Public Enterprises (2006a), Automotive Mission
Plan 2006-2016, Government of India, New Delhi.
18. Ministry of Heavy Industries and Public Enterprises (2006b), Automotive
Industry, Eleventh Five Year Plan (2007-2012), Report of Working Group,
Department of Heavy Industry, Government of India, New Delhi.
19. Ministry of Heavy Industries and Public Enterprises (2002), Auto Policy 2002,
Department of Heavy Industry, Government of India, New Delhi.

29
20. Narayanan, K. (2001), Liberalisation and the Differential Conduct and
Performance of Firms: A Study of the Indian Automobile Sector, Discussion Paper
Series- A No. 414, The Institute of Economic Research, Hitotsubashi University
and United Nations University Institute of Advanced Studies, Japan.
21. Nardo, Michela, Michaela Saisana, Andrea Saltelli & Stefano Tarantola (2005),
Tools for Composite Indicators Building, EUR 21682 EN, Institute for the
Protection and Security of the Citizen, JRC, Ispra, Italy.
22. Nath, Aditya (2006), India: The Next Automobile Giant, Business Performance
Consulting, CGN & Associates Inc.
23. Porter, M. E. (1990), The Competitive Advantage of Nations. New York: Free
Press.
24. Prahalad, C. K. and G. Hamel (1990), The Core Competence of the Corporation,
Harvard Business Review, Vol. 68, No.3, pp.79-81.
25. Saisana, Michaela (2005), State-of-the-Art Report on Composite Indicators for the
Knowledge-based Economy, Work-package 5, KEI-project, European
Commission: Joint Research Centre, Ispra, Italy.
26. Saisana, M. and S. Tarantola, (2002), State-of-the-art Report on Current
Methodologies and Practices for Composite Indicator Development, EUR 20408
EN, Institute for the Protection and Security of the Citizen, JRC Ispra, Italy.
27. Salzman, J. (2003), Methodological Choices Encountered in the Construction of
Composite Indices of Economic and Social Well-Being, mimeo, Center for the
Study of Living Standards, Ontario.
28. Siggel, Eckhard (2003), Concepts and Measurements of Competitiveness and
Comparative Advantage: Towards an Integrated Approach, paper prepared for the
International Industrial Organization Conference at Northeastern University,
Boston, Massachusetts.
29. Singh, Neelam (2004), Strategic Approach to Strengthening the International
Competitiveness in Knowledge Based Industries: The Case of Indian Automotive
Industry, RIS Discussion Paper Series No. 82, Research and Information System
for the Non-Aligned and Other Developing Countries, New Delhi.
30. Society of Indian Automobile Manufacturers (2007), Market Share Analysis
Report, Report VII, SOP 11-F-09/01, New Delhi.
31. Society of Indian Automobile Manufacturers (2004), Automobile Industry:
Advantage India Indian Automobile Industry – An Agenda for Global Leadership,
Speech by Mukesh D. Ambani, Annual Convention, New Delhi.

30
WEBSITES:
ACMA (2007), Retrieved on 08-09-2007 from
http://acmainfo.com/docmgr/Status_of_Auto_Industry/Status_Indian_Auto_Industry.
Auto India Mart (2007), Retrieved on 21-09-2007 from
http://auto.indiamart.com/index.html
India Infoline (2003), Automobile- Cars, Sector Report, retrieved on 01-09-2007 from
http://www.indiainfoline.com/sect/atca/ch01.html
SIAM (2007), Industry Statistics, Market Share, retrieved on 01-10-2007 from
http://www.siamindia.com/scripts/market-share.aspx
The Great Idea Finder (2005), Wheel, Retrieved on 22-09-2007 from
http://www.ideafinder.com/history/inventions/wheel