Embed Size (px)
Citation preview
DEPARTMENT OF ECONOMICS
Working Paper
UNIVERSITY OF MASSACHUSETTS AMHERST
UMass Amherst Economics Papers
No Employment without Participation: An Evaluation of India's Employment
Program in Eastern Uttar Pradesh
Kartik Misra
Working Paper 2019-13
No Employment without Participation: An Evaluation of India's Employment Program in Eastern Uttar Pradesh
Kartik Misra1
Abstract
The Mahatma Gandhi National Rural Employment Guarantee Act (NREGA) provides 100 days of employment in a year to every rural household at the legal minimum wage. At the national level this programme has been highly successful in providing an income safety-net to small peasants and landless workers. However, in the poorer states of Uttar Pradesh, Bihar and Jharkhand the provision of public employment under NREGA has been inadequate. Using evidence from field research in the Mirzapur district of Uttar Pradesh, this paper aims to study how awareness among programme beneficiaries about their legal entitlements and at various levels of government determines the provision of NREGA employment in one of the poorest regions of the country. Further, we discuss the impact of NREGA on agricultural productivity and wage bargaining by landless workers who are the intended beneficiaries of NREGA. Our findings suggest that patron-client exchanges between the local elite and NREGA beneficiaries determines the provision of public employment and generates rents for the local elite. Therefore, there is urgent need for increasing transparency in NREGA provision and creating mechanisms to hold elected representatives and government functionaries accountable to NREGA beneficiaries.
1 Department of Economics, University of Massachusetts, Amherst, MA 01002. [email protected] I thank Deepankar Basu, Lynnette Leidy Sievert and Uttara Balakrishnan for their comments and suggestions. I thank Amit Kumar Singh the Chief Development Officer of Mirzapur, Vivek Kumar, Sandeep Srivastava and Manoj Sharma for logistical support. Finally, I thank Manish Tiwari, Awadhraj Singh, Anurag Srivastava, Shailendra Maurya, Shatrughan Dubey and Vinay Dubey for help with data collection. This research was funded by a research fellowship from the American Institute of India Studies and the Department of Economics, University of Massachusetts Amherst.
1
1. INTRODUCTION
The Mahatma Gandhi National Rural Employment Guarantee Act (NREGA) is the largest rural
welfare program in the world. Enacted in India in 2005, this scheme guarantees 100 days of
employment in a year to every rural household at the legal minimum wage. The Act was
operational in the 200 poorest districts by February 2006, another 130 districts got the scheme in
the second phase in April 2007 and finally by 2008, the entire country was under its ambit. This
legal work entitlement impacts close to 50 million households in India and is thus a powerful tool
for social and economic transformation. Through its joint emphasis on social protection and
livelihood security, the scheme endeavours to empower the rural poor by instilling a new sense of
identity and bargaining power and make economic growth inclusive for all in rural India. However,
lack of transparency in its implementation and awareness of legal entitlements of workers has
diluted the demand-driven nature of the program. Using primary data collected from the Halia
block of Mirzapur district in Uttar Pradesh, this paper documents the extent of awareness of legal
entitlements by program beneficiaries and government officials responsible for its implementation
in one of the poorest regions of the country. Further, we discuss the impact of NREGA on
agricultural productivity and wage bargaining by landless workers who are the intended
beneficiaries of NREGA. Our study suggests that patron-client exchanges between the local elite
and NREGA beneficiaries determines the provision of public employment and generates rents for
the local elite.
Public workfare programs have enjoyed a long and distinguished presence in the experience of
economic development around the world and their potential benefits depend on their ability to
create income safety-nets for the poor.2 This program improves upon earlier employment schemes
in two ways. First, it employs workers directly and prohibits the hiring of private contractors as
there is a long history of private contractors exploiting workers through underpayment and other
forms of harassment (Ambasta et al., 2008). Second, public works under NREGA do not use labour
displacing technology in order to maximize employment generation under NREGA. NREGA is a
demand driven program based on the principle of self-selection (Dutta et al., 2012). It treats
employment as a legal right and if the state is unable to provide employment for participants then
2 India has a long history with these programs since the 1960s. Schemes like Jawahar Rozgar Yojana, Employment Assurance Scheme, Food for Work Program, Jawahar Gram Samridhi Yojana, and Sampoorna Grameen Rozgar Yojana were forerunners to NREGA. Subbarao (1997) provides an overview of India’s employment guarantee programs.
2
it is obliged to pay workers without work. Public employment generated through NREGA is meant
to generate productive assets that increase agricultural productivity and provide livelihood
security. These include works aimed at natural resource management like irrigation works and
afforestation. Moreover, public works can also be aimed to specifically improve the productivity
of agricultural land owned by the scheduled castes, scheduled tribes and other disadvantaged
sections of society. Finally, labour can also be employed to build rural infrastructure like toilets,
roads and food grain storage structures (Dreze et al., 2006).
In 2018, NREGA completed a decade of being in operation throughout the country. Several
academic studies and newspaper editorials were written to analyse each aspect of this historic
legislation. Evidence suggests that public works leading to capital formation in agriculture have
three potential effects on welfare (i) The direct effect of job creation for those employed (Klonner
and Oldiges, 2014), (ii) public employment in the lean season of agriculture raise wages (Azam,
2011); and (iii) creation of public goods which increase agricultural productivity (Berg et al.,
2012). There is evidence that NREGA has increased agricultural wages by around 4.3 percent
(Berg et al., 2018) which caused a 20-percentage point shift away from use of labour-intensive
technologies by small farmers (Bhargava, 2014) and resulted in crowing-out of private agricultural
labour by 5 percentage points in regions where NREGA employment is not rationed (Misra, 2019).
Additionally, Imbert and Papp (2015) show that the increase in wages for households in the poorest
30 percent of the population accounts for around 31 percent of the total welfare gains from the
program. Correspondingly, others have argued that public works under NREGA contributed to
increasing the productivity of agriculture which contributed to the non-transfer benefits of the
programme (Deininger and Liu, 2013; Abreu et al., 2014).
In practice, NREGA suffers from several problems like reduced budgetary allocation, corruption,
violation of people's entitlements and insufficient employment generation (Aggarwal, 2016).
Further, the implementation and performance of NREGA varies considerably across states and
districts. While states like Andhra Pradesh, Chhattisgarh, Himachal Pradesh, Madhya Pradesh,
Rajasthan and Tamil Nadu have successfully created more than 100 days of employment under
the program (Imbert and Papp, 2015), other states like Jharkhand and Bihar have lagged in the
provision of NREGA employment under the program (Dutta et al., 2012; Bhatia and Dreze, 2006).
Existing studies have identified limited administrative capacities, low awareness of the program
among beneficiaries (Ravallion et al., 2015), insufficient financial allocation for NREGA
3
(Banerjee and Saha, 2010), and corruption by bureaucrats (Adhikari and Bhatia, 2010) and private
contractors (Bhagat, 2012) to explain poor performance of the program in certain states. Misra
(2019) finds that local political economy factors like historical inequality in landownership and
concentration of political power determines the provision of NREGA employment and its labour
market impact.
In the state of Uttar Pradesh (UP), existing literature documents that the provision of NREGA has
been inadequate. Dutta et al., (2012) show that in 2009-10 over 54 percent of the households in
UP that demanded work under NREGA were not provided public employment guaranteed under
the Act. Paradoxically, the same study found that the demand for NREGA work in UP is also low.
Only around 35 percent of rural households officially demanded employment under NREGA when
the national average was around 45 percent. This is surprising since UP has the highest proportion
of the population below the poverty line in comparison to any state in the country. This lack of
demand for NREGA suggests that workers may not be fully aware of their rights to demand public
employment which is NREGA's unique feature.
National level studies on the functioning of NREGA conceals considerable regional heterogeneity
in the implementation of the programme and few field-based studies have focussed on local
political economy factors in the provision of NREGA, particularly in eastern Uttar Pradesh. This
research aims to fill this lacuna in the existing literature. This paper aims to study how awareness
among beneficiaries about their legal entitlements and at various levels of government determine
the functioning of NREGA in one of the poorest regions of the country where NREGA has been
operational since its inception in 2006. High incidence of poverty, prevalence of bonded labour in
agriculture and high Maoist insurgency, were the main motivations in choosing the Halia block of
Mirzapur district in Uttar Pradesh (UP) as the main setting for this study. We conducted in-depth
household level surveys with NREGA beneficiaries and semi-structured interviews with
government officials in 12 Gram Panchayats of Halia block.
This study contributes to the existing literature on the functioning of NREGA in three critical ways.
First, this paper is the first to interview government officials at the state, district and block-level
responsible for the planning and implementation of the scheme to understand the bottlenecks in
NREGA implementation on the supply side. Using semi-structured interviews from government
functionaries, this paper discusses how and why the actual execution of NREGA diverges
4
significantly from the provisions of the Act. This allows us to understand various processes
associated with the program based on information on the flow of finances, data entry processes
and the role of block and district level development officers in supporting the endeavours of the
Gram Panchayats.
Second, using primary household level data, we analyse bottlenecks on the demand side by
recording people's perceptions about NREGA implementation and the role of various stakeholders
to assess their awareness of various provisions of the Act. Finally, this paper analyses the impact
of NREGA on agricultural production, and labour supply of NREGA beneficiaries in the region to
ascertain whether NREGA income allows farmers to change their production decisions.
There are four major findings from this study. On the supply side, first, our findings suggest that
even though NREGA has been India’s flagship poverty alleviation program for more than a
decade, government functionaries at the state and local level have little awareness of their
responsibilities and administrative capacity to ensure smooth functioning of NREGA at the grass-
roots level. Additionally, official records of the number of employment days created, wages paid
under the programme differ significantly from those reported by workers. Second, in the surveyed
villages all decision-making authority was concentrated with the elected head of the village
assembly (Pradhan). This concentration of power creates patron-client relationships of exchange
between the Pradhan and workers which generates rents for the former and safeguards his class
interests.
On the demand side, we find that first, around 60 percent of NREGA workers in our sample were
not aware of the provisions of the scheme and their role in demanding employment under NREGA
and participating in its implementation and planning at the local level. Further, contrary to
evidence from states like Rajasthan and Andhra Pradesh where workers’ participation and social
audits create transparency and predictability in NREGA implementation, our surveys find that
citizens are excluded from the planning process and the role of the village assembly is totally
irrelevant in the provision of NREGA. Second, the provision of NREGA in this region is not
enough to increase agricultural productivity and consequently, its impact on agricultural wage
bargaining is limited. This is contrary to national level analysis which finds that NREGA has a
positive impact on agricultural productivity and wages (Berg et al., 2012; Berg et al., 2018). This
difference is caused primarily by the erratic and unpredictable nature of NREGA employment in
5
Mirzapur has not resulted in productive assets being created in the region and consequently,
NREGA has had no impact on agricultural productivity in this region.
The rest of this paper is organised as follows. Section 2 presents an overview of the survey region
and discusses the sampling process and methodology of data collection used in this study. Section
3 presents the findings of our interviews with government officials and shows how processes
necessary to increase workers' participation in NREGA functioning are not followed. Section 4
analyses the findings of our household surveys of NREGA beneficiaries and section 5 reports the
findings from our focus-group discussions on how NREGA is impacting agricultural productivity
and labour demand. Section 6 argues that lack of awareness among NREGA beneficiaries serves
the vital purpose of protecting the interests of the local elite and finally section 7 concludes with
some policy implications of this study.
2. CHOICE OF DISTRICT AND DATA COLLECTION
This study was conducted in the Halia block of Mirzapur district in eastern Uttar Pradesh.3 Lack
of proper implementation and embezzlement of NREGA funds in the region has attracted
considerable media attention and has been the subject of a high-level official inquiry (PTI, 2014).4
In this context, there are two main motivations for documenting the functioning of NREGA in this
region.
First, this region is characterized by the presence of the kol community which is one of the most-
backward communities of the country and is forced to work in tied-labour arrangements in
agriculture. Following the pioneering work of Srinivas and Marriot (1995), several researchers
have analysed the role of caste identity in determining people's access to public goods, their ability
to engage profitably in trade and to raise capital through collateral (Banerjee and Somanathan,
2007; Anderson, 2011; Verma, 1991; Dreze et al., 1999). Rural wages and the incidence of poverty
differ along gender, caste and religious lines. Social stratification along caste and gender lines can
reduce certain groups' access to NREGA, who remain impoverished in regions where these
inequalities are more pronounced. In this context, analysing the kol community become crucial
given their extreme social and economic exclusion. The second motivation for choosing Halia
3 Blocks or tehsils are administrative sub-division of a district created for rural development. Halia is one of the 12 administrative blocks of Mirzapur. 4 For instance, Singh (2009) records instances of corruption and other problems with NREGA implementation in the region.
6
block was that this region is affected by Maoist movements. While there is some literature which
examines the impact of NREGA on the Maoists, granular, block level evidence is scarce.
We conduced informal discussions with several state and district level officials and undertook
household level surveys of NREGA participants between November 2016 and March 2017. This
section presents an overview of the survey district and presents our sampling and data collection
strategy.
2.1 Mirzapur
Mirzapur located in the eastern part of Uttar Pradesh (UP), is one of the poorest 200 districts of
the country and among the fifteen poorest districts of UP (Haq, 2017).5 This district was covered
under NREGA in the first phase in 2006. It is a predominantly rural district with 86 percent of its
total population of around 2.5 million residing in rural areas. Over 65 percent of the total labour
force is employed in agriculture.6
Selected demographic indicators are given below in Table 1. The proportion of marginalized
communities, particularly Scheduled Castes is 28 percent in Mirzapur while the state-level average
is 23 percent. Socially backward communities like SCs and STs are over-represented in NREGA
participation as the incidence of poverty is higher for these groups.7 Correspondingly we find that
5 percent of our sample of NREGA beneficiaries comprises of STs, when their share in district-
level population is only 0.7 percent. Further, literacy rates among these groups (56 percent for SCs
and 57 percent for STs) are also lower than the state average of (60 percent for SCs and 64 percent
for STs). We next discuss the kol community and the Maoist movements in this region.
[INSERT TABLE 1 HERE]
2.1.1 Kols
In addition to widespread poverty and higher incidence of marginalized communities, Halia district
is also home to the kol community. The kols are a tribal community of Central India who live
primarily in the states of Uttar Pradesh, Bihar, Jharkhand, Madhya Pradesh, Maharashtra and
Tripura. This community is classified as Scheduled Tribes (ST) in all states except UP where they
5 In the 2003 ranking of districts by poverty, Mirzapur was ranked 180 out of the 447 backward districts of the country (Planning Commission, 2005). 6 This includes the percentage of cultivators and agricultural wage workers. 7 For instance, in 2011, 45 percent of the Scheduled Tribes living in rural India were below the poverty line in comparison to only 15 percent of those belonging to the upper castes.
7
are classified as Scheduled Castes (SC). According to the Census of India, (2011) the total
population of the community is estimated at 1.7 million, of which around 300 thousand kols live
in eastern UP.8
The kols like most tribal adivasi groups of the country, have traditionally depended on forest
produce for subsistence. The kols of Central India have been among the most disadvantaged groups
in the country and their development indicators have lagged other tribal communities. For instance,
in a study of body-mass index (BMI) of adult males in Central India, Adak et al., (2006) find that
over 51 percent of the kols in the region suffered from severe to mild chronic energy deficiency.
In the three decades following India's independence in 1947, these groups have been dispossessed
of their lands and denied access to forests under various developmental paradigms. These groups
have been displaced and rendered homeless for the construction of large dams and industrial
townships (Guha, 2007). This process of dispossession of adivasis accelerated under the neoliberal
policies followed by the Indian state since the 1990s. Verma (2016) shows that till 1990s, 40
percent of all displaced social groups were adivasis and policies of involuntary land transfer for
setting-up of Special Economic Zones (SEZs) increased the dispossession of this group
significantly. Further, this group has suffered violent atrocities and human rights violations by the
police and other agencies as they organize resistance movements against land grab attempts by the
state (Baviskar, 2003).
The kols of southern UP work primarily as wage workers in agriculture and in quarry mining
industries. Most kol households either do not own agricultural land or own uneven, rocky or less-
productive land.9 They dwell in stone or katchcha houses without basic amenities like electricity,
clean water, toilets or access to health care (Rashid, 2013). Srinivasan et al., (2005) find that the
kols of Halia block in Mirzapur are among the few communities where bonded labour in
agriculture has continued unabated. These tied-labour arrangements among kols represent inter-
linked factor markets characterized by debt-bondage where workers are forced to work for large
agricultural landlords (often over generations) in order to service a short debt or loan taken from
their employers.
8 Madhya Pradesh has around 900 thousand kol population which is the highest in the country. 9 A full account of struggles for kol landownership can be found here.
8
In a detailed study of bonded workers in Halia block of Mirzapur, Shankar (1996) finds that
workers traditionally take a small loan in order to meet the expenses of a marriage or funeral
(shradh) and are forced to pledge their labour to the landlord who does not charge interest on the
loan. Further, workers are paid using food-grains.10 In addition, this labour-tying arrangement also
involves a component of share cropping. The kol workers are given a small plot of land (0.06 ha)
for subsistence farming and the landlords claims a share of the produce based on the credit and
inputs like seeds and fertilizers supplied by them in the production process.
2.1.2 Maoist movements in the region
In addition to bonded labour, the Halia block of Mirzapur is also affected by armed left-wing
Maoist movements by virtue of being situated at the border of Madhya Pradesh and Uttar Pradesh.
Socio-economic exclusion and high incidence of poverty has contributed to these struggles in the
region. Borooah (2008) finds that the probability of a district being affected by extremist
movements is increasing in poverty and decreasing in literacy.
While 41 percent of UP's population is below the poverty-line, Mirzapur has a higher concentration
of poverty. Using the 2004, National Sample Survey (Consumption Expenditure Survey) we find
that the poverty rate in Mirzapur is around 53 percent. High levels of poverty coupled with Maoist
insurgencies has contributed to the listing of the district among 170 extremely backward districts
and among the 55 extremist affected districts of the country (Planning Commission, 2005).11 While
there is some evidence of NREGA has succeeded in creating an income safety-net for people and
improved their participation in anti-Maoist operations (Khanna and Zimmerman, 2017), therefore,
it is important to assess the impact of the programme in this region as such local level evidence is
scarce.
2.2 Sampling and Data Collection
This paper presents the findings of a field study conducted in the Halia block of Mirzapur district.
There are two components of the study. First, we document the district and block-level
administrative processes involved in the provision of NREGA and second, we discuss the gaps in
10 The wages in kind are mostly given in kodo which is an inferior rain-fed crop (Shankar, 1996). 11 See Kumar et al., (2015) for details of the Maoist movement in eastern Uttar Pradesh.
9
implementation and the extent of awareness workers have of the rights of workers under the
program. Correspondingly, we collect data from government officials and NREGA beneficiaries.
2.2.1 Administrative Data Collection
This paper is the first to document the experiences of officials involved in the ground level
implementation of NREGA. Between August - November of 2017, we conducted several rounds
of semi-structured interviews with officials involved in NREGA implementation at the state,
district and block levels. At the state level, we discussed the role of the state government in the
implementation of NREGA with officials of the Ministry of Rural Development in the state capital
of Lucknow. At the district level, we interviewed the office of the Chief Development officer
(CDO) of Mirzapur to document the procedure of data entry, funds transfer and recording un-met
demand for NREGA work at the district level. Finally, at the block level we interviewed the office
of the Block Development Officer (BDO) to assess the administrative capacity at the block level
for NREGA provision and supervision in the Halia block of Mirzapur.
2.2.2 Household Survey Data
In order to understand the impediments to NREGA participation and timely wage payment in one
of the most backward regions of the country we conduced household level surveys of NREGA
beneficiaries in 12 Gram Panchayats of Halia block from November 2017 - February 2018. The
NREGA web portal provides detailed information about NREGA workers at the village level
including the number of days and names of projects in which NREGA beneficiaries have worked.
Using the work records for the year 2017 from the NREGA web-portal, we randomly selected
around 1100 households for our study. Of these, we were able to trace around 973 households who
were surveyed for this study.12
Our surveys included both quantitative and qualitative questions about household characteristics
and assets, indebtedness profiles of household members and their sources of income including
agricultural and non-agricultural earnings. Further, we asked beneficiaries about their participation
in and awareness of the provisions of NREGA. These included detailed questions about the number
12 Most villages had a population less than 2,000 people and settlements were organized along caste lines. Therefore, it was easy to identify and survey individuals from these households. In many cases we were informed that some individuals on our list had migrated out of the village a few years ago or were deceased. The inability of our team to locate around 120 households may indicate the presence of fudging of muster-rolls documented in existing studies like Adhikari and Bhatia (2010). However, we are unable to ascertain whether these were indeed instances of `ghost-workers' and suggest the need for future research on this issue.
10
of days they worked under NREGA, wages paid and conditions of work. Additionally, we recorded
people's perceptions and experiences of negotiating with the Pradhans or BDO for their
entitlements under NREGA. Table 2 provides the break-up of sample households by their caste
and Gram Panchayat (GP). Fuliyari and Gaurava are the largest GPs in the sample and they
collectively contribute to around 40 percent of the sample. While, all GPs in the sample are affected
by Maoist activity, the villages of Fuliyari, Parshiakala, Deohyat, Khutha and Gaurava are right
at the border of Madhya Pradesh are more prone to insurgent activities. These household level
surveys were conducted in respondents’ homes, so they feel comfortable in answering questions
about NREGA wages received and their perceptions about the role of their elected representatives
and government officials.
[INSERT TABLE 2 HERE]
2.2.3 Focus Group Discussions
In addition, we also conducted two focus group discussions asking people about the impact of
NREGA on agricultural productivity, incomes and employment opportunities. These focus group
discussions were held in the villages of Halia and Fuliyari where around 10-15 cultivators and
agricultural wage workers were asked to discuss whether NREGA was having any spill over
impact in agriculture. In several villages we were invited by the Pradhan for a meeting to discuss
the functioning of NREGA and the problems faced by them. However, this would have interfered
with our findings, so we decided to not meet with the Pradhan’s.13
2.2.4 Summary Statistics
We present summary statistics for our sample in Table 3. We see most NREGA beneficiaries were
below the poverty line and lived in katchcha houses without access to clean drinking water and
toilets. The respondents of all social groups relied primarily on public distribution of food at
subsidized rates for rations. Most households had solar energy panels installed on their roofs which
generally powered one LCD lamp and a mobile charging plug point for around ten hours in a day.
These solar panels were installed under government programs where beneficiaries had to pay only
10 percent of the total cost. Further, most households had few durable assets other than bicycle
13 In some cases, the Pradhan’s offered to arrange for surveys to be conducted in his house but we rejected these offers.
11
and mobile phones. In most cases, the mobile phones were used primarily by men and women did
not report owning mobiles.
[INSERT TABLE 3 HERE]
3. SUPPLY-SIDE CONSTRAINTS IN NREGA IMPLEMENTATION
As the survey of existing studies in Section 1 showed, there was surprisingly little awareness about
NREGA’s provisions and worker entitlements among our respondents. Existing research on the
implementation of NREGA has focused primarily on improving the transparency of the village
assemblies (Gram Panchayats) through social audits (Kumar and Shah, 2015) and capacity
building and greater monitoring (Aiyar and Samji, 2006). Other studies have discussed the role of
caste and gender affiliations of elected representatives (Johnson, 2009) and funds utilization and
state-level capacity for proper implementation of NREGA (Chakraborty, 2007). However, few
studies have focused on the bureaucratic capacity and opaque information flow within the
administrative set-up created to oversee the provision of NREGA, particularly in the poorer
states.14
The implementation of NREGA rests on the coordinated and timely functioning of the state,
district and local governments. Himanshu (2013) outlines the responsibilities of each of these
institutions in the planning, provision of public employment and wage payments under the
program. This scheme is largely financed by the Central government but under Section 32 of the
NREGA Act, the responsibility of implementing it is vested with state and local government or
the Gram Panchayats (Mookherjee, 2014). In this section, we discuss that lack of awareness of
workers' rights and the duties of elected representatives and government functionaries under
NREGA contributes to the formation of client-patron exchanges between workers and the local
elite and corruption in the provision of NREGA. We discuss the role played by each level of
government in Mirzapur district of eastern Uttar Pradesh.
3.1 Role of the State Government
At the state-level the major constraint faced in the state NREGA secretariat is the lack of adequate
number of officials to implement the various administrative duties. Most employees are contractual
14 Notable exceptions include Raabe et al., (2010) who conduct an analysis of NREGA implementation using case studies in Bihar and Aiyar and Samji (2009) who study the role the state government of Andhra Pradesh in the implementation of NREGA.
12
data-entry staff with high turnaround rates. The administration was also unaware of its role in
appointing district level officials like the Employment Guarantee Assistant (Gram Rozgar
Sahayak) and the Program Officer (PO). We were told that these officials were determined at the
district level and the state authority does not interfere with local decisions.
State level NREGA operations in UP do not have any programs to increase awareness of NREGA
provisions among beneficiaries. Not only is this in violation of the responsibilities of the state
government, but also contributes to the lack of information about participant rights and
entitlements that we found in our field study. Further, under the NREGA Act state governments
are expected to engage professional agencies for technical support to improve the quality of data
collected under the program. This aspect of the scheme is also neglected. This disjoint between
the ‘perceived’ and ‘practiced’ responsibility of the state government was also witnessed in the
case of social audits. NREGA Act requires state governments to establish competent agencies to
conduct social audits of NREGA functioning and asset creation. However, state-level officials
contested this claim and stated that financial audits are conducted by the Central government and
local bodies like the Panchayats decide to inspect public works completed under NREGA.
Finally, officials were reluctant to answer any questions. Most officials maintained that there was
no delay in releasing funds from the State Employment Fund (SEF) to districts or the submission
of district-wise utilization certificates to the Central government. In fact, any instance of
insufficient or delayed fund transfer was blamed on delays in data entry. While there was general
acknowledgement of the fact that funds were inadequate to pay workers on time, officials were
not willing to explain these deficiencies.15 Therefore, the state level administrative set-up in UP
does not adequately fulfil its obligations under the NREGA Act, reflecting poor implementation
of the program at the state level. We next turn to district level implementation.
3.2 Role of the District Level Officials
The Chief Development Officer (CDO) is the main district level officer responsible for smooth
functioning of NREGA. Through our meetings with the CDO and his staff, we found the CDO
conducted bi-weekly meetings with all BDOs to tackle the bottlenecks associated with NREGA.
Further, the CDO had a team of around five contractual staff dedicated to data entry and
15 Public officials may be wary of pointing to the role of the state government in delaying or mismanagement of NREGA finances. However, our study could not ascertain these issues in detail.
13
maintaining records. However, on inspecting the records, we found that the lists of projects and
information about works completed were not updated for the past six months. Further, according
to the records maintained by the CDO, all workers under NREGA were paid full wages on time.
However, when we cross-checked these entries with the workers, we found that official records
about the number of days worked and wages paid differed considerably from those reported by the
workers. The data entry staff at the CDO's office showed us that his records match those supplied
by the block level officials but there was no provision for workers to verify their records. In
addition, contrary to the provisions of the Act the CDO does not inspect or monitor the public
works completed under NREGA which is under the purview of the Block Development Officer
(BDO). We next turn to block level implementation.
3.3 Role of the Block Level Officials
Successful implementation of NREGA depends critically on block level officers discharging their
duties in a transparent manner. However, it was at this level that we found that procedures were
most opaque and diverged from the rules considerably. For instance, there was no Program Officer
(PO) to oversee the implementation of NREGA. The PO is the main authority who accepts
applications for NREGA work, scrutinizes proposals and creates NREGA employment. In the
absence of the PO, NREGA provision and transparency mechanisms within the Act are diluted.
For instance, there are no direct employment requests made to block level officials and monitoring
of NREGA works is seldom undertaken. When asked about social audits, we were told that there
was never a request for these audits from the Gram Panchayats. Further, NREGA muster rolls were
created by contractual data entry staff and suffered from delays due to electricity shortage and
computer malfunctions.
The BDO himself primarily works out of another district and seldom visits the block. Therefore,
information about NREGA responsibilities was limited in the Halia block administration office.
We were told that the office simply compiles the lists of number of workdays generated under
NREGA based on the information provided by the Pradhan. However, the officials at the BDO's
office denied any corruption and leakages in NREGA funds transfer claiming that all payments
were directly made by the state-government into the bank or post-office accounts of NREGA
workers.

14
Further, we were told citizens have never approached the BDO for any NREGA related issue.
Correspondingly, the officials at the BDO's office believed that NREGA was working well in their
block in comparison to the neighbouring block. Given the lack of demands for accountability, it is
not surprising that the provision of NREGA in the block is well below the national average and
suffers from wage delays and other shortcomings. We next discuss implementation of NREGA at
the Gram Panchayat level.
4. STAGE-WISE FUNCTIONING OF NREGA
This section breaks down NREGA participation into different stages to discuss potential
challenges to its successful implementation. We discuss five main stages: (1) application for public
employment under NREGA, (2) provision of public employment and wage payment, (3)
supporting facilities at work sites, (4) asset creation under NREGA, and (5) presence of an efficient
grievance redressal mechanism.
4.1 Applying for NREGA works
In order to ensure that the demand driven nature of the program is maintained, the application for
NREGA employment involves two steps. First, households who anticipate working under NREGA
must register with the Gram Panchayat (GP) which issues a job card to all applicants with a five-
year validity (Dreze, Dey, and Khera, 2006). Second, any household with a valid job-card can
request NREGA employment by submitting an oral or written application to either the Gram
Panchayat or the NREGA program officer. We discuss these two steps in detail below.
Step 1: Job Cards
Our survey revealed that close to 90 percent of the respondents had NREGA job cards issued by
the GP. Most respondents (close to 95 percent) claimed that the Pradhan helped them in getting a
job-card. Panel A of Table 4 shows that there is little inter-caste variation in the proportion of
households with a valid job card. However, this percentage is significantly lower for Muslim
households (76 percent).
While most households had a valid job card, none of the job cards had any entry of the work done
in the last six-months. In addition, in four villages (around 30 percent) of the sample, the job cards
for the entire village were kept with the Pradhan’s and not the individual households. When we
15
asked the respondents to show us the job-cards, in most cases they could retrieve them from the
Pradhan's house. In these cases, the respondents stated that job cards were always kept with the
Pradhan and they had never questioned this practice.
Step 2: Requesting NREGA Employment
Around 70 percent households in our sample had never placed a formal request (oral or written)
for NREGA employment either to the BDO or the Pradhan. Some people had informally asked
the Pradhan for NREGA work but received no acknowledgement for this request. Most
respondents were unaware of their role in demanding employment under NREGA. It was believed
that NREGA works would begin only when the Pradhan desires. In fact, over 50 percent of the
respondents believed that NREGA works are undertaken in the village because the Pradhan
wanted to help them during the lean season of agriculture. This demonstrates that in practice, the
promise of demand driven employment guarantee is diluted as workers are unaware of the legal
provisions of the Act. This also explains why official records of NREGA works in the region do
not show any unfulfilled work demand during any time.16 Since people do not request the provision
of public employment, there is no mechanism to record how much work people want under
NREGA. Existing research suggests there is a wide gap between the demand and actual provision
of NREGA in regions where NREGA is not functioning properly (Dutta et al., (2014); Misra
(2019)). However, our findings suggest that this gap may be even higher as there is no procedure
to record the actual demand for NREGA employment by the beneficiaries. When we asked our
respondents how many days in a year would they like to work under NREGA, the majority
answered that they would like to work under NREGA for as much as possible. Surprisingly, 60
percent of the respondents were unaware of their legal entitlement of 100 days of NREGA
employment per household.
16 According to the data processing staff at the office of the Central Development Officer (CDO) there is no unfulfilled demand for NREGA is the district. According to the NREGA website, there are a few cases of unfulfilled work demand from the previous years. We were told that this is a actually a data entry problem and does not signify any unmet work demand under NREGA.

16
4.2 Provision of NREGA employment and Wage Payment
4.2.1 Provision of NREGA employment
The next step after the issuance of job cards and putting in a request for public employment is the
provision of public employment. Results from our survey show that both, participation rates
(extensive margin) and number of days worked (intensive margin) are low in our sample.
Participation rate of marginalized communities
Female participation in NREGA at 18 percent in UP is among the worst in the country as the
national average in 2012 was around 47 percent (Mann and Pande, 2012). Our study shows that
only 12 percent of the women worked under NREGA. This is particularly alarming since 33
percent of public employment created under the scheme is reserved for women.17 Our findings are
consistent with existing studies which argue that women’s participation in NREGA depends on
factors like presence of alternative employment for men (Desai, 2018). Since, our survey region is
one of the most backward districts of the country, employment opportunities for men are few and
correspondingly, they predominantly work under NREGA in the lean season of agriculture.
However, further research is needed to identify household-level impediments to women’s
participation in NREGA.18
Number of days worked by marginalized communities
The actual provision of NREGA in the region does not correspond to demand. In 2016, workers
reported working under NREGA for an average of 29 days. The number of days worked were
roughly equal for men and women (29 and 28 respectively). Panel B of Table 4 shows that
marginalized communities (SCs, STs OBCs and kols) reported working for more than 31 days in
a year while upper castes and Muslims worked for around 25 days. Low participation by Muslims
may be attributed to high rates of inter-seasonal migration by household members (62 percent) in
comparison to other social groups (35 percent).
17 Several studies have found that NREGA has had a positive impact on female labour force participation nationally (Azam, 2011) and political engagement in local decision-making (Girard, 2014). Tsaneva and Balakrishnan (2018) find that in the first year of the program, women living in districts where NREGA was implemented were less likely to experience depression symptoms as the program provided them economic security and independence. 18 Several studies like Folbre (1986) discuss intra-household decision-making where the head of the household, dictates his preferences over economic choices of other family members.
17
However, higher participation by marginalized communities suggests that NREGA serves as an
income safety-net for the poorer sections of society. Several studies using national and field level
data have concluded that NREGA is mostly availed by the poor and participation by people from
the top consumption quintile is merely 10 percent which means that the scheme is ‘not poorly
targeted’ (Sabhiki, 2012).19 This is borne out by other studies as well. Using field data from Andhra
Pradesh, Karnataka, Rajasthan and Maharashtra collected in 2010, studies show that small and
marginal farmers mainly benefited from NREGA except in distress prone districts of Anantpur
and Yavatmal where larger farmers also participated and gained from NREGA (Kareemulla et al.,
2010).
Differential provision of employment by socio-economic status
While the actual provision of NREGA was low in our sample, surprisingly, we found no evidence
of any discrimination in people's participation based on gender, religion or caste of the household.
In addition, none of the respondents reported having paid any bribes to help secure NREGA work
or wages. In 76 percent household’s public employment was primarily performed by men while in
others, both men and women participated in NREGA.
Mismatch between actual provision and reported provision
The number of workdays reported by respondents differed significantly from the official records
on the NREGA website. For instance, the average number of workdays according to the records
was only 25. Our findings suggest that there is significant discrepancy in official records of
NREGA employment. Panel B of Table 4 shows considerable inter-caste variation in the
difference between the official record and the actual number of days that people claimed to have
worked. For instance, the Scheduled Castes and OBC households reported having worked for an
average of 28 and 32 days respectively. However, according to the official records they worked
only for 21 and 24 days respectively. This implies that workdays were under-reported for
marginalized groups. This means that some of the labour performed by these groups was not
recorded in official statistics and correspondingly they were not paid for this labour. The trend was
different for upper caste households who reported having worked for 25 days but official records
indicate that they worked for 37 days. Therefore, there was significant over-reporting of workdays
19 This is important as concerns are raised about leakage to the non-poor (Bhagwati and Panagariya, 2014).
18
in this case. This implies that upper caste workers got paid more than what they worked while
poorer lower caste workers who depend more on income support provided by NREGA. This shows
that even though workers in the region do not face any discrimination in work allocation, but caste
plays a role in determining the earnings of NREGA workers. In contrast, evidence from Rajasthan
shows that when the provision of NREGA falls short of its demand, employment is rationed based
on the caste and of the village head Sarpanch (Mukhopadhyay et al., 2015). This discrepancy in
payment received by different social groups highlights corruption as an important factor in the
provision of NREGA employment. Existing literature has reported similar findings. For instance,
Adhikari and Bhatia (2010) report that corruption in the form of fudging of muster rolls, flawed
work measurement, non-payment of minimum wages and delays in wage payments is widespread
across the country.
We found no evidence of year-long agricultural labour contracts which would hinder worker's
ability to participate in NREGA. For over 81 percent of households engaged in self-farming or
wage employment, NREGA employment augmented their income time without causing any
significant substitution of private or self-employment by NREGA. This is contrary to Imbert and
Papp (2015) who find significant crowding-out of private wage employment post-NREGA. The
insufficient and unpredictable nature of NREGA provision does not allow farmers to change their
labour supply decisions in response to public employment. Further, since NREGA employment
occurs in the lean season of agriculture, labour demand in agricultural markets and in self-farming
is low.20 Further, most employers are flexible and adjust their own labour demand to allow workers
to participate in NREGA.21
Perceptions about NREGA provision
When we tried to ascertain people's perceptions about NREGA supply, an overwhelming majority
agreed that the provision of employment under NREGA is insufficient. However, there was little
awareness about its causes. Around 60 percent of the respondents claimed that the Pradhan “tries
his best” to create NREGA employment but has no budget to do so. Most people said that the
provision of NREGA has remained consistently low ever since its inception. Therefore, our
20 Most respondents claimed that they would prefer NREGA to remain operational throughout the year including the peak season of agriculture. This shows that labour demand in the rural economy (agricultural and non-agricultural) is insufficient to provide employment to workers at any point during the year. 21 In most cases, private employers (agricultural and non-agricultural) adjusted the timing of their labour demand by a few days to accommodate NREGA employment.
19
findings suggest that NREGA has not altered the social relations of production within the rural
economy. This is primarily because the actual provision of NREGA does not vary by demand but
is fixed exogenously by the Pradhan. The number of workdays created under NREGA is not
sufficient to meet the consumption requirements of poor households in the region. The average of
29 days of NREGA in the region in this study is lower than other regions including the worst
performing states. For instance, during the period between 2013 and 2016, at the national level,
NREGA generated 45 days of work in a year for each participating household in rural India.
4.2.2 Payment of Wages
Similar to the provision of NREGA employment, the nature of wage payment also diverged
considerably from the norm. Our study found that there is no set schedule for NREGA payment in
the survey villages. Officially, payment for NREGA works must be made weekly or fortnightly
(Dreze et al., 2006). The primary purpose of employment guarantee is to raise people's incomes
during the lean season of agriculture. Therefore, delays in payment effectively dilute the welfare
effects of NREGA (Basu and Sen, 2015). Around 84 percent of the respondents claimed that
NREGA payments were delayed by over two-weeks which is a direct violation of NREGA
provisions.22,23,24 Existing research identifies delays in payments as a major impediment to the
successful implementation of NREGA across the country. Problems of delayed wage payments
are effectively diluting the welfare effects of NREGA (Basu and Sen, 2015). Payment delays have
increased since 2008 with the movement from cash payments to payments through bank and post
office accounts and the complex procedures needed to approve payments for NREGA workers
(Ravallion et al., 2015).
Mode of payment
Over 92 percent of the respondents claimed to have bank or post-office accounts and produced
bank passbooks to show NREGA payments. In the remaining cases, the money was paid in cash
by the Pradhan. In some cases, respondents had given signed blank bank-withdrawal slips linked
22 The provision of NREGA remained low in Jharkhand even during acute agricultural crisis when it was most needed. 23 This is different from the experience in Jharkhand, Chhattisgarh, and Odisha where work is allocated to groups of workers and wages are paid to the group leader so individual workers receive less than their official wage (Banerjee and Saha, 2010). Further, several instances of collusion between local elected body and bank officials to reduce payments received by workers. 24 Studies from the neighbouring state of Bihar found even longer delays. For instance, in Bihar, 38 percent of payments are delayed by more than 60 days (Ravallion et al., 2015).
20
to their accounts to the Pradhan who would withdraw the money and pay cash to workers.25 In
around 39 percent of cases no wages were paid to workers even when they participated in NREGA.
Differences in wage payments by socio-economic status
Panel C of Table 4 shows that based on the number of days respondents claimed to have actually
worked, the average daily wage rate paid for NREGA employment was 65 INR (0.9 USD).26 The
actual wage rate differed considerably between social groups. For instance, on the one hand the
upper castes and Muslim households received an actual wage rate of 86 and 73 INR respectively.
On the other hand, the actual wage rate for SCs (including kols) and OBCs was only 63 and 69
INR respectively. The lowest wage rate was recorded for the STs who earned less than 60 INR a
day under NREGA. However, if we compare daily wage rates based on the number of days
officially reported on the NREGA website, we find that the average wage rate was 78 INR and
there was relatively little variation between wage rates between social groups.27
We were not able to discern any differences in wages paid to men and women workers. This is
particularly important since prior to NREGA, daily wages received by women were lower than the
legal minimum wage in most states in comparison to men (Basu, 2013) Using nationally
representative data (Zimmerman, 2012) has shown that female wages have risen considerably after
NREGA. Moreover Desai, Vashishtha, and Joshi (2015) finds that around 45 percent of women
working under NREGA during 20011 - 2012 were either not working earlier or were working
exclusively on family farms in 2004-2005. Therefore, NREGA gave several women their first
opportunity to earn a cash wage and consequently their material living, and household bargaining
position have significantly improved.
Perceptions about wage payments
Surprisingly, more than 88 percent of the households were aware that the minimum wage in the
district was around 100 INR per day but were not aware that the minimum wage laws applied to
NREGA employment. Further, most respondents felt they were paid a fair amount since their
neighbours and friends received similar wages. While most respondents remembered the dates and
25 In principle bank-withdrawal slips can be used only by the account holder to withdraw money but according to the respondents, the Pradhan can operate their bank accounts without them being present. 26 Using the 2017 exchange rate 1 USD = 69 INR. 27 Some respondents claimed that the Pradhan assured them that they will get another payment related to NREGA in the coming weeks. However, the CDO's office confirmed that all NREGA wages for the year were paid.
21
amounts of NREGA earnings, they could not calculate their wage rates and estimate whether their
earnings were commensurate with the number of days worked. Lack of awareness coupled with
lack of education may explain people's inability to determine whether they are paid fair wages. For
instance, the household head in 69 percent of the households was illiterate. This number was much
lower for upper castes (39 percent).
4.3 Supporting Facilities at Work Sites
According to Dreze et al., (2006), NREGA worksites are required to be located within 5 kilometres
of the village and should have provision for safe drinking water, shade for children and periods of
rest, first-aid box with adequate material for emergency treatment for minor injuries and other
health hazards connected with the work [Schedule II, Para 23]. All respondents agreed that
NREGA works were undertaken very close to the village (in most cases less than one kilometre).
However, most respondents agreed that apart from the provision of drinking water, no other facility
was provided at the worksite.
Panel D of Table 4 shows that most workers agreed that in their experience no health or childcare
facilities are provided at NREGA work sites. In some cases, women workers suggested that they
had to delegate child-care to other family members and would benefit if there was any form of
child-care support while they worked. However, they had never made a formal or informal request
for this as they did not think it was mandatory under the Act. Further, most women agreed that
their primary concern was lack of adequate work and timely payment under NREGA and
consequently, they would refrain from demanding work-site child-care facilities as that might
upset the Pradhan. This potentially creates impediments to women's participation in NREGA as
they disproportionately bear childcare responsibilities within the household.
4.4 Assets Created under NREGA
In eight out of twelve villages the respondents claimed to have worked under two NREGA works.
The construction of a water reservoir (talaab) and a mud (katchcha) road. Both existed and were
verified by our team. In the remaining four villages workers only worked on a water reservoir
which could not be completed as works had been halted owning to insufficient funds. Over 70
percent respondents claimed that the water reservoirs helped with agricultural production but
claimed that they have been working on the same reservoir for several seasons as it needs frequent
repairs. More than 80 percent of the respondents had no knowledge of any list of prospective works
22
maintained by the Gram Panchayat. Finally, most workers did not know that NREGA works were
meant to improve the productivity of their agriculture. It was believed that the government chose
which public assets were to be created under NREGA and local participants had no say in the
process.
While productive assets created under NREGA can create non-transfer welfare gains for the local
economy as they increase the productivity of agriculture (Abreu et al., 2014). However, the
experience of this region shows that this element of the program is not implemented seriously.
Creation of durable assets is also a significant source of corruption in NREGA. For instance, public
employment to create wells was undertaken in Jharkhand and corruption and bribery were rampant
during the construction process (Bhagat, 2012). Lack of accountability through social audits and
public disclosure of payment rolls hinders the ability of workers to examine fund utilization
certificates prepared by the officials (Ambasta et al., 2008). However, better implementation of
the program can help in minimizing corruption and increasing transparency in NREGA. For
instance, creating correct incentives for officials reduces theft by around 64 percent (Niehaus and
Sukhtankar, 2013). Better implementation of NREGA can increase private market wages by
around 6 percent and decrease days without work by 7 percent (Murlidharan et al., 2016).
4.5 Grievance Redressal
Over 90 percent of the respondents claimed that they had problems with the inadequate provision
of NREGA and delayed wage payments. However, in most cases they would only discuss this with
the Pradhan who would blame lack of budgetary allocation for the poor provision of NREGA.
None of the respondents claimed to have approached the BDO, NREGA PO, or any bureaucrat to
discuss problems related to NREGA implementation. This is consistent across social groups as
seen from Panel E of Table 4. In fact, nobody claimed raising this issue in the Gram Sabha or the
village assembly. This shows that people's perception of NREGA differs considerably from its
actual provisions. People have not realized that NREGA is a demand driven program and they are
entitled to 100 days of employment at the minimum wage. Most people claimed that they had no
knowledge about the provisions of NREGA and relied on the Pradhan's interpretation of the rules
and procedures to help them with their problems.
[INSERT TABLE 4 HERE]
23
5. NREGA’S IMPACT ON AGRICULTURE
It is important to investigate whether the creation of productivity enhancing assets under NREGA
has had an impact on agriculture in this region for three reasons. First, as mentioned above, this
region is traditionally characterized by the incidence of tied-labour and among the most backward
districts of the country.28 Correspondingly, it is important to study whether NREGA has been
successful in helping prevent indebtedness by raising the productivity and incomes in agriculture.29
Second, raising agricultural productivity through public works is an important non-transfer benefit
of NREGA which augments the direct income transfer under the program (Deininger and Liu,
2013). However, creation of productivity enhancing assets under NREGA requires a coordinated
push from the farmers, Gram Sabhas and the block level officials. As mentioned above, we found
no evidence of any planning or proposals for possible works under the program and there was no
mechanism for involving local farmers in deciding the nature of public assets created.
Finally, most NREGA beneficiaries in our sample were wage workers for most months in a year.
Existing research shows that the guarantee of alternative employment increases the bargaining
position of workers and exert an upward pressure on rural wages (Imbert and Papp, 2015; Basu et
al., 2009). Studies using national level data show that NREGA has allowed rural households to
increase consumption expenditure between 6.5 and 10 percent with around 12 percent increase for
marginalized caste groups (Bose, 2017).
5.1 Agricultural Profile of the Region
Table 5 provides an overview of the proportion of agricultural cultivators and wage workers by
social group. Around 74 percent of our respondents were engaged in some form of agricultural
production. Among these, 46 percent own the land they cultivate and the remaining 54 percent
work as sharecroppers on the land of large landlords. While we did not find any incidence of
28 The Backwardness Index comprises of agricultural productivity per worker, agricultural wages, and the proportion of SCs and STs in the population (Planning Commission, 2015). 29 Other studies have shown that NREGA employment enables peasants to withstand adverse weather shocks and the agricultural lean season when private labour demand is low (Bardhan, 1980). For instance, in 2008, around two-thirds of NREGA workers in North India avoided hunger and around 75 percent respondents credited NREGA for helping them sustain their livelihoods in the dry season of agriculture (Khera and Nayak, 2009). This, in turn may reduce their reliance on informal credit to meet their consumption or investment needs and reduces migration to urban areas. Studies have also shown that NREGA increased the consumption expenditure of the most vulnerable sections (Schedule Castes and Scheduled Tribes) during the lean season of agriculture (Klonner and Oldiges, 2014)
24
bonded labour in over 390 kol households that we surveyed, around 65 percent kol households
engaged in share-cropping (adhiya) where the landlord claimed about half the total produce. The
incidence of sharecropping among the kols was the highest among all social groups. As already
noted, sharecropping on land owned by the landlord (who also provides credit and inputs for
production) is an important component of tied-labour arrangements in this region. However, none
of our respondents reported that they were forced to work for their landlords exclusively.30
Most households cultivate small plots of land (less than 0.5 acre) and over 97 percent of the
respondents produced solely to meet their subsistence needs. They relied predominantly on
household labour and over 90 percent never hired any additional workers. The remaining 26
percent of the respondents work as landless labour in agriculture and non-agricultural wage
employment. Even among cultivators, household members engage in wage labour for six to nine
months in a year. The agricultural produce for these households lasts between three to six months
depending on the farm and family size. Members from most households that engage in self-farming
also work as agricultural wage workers as incomes from agriculture are not sufficient to meet their
subsistence needs. While 67 percent of all cultivators (and 60 percent of kol cultivators) reported
taking a loan from the landlords or local money lenders, none of them reported any work
conditionality attached to the loan repayment schedule. Interest rates charged were between 15 -
25 percent per month and none of the respondents had ever approached a bank or any formal
lending institution for credit. None of the respondents felt that banks would lend them any money
even when all of them had bank accounts and even ATM debit cards. Most loans were taken to
buy inputs for agriculture (67 percent), financing household consumption and medical expenses
came next (15 percent).
[INSERT TABLE 5 HERE]
5.2 Role of NREGA on Agricultural Productivity and Wages
Several studies have shown that NREGA positively impacts agricultural productivity (Berg et al.,
2012) and raises agricultural wages (Berg et al., 2018). However, results from our sample suggest
30 The landlord occasionally asks sharecroppers to work in his house during weddings and other ceremonies without any monetary payment. In the focus group discussions, we found that this practice was not practices across castes and was not confined to the kols. People in the region distinctly remember that kols were forced to work on the landlord's farms for 1kg rice and a bottle of local liquor but reported that this practice does not exist anymore. While we did not any incidence of debt-bondage in our sample, future research is needed to determine whether the practice is actually extinct from the region.
25
that NREGA had little impact on the intensity of inputs like fertilizer, machinery and labour
demand in this region. This is not surprising since we found little evidence of durable assets being
created under NREGA. Further, contrary to evidence from other states; none of the NREGA works
in this region were conducted in the fields belonging to marginalized communities. This is
particularly important as kol farmers were granted landownership of rocky and semi-barren land
on the outskirts of several villages under the Uttar Pradesh Land Ceiling Act of 1972.31 Under
Category II of the permissible works under NREGA, public employment can be used to undertake
individual works to improve the land belonging to scheduled castes, scheduled tribes, de-notified
tribes and other families below the poverty line (Dreze et al., 2006). In contrast, Rawaware et al.,
(2015) finds that in Maharashtra around 75 percent of NREGA works on private land belonged to
small (53 percent) and marginal farmers (22 percent) However, our study found that no such works
were ever undertaken in the rocky fields belonging to the kol farmers who could have benefited
immensely from such productivity enhancing works on their land.
We also investigate the impact of NREGA on agricultural wages. Our respondents claimed that
NREGA had no impact on their wage bargaining position vis-a-vis private agricultural employers.
In a few instances when workers had demanded higher wages, landlords simply refused and in the
absence of other alternative employment, workers had no choice but to accept the wages offered
by the landlords. This was also true during the lean season of the year when NREGA employment
was primarily undertaken. The ability of NREGA to increase wages depends on the increase in
wage bargaining power of workers that the guarantee of NREGA employment provides. In places
where this guarantee is diluted by the inadequate and erratic nature of NREGA provision, the
programme would not affect wages in the countryside (Misra, 2019). Further, owing to stagnant
agricultural productivity there was no increase in labour demand during the harvest season and
consequently there was no upward pressure on agricultural wages. In several instances, workers
reported having worked at wages below the legal minimum.
Therefore, contrary to the experience of better performing states like Andhra Pradesh, Rajasthan
and Tamil Nadu where NREGA has had a positive impact on rural wages and crowded-out private
employment (Dreze and Khera, 2009; Imbert and Papp, 2015), in the most backward regions of
31 Under the Land Ceiling Act of 1972, the maximum land size for agricultural holding was fixed at 12.5 acres. Any landholding above this size was confiscated by the state and redistributed among the landless workers, primarily belonging to the marginalized social groups. However, there has been limited real redistribution under the scheme and most land transferred is barren or non-agricultural land. See Singh and Mehrotra (2014) for a full discussion on land reforms in UP.
26
the country, the full potential of NREGA has not been realized. In fact, its implementation does
not allow cultivators to increase the productivity of their agriculture or workers to improve their
wage bargaining potential. It simply serves as an erratic and unpredictable source of income for a
few days in the year. Almost all respondents claimed that NREGA earnings were spent in
household consumption and was not enough to increase their savings or provide for agricultural
investment. Next, we discuss how lack of transparency and citizen's participation in the provision
of NREGA is leading to elite capture and corruption in its implementation.
6. LACK OF AWARENESS AND THE LOCAL POLITICAL ECONOMY
6.1 Role of the Pradhan
The Pradhan plays a pivotal role in NREGA provision, wage payment and record collection in
every gram panchayat. In most cases, people approach the Pradhan with most of their NREGA
related queries. However, when we questioned people on whether the Pradhan’s discharge their
duties as mandated by the NREGA Act, we found that the Pradhan did not keep any records of
existing works, number of days of employment created and wages paid in a transparent manner.
Further, NREGA job-cards were never updated with particulars of the number of days worked and
wages paid. In several cases the Pradhan kept the job cards, so people had no idea of the wages
they were actually paid and the number of days of work that got registered in the official records.
This increased the opaqueness in the functioning of NREGA.
Paradoxically, as outlined in Section 4 above, almost all respondents had a positive view of the
role played by the Pradhan in helping them with NREGA related difficulties. Table 6 shows that
most respondents thought that inadequate provision of NREGA and delays in wage payments were
minimized because of the efforts of the Pradhan. It was believed that the Pradhan even pays the
panchayat mitra an additional monthly payment of 5000 INR for maintaining NREGA records for
the entire village.32 In addition, our respondents never met or interacted with any of the government
functionaries like the Program Officer or saw the BDO inspect any work site. Even in Halia village
which is located within a few kilometres from the Block headquarters, 80 percent of the
32 Panchayat mitras are local officials who assist with the day to day functioning of the Gram Panchayat.
27
respondents agreed that they had never heard of the Program Officer and less than 6 percent of the
respondents said they ever spoke to any one from the BDO's office.
This central position of the Pradhan is primarily because of a total lack of awareness of the
provisions of NREGA among the beneficiaries. In the absence of any transparency measures like
social audits, this concentration of political and social power with the Pradhan has led to client-
patron exchanges and corruption in the functioning of NREGA. Table 6 shows that around 90
percent or more respondents of all social groups believed that the provision of NREGA depends
solely on the Pradhan who has consolidated his position considerably in the local economy.
Respondents explained that if they have to approach the Pradhan with their NREGA related
complaints, they could not afford to antagonize him in any way. We find that in this region, the
village Pradhan not just controls all facets linked to NREGA implementation in his Gram
Panchayat but has also emerged as the link between citizens and government officials. A
respondent in Maheshpur village summed up the role of the Pradhan as follows.
“Pradhanji is surely on our side, he runs around for our work and does not ask us for anything. If
the government doesn’t release funds, how can we blame him? He even withdraws our money and
delivers it it us from the bank”
Experiences from Jharkhand where local body elections have not been held since 1978 also show
that local institutions like the Gram Sabha lacks the administrative capacity to implement NREGA
(Bhatia and Dreze, 2006). The absence of village assemblies seriously dilutes the legal entitlement
of NREGA as these assemblies are pivotal in ensuring that NREGA is implemented when people
demand employment from the state. In most cases, this lack of administrative capacity is also
reflected in the delay in appointment of officials at the village and block level.33 In fact, these
deficiencies in public personnel and institutional capacity allows public officials to restrict the
number of job cards and regulate the supply of NREGA workdays.
[INSERT TABLE 6 HERE]
33 Officials at the local level include panchayat sevaks or panchayat mitras and gram rozgar sevaks and block level officials include supervisors, engineers etc.
28
6.2 Patron-Client Exchanges NREGA Implementation
According to Scott (1972) patron-client relationships consist of exchanges between an individual
of higher socio-economic status (patron) who uses his own influence and resources to provide
protection or benefits, or both, for a person of lower status (client) who, for his part, reciprocates
by offering general support and assistance, including personal services, to the patron. Such
repeated exchanges between an identifiable agent within a community is a form of rent seeking in
developing countries. The patron spends a part of the rents created in one period to provide
protection and access to scarce resources to clients in their networks to maintain their influence
and authority which allows further rounds of rent-seeking (Khan and Jomo, 2000). The pivotal
role played by the Pradhan in the functioning of NREGA in his Gram Panchayat establishes him
as the principle patron in the repeated provision of NREGA which creates rents for the local elite.
One of the respondents in Fuliayi summed up the Pradhan’s role in the implementation of NREGA
as follows.
“If he [Pradhan] would not benefit, then why will he work so hard for our welfare”
Dutta et al., (2012) attribute the low demand and participation rates in NREGA in Bihar, Jharkhand
and Odisha to low information and awareness. As workers are unaware of their rights under
NREGA, they rely on the Pradhan for the provision of NREGA. The Pradhan in turn, benefits
from lack of transparency in the functioning of NREGA to control its supply to suit the interests
of local landholding elite and appropriate NREGA funds. At the same time, the Pradhan spends
some resources to ensure that workers continue to trust and rely on him to address their concerns
and grievances related to the functioning of NREGA. By excluding the role of community
participation and decision-making through the Gram Sabhas, Pradhans not only dilute the demand
driven provisions of NREGA, but also create opaqueness in the implementation of NREGA. This
arrangement suits government functionaries as workers do not approach the PO or BDO with
requests for NREGA and the official records can show that there is no unfulfilled demand for
NREGA in their regions. Such complicity between lower-level government officials and local elite
has been studied extensively in the Indian context. For instance, Bardhan (1998) argues that
professionals, large landlords and capitalist form dominant coalitions in India which exclude the
poor from political participation and economic prosperity. Existing research also finds that the
impact of NREGA on agricultural labour markets is muted in regions where high levels of land
29
inequality have persisted historically (Misra, 2019). In these districts, the class interest of large
landlords is adversely affected by an upward pressure on agricultural wages exerted by the
guarantee of NREGA employment. Consequently, the elite like the Pradhan control the provision
of NREGA to ensure that it does not emerge as a credible alternative to private agricultural
employment.
6.3 Corruption in NREGA Implementation
If NREGA employment is provided for 100 days in a year and wages are paid on time, the wage
bill of large landlords would rise. In most cases the Pradhan or his extended family members are
major employers of agricultural labour. Therefore, it is in their interest to curtail the supply of
NREGA. Further, ignorance of official procedures creates avenues for corruption and fund
embezzlement. Our surveys revealed that the number of days worked by individuals recorded on
the NREGA website differed significantly from the number of days workers claimed to have
worked. As we were conducting our study shortly after NREGA works ended for the year and
since most workers worked on similar projects, it was easy to calculate the number of days that
each member of the household worked under NREGA. On average, around 42 percent of our
respondents reported working more days under NREGA than what was officially recorded, and
the remaining workers had worked fewer number of days. This discrepancy also existed in their
wages paid, as payments are released based on the official number of days worked by people.
Therefore, workers whose workdays were underreported in the official statistics, were paid less
and others were paid more for the same number of days worked.
As outlined previously, the Pradhan maintained control of payment schedules and in some cases,
he was also in possession of bank account details and withdrawal slips linked to workers accounts.
Individual NREGA beneficiaries had no idea how much money was deposited in the account by
the state, but only knew the cash payment received by the Pradhan. This discrepancy in NREGA
records and opaqueness in wage payment is maintained by the Pradhan as he controls data entry
for NREGA works at the village level. Further, several respondents believed that the Pradhan
submits several requests to the BDO to ensure the release of NREGA funds. This is important to
ensure that corruption rent-seeking continue through the patron-client engagements devised by the
Pradhan.
30
7. POLICY IMPLICATIONS
By documenting the functioning of NREGA in one of the poorest regions of UP, this paper aims
to explain why NREGA may not be performing well in eastern Uttar Pradesh. Using semi-
structured interviews and household surveys with government functionaries and NREGA
beneficiaries we find that three main factors contribute to the poor and opaque implementation of
NREGA in this region. These include: (1) lack of awareness of workers' entitlements, (2) poor
administrative capacity, and (3) corruption and collusion between the bureaucracy and local level
elected officials.
This paper contributes to the existing literature by arguing that lack of awareness about the
provisions of NREGA not only limits participation in public works but also serves as a basis for
patron-client relationships to emerge between the local elites, primarily the Pradhans and NREGA
beneficiaries. By centralizing all decision-making and NREGA record keeping practices, the
Pradhans can engage in rent seeking through corruption and protect their class interests by keeping
rural wages depressed. This arrangement also suits local administrators as it insulates them from
day to day monitoring and implementation of NREGA. However, this collusion between the local
elite and government officials effectively dilutes the demand driven nature of NREGA. Periodic
social audits and people's participation in its implementation act as checks and balances on elected
representatives and government officials at the local level. Our findings suggest that grassroots
organisations like the Mazdoor Kisan Shakti Sansthan in Rajasthan are indispensable to ensure
citizens’ participation in the functioning of NREGA. In the absence of such organizations, the
provision of NREGA may be controlled by the local elite who may benefit from controlling the
supply of public employment. However, our study shows that these measures have not been
introduced in eastern UP. Similarly, no durable assets have been created to augment agricultural
productivity in the region. As consequence the spill over benefits of NREGA have not been
realized and there is no change in agricultural productivity or labour demand.
There are three important implications of this study. First, there is an urgent need to increase
awareness and administrative capacity at the state and district level. These offices were severely
understaffed and ill-equipped to handle the administrative workload of NREGA. This under-
staffing leads to sub-contracting of important data entry and verification work to part-time
31
employees at the state level and to people affiliated to the Pradhan’s at the village level. Not only
does this dilute the transparency provisions of the Act, but it also creates avenues for corruption.
Second, information about the provisions of NREGA is shockingly absent even after 10 years of
its existence. There is an urgent need to fill this lacuna. In the absence of awareness of entitlements,
the demand driven nature of the program is diluted. Therefore, public information campaigns and
local self-help groups must be strengthened to ensure that the guarantee of public employment is
maintained and NREGA emerges as a credible alternative to low wage and seasonal agricultural
employment.
Finally, there is a growing gap between the performance and impact of NREGA between states
and regions. Therefore, there is a need to understand the role of local political economy factors
that condition and complicate the functioning of NREGA. The role of local elite and their collusion
with government officials effectively exclude NREGA beneficiaries from participating in the
planning process and maintaining an oversight of funds transfer, works completed and
employment generated. Further research is needed to identify the impediments faced by citizens
in organizing and participating village level discussions on various aspects of NREGA which can
create accountability in its provision.
32
References
Abreu, D., P. Bardhan, M. Ghatak, A. Kotwal, D. Mookherjee, and D. Ray (2014): “Wrong numbers: Attack
on NREGA is misleading,” Times of India.
Adak, D. K., R. Gautam, S. Bharati, A. Gharami, M. Pal, and P. Bharati (2006): “Body mass index and
chronic energy deficiency of adult males of Central Indian populations,” Human biology, 78(2), 161–179.
Adhikari, A., and K. Bhatia (2010): “NREGA Wage Payments: Can we Bank on the Banks?” Economic
and Political Weekly, pp. 30–37.
Aggarwal, A. (2016): “The MGNREGA crisis,” Economic and Political Weekly, 51(22), 38–43.
Aiyar, Y., and S. Samji (2006): “Improving the Effectiveness of National Rural Employment Guarantee
Act,” Economic and Political Weekly, pp. 320–326.
_________(2009): “Transparency and accountability in NREGA: A case study of Andhra Pradesh” .
Ambasta, P., P. V. Shankar, and M. Shah (2008): “Two Years of NREGA: The Road Ahead,” Economic
and Political Weekly, pp. 41–50.
Anderson, S. (2011): “Caste as an Impediment to Trade,” American Economic Journal: Applied Economics,
3(1), 239–263.
Azam, M. (2011): “The impact of Indian job guarantee scheme on labor market outcomes: Evidence from
a natural experiment,” Available at SSRN 1941959.
Banerjee, A., E. Duflo, C. Imbert, S. Mathew, and R. Pande (2014): “Can e-governance Reduce Capture of
Public Programs? Experimental Evidence from a Financial Reform of India’s Employment Guarantee,”
economics. mit. edu/files/10557 (accessed July 1, 2015).
Banerjee, A., and R. Somanathan (2007): “The Political Economy of Public Goods: Some Evidence from
India,” Journal of development Economics, 82(2), 287–314.
Banerjee, K., and P. Saha (2010): “The NREGA, the Maoists and the Developmental Woes of the Indian
State,” Economic and Political Weekly, pp. 42–47. 37
Bardhan, P. (1998): “The Political Economy of Development in India (1984)”.
Bardhan, P. K. (1980): “Interlocking Factor Markets and Agrarian Development: A Review of Issues,”
Oxford Economic Papers, 32(1), 82–98.
Basu, A. K. (2013): “Impact of Rural Employment Guarantee Schemes on Seasonal Labor Markets:
Optimum Compensation and Workers Welfare,” The Journal of Economic Inequality, 11(1), 1–34.
33
Basu, A. K., N. H. Chau, and R. Kanbur (2009): “A Theory of Employment Guarantees: Contestability,
Credibility and Distributional Concerns,” Journal of Public economics, 93(3), 482– 497.
Basu, P., and K. Sen (2015): “Welfare Implications of India’s Employment Guarantee Programme with a
Wage Payment Delay”.
Baviskar, A. (2003): “Between violence and desire: space, power, and identity in the making of
metropolitan Delhi”.
Berg, E., S. Bhattacharyya, R. Durgam, M. Ramachandra, et al. (2012): Can Rural Public Works Affect
Agricultural Wages? Evidence from India," Centre for the Study of African Economies, Oxford University.
Working Paper WPS/2012-05.
Berg, E., S. Bhattacharyya, D. Rajasekhar, and R. Manjula (2018): Can public works increase equilibrium
wages? Evidence from India’ s National Rural Employment Guarantee," World Development, 103, 239-
254.
Bhagat, K. (2012): Evaluation of NREGA Wells in Jharkhand," Economic & Political Weekly, 47(35), 25.
Bhatia, B., and J. Dreze (2006): Employment Guarantee in Jharkhand: Ground Realities," Economic and
Political Weekly, pp. 3198 - 3202.
Bhatti, B. (2012): “Aadhaar-Enabled Payments for NREGA Workers,” Economic & Political Weekly,
47(49), 16–19.
Borooah, V. K. (2008): “Deprivation, violence, and conflict: An analysis of Naxalite activity in the districts
of India,” International Journal of Conflict and Violence (IJCV), 2(2), 317–333.
Bose, N. (2017): “Raising consumption through India’s national rural employment guarantee scheme,”
World Development, 96, 245–263.
Chakraborty, P. (2007): “Implementation of employment guarantee: a preliminary appraisal,” Economic
and Political Weekly, pp. 548–551.
Commission, P., et al. (2005): “Report of the inter-ministry task group on redressing growing regional
imbalances,” Government of India, New Delhi. (2014): “Report of the expert group to review the
methodology for measurement of poverty,” Government of India, New Delhi.
Deininger, K., and Y. Liu (2013): “Welfare and poverty impacts of India’s national rural employment
guarantee scheme,” Evidence from Andhra Pradesh. World Bank Policy Research Working Paper, (6543).
Desai, S., P. Vashishtha, and O. Joshi (2015): “Mahatma Gandhi National Rural Employment Guarantee
Act: A Catalyst for Rural Transformation,” Discussion paper, eSocialSciences.
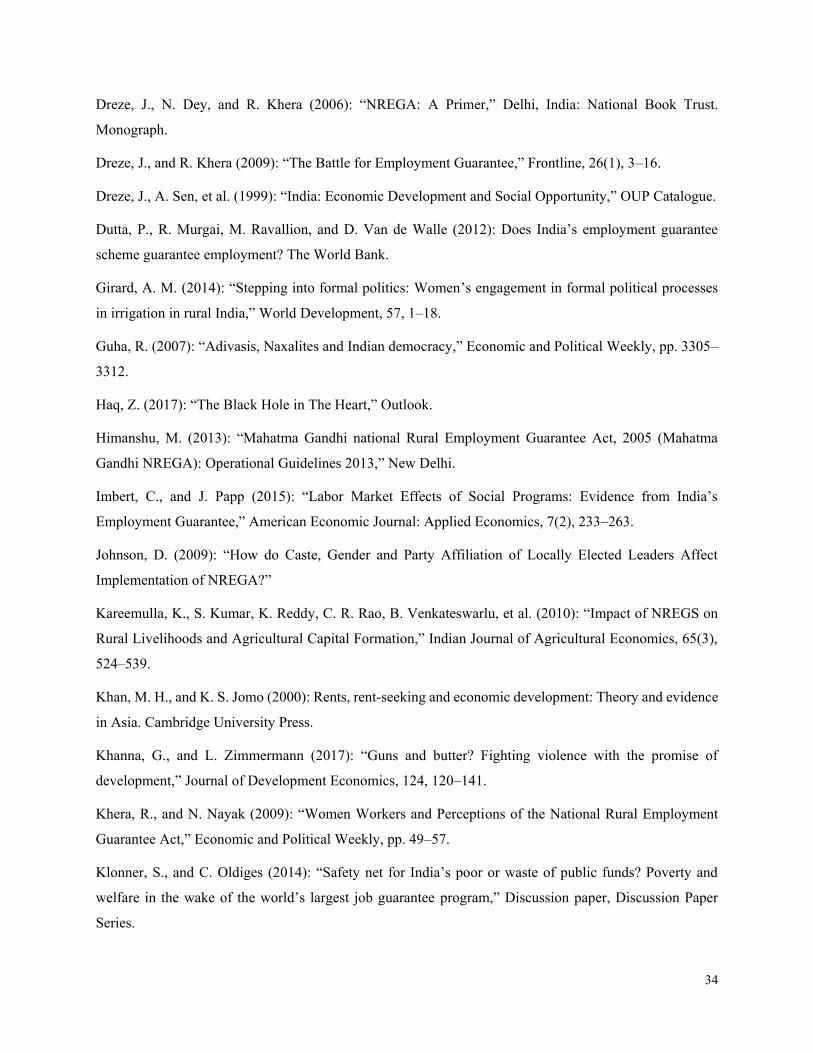
34
Dreze, J., N. Dey, and R. Khera (2006): “NREGA: A Primer,” Delhi, India: National Book Trust.
Monograph.
Dreze, J., and R. Khera (2009): “The Battle for Employment Guarantee,” Frontline, 26(1), 3–16.
Dreze, J., A. Sen, et al. (1999): “India: Economic Development and Social Opportunity,” OUP Catalogue.
Dutta, P., R. Murgai, M. Ravallion, and D. Van de Walle (2012): Does India’s employment guarantee
scheme guarantee employment? The World Bank.
Girard, A. M. (2014): “Stepping into formal politics: Women’s engagement in formal political processes
in irrigation in rural India,” World Development, 57, 1–18.
Guha, R. (2007): “Adivasis, Naxalites and Indian democracy,” Economic and Political Weekly, pp. 3305–
3312.
Haq, Z. (2017): “The Black Hole in The Heart,” Outlook.
Himanshu, M. (2013): “Mahatma Gandhi national Rural Employment Guarantee Act, 2005 (Mahatma
Gandhi NREGA): Operational Guidelines 2013,” New Delhi.
Imbert, C., and J. Papp (2015): “Labor Market Effects of Social Programs: Evidence from India’s
Employment Guarantee,” American Economic Journal: Applied Economics, 7(2), 233–263.
Johnson, D. (2009): “How do Caste, Gender and Party Affiliation of Locally Elected Leaders Affect
Implementation of NREGA?”
Kareemulla, K., S. Kumar, K. Reddy, C. R. Rao, B. Venkateswarlu, et al. (2010): “Impact of NREGS on
Rural Livelihoods and Agricultural Capital Formation,” Indian Journal of Agricultural Economics, 65(3),
524–539.
Khan, M. H., and K. S. Jomo (2000): Rents, rent-seeking and economic development: Theory and evidence
in Asia. Cambridge University Press.
Khanna, G., and L. Zimmermann (2017): “Guns and butter? Fighting violence with the promise of
development,” Journal of Development Economics, 124, 120–141.
Khera, R., and N. Nayak (2009): “Women Workers and Perceptions of the National Rural Employment
Guarantee Act,” Economic and Political Weekly, pp. 49–57.
Klonner, S., and C. Oldiges (2014): “Safety net for India’s poor or waste of public funds? Poverty and
welfare in the wake of the world’s largest job guarantee program,” Discussion paper, Discussion Paper
Series.
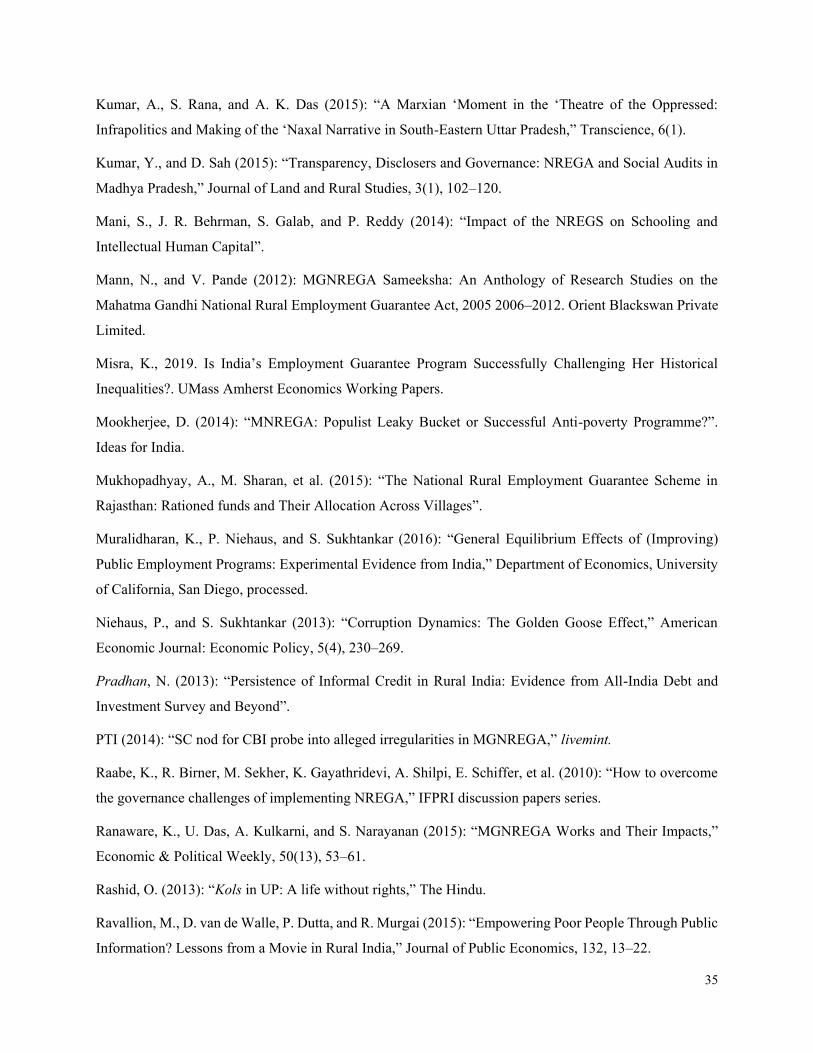
35
Kumar, A., S. Rana, and A. K. Das (2015): “A Marxian ‘Moment in the ‘Theatre of the Oppressed:
Infrapolitics and Making of the ‘Naxal Narrative in South-Eastern Uttar Pradesh,” Transcience, 6(1).
Kumar, Y., and D. Sah (2015): “Transparency, Disclosers and Governance: NREGA and Social Audits in
Madhya Pradesh,” Journal of Land and Rural Studies, 3(1), 102–120.
Mani, S., J. R. Behrman, S. Galab, and P. Reddy (2014): “Impact of the NREGS on Schooling and
Intellectual Human Capital”.
Mann, N., and V. Pande (2012): MGNREGA Sameeksha: An Anthology of Research Studies on the
Mahatma Gandhi National Rural Employment Guarantee Act, 2005 2006–2012. Orient Blackswan Private
Limited.
Misra, K., 2019. Is India’s Employment Guarantee Program Successfully Challenging Her Historical
Inequalities?. UMass Amherst Economics Working Papers.
Mookherjee, D. (2014): “MNREGA: Populist Leaky Bucket or Successful Anti-poverty Programme?”.
Ideas for India.
Mukhopadhyay, A., M. Sharan, et al. (2015): “The National Rural Employment Guarantee Scheme in
Rajasthan: Rationed funds and Their Allocation Across Villages”.
Muralidharan, K., P. Niehaus, and S. Sukhtankar (2016): “General Equilibrium Effects of (Improving)
Public Employment Programs: Experimental Evidence from India,” Department of Economics, University
of California, San Diego, processed.
Niehaus, P., and S. Sukhtankar (2013): “Corruption Dynamics: The Golden Goose Effect,” American
Economic Journal: Economic Policy, 5(4), 230–269.
Pradhan, N. (2013): “Persistence of Informal Credit in Rural India: Evidence from All-India Debt and
Investment Survey and Beyond”.
PTI (2014): “SC nod for CBI probe into alleged irregularities in MGNREGA,” livemint.
Raabe, K., R. Birner, M. Sekher, K. Gayathridevi, A. Shilpi, E. Schiffer, et al. (2010): “How to overcome
the governance challenges of implementing NREGA,” IFPRI discussion papers series.
Ranaware, K., U. Das, A. Kulkarni, and S. Narayanan (2015): “MGNREGA Works and Their Impacts,”
Economic & Political Weekly, 50(13), 53–61.
Rashid, O. (2013): “Kols in UP: A life without rights,” The Hindu.
Ravallion, M., D. van de Walle, P. Dutta, and R. Murgai (2015): “Empowering Poor People Through Public
Information? Lessons from a Movie in Rural India,” Journal of Public Economics, 132, 13–22.
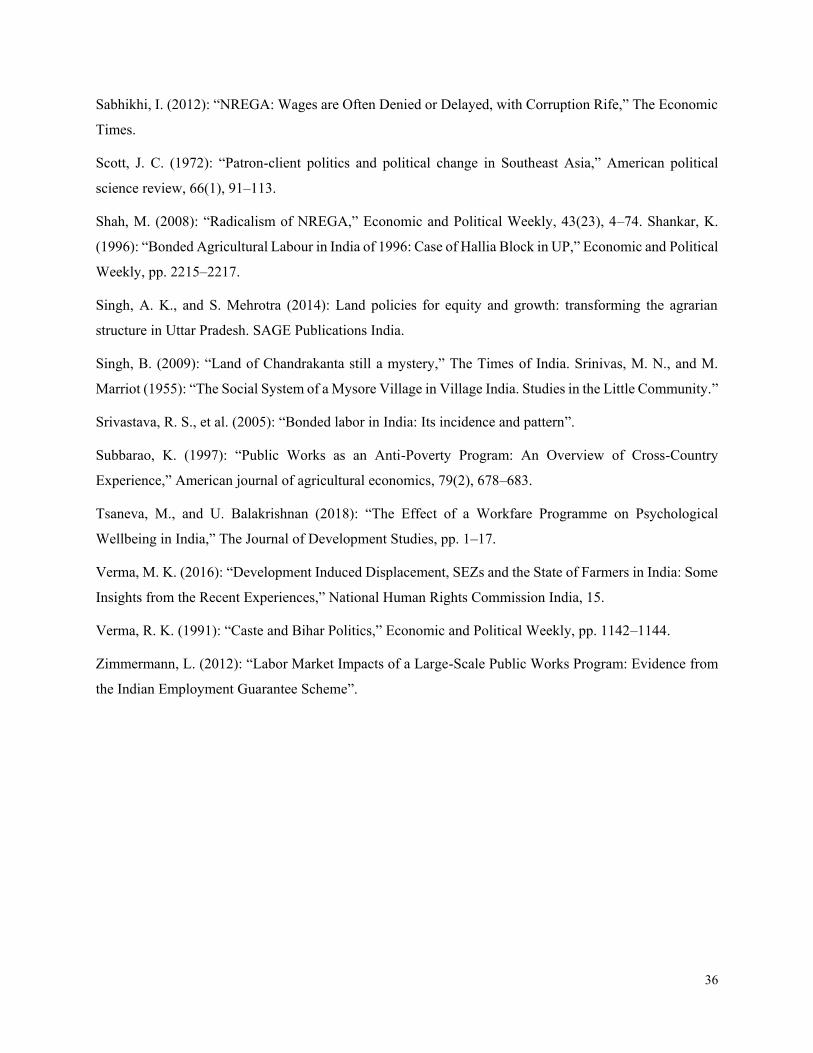
36
Sabhikhi, I. (2012): “NREGA: Wages are Often Denied or Delayed, with Corruption Rife,” The Economic
Times.
Scott, J. C. (1972): “Patron-client politics and political change in Southeast Asia,” American political
science review, 66(1), 91–113.
Shah, M. (2008): “Radicalism of NREGA,” Economic and Political Weekly, 43(23), 4–74. Shankar, K.
(1996): “Bonded Agricultural Labour in India of 1996: Case of Hallia Block in UP,” Economic and Political
Weekly, pp. 2215–2217.
Singh, A. K., and S. Mehrotra (2014): Land policies for equity and growth: transforming the agrarian
structure in Uttar Pradesh. SAGE Publications India.
Singh, B. (2009): “Land of Chandrakanta still a mystery,” The Times of India. Srinivas, M. N., and M.
Marriot (1955): “The Social System of a Mysore Village in Village India. Studies in the Little Community.”
Srivastava, R. S., et al. (2005): “Bonded labor in India: Its incidence and pattern”.
Subbarao, K. (1997): “Public Works as an Anti-Poverty Program: An Overview of Cross-Country
Experience,” American journal of agricultural economics, 79(2), 678–683.
Tsaneva, M., and U. Balakrishnan (2018): “The Effect of a Workfare Programme on Psychological
Wellbeing in India,” The Journal of Development Studies, pp. 1–17.
Verma, M. K. (2016): “Development Induced Displacement, SEZs and the State of Farmers in India: Some
Insights from the Recent Experiences,” National Human Rights Commission India, 15.
Verma, R. K. (1991): “Caste and Bihar Politics,” Economic and Political Weekly, pp. 1142–1144.
Zimmermann, L. (2012): “Labor Market Impacts of a Large-Scale Public Works Program: Evidence from
the Indian Employment Guarantee Scheme”.
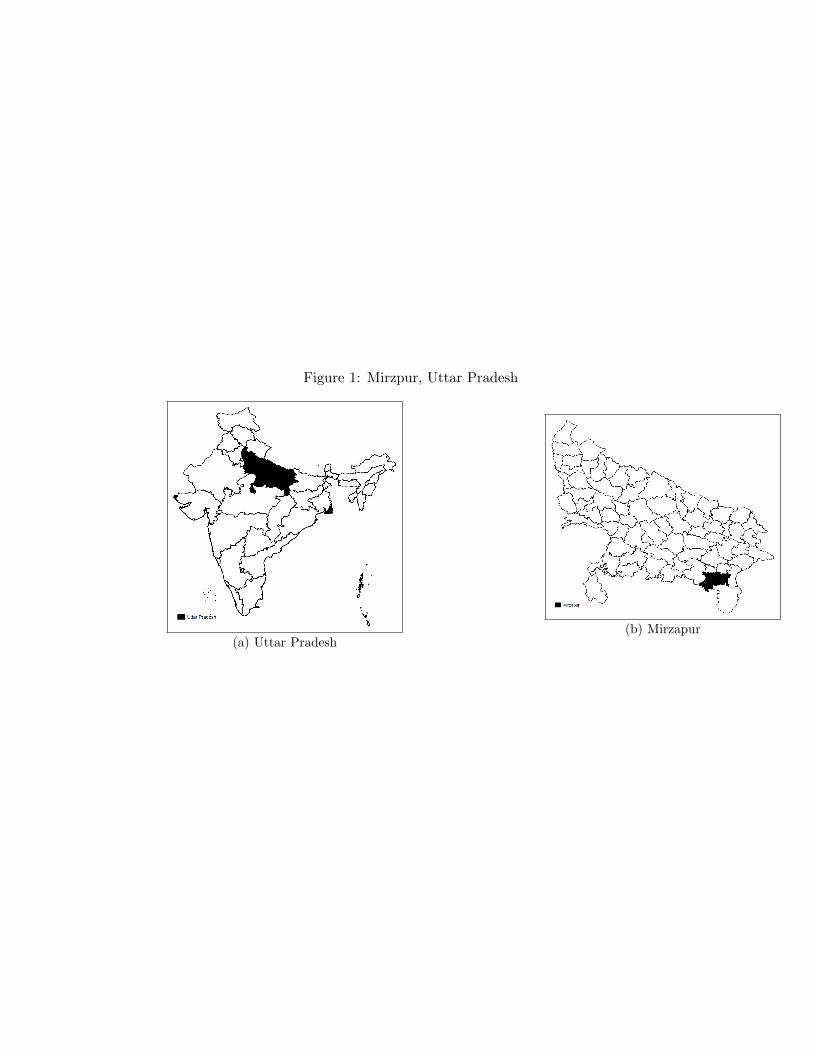
Figure 1: Mirzpur, Uttar Pradesh
(a) Uttar Pradesh(b) Mirzapur
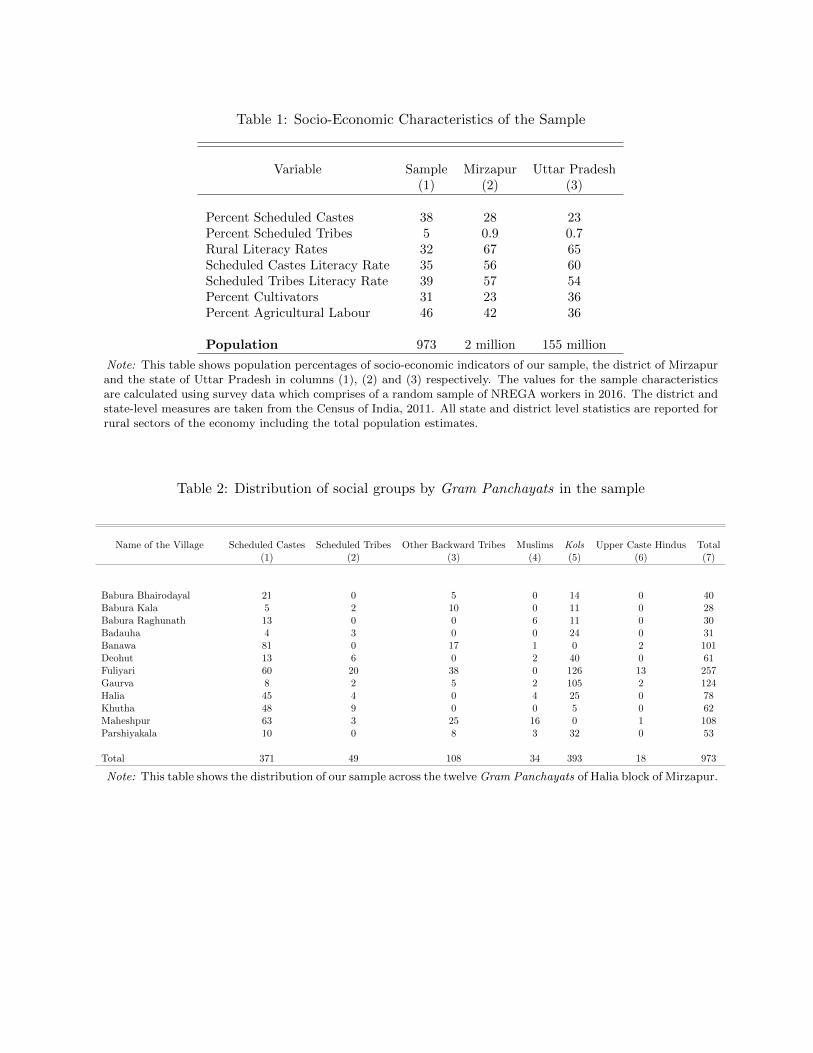
Table 1: Socio-Economic Characteristics of the Sample
Variable Sample Mirzapur Uttar Pradesh(1) (2) (3)
Percent Scheduled Castes 38 28 23Percent Scheduled Tribes 5 0.9 0.7Rural Literacy Rates 32 67 65Scheduled Castes Literacy Rate 35 56 60Scheduled Tribes Literacy Rate 39 57 54Percent Cultivators 31 23 36Percent Agricultural Labour 46 42 36
Population 973 2 million 155 million
Note: This table shows population percentages of socio-economic indicators of our sample, the district of Mirzapur
and the state of Uttar Pradesh in columns (1), (2) and (3) respectively. The values for the sample characteristics
are calculated using survey data which comprises of a random sample of NREGA workers in 2016. The district and
state-level measures are taken from the Census of India, 2011. All state and district level statistics are reported for
rural sectors of the economy including the total population estimates.
Table 2: Distribution of social groups by Gram Panchayats in the sample
Name of the Village Scheduled Castes Scheduled Tribes Other Backward Tribes Muslims Kols Upper Caste Hindus Total(1) (2) (3) (4) (5) (6) (7)
Babura Bhairodayal 21 0 5 0 14 0 40Babura Kala 5 2 10 0 11 0 28Babura Raghunath 13 0 0 6 11 0 30Badauha 4 3 0 0 24 0 31Banawa 81 0 17 1 0 2 101Deohut 13 6 0 2 40 0 61Fuliyari 60 20 38 0 126 13 257Gaurva 8 2 5 2 105 2 124Halia 45 4 0 4 25 0 78Khutha 48 9 0 0 5 0 62Maheshpur 63 3 25 16 0 1 108Parshiyakala 10 0 8 3 32 0 53
Total 371 49 108 34 393 18 973
Note: This table shows the distribution of our sample across the twelveGram Panchayats of Halia block of Mirzapur.
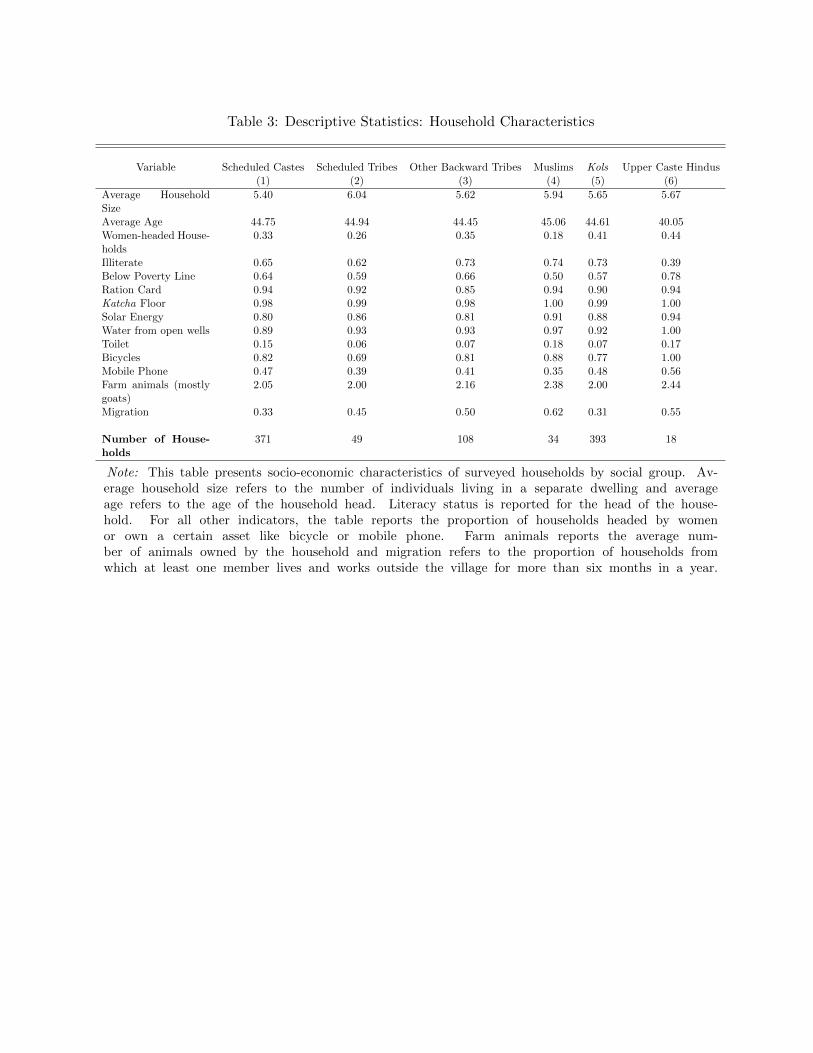
Table 3: Descriptive Statistics: Household Characteristics
Variable Scheduled Castes Scheduled Tribes Other Backward Tribes Muslims Kols Upper Caste Hindus(1) (2) (3) (4) (5) (6)
Average HouseholdSize
5.40 6.04 5.62 5.94 5.65 5.67
Average Age 44.75 44.94 44.45 45.06 44.61 40.05Women-headed House-holds
0.33 0.26 0.35 0.18 0.41 0.44
Illiterate 0.65 0.62 0.73 0.74 0.73 0.39Below Poverty Line 0.64 0.59 0.66 0.50 0.57 0.78Ration Card 0.94 0.92 0.85 0.94 0.90 0.94Katcha Floor 0.98 0.99 0.98 1.00 0.99 1.00Solar Energy 0.80 0.86 0.81 0.91 0.88 0.94Water from open wells 0.89 0.93 0.93 0.97 0.92 1.00Toilet 0.15 0.06 0.07 0.18 0.07 0.17Bicycles 0.82 0.69 0.81 0.88 0.77 1.00Mobile Phone 0.47 0.39 0.41 0.35 0.48 0.56Farm animals (mostlygoats)
2.05 2.00 2.16 2.38 2.00 2.44
Migration 0.33 0.45 0.50 0.62 0.31 0.55
Number of House-
holds
371 49 108 34 393 18
Note: This table presents socio-economic characteristics of surveyed households by social group. Av-erage household size refers to the number of individuals living in a separate dwelling and averageage refers to the age of the household head. Literacy status is reported for the head of the house-hold. For all other indicators, the table reports the proportion of households headed by womenor own a certain asset like bicycle or mobile phone. Farm animals reports the average num-ber of animals owned by the household and migration refers to the proportion of households fromwhich at least one member lives and works outside the village for more than six months in a year.
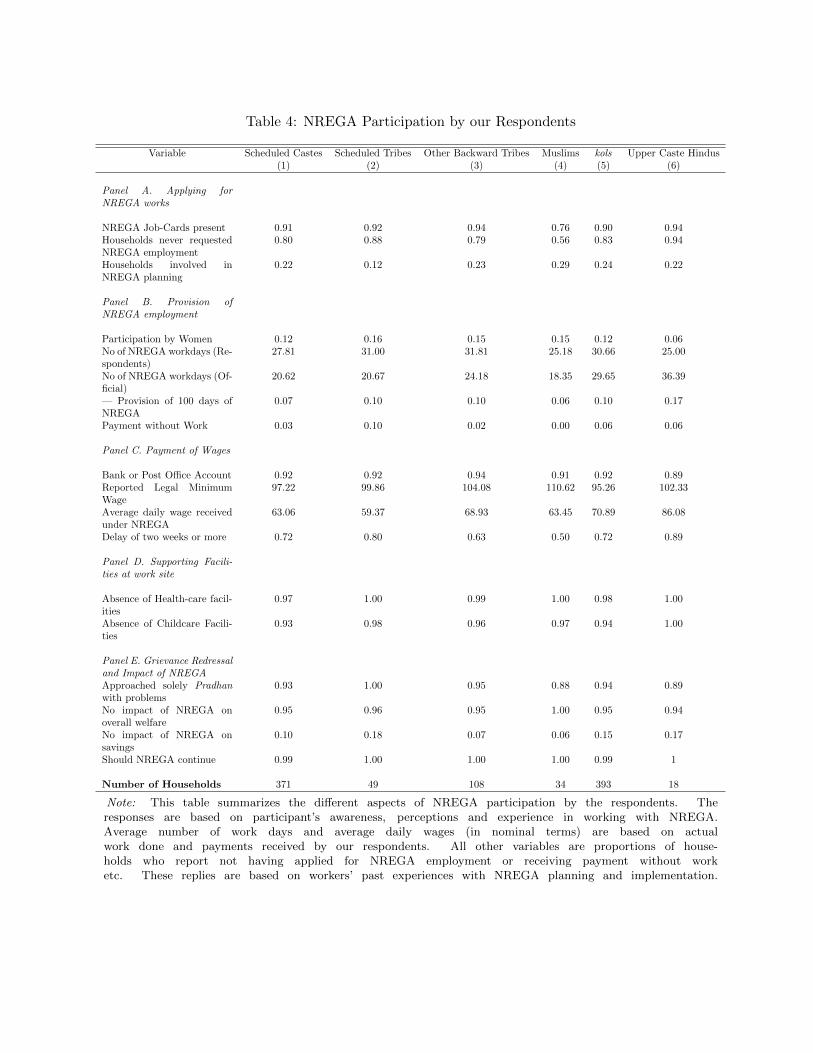
Table 4: NREGA Participation by our Respondents
Variable Scheduled Castes Scheduled Tribes Other Backward Tribes Muslims kols Upper Caste Hindus(1) (2) (3) (4) (5) (6)
Panel A. Applying forNREGA works
NREGA Job-Cards present 0.91 0.92 0.94 0.76 0.90 0.94Households never requestedNREGA employment
0.80 0.88 0.79 0.56 0.83 0.94
Households involved inNREGA planning
0.22 0.12 0.23 0.29 0.24 0.22
Panel B. Provision ofNREGA employment
Participation by Women 0.12 0.16 0.15 0.15 0.12 0.06No of NREGA workdays (Re-spondents)
27.81 31.00 31.81 25.18 30.66 25.00
No of NREGA workdays (Of-ficial)
20.62 20.67 24.18 18.35 29.65 36.39
— Provision of 100 days ofNREGA
0.07 0.10 0.10 0.06 0.10 0.17
Payment without Work 0.03 0.10 0.02 0.00 0.06 0.06
Panel C. Payment of Wages
Bank or Post O�ce Account 0.92 0.92 0.94 0.91 0.92 0.89Reported Legal MinimumWage
97.22 99.86 104.08 110.62 95.26 102.33
Average daily wage receivedunder NREGA
63.06 59.37 68.93 63.45 70.89 86.08
Delay of two weeks or more 0.72 0.80 0.63 0.50 0.72 0.89
Panel D. Supporting Facili-ties at work site
Absence of Health-care facil-ities
0.97 1.00 0.99 1.00 0.98 1.00
Absence of Childcare Facili-ties
0.93 0.98 0.96 0.97 0.94 1.00
Panel E. Grievance Redressaland Impact of NREGAApproached solely Pradhanwith problems
0.93 1.00 0.95 0.88 0.94 0.89
No impact of NREGA onoverall welfare
0.95 0.96 0.95 1.00 0.95 0.94
No impact of NREGA onsavings
0.10 0.18 0.07 0.06 0.15 0.17
Should NREGA continue 0.99 1.00 1.00 1.00 0.99 1
Number of Households 371 49 108 34 393 18
Note: This table summarizes the di↵erent aspects of NREGA participation by the respondents. The
responses are based on participant’s awareness, perceptions and experience in working with NREGA.
Average number of work days and average daily wages (in nominal terms) are based on actual
work done and payments received by our respondents. All other variables are proportions of house-
holds who report not having applied for NREGA employment or receiving payment without work
etc. These replies are based on workers’ past experiences with NREGA planning and implementation.
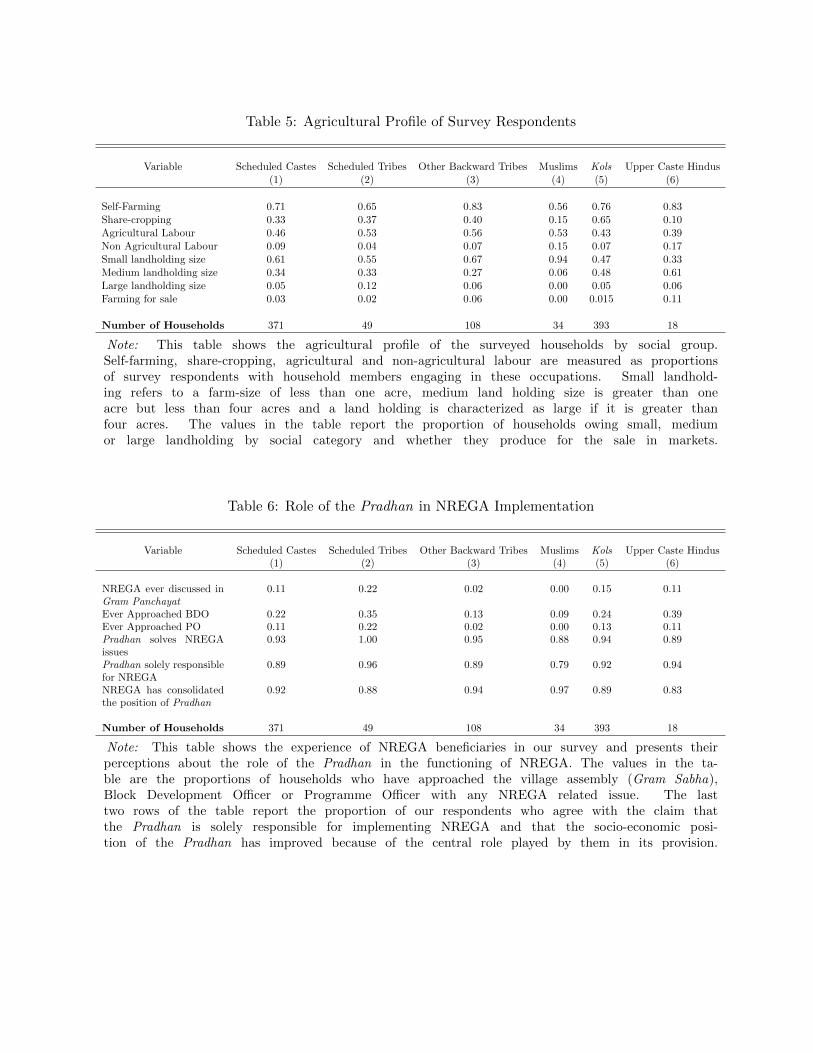
Table 5: Agricultural Profile of Survey Respondents
Variable Scheduled Castes Scheduled Tribes Other Backward Tribes Muslims Kols Upper Caste Hindus(1) (2) (3) (4) (5) (6)
Self-Farming 0.71 0.65 0.83 0.56 0.76 0.83Share-cropping 0.33 0.37 0.40 0.15 0.65 0.10Agricultural Labour 0.46 0.53 0.56 0.53 0.43 0.39Non Agricultural Labour 0.09 0.04 0.07 0.15 0.07 0.17Small landholding size 0.61 0.55 0.67 0.94 0.47 0.33Medium landholding size 0.34 0.33 0.27 0.06 0.48 0.61Large landholding size 0.05 0.12 0.06 0.00 0.05 0.06Farming for sale 0.03 0.02 0.06 0.00 0.015 0.11
Number of Households 371 49 108 34 393 18
Note: This table shows the agricultural profile of the surveyed households by social group.Self-farming, share-cropping, agricultural and non-agricultural labour are measured as proportionsof survey respondents with household members engaging in these occupations. Small landhold-ing refers to a farm-size of less than one acre, medium land holding size is greater than oneacre but less than four acres and a land holding is characterized as large if it is greater thanfour acres. The values in the table report the proportion of households owing small, mediumor large landholding by social category and whether they produce for the sale in markets.
Table 6: Role of the Pradhan in NREGA Implementation
Variable Scheduled Castes Scheduled Tribes Other Backward Tribes Muslims Kols Upper Caste Hindus(1) (2) (3) (4) (5) (6)
NREGA ever discussed inGram Panchayat
0.11 0.22 0.02 0.00 0.15 0.11
Ever Approached BDO 0.22 0.35 0.13 0.09 0.24 0.39Ever Approached PO 0.11 0.22 0.02 0.00 0.13 0.11Pradhan solves NREGAissues
0.93 1.00 0.95 0.88 0.94 0.89
Pradhan solely responsiblefor NREGA
0.89 0.96 0.89 0.79 0.92 0.94
NREGA has consolidatedthe position of Pradhan
0.92 0.88 0.94 0.97 0.89 0.83
Number of Households 371 49 108 34 393 18
Note: This table shows the experience of NREGA beneficiaries in our survey and presents theirperceptions about the role of the Pradhan in the functioning of NREGA. The values in the ta-ble are the proportions of households who have approached the village assembly (Gram Sabha),Block Development O�cer or Programme O�cer with any NREGA related issue. The lasttwo rows of the table report the proportion of our respondents who agree with the claim thatthe Pradhan is solely responsible for implementing NREGA and that the socio-economic posi-tion of the Pradhan has improved because of the central role played by them in its provision.