Embed Size (px)
Citation preview

Department of Economic Development and Environmental
Affairs
EASTERN CAPE CLIMATE CHANGE RESPONSE STRATEGY
Prepared for: Province of the EASTERN CAPE
Department of Economic Development and Environmental Affairs
P/Bag X0054, BHISHO South Africa, 5605
Phone: +27 (40) 609 3376 Fax: +27 (40) 635 1821
Web: www.deaet.ecprov.gov.za
Prepared by: Coastal & Environmental Services
P.O. Box 8145 East London, 5210
Phone: 043-722-5812 Fax: 086-872-4339 Cell: 083-379-9861
E-mail: [email protected] Web-site: www.cesnet.co.za
In association with
MARCH 2011

Eastern Cape Climate Change Response Strategy

Eastern Cape Climate Change Response Strategy
i
REPORT STRUCTURE
The Eastern Cape Climate Change Response Strategy report is presented in five separate sub-reports. These are outlined below:
• Summary Report – which gives a high-level synthesis of the overall process and outcomes;
• Phase I Report: Eastern Cape Climate Change Scenario - where an understanding of the issues and context of climate change in the Eastern Cape was developed.
• Phase II Report: Provincial Needs and Technology Assessment – where technical options for climate change mitigation most appropriate to the circumstances and needs of the Eastern Cape are identified.
• Phase III Report: Guideline Document on Sectoral Climate Change Action Plans – where priority response options are identified and developed as cross-sectoral programmes. The response programmes are grouped into adaptation programmes and mitigation programmes.
• Phase IV Report: Eastern Cape Climate Communications, Education and Public Awareness Strategy.
Tables of contents, lists of figures and lists of tables are provided for each report.

Eastern Cape Climate Change Response Strategy
ii
Acknowledgements
The following individuals constituted the DEDEA project management team.
L Mardon
L Macanda
A Mfenyana
G Pienaar
The following individuals formed part of the project steering committee
A Williams LG&TA
B Jara DEDEA
B Noncembu DEDEA
C Gyan DEDEA
J Witi DEA
L Macanda DEDEA
L Mardon DEDEA
L Pani DEDEA
M Mkosana DEDEA
M.Savenije DEDEA
N Fotoyi DEDEA
N.S.Duze DEDEA
S Gqalangile DEDEA
S Shwababa DEDEA
T Mapukata DEDEA
T Morgenthal EC Dept Agriculture
T Wanklin Tshani Consulting
Numerous other individuals contributed to the project through participation in stakeholder workshops, focused meetings and other media and forums.

Eastern Cape Climate Change Response Strategy
iii
Project Team
The following individuals contributed to the development of the Eastern Cape Climate Change Response Strategy.
Alan Carter (Dr) Coastal and Environmental Services
Alistair McMaster PURE Carbon Africa
Glynn Morris AGAMA Energy
Kevin Whittington-Jones (Dr) Coastal and Environmental Services
Lisa Constable ERM Southern Africa
Marie Parramon Imbewu Sustainability Legal Specialists

Executive Summary
i
EXECUTIVE SUMMARY

Executive Summary
ii
CONTENTS
1 INTRODUCTION 1
2 PHASE 1: EASTERN CAPE CLIMATE CHANGE SCENARIO 3
2.1 Legal and Policy Framework 3
2.2 Climate Change Scenarios and Impacts 4
2.3 Eastern Cape Province Development Priorities 6
2.4 Risk and Vulnerability Assessment of Sectors and Resources 7
2.5 Eastern Cape Greenhouse Gas Inventory 9
3 PHASE 2: EASTERN CAPE TECHNOLOGY ASSESSMENT 11
4 PHASE 3: GUIDELINE DOCUMENT ON SECTORAL CLIMATE CHANGE ACTION PLANS 15
4.1 Adaptation 15
4.2 Mitigation 17
5 PHASE 4: COMMUNICATION, EDUCATION AND PUBLIC AWARENESS STRATEGY 18
6 REFERENCES 19

Executive Summary
iii
LIST OF FIGURES
Figure 1: Projected median change in maximum surface temperature by 2050 (Source: Midgley et al 2007). ....................................................................................................................................................... 5 Figure 2: Projected change in total annual rainfall (mm month-1) for July and December (mid century) (Source, Midgley et al 2007).................................................................................................................... 6 Figure 3: Emissions sources in the Eastern Cape for the year 2008 in Gigagrams of Carbon Dioxide Equivalent. Please note that sinks from forestry and other landuse/landuse change are not included, while emissions from Industrial Processes and Product Use are under-represented due to lack of data................................................................................................................................................................ 10 Figure 4: Emissions for GHG types in the Eastern Cape for the year 2008 in Gigarams of Carbon Dioxide Equivalent. Little or no data was available for HFCs, PFCs and SF6. ..................................... 10 Figure 5: Global cost curve for greenhouse gas abatement measures - strategic options for climate change mitigation (source: UNEP/GRID 2008) ..................................................................................... 11 Figure 6: World abatement of energy-related CO2 emissions in the 450 ppm scenario (Source: World Energy Outlook 2009, IEA) .................................................................................................................... 12 Figure 7: Gross direct jobs for new generation capacity of various energy types (Source: AGAMA Energy 2003) ......................................................................................................................................... 14 Figure 7: Climate Change Response Cycle (Source: IPCC 2001)........................................................ 15 Figure 8: Programmatic framework for multi-sectoral adaptive response planning. ............................. 16 Figure 9: Framework for multi-sectoral mitigation programmes. ........................................................... 17

Executive Summary
iv
LIST OF TABLES
Table 1: Impacts of extreme significance for various sectors as identified in the preliminary risk assessment process. ............................................................................................................................... 7 Table 2: Prioritized technologies for mitigation in the Eastern Cape..................................................... 12 Table 3: Estimated World-wide Employment in the Renewable Energy Sector in 2006. Source: UNEP 2008. ...................................................................................................................................................... 13 Table 4: Recommended programmes in response to the impacts of extreme significance identified in the systematic risk assessment. ............................................................................................................ 16 Table 5: Proposed integrated mitigation programmes........................................................................... 17
Executive Summary
v
ACRONYMS AND ABBREVIATIONS
AFOLU Agriculture, Forestry and other Land Use AR4 Fourth Assessment Report of the IPCC CO2e Carbon Dioxide Equivalent COP Conference of Parties
DEDEA Department of Economic Development and Environmental Affairs
DEA Department of Environmental Affairs ECCCRS Eastern Cape Climate Change Response Strategy ECDC Eastern Cape Development Corporation ECSECC Eastern Cape Socio-Economic Consultative Council GHG Greenhouse Gas GRIP Greenhouse Gas Regional Inventory Protocol IPCC Intergovernmental Panel on Climate Change IPPU Industrial Processes and Product Use LTMS Long Term Mitigation Scenarios PGDP Provincial Growth and Development Plan PIDS Provincial Industrial Development Strategy RD&ATS Rural Development and Agrarian Transformation Strategy UNFCCC United Nations Framework Convention on Climate Change WMA Water Management Area

Executive Summary
1
1 INTRODUCTION
It is internationally recognised that climate change is one of the greatest challenges of our time. There is an urgent need to combat climate change and to stabilize greenhouse gas (GHG) concentrations in the atmosphere at a level that would prevent dangerous interference with the climate system. This is affirmed by the Copenhagen Accord adopted in 2009 by the 15
th session of the Conference of the Parties (COP 15) to the United Nations Framework
Convention on Climate Change (UNFCCC). Climate change is likely to have pervasive effects. Furthermore, the far reaching impacts of climate change experienced in the foreseeable future will be felt in some way by every person and every organisation, public or private, and at all levels, from strategic management to operational activities for many years to come. The effects will impact across environmental issues, economic performance, social behaviour, infrastructure and other aspects of human existence. South Africa, and particularly the presidency, is playing an increasingly important and respected role in international climate change negotiations. This is highlighted by the fact that South Africa will be hosting COP 17 in Durban in November and December 2011. In keeping with the national initiative, a process to develop an Eastern Cape Climate Change Response Strategy (ECCCRS) was initiated by the Eastern Cape Provincial Department of Economic Development and Environmental Affairs (DEDEA) in January 2010. The Eastern Cape Provincial Government recognises that the Province is contributing to climate change, while at the same time it is vulnerable to the effects of climate change. Provincial government recognises the importance of initiating policy responses to facilitate planned and coordinated approaches to both climate change mitigation and adaptation. During the course of the development of the ECCCRS, the National Climate Change Response Green Paper was released (December 2010). Section six of the Green Paper states that in order to ensure that climate change considerations and the climate change responses outlined in the Green Paper are fully mainstreamed into the work of government, all three spheres of government, all government departments and all state owned enterprises must –
• By 2012, conduct a review of all policies, strategies, legislation, regulations and plans falling within its jurisdiction or sphere of influence to ensure full alignment with the National Climate Change Response Policy.
• By 2014, ensure that all policies, strategies, legislation, regulations and plans falling within its jurisdiction or sphere of influence are fully aligned with the National Climate Change Response Policy
The Green Paper affirms the need for a provincial response process, and supports the issues and priorities identified in the ECCCRS. The Development of the ECCCRS has entailed four phases, namely:
• Phase I - Eastern Cape Climate Change Scenario, where an understanding of the issues and context of climate change in the Eastern Cape was developed. The phase includes five components, namely:
• Legal and Policy Framework – where the international, national and local policy and legislative context for climate change response in the Eastern Cape is assessed;
• Climate Change Scenarios and Impacts - where the manifestations of climate change and related impacts relevant to the Eastern Cape are identified;
• Risk Assessments of appropriate sectors and resources of the Eastern Cape – where a systematic process of identifying and prioritising risks to various sectors is undertaken;

Executive Summary
2
• Eastern Cape provincial development priorities – where development policies and strategies are reviewed in order to ensure that the ECCCRS process is informed by these priorities;
• Greenhouse gas inventory – where a preliminary assessment of the greenhouse gas “footprint” of the Province is undertaken.
• Phase II: Provincial Needs and Technology Assessment – where technical options for climate change mitigation most appropriate to the circumstances and needs of the Eastern Cape are identified.
• Phase III: Guideline Document on Sectoral Climate Change Action Plans – where priority response options are identified and developed as cross-sectoral programmes. The response programmes are grouped into adaptation programmes and mitigation programmes.
• Phase IV: Eastern Cape Climate Communications, Education and Public Awareness Strategy.
Each phase has been documented as a separate volume. However, the substance of each phase is summarised in sections 2, 3,4 and 5.

Executive Summary
3
2 PHASE 1: EASTERN CAPE CLIMATE CHANGE SCENARIO
2.1 Legal and Policy Framework
A comprehensive understanding of the policy and legislative environmental is an essential component in developing a climate change response strategy for the Eastern Cape Province. A stand alone ECCCRS legal and policy assessment was drafted for the process, which forms an annexure to Volume 1. The document provides an overview of the international and national policy and legislative environment. Internationally, South Africa is a signatory to the 1994 United Nations Framework Convention on Climate Change (UNFCCC) and its associated Kyoto protocol (1997). The most important national policy is the National Climate Change Response Green Paper 2010. The Green Paper is the key policy document framing the South African response to the challenges of climate change. In terms of the Green Paper, South Africa will implement the following strategies in order to achieve its climate change response objectives:
• Taking a balanced approach to both climate change mitigation and adaptation responses in terms of prioritisation, focus, action and resource allocation.
• Prioritising the development and maintenance of the science-policy interface and knowledge management and dissemination systems to ensure that climate change response decisions are informed by the best available information.
• The short-term prioritisation of adaptation interventions that address immediate threats to the health and well-being of South Africans including interventions in the water, agriculture and health sectors.
• The prioritisation of mitigation interventions that significantly contribute to a peak, plateau and decline emission trajectory where greenhouse gas emissions peak in 2020 to 2025 at 34% and 42% respectively below a business as usual baseline, plateau to 2035 and begin declining in absolute terms from 2036 onwards, in particular, interventions within the energy, transport and industrial sectors.
• The prioritisation of mitigation interventions that have potential positive job creation, poverty alleviation and/or general economic impacts. In particular, interventions that stimulate new industrial activities and those that improve the efficiency and competitive advantage of existing business and industry.
• Prioritising the development of knowledge generation and information management systems that increase our ability to measure and predict climate change and, especially extreme weather events, floods, droughts and forest and veld fires, and their impacts on people and the environment.
• The mainstreaming of climate change response into all national, provincial and local planning regimes.
• The use of incentives and disincentives, including through regulation and the use of economic and fiscal measures to promote behaviour change that would support the transition to a low carbon society and economy.
• Acknowledging that, with the energy intensive nature of the South African economy, the mitigation of greenhouse gases is generally not going to be easy or cheap and that Government must support and facilitate the mitigation plans of, in particular, the energy, transport and industrial sectors.
• The recognition that sustainable development is also climate friendly development and that that; the more sustainable our development path is, the easier it will be to build resilience to climate change impacts.
• Recognise that measures taken by developed countries in their efforts to respond to climate change may have detrimental effects on high carbon and energy intensive economies such as South Africa. These response measures may include trade measures including border tax adjustments, and could be reflected in a reluctance to
trade in goods with a high carbon footprint. South Africa’s climate change strategy

Executive Summary
4
must recognise and address this and also create mechanisms that will give high carbon sectors the support and time to move to lower carbon forms of production.
• Recognise that South Africa’s response to climate change will have major implications for both the Southern African region and for Africa as a whole and ensure that national responses are aligned to, support and operate as part of a broader regional response.
The most important national legislation relating to climate change includes among others:
• The National Environmental Management Act 107 of 1998 (NEMA);
• The National Environmental Management: Air Quality Act 39 of 2004;
• The National Environmental Management: Waste Act 59 of 2008;
• The Energy Act, 2008;
• The National Environmental Management: Integrated Coastal Management Act 24 of 2008 (NEM:ICMA); and
• South Africa Renewable Energy Feed-in Tariff (REFIT), Regulatory Guidelines 26 March 2009.
In the South African context, numerous opportunities related to climate change are noted, especially regarding mitigation actions, which can be classified as follows:
• Create new streams of revenue from greenhouse gases reduction projects;
• Technology transfer and development;
• Access to foreign investment;
• Cost saving from increased energy efficiency and conservation;
• Poverty alleviation through income and employment generation associated with mitigation and development programmes;
• The Clean Development Mechanism (CDM) and the carbon market and involvement in emissions trading (buying or selling carbon credit);
• Opportunities to develop new products, services or technologies;
• Carbon neutral activities or projects to offset emissions from parts of its operations by buying or acquiring carbon credits; and
• Development of strategic partnerships with national and international partners.
2.2 Climate Change Scenarios and Impacts
Climate Change is defined by the United Nations Framework Convention on Climate Change (UNFCCC) as “a change of climate which is attributed directly or indirectly to human activity that alters the composition of the global atmosphere and which is in addition to natural climate variability over comparable time periods”. Global warming is defined by the UNFCCC as “the increase in the earth’s temperature, in part due to emissions of greenhouse gases (GHG’s) associated with human activities such as burning fossil fuels, biomass burning, cement manufacture, cow and sheep rearing, deforestation and other land-use changes.” The manifestations of climate change in South Africa are likely to include:
• Higher temperatures;
• Altered rainfall patterns;
• More frequent or intense extreme weather events including heat-waves, droughts, storms and floods; and

Executive Summary
5
• Rising sea levels (which, associated with more intense storm surges and floods, may result in local inundation and coastal erosion).
The Eastern Cape is expected to experience highest temperature increases towards the north-west interior, while lowest increases are likely along the coast (Figure 1). Associated with the higher temperature will be increases in evaporation rates and increased intensity of droughts.
Figure 1: Projected median change in maximum surface temperature by 2050 (Source: Midgley et al 2007). In regard to precipitation, downscaling models show a wetting trend to the east and northeast of the country and a drying trend to the south and particularly the south west (Midgley et al 2007). Figure 2 indicates projections for South Africa.

Executive Summary
6
Figure 2: Projected change in total annual rainfall (mm month-1) for July and December (mid century) (Source, Midgley et al 2007).
As with the national scenario, downscaling models for the Eastern Cape indicate future precipitation which is generally stable or slightly higher than present, with increasing intensity. Increased precipitation is more likely to the east of the province (Johnston et al, 2011). Although little research has been conducted for sea-level rise impacts on the Eastern Cape, useful information exists for the City of Cape Town and Durban. Studies for these cities give local sea level rise scenarios ranging from 2m to 6.5m depending on exposure.
2.3 Eastern Cape Province Development Priorities
In order to assess the potential impacts of climate change and appropriate responses in the Eastern Cape, it is important to understand the local context. More specifically, it is important to understand how current development priorities for the Province will be affected. The assessment of provincial development priorities focuses on the implications of climate change on social and economic development plans in the Eastern Cape, including:
• Provincial Growth and Development Plan (PGDP);
• Provincial Industrial Development Strategy (PIDS);
• Programmes under the PGDP. The assessment outlines the relevance of climate change to these plans and programmes. For example:
• Initiatives and programmes reflected in provincial plans and programmes need to take into consideration risks and impacts and limitations imposed by climate change, such as increased temperatures; changes in precipitation levels; increased storm events; tidal surges and sea-level rise; and consider adaptation measures.
• Infrastructure development needs to take into account the impact of changing variables such as higher return periods for flooding and droughts, more extreme weather events, and sea level rise. Infrastructure development should pay close attention to geographic areas at highest risk such as flood–prone areas and areas close to sea-level.
• Development plans and programmes need to take into consideration the growing need for climate change mitigation and clean energy projects as development direction and economic opportunity. Such a development direction is underscored by the growing green economy.

Executive Summary
7
• Development plans and programmes need to consider co-funding opportunities through mechanisms such as trading of Carbon Credits and Climate Change Adaptation Funds.
• It should be emphasised that the successful outcomes of development plans and programmes, particularly in regard to poverty alleviation and food security, will increase the resilience of vulnerable communities to climate change.
2.4 Risk and Vulnerability Assessment of Sectors and Resources
The effects of climate change such as temperature increases and sea-level rise may have significant knock on effects which combine to threaten the environmental, economic and social systems of the province. These effects also threaten the continuity and functioning of provincial and local governance institutions and their associated mandate in the Eastern Cape A climate change risk assessment matrix was developed as part of the ECCCRS. The risk assessment matrix aims to facilitate a step-wise approach to understanding which climate change impacts may affect the province, how serious these impacts are likely to be, and which provincial plans, agencies and departmental and municipal mandates are directly affected. The following systems, sectors or infrastructure types are included in the matrix: • Agricultural Sector • Air Quality Systems • Biodiversity Systems • Coastal and Marine Systems • Energy Services Infrastructure • Fisheries & Aquaculture Sector • Forestry Sector • Geology & Soils Systems • Health Services Infrastructure • Social & Economic Systems • Tourism Sector • Transport Infrastructure • Water Resources Systems • Water Services Infrastructure Climate change risks assessed as being of extreme significance are given in the table below. Note that these risks were assessed at the scale, and in the context of, the various mandates of the Eastern Cape Provincial Government. Table 1: Impacts of extreme significance for various sectors as identified in the preliminary risk assessment process.
Climate Change Manifestation
2nd Order Impact 3
rd Order Impact
Systems/sectors/ Infrastructure
More hot days and heat waves
Increased frequency of fire danger index reaching high-extreme, coupled with berg-wind conditions
Risk of major loss of livestock, grazing, crops and infrastructure. Threats to financial sustainability of existing commercial and subsistence farming operation and rural livelihoods; Reduced food security.
Agriculture Sector
Increased storm severity/ Extreme weather events.
Increased inundation and loss of coastal land, wetlands and estuaries
Increased damage to/loss of coastal property and infrastructure and increased insurance premiums
Coastal and Marine Systems

Executive Summary
8
More hot days and heat waves
Increased frequency of fire danger index reaching high-extreme, coupled with berg-wind conditions
Risk of major and widespread loss of standing stocks and threats to financial sustainability of existing operations.
Forestry Sector
More hot days and heat waves
Increased morbidity and mortality among elderly and infirm (e.g. HIV/AIDS patients)
Increased strain on health services Social & Economic Systems
Higher mean temperatures
Coupled with increased rainfall, spread in range of diseases and vectors, including cholera, malaria and bilharzia.
General increase in occurrence of disease; exacerbation of effects on people with HIV/AIDS, the elderly and the poor.
Social & Economic Systems
Increased storm severity/ Extreme weather events.
Increased storm surges coupled with sea level rise and flooding from both climate change causes and catchment hardening.
Direct threat to livelihoods, services and infrastructure in coastal low lying areas.
Social & Economic Systems
Increased storm severity/ Extreme weather events.
Coupled with more intense rain, catchment hardening due to urban development, and reduced integrity of water catchments: increased risk of flooding or flash floods
Direct threat to infrastructure within flood-prone areas; Direct threat to human life.
Social & Economic Systems
More hot days and heat waves
Increased frequency of fire danger index reaching high-extreme
Increased fire frequency increases direct threat to human life; threats to livelihood and infrastructure.
Social & Economic Systems
More hot days and heat waves
Increased morbidity and mortality among elderly and infirm (e.g. HIV/AIDS patients)
Direct threat to livelihoods and social services
Social & Economic Systems
Higher mean temperatures
Increased evaporation, reduced soil moisture, reduced runoff and river base flow.
Compounded by reduced MAP, systemic water shortages will limit economic growth potential to the south-west.
Social & Economic Systems
Sea level rise Coupled with storm surges and flood events exacerbated by catchment hardening, inundation and wave damage to coastal low lying areas.
Direct threat to livelihoods, services and infrastructure in coastal low lying areas.
Social & Economic Systems
Increased storm severity/ Extreme weather events.
Crop damage from hail and wind and heavy rain
Increased risk of crop failure; threats to commercial and subsistence agriculture, rural livelihoods and food security.
Social & Economic Systems
Longer dry spells and increased likelihood/ severity of droughts
Increased risk/frequency of dry land crop-failure; Increased mortality and reduced productivity among livestock.
Threats to commercial and subsistence agriculture, rural livelihoods and food security.
Social & Economic Systems
More hot days and heat waves
Heat waves coupled with dry conditions may increase the risk of uncontrollable shack fires in informal settlements
Threat to human life. Threats to urban livelihoods and increased strain on urban disaster management systems.
Social & Economic Systems
Increased storm severity/ Extreme weather events.
Increased frequency of storm surges
Reduced safety of personnel and increased frequency of injury or loss of life
Transport infrastructure

Executive Summary
9
2.5 Eastern Cape Greenhouse Gas Inventory
The National Department for Environmental Affairs (DEA) is responsible for the development of South Africa’s National GHG Inventory. South Africa has developed three national inventories covering the years 1990, 1994 and 2000. The 2000 GHG Inventory has been developed using the 2006 IPCC Guidelines. Data availability has been a key challenge in developing the 2000 GHG Inventory with most of the data only being available at an aggregated national level rather than at provincial, local or point source level. A preliminary inventory for the Eastern Cape was undertaken as part of the ECCCRS. The inventory is for the year 2008, but is discussed in the context of the National Greenhouse Gas Inventory (year 2000). It should be emphasised that the Provincial inventory is not of the level of rigour and detail as the National Inventory. The results reported here are not authoritative, but rather are given for indicative purposes. As per the 2006 IPCC guidelines, the inventory classifies emissions into the following four categories:
• Energy: emissions within this sector are from the combustion of fuel and fugitive fuel emissions from stationary and mobile energy activities including: public electricity and heat production; petroleum refining; manufacture of solid fuels; other energy industries; manufacturing industries and construction; transport; commercial; residential; agriculture; forestry; fishing; and fugitive emissions from coal mining, coal-to-liquid, oil and natural gas activities.
• Industrial Processes and Product Use (IPPU): emissions within this sector comprise by-product or fugitive emissions of GHGs from industrial processes. Emissions from the combustion of fuel in industry are reported under Energy.
• Waste: emissions within this sector are from waste management including disposal of solid waste on land and wastewater treatment.
• Agriculture, Forestry and other Land Use (AFOLU): emissions from this sector include anthropogenic emissions from agricultural activities except for fuel combustion (reported under Energy) and sewage emissions (reported under Waste). Activities include enteric fermentation, manure management, agricultural soils, prescribed burning of savannas and field burning of agricultural residues. This sector also includes total emissions from and removals by forest and land use change activities including changes in forest and other woody biomass stocks, forest and grassland conversion, and emissions from and removals by soil.
The results of the preliminary provincial inventory indicate that the energy sector is responsible for 67% of emissions, while IPPU, AFOLU and Waste are responsible for 1%, 28% and 5% respectively (see Figure 3). However, these figures are deceptive and should be used with caution in that AFOLU is overstated (sources and sinks from forestry and land use have not been included through lack of readily available data), while IPPU is understated (lack of readily available data). Likewise, the results for waste should be viewed with caution in that they are based on population data, rather than measured waste generation, treatment and disposal data. The ratio of greenhouse gas types (expressed in carbon dioxide ton equivalent) are 60% Carbon dioxide, 27% Methane, 11% Nitrous oxide and 2% HFC, PFC and SF6. These ratios are illustrated in Figure 4. While 435,461 Gigagrams of Carbon dioxide equivalent were emitted for the whole of South Africa in 2000, 38,991 Gigagrams were emitted for the Eastern Cape in 2008. In other words, the Eastern Cape produced 9% of national emissions (bearing in mind the 8 year gap between inventories).

Executive Summary
10
0.00
5000.00
10000.00
15000.00
20000.00
25000.00
30000.00
CO2eq (Gg)
Series1 10734.32 26124.89 244.47 1887.60
Agriculture Energy Industrial Processses Waste
Exludes sinks
from forestry
and others
Under -represented
due to data gaps
Figure 3: Emissions sources in the Eastern Cape for the year 2008 in Gigagrams of Carbon Dioxide Equivalent. Please note that sinks from forestry and other landuse/landuse change are not included, while emissions from Industrial Processes and Product Use are under-represented due to lack of data.
SF6, 0.00PFC, 0.01HFC, 0.02
N2O
11%
CH4
27%
CO2
60%
0.00
5000.00
10000.00
15000.00
20000.00
25000.00
30000.00
CO2 CH4 N2O HFC PFC SF6
CO2eq (Gg)
Unde-represented due
to data gaps
Figure 4: Emissions for GHG types in the Eastern Cape for the year 2008 in Gigarams of Carbon Dioxide Equivalent. Little or no data was available for HFCs, PFCs and SF6.

Executive Summary
11
3 PHASE 2: EASTERN CAPE TECHNOLOGY ASSESSMENT
The opportunities for mitigation of climate change impacts by means of technical interventions or programmes are generally well understood and are described in the international literature (IPCC, 2007). Furthermore, these technical responses can be prioritised among the non-technical mitigation opportunities in terms of cost-efficiency as illustrated in Figure 5 in the form of marginal abatement cost (MAC) curves.
Figure 5: Global cost curve for greenhouse gas abatement measures - strategic options for climate change mitigation (source: UNEP/GRID 2008) A key observation from the analysis of the strategic options above is that, apart from some contributions from forestation, livestock and soils, the predominant opportunities for mitigation are in the energy sector. It is clear that the highest priority opportunities are in terms of energy efficiency – both on the demand and the supply side. These are either no-cost or relatively low-cost interventions which realise savings in resource consumption, and also hence costs, and which have attractive paybacks or returns on investment. This observation is confirmed by the findings of the IEA’s World Energy Outlook which highlights the opportunity for energy efficiency to achieve two-thirds of the abatement in 2020. Increased use of renewable energy would contribute approximately a fifth. These opportunities are illustrated in Figure 6.

Executive Summary
12
Figure 6: World abatement of energy-related CO2 emissions in the 450 ppm scenario (Source: World Energy Outlook 2009, IEA) The opportunities for technical responses in the Eastern Cape are more specific and particular to the social, economic and environmental context in the province over the short- to medium-term. The most important and promising technologies and the appropriateness of technology opportunities for conditions in the Eastern Cape have been assessed in terms of:
• Maturity of the technology;
• Opportunities for cooperation with other organizations; and
• Options for promotion within ECP Policies and Sector Plans. Based on the assessment, key technologies for mitigation in the Eastern Cape Province have been prioritised in the table below. These represent technologies where the most significant gains in mitigation can be achieved for time, effort and finances invested. This is based on appropriateness of technology and ease of implementation in the Eastern Cape. Table 2: Prioritized technologies for mitigation in the Eastern Cape.
Technology option Application Comment
1 Energy efficiency in buildings and appliances
- GreenStar rating of buildings
- Efficient air-conditioning
- Efficient lighting
Buildings lifetimes exceed 50 years and consequently these lock in emissions or savings for a long time All government / municipal buildings will soon be required to meet a Four Star rating
2 Heat pump technologies
- Heat pumps and efficient water heating
Manufacturing opportunities offer a double return on investment in energy efficiency with heat pumps
3 Solar space and water heating
- Passive solar design standards
- Building standards to include SWH
Highly topical and appropriate within the context of the DoE Strategic Framework for SWH and 1 million SWH target
4 Energy efficiency in transport
- Fuel efficiency standards
- Electric vehicles - Plan for non-
motorised transport
Security of supply issues are important too Exposure to price risks in the future costs of carbon based fuels
5 Industrial energy efficiency
- Efficient motors and drives
Effective frameworks and mechanisms (beyond Eskom’s DSM scheme) are required to enable / accelerate these investments
6 Smart grids and metering systems
- Upgrade metering - Introduce
intelligence in the network
Local authorities (and REDs in future?) will benefit in higher levels of service delivery and deferred investments for new capacity

Executive Summary
13
7 Biomass energy systems
- Energy from waste - Agricultural and
household biogas
The E. Cape has a significant resource for on-site and distributed energy service provision
8 Wind energy systems - Utility-scale wind farms
- Small scale mini-grid and stand-alone systems
The E. Cape has some of the best wind regimes in SA Infrastructure can be implemented more quickly than other systems (subject to EIA approvals)
9 Hydro energy systems - Small and medium scale systems
The E. Cape has the best resource in the country and some excellent experience with existing capacity
10 Solar PV systems - Stand-alone systems for household electrification
- Grid-connected PV on buildings and for utility generation
Increased access to energy services can be rapidly addressed Grid-connected systems can also be implemented very quickly but the costs are currently still high for good ROIs
Although climate change has many negative social and economic implications, the necessary adjustment of global modes of production to a more sustainable, low carbon economy is likely to result in many opportunities for the generation of “green” jobs. Currently green job creation is taking place in both affluent countries and in some of the major developing economies. As an illustration, employment in the renewables sector in Germany increased from 66,600 to 259,100 between 1998 and 2006 (UNEP 2008). Table 3 shows that over 2.3 million jobs world-wide were attributable to the Renewable Energy Sector in 2006, with the greatest number of jobs coming from renewable biomass. Table 3: Estimated World-wide Employment in the Renewable Energy Sector in 2006. Source: UNEP 2008.
RE Type Number of Jobs
Wind 300,000
Solar PV 170,000
Solar Thermal 624,000
Biomass 1,174,000
Hydropower 39,000-plus
Geothermal 25,000
Renewables, Combined 2,332,000-plus
A study by AGAMA Energy in 2003 gives details of the relative number of jobs per Terawatt Hour (TWh) for different energy generation types (see Figure 7). Renewable energy technologies result in more jobs per unit energy than nuclear, coal and gas. Significant numbers of jobs are created in the Biogas, Bioethanol, Solar Water Heating and Biodiesel industries.

Executive Summary
14
Comparison of Job Creation Potential of Various Energy Generation Technologies
0
2000
4000
6000
8000
10000
12000
14000
16000
18000
Jobs/TWh equivalent
Jobs/TWheq 80 130 700 952 1341 3778 8733 16318
Nuclear Gas Coal
Renewable
Energy
Technologies
Biogas BioethanolSolar Water
HeatingBiodiesel
Figure 7: Gross direct jobs for new generation capacity of various energy types (Source: AGAMA Energy 2003) Policies and measures that can be introduced by the Eastern Cape Provincial Government to promote technical options for mitigation include requirements for market creation and development, RD&D efforts, investments in new technologies, standard setting and the development of an enabling regulatory environment.

Executive Summary
15
4 PHASE 3: GUIDELINE DOCUMENT ON SECTORAL CLIMATE CHANGE ACTION PLANS
Phase III of the ECCCRS deals with the development of provincial response programmes and plans. The context of response planning in regard to the overall climate change response process is illustrated in Figure 8 below.
Figure 8: Climate Change Response Cycle (Source: IPCC 2001)
4.1 Adaptation
The impacts of climate change will, to greater and lesser degrees, affect every Provincial department, development plan and municipality. Likewise, climate change responses are cross sectoral. Effective response processes are cross-cutting and cannot be dealt with by each sector or department in isolation. Rather, integrated response programmes are required where multiple sectors and departments contribute to a common climate change issue to ensure effective adaptation responses. A programmatic framework for such multi-sectoral planning is described in Figure 9 below.
Phase 3: Response Planning.

Executive Summary
16
Figure 9: Programmatic framework for multi-sectoral adaptive response planning. The impacts of extreme significance as identified in Table 1 have been grouped into adaptive response programmes as given in Table 4 below. Table 4: Recommended programmes in response to the impacts of extreme significance identified in the systematic risk assessment.
Adaptation Category Adaptation objective
Coastal Infrastructure and Livelihoods
• Increased resilience of coastal infrastructure and resources to the effects of sea-level rise, storm-surges, flooding and increased sea temperature (fisheries).
• Improved response to the impacts of extreme coastal events.
Water Scarcity
• Mainstreaming climate change induced water scarcity in institutional decision-making and planning in water stressed areas in the Eastern Cape Province.
• Effective water resources management and efficient water use throughout the Eastern Cape Province.
Flood Management
• Flood prevention
• Reducing vulnerability to flooding events;
• Improved response to the impacts of flooding events
Responses to increased risk of wildfires • Improved wildfire prevention and suppression
Managing the effects of increased temperature on human lives
• Societal adaptation to human health impacts from temperature increases associated with climate change.
Food security • Incorporating Climate Change acclimatization and resilience in provincial food security programmes.
Draft adaptive response options and response programmes have been developed in the Phase III document for each adaptation category in line with the response framework set out in Figure 9.
Common climate change impact affecting many sectors or departments
Adaptation objectives common to many sectors or departments
Cross-Cutting/Integrated Response Programme:
Mapping; Regulations; Standards and Specifications; Support Programmes
Programme Custodian: Champion - existing or new forum or committee
Programme Participants: Affected departments, agencies and sectors
1st Generation Action Plan:
Objectives, Targets, Allocation of Responsibility, KPAs, Budgets, Key Stakeholders; Relevant Policy and Legislation

Executive Summary
17
4.2 Mitigation
As with adaptation, mitigation activities would be relevant to many sectors. This means that integrated mitigation programmes are required where multiple sectors and departments contribute to a common mitigation objective. As with adaptation, a programmatic framework for such multi-sectoral mitigation planning is described in Figure 10 below.
Figure 10: Framework for multi-sectoral mitigation programmes.
Drawing from the preliminary greenhouse gas inventory described in Phase I, and from the technology options described in Phase II, a set of pragmatic greenhouse gas mitigation programmes is proposed. These are developed in the section below and introduced in Table 5 below.
Table 5: Proposed integrated mitigation programmes. Mitigation Category Mitigation objective
Mainstreaming GHG Mitigation in Provincial and Local Government and in Industry
• Mainstreaming GHG Mitigation in Decision-making at all levels of government within the Eastern Cape Province
• Promoting GHG Mitigation in Provincial and Local Government Operations.
• Promoting Greenhouse Gas Reporting in Industry.
Promotion of Renewable Energy in the EC
• Create an enabling environment for investment in, implementation and use of clean energy in the Eastern Cape.
Mitigation and opportunities for sustainable livelihoods
• Facilitate integrated lead projects that promote sustainable livelihoods and local economic development while achieving (tradable) emission reductions.
Mitigation in Solid Waste and Wastewater Treatment
• Reduction in organic waste to landfill, renewable energy from waste, and methane use or destruction.
Greenhouse Gas Mitigation in Transport
• Facilitate shift to low greenhouse gas modes of transport and transport systems.
Draft mitigation programmes have been developed in the Phase III document for each adaptation category in line with the response framework set out in Figure 10. It should be noted that both the adaptation and mitigation programmes are working documents which require regular review and revision by relevant departments or stakeholders
Greenhouse gas mitigation opportunities common to many departments
Mitigation objectives common to many departments
Cross-Cutting/Integrated Response Programme:
Initiatives; Regulations; Standards and Specifications; Support Programmes.
Programme Custodian: Champion - existing or new forum or committee
Programme Participants: Participating departments, agencies and sectors
1st Generation Action Plan:
Objectives, Targets, Allocation of Responsibility, KPAs, Budgets, Key Stakeholders; Relevant Policy and Legislation

Executive Summary
18
5 PHASE 4: COMMUNICATION, EDUCATION AND PUBLIC AWARENESS STRATEGY
As climate change is a global problem with wide-ranging impacts, it is essential that the climate change message is communicated successfully to as many different and affected groups as possible. Policy makers, businesses, the media and the public are increasingly interested in the complex issue of climate change. This generates a multitude of information and opinions about climate change, and presents significant challenges in accurately and effectively communicating the issue. With regard to the ECCCRS, it is important to consider how the outcomes and programmes coming out of the study (particularly those mentioned in Phase III) are communicated to various stakeholders. Phase IV of the process outlines a climate change communications, education and public awareness strategy. A targeted approach relevant to the types of audience, together with specific communication approaches, is recommended. Recommended target audiences are given below:
• Provincial legislature and local government councillors;
• Provincial and local government departments;
• Affected industry and service sectors;
• Relevant committees associated with the response programmes recommended in Phase III of the ECCCRS; and
• The general public. The communication approaches are detailed in the Phase IV document. A pro-forma business plan for the further development and rollout of the ECCCRS communication, awareness and education plan is also set out in the Phase IV document. A critical climate change message is that “Everyone has a role to play in reducing emissions (mitigation) and everyone will be affected by climate change (adaptation)”.

Executive Summary
19
6 REFERENCES
G Midgley, R Chapman, P Mukheibir, M Tadross, B Hewitson, S Wand, R Schulze, T Lumsden, M Horan, M Warburton, B Kgope, B Mantlana, A Knowles, A Abayomi, G Ziervogel, R Cullis and A Theron, 2007. Impacts, Vulnerability and Adaptation in Key South African Sectors: An Input into the Long-Term Mitigation Scenarios Process. University of Cape Town. 20pp. IEA (2008) Energy Technology Perspectives 2008: ScenarIos and Strategies to 2050 - In support of the G8 Plan of Action, OECD/IEA, Paris. IPCC (2007) http://www.ipcc.ch/publications_and_data/ar4/wg3/en/contents.html accessed on 21 April 2010. IPCC, 2007: Climate Change 2007: Synthesis Report. Contribution of Working Groups I, II and III to the Fourth Assessment Report of the Intergovernmental Panel on Climate Change [Core Writing Team, Pachauri, R.K and Reisinger, A. eds.)]. IPCC, Geneva, Switzerland, 104 pp. Johnston, P., Coop, L., and Lennard, C., 2011. Climate Change Projections and Impacts for the Eastern Cape region of South Africa. Climate Systems Analysis Group. Cape Town. Report commissioned by Eastern Cape Department of Economic Development and Environmental Affairs. UNEP (2008): Green Jobs: Towards decent work in a sustainable, low-carbon world. Available online: http://www.unep.org/greeneconomy/ UNEP/GRID 2008: Strategic options for climate change mitigation. UNEP/GRID Arendal Maps and Graphics Library, http://maps.grida.no/go/graphic/strategic-options-for-climate-change-mitigation)

Phase 1: Climate Change Scenario
Eastern Cape Climate Change Response Strategy i
PHASE 1: EASTERN CAPE CLIMATE CHANGE SCENARIO

Phase 1: Climate Change Scenario
Eastern Cape Climate Change Response Strategy ii
CONTENTS
1 INTRODUCTION 9
2 LEGAL AND POLICY FRAMEWORK 11
2.1 Overview of international policy and regulatory framework 11
2.2 Overview of national policy and regulatory framework 11 2.2.1 National Climate Change Response Green Paper 2010 11 2.2.2 Other national policy 12 2.2.3 National legislation and regulatory framework 14
2.2.3.1 The National Environmental Management Act 107 of 1998 (NEMA) 14
2.2.3.2 The National Environmental Management: Air Quality Act 39 of 2004 14
2.2.3.3 The Energy Act, 2008 15 2.2.3.4 The National Environmental Management: Integrated Coastal
Management Act 24 of 2008 (NEM:ICMA) 15 2.2.3.5 South Africa Renewable Energy Feed-in Tariff (REFIT),
Regulatory Guidelines 26 March 2009 15
2.3 Climate change opportunities 15
3 CLIMATE CHANGE SCENARIOS AND IMPACTS 16
3.1 Background 16
3.2 Overview of the climate change phenomenon 16
3.3 Global climate change trends and scenarios 19 3.3.1 Some key observations of global climate change trends 20
3.3.1.1 Temperature 20 3.3.1.2 Sea level rise 21 3.3.1.3 Snow and ice cover 21 3.3.1.4 Rainfall 22 3.3.1.5 Extreme weather events 22
3.3.2 Projections of future changes in global climatic conditions 23 3.3.3 Impacts on Africa 24 3.3.4 Key scientific developments since the IPCC Fourth Assessment Report
(June 2009) 24
3.4 Climate Change in South Africa and the Eastern Cape 26 3.4.1 Some key observations of local climate change trends 27
3.4.1.1 Temperature 27 3.4.1.2 Rainfall 28 3.4.1.3 Sea-level rise 31
4 EASTERN CAPE PROVINCE DEVELOPMENT PRIORITIES 33
4.1 Provincial Growth and Development Plan (PGDP) 33 4.1.1 PGDP strategy framework 33
4.1.1.1 The three key objectives are: 33 4.1.1.2 These key objectives are supported by three foundation
objectives: 33 4.1.2 PGDP targets 33 4.1.3 Strategic objectives 34

Phase 1: Climate Change Scenario
Eastern Cape Climate Change Response Strategy iii
4.1.3.1 Systematic Poverty Eradication through a Holistic, Integrated and Multi-Dimensional approach to Pro-Poor Programming 34
4.1.3.2 Agrarian Transformation and Strengthening Household Food Security 34
4.1.3.3 Consolidation, Development and Diversification of the Manufacturing Base and Tourism Potential 34
4.1.3.4 Infrastructure Development 35 4.1.4 Human Resource Development 35 4.1.5 Public Sector and Institutional Transformation 36
4.2 Provincial Industrial Development Strategy (PIDS) 37 4.2.1 Strategic Framework for Industrial Development 37 4.2.2 Priority Sectors 38 4.2.3 Critical Success Factors 38 4.2.4 High Level Interventions 39 4.2.5 Conclusions 39
4.3 PGDP IMPLEMENTING AGENCIES 40 4.3.1 Accelerated and shared growth Initiative of South Africa (AsgiSA) 40 4.3.2 Rural Development and Agrarian Transformation Strategy (Draft 2009) 41
4.3.2.1 Pillars of the Strategy 41 4.3.3 Massive Food Production Programme 41 4.3.4 Eastern Cape Socio-Economic Consultative Council (ECSECC) 42 4.3.5 Eastern Cape Development Corporation (ECDC) 43
4.3.5.1 Sectors and Industries 43
5 RISK AND VULNERABILITY ASSESSMENT OF SECTORS AND RESOURCES 44
5.1 Impacts identified in other studies in South Africa. 44 5.1.1 Durban 44 5.1.2 Cape Town 45
5.1.2.1 Urban water Supplies 45 5.1.2.2 Storm water 45 5.1.2.3 Biodiversity 45 5.1.2.4 Alien invasive species 45 5.1.2.5 Fires 45 5.1.2.6 Coastal zones 45 5.1.2.7 Livelihoods 46 5.1.2.8 Health 46 5.1.2.9 Air pollution 46 5.1.2.10 Sea level rise in the City of Cape Town 46
5.2 Climate Change Risk Assessment Matrix for the Eastern Cape 48 5.2.1 Context 48 5.2.2 Approach 48
5.2.2.1 The primary impacts of Climate Change 49 5.2.2.2 2nd
and 3rd order impacts 50
5.2.2.3 Affected systems, sectors and infrastructure. 51 5.2.2.4 Risks and opportunities 51 5.2.2.5 Notes on the historical occurrence of this impact 52 5.2.2.6 Assessment of likelihood, consequence and significance 52 5.2.2.7 Identifying affected provincial plans and strategies, agencies,
departments and district municipalities. 55 5.2.2.8 Identifying affected national departments 55
5.3 Biodiversity Systems 56 5.3.1 Background 56 5.3.2 Risks, Vulnerability and Opportunities 56 5.3.3 Risk Matrix: Biodiversity systems 57 5.3.4 Relevance to the Provincial Government of the Eastern Cape 58

Phase 1: Climate Change Scenario
Eastern Cape Climate Change Response Strategy iv
5.4 Coastal and Marine Systems 58 5.4.1 Background 58 5.4.2 Risks, Vulnerability and Opportunities 59 5.4.3 Risk Matrix: Coastal and marine systems 59 5.4.4 Relevance to the Provincial Government of the Eastern Cape 61
5.5 Social and Economic Systems 61 5.5.1 Background 61
5.5.1.1 Demographics and Livelihoods 61 5.5.1.2 Economy and Industry 62
5.5.2 Risk and vulnerability 63 5.5.3 Risk Matrix: Social and economic systems 65 5.5.4 Relevance to the Provincial Government of the Eastern Cape 67
5.6 Water Resource Systems 67 5.6.1 Background 67 5.6.2 Risk and vulnerability 68
5.6.2.1 Changes to baseflows and stormflows and their variabilities; 68 5.6.3 Risk Matrix: Water resource systems 72 5.6.4 Relevance to the Provincial Government of the Eastern Cape 74
5.7 Agricultural Sector 74 5.7.1 Background 74 5.7.2 Risks and vulnerability 75 5.7.3 Risk Matrix: Agricultural Sector 75 5.7.4 Relevance to the Provincial Government of the Eastern Cape 77
5.8 Fisheries & Aquaculture Sector 77 5.8.1 Background 77 5.8.2 Risks, Vulnerability and Opportunities 77 5.8.3 Risk Matrix: Fisheries & Aquaculture Sector 78 5.8.4 Relevance to the Provincial Government of the Eastern Cape 79
5.9 Forestry Sector 79 5.9.1 Background 79 5.9.2 Risks and opportunities 80 5.9.3 Risk Matrix: Forestry Sector 80 5.9.4 Relevance to the Provincial Government of the Eastern Cape 81
5.10 Water Services Infrastructure 81 5.10.1 Background 81 5.10.2 Risks and Opportunities 82
5.10.2.1 Rising Sea Levels 82 5.10.2.2 Warmer overall 82 5.10.2.3 Increased water temperature 82 5.10.2.4 Possible increased water demand 82 5.10.2.5 More intense rainfall events: 83 5.10.2.6 Increased inter-annual variability of streamflow. 83
5.10.3 Risk Matrix: Water Services Infrastructure 83 5.10.4 Implications for the Provincial Government of the Eastern Cape 84
5.11 Transport infrastructure 84 5.11.1 Background 84 5.11.2 Risks, Vulnerability and Opportunities 85 5.11.3 Risk Matrix: Transport Infrastructure 85 5.11.4 Relevance to the Provincial Government of the Eastern Cape 87
5.12 Energy services Infrastructure 87 5.12.1 Risks and vulnerabilities 88
5.12.1.1 Sea level rise and storm surges 88 5.12.1.2 Increased wild-fires 89

Phase 1: Climate Change Scenario
Eastern Cape Climate Change Response Strategy v
5.12.1.3 Increased average temperature and heat waves 89 5.12.1.4 Increased mean temperature and precipitation to the east of
the province 89 5.12.2 Risk Matrix: Energy services Infrastructure 89 5.12.3 Relevance to the provincial government of the Eastern Cape 90
6 EASTERN CAPE GREENHOUSE GAS INVENTORY 91
6.1 Introduction 91
6.2 GHG Inventories – Context 91 6.2.1 International 91 6.2.2 Regional GHG Inventories 92
6.3 South Africa’s National GHG Inventory 92 6.3.1 Existing GHG Inventories 92 6.3.2 Future South African GHG Inventories 93
6.4 Recommended approach to calculating the ECP GHG Inventory 94 6.4.1 Approach 94 6.4.2 Methodology 94
6.5 Preliminary GHG Inventory for the Eastern Cape 99 6.5.1 Introduction 99 6.5.2 Detail and Methodology 99
6.5.2.1 Overall Methodology 99 6.5.2.2 Emission Factors 100 6.5.2.3 Activity Data 100 6.5.2.4 Quality Control and Uncertainty 100
6.5.3 National Overview 100 6.5.4 Overview for the Eastern Cape 100 6.5.5 Energy 103
6.5.5.1 Data Sources and Confidence 104 6.5.5.2 Issues and recommendations for improvements 104
6.5.6 Industrial Processes and Product Use 104 6.5.6.1 Data Sources 105 6.5.6.2 Issues and recommendations for improvements 105
6.5.7 Agriculture Forestry and other Landuse 105 6.5.7.1 Data Sources 106 6.5.7.2 Issues and recommendations for improvements 107
6.5.8 Waste 107 6.5.8.1 Data Sources 107 6.5.8.2 Issues and Recommendations for improvements 108
6.5.9 Interaction with SAAQIS 108
7 REFERENCES 109

Phase 1: Climate Change Scenario
Eastern Cape Climate Change Response Strategy vi
LIST OF FIGURES
Figure 1: Climate Change Response Cycle (Source: IPCC 2001)...................................................... 10 Figure 2: Greenhouse effect (Source: United Nations Environmental Programme, 2009) ................. 17 Figure 3: Greenhouse effect (Source: United Nations Environmental Programme, 2009) ................. 17 Figure 4: Emissions of CO2 - selected countries (1995). Source UNEP - GRID Arendal. .................. 18 Figure 5: Schematic framework of anthropogenic climate change drivers, impacts and responses (IPCC 2007) ......................................................................................................................................... 19 Figure 6: Observed changes in (a) global average surface temperature; (b) global average sea level from tide gauge (blue) and satellite (red) data; and (c) Northern Hemisphere snow cover for March-April. All differences are relative to corresponding averages for the period 1961-1990. Source: IPCC 2007 .....................................................................................................................................................22 Figure 7: Projected changes in global temperature to 2100 (Source: United Nations Environmental Programme, 2009) ............................................................................................................................... 24 Figure 8: Comparison of recent estimates of mean sea level rise in 2100, relative to 1990 levels. ... 25 Figure 9: Projected median change in maximum surface temperature by 2050 (Source: Midgley et al 20007). ................................................................................................................................................. 27 Figure 10: Projected change in total annual rainfall (mm month-1) for July and December (mid century) (Source, Midgley et al 2007).................................................................................................. 28 Figure 12: Risk assessment matrix used in this study (left) with an example for the agricultural sector on the right. .......................................................................................................................................... 49 Figure 13: Examples of a chain of impacts initiated by a 1
st order climate change impact. ................ 50
Figure 14: Details and extent of projected impacts on ecological systems as mean global surface temperatures increase (Source: IPCC 2007) ...................................................................................... 57 Figure 15: Percentage of households using electricity for lighting by province (Source: Stats SA Community Survey, 2007) ................................................................................................................... 62 Figure 16: Percentage of households that have access to piped water by province (Source: Stats SA Community Survey, 2007) ................................................................................................................... 62 Figure 17: Actual and forecast GDP growth rate for the Eastern Cape (Source: DEDEA 2010) ........ 63 Figure 18: Ratios of future to present mean annual baseflow derived from ACRU simulations with C-CAM RCM daily climate outputs (Source Schulze et al 2005). ........................................................... 69 Figure 19: Ratios of future to present mean annual stormflow derived from ACRU simulations with C-CAM RCM daily climate outputs (Source Schulze et al 2005). ........................................................... 70 Figure 20: Ratios of future to present mean annual accumulated streamflows derived from ACRU simulations (Source Schulze et al 2005). ............................................................................................ 70 Figure 21: Ratios of future to present mean annual sediment yield and its inter-annual variability, derived from ACRU simulations with C-CAM RCM daily climate outputs (Schulze et al 2005). ......... 71 Figure 22: Current and potential extents of plantation forestry in South Africa (Source ECSECC 2007) ....................................................................................................................................................80 Figure 23: Energy sources for lighting in households in the Eastern Cape, 2007 (Source ELIDZ 2009)............................................................................................................................................................. 88 Figure 24: Eastern Cape provincial energy supply by energy carrier expressed in Megajoules (Data sources: Eskom 2009, South African Petroleum Producers Association 2008).................................. 88 Figure 25: Greenhouse Gas emissions in South Africa for the year 2000 (DEAT 2009). ................. 100 Figure 26: Emissions Sources in the Eastern Cape for the year 2008 in Gigagrams of Carbon Dioxide Equivalent. Please note that sinks from forestry and other landuse/landuse change are not included, while emissions from Industrial Processes and Product Use are under represented due to lack of data. ................................................................................................................................................... 101 Figure 27: Emissions for GHG types in the Eastern Cape for the year 2008 in Gigarams of Carbon Dioxide Equivalent. Little or no data was available for HFCs, PFCs and SF6. ................................. 102 Figure 28: Comparison between the South African National GHG Inventory (2000) and the initial Eastern Cape inventory for 2008. ...................................................................................................... 102 Figure 29: Emissions from combustion of fossil fuels in the Eastern Cape Province in 2008. Note that electricity consumption includes electricity imported from other provinces. ...................................... 104 Figure 30: Emissions from Waste...................................................................................................... 107

Phase 1: Climate Change Scenario
Eastern Cape Climate Change Response Strategy vii
LIST OF TABLES
Table 1: Projected global average surface warming and sea level rise at the end of the 21st century (IPCC, 2007). ....................................................................................................................................... 23 Table 2: Sea level rise scenarios for the City of Cape Town............................................................... 31 Table 3: Diverse 2
nd and 3
rd order impacts for a given 1
st order impact.............................................. 50
Table 4: Different meanings of a similar impact for different sectors. ................................................. 51 Table 5: Likelihood scales for the assessment of climate change risks (AGS 2006).......................... 53 Table 6: Consequence scales for local government risk assessment (AGS 2006). ........................... 54 Table 7: Significance scales based on the degree of likelihood and consequence (AGS 2006). ....... 54 Table 8: Population growth in South Africa by province (Source: Stats SA community survey)......... 61 Table 9: Examples of current and projected climate-change impacts on industry, settlement and society and their interaction with other processes (adapted from Wilbanks et al 2007). .................... 64 Table 10: Water availability per sub-WMA within the Eastern Cape Province – 2000 (million m
3/a)
(source DWAF, 2002) .......................................................................................................................... 67 Table 11: Results of recent hydrological assessments (Schulze et al, in press). ............................... 71 Table 12: Economic impact of new afforestation in the Eastern Cape (Source ECSECC 2007)........ 80 Table 13: List of capital expenditure and implementation projects for 2009/10 (Source: DWA, 2010)............................................................................................................................................................. 81 Table 14: Eastern Cape energy supply in physical units (Data sources: Eskom 2009, South African Petroleum Producers Association 2008; compiled for ELIDZ, 2009). ................................................. 88 Table 15 : GHG and air pollution emissions to be reported ................................................................ 94 Table 16: GHG Emission and Sink Categories ................................................................................... 96 Table 17: Data sources for energy emissions. .................................................................................. 104 Table 18: Data sources for Industrial Process and Product Use emissions...................................... 105 Table 19: AFOLU Sources and Sinks included in the EC GHG Inventory ........................................ 105 Table 20: Emissions from Agriculture (excludes forestry and landuse change) ............................... 106 Table 21: Data sources for Agricultural Emissions............................................................................ 106 Table 22: Data sources for emissions from waste............................................................................. 107

Phase 1: Climate Change Scenario
Eastern Cape Climate Change Response Strategy 8
ACRONYMS AND ABBREVIATIONS
AFOLU Agriculture, Forestry and other Land Use AR4 Fourth Assessment Report of the IPCC CO2e Carbon Dioxide Equivalent COP Conference of Parties
DEDEA Department of Economic Development and Environmental Affairs
ECDC Eastern Cape Development Corporation ECSECC Eastern Cape Socio-Economic Consultative Council GHG Greenhouse Gas GRIP Greenhouse Gas Regional Inventory Protocol IPCC Intergovernmental Panel on Climate Change IPPU Industrial Processes and Product Use LTMS Long Term Mitigation Scenarios PGDP Provincial Growth and Development Plan PIDS Provincial Industrial Development Strategy RD&ATS Rural Development and Agrarian Transformation Strategy UNFCCC United Nations Framework Convention on Climate Change WMA Water Management Area

Phase 1: Climate Change Scenario
Eastern Cape Climate Change Response Strategy 9
1 INTRODUCTION
Climate change is one of the most serious environmental challenges facing the planet and is largely the result of combustion of fossil fuels and release of greenhouse gases into the atmosphere (mostly carbon dioxide) causing the “greenhouse effect”. The Minister of (then) Environmental Affairs & Tourism (DEAT, 2008) has been quoted as saying: “Climate change is every one’s problem and over the next 50 years it may well become the worst social economic and environmental challenge ever faced”. In addition, the Conference of the Parties (COP) to the United Nations Climate Change Convention (UNFCCC) at its fifteen session (COP 15) in Copenhagen (December 2009), adopted a decision that took note of the Copenhagen Accord of 18 December 2009, which amongst other reaffirms the following:
• That climate change is one of the greatest challenges of our time;
• That there is an urgent need to combat climate change and to stabilize greenhouse gas (GHG) concentrations in the atmosphere at a level that would prevent dangerous anthropogenic interference with the climate system;
Climate change is likely to have pervasive affects. Furthermore, the far reaching impacts of climate change experienced in the foreseeable future will be felt in some way by every person and every organisation, public or private, and at all levels, from strategic management to operational activities for many years to come. The affects will impact across environmental issues, economic performance, social behaviour, infrastructure and other aspects of human existence. South Africa, and particularly the presidency, is playing an increasingly important and respected role in international climate change negotiations. This builds on the progress made at a national level towards the development of a National Climate Change Response Strategy. A climate change response policy framework is currently in place, which is reflected in the National Climate Change Response Green Paper which was released for comment in December 2010. In keeping with the national initiative, a process to develop an Eastern Cape Climate Change Response Strategy (ECCCRS) has been initiated by the Eastern Cape Provincial Department of Economic Development and Environmental Affairs (DEDEA). This proactive approach reflects the recognition of the Eastern Cape Provincial Government that the Province is both contributing to climate change, while at the same time is vulnerable to the effects of climate change and that it is important that Provincial Government initiates the development of policy responses to facilitate planned and coordinated approaches to both climate change mitigation and adaptation as illustrated in Figure 1 below.

Phase 1: Climate Change Scenario
Eastern Cape Climate Change Response Strategy 10
Figure 1: Climate Change Response Cycle (Source: IPCC 2001) This document (phase 1 of the process) includes an outline of the legal and policy framework as it relates to Climate Change Response in the Eastern Cape, a review of the climate change phenomenon together with future scenarios, an outline of development priorities in the Eastern Cape, an assessment of climate change risks, and a preliminary Greenhouse Gas inventory.

Phase 1: Climate Change Scenario
Eastern Cape Climate Change Response Strategy 11
2 LEGAL AND POLICY FRAMEWORK
A comprehensive understanding of the policy and legislative environmental is an essential component in developing a climate change response strategy for the Eastern Cape Province. The current section represents a summary of the full legal and policy framework assessment which is included in Appendix A.
2.1 Overview of international policy and regulatory framework
A detailed overview of the international climate change policy and regulatory framework can be found in Part C of Appendix A. In terms of climate change and air quality the following international Conventions are considered to be the most relevant for South Africa, particularly since South Africa is a signatory to both conventions:
• The United Nations Convention on Climate Change 1994 (UNFCCC) and its associated Kyoto protocol, 1997; and
• The Vienna Convention for the Protection of the Ozone Layer, 1985 and its associated Montreal protocol, 1990.
2.2 Overview of national policy and regulatory framework
A detailed overview of the national climate change policy and regulatory framework can be found in Part D of Appendix A.
2.2.1 National Climate Change Response Green Paper 2010
The National Climate Change Response Green Paper (2010) is the key policy document framing the South African response to the challenges of climate change. In terms of the Green Paper, South Africa will implement the following strategies in order to achieve its climate change response objective:
• Taking a balanced approach to both climate change mitigation and adaptation responses in terms of prioritisation, focus, action and resource allocation.
• Prioritising the development and maintenance of the science-policy interface and knowledge management and dissemination systems to ensure that climate change response decisions are informed by the best available information.
• The short-term prioritisation of adaptation interventions that address immediate threats to the health and well-being of South Africans including interventions in the water, agriculture and health sectors.
• The prioritisation of mitigation interventions that significantly contribute to a peak, plateau and decline emission trajectory where greenhouse gas emissions peak in 2020 to 2025 at 34% and 42% respectively below a business as usual baseline, plateau to 2035 and begin declining in absolute terms from 2036 onwards, in particular, interventions within the energy, transport and industrial sectors.
• The prioritisation of mitigation interventions that have potential positive job creation, poverty alleviation and/or general economic impacts. In particular, interventions that stimulate new industrial activities and those that improve the efficiency and competitive advantage of existing business and industry .In order to accurately identify these sectors and the job creation, industrial development potential of these, work will be done in order that the White Paper provides a clear understanding and prioritisation of these and their potential.
• Prioritising the development of knowledge generation and information management systems that increase our ability to measure and predict climate change and,

Phase 1: Climate Change Scenario
Eastern Cape Climate Change Response Strategy 12
especially extreme weather events, floods, droughts and forest and veld fires, and their impacts on people and the environment.
• The mainstreaming of climate change response into all national, provincial and local planning regimes.
• The use of incentives and disincentives, including through regulation and the use of economic and fiscal measures to promote behaviour change that would support the transition to a low carbon society and economy.
• Acknowledging that, with the energy intensive nature of the South African economy, the mitigation of greenhouse gases is generally not going to be easy or cheap and that Government must support and facilitate the mitigation plans of, in particular, the energy, transport and industrial sectors.
• The recognition that sustainable development is also climate friendly development and that that; the more sustainable our development path is, the easier it will be to build resilience to climate change impacts.
• Recognise that measures taken by developed countries in their efforts to respond to climate change may have detrimental effects on high carbon and energy intensive economies such as South Africa. These response measures may include trade measures including border tax adjustments, and could be reflected in a reluctance to
trade in goods with a high carbon footprint. South Africa’s climate change strategy must recognise and address this and also create mechanisms that will give high carbon sectors the support and time to move to lower carbon forms of production.
• Recognise that South Africa’s response to climate change will have major implications for both the Southern African region and for Africa as a whole and ensure that national responses are aligned to, support and operate as part of a broader regional response.
2.2.2 Other national policy
The following additional national policies are regarded as the most relevant in the context of climate change:
• White Paper on the Energy Policy of the Republic of South Africa, 1998, which promotes renewable energy and improvement of energy efficiency.
• A National Climate Change Response Strategy for South Africa, 2004 which sets certain strategic objectives, principles and proposals for addressing national priorities related to global climate change.
• Energy Efficiency Strategy of the Republic of South Africa, 2005, which sets a national target (not mandatory, only policy objective) for energy efficiency improvement of 12% by 2015 and provides for a number of “enabling instruments”
• White Paper on Renewable Energy, 2003, which lays the foundation for the widespread implementation of renewable energy and sets a target (not mandatory, only policy objective) of ten thousand gigawatt-hours of renewable energy contribution to final energy demand by 2013.
• Draft Policy Paper a Framework for Considering Market-based Instruments to Support Environmental Fiscal Reform in South Africa, 2006, which seeks to “explore how environmentally-related taxes and charges could assist in progressing towards the achievement of environmental goals and objectives and costs effective manner.”
• The Long Term Mitigation Scenarios: Strategic Options for South Africa, 2007 (LTMS). The LTMS sets the pathway for South Africa long-term climate policy and will eventually inform a legislative, regulatory and fiscal package that will give effect to the policy package at a mandatory level. The overall goal is to “develop a plan of action which is economically risk-averse and internationally aligned to the world effort on climate change.”

Phase 1: Climate Change Scenario
Eastern Cape Climate Change Response Strategy 13
• The Government’s vision and strategy for climate change, 2008. The Government’s vision and strategy for climate change strives to set the overall framework to design the national policy for the transition to a climate resilient and low-carbon economy and society, ensuring that the mitigation and adaptation response are balanced. The climate response policy is built on six pillars which will be informed by what is required by science, namely to limit global temperature increase to 2°C above pre-industrial levels.
• The Climate Change Summit, March 2009. The Summit was intended to translate Cabinet’s climate change policy decisions and directives (the Long Term Mitigation Strategy Scenarios described in the previous edition), into action. The main outcome of the Summit was the “National climate change response policy: Discussion Document” and the Conference Statement, “Towards an effective South African climate change response policy”, dated 6 March 2009 which provides various guidance on the short, medium and long terms national regulatory and policy interventions to be implemented by the South African Government in the context of Climate Change.
• The South African position at international negotiation especially at COP 15 and 16. In terms of the latest policy developments, the following national regulatory and policy interventions can be expected: Long term (10 years or more)
(a) Laying the basis for a net zero-carbon electricity sector.
Short to medium term (5 – 10 years)
(a) Ambitious and mandatory (as distinct from voluntary) targets for energy efficiency.
(b) Each sector will be required to do work towards the determination of adequate actions and targets in relation to this overall framework.
(c) Energy efficiency policies and strategies will be continuously reviewed and amended to reflect more ambitious national targets aligned with the LTMS.
(d) Increasing carbon price through an escalating CO2 tax, or an alternative market mechanism.
(e) Diversification of the energy mix away from coal whilst shifting to cleaner coal.
(f) Targets for electricity generated from both renewable and nuclear.
(g) Renewable energy through feed-in tariffs.
(h) Introducing industrial policy that favours sectors using less energy per unit of economic output and building domestic industries in these emerging sectors.
(i) Setting ambitious and where appropriate mandatory national targets for the reduction of transport emissions, including through stringent and escalating fuel efficiency standards, facilitating passenger modal shifts towards public transport and the aggressive promotion of hybrids and electric vehicles.”
(j) Scaled-up of renewable energies and energy efficiency.
(k) Energy efficiency standards for industrial equipment and processes.
(l) Improved integrated energy planning.
(m) Enhanced government coordination and policy alignment.
(n) Fast-tracked implementation of the favourable tax treatment for carbon credits from Clean Development Mechanism projects.
(o) Massively up-scaled public education, awareness, media and information on climate change.
(p) Mobilisation of the resources required, including the significant investment in R&D for new technologies

Phase 1: Climate Change Scenario
Eastern Cape Climate Change Response Strategy 14
(q) Exploring and developing carbon capture and storage (CCS) for coal fired power stations and all coal-to-liquid (CTL) plants, and not approving new coal fired power stations without carbon capture readiness.
Immediate priorities (0 -5 years)
(a) Mandatory standards for energy efficiency, including standards for commercial and residential buildings, fuel efficiency standards, including the roll out, scaling up of solar water heaters and building of a local industry and finalising and implementing a renewable energy feed-in tariff at a level adequate to incentivise large-scale investment
(b) Working for Energy and other initiatives to create green jobs in energy efficiency and renewable energy.
(c) Working for Adaptation – developing a green jobs programme to build climate resilience.
(d) Ensure that the Industrial Policy Action Plan review includes promotion of green technologies to address both adaptation and mitigation.
(e) Accelerate the development of the Risk and Vulnerability Atlas to inform adaptation responses and planning.
(f) Developing the atlas of sites for carbon capture and storage (CCS) and establishing a CCS centre.
(g) Finalise the Greenhouse Gas Inventory and the Second National Communications for submission to the UNFCCC.
(h) Completion of the Treasury report on options to implement a price on carbon this year.
(i) Developing regulations for mandatory emissions monitoring and reporting.
(j) Convening by Government of a group to ramp up efforts on education, public awareness, media and public awareness sectors and stakeholders.
The abovementioned policy framework in terms of climate change and strategic direction “to grow with a carbon constraint” will have for a direct result to change the composition and structure of the world and national economy.
2.2.3 National legislation and regulatory framework
The following national legislation and regulations are relevant to the Provincial Climate Change Response.
2.2.3.1 The National Environmental Management Act 107 of 1998 (NEMA)
Currently it is not expressly prescribed that EIAs should address climate change related aspects and effects in terms of a proposed activity. However, considering the objectives of EIAs, read in conjunction with the environmental management principles prescribed by NEMA, climate change related concerns (adaptation and mitigation) should, and have been but not in a comprehensive and holistic manner, addressed in many proposed activities/developments.
2.2.3.2 The National Environmental Management: Air Quality Act 39 of 2004
The Act is identified in the Climate Change Response Strategy as DWEA’s primary instrument in combating climate change and, as such, provides a framework for very effective future interventions in this regard. It remains to be seen whether such interventions will, indeed, be forthcoming or, if they are forthcoming, are made in time for them to contribute to resisting the climate change phenomenon. To achieve its objective, the Act provides for a number of regulatory mechanisms. Emissions trading is unlikely to be implemented in South Africa in the immediate future. Considering the latest policy statements made by DWEA regarding climate

Phase 1: Climate Change Scenario
Eastern Cape Climate Change Response Strategy 15
change, it is anticipated that regulations for the direct or indirect control and management of greenhouse gases emissions will be developed within the next 3 years.
2.2.3.3 The Energy Act, 2008
It is anticipated that the regulations under this Act will stimulate/require energy efficiency, energy conservation and the development of renewable energy.
2.2.3.4 The National Environmental Management: Integrated Coastal Management Act 24 of 2008 (NEM:ICMA)
NEM: ICMA recognised, indirectly, climate change related impacts (natural hazards and risks arising from dynamic coastal processes, including the risk of sea-level rise) on the coastal zone as a risk for people, property and economic activities on the coastal zone. The Act prescribes various instruments which might be used to management adaptation measures on the coastal zone.
2.2.3.5 South Africa Renewable Energy Feed-in Tariff (REFIT), Regulatory Guidelines 26 March 2009
In terms of pending legislations, the following are considered as the ones with the most potential implications in terms of climate change:
(a) Proposed EIA amendments, 2008 (potential implication in terms of climate change)
(b) Draft regulations under section 12I of the Income Tax Act 58 of 1962, for public comment, 10 March 2009
2.3 Climate change opportunities
Section B of Appendix A notes that in the South African context, there are numerous opportunities related to climate change, especially regarding mitigation actions, which can be classified as follows:
• Create new stream of revenue from greenhouse gases reduction projects.
• Technology transfer and development.
• Access to foreign investment.
• Cost saving from increased energy efficiency and conservation.
• Poverty alleviation through income and employment generation associated with mitigation and development programmes”.
• The Clean Development Mechanism (CDM) and the carbon market AND involvement in emissions trading (buying or selling carbon credit).
• Opportunities to develop new products, services or technologies.
• Carbon neutral activities or projects to offset emissions from parts of its operations by buying or acquiring carbon credits.
• Development of strategic partnerships with national and international partners.

Phase 1: Climate Change Scenario
Eastern Cape Climate Change Response Strategy 16
3 CLIMATE CHANGE SCENARIOS AND IMPACTS
3.1 Background
The Conference of the Parties (COP) to the United Nations Climate Change Convention (UNFCCC) at its fifteen session (COP 15) in Copenhagen (December 2009), adopted a decision that took note of the Copenhagen Accord of 18 December 2009, which amongst other reaffirms the following:
• That climate change is one of the greatest challenges of our time;
• That there is an urgent need to combat climate change and to stabilize greenhouse gas (GHG) concentrations in the atmosphere at a level that would prevent dangerous anthropogenic interference with the climate system;
• That deep cuts in global emissions are required according to science as documented by the Intergovernmental Panel on Climate Change (IPCC) Fourth Assessment Report (AR4) (2007) with a view to reduce global emissions so as to hold the increase in global temperature below 2 degrees Celsius (
oC);
• That there should be global cooperation to achieve a peaking of global and national emissions as soon as possible;
• That bearing in mind that social and economic development and poverty eradication are the first and overriding priorities of developing countries (including Africa), that a low-emission development strategy is indispensable to sustainable development;
• That adaptation to the adverse effects of climate change and the potential impacts of response measures is a challenge faced by all countries;
• That enhanced action and international cooperation on adaptation is urgently required to reduce vulnerability and build resilience in developing countries; and
• That developed countries shall provide adequate, predictable and sustainable financial resources, technology and capacity-building to support the implementation of adaptation action in developing countries.
In addition, the Intergovernmental Panel on Climate Change (IPCC) Fourth Assessment Report (AR4) (2007) states the following:
• Warming of the climate system is unequivocal, as is now evident from observations of increases in global average air and ocean temperatures, widespread melting of snow and ice and rising global average sea level;
• Global GHG emissions due to human activities have grown since pre-industrial times, with an increase of 70% between 1970 and 2004;
• There is very high confidence that the global average net effect of human activities since 1750 has been one of warming; and
• Most of the observed increase in global average temperatures since the mid-20th century is very likely due to the observed increase in anthropogenic GHG concentrations.
3.2 Overview of the climate change phenomenon
Climate Change is defined by the UNFCCC as “a change of climate which is attributed directly or indirectly to human activity that alters the composition of the global atmosphere and which is in addition to natural climate variability over comparable time periods”. Global warming is defined by the UNFCCC as “the increase in the Earth’s temperature, in part due to emissions of greenhouse gases (GHG’s) associated with human activities such as

Phase 1: Climate Change Scenario
Eastern Cape Climate Change Response Strategy 17
burning fossil fuels, biomass burning, cement manufacture, cow and sheep rearing, deforestation and other land-use changes.” Figure 2 below shows diagrammatically the Greenhouse effect, while Figure 3 shows the apparent direct relationship between changes in the earth’s temperature and CO2
concentrations in the atmosphere.
Figure 2: Greenhouse effect (Source: United Nations Environmental Programme, 2009)
Figure 3: Greenhouse effect (Source: United Nations Environmental Programme, 2009)

Phase 1: Climate Change Scenario
Eastern Cape Climate Change Response Strategy 18
Africa’s contribution to concentrations of greenhouse gases in the atmosphere amounts to only 3.8% of the world’s total. However, it is one of the most vulnerable continents to climate change impacts. In addition, South Africa is the 11th largest per capita contributor to greenhouse gas emissions of the world’s total (Figure 4).
Figure 4: Emissions of CO2 - selected countries (1995). Source UNEP - GRID Arendal. Climate scientists see a real risk that the earth’s climate will change rapidly and dramatically over the coming decades. However, no one is certain about the nature and severity of the future effects. In most scientific circles, the issue is no longer whether climate change is a potentially serious problem, but how the problem will develop, what its effects will be and how these effects can best be detected and effectively mitigated. Climate change is likely to have pervasive affects. Furthermore, the far reaching impacts of climate change experienced in the foreseeable future will be felt in some way by every person and every organisation, public or private, and at all levels, from strategic management to operational activities for many years to come. The effects will impact across environmental issues, economic performance, social behaviour, infrastructure and other aspects of human existence. Changes are likely to develop gradually but could be also abrupt. As discussed in more detail later in this report, the manifestations of climate change in South Africa are likely to include:
• Higher temperatures
• Altered rainfall patterns
• More frequent or intense extreme weather events such as heat-waves, droughts and storms.
• Rise in sea levels

Phase 1: Climate Change Scenario
Eastern Cape Climate Change Response Strategy 19
Figure 5: Schematic framework of anthropogenic climate change drivers, impacts and responses (IPCC 2007)
3.3 Global climate change trends and scenarios
The primary source of information on climate change trends and future scenarios at a global scale is the IPCC Fourth Assessment Report on Climate Change (AR4) (IPCC 2007). According to AR4, since the Third Assessment Report (TAR) there has been marked progress in understanding how climate is changing in space and time due to (IPCC 2007):
• Improvements and extensions of numerous datasets and data analyses,
• Broader geographical coverage, and
• Better understanding of uncertainties and a wider variety of measurements. In addition, AR4 indicates that warming of the climate system is unequivocal, as is now evident from observations of increases in global average air and ocean temperatures, widespread melting of snow and ice and rising global average sea level.
Summary of main findings of AR4 Current knowledge about observed impacts of climate change on the natural and human environment
• Observational evidence from all continents and most oceans shows that many

Phase 1: Climate Change Scenario
Eastern Cape Climate Change Response Strategy 20
natural systems are being affected by regional climate changes, particularly temperature increases.
• A global assessment of data since 1970 has shown it is likely that anthropogenic warming has had a discernible influence on many physical and biological systems.
• Other effects of regional climate changes on natural and human environments are emerging, although many are difficult to discern due to adaptation and non-climatic drivers.
• More specific information is now available across a wide range of systems and sectors concerning the nature of future impacts, including for some fields not covered in previous assessments.
Current knowledge about future impacts
• More specific information is now available across the regions of the world concerning the nature of future impacts, including for some places not covered in previous assessments.
• Magnitudes of impact can now be estimated more systematically for a range of possible increases in global average temperature.
• Impacts due to altered frequencies and intensities of extreme weather, climate and sea-level events are very likely to change.
• Some large-scale climate events have the potential to cause very large impacts, especially after the 21st century.
• Impacts of climate change will vary regionally but, aggregated and discounted to the present, they are very likely to impose net annual costs which will increase over time as global temperatures increase.
Current knowledge about responding to climate change
• Some adaptation is occurring now, to observed and projected future climate change, but on a limited basis.
• Adaptation will be necessary to address impacts resulting from the warming which is already unavoidable due to past emissions.
• A wide array of adaptation options is available, but more extensive adaptation than is currently occurring is required to reduce vulnerability to future climate change. There are barriers, limits and costs, but these are not fully understood.
• Vulnerability to climate change can be exacerbated by the presence of other stresses.
• Future vulnerability depends not only on climate change but also on development pathway.
• Sustainable development can reduce vulnerability to climate change, and climate change could impede nations’ abilities to achieve sustainable development pathways.
• Many impacts can be avoided, reduced or delayed by mitigation.
• A portfolio of adaptation and mitigation measures can diminish the risks associated with climate change.
3.3.1 Some key observations of global climate change trends
Some key global observations include the following (IPCC 2007):
3.3.1.1 Temperature

Phase 1: Climate Change Scenario
Eastern Cape Climate Change Response Strategy 21
• Eleven of the last twelve years (1995-2006) rank among the twelve warmest years in the instrumental record of global surface temperature (since 1850).
• The 100-year linear trend (1906-2005) of 0.74°C is larger than the corresponding trend of 0.6°C (1901-2000) given in the Third Assessment Report (TAR) (Figure 6).
• The linear warming trend over the 50 years from 1956 to 2005 (0.13°C per decade) is nearly twice that for the 100 years from 1906 to 2005.
• Observations since 1961 show that the average temperature of the global ocean has increased to depths of at least 3000m and that the ocean has been taking up over 80% of the heat being added to the climate system.
3.3.1.2 Sea level rise
• Increases in sea level are consistent with warming (Figure 6) where global average sea level rose at an average rate of 1.8 mm per year over 1961 to 2003 and at an average rate of about 3.1 mm per year from 1993 to 2003.
• Since 1993 thermal expansion of the oceans has contributed about 57% of the sum of the estimated individual contributions to the sea level rise, with decreases in glaciers and ice caps contributing about 28% and losses from the polar ice sheets contributing the remainder. From 1993 to 2003 the sum of these climate contributions is consistent within uncertainties with the total sea level rise that is directly observed.
3.3.1.3 Snow and ice cover
• Observed decreases in snow and ice extent are also consistent with warming (Figure 6).
• Satellite data since 1978 show that annual average Arctic sea ice extent has shrunk by 2.7% per decade, with larger decreases in summer of 7.4 % per decade.
• Mountain glaciers and snow cover on average have declined in both hemispheres.
• Temperatures at the top of the permafrost layer have generally increased since the 1980s in the Arctic by up to 3°C.

Phase 1: Climate Change Scenario
Eastern Cape Climate Change Response Strategy 22
Figure 6: Observed changes in (a) global average surface temperature; (b) global average sea level from tide gauge (blue) and satellite (red) data; and (c) Northern Hemisphere snow cover for March-April. All differences are relative to corresponding averages for the period 1961-1990. Source: IPCC 2007
3.3.1.4 Rainfall
• Changing trends in precipitation amounts from 1900 to 2005 have been observed in many regions.
• Over this period, precipitation has declined in southern Africa.
• Globally, the area affected by drought has likely increased since the 1970s.
3.3.1.5 Extreme weather events
• Some extreme weather events have changed in frequency and/or intensity over the last 50 years:
• It is very likely that cold days, cold nights and frosts have become less frequent over most land areas, while hot days and hot nights have become more frequent.
• It is likely that heat waves have become more frequent over most land areas.
• It is likely that the frequency of heavy precipitation events (or proportion of total rainfall from heavy falls) has increased over most areas.
• It is likely that the incidence of extreme high sea level has increased at a broad range of sites worldwide since 1975.
• There is observational evidence of an increase in intense tropical cyclone activity in the North Atlantic since about 1970, and suggestions of increased intense tropical cyclone

Phase 1: Climate Change Scenario
Eastern Cape Climate Change Response Strategy 23
activity in some other regions where concerns over data quality are greater.
• Average Northern Hemisphere temperatures during the second half of the 20th century were very likely higher than during any other 50-year period in the last 500 years and likely the highest in at least the past 1300 years.
3.3.2 Projections of future changes in global climatic conditions
For the next two decades a warming of about 0.2°C per decade is projected for a range of emissions scenarios. Even if the concentrations of all GHGs and aerosols are kept constant at year 2000 levels, a further warming of about 0.1°C per decade would be expected. Afterwards, temperature projections increasingly depend on specific emissions scenarios (Figure 7). Since the IPCC’s first report in 1990, assessed projections have suggested global averaged temperature increases between about 0.15 and 0.3°C per decade from 1990 to 2005. This can now be compared with observed values of about 0.2°C per decade, strengthening confidence in near-term projections. According to the AR4, continued GHG emissions at or above current rates will cause further warming and induce many changes in the global climate system during the 21st century that would very likely be larger than those observed during the 20th century. Table 1 shows best estimates and likely ranges for global average surface air warming and global average sea level rise for the six emissions scenarios. Table 1: Projected global average surface warming and sea level rise at the end of the 21st century (IPCC, 2007).

Phase 1: Climate Change Scenario
Eastern Cape Climate Change Response Strategy 24
Figure 7: Projected changes in global temperature to 2100 (Source: United Nations Environmental Programme, 2009)
3.3.3 Impacts on Africa
Boko et al (2007), in their contribution to AR4 entitled “Impacts, adaptation and vulnerability”, the following impacts for Africa were noted:
• By 2020, between 75 and 250 million of people are projected to be exposed to increased water stress due to climate change.
• By 2020, in some countries, yields from rain-fed agriculture could be reduced by up to 50%.
• Agricultural production, including access to food, in many African countries is projected to be severely compromised. This would further adversely affect food security and exacerbate malnutrition.
• Towards the end of the 21st century, projected sea level rise will affect low-lying coastal areas with large populations. The cost of adaptation could amount to at least 5 to 10% of GDP.
• By 2080, an increase of 5 to 8% of arid and semi-arid land in Africa is projected under a range of climate scenarios (high confidence).
3.3.4 Key scientific developments since the IPCC Fourth Assessment Report (June 2009)
Since the IPCC released AR4 in July 2006, various new information has been published that will be made before the next IPCC assessment, due in 2014. A brief overview of some key new findings is provided here (McMullen and Jabbour 2009). The link between fossil fuel emissions and many aspects of climate change is increasingly clear.

Phase 1: Climate Change Scenario
Eastern Cape Climate Change Response Strategy 25
AR4 concluded that greenhouse gas emissions from human activity are responsible for most of the increase in global average temperature with greater than 90 percent certainty. Numerous recent findings explicitly link other aspects of climate change to human activities:
(a) Human-induced climate change is already affecting multiple systems, both physical (e.g., timing of seasonal lake freeze and thaw) and biological (e.g., seasonal timing of plant flowering and animal migration).
(b) Changes in polar temperatures, both in the Arctic and Antarctic, have been attributed conclusively to human activity, with impacts on ecosystems, indigenous communities, ice sheet and ice shelf stability, and sea level rise.
(c) Changes in global precipitation trends linked to human induced global warming are larger than model predictions and may already be impacting ecosystems, agriculture, and human health in certain regions.
(d) Satellites show an increase in total atmospheric moisture content over the oceans since 1998, and this has been attributed to anthropogenic emissions of greenhouse gases, as opposed to natural causes or internal variability.
A better understanding of the behaviour of large ice sheets combined with observations of rapid melting have raised projections of 21st-century global sea level rise.
New estimates of average global sea level rise of 2 metres or more by 2100 are significantly larger than in the AR4, as shown in Figure 8. The AR4 projected an average sea level rise of 0.18 to 0.59 meters (see Table 1) by the end of the 21st century. This estimate was driven mostly by the thermal expansion of the oceans as the water warms. However, due to an inability to model how ice moves in large, land-based ice sheets (i.e., the Greenland and Antarctic ice sheets), the IPCC did “not assess the likelihood, nor provide a best estimate or an upper bound for sea level rise”. The upper end of the AR4 projection should not, therefore, be interpreted as an upper limit; in fact, it likely underestimates future sea level rise.
Figure 8: Comparison of recent estimates of mean sea level rise in 2100, relative to 1990 levels.
The impacts of climate change may persist for more than 1000 years, even after human-induced emissions of CO2 stop completely.

Phase 1: Climate Change Scenario
Eastern Cape Climate Change Response Strategy 26
New studies find that warmer temperatures and changes in precipitation caused by emissions from human activity are largely irreversible. Atmospheric temperatures are not expected to decrease for many centuries to millennia, even after human-induced greenhouse gas emissions stop completely. In addition to long-term increases in temperature, climate models also suggest that a peak in CO2 levels between 450 and 600 ppm produces irreversible rainfall reductions in many parts of the world. For example, a 15-20 percent reduction in rainfall in the south-western United States is predicted—a larger decrease than the “Dust Bowl” of the 1930s. In the models, these changes persist for more than 1000 years for two reasons:
• The long lifetime of CO2 in the atmosphere – some 25 percent of it may remain in the atmosphere for more than 5000 years.
• The long period of time required for the transfer of heat between the oceans and the atmosphere. The uptake of heat by the oceans is expected to be slow, causing atmospheric temperatures to remain elevated for thousands of years.
Unmitigated CO2 emissions will likely generate greater warming than previously estimated. Recent observations reveal that CO2 emissions from human activities grew faster over the past decade than the IPCC previously expected. Some other key research findings include:
(a) Ocean acidification severely threatens marine ecosystems and fisheries.
(b) Surface melting of the Greenland Ice Sheet is accelerating.
(c) Antarctic ice shelves are collapsing more rapidly than expected.
(d) Improved analysis suggests that Antarctica is warming.
(e) Arctic sea ice is melting more quickly than projected.
(f) Permafrost is thawing more quickly than previously thought.
In summary the majority of the new scientific insights since AR4, as described above, are based entirely or partially on direct observations of climate change. Sea level is rising, global ice cover is diminishing, and biological systems are responding to climate change. In general, observed climate change is proceeding at a more rapid pace than anticipated by previous estimates or model projections. Recent revisions of projected changes are higher than earlier estimates and the IPCC projections published in 2007 now appear rather conservative in light of more recent observations and improved modelling techniques.
3.4 Climate Change in South Africa and the Eastern Cape
Information on local South African climate change trends and scenarios has been obtained from the following main sources:
• A report generated by the Climate Systems Analysis Group (CSAG) for DEDEA entitled “Climate Change Projections and Impacts for the Eastern Cape region of South Africa” (Johnston et al, 2011).
• A Status Quo, Vulnerability and Adaptation Assessment of the Physical and Socio-Economic Effects of Climate Change in the Western Cape (Midgley et al, 2005);
• Framework for Adaptation to Climate Change in the City of Cape Town (Mukheibir and Ziervogel, 2006);
• A climate change strategy and action plan for the Western Cape (DEAD&P, 2008);
• A Sea-Level Rise Risk Assessment for the City of Cape Town (Cartwright, 2008); and
• Climatic Future for Durban (Shamini et al, 2006). The following sections highlight some of the main outcomes from these studies.

Phase 1: Climate Change Scenario
Eastern Cape Climate Change Response Strategy 27
3.4.1 Some key observations of local climate change trends
3.4.1.1 Temperature
Surface air temperature is certain to continue to increase by between 1°C and 3°C across the country over the next three to five decades at least, with the greatest increases towards the interior, and strongest trends in the daily minimum (Midgley et al 2007). The Eastern Cape is expected to experience highest temperature increases towards the north-west interior, while lowest increases are likely along the coast (Figure 9). Associated with the higher temperature will be increases in evaporation rates and increased intensity of droughts.
Figure 9: Projected median change in maximum surface temperature by 2050 (Source: Midgley et al 20007). Durban While current data for Durban (Shamini et al, 2006) indicates that daily maximum temperatures range from 20-26°C, based on the IPCC globally used 2070-2100 scenario (described above), Durban is likely to experience an increase in monthly maximum temperatures of about 2-3°C. In addition to increased temperature averages, it is expected that during the months of in January and February, Durban will experience 5 to 6 times more days with temperatures greater than 30°C and 12-14 times more days with temperatures greater than 30 °C in March, October and November. In addition to the above, Durban is likely to experience 11 times more consecutive days of temperatures exceeding 25°C. These projections are very significant as it implies that incidences of heat stress will increase together with evaporation rates. If rainfall decreases, it is likely that water availability will be an issue.

Phase 1: Climate Change Scenario
Eastern Cape Climate Change Response Strategy 28
Cape Town Based on data collected between 1967 and 2000 for Cape Town (DEAD&P, 2008), it is apparent that very warm days have become warmer or have occurred more regularly during the last decade, particularly during January, April and August. Mean annual Temp min and Temp max over the same time period showed significant warming trends at most stations. In terms of future trends, temperatures in Cape Town are expected to rise everywhere, least on the coast and more as one moves inland. Typical ranges of increase to be expected by 2050 are ~1.5ºC on the coast, and 2-3ºC inland of the coastal mountains. Eastern Cape: Based on work undertaken by the Climate Systems Analysis Group at the University of Cape Town, downscaled projections of monthly mean temperature for the Eastern Cape show a significant change in the median monthly maximum temperatures into the future. The annual mean is projected to increase by ~2°C in the near-future under the A2 SRES emissions scenario and this increase is echoed in the figures with temperature increases of between 1.5ºC and 2.5 ºC visible at all the stations. The stations near the coast display a smaller expected increase of around 2 ºC, while the two furthest inland, Aliwal North and Middelburg show expected increases of around 2.5 ºC. The maximum temperature increases appear to be marginally lower than the mean monthly minimum temperatures increases. For more information see Johnston et al, 2011.
3.4.1.2 Rainfall
Scenarios of regional climate change in South Africa remain uncertain, particularly with regard to rainfall projections. However, current downscaling models show a wetting trend to the east and northeast of the country and a drying trend to the south and particularly the south west. In the Eastern Cape a mirror pattern is expected where a wetting trend is expected eastwards. Figure 10 indicates projections for South Africa. In addition to increases in mean annual rainfall, it is projected that the durations of droughts will increase while the intensity of rainfall may increase (Midgley et al 2007).
Figure 10: Projected change in total annual rainfall (mm month-1) for July and December (mid century) (Source, Midgley et al 2007).
In addition, existing rainfall data also indicates that rainfall seasonal patterns in South Africa are changing, where for the months of December through to February (summer rainfall), most of the country is getting drier which will have impacts on run-off generation and reservoir storage capacity. Conversely, for the months of September to November (spring rainfall), most of the country is getting wetter (Shamini et al, 2006). Durban
Phase 1: Climate Change Scenario
Eastern Cape Climate Change Response Strategy 29
Similar to global trends in rainfall variability it is projected that Durban will experience an increase in rainfall events greater than 10mm and 25mm for the period 2070-2100 (Shamini et al, 2006). Although projections suggest that average rainfall may not deviate much from present rainfall conditions, the distribution of rainfall is likely to change where it is projected that the number of days without rain will increase and when rainfall events occur they will be heavier than current conditions. Overall, decreases in rainfall coupled with increases in temperature and evaporation rates are likely to result in less water available for industrial and human consumption, thus placing additional pressures on Durban’s already stressed water resources. Cape Town In general, over the years, mountainous regions inn Cape Town have shown increased precipitation (DEAD&P, 2008), while lowland regions have show decreased precipitation trends, which are consistent with the understanding of the rainfall processes, namely, increased moist atmosphere (resulting from a warmer world). Future trends: Two general trends are projected:
• An increase in total rainfall over the eastern regions of the Western Cape during late summer (January to March) and
• A decrease in rainfall, particularly over the western regions of the Western Cape, during early winter (April to June).
As changes in the climate begin to accelerate (as they are predicted to do) the projections will become more apparent for the long term. Eastern Cape The future projections for precipitation generally indicate stable or slightly increasing precipitation, with increasing intensity. Increased precipitation is more likely to the east of the province. Figure 11 illustrates downscaled projections in gridded format.

Phase 1: Climate Change Scenario
Eastern Cape Climate Change Response Strategy 30
Figure 11: Downscaled seasonal rainfall anomalies for the Eastern Cape:2046-2065 compared with the 1961-2000 period. From left seasons DJF, MAM, JJA, and SON. Variation from top, wettest 10%, median and driest 10%. Source: Johnston et al, 2011.

Phase 1: Climate Change Scenario
Eastern Cape Climate Change Response Strategy 31
3.4.1.3 Sea-level rise
Although little research has been conducted for sea-level rise impacts on the Eastern Cape, useful information exists for the City of Cape Town and Durban. Cape Town A series of four reports under the Global Climate Change and Adaptation: A Sea-Level Rise Risk Assessment (2008), provides a comprehensive assessment of sea level rise and associated risks for the City of Cape Town (Naidu et al, 2006) The study assesses the risks associated with sea level rise under three broad scenarios summarised below: Table 2: Sea level rise scenarios for the City of Cape Town
Description Sea level rise Impact Probability Scenario 1
Present Day very Worst Scenario
2m in sheltered environments, 4.5m in exposed environments, and 6.5m in very exposed environments
About 25 km2 covered by the sea (1% of Cape Metro) albeit for a short time.
95% chance in next 25 years
Scenario 2
Scenario at the End of the Next Decade
Same as above but with shorter return periods Expected whenever an extreme storm occurs at same time as Equinox spring high tide
About 60 km2 covered by sea (2% of total Metro) for a short period.
85% chance in next 25 years
Scenario 3
Polar Ice Sheet Melt Scenario
6.5 metre sea-level rise linked to the melting of the Greenland and West Antarctic ice shelves, and involving permanent inundation Excludes impacts of tidal surges and storms
Permanent inundation of about 95 km2 of land around the Cape coastline (4% of Metro)
20% chance in next 25 years
Also of interest from the Cape Town study is that ice melting will accelerate with a global average warming in excess of 2°C and further contribute to accelerated sea level rise. The complete elimination of the Greenland Ice Sheet will eventually lead to a contribution to sea level rise of 7m. These temperatures correspond to those of the last inter-glacial of 125,000 years ago, when sea level was 4 to 6 m higher than present levels. Around the Cape Peninsula the sea level at this time is reasonably well marked as the 18 foot wave cut platform. Durban The eThekwini Municipality report (Shamini et al, 2006) also provides a comprehensive assessment of projected sea level rise in Durban area, which included the determination of 1 in 100 year setback lines. The Durban study uses IPCC scenarios of about 0.5 to 1.0 metre sea level rise as a starting point and taking into consideration:
• Tidal reference level (Datum)
• Tides and sea-level rise
• Wave action
• Wind and atmospheric pressure Adding all of these set-up effects and adjusting for the probability of contributing events occurring simultaneously, probable maximum seawater levels of about 2.4 m and 2.8 m MSL are predicted. It is important to point out that these new lines do not take account various factors i.e.:
• the increase in 1-in-50 year to 1-in-100 year maximum in natural short-term (hours to weeks) shoreline variability, which is caused by storm waves and surges;
Phase 1: Climate Change Scenario
Eastern Cape Climate Change Response Strategy 32
• the increase in 1-in-50 year to 1-in-100 year progressive shoreline retreat where this phenomenon is occurring (some areas are at present already experiencing ongoing long-term coastal erosion); and
• The increase in duration and magnitude of sea storms due to climate change (or any other such impacts, other than just sea-level rise).
It is also worth noting that the recent City of Cape Town study on sea level rise (see above), indicated that the observed sea level rise in KwaZulu Natal during the storms of March 2007, amounted about 1.9 metres, of which storm surge contributed 0.55 metres. Eastern Cape: It can be anticipated that the Eastern Cape may be prone to similar sea level rise impacts as Durban and Cape Town.

Phase 1: Climate Change Scenario
Eastern Cape Climate Change Response Strategy 33
4 EASTERN CAPE PROVINCE DEVELOPMENT PRIORITIES
In order to assess the potential impacts of climate change and appropriate responses in the Eastern Cape, it is important to understand the local context. More specifically, it is important to understand how current development priorities for the Province will be affected. It is also important to understand the focus areas of the social and economic systems, and to what extent they are vulnerable to climate change. This section focuses on the implications of climate change on social and economic development in the Eastern Cape. These include:
• Provincial Growth and Development Plan (PGDP)
• Provincial Industrial Development Strategy (PIDS)
• Programmes under the PGDP The above development plans are intended to guide economic and social development. However, these programmes need to be reviewed in light of the implications of climate change. It should also be appreciated that the successful outcomes of these plans should, in general, increase the resilience of the Province to climate change.
4.1 Provincial Growth and Development Plan (PGDP)
The Eastern Cape Provincial Growth and Development Plan (PGDP) is the Eastern Cape’s official economic development roadmap designed to deliver growth, employment and reduce the levels of poverty in the Eastern Cape. The PGDP provides the strategic framework, sectoral strategies and programmes aimed at a rapid improvement in the quality of life for the poorest people of the Province. To do this, the PGDP sets out a vision with quantified and sequenced targets in the areas of economic growth, employment creation, poverty eradication and income redistribution for the 10-year period 2004-2014.
4.1.1 PGDP strategy framework
The strategy framework for growth and development is expressed in terms of six strategic objectives, which are divided into three key objectives and three foundation objectives.
4.1.1.1 The three key objectives are:
• Systematic eradication of poverty through a holistic, integrated and multi-dimensional approach to pro-poor programming.
• Agrarian transformation and strengthening of household food security.
• Consolidation, development and diversification of the manufacturing base and tourism potential.
4.1.1.2 These key objectives are supported by three foundation objectives:
• Infrastructure development.
• Human resource development.
• Public sector and institutional transformation.
4.1.2 PGDP targets
At a more detailed level, the following quantified targets for growth and development in the Eastern Cape for the period 2004-2014, with 2003 as the base year, have been developed:
• To maintain an economic growth rate of between 5% and 8% per annum.
• To halve the unemployment rate by 2014.

Phase 1: Climate Change Scenario
Eastern Cape Climate Change Response Strategy 34
• To reduce by between 60% and 80% the number of households living below the poverty line 2014.
• To reduce by between 60% and 80% the proportion of people suffering from hunger by 2014.
• To establish food self-sufficiency in the Province by 2014.
• To ensure universal primary education (UPE) by 2014, with all children proceeding to the first exit point in a secondary education.
• To improve the literacy rate in the Province by 50% by 2014.
• To eliminate gender disparity in education and employment by 2014.
• To reduce by two-thirds the under-five mortality rate by 2014.
• To reduce by three-quarters the maternal mortality rate by 2014.
• To halt and begin to reverse the spread of HIV/AIDS by 2014.
• To halt and begin to reverse the spread of tuberculosis by 2014.
• To provide clean water to all in the Province by 2014.
• To eliminate sanitation problems by 2014.
4.1.3 Strategic objectives
The following describes in more detail the approach to achieving the PGDP strategic objectives.
4.1.3.1 Systematic Poverty Eradication through a Holistic, Integrated and Multi-Dimensional approach to Pro-Poor Programming
The strategic approach to poverty eradication must address all these dimensions of poverty. They are summarised under the following seven platforms:
• Facilitating access to good quality employment and economic opportunities.
• Increasing the physical asset base of the poor;
• Facilitating access to basic services.
• Strengthening community management and organisation of own initiatives and external programmes.
• Enhancing democratic participation by the poor.
• Ensuring access of the poor to legal entitlements and security.
• Ensuring access to safety nets to strengthen ability to manage shocks and stresses.
4.1.3.2 Agrarian Transformation and Strengthening Household Food Security
• Establishing household food security through the promotion of small-scale farming entrepreneurs and support on a massive scale will be given to the development of homestead agricultural production.
• Promote the effective use of land to improve the livelihoods of the poor.
• Promote the expansion of commercial agricultural enterprises, especially in the former homelands.
4.1.3.3 Consolidation, Development and Diversification of the Manufacturing Base and Tourism Potential

Phase 1: Climate Change Scenario
Eastern Cape Climate Change Response Strategy 35
Industrial strategy will need to include:
• Industrial planning to develop a growth strategy in each sub-sector with the Provincial social partners.
• Research to identify the highest potential areas for investment.
• The development of research partnerships for technology development, including Provincial higher education institutions.
• Promotion of skills development through the relevant Sector Education and Training Authorities (SETAs).
The Provincial strategy for industrial development must also build linkages between the modern export-led sector and other industries. This is especially important in the case of the new IDZs, which must be used as opportunities to boost growth in Provincial industry through supply linkages. The development of the Provincial tourism potential should optimise benefits to host communities and through community-based forms of tourism. Linkages between tourism and agriculture activities in rural areas are critical.
4.1.3.4 Infrastructure Development
Infrastructure development is a foundational objective in the Eastern Cape due to its key role in social development, especially the eradication of social backlogs, and its role in leveraging economic development. Investing in social infrastructure, especially in the former homelands should include
• Rural access roads
• School and clinic construction
• Water and sanitation need. Investing in economic infrastructure to unlock growth: While good roads and communications infrastructure exist in and between the major towns, there are gaps in the network. Emphasis will be placed on:
• Major road links
• Rail links
• Airports
• Seaports
• Electricity
4.1.4 Human Resource Development
To align with the objective of the national strategy for the achievement of rising skill levels which promote economic and employment growth and social development. Specific objectives are:
• To improve the skills profile of the population through accredited high-quality education and training.
• To increase the quality and quantity of intermediate-level skills in the country.
• To improve social and infrastructure delivery by increasing skills.
• To raise the quality, relevance and cost-effectiveness of skills development throughout the country.
Phase 1: Climate Change Scenario
Eastern Cape Climate Change Response Strategy 36
4.1.5 Public Sector and Institutional Transformation
The strategic approach will be focused on the harnessing of skills and resources in support of local priorities as articulated through the integrated development planning process. This will require:
• Effective coordination of Provincial and national programmes within the boundaries of District Municipalities.
• Improved coordination of planning and budgeting.
• Predictability and targeting of fiscal flows from agencies within the national and Provincial spheres of government.
• Strong support to capacity development through skills training and the deployment of Provincial staff to Local Government.
• Development of the structures and systems for the effective functioning of participatory democracy within the local sphere.
• Effective mobilisation of all social partners in support of the formulation and implementation of the IDPs.
Provincial and National Government should increasingly focus planning and programme implementation around the priorities of Municipalities, while maintaining clear visions of broader Provincial and national priorities. Finally, the participatory planning process should be institutionalised as part of PGDP implementation to ensure that all social partners continue to participate and are mobilised in support of the PGDP as well as the monitoring of its outcomes.
Relevance of climate change to PGDP
• Initiatives and programmes reflected in the PGDP, need to take into consideration risks and impacts and limitations imposed by climate change, such as: increased temperatures, changes in precipitation levels, increased storm events, tidal surges and sea-level rise, etc., and consider adaptation measures.
• Infrastructure development needs to take into account the impact of changing variables such as higher return periods for flooding and droughts, more extreme weather events, and sea level rise. Infrastructure development should pay close attention to geographic areas at highest risk such as flood –prone areas and areas close to sea-level.
• The PGDP needs to take into consideration the growing need for climate change mitigation and renewable energy projects both locally and globally and the growing green economy as development direction and economic opportunity.
• The PGDP needs to consider co-funding opportunities through mechanisms such as trading of Carbon Credits and Climate Change Adaptation Funds.
• It should be emphasised that the successful outcomes of the PGDP, particularly in regard to poverty alleviation and food security, will increase the resilience of vulnerable communities to climate change.

Phase 1: Climate Change Scenario
Eastern Cape Climate Change Response Strategy 37
4.2 Provincial Industrial Development Strategy (PIDS)
The Provincial Industrial Development Strategy (PIDS) was published in March 2010 and is closely linked to and builds on the strategic objectives relating to manufacturing diversification and tourism development within the PGDP. The PIDS vision is as follows: “A state-led industrialisation path towards a robust, resilient and sustainable industrial base by 2025.” To summarise, the PIDS is best captured in the framework presented below:
The strategy emphasises the need for synergy and linkages between PIDS, the PGDP and a host of other support strategies for industrialisation such as Local and Regional Economic Development Strategy, SMME Strategy, Tourism Master Plan, Rural Development Strategy and the Cooperatives Strategy.
4.2.1 Strategic Framework for Industrial Development
Three main strategic imperatives and goals are identified that encapsulate the principal challenges that must be addressed through the PIDS:
• Economic Growth: Increasing economic growth through strengthening of existing sectors and investment into new high potential industrial sectors, coupled with state investment in infrastructure.
• Labour Absorption: Improved labour absorption through skills development, especially for the youth, and through spatial spread of sectors, especially manufacturing industry.
• Job Retention: The net retention of existing jobs through the development of sectoral industrial policies and strategies and through the utilization of bridging and retraining strategies in declining industries.
In order to realise growth objectives, protect current jobs and create new ones, the strategic framework prioritises five thematic areas, under the umbrella of strategic objectives. These are the following:
• Stabilisation of vulnerable and declining sectors as a result of the economic crisis and deindustrialisation.

Phase 1: Climate Change Scenario
Eastern Cape Climate Change Response Strategy 38
• Protection - safeguard productive capacity of existing industries and retain current jobs.
• Diversification - deliberate efforts geared towards spreading employment and investment over a wide range of industrial activities.
• Expansion - increase the productive capacity of the province by investing in enabling infrastructure and innovation capabilities.
• Transformation - broadening the ownership of capital and assets; income distribution; and spatial distribution of industrial activity based on regional competitive and comparative advantages.
4.2.2 Priority Sectors
In terms of the PIDS specific priority sectors are targeted for industrial development in order to transform industrial structure. These sectors have been selected on:
• The basis to which they contribute to national and provincial development goals;
• The extent to which they create/protect jobs;
• The extent to which they enable industrial diversification into non-commodity tradable sectors;
• The extent to which they enable value-added linkages within and across sectors; and
• The extent to which they hold out direct benefits for BBBEE, co-operatives, SMMEs and enhance regional and local comparative and competitive advantages.
These priority sectors are reflected below:
4.2.3 Critical Success Factors
The PIDS emphasises a central coordinating role to be played by provincial government in ensuring that an enabling support environment is created. This role is defined around the following critical success factors:
• Research and development (R&D) and innovation;
• Training and skills development;
• Infrastructure and logistics;

Phase 1: Climate Change Scenario
Eastern Cape Climate Change Response Strategy 39
• Industrial finance;
• Investment, trade and export promotion; and
• Institutional development.
4.2.4 High Level Interventions
The PIDS framework narrows down to three high level intervention areas over the short, medium, and long term. These are:
• Crisis support and socio-economic stabilisation
• Building a coherent economic development support environment
• Economic transformation and revitalisation In the short term, the strategy must begin by addressing the consequences of the global economic crisis and the de-industrialising tendencies which threaten the long term industrial future of the Province. At the same time the strategy must ensure that provincial government and its entities are appropriately structured, skilled, enabled and resourced to deliver on the strategy as outlined below. This will entail ensuring that the province takes advantage of the emerging green industries, that it plans and implements priority sector plans and that it begins to put the building blocks in place to create a resilient and innovative economy that is able to stake its claim in the longer term capital goods sector.
4.2.5 Conclusions
In conclusion, the PIDS framework for industrialisation in the Eastern Cape outlines the Province’s broad approach to transform the structure and distribution of industrial activity to meet particular economic, social, environmental and political objectives. This approach has taken account of national policy direction and the confines of legislated areas of Provincial competence in industrial development. The PIDS identifies the next critical steps as the following:
• Development of a three-year PIDS Implementation and Action Plan that details resource impactions; institutional implications, and target setting.
• The Implementation Plan will include Priority Industry Action Plans, which should emerge from a process of engagement with all key role-players in respective sectors, and should reflect concrete outputs that will unlock opportunities and address identified constraints.
• Importantly, the Action Plans should contain details on the industry co-ordination and implementation modalities, and accountability mechanisms both to Provincial Government and other industry role-players.
• Institutional arrangements as proposed in this document also require further refinement in line with the IGR framework. Careful consideration must also be given to enhancing platforms for engagement with critical stakeholders outside the public sector.
The PIDS is also clear in stating that new capabilities will have to be urgently developed within provincial government, and the lead Department for industrial development in particular, i.e. DEDEA to ensure effective coordination and support of implementation activities, as well as and monitoring and evaluation.
Relevance of climate change to the PIDS
• Industrial development initiatives and programmes reflected in the PIDS, need to take into consideration risks and impacts and limitations imposed by climate change, such as: increased temperatures, changes in precipitation levels, increased storm events, tidal surges and sea-level rise, etc., and consider

Phase 1: Climate Change Scenario
Eastern Cape Climate Change Response Strategy 40
adaptation measures.
• The PIDs needs to take into consideration future restrictions on greenhouse gas emissions together with carbon taxes that will probably be imposed on industry.
• The PIDS needs to take into consideration the growing need for climate change mitigation and renewable energy projects both locally and globally and the growing green economy as development direction and economic opportunity.
• The PIDS needs to consider co-funding opportunities through mechanisms such as trading of Carbon Credits, etc.
4.3 PGDP IMPLEMENTING AGENCIES
4.3.1 Accelerated and shared growth Initiative of South Africa (AsgiSA)
Accelerated and shared growth Initiative of South Africa (AsgiSA) Eastern Cape was launched in May 2007 and is a South African government initiative which assists the provincial government in accelerating growth and development in the eastern part of the Eastern Cape, also known as the former Transkei, and forms part of the PGDP. The organization visualizes “a vibrant and sustainable rural economy that improves livelihoods and unlocks the dormant potential of the land and the people of the Eastern Cape”. AsgiSA Mission “Through partnerships, high level and focused integration and coordination, AsgiSA Eastern Cape plays a direct and catalytic role in building a sustainable and modern, rural-based economy, primarily through agrarian reform”. The diagram below depicts the proposed AsgiSA – EC strategic focus and paradigm.
The development mandate that has led to the establishment of AsgiSA-EC rests on six pillars, namely:
• Agriculture and agro-processing
• Forestry Development
• Water resources development
• Hydro-power and alternative energy
• Tourism Development
• Addressing unsustainable human settlement

Phase 1: Climate Change Scenario
Eastern Cape Climate Change Response Strategy 41
4.3.2 Rural Development and Agrarian Transformation Strategy (Draft 2009)
The Rural Development and Agrarian Transformation Strategy (Draft 2009) (RDATS) defines the rural agenda for the Eastern Cape, and sets down a series of objectives and attendant programmes. The strategy also outlines the necessary enabling environment for rural development, namely issues of institutions, policies and practices that can enable rural development. The strategy also suggests a number of institutional and funding mechanisms for successful implementation.
4.3.2.1 Pillars of the Strategy
The goals and objectives of RDATS will be underpinned by six strategic pillars. The pillars and priority areas of the strategy is illustrated in the table below.
4.3.3 Massive Food Production Programme
The Massive Food Production Program is a rural economic development initiative that targets grain food production through subsidising input supplies, mechanisation, marketing and agro- processing by means of a conditional grant scheme. Objectives
• Food security – commercial field crop production to address local and provincial food needs.
• Poverty alleviation and rural economic development through the establishment of competent and economically sustainable crop farmers.
• Conservation Cropping Practices – progressively establish the general use of conservation field cropping practices that optimise the sustainable and profitable use of arable areas including the practice of minimum tillage.

Phase 1: Climate Change Scenario
Eastern Cape Climate Change Response Strategy 42
4.3.4 Eastern Cape Socio-Economic Consultative Council (ECSECC)
Eastern Cape Socio-Economic Consultative Council (ECSECC) is a Schedule 3 Public Entity established in 1996 as a formal Consultative Council comprising the social partners of Government, organised business, organised labour, the higher education sector and NGO s in the Province of the Eastern Cape. ECSECC was established to assist Provincial Government accelerate the pace of socio-economic transformation, and address the principal challenges of unemployment, inequality and poverty in the Province. Over the past few years ECSECC has been instrumental in developing the Provincial Growth and Development Plan (PGDP), which is the blueprint for eradicating poverty and growing the economy over the next 8 years. By 2014 we aim to have achieved an average annual growth rate of between 5%-8%; halved poverty and unemployment, and achieved a number of other human development targets aligned to the Millennium Development Goals. Much of ECSE CC’s work over the past year has revolved around three programmatic areas:
• Facilitating sector strategies, such as the Skills Development Plan and the Industrial Development Strategy, which aim to strengthen the PGDP;
• Aligning the plans and budgets of Government around PGDP priorities through, for example, reviewing IDPs and the sector plans of Provincial Government departments; and
• Mobilising and co-ordinating the work of our stakeholders and facilitating active development partnerships through, for example, the Provincial Jobs Summit, in which all social partners have agreed to work together to implement programmes to rid the Province of unemployment and poverty.
Programmes

Phase 1: Climate Change Scenario
Eastern Cape Climate Change Response Strategy 43
• Policy, Research & Information Unit
• Social mobilisation
• Joint Initiative for Priority Skills Acquisition (JIPSA)
4.3.5 Eastern Cape Development Corporation (ECDC)
Eastern Cape Development Corporation (ECDC) is the official economic development and investment agency for the Eastern Cape Province and is wholly-owned by the Eastern Cape Government. The aims of the ECDC are to:
• Attract new investors and position the Eastern Cape as the investment target of choice
• Stimulate exports
• Facilitate economic development
• Derive value from our assets, including our large property portfolio
• Build existing businesses
• Facilitate start-up businesses The work of the ECDC is closely aligned with the strategic intent of the Provincial Growth and Development Plan (PGDP).
4.3.5.1 Sectors and Industries
• Agriculture
• Aquaculture and Fisheries
• Minerals
• Automotives and Components
• Textiles and Clothing
• Pharmaceuticals
• Arts and Crafts
• Tourism
• Business Process Outsourcing
• Construction
• General Manufacturing
• Renewable Energy
Relevance of climate change to the PGDP implementing agencies
• Implementing agencies need to factor climate change risks into implementation programmes and initiatives.
• Implementing agencies need to explore economic opportunities relating to climate change mitigation projects.

Phase 1: Climate Change Scenario
Eastern Cape Climate Change Response Strategy 44
5 RISK AND VULNERABILITY ASSESSMENT OF SECTORS AND RESOURCES
5.1 Impacts identified in other studies in South Africa.
Numerous Climate Change studies have been undertaken for other regions and cities in South Africa. It is useful to review the impacts identified in these studies as a context to the Eastern Cape Climate Change Response Strategy. In the following section, impacts identified for the eThekwini Municipality and City of Cape Town are considered. It should be remembered that these are only a sample of potential impacts for illustrative purposes, and should not be considered as a complete list.
5.1.1 Durban
The eThekwini Municipality climate change report (Shamini et al, 2006) highlights the potential impacts of temperature and rainfall variability in the Durban area. Some of these are described briefly below:
• Water availability
• For the period 2070 to 2100, there will be a reduction in yearly water flow of approximately 158 million cubic metres, which is equivalent to the size of the Midmar Dam
• Agriculture
• While increased temperatures may cause an increase in agricultural production, water availability could become a limiting factor, requiring increased irrigation.
• Small scale agriculture is likely to be the most impacted due to reduced water availability.
• Biodiversity
• Increased temperatures and variable rainfall is likely to result in species migrations and extinctions of certain plant and animal species and biodiversity hotspots.
• Invasive species are expected to increase their ranges of distribution.
• Flooding and storm events
• The combination of increased temperatures and changes in rainfall distribution, it is likely that flooding and storm events will increase and will impact on human settlements, infrastructure, human health and place a greater burden on particularly impoverished communities.
• Increased temperatures will also lead to increased sea surface temperatures which could possibly lead to greater storm surges, destroying infrastructure, affecting human life and marine ecosystems.
• Human health
• Increased temperature, precipitation and flooding will facilitate the breeding of malaria vectors which will support malaria epidemics. Recent studies project that the area of South Africa potentially prone to malaria will almost double by 2050. In terms of Durban, which is currently a malaria risk area, it is likely that increases in malaria will occur in spite of the implementation of malaria preventative measures.
• Cholera also has the potential to increase due to water shortages which encourage unhygienic practices. Similarly, increased flooding is likely to cause

Phase 1: Climate Change Scenario
Eastern Cape Climate Change Response Strategy 45
contamination of water supplies resulting in an increase in the outbreaks of disease.
5.1.2 Cape Town
The City of Cape Town climate change report (DEAD&P, 2008), identifies the following climate change impacts and vulnerabilities for the City:
5.1.2.1 Urban water Supplies
• The Greater Cape Town area has been identified as the first major urban region in South Africa where the demand for water will exceed the total potential yield for the area if growth scenarios are realised or the impact of projected climate change manifests itself.
• The Western Cape has recently experienced a drought, which can be attributed to climate variability. Climate variability is expected to alter the present hydrological resources in Southern Africa and add pressure on the adaptability of future water resources, including Cape Town.
5.1.2.2 Storm water
• In March 2003 and April 2005 the city experienced damaging floods due to cut-off lows, which cause heavy rainfall in a short period of time and gale force winds. The extent of the damage for the Western Cape Province during this period exceeded R260 million.
• The intensity of rainfall in the Western Cape can be expected to change due to climate variability. An increase in the number of extreme events will cause substantial increases in the cost of losses to the public and private sectors, as well as increasing personal hardship for the people directly affected.
5.1.2.3 Biodiversity
• The impact of climate change manifested by a warmer and dryer climate will be a contraction of fynbos, which is a bio-diverse hotspot.
• Estuaries, which need fresh water for flushing and maintaining salinity profiles, will face increased competition for water from agricultural and urban demands.
5.1.2.4 Alien invasive species
• A drier environment would restrict the spread of terrestrial alien invasive plant species, but increasing carbon and especially nitrogen fertilisation would enhance growth of alien species.
5.1.2.5 Fires
• The frequency and intensity of wildfires is expected to increase substantially due to lower rainfall (reducing the moisture content of fuels), lower relative humidity, longer droughts, and higher wind speeds.
• High fire risk conditions are projected to almost triple in the west of the province. This will have a negative effect on biodiversity, soil structure and the spread of fire-adapted alien invasive plants.
5.1.2.6 Coastal zones
Coastal areas are vulnerable to the five potential impacts listed below:
• Increased exposure to extreme events (which themselves might increase in frequency or intensity);
• Increased saltwater intrusion and raised groundwater tables;
• Greater tidal influence;

Phase 1: Climate Change Scenario
Eastern Cape Climate Change Response Strategy 46
• Increased flooding (frequency and extent); and
• Increased coastal erosion. The City of Cape Town coastline has many sandy areas that have high potential for erosion as a result of the high energy wave regime. The most significant impacts of sea-level rise are expected where problems are already experienced. In most cases these are the areas where development has exceeded the high-water line by far, or is at a too-low elevation above mean sea-level.
5.1.2.7 Livelihoods
A range of hazards associated with climate change may affect the livelihoods of people living in the city. These range from the prospect of increasingly poor health which could result from:
• Increased air pollution (the projected increase in the number of inversions will trap pollutants in the atmosphere close to the ground);
• Heat stress (the number of very hot days may increase); and
• The possibility of increased flooding (rainfall events may become fewer but heavier). Economic sectors such as insurance, banks (through the underlying secured assets), transport and communication infrastructure and construction may all be affected to some degree by climate change.
5.1.2.8 Health
• Warmer average temperatures combined with a change in precipitation and increased flooding can alter the pattern of exposure to temperature extremes and resultant health impacts, in both summer and winter.
• While infectious diseases as malaria and dengue fever are not currently a key concern, the range of malaria could spread southwards in future and should not be ignored.
• Flooding due to the high water table in the Cape Flats area in particular can compromise sewage and storm-water systems, and can lead to water pollution associated diseases such as diarrhoea and dehydration.
• Food security is both directly and indirectly related to climate variability.
5.1.2.9 Air pollution
• In Cape Town, one of the most urgent health threats from climate change is air pollution, such as the build-up of photochemical smog which is undesirable from both a health and aesthetic standpoint.
• Brown haze episodes may occur frequently when a temperature inversion exists over the City.
5.1.2.10 Sea level rise in the City of Cape Town
Present sea level rise related concerns identified for Cape Town that will also be relevant to the coastal areas of the Eastern Cape include:
• Natural protection
• Natural sand dune barriers – Sea level rise will damage and compromise the protection provided by natural sand dune systems.
• Impacts on infrastructure
• Throughout the Cape Town area, sea level rise will impose significant risk to various infrastructure.
• Planning
• Cape Town City currently has no long term infrastructure development plan.

Phase 1: Climate Change Scenario
Eastern Cape Climate Change Response Strategy 47
• The current building regulations only require an Environmental Impact Assessment under NEMA.
• Assessment for building within 100m from the high water mark (in terms of EIA Regulations) has proven this to be ineffective in some areas.
• The ability to protect infrastructure in future may be reduced (both natural and manmade i.e. sand dunes and seawalls).
• Areas that are currently considered protected or sheltered may become more exposed.
• Risk of flooding to private and commercial properties.
• Transport
• The coastal railway system is expected to become increasingly effected by increasing sea levels.
• Traffic congestion when the transport systems such as roads have been affected by flooding etc.
• Failure of coastal defences that are currently not maintained will lead to the disruption of services such as public transport.
• Flooding events increase erosion and can reduce the expected life span of road systems, bridges, and other infrastructure.
• The Cape Town Harbour has been highlighted as an area of concern by the GIS inundation model (Scenarios 1 and 2). The expected increase in frequency and intensity of storms may therefore impact upon sea transport. The increase in frequency and intensity of storms may also impact on berthing, loading and storage facilities for oil and gas.
• Storm-water systems
• Silt deposits in the storm-water infrastructure often exacerbate blockage.
• During flooding events, some the pipes burst under the increased pressure (from the increased water levels as a result of the storm and the pipes getting clogged up with silt) and often the water is forced up to the surface contributing to further
• The impact on large infrastructure such as main culverts and river systems in terms of monetary value.
• Sewerage/ Waste water
• Many waste water plants are close to rivers in order to discharge thus leaving them vulnerable in the event of flooding in the localised area.
• There are many sewerage lines and pump stations located along the coastal edge in low-lying areas. Some of these are already out of service a result of being impacted upon by the sea.
• Already have problems with sewerage during storms in the Strand area.
• Electricity
• Present disruption of energy supplies will be further exacerbated.
• There are numerous substations for electrical distribution located in coastal areas.
• Power loss from damage to overhead cables.
• Disaster/Risk Management
• There must be a long-term plan for disaster management and implementation.
• Current warnings are on a large scale and do not pin point precise areas that require management.

Phase 1: Climate Change Scenario
Eastern Cape Climate Change Response Strategy 48
• There is a need to develop and put in place an early warning weather system that would provide warnings in greater detail than those that are currently available.
5.2 Climate Change Risk Assessment Matrix for the Eastern Cape
The effects of climate change manifestations such as changing precipitation and sea-level rise may have significant knock on effects which combine to threaten the entire economy of the province while the livelihood of a significant proportion of the population could be affected. These effects also threaten the continuity and functioning of provincial and local governance institutions and their associated mandate in the Eastern Cape. In the context of a climate change response strategy for the provincial government, it is necessary to systematically identify and assess the areas where provincial plans, agencies and departmental and municipal mandates are directly at risk. In contrast, the impacts of climate change may cause certain opportunities to arise. These opportunities should also be systematically identified so that they may be taken advantage of. A climate change risk assessment matrix has been developed as part of the EC Climate Change Response Strategy. The Risk Assessment Matrix represents an approach towards the systematic identification of Climate Change based impacts to the systems and resources that our environment, society and economy rely on. The matrix has, and will continue to, go through a number of iterations, with reciprocal input among the project team and stakeholders. A discussion regarding the method adopted in developing and populating the matrix is given in the following sections. The ultimate object of the matrix is to allow summary spreadsheets filtered for selected categories, such as: “Risks of high significance relevant to the Eastern Cape Department of Transport".
5.2.1 Context
Since the EC Climate Change Response Strategy is aimed particularly at Eastern Cape Provincial Governance, the impacts are considered at the scale, and from the context, of the province and associated district municipalities. Particular attention is therefore paid to the goals of the Provincial Growth and Development Plan and associated agencies and departments.
5.2.2 Approach
The risk assessment matrix aims to facilitate a step-wise approach to understanding which climate change impacts may affect the province, how serious these impacts are likely to be, and which provincial plans, agencies and departmental and municipal mandates are directly affected The sequence of steps in populating the matrix is given together with an example below:

Phase 1: Climate Change Scenario
Eastern Cape Climate Change Response Strategy 49
Identify Primary Impact Higher mean temperatures
Identify Secondary ImpactIncreas in ranges and vigour of pests, diseases
and vectors
Which systems/sectors/ infrastructure
types will be affectedAgriculture Sector
What are the tertiary ImpactsIncreased infestation of pests and deseases
and reduced net revenue per hectare
Is the impact a risk or opportunity? Risk
Has this event occurred historically?
What are the details?
Recent occurrence of Red-water disease
among cattle in previously disease free areas.
What is the likelihood of this even
occurring?Likely
What are the consequences (Exposure &
Sensitivity to Climate Change)Major
What is the significance (Likelihood x
consequence)High
Provincial Plans, Agencies, Departmental
and Municipal Mandates Directly Affected
For example: PGPD and Provincial Department
of Agriculture and Land.
Figure 12: Risk assessment matrix used in this study (left) with an example for the agricultural sector on the right.
5.2.2.1 The primary impacts of Climate Change
The first column in the matrix represents primary climate change impacts (in other words climate change manifestations). The cells in this column are populated by using the associated drop down list of options namely (Christensen et al, 2007; Midgley et a 2007):
• Change in precipitation patterns
• Changes in annual average precipitation
• More intense rain
• Fewer cold/frost days
• Higher mean temperatures
• Increased number of berg wind days
• Increased storm severity
• Longer dry spells and increased likelihood/ severity of droughts
• More hot days and heat waves
• Sea level rise
• Ocean acidification

Phase 1: Climate Change Scenario
Eastern Cape Climate Change Response Strategy 50
• Elevated atmospheric CO2 concentrations Although the above 1
st order impacts are suggested, the matrix is not limited to these.
5.2.2.2 2nd and 3rd order impacts
Although climate change appears to have a limited set of direct impact categories such as increased surface temperature and changing patterns of precipitation, these in turn are likely to set in motion a chain of knock-on impacts. An example of a chain of first, second, third, and fourth order impacts is given in Figure 13. Figure 13: Examples of a chain of impacts initiated by a 1
st order climate change
impact. The risk assessment matrix is limited to the identification of 2
nd and 3
rd order impacts. It should
be noted that numerous 2nd order impacts can arise from primary (i.e. 1
st order) impacts.
Likewise numerous 3rd order impacts can arise from 2
nd order impacts. It follows that a large
number of 3rd order impacts can be attributable to a single 1
st order impact. An example of the
diverse impacts of higher mean temperature in the agricultural sector is given below. Table 3: Diverse 2
nd and 3
rd order impacts for a given 1
st order impact.
1st Order Impact 2
nd Order Impact 3
rd Order Impact
Systems/sectors/ Infrastructure
Higher mean temperatures Increased evaporation and decreased soil water balance (particularly to the west)
Reduced net revenue per hectare for existing crop types and shifting/shrinking ranges for certain crops types and cultivars
Agriculture Sector
Higher mean temperatures Increased evaporation and decreased soil water balance (particularly to the west)
Increased irrigation requirements per hectare. Net water requirements of crops are projected to increase.
Agriculture Sector
Higher mean temperatures Increase in ranges and vigour of pests, diseases and vectors
Increased infestation of pests and diseases and reduced net revenue per hectare
Agriculture Sector
Higher mean temperatures 15-35% increase in heat units if Global Warming reaches 2°C.
Changes in the ranges, planting times, flowering and harvest times of crops.
Agriculture Sector
Higher mean temperatures Alteration to the ranges of certain species of plant and animal
Potential for introduction of new species for commercial exploitation
Agriculture Sector
1st order impact: Longer dry periods, shorter more intense wet periods
and increased temperature and heat waves
2nd order impact: Increased frequency and severity of droughts followed
by excessive and damaging rainfall
3rd order impact: Increase in frequency of crop failure and general
decline in rural livelihoods
4th order impact: Migration, urbanisation and conflict over resources

Phase 1: Climate Change Scenario
Eastern Cape Climate Change Response Strategy 51
Since the intention of the spreadsheet is to allow diverse summary tables and filters, all line items (rows) are fully populated even if this requires repeated entries in the primary and secondary impacts columns. The number and diversity of 2
nd and 3
rd order impacts is potentially unlimited. These impacts
are therefore not prescribed in the spreadsheet.
5.2.2.3 Affected systems, sectors and infrastructure.
The identification and description of impacts is strongly contextualised by the system, sector or infrastructure type under consideration. It is therefore likely that different 3
rd order impacts will
arise for the same primary and 2nd order impacts depending on the system or sector under
consideration. In the example below, the second order impact: “Alteration to the ranges of certain species of plant and animal” represents (potentially) a consequential opportunity in the agricultural sector, but a consequential risk in to biodiversity systems. Table 4: Different meanings of a similar impact for different sectors.
1st Order Impact 2
nd Order Impact 3
rd Order Impact
Systems/sectors/ Infrastructure
Higher mean temperatures Alteration to the ranges of certain species of plant and animal
Potential for introduction of new species for commercial exploitation
Agriculture Sector
Higher mean temperatures Alteration to the ranges of certain species of plant and animal
Potential disruption of ecosystems
Biodiversity Systems
As with the section above, the intention of the spreadsheet is to allow diverse summary tables and filters. All line items (rows) are fully populated even though this requires duplicate entries in the primary and secondary impacts columns for different sectors, systems or infrastructure. It follows that each system, sector or infrastructure type must be assessed independently, even if this results in a certain amount of duplication. Selectable systems, sectors or infrastructure types include:
• Agricultural Sector
• Air quality Systems
• Biodiversity Systems
• Coastal and Marine Systems
• Energy services Infrastructure
• Fisheries & Aquaculture Sector
• Forestry Sector
• Geology & Soils Systems
• Health Services Infrastructure
• Social & Economic Systems
• Tourism Sector
• Transport infrastructure
• Water Resources Systems
• Water Services Infrastructure
5.2.2.4 Risks and opportunities

Phase 1: Climate Change Scenario
Eastern Cape Climate Change Response Strategy 52
Although climate change primarily presents risks, there are nevertheless certain opportunities that may arise. For example the possibility of increased mean annual runoff in the eastern sections of the province may, all things being equal, result in the opportunity for increased hydro-power generation. A column is available to define whether a given climate change impact represents a risk or an opportunity in the context of a given sector, system or infrastructure type.
5.2.2.5 Notes on the historical occurrence of this impact
Climate change will not necessarily result in the occurrence of completely new impacts. Rather, events and trends are likely to increase in frequency and severity. For example floods are historically common, but it may be useful to note particularly extreme floods to: Illustrate examples or effects of that impact; Understand what it means if that event or trend increased in frequency and/or severity in future. A column has been included in the matrix in which descriptions of historical events can be included.
5.2.2.6 Assessment of likelihood, consequence and significance
Different impacts will have different degrees of significance for the province. Since there are so many potential climate change impacts, these must be ranked in order to allow the prioritisation of responses. In this study, significance is considered in terms of the likelihood of an impact taking place, and the consequences of that impact should it happen. The rating of likelihood and consequence requires a value judgement, and is therefore recognised as subjective. Given the scope of this study, it is not feasible to undertake a multi-stakeholder rating process for each impact. Therefore, and for the sake of consistency across the matrix, the rating of likelihood, consequence and significance is undertaken by the project team, guided by the scales in Table 5,

Phase 1: Climate Change Scenario
Eastern Cape Climate Change Response Strategy 53
Table 6 and Table 7 below. Table 5: Likelihood scales for the assessment of climate change risks (AGS 2006).

Phase 1: Climate Change Scenario
Eastern Cape Climate Change Response Strategy 54
Table 6: Consequence scales for local government risk assessment (AGS 2006).
Table 7: Significance scales based on the degree of likelihood and consequence (AGS 2006).

Phase 1: Climate Change Scenario
Eastern Cape Climate Change Response Strategy 55
5.2.2.7 Identifying affected provincial plans and strategies, agencies, departments and district municipalities.
The EC Climate Change Response Strategy aims to assist provincial competencies in responding to climate change risks and opportunities. It is therefore necessary to identify the provincial plans and strategies, agencies, departments and district municipalities that may be affected by each potential climate change risk in the context of a given system, sector or infrastructure type. In the risk matrix, a column has been allocated to each entity that may be affected. Each impact has a corresponding cell for each entity. Where the entity is directly affected, the cell is blacked out. Although it is recognised that different entities will be affected to different degrees by each impact, it is not feasible to objectively and consistently quantify or categorise these degree of impact given the scope of this study. In this study, therefore, a “yes” or “no” approach has been adopted, where:
• YES (blacked out cell) means that the entity will be directly affected by the impact; or
• NO (blank cell) means that the entity will either be indirectly affected, or will not be affected at all.
When an entity or plan is directly affected, this refers to immediate threats (or opportunities) to its mandate or goals. As an example of the difference between direct and indirect threats:
• The threat of reduced raw water quality will directly affect the local water service provider’s mandate to provide adequate basic water services to the population. This is a direct threat to the water services provider.
• If the water service provider fails to provide adequate basic services due to the direct threat of reduced water quality, this could, in turn, result in negative health effects which may threaten the capacity of the EC Department of Health. Therefore reduced water quality is an indirect threat to the EC Department of Health.
The person working with the matrix should: Examine each impact with respect to their relevant provincial plan, agency, department or district municipality and black out cells where relevant; and/or If adding an impact to the matrix, attempt to black out provincial plans, agencies, departments or district municipalities which, in their understanding, will be directly affected by that impact.
5.2.2.8 Identifying affected national departments
The EC Climate Change Response Strategy confines its scope to the Eastern Cape Province and Provincial Government. However, there are cases where certain provincial competencies are handled by a national department. A case in point is the National Department of Water. Where such as situation is relevant, a column exists for listing the affected department. Departments available in the drop-down list include:
• Department of Energy;
• Department of Agriculture Forestry & Fisheries; and
• Department of Water. The following sections provide discussions on possible impacts to systems, sectors or infrastructure in the province, thus providing background to the risks identified in the matrix.

Phase 1: Climate Change Scenario
Eastern Cape Climate Change Response Strategy 56
5.3 Biodiversity Systems
5.3.1 Background
According to IPCC AR4 there is now more specific information available across a wide range of systems and sectors concerning the nature of future impacts of climate change. The resilience of many ecosystems is likely to be exceeded this century by an unprecedented combination of climate change, associated disturbances (e.g. flooding, drought, wildfire, insects, ocean acidification) and other global change drivers (e.g. land-use change, pollution, fragmentation of natural systems, overexploitation of resources) (high confidence). Approximately 20 to 30% of plant and animal species assessed so far are likely to be at increased risk of extinction if increases in global average temperature exceed 1.5 to 2.5°C (medium confidence). For increases in global average temperature exceeding 1.5 to 2.5°C and in concomitant atmospheric CO2 concentrations, there are projected to be major changes in ecosystem structure and function, species’ ecological interactions and shifts in species’ geographical ranges, with predominantly negative consequences for biodiversity and ecosystem goods and services, e.g. water and food supply (high confidence). The southern extent of the Eastern Cape up to Nelson Mandela Bay Municipality (NMBM) incorporates the eastern-most extent of the Cape Floristic Region (CFR). According to Cape Action (www.capeaction.org.za), the CFR is recognised internationally for its high diversity of plant and animal life and despite its enormous economic importance, is one of the world’s 25 most threatened hotspots. The total economic value includes plants, animals, scenery, ecosystems and ecosystem services such as water purification and erosion control. According to AR4, “there will be substantial reductions in areas of suitable climate for 81-97% of the 5 197 African plants examined” and losses of between 51 - 61% of Fynbos and succulent Karoo biomes. The economy of the Eastern Cape is heavily dependent on natural systems which are linked directly to the success of important sectors including agriculture, forestry, fisheries (see above) and tourism. The potential implications of changes to biological systems are far-reaching and the risks need to be understood in order to allow economic systems to respond effectively.
5.3.2 Risks, Vulnerability and Opportunities
As with fisheries, biodiversity is extremely susceptible to climatic changes including rainfall and temperature. Reduced rainfall and increased temperatures may result in local extinction of marginal species and may facilitate extension of the geographical range of invasive alien species of plant an animal. These, in turn, will compete with indigenous species for scarce resources and may ultimately impair the ability of ecosystems to cope with other disturbances. This is of particular importance when indigenous species contribute to essential goods or services. Increased temperatures in particular are expected to result in increased insect outbreaks which may have negative consequences for agriculture within the province. An illustration of the global effects on biodiversity is given in Figure 14.

Phase 1: Climate Change Scenario
Eastern Cape Climate Change Response Strategy 57
Figure 14: Details and extent of projected impacts on ecological systems as mean global surface temperatures increase (Source: IPCC 2007)
5.3.3 Risk Matrix: Biodiversity systems
Primary Impact (Manifestation)
2nd Order Impact 3
rd Order Impact
Risk or opportunity
Significance (Likelihood x consequence)
Higher mean temperatures
Alteration to the ranges of certain species of plant and animal, including shifts in endemic taxa.
Potential disruption of ecosystems and conservation targets associated with protected areas.
Risk High
Higher mean temperatures
Local extinction of certain species
Potential disruption of ecosystems
Risk High
Longer dry spells and increased likelihood/ severity of droughts
Alteration to the ranges of certain species of plant and animal
Potential disruption of ecosystems.
Risk High
Longer dry spells and increased likelihood/ severity of droughts
Local extinction of certain species
Potential disruption of ecosystems
Risk High
Sea level rise Inundation of coastal habitats
Local extinction of certain species
Risk High
Elevated atmospheric CO2 concentrations
Coupled with other climate change manifestations, increased spread of alien invasive trees and shrubs.
Disruption of ecosystems, loss of biodiversity.
Risk Medium
More hot days and heat waves
Increased fire frequency and intensity - changes to fire regime
Changes to ecosystem processes.
Medium
Higher mean temperatures
Local extinction of certain species
Impacts to the economy, particularly the fishing, tourism and agricultural sectors
Risk Medium

Phase 1: Climate Change Scenario
Eastern Cape Climate Change Response Strategy 58
Longer dry spells and increased likelihood/ severity of droughts
Alteration to the ranges of certain species of plant and animal
Impacts to the economy, particularly the fishing, tourism and agricultural sectors
Risk Medium
Longer dry spells and increased likelihood/ severity of droughts
Local extinction of certain species
Impacts to the economy, particularly the fishing, tourism and agricultural sectors
Risk Medium
Sea level rise Inundation of coastal habitats
Potential disruption of ecosystems
Risk Medium
Sea level rise Inundation of coastal habitats
Impacts to the economy, particularly the fishing, tourism and agricultural sectors
Risk Medium
5.3.4 Relevance to the Provincial Government of the Eastern Cape
Seen together with other climate change impacts, losses and changes to Ecosystem Goods and Services is likely to have negative environmental, social and economic consequences for the Eastern Cape. These are likely to have implications for the following Eastern Cape Policies and Plans:
• PGDP;
• Provincial Industrial Development Strategy, particularly in connection with resource-based industries;
• AsgiSA Eastern Cape, particularly in connection with Agriculture and agro-processing, forestry development and tourism development; and
• RD&ATS, particularly in connection with food security and the non-farm rural economy.
5.4 Coastal and Marine Systems
5.4.1 Background
Observations since 1961 show that the average temperature of the global ocean has increased to depths of at least 3000m and that the ocean has been taking up over 80% of the heat being added to the climate system. Increases in sea level are consistent with warming where global average sea level rose at an average rate of 1.8 mm per year over 1961 to 2003 and at an average rate of about 3.1 mm per year from 1993 to 2003. Since 1993 thermal expansion of the oceans has contributed about 57% of the sum of the estimated individual contributions to the sea level rise, with decreases in glaciers and ice caps contributing about 28% and losses from the polar ice sheets contributing the remainder. From 1993 to 2003 the sum of these climate contributions is consistent within uncertainties with the total sea level rise that is directly observed. The IPCC AR4 report projects sea level rise of between 0.2 to 0.6 metres (excluding storm surges and other factors) for different development scenarios. It should be noted that the sea level projections do not include uncertainties in climate-carbon cycle feedbacks nor do they include the full effects of changes in ice sheet flow, because a basis in published literature is lacking. Therefore the upper values of the ranges given are not to be considered upper bounds for sea level rise. The projections include a contribution due to increased ice flow from Greenland and Antarctica at the rates observed for 1993-2003, but these flow rates could increase or decrease in the future. If this contribution were to grow linearly with global average temperature change, the upper ranges of sea level rise for the development scenarios would increase by 0.2m.

Phase 1: Climate Change Scenario
Eastern Cape Climate Change Response Strategy 59
It is also worth noting, that AR4 indicates that current models suggest virtually complete elimination of the Greenland ice sheet and a resulting contribution to sea level of about 7m if global average warming were sustained for millennia in excess of 1.9 to 4.6 degrees Celsius relative to pre-industrial values. Coasts are projected to be exposed to increasing risks, including coastal erosion, due to climate change and sea level rise. The effect will be exacerbated by increasing human-induced pressures on coastal areas (very high confidence). By the 2080s, many millions more people than today are projected to experience floods every year due to sea level rise. The numbers affected will be largest in the densely populated and low-lying mega-deltas of Asia and Africa while small islands are especially vulnerable (very high confidence). Of particular relevance to this report is that “three of the five regions shown to be at risk of flooding in coastal and deltaic areas of the world are those located in Africa” (IPCC AR4 chp 9: Africa) and one is southern Africa.
While there is little doubt that the coastal regions of the world will be affected by climate change (IPCC AR4), it is sometimes difficult to separate climate change related changes from those brought about by anthropogenic activities. Examples of human activities that could exacerbate the impacts of climate change, specifically changes in coastal geomorphology include shoreline development, clearing of mangroves and the mining of beach sand. According to AR4 (chp 1 Observed changes, Syvitski et al, 2005a), pumping of groundwater also enhances land subsidence. According to Cartwright (2009), the South African coastline’s natural buffering capacity has been eroded by anthropogenic activities including development of estuaries, land reclamation, removal of coastal dunes, and sand mining.
5.4.2 Risks, Vulnerability and Opportunities
Potentially the most significant direct impacts of climate change on coastal regions are loss of land, estuaries and wetland systems due to subsidence, storm events and flooding. As mentioned above, the impacts of climate change may be exacerbated by anthropogenic activities. The relatively pristine nature of the coastal zone of the Eastern Cape Province is key to its current and future contribution to the economy of the region through sectors such tourism and fishing / aquaculture. In addition, the three provincial ports and associated infrastructure are important for expansion of the local manufacturing sector. In recent years, considerable resources have been allocated to the development of coastal infrastructure to enhance these sectors, and expected impacts of climate change, including flooding, coastal surges and subsidence could ultimately have significant direct and indirect impacts on the economy of the province. Direct impacts could include damage to infrastructure, amenities and property and loss of human life while indirect impacts within the provincial context could include loss of tourism, increased expenditure on disaster relief and increased insurance premiums for coastal property (Cartwright, 2009).
5.4.3 Risk Matrix: Coastal and marine systems
Primary Impact (Manifestation)
2nd Order Impact 3
rd Order Impact
Risk or opportunity
?
Significance (Likelihood x consequence)
Increased storm severity/ Extreme weather events.
Increased subsidence and loss of coastal land, wetlands and estuaries
Increased damage to/loss of coastal property and infrastructure and increased insurance premiums
Risk Extreme

Phase 1: Climate Change Scenario
Eastern Cape Climate Change Response Strategy 60
Higher mean temperatures
Increase in sea-surface temperature
Changes to marine species distribution including expansion of the range of alien invasive species with associated negative economic impacts
Risk High
More intense rain
Increased erosion in coastal areas
Damage to infrastructure and property
Risk High
More intense rain
Increased erosion in coastal areas
Increased subsidence and loss of coastal land, wetlands and estuaries
Risk High
Higher mean temperatures
Increased sea-surface temperature
Changes to species distribution including expansion of the range of alien invasive species
Risk Medium
Increased storm severity/ Extreme weather events.
Increased subsidence and loss of coastal land, wetlands and estuaries
Reduced tourism potential Risk Medium
Increased storm severity/ Extreme weather events.
Increased subsidence and loss of coastal land, wetlands and estuaries
Increased financial allocation for disaster relief
Risk Medium
Increased storm severity/ Extreme weather events.
Loss of human life Reputational damage Risk Medium
Increased storm severity/ Extreme weather events.
Damage to infrastructure and property
Disruption of normal commercial activities and subsequent loss of income
Risk Medium
Increased storm severity/ Extreme weather events.
Damage to infrastructure and property
Increased allocation of financial resources for repair or replacement of infrastructure
Risk Medium
Increased storm severity/ Extreme weather events.
Disruption of normal commercial activities and subsequent loss of income
Reduction in economic potential of certain industry sectors
Risk Medium
Longer dry spells and increased likelihood/ severity of droughts
Discharge of more concentrated effluent into estuaries due to reduced dilution
Negative impacts of contaminants on coastal ecosystems with subsequent impacts on the fishing and tourism sectors
Risk Medium
More intense rain
Increased deposition of silt in rivers and estuaries
Negative impacts on coastal ecosystems with subsequent impacts on the fishing sector
Risk Medium
More intense rain
Flooding in coastal areas Damage to infrastructure and property
Risk Medium
More intense rain
Flooding in coastal areas Disruption of normal commercial activities and subsequent loss of income
Risk Medium

Phase 1: Climate Change Scenario
Eastern Cape Climate Change Response Strategy 61
Sea level rise Increased subsidence and loss of coastal land, wetlands and estuaries
Disruption of normal commercial activities and subsequent loss of income
Risk Medium
Sea level rise Increased subsidence and loss of coastal land, wetlands and estuaries
Decreased value of coastal properties
Risk Medium
Sea level rise Increased subsidence and loss of coastal land, wetlands and estuaries
Potential benefits to ports that become deeper and can accommodate ships with a deeper draft
Opportunity Medium
Increased storm severity/ Extreme weather events.
Increased subsidence and loss of coastal land, wetlands and estuaries
Increased demand for emergency services
Risk low
Increased storm severity/ Extreme weather events.
Loss of human life Increased expenditure on social grants for dependents
Risk low
More intense rain
Increased deposition of silt in rivers and estuaries
Increased discharge of sediment to nearshore marine systems resulting in increased turbidity with associated negative impacts on marine ecosystems
Risk low
More intense rain
Flooding in coastal areas Increased expenditure on disaster relief and emergency services
Risk low
More intense rain
Flooding in coastal areas Revision of coastal development plans
Risk low
Sea level rise Increased subsidence and loss of coastal land, wetlands and estuaries
Revision of coastal development plans
Risk low
5.4.4 Relevance to the Provincial Government of the Eastern Cape
The Eastern Cape Government, through the PGDP, ECDC and other agencies, places a strong emphasis on the role coastal and marine resources play in supporting livelihoods and economic development. Furthermore, a strong concentration of critical infrastructure is established along coastal zones, including roads, bridges, ports, pipelines and wastewater treatment facilities. This infrastructure is at risk to the impacts of climate changes.
5.5 Social and Economic Systems
5.5.1 Background
5.5.1.1 Demographics and Livelihoods
The population of the Eastern Cape has grown from 6,147,244 in 1996 to 6,527,747 in 2007 (see Table 8), representing a 6.2% growth rate over 11 years. The Eastern Cape has the third largest population in the country. Table 8: Population growth in South Africa by province (Source: Stats SA community survey). Provinces Census 1996 Census 2001 % Change CS 2007 % Change Eastern Cape 6 147 244 6 278 651 2,1 6 527 747 4,0 Free State 2 633 504 2 706 775 2,8 2 773 059 2,4 Gauteng 7 624 893 9 178 873 20,4 10 451 713 13,9 KwaZulu-Natal 8 572 302 9 584 129 11,8 10 259 230 7,0 Limpopo 4 576 133 4 995 534 9,2 5 238 286 4,9

Phase 1: Climate Change Scenario
Eastern Cape Climate Change Response Strategy 62
Mpumalanga 3 124 203 3 365 885 7,7 3 643 435 8,2 Northern Cape 1 011 864 991 919 -2,0 1 058 060 6,7 North West 2 936 554 3 193 676 8,8 3 271 948 2,5 Western Cape 3 956 875 4 524 335 14,3 5 278 585 16,7 South Africa 40 583 573 44 819 778 10,4 48 502 063 8,2
Key livelihood indicators for the province include Education, HIV/Aids, Water Services, Sanitation, Energy, Housing, Telecommunication and Refuse Removal. Indicators for energy services and water services are given in Figure 15 and Figure 16 respectively. The percentage of households in the Eastern Cape with access to electricity has increased from 50% in 2001 to 65% in 2007. However, this remains among the lowest rates of electrification in the country.
Figure 15: Percentage of households using electricity for lighting by province (Source: Stats SA Community Survey, 2007) The percentage of households that have access to piped water in the province has increased from 63% to 70.4%. This too remains one of the lowest levels of delivery in the country.
Figure 16: Percentage of households that have access to piped water by province (Source: Stats SA Community Survey, 2007)
5.5.1.2 Economy and Industry
The sustainability of the economy of the Eastern Cape is challenged by the distorted spatial nature of its development. As stated by the PGDP (2004): The Eastern Cape is characterised by extreme levels of uneven development. This is evident through a number of dualisms: between the two urban industrial manufacturing centres and
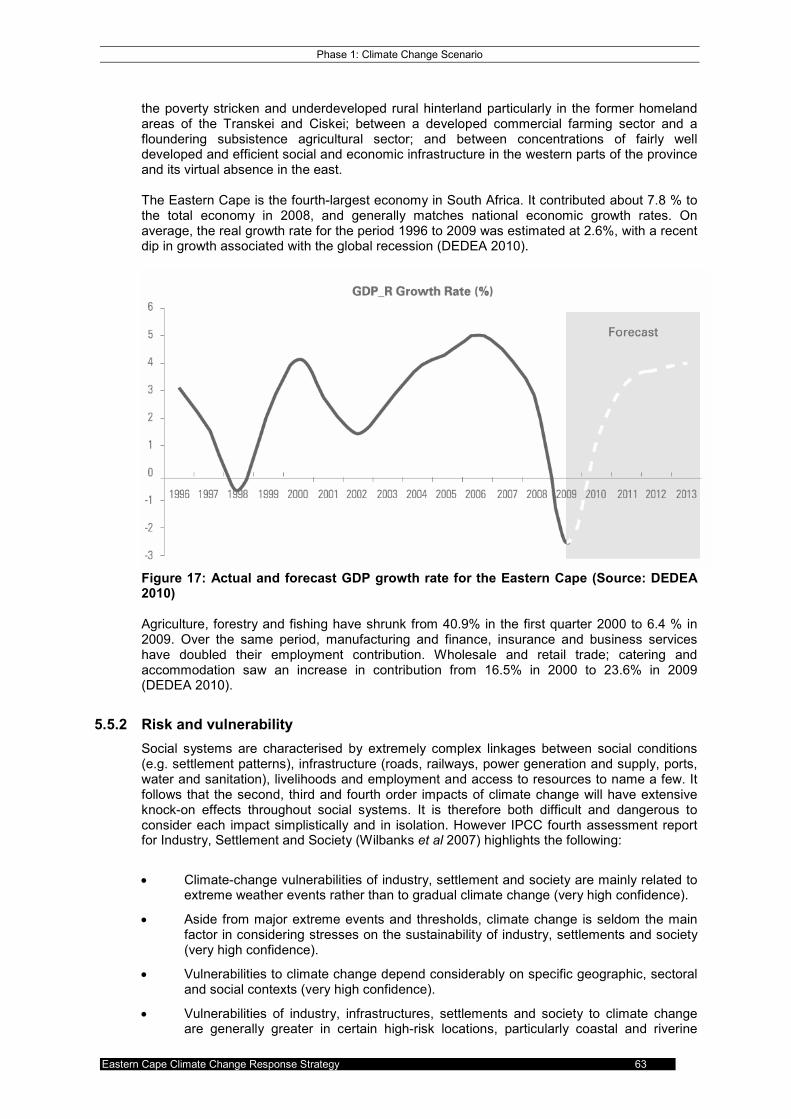
Phase 1: Climate Change Scenario
Eastern Cape Climate Change Response Strategy 63
the poverty stricken and underdeveloped rural hinterland particularly in the former homeland areas of the Transkei and Ciskei; between a developed commercial farming sector and a floundering subsistence agricultural sector; and between concentrations of fairly well developed and efficient social and economic infrastructure in the western parts of the province and its virtual absence in the east. The Eastern Cape is the fourth-largest economy in South Africa. It contributed about 7.8 % to the total economy in 2008, and generally matches national economic growth rates. On average, the real growth rate for the period 1996 to 2009 was estimated at 2.6%, with a recent dip in growth associated with the global recession (DEDEA 2010).
Figure 17: Actual and forecast GDP growth rate for the Eastern Cape (Source: DEDEA 2010) Agriculture, forestry and fishing have shrunk from 40.9% in the first quarter 2000 to 6.4 % in 2009. Over the same period, manufacturing and finance, insurance and business services have doubled their employment contribution. Wholesale and retail trade; catering and accommodation saw an increase in contribution from 16.5% in 2000 to 23.6% in 2009 (DEDEA 2010).
5.5.2 Risk and vulnerability
Social systems are characterised by extremely complex linkages between social conditions (e.g. settlement patterns), infrastructure (roads, railways, power generation and supply, ports, water and sanitation), livelihoods and employment and access to resources to name a few. It follows that the second, third and fourth order impacts of climate change will have extensive knock-on effects throughout social systems. It is therefore both difficult and dangerous to consider each impact simplistically and in isolation. However IPCC fourth assessment report for Industry, Settlement and Society (Wilbanks et al 2007) highlights the following:
• Climate-change vulnerabilities of industry, settlement and society are mainly related to extreme weather events rather than to gradual climate change (very high confidence).
• Aside from major extreme events and thresholds, climate change is seldom the main factor in considering stresses on the sustainability of industry, settlements and society (very high confidence).
• Vulnerabilities to climate change depend considerably on specific geographic, sectoral and social contexts (very high confidence).
• Vulnerabilities of industry, infrastructures, settlements and society to climate change are generally greater in certain high-risk locations, particularly coastal and riverine

Phase 1: Climate Change Scenario
Eastern Cape Climate Change Response Strategy 64
areas, and areas whose economies are closely linked with climate sensitive resources, such as agricultural and forest product industries, water demands and tourism; these vulnerabilities tend to be localised but are often large and growing (high confidence).
• Where extreme weather events become more intense and/or more frequent with climate change, the economic and social costs of those events will increase (high confidence).
• Poor communities can be especially vulnerable, in particular those concentrated in relatively high-risk areas (high confidence).
• Poor communities tend to have more limited adaptive capacities, and are more dependent on climate-sensitive resources such as local water and food supplies
Examples of the linkages between primary climate change impacts and stresses on social systems are given in Table 9. Table 9: Examples of current and projected climate-change impacts on industry, settlement and society and their interaction with other processes (adapted from Wilbanks et al 2007). Climate Driven Phenomena
Evidence for Current Impact/ Vulnerability
Other Processes/ Stresses
Projected Future Impact/ Vulnerability
Zones, Groups Affected
Changes in extremes
Storm surge
Flood and wind casualties and damages; economic losses: transport, tourism, infrastructure (e.g., energy, transport), insurance
Land use/ population density in flood-prone areas; flood defences; institutional capacities
Increased vulnerability in storm prone coastal areas; possible effects on settlements, health, tourism, economic and transportation systems, buildings and infrastructures
Coastal areas, settlements and activities; regions and populations with limited capacities and resources; fixed infrastructures; insurance sector
Extreme rainfall, riverine floods
Erosion/landslides; land flooding; settlements; transportation systems; infrastructure
As for storm surge, plus drainage infrastructure
As for storm surge, plus drainage infrastructure
As for storm surge, plus flood plains
Heat waves
Effects on human health; social stability; requirements for energy, water and other services (e.g., water or food storage), infrastructures (e.g., energy transportation)
Building design and internal temperature control; social contexts; institutional capacities
Increased vulnerabilities in some regions and populations; health effects; changes in energy requirements
elderly, very young, ill and/or very poor populations
Drought
Water availability, livelihoods; energy generation; migration,; transportation in water bodies
Water systems; competing water uses; energy demand water demand constraints
Water resource challenges in affected areas; shifts in locations of population and economic activities; additional investments in water supply
Semi-arid and arid regions; poor areas and populations; areas with human-induced water scarcity
Changes in means
Temperature
Energy demands and costs; urban air quality; thawing of permafrost soils; tourism and recreation; retail consumption; livelihoods; loss of melt water
Demographic and economic changes; land-use changes; technological innovations; air pollution; institutional capacities
Shifts in energy demand; worsening of air quality.
Very diverse, but greater vulnerabilities in places and populations with more limited capacities and resources for adaptation
Precipitation
Agricultural livelihoods; saline intrusion; tourism; water infrastructures; energy supplies
Competition from other regions/sectors. Water resource allocation
Depending on the region, vulnerabilities in some areas to effects of precipitation increases (e.g., flooding, but could be positive) and in some areas to decreases (see drought above)
Poor regions and populations
Saline intrusion Effects on water infrastructures
Trends in groundwater withdrawal
Increased vulnerabilities in coastal areas
Low-lying coastal areas, especially those with limited

Phase 1: Climate Change Scenario
Eastern Cape Climate Change Response Strategy 65
capacities and resources
Sea-level rise Coastal land uses; flood risk, water logging; water infrastructures
Trends in coastal development, settlement and land uses
Long-term increases in vulnerabilities of low-lying coastal areas
As for saline intrusion,
Abrupt climate change
Analyses of potentials
Demographic, economic, and technological changes; institutional developments
Possible significant effects on most places and populations in the world, at least for a limited time
Most zones and groups
5.5.3 Risk Matrix: Social and economic systems
Primary Impact (Manifestation)
2nd Order Impact 3
rd Order Impact
Risk or opportuni
ty?
Significance (Likelihood x consequence
)
More hot days and heat waves
Increased morbidity and mortality in elderly and infirm (e.g. HIV/AIDS patients)
Increased strain on health services
Risk Extreme
Higher mean temperatures
Coupled with increased rainfall, spread in range of diseases and vectors, including cholera, malaria and bilharzia.
General increase in occurrence of disease; exacerbation of effects on people with HIV/AIDS, the elderly and the poor.
Risk Extreme
Increased storm severity/ Extreme weather events.
Increased storm surges coupled with sea level rise and flooding from both climate change causes and catchment hardening.
Direct threat to livelihoods, services and infrastructure in coastal low lying areas.
Risk Extreme
Increased storm severity/ Extreme weather events.
Coupled with more intense rain, catchment hardening due to urban development, and reduced integrity of water catchments: increased risk of flooding or flash floods
Direct threat to infrastructure within flood-prone areas; Direct threat to human life.
Risk Extreme
More hot days and heat waves
Increased frequency of fire danger index reaching high-extreme
Increased fire frequency increases direct threat to human life, threats to livelihood and infrastructure.
Risk Extreme
More hot days and heat waves
Increased morbidity and mortality in elderly and infirm (e.g. HIV/AIDS patients)
Direct threat to livelihoods and social services
Risk Extreme
Higher mean temperatures
Increased evaporation, reduced soil moisture, reduced runoff and river baseflow.
Compounded by reduced MAP, systemic water shortages will limit economic growth potential to the south-west.
Risk Extreme
Sea level rise
Coupled with storm surges and flood events exacerbated by catchment hardening, inundation and wave damage to coastal low lying areas.
Direct threat to livelihoods, services and infrastructure in coastal low lying areas.
Risk Extreme
Increased storm severity/ Extreme weather events.
Crop damage from hail and wind and heavy rain
Increased risk of crop failure; threats to commercial and subsistence agriculture, rural livelihoods and food security.
Risk Extreme
Longer dry spells and increased likelihood/ severity of
Increased risk/frequency of dryland crop-failure; Increased mortality and reduced productivity among livestock.
Threats to commercial and subsistence agriculture, rural livelihoods and food security.
Risk Extreme

Phase 1: Climate Change Scenario
Eastern Cape Climate Change Response Strategy 66
droughts
More hot days and heat waves
Heat waves coupled with dry conditions may increase the risk of uncontrollable shack fires in informal settlements
Threat to human life. Threats to urban livelihoods and increased strain on urban disaster management systems.
Risk Extreme
Changes in annual average precipitation
Decreased precipitation in the south-western portion of the province poses a threat to drinking water quantity and quality.
Reduced availability of potable water, threats to human health from poor quality drinking water in un-serviced areas.
Risk High
Changes in annual average precipitation
Decreased precipitation in the south-western portion of the province increases risk of inadequate water supply
Gradual curtailment of industries and systems relying on bulk water supply per unit output.
Risk High
Higher mean temperatures
Spread in range of diseases and vectors, including cholera, malaria and bilharzia.
Strain on health services, increased morbidity and reduced economic productivity of population.
Risk High
Longer dry spells and increased likelihood/ severity of droughts
Risk of failure of water supply in the south-western portion of the province: water demand exceeds capacity to supply
Systematic shut down or curtailment of industries and systems relying on bulk water supply.
Risk High
More hot days and heat waves
Impacts on infrastructure and services (design specifications of systems exceeded)
Interrupted, reduced or limited service provision.
Risk High
More hot days and heat waves
Impacts on infrastructure and services (design specifications of systems exceeded)
Increased risk of unforeseen hazardous events/accidents such as train derailments or decouplings.
Risk High
More hot days and heat waves
Increased heat stress in population
loss of economic productivity when discomfort index is high
Risk High
More hot days and heat waves
Increased heat stress in population
Reduction in quality of life for people without appropriate housing and facilities
Risk High
More intense rain
Increased flood runoff exacerbated by catchment hardening and settlement below floodlines
Direct threat to livelihoods, services and infrastructure in areas within the current and future 1:100 year floodline
Risk High
More intense rain
Increased flood runoff Spread of disease as sanitation infrastructure becomes submerged
Risk High
Changes in annual average precipitation
Decreased precipitation in the south-western portion of the province increases risk of inadequate water supply
Systemic water shortages will limit economic growth potential to the south-west.
Risk High
Higher mean temperatures
Increased evaporation and decreased soil water balance (particularly to the west)
Threats to the viability of dryland crops; Threats to rural livelihoods and food security.
Risk High
Higher mean temperatures
Increase in ranges and vigour of pests, diseases and vectors;
Threats to subsistence agriculture, rural livelihoods and food security.
Risk High
Higher mean temperatures
Increased evaporation rates resulting in lower mean soil moisture percentages
Reduced viability of rainfed agriculture threatens rural livelihoods and food security
Risk High

Phase 1: Climate Change Scenario
Eastern Cape Climate Change Response Strategy 67
Higher mean temperatures
Increased evaporation rates resulting in lower mean soil moisture percentages
Lower livestock carrying capacity of rangelands threatens rural livelihoods
Risk High
Changes in annual average precipitation
Stresses on current ecosystems and vegetation cover resulting in changes to environmental goods and services
Threats to rural livelihoods where there is a reliance on sustainable use of environmental goods and services.
Risk High
Increased storm severity/ Extreme weather events.
Severe flooding may increase the risk of contaminated sources of drinking water
Threats to human health, including exposure to water born disease - particularly in rural and unserviced areas.
Risk High
Changes in annual average precipitation
Decreased precipitation in the south-western portion of the province increases risk of inadequate water supply
Increased cost of water, resulting in less competitive pricing of manufactured products.
Risk Medium
Higher mean temperatures
Worsening of air-quality in urban areas
Effects on human health Risk Medium
More hot days and heat waves
Increased demand for chilling, air conditioning, water services.
Increased stress on services and associated economic consequences.
Risk Medium
More hot days and heat waves
Increased frequency of fire danger index reaching high-extreme
Increasing strain on disaster management services
Risk Medium
More intense rain
Increased flood runoff Increased strain on disaster management services
Risk Medium
More hot days and heat waves
Increased heat stress in subsistence crops, and consequent lost productivity.
Threats to rural livelihoods and food security
Risk Medium
5.5.4 Relevance to the Provincial Government of the Eastern Cape
Climate change is likely to have impacts on numerous aspects of human development. These impacts may be positive or negative, depending on the geographic location, the economic sector, and the extent of existing development in that location. Since these impacts are likely to affect vulnerable communities to the greatest degree, Climate Change has strong relevance in terms of threat and opportunities for the goals of the PGDP and other provincial plans and policies.
5.6 Water Resource Systems
5.6.1 Background
The Eastern Cape Province largely incorporates two National Water Management Areas (WMA), namely the Mzimvubu to Keiskamma, and Fish to Tsitsikamma WMA areas. In addition a portion of the Kraai sub-catchment of the Upper Orange WMA lies within the provincial boundary. In addition to natural stream-flow, the Fish and Sundays Rivers are augmented by inter-basin transfer from the Gariep Dam. As with all WMAs in South Africa, over-abstraction remains a major issue for the management of water resources while threatening ecological stream-flow requirements. The While most rivers in the Fish to Tsitsikama are fully allocated, the Mzimvubu to Keiskamma remains one of the few WMAs where water resources are not 100% allocated. Water availability is summarised in Table 10. Table 10: Water availability per sub-WMA within the Eastern Cape Province – 2000 (million m
3/a) (source DWAF, 2002)

Phase 1: Climate Change Scenario
Eastern Cape Climate Change Response Strategy 68
Reporting Scale Natural Resource Usable Return Flow
WMAs Sub-WMAs Surface water
Groundwater Irrigation Urban Mining and bulk industrial
Transfers in
Total resource available
Mzimvubu 85 3 1 2 0 0 91
Mtata 129 1 0 6 0 0 136
Mbashe 112 1 0 1 0 85 199
Kei 325 14 14 6 0 0 359
Amatola 122 1 2 25 0 0 150
Mzimvubu to Keiskamma
Wild Coast 4 1 0 0 0 0 5
Fish -21 6 77 6 0 571 639
Bushmans 16 2 0 4 0 1 23
Sunday 81 16 29 2 0 120 248
Gamtoos 119 5 7 1 0 0 132
Algoa 21 6 1 6 0 68 102
Fish to Tsitsikamma
Tsitsikamma 49 1 1 2 0 0 53
Upper Orange
Kraai 34 10 0 0 0 0 44
Total 1076 67 132 61 0 845 2181
Water resource management issues in the Eastern Cape include:
• Over-abstraction of existing resources for irrigation, manufacturing and urban requirements, resulting in deterioration of downstream water quality, quantity and ecological integrity;
• Threats to water quality, quantity and aquatic ecosystem integrity due to catchment degradation;
• Threats to water quality, quantity and aquatic ecosystem integrity due to land-use change in catchments;
• Threats to water quality from sub-standard effluent releases as a result of poorly managed and poorly maintained waste-water treatment works and sewage reticulations.
• Threats to ecological integrity of fresh-water resources due to damming of existing resources.
It is likely that the above threats will be compounded by the impacts of future climate change.
5.6.2 Risk and vulnerability
Some of the secondary impacts of climate change on water resources include:
• Changes to baseflows and stormflows and their variabilities;
• Changes to annual streamflows and their variabilities;
• Changes to sediment yield and its variability; and
• Changes to irrigation water requirements and associated losses. Stormflow, baseflow and sediment yield regimes and their associated variability have strong and direct influences on water quality and quantity, as well as the integrity of aquatic ecosystems.
5.6.2.1 Changes to baseflows and stormflows and their variabilities;
Baseflows constitute “dry weather” flows and are hydrologically significant in that they sustain flows into the non-rainy seasons, are important for ecological flows and also have a different water chemistry to that of stormflows. Projected future changes in baseflow with respect to
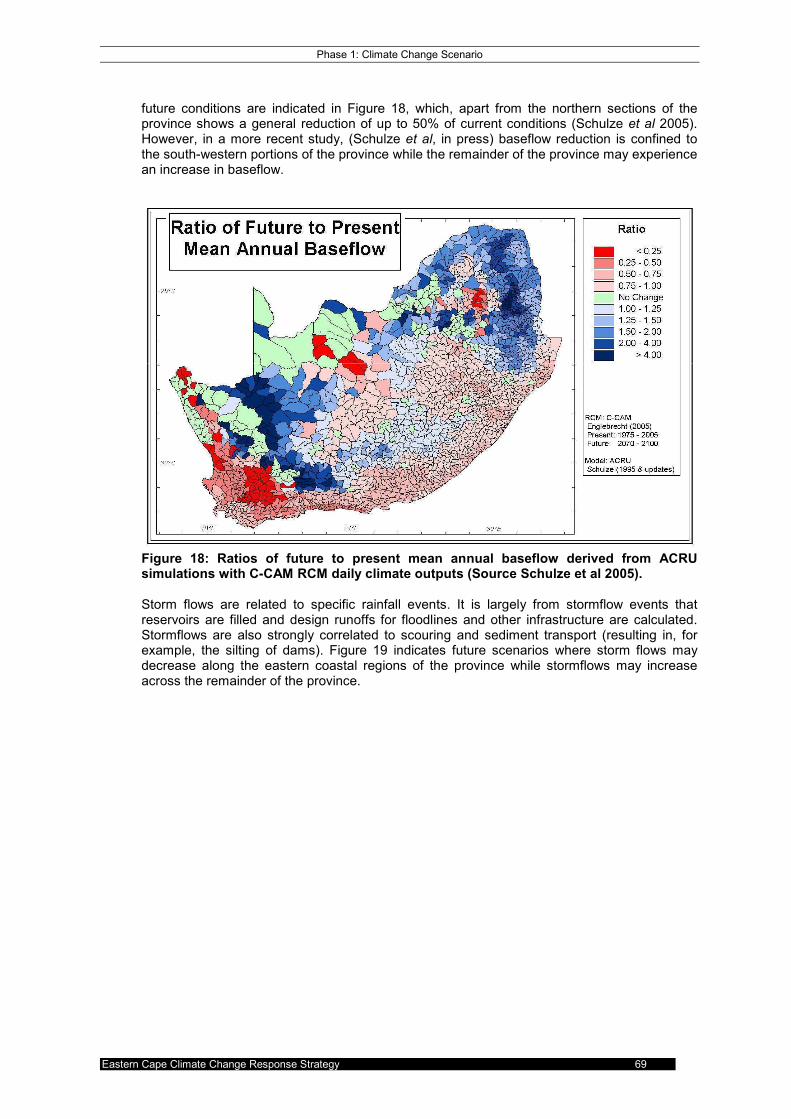
Phase 1: Climate Change Scenario
Eastern Cape Climate Change Response Strategy 69
future conditions are indicated in Figure 18, which, apart from the northern sections of the province shows a general reduction of up to 50% of current conditions (Schulze et al 2005). However, in a more recent study, (Schulze et al, in press) baseflow reduction is confined to the south-western portions of the province while the remainder of the province may experience an increase in baseflow.
Figure 18: Ratios of future to present mean annual baseflow derived from ACRU simulations with C-CAM RCM daily climate outputs (Source Schulze et al 2005). Storm flows are related to specific rainfall events. It is largely from stormflow events that reservoirs are filled and design runoffs for floodlines and other infrastructure are calculated. Stormflows are also strongly correlated to scouring and sediment transport (resulting in, for example, the silting of dams). Figure 19 indicates future scenarios where storm flows may decrease along the eastern coastal regions of the province while stormflows may increase across the remainder of the province.

Phase 1: Climate Change Scenario
Eastern Cape Climate Change Response Strategy 70
Figure 19: Ratios of future to present mean annual stormflow derived from ACRU simulations with C-CAM RCM daily climate outputs (Source Schulze et al 2005). Steamflow refers to the total runoff from a water catchment over the course of a year. Figure 20 indicates a general reduction in streamflow in the province, apart from the northern regions of the province. However, recent unpublished data shows an increase in annual streamflow to the east and a decrease to the southwest of the province.
Figure 20: Ratios of future to present mean annual accumulated streamflows derived from ACRU simulations (Source Schulze et al 2005). Sediment yield refers to the quantity of silt or sediment entrained, transported and deposited as water flows through a catchment. Figure 21 shows a decrease in sediment yield along the eastern coastal regions of the province with an increase to the north and west of the province.

Phase 1: Climate Change Scenario
Eastern Cape Climate Change Response Strategy 71
Figure 21: Ratios of future to present mean annual sediment yield and its inter-annual variability, derived from ACRU simulations with C-CAM RCM daily climate outputs (Schulze et al 2005). Table 11 gives the results of a recent (2009) assessment of future climate change streamflow scenarios for South Africa (Schulze et al, in press). This data represents an update of the studies undertaken by Schulze et al, 2005, and contrasts with the 2005 assessment in that there are indications of wetter than anticipated conditions to the east of the province and drier than anticipated conditions to the west. Table 11: Results of recent hydrological assessments (Schulze et al, in press). Ecological Flow Indicator Intermediate: Present Future: Present
Annual Subcatchment Runoff
Moderate increase projected in the eastern half of southern Africa. Moderate decrease projected for a band of Quinaires running from Limpopo to the Eastern Cape.
A significant increase by a factor of between 2 and 5 is projected throughout southern Africa, but excluding the Western Cape, which could experience a decrease by 25-50%.
Annual Accumulated Streamflows
Moderate increase projected in the eastern half of southern Africa. Moderate decrease projected for a band of Quinaires running from Limpopo to the Eastern Cape.
A significant increase by a factor of between 2 and 5 is projected throughout southern Africa, but excluding the Western Cape, which could experience a decrease by 25-50%.
CoD of Annual Subcatchment Runoff
Results do not display clear overall trends, but most Quinaries throughout southern Africa could experience a decrease in CoD.
Results do not display clear overall trends, but most Quinaries throughout southern Africa could experience a decrease in CoD.
CoD of Annual Accumulated Streamflows
Results do not display clear overall trends, but most Quinaries throughout southern Africa could experience a decrease in CoD.
Results indicate most Quinaries throughout southern Africa could experience a decrease in CoD.
Magnitude of Flow Events
Annual Alt-BFI
Eastern half of the country could experience an increase, while no significant change is projected for the Western and Eastern Cape.
Eastern half of the country could experience an increase, while the no significant change is projected for the Western and Eastern Cape.
Duration of Flow Events Annual Low Flow
Conditions Moderate increase projected in the eastern half of southern Africa by approximately 50% for all flow durations. Moderate decrease projected for a large band of Quinaires running from Limpopo to the Eastern Cape
A significant increase by a factor of between 2 and 5 is projected throughout southern Africa, but excluding the Western Cape, which could experience a decrease in flows by 25-50% for all flow durations.

Phase 1: Climate Change Scenario
Eastern Cape Climate Change Response Strategy 72
for all flow durations.
Annual High Flow Conditions
Moderate increase projected in the eastern half of southern Africa by approximately 50% for all flow durations. Moderate decrease projected for a large band of Quinaires running from Limpopo to the Eastern Cape for all flow durations.
A significant increase by a factor of between 2 and 5 is projected throughout southern Africa, but excluding the Western Cape, which could experience a decrease in flows by 25-50% for all flow durations.
CoD of Annual Low Flow Conditions
Results do not display clear overall trends, but most Quinaries throughout southern Africa could experience a decrease in CoD for all flow durations.
Results indicate most Quinaries throughout southern Africa could experience a decrease in CoD for all flow durations.
CoD of Annual High Flow Conditions
Results do not display clear overall trends, but most Quinaries throughout southern Africa could experience a decrease in CoD for all flow durations.
Results indicate most Quinaries throughout southern Africa could experience a decrease in CoD for all flow durations.
Rowlston (2011) summarises potential impacts on water resources as follows:
• Increased temperature.
• Will result in increased evaporation from open water surfaces such as impounding reservoirs, increased evaporation from the land surface reduced surface runoff, and probable increases in crop water requirements with consequential increases in the demand for irrigation water.
• Increased variability of rainfall and runoff
• The costs of creating additional storage is likely to increase, since impounded volumes will need to be higher to maintain assurance of yield.
• Changes in annual average river flow regimes, and groundwater recharge rates.
• If the changes are negative they will result in reductions in the availability of water for offstream uses such as domestic water supply and irrigation, and changes in the ecological functioning of rivers and streams.
• Reduced flow rates will reduce the assimilative capacity of rivers and declines in water quality.
• Changes in the intensity and duration of flood and drought events.
• Increased frequency and intensity of storm events is likely to increase erosion from land surfaces, resulting in sediment deposition in river channels and eventual reduction in storage capacity of in-channel impoundments.
• Higher rainfall intensity may increase washoff of pollutants from diffuse sources into rivers, thereby affecting water quality.
• The frequency and extent of Inundation of riparian zones is likely to increase, with concomitant increases in risk to those living in flood-prone areas.
• Increases in the length and frequency of rainfall-related drought events will increase the requirement for irrigation water, or reduce agricultural productivity, or both.
5.6.3 Risk Matrix: Water resource systems
Primary Impact (Manifestation)
2nd Order Impact 3
rd Order Impact
Risk or opportunit
y?
Significance (Likelihood x consequence
)

Phase 1: Climate Change Scenario
Eastern Cape Climate Change Response Strategy 73
Changes in annual average precipitation
Decreased annual average precipitation to the west of the province resulting in reduced annual stream flow
Reduction in quantity of water in the system
Risk High
Changes in annual average precipitation
Decreased annual average precipitation to the west of the province resulting in reduced groundwater recharge.
Reduction in quantity of water in the system
Risk High
Changes in annual average precipitation
Increased annual average precipitation to the east of the province resulting in increased stream flow
Increase in quantity of water in the system
Opportunity
High
Increased storm severity/ Extreme weather events.
Increased storm flow events Increased scouring, erosion, turbidity and sedimentation of fresh-water systems.
Risk High
Longer dry spells and increased likelihood/ severity of droughts
Reduced base flows during dry period
Altered freshwater flow-regimes threatens freshwater and estuarine ecological integrity and general water quality. Exacerbating current water quality issues.
Risk High
More intense rain
Increased storm flow events Increased scouring, erosion, turbidity and sedimentation of fresh-water systems.
Risk High
More intense rain
Increased storm flow events
Altered flow-regimes and increased disturbance may threaten current ecosystem structures and community structure.
Risk High
Changes in annual average precipitation
Decrease in vegetation cover of catchments in the south-western portions of the province.
Increased storm-flow and decreased, baseflow, together with a decrease in groundwater recharge.
Risk Medium
Changes in annual average precipitation
Decrease in vegetation cover of catchments in the south-western portions of the province.
Increased sedimentation and turbidity of water resources.
Risk Medium
Changes in annual average precipitation
Increased variability of inter-annual precipitation to the west of the province will result in an increase in the variability of inter-annual flow-regimes.
Increasing variability of flow regimes is likely to increase the stress on sensitive/highly niche species.
Risk Medium
Higher mean temperatures
Reduced baseflows due to increased evaporation and decreased soil water balance
Altered freshwater flow-regimes threatens freshwater and estuarine ecological integrity and general water quality.
Risk Medium
Higher mean temperatures
Higher ambient temperature of freshwater
Reduced concentrations of dissolved oxygen in freshwater. This will reduce water quality and limit the ability of certain freshwater species to exist in aquatic habitats.
Risk Medium
Higher mean temperatures
Higher ambient temperature of freshwater
Increased eutrophication Risk Medium
Higher mean temperatures
Higher ambient temperature of freshwater
Increased biological activity of certain tolerant species causing changes in ecosystem community composition (e.g. algal blooms).
Risk Medium

Phase 1: Climate Change Scenario
Eastern Cape Climate Change Response Strategy 74
Higher mean temperatures
Higher evaporation rates Increased Total Dissolved Solids/Salinity of freshwater during baseflow periods.
Risk Medium
More hot days and heat waves
Higher evaporation rates Increased Total Dissolved Solids/Salinity of freshwater during baseflow periods.
Risk Medium
More hot days and heat waves
Increased frequency of fire danger index reaching high-extreme
Increased fire frequency may change catchment landcover characteristics, in turn changing surface water flow characteristics
Risk Medium
Sea level rise Salt water intrusion into ground water
Reduced quality of groundwater resources
Risk Medium
Higher mean temperatures
15-35% increase in heat units if Global Warming reaches 2°C.
Increased vigour and spread of alien invasive species resulting in increased stream flow reductions
Risk low
5.6.4 Relevance to the Provincial Government of the Eastern Cape
It is in the interest of the Provincial Government of the Eastern Cape to ensure that the quantity and quality of water resources, together with the integrity of the biophysical systems that support them, remain adequate for the growth and development requirements of the Eastern Cape. At the same time it is necessary to ensure the adequate supply of basic water services. Climate Change projections indicate that there may be negative impacts to water resources systems in the western portion of the province, while there will be both negative and positive impacts in the central and eastern portions. The above issues are strongly relevant to the goals of the PGDP, while the water services mandates of district and local municipalities may be threatened by the quantity, quality and unpredictability of available water supplies in the Water Management Areas of the Eastern Cape.
5.7 Agricultural Sector
5.7.1 Background
Approximately 1.7% of the Eastern Cape value added gross domestic product comes through agriculture and 2.9% of the population in the Eastern Cape is working in this sector (Provide, 2009). However, in addition to formal agriculture, it should be noted that Approximately 3.7 million people living in 594,188 (83.5%) rural households in the Eastern Cape have access to land for farming purposes (Stats SA Rural Survey, 1997). Approximately 407,000 (69.4%) of these smallholders have livestock other than poultry and 461,000 (78.4%) of these households grow farm produce (such as maize and sorghum). The Eastern Cape is accounts for 21% of South Africa's cattle, 28% of its sheep and 46% of its goats, while the province provides approximately a quarter of the national milk supply. In terms of agricultural crops, the province is a major producer of chicory, pineapples, tomatoes, citrus fruit, deciduous fruit and tea (ECDC 2009). Large-scale agricultural projects currently driven by the Eastern Cape Government include:
• A drive to place 30,000 hectares of land under maize production as part of the ASGISA Eastern Cape project; and
• Pans to make a further 460,000 hectares available for food and biofuel crops as part of its PGDP.

Phase 1: Climate Change Scenario
Eastern Cape Climate Change Response Strategy 75
5.7.2 Risks and vulnerability
Perhaps the most pervasive of effects of climate change on agriculture is the gradual increase in mean temperature and changes in moisture condition over time. The full scale of knock-on effects is difficult to extrapolate. Changes in temperature and moisture regimes from current conditions may result in both increases and decreases in agricultural productivity depending on local circumstances and the crop type in place. Projected climate change will alter the rate at which heat units accumulate, affecting crop yields, timing of farming operations and pest vigour. With a 2°C increase in temperature, on average, most of the agriculturally important parts of the country will experience a 15-35% increase in heat units, with most significant increases on the Highveld and eastern Escarpment which are currently amongst the coolest regions (Midgley et al 2007). Conversely, warming as a result of climate change is predicted to reduce the accumulation of chill units, making it more difficult to produce chill-dependent deciduous fruits such as apples. Furthermore added heat stress will reduce the productivity of perennial and annual crops. Due to increased evaporation and drying net water requirements for crops in the summer rainfall region are projected to increase throughout southern Africa but particularly in the eastern and central parts of South Africa. Projections for profitability of maize production are sensitive to temperature, rainfall. A 2°C temperature increase is projected to reduce profits by around R500/ha across the highveld maize region (Midgley et al 2007, Rudman 2007).
5.7.3 Risk Matrix: Agricultural Sector
Primary Impact (Manifestation)
2nd Order Impact 3
rd Order Impact
Risk or opportunit
y
Significance (Likelihood x consequence
)
More hot days and heat waves
Increased frequency of fire danger index reaching high-extreme, coupled with berg-wind conditions
Risk of major loss of livestock, grazing, crops and infrastructure. Threats to financial sustainability of existing commercial and subsistence farming operation and rural livelihoods; Reduced food security.
Risk Extreme
Higher mean temperatures
Increased evaporation and decreased soil water balance (particularly to the west)
Reduced net revenue per hectare for existing crop types and shifting/shrinking ranges for certain crops types and cultivars
Risk High
Higher mean temperatures
Increased evaporation (from both soil and open water sources) and decreased soil water balance (particularly to the west)
Increased irrigation requirements per hectare. Net water requirements of crops are projected to increase.
Risk High
Higher mean temperatures
Increase in ranges and vigour of pests, diseases and vectors
Increased infestation of pests and diseases and reduced net revenue per hectare
Risk High
Increased storm severity/ Extreme weather events.
Threats to infrastructure due to wind damage
Increased damage to hydroponics/shade tunnels.
Risk High

Phase 1: Climate Change Scenario
Eastern Cape Climate Change Response Strategy 76
More hot days and heat waves
Increased heat stress for crops and livestock,
Risk of crop failure and poorer livestock performance per hectare.
Risk High
More intense rain
Increased soil erosion Loss of soil resources and fertility, silting up of dams and irrigation infrastructure
Risk High
More hot days and heat waves
Increased heat stress among livestock
Reduced productivity and product quality among non-indigenous breeds, and consequent threats to viability of commercial and subsistence farming
Risk High
More hot days and heat waves
Increased heat stress in dryland and irrigated crops
Reduced crop productivity and quality, and consequent threat to viability of commercial and subsistence farming.
Risk High
Higher mean temperatures
Increased evaporation of surface water resulting in increased salinisation of irrigated lands.
Reduced yields from irrigated crops in marginal areas.
Risk High
Fewer cold/frost days
Fewer chill units per year Decreased yield and or ranges for crops relying on cold weather (e.g. olives & apples)
Risk High
Increased number of berg wind days
Increased danger of wild fire
Risk of major loss of livestock, grazing, crops and infrastructure. Threats to financial sustainability of existing farming operations.
Risk High
Increased storm severity/ Extreme weather events.
Crop damage from hail and wind and heavy rain
Increased risk of crop failure; threats to financial sustainability of operations. Threats to viability of subsistence agriculture.
Risk High
Longer dry spells and increased likelihood/ severity of droughts
Impacts on yield
Increased risk of crop failure and loss of livestock. Threats to financial sustainability of farming operations.
Risk High
More hot days and heat waves
Increased risk of heat events damaging certain crops
Increased risk of crop failure and reduced net revenue per hectare
Risk High
More intense rain
Increased flood run off Threats to crops, livestock and infrastructure
Risk High
Change in precipitation patterns
Increased inter- and intra- annual variability of rainfall
Reduced viability of dryland crops; Increased economic risks to dryland crop-farming.
Risk High
Elevated atmospheric CO2
Concentrations
Increased plant productivity per hectare
Increased biomass and increased crop yield if considered apart from negative heat and water impacts.
Opportunity
Medium
Elevated atmospheric CO2
concentrations
Increased growth of shrubs and trees in grassland
Increased bush encroachment and spread of alien invasive trees and shrubs.
Risk Medium
Fewer cold/frost days
Changes in crop planting date
Potential lengthening of the growing season.
Opportunity
Medium
Higher mean temperatures
Increase in heat units Changes in the ranges, planting times, flowering and harvest times of crops.
Risk Medium
Longer dry spells and increased likelihood/ severity of
Decreased water quality Poorer quality of irrigation water may reduce net revenue per hectare
Risk Medium

Phase 1: Climate Change Scenario
Eastern Cape Climate Change Response Strategy 77
droughts
Longer dry spells and increased likelihood/ severity of droughts
Increased evaporation and decreased water balance
Increased stress to existing crop regime. Reduced average revenue per hectare over time
Risk Medium
Sea level rise Salt water intrusion into ground water
Reduced viability of coastal farming operations relying on ground-water.
Risk Medium
Higher mean temperatures
Alteration to the ranges of certain species of plant and animal
Potential for introduction of new species for commercial exploitation
Opportunity
low
5.7.4 Relevance to the Provincial Government of the Eastern Cape
The Agricultural Sector is one of the most important primary resource bases in the Eastern Cape, is an important source of employment, and is critical to rural livelihoods and food security. Climate Change impacts are relevant to the Province in regard to:
• Threat to the goals of the PDGP
• Threat to the goals of Asgisa and the Massive Food Programme
• Threat to the goals of the ECDC.
• General threats to the Eastern Cape Economy.
5.8 Fisheries & Aquaculture Sector
5.8.1 Background
The fishing sector as a whole makes a significant contribution to the economy of South Africa and in the Eastern Cape, it is estimated that conventional fishing and the operation of fish farms contributes 1.82% to the Provincial Gross Value Add (GVA) (EC development plan REF?). According to the Eastern Cape Development Corporation (ECDC) (www.ecdc.co.za), the fishing industry in the province “generates over R400 million (US$53 million) a year and employs 3 500 people in both primary and secondary production”. If one considers this contribution relative to total exports of animals and animal products from the province, it equates to a highly significant 78% of the total R535 million. In addition to the contribution to the GVA, the sector also generates significant employment opportunities. It is estimated that in 2006 nearly 28 000 people were employed nationally by the fishing sector, with 13.6% of these jobs (~3 800) being in the Eastern Province (DEAT, SoE, 2006, http://soer.deat.gov.za). The industry is currently concentrated around Port Elizabeth and key catch species are cuttlefish and squid that contribute approximately R300 million (72% of industry revenue) followed by sardines (R26 million or 6.3% of industry revenue) (ECDC, 2010). A number of successful aquaculture ventures are also operational within the province. Local conditions are particularly conducive to the operation of fin-fish operations and key factors such as availability of suitable sites, water temperature and the location of the East London and Coega industrial development zones are likely to contribute to the growth of this sector. Recent development in the local aquaculture sector include operations for the growth of prawns, kob and abalone.
5.8.2 Risks, Vulnerability and Opportunities
Fluctuations in rainfall, sea level and sea temperature associated with climate change are likely to have a significant impact on marine ecosystems, with potential consequences for all sectors of the industry (DEAT, 2006 – SoER). One of the most far-reaching impacts will be the continued reduction in the amount of freshwater entering estuaries. These natural systems are frequently the receptors of effluent streams, which are likely to be more concentrated due to

Phase 1: Climate Change Scenario
Eastern Cape Climate Change Response Strategy 78
the lack of freshwater to dilute contaminants. This could ultimately lead to a reduction in water quality in estuaries and in-shore marine environments, with negative consequences for local ecosystems. These areas are important for local fisheries and reduced water quality could have a negative impact on local fish resources. According to DEAT (2006), “loss or reduction of estuarine habitats is likely to have serious consequences for fisheries that target estuary-associated species” including the east coast prawn trawl fishery. The total landed value of this particular industry is R8.5 million per year but it is uncertain what proportion of this falls within the Eastern Cape Province. A change in sea-surface temperature is also predicted to have significant consequences for marine ecosystems and their function. According to DEAT (2006), sea-surface temperatures have increased by approximately 0.25
oC per decade over the last four decades. Marine
species, particularly those that are most sensitive to temperature, are likely to respond by shifting distribution patterns. As a consequence, the location of traditional fishing grounds may change as could the type and relative abundance of species in a particular area. Other manifestations of climate change, including increased frequency of storm events and sea-level rise could also have negative impacts on fisheries. Impacts could include physical damage to infrastructure (both off-shore and land-based), and an increase in the number of days that fishing vessels must remain within the shelter of ports. The latter will result in a reduction in the number of fishing days per year and could reduce total annual tonnage of fish caught. According to IPCC AR4 (2007), the ocean has become more acidic since 1750 with an average decrease in pH of 0.1 units. Although there are currently no reports on the impact of this acidification, it is expected that it will have “negative impacts on marine shell-forming organisms and their dependent species”. This may be of relevance to the future success of prawn and abalone fisheries and aquaculture operations in the province. Positive impacts could include expansion of the number of commercial fish species in certain areas due to changes in sea temperature, and increased demand for land-based aquaculture to secure supply of fish as a result of decreased reliability of natural fish populations.
5.8.3 Risk Matrix: Fisheries & Aquaculture Sector
Primary Impact (Manifestation)
2nd Order Impact 3
rd Order Impact
Risk or opportunity
?
Significance (Likelihood x consequence)
Higher mean temperatures
Increase in sea-surface temperature
Potential disruption of ecosystems and subsequent changes to local fish stocks in terms of species and abundance
Risk High
Increased storm severity/ Extreme weather events.
Damage to infrastructure Financial resources required for replacement or repair
Risk High
Increased storm severity/ Extreme weather events.
Damage to infrastructure Disruption of normal commercial activities
Risk High
Increased storm severity/ Extreme weather events.
Disruption of normal commercial activities ie. Vessels spent more time in the port due to unfavorable or dangerous sea conditions
Loss of income Risk High
Increased storm severity/ Extreme weather events.
Disruption of normal commercial activities ie. Vessels spent more time in the port due to unfavorable or dangerous sea conditions
Loss of employment opportunities Risk High

Phase 1: Climate Change Scenario
Eastern Cape Climate Change Response Strategy 79
Increased storm severity/ Extreme weather events.
Disruption of normal commercial activities ie. Vessels spent more time in the port due to unfavorable or dangerous sea conditions
Closure of marginal business operations
Risk High
Longer dry spells and increased likelihood/ severity of droughts
Discharge of more concentrated effluent into estuaries due to reduced dilution
Negative impacts of contaminants on coastal ecosystems with subsequent impacts on fish stocks
Risk High
More intense rain
Increased deposition of silt in rivers and estuaries
Negative impacts on coastal ecosystems with subsequent impacts on the fishing sector
Risk High
More intense rain
Increased deposition of silt in rivers and estuaries
Increased discharge of sediment to nearshore marine systems resulting in increased turbidity with associated negative impacts on marine ecosystems
Risk High
Higher mean temperatures
Increase in sea-surface temperature
Expansion of number of species that can be exploited commercially
Opportunity Medium
Increased storm severity/ Extreme weather events.
Loss of life Increased demand for social grants to support families of survivors
Risk Medium
Higher mean temperatures
Increase in sea-surface temperature
Increased demand for cooling of water for land-based aquaculture operations
Risk low
5.8.4 Relevance to the Provincial Government of the Eastern Cape
Fisheries and aquaculture are important to food security and economic development in the province. As such, threats to the sector pose a risk to the outcomes of provincial development.
• Threat to the goals of the PDGP
• Threat to the goals of the ECDC.
• General threats to the Eastern Cape Economy.
5.9 Forestry Sector
5.9.1 Background
The forestry plantations in the Eastern Cape cover 176,401 ha and represent 13% of South Africa’s plantation resource. Forestry and timber products contribute R300 million a year to the national GDP, and the forestry sector employs 8,700 people (ECSECC 2007).

Phase 1: Climate Change Scenario
Eastern Cape Climate Change Response Strategy 80
Figure 22: Current and potential extents of plantation forestry in South Africa (Source ECSECC 2007) Studies have shown that the current extent of commercial forests have the potential to be expanded from 176 401 Ha to roughly 286 000 Ha (Figure 22). At full potential, the forestry sector is projected to account for 12000 direct jobs and R1400 million and R 7000 million in forestry and processing respectively (Table 12). Table 12: Economic impact of new afforestation in the Eastern Cape (Source ECSECC 2007)
Impact Existing 175 000 Ha Up by 100 000 Ha Jobs Direct 7000 12000 Jobs Indirect 28000 48000 Revenue Forestry R 300 million R 1400 million Revenue Processing R 1500 million R 7000 million
5.9.2 Risks and opportunities
The formal forestry sector is sensitive to projected rainfall change. With expected temperature increases 2ºC and a reduction in rainfall of 10%, most forestry species show reduced viable production area of between 40% and 100%, but an increase of between 50% and 90% in planting area if rainfall increases by 10% with 2ºC warming (Midgely 2007). In addition to temperature and rainfall changes, various studies have shown that forest productivity may increase with increasing concentrations of atmospheric CO2 given suitable temperature and precipitation regimes (IPCC 2007). However, commercial forests are also prone to extreme events which have been modelled to increase in frequency with climate change. For example severe storm events or wild-fires driven by berg winds may result in the mass destruction of large expanses of standing stocks. The above climate change related risks must also be considered in combination. For example the likelihood of longer and more sever dry periods, coupled with increased dead matter due to disease and storm events, will severely increase the risk and severity of wild-fires driven by berg-winds.
5.9.3 Risk Matrix: Forestry Sector
Primary Impact (Manifestation)
2nd Order Impact 3
rd Order Impact
Risk or opportunity
?
Significance (Likelihood x consequence)

Phase 1: Climate Change Scenario
Eastern Cape Climate Change Response Strategy 81
More hot days and heat waves
Increased frequency of fire danger index reaching high-extreme, coupled with berg-wind conditions
Risk of major and widespread loss of standing stocks and threats to financial sustainability of existing operations.
Risk Extreme
Increased number of berg wind days
Increased danger of wild fire
Risk of major loss of standing stocks and threats to financial sustainability of existing operations.
Risk High
Changes in annual average precipitation
Reduced streamflows, especially to the south west of the province.
Forestry, as a legislated form of streamflow reduction, will face increased competition for water use from other sectors such as agriculture and urban demand.
Risk High
Changes in annual average precipitation
Increased annual average precipitation to the east of the province.
If temperature regimes are suitable, increased standing stocks and yield of forest product per hectare.
Opportunity Medium
Changes in annual average precipitation
Decreased annual average precipitation to the west of the province.
Reduction in suitable planting areas to the west of the province
Risk Medium
Higher mean temperatures
Increase in ranges and vigour of pests, diseases and vectors
Defoliation and reduced timber quality, with the possibility of large-scale die back.
Risk Medium
Higher mean temperatures
15-35% increase in heat units if Global Warming reaches 2°C.
Changes in ranges suitable for forestry
Opportunity Medium
Elevated atmospheric CO2
Concentrations
CO2 Fertilisation may increase the growth rate and yield of forests per hectare given suitable precipitation regimes.
Increased standing stocks and forest product for processing per hectare.
Opportunity low
5.9.4 Relevance to the Provincial Government of the Eastern Cape
Forestry and the processing of forest products are seen as an important element of the Provincial economy. The consequences of climate change are, among others, listed below:
• Increased risk of major loss of standing stocks threatens sustainability of local economy, job creation and livelihoods in certain regions.
• Likelihood of improved forest productivity has positive economic consequences to the east of the province.
• Likelihood of reduced suitable planting areas has negative economic consequences to the west of the province.
5.10 Water Services Infrastructure
5.10.1 Background
The Eastern Cape Province has a population of 6.5 million, of which 3 million have been provided with basic water supply services and 2.14 with sanitation services (DWA, 2010). There is a current backlog of 0.14 million households without basic water services infrastructure and 0.44 million households without basic sanitation services. Numerous infrastructure projects funded by the Municipal Infrastructure Grant system are underway. Table 13 gives a list of capital and expenditure projects for the period 2009/2010. Budget allocations increased from R 59 Million in 2008/9 to R 91 Million in 2009/10. Table 13: List of capital expenditure and implementation projects for 2009/10 (Source: DWA, 2010)

Phase 1: Climate Change Scenario
Eastern Cape Climate Change Response Strategy 82
Scheme District Municipality
Local Municipality
Project Budget Allocation for 2008/09
Project Budget Allocation for 2009/10
Implementation/Construction
Sterkspruit Bulk Supply Mains
Ukhahlamba Design
OR Tambo Mthatha FS O.R.Tambo 800,000.00 1,500,000.00 Preliminary Design
Sundays River Cacadu Sundays River Valley/ Paterson
0 10,000,000.00 Construction
Ibika Water supply Amatole Mnquma 3,200,000.00 5,000,000.00 Design Mncwasa BWS Amatole Mbashe 4,300,000.00 10,000,000.00 Tender Xhora East WS Amatole Mbashe 3,400,000.00 25,000,000.00 Tender Mbhashe North Amatole Mbashe 4,000,000.00 Construction Chris Hani Tsomo RDP2 (Amahlathi,IntsikaYethu, Emalahleni)
Chris Hani Intsika Yethu Construction/ Completed
Mbizana Regional Bulk WS O.R.Tambo Mbizana 4,800,346.00 22,000,000.00 Design 35% OR Tambo regional extensions (Coffee Bay)
O.R.Tambo King Sabata Dalindyebo
18,304,255.00 10,750,000.00 Tender
OR Tambo Mthatha Bulk Water Intervention
O.R.Tambo
King Sabata Dalindyebo/ Mhlontlo/ Nyandeni
21,095,399.00 7,250,000.00 Construction
Total 59,900,000.00 91,500,000.00
The ability of the Department of Water Affairs and the six Water Services Authorities in the province to expand and sustain water and sanitation services in the Eastern Cape is strongly dependent on state of the water resources in the relevant Water Management Areas (see section 5.6). It is therefore critical that those responsible for water services infrastructure take into account future climate change scenarios related to water resources. Climate Change is also likely to have secondary and tertiary impacts on the technical and operational integrity of installed water services infrastructure.
5.10.2 Risks and Opportunities
The risks and opportunities outlined here are in many instances knock-on effects of climate change impacts to water resources in general. For more details of primary and secondary impacts to water resources, see section 5.6). Impacts detailed below are adapted from Cromwell et al, 2007 and IPCC 2007.
5.10.2.1 Rising Sea Levels
• Increased saline intrusion into groundwater aquifers
• Water treatment challenges: need for desalination
• Increased salinity of brackish surface water sources
• Water treatment challenges: need for desalination
• Increased risk of direct storm and flood damage to water utility facilities
5.10.2.2 Warmer overall
• Changes in flow regimes due to upstream changes
• Changes in recharge characteristics of major groundwater aquifers due to upstream changes
5.10.2.3 Increased water temperature
• Increased evaporation and eutrophication in surface sources
• Water treatment and distribution challenges (disinfection, byproducts, regrowth)
5.10.2.4 Possible increased water demand

Phase 1: Climate Change Scenario
Eastern Cape Climate Change Response Strategy 83
• Increased irrigation demand
• Increased urban demand with more heat waves and dry spells
• Increased drawdown of local groundwater resources to meet the above
5.10.2.5 More intense rainfall events:
• Increased turbidity and sedimentation
• Loss of capacity of storage dams
• Increased water treatment costs
• Shallower, warmer water; increased evaporation and eutrophication
• Increased risk of direct flood damage to water services and treatment facilities.
5.10.2.6 Increased inter-annual variability of streamflow.
• Unpredictability of annual water supply to storage dams
• Increased storage capacity required for assurance of the same supply, with associated increases in unit cost of supply.
5.10.3 Risk Matrix: Water Services Infrastructure
Primary Impact (Manifestation)
2nd Order Impact 3
rd Order Impact
Risk or opportunity
?
Significance (Likelihood x consequence)
Longer dry spells and increased likelihood/ severity of droughts
Longer periods without stream flow
Risk of inadequate raw water reserves for water services
Risk High
More intense rain
Increased storm flow events Increased siltation of water storage dams, reducing water storage capacity.
Risk High
More intense rain
Increased storm flow events Increased risk of direct flood damage to low-lying infrastructure.
Risk High
Sea level rise Together with increased rain intensity and storm events, increased coastal flooding
Risk of direct flood damage to water and sanitation infrastructure
Risk High
Changes in annual average precipitation
Decreased precipitation in the south-western portion of the province increases risk of inadequate water supply
Increased cost of water supply Risk Medium
Changes in annual average precipitation
Decrease in vegetation cover of catchments in the south-western portions of the province.
Increased storm-flow and decreased, baseflow will cause water storage challenges
Risk Medium
Changes in annual average precipitation
Decrease in vegetation cover of catchments in the south-western portions of the province.
Increased sedimentation and turbidity results in sedimentation of water storage dams.
Risk Medium
Changes in annual average precipitation
Decrease in vegetation cover of catchments in the south-western portions of the province.
Increased sedimentation and turbidity results in water treatment challenges
Risk Medium

Phase 1: Climate Change Scenario
Eastern Cape Climate Change Response Strategy 84
Changes in annual average precipitation
Increased variability of inter-annual precipitation to the west of the province will result in an increase in the variability of inter-annual flow-regimes.
Decreased predictability of annual flows requires an increase in storage capacity for assurance of the same supply, at a higher cost.
Risk Medium
Higher mean temperatures
Higher ambient temperature of freshwater
Water treatment and distribution challenges such as disinfection and byproducts.
Risk Medium
Longer dry spells and increased likelihood/ severity of droughts
Increased evaporative losses to surface water
Reduced availability of raw water and reduced water supply
Risk Medium
More hot days and heat waves
Increased urban demand for water services
Increased delivery challenges Risk Medium
More hot days and heat waves
Increased irrigation requirements
Increased competition for water allocations
Risk Medium
5.10.4 Implications for the Provincial Government of the Eastern Cape
The broad range of second, third and fourth order impacts that could be produced by climate change on the water services sector are extensive. The threats to the sustainability of water services and resultant socio-economic consequences, particularly to the south-west of the province, are considered to be high.
5.11 Transport infrastructure
5.11.1 Background
For the purpose of this report, transport infrastructure includes roads, rail, airports, pipelines and sea ports. Any negative impacts on this infrastructure would have significant negative impacts not only for those directly involved in transportation of goods and people but also for all other sectors that rely on transport. These include manufacturing, agriculture, tourism and even health and emergency services. Transport infrastructure serving the major industrial cities of the Eastern Cape, East London and Port Elizabeth, is well-developed and includes an airport and sea-port in each. In addition to the Port of Port Elizabeth, the nearby Coega IDZ is also served by the Port of Ngqura, a deep-water port. The high quality of this transport infrastructure is one of the keys to the future development of the IDZs in both cities. According to the ECDC, statistics show that in 2006, 17.3% of the provincial GDP was attributed to the manufacturing sector, mostly related to automotive and components sector and to a lesser extent textiles, clothing, chemicals and machinery. The growth of this sector will be highly dependent of efficient transportation of raw materials and finished products. Tourism, another potential growth sector, is also highly dependent on transport infrastructure. Rail infrastructure in the province is extensive and is important for movement of commuters, mainline passengers and freight (ECDC, 2010). The main lines connect the cities of Port Elizabeth and East London with Gauteng. All three ports are serviced by rail infrastructure but as the main lines from the ports of East London and Port Elizabeth run close to the shoreline, they are considered vulnerable to damage resulting from more frequent storm events and, potentially, sea-level rise. The road network is also extensive but only 10% are paved. Due to the extreme importance of transport infrastructure to the economy, the potential impact of climate change on this infrastructure has received considerable attention internationally.
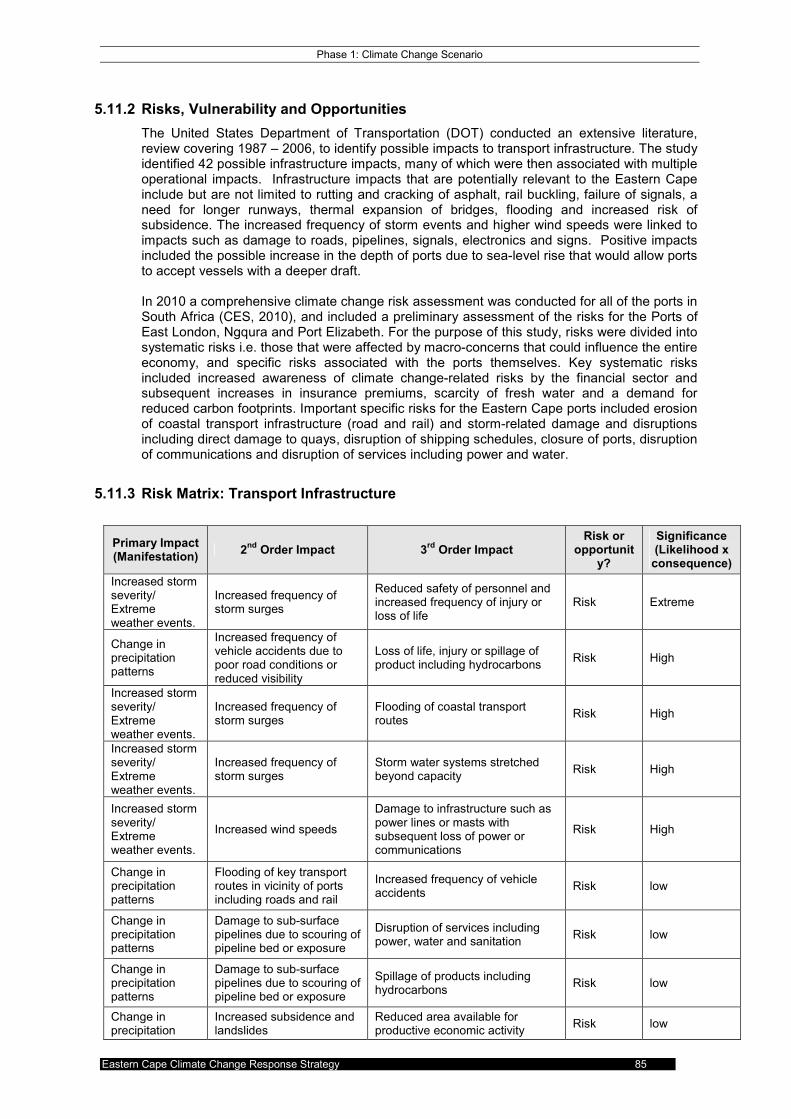
Phase 1: Climate Change Scenario
Eastern Cape Climate Change Response Strategy 85
5.11.2 Risks, Vulnerability and Opportunities
The United States Department of Transportation (DOT) conducted an extensive literature, review covering 1987 – 2006, to identify possible impacts to transport infrastructure. The study identified 42 possible infrastructure impacts, many of which were then associated with multiple operational impacts. Infrastructure impacts that are potentially relevant to the Eastern Cape include but are not limited to rutting and cracking of asphalt, rail buckling, failure of signals, a need for longer runways, thermal expansion of bridges, flooding and increased risk of subsidence. The increased frequency of storm events and higher wind speeds were linked to impacts such as damage to roads, pipelines, signals, electronics and signs. Positive impacts included the possible increase in the depth of ports due to sea-level rise that would allow ports to accept vessels with a deeper draft. In 2010 a comprehensive climate change risk assessment was conducted for all of the ports in South Africa (CES, 2010), and included a preliminary assessment of the risks for the Ports of East London, Ngqura and Port Elizabeth. For the purpose of this study, risks were divided into systematic risks i.e. those that were affected by macro-concerns that could influence the entire economy, and specific risks associated with the ports themselves. Key systematic risks included increased awareness of climate change-related risks by the financial sector and subsequent increases in insurance premiums, scarcity of fresh water and a demand for reduced carbon footprints. Important specific risks for the Eastern Cape ports included erosion of coastal transport infrastructure (road and rail) and storm-related damage and disruptions including direct damage to quays, disruption of shipping schedules, closure of ports, disruption of communications and disruption of services including power and water.
5.11.3 Risk Matrix: Transport Infrastructure
Primary Impact (Manifestation)
2nd Order Impact 3
rd Order Impact
Risk or opportunit
y?
Significance (Likelihood x consequence)
Increased storm severity/ Extreme weather events.
Increased frequency of storm surges
Reduced safety of personnel and increased frequency of injury or loss of life
Risk Extreme
Change in precipitation patterns
Increased frequency of vehicle accidents due to poor road conditions or reduced visibility
Loss of life, injury or spillage of product including hydrocarbons
Risk High
Increased storm severity/ Extreme weather events.
Increased frequency of storm surges
Flooding of coastal transport routes
Risk High
Increased storm severity/ Extreme weather events.
Increased frequency of storm surges
Storm water systems stretched beyond capacity
Risk High
Increased storm severity/ Extreme weather events.
Increased wind speeds
Damage to infrastructure such as power lines or masts with subsequent loss of power or communications
Risk High
Change in precipitation patterns
Flooding of key transport routes in vicinity of ports including roads and rail
Increased frequency of vehicle accidents
Risk low
Change in precipitation patterns
Damage to sub-surface pipelines due to scouring of pipeline bed or exposure
Disruption of services including power, water and sanitation
Risk low
Change in precipitation patterns
Damage to sub-surface pipelines due to scouring of pipeline bed or exposure
Spillage of products including hydrocarbons
Risk low
Change in precipitation
Increased subsidence and landslides
Reduced area available for productive economic activity
Risk low

Phase 1: Climate Change Scenario
Eastern Cape Climate Change Response Strategy 86
patterns
Change in precipitation patterns
Increased subsidence and landslides
Loss of life or injury Risk low
Change in precipitation patterns
Increased subsidence and landslides
Resources required for clearing of material and stabilisation of slopes
Risk low
Change in precipitation patterns
Increased subsidence and landslides
Temporary closure of roads and rail resulting in delays
Risk low
Change in precipitation patterns
Increased subsidence and landslides
Resources required for repair of infrastructure
Opportunity low
Change in precipitation patterns
Flooding of construction works or work stoppages
Delay in completion of projects Risk low
Change in precipitation patterns
Deterioration of concrete structures
Increased financial costs related to repair
Risk low
Change in precipitation patterns
Increased storm water flow Increased transportation of pollutants into the port
Risk low
Higher mean temperatures
longer runways required Increased expenditure to upgrade facilities
Risk low
Higher mean temperatures
longer runways required Increased requirements for land Risk low
Higher mean temperatures
More frequent overheating of diesel engines
Increased frequency of stoppages and breakdowns
Risk low
Higher mean temperatures
Additional cold storage requirements
Increased requirements for land Risk low
Increased storm severity/ Extreme weather events.
Increased frequency of storm surges
Release of pollutants due to damage of infrastructure or vehicles
Risk low
Increased storm severity/ Extreme weather events.
Lightning / electrical disturbances
Damage to electrical and electronic infrastructure and loss of power
Risk low
Sea level rise Higher tides at port and harbour facilities
Improved or reduced access to vessels depending on design and size,
Risk low
Change in precipitation patterns
Flooding of key transport routes in vicinity of ports including roads and rail
Increased travel time due to road closures, speed restrictions & malfunction of signals.
Risk Medium
Change in precipitation patterns
Direct destruction of property and infrastructure due to flooding
Disruption or closure of transport routes and regular port operations and costs associated with repair or claims
Risk Medium
Change in precipitation patterns
Increased storm water flow Changes to patterns and quantities of silt deposition within ports
Risk Medium
Higher mean temperatures
Damage to key transport routes into and out of ports due to eg. rail buckling and expansion of bridges
Increased travel time due to delays, derailments, failure of track sensors and signals
Risk Medium
Higher mean temperatures
Additional cold storage requirements
Increased energy consumption Risk Medium
Increased storm severity/ Extreme weather events.
Increased frequency of storm surges
Direct damage to infrastructure including quay walls
Risk Medium

Phase 1: Climate Change Scenario
Eastern Cape Climate Change Response Strategy 87
Increased storm severity/ Extreme weather events.
Increased wind speeds Congestion within ports Risk Medium
Sea level rise Erosion of coastal transport infrastructure (roads and rail)
Increased travel time and delays due to road closures and speed restrictions
Risk Medium
Sea level rise Higher tides at port and harbour facilities
Increased frequency of over-topping leading to damage to infrastructure and injury
Risk Medium
Sea level rise Increased depth of the port Use of port by larger vessels and reduced requirements for dredging
Opportunity Medium
5.11.4 Relevance to the Provincial Government of the Eastern Cape
The PGDP explicitly recognises the role of infrastructure in unlocking economic growth and social development. The PGDP places emphasis on: • Major road links • Rail links • Airports • Seaports Furthermore, the PGDP recognises the importance of good rural access roads as integral to poverty alleviation and rural livelihoods. As outlined in the section above, climate change poses a threat to the integrity and expansion of transport infrastructure.
5.12 Energy services Infrastructure
Although energy consumption in the Eastern Cape is dominated by commercial and industrial sectors, it should also be noted that access to household energy is disparate, with numerous households relying on primary forms of energy such as fuelwood and paraffin. Figure 23 shows that although most households utilise electricity for lighting, there remains a significant number of households relying on paraffin and candles. It is notable that a large proportion of the households relying on paraffin and candles are situated to the east of the province.
0
200000
400000
600000
800000
1000000
1200000
Number of Households
Series1 1045720 3270 259311 265341 3070 10020
Electricity Gas Paraffin Candles Solar Other
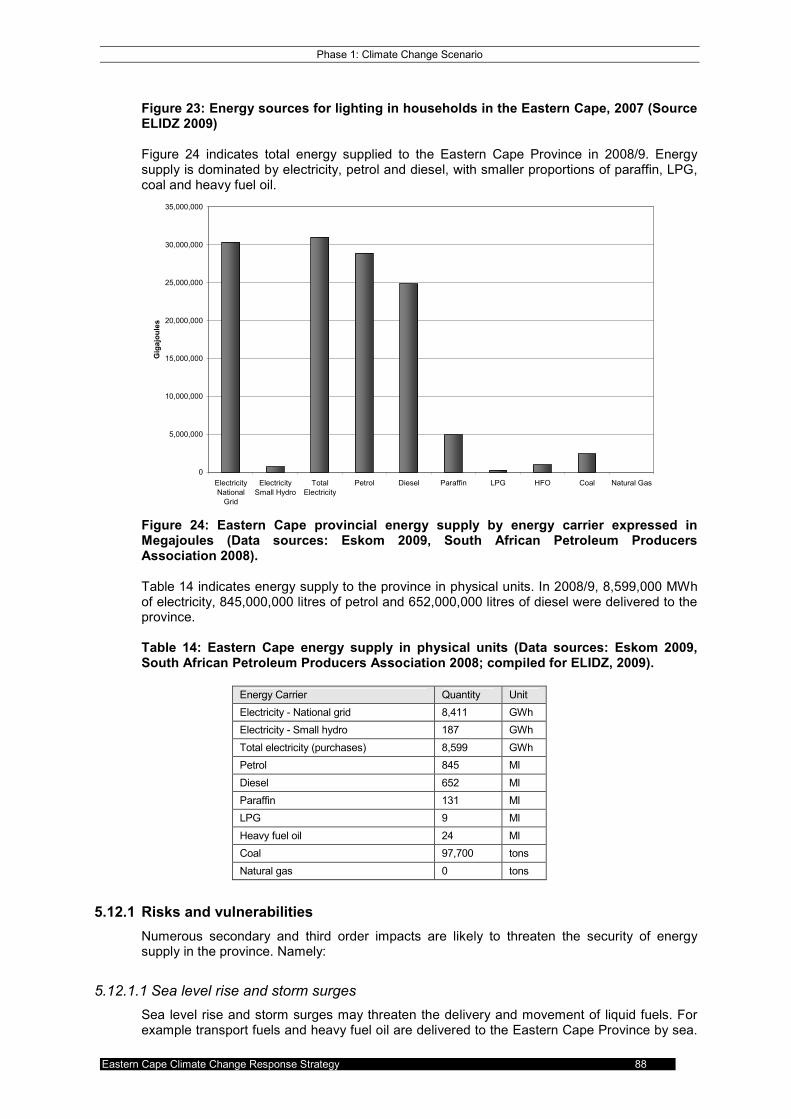
Phase 1: Climate Change Scenario
Eastern Cape Climate Change Response Strategy 88
Figure 23: Energy sources for lighting in households in the Eastern Cape, 2007 (Source ELIDZ 2009) Figure 24 indicates total energy supplied to the Eastern Cape Province in 2008/9. Energy supply is dominated by electricity, petrol and diesel, with smaller proportions of paraffin, LPG, coal and heavy fuel oil.
0
5,000,000
10,000,000
15,000,000
20,000,000
25,000,000
30,000,000
35,000,000
Electricity
National
Grid
Electricity
Small Hydro
Total
Electricity
Petrol Diesel Paraffin LPG HFO Coal Natural Gas
Gigajoules
Figure 24: Eastern Cape provincial energy supply by energy carrier expressed in Megajoules (Data sources: Eskom 2009, South African Petroleum Producers Association 2008). Table 14 indicates energy supply to the province in physical units. In 2008/9, 8,599,000 MWh of electricity, 845,000,000 litres of petrol and 652,000,000 litres of diesel were delivered to the province. Table 14: Eastern Cape energy supply in physical units (Data sources: Eskom 2009, South African Petroleum Producers Association 2008; compiled for ELIDZ, 2009).
Energy Carrier Quantity Unit
Electricity - National grid 8,411 GWh
Electricity - Small hydro 187 GWh
Total electricity (purchases) 8,599 GWh
Petrol 845 Ml
Diesel 652 Ml
Paraffin 131 Ml
LPG 9 Ml
Heavy fuel oil 24 Ml
Coal 97,700 tons
Natural gas 0 tons
5.12.1 Risks and vulnerabilities
Numerous secondary and third order impacts are likely to threaten the security of energy supply in the province. Namely:
5.12.1.1 Sea level rise and storm surges
Sea level rise and storm surges may threaten the delivery and movement of liquid fuels. For example transport fuels and heavy fuel oil are delivered to the Eastern Cape Province by sea.

Phase 1: Climate Change Scenario
Eastern Cape Climate Change Response Strategy 89
With rising sea levels and storm surges, the port infrastructure for the delivery and transfer of these fuels may be threatened. Likewise transport infrastructure for the distribution of fuels, such as roads and railways crossing estuaries and low lying coastal areas may be threatened.
5.12.1.2 Increased wild-fires
Increased wild fires may impact low voltage transmission lines traversing forests and vegetation prone to wildfire. This is particularly the case when wooden, rather than steel or concrete pylons are utilised.
5.12.1.3 Increased average temperature and heat waves
Increased average temperature and heat waves are likely to increase electricity demand for chilling and air conditioning purposes. In particular, demand scenarios related to air conditioning and chilling are likely to increase peak demand, placing severe strain on national reserve generation capacity. In consequence, it is possible that reserve power generation capacity will be required which will experience high levels of inter-peak redundancy.
5.12.1.4 Increased mean temperature and precipitation to the east of the province
It is possible that projected climate changes may result I an increase in biological productivity to the east of the province. This in turn may result in potential for an increase in the availability of biofuel, biogas and biomass energy feedstocks for energy generation in response to provincial needs. Similarly, changing patterns may result in an increase in streamflows for hydro-electric generation. This is, however, countered by reduced water quality associated with increased storm-flow events.
5.12.2 Risk Matrix: Energy services Infrastructure
Primary Impact (Manifestation)
2nd Order Impact 3
rd Order Impact
Risk or opportunity
?
Significance (Likelihood x consequence)
Sea level rise
Together with storm surges, inundation of liquid fuel delivery and transfer infrastructure in ports
Reduced security of liquid fuel supply
Risk High
Changes in annual average precipitation
Increased annual average precipitation to the east of the province resulting in increased stream flow
Potentially improved viability of hydro-electric power generation
Opportunity Medium
Changes in annual average precipitation
Increased annual average precipitation to the east of the province, together with increased mean temperature, may increase biological productivity
Increased availability of biomass, biofuel and biogas feedstocks for local and provincial energy generation and refining.
Opportunity Medium
Higher mean temperatures
Increased demand event for chilling, air conditioning, water services.
Increased power demand over and above existing growth projections - increased stress on reserve generation capacity and transmission infrastructure.
Risk Medium
Increased storm severity/ Extreme weather events.
Storm surges, together with sea level rise and increased flood frequency, may result in direct damage to energy transmission and distribution systems.
Threats to provincial energy security
Risk Medium

Phase 1: Climate Change Scenario
Eastern Cape Climate Change Response Strategy 90
More hot days and heat waves
Increased demand for chilling, air conditioning, water services.
Increased peak demand may place severe stress on reserve generation margins and transmission infrastructure
Risk Medium
Higher mean temperatures
Reduced energy demand for heating
Reduce stress on reserve generation capacity in winter months
Opportunity low
Increased number of berg wind days
Increased danger of wild fire Possible damage to electricity transmission infrastructure
Risk low
Increased storm severity/ Extreme weather events.
Threats to electricity transmission infrastructure as a result of wind damage, such as trees falling onto power-lines.
Increased power outages Risk low
5.12.3 Relevance to the provincial government of the Eastern Cape
The security of energy supply is considered to be of strategic significance. As noted by DEDEA 2008: “Energy security is high on the political agenda of the country and the province as whole. As the issue of energy affects different sectors of civil society and the economy, and not only economic growth and development, the Department of Economic Development and Environmental Affairs (DEDEA) considers it important that the question of energy is addressed in an integrated manner. Efforts to position the Province as a compelling place to live, work and invest require particular focus on a common approach to energy efficiency, the sustainable use of non-renewable energy sources, alternative energy sources, and other areas of intervention”. The potential risks and opportunities associated with climate change must be considered in provincial energy planning.

Phase 1: Climate Change Scenario
Eastern Cape Climate Change Response Strategy 91
6 EASTERN CAPE GREENHOUSE GAS INVENTORY
6.1 Introduction
As part of the development of the Eastern Cape Climate Change Strategy, the Eastern Cape Department of Economic Development and Environmental Affairs would like to develop the greenhouse gas (GHG) inventory for the Eastern Cape Province. There are two commonly used methods for calculating emissions, namely the Intergovernmental Panel on Climate Change (IPCC) Guidelines for National Emission Inventory Reporting and the ‘Greenhouse Gas (GHG) Protocol Corporate Accounting Standard’ developed by the World Business Council for Sustainable Development and the World Resources Institute. The GHG Protocol is best suited for use by individual organisations and industries and focuses on determining emissions from specific activities (e.g. electricity generation, combustion of fuel in vehicles etc). The IPCC Inventory Guidelines look at emissions from a sector level and is best suited to categorisation of emissions on a regional and national basis as it focuses on direct emissions and reduces the risk of double counting. Using the IPCC methodology also allows for emissions from individual activities to be disaggregated into sectors to allow for more detailed analysis. Upon review of regional GHG inventories developed for cities and provinces around the world and in discussion with the South African National Department for Environmental Affairs, it is considered appropriate for the Eastern Cape Province GHG Inventory to be developed in line with the IPCC Guidelines. This chapter discusses the context within which GHG Inventories are developed internationally and outlines the work currently underway on a national level to formalise the processes within which the South African National GHG Inventory is developed. The final section outlines the recommended framework within which the Eastern Cape Provincial GHG Inventory should be developed in order to reduce duplication of effort and to feed directly into the National GHG Inventory development.
6.2 GHG Inventories – Context
6.2.1 International
South Africa is party to the United Nations Framework Convention on Climate Change (UNFCCC) and is required to develop, periodically update, and publish national inventories of anthropogenic greenhouse gas (GHG) emissions. The Intergovernmental Panel on Climate Change (IPCC) has developed procedures and best practice guidance to assist countries with the development of national GHG Inventories. The 1996 IPCC Guidelines were revised and new guidelines incorporating best practice and lessons learned were issued in 2006. The 2006 IPCC Guidelines have yet to be approved by the UNFCCC and as such the vast majority of countries continue to use the 1996 IPCC Guidelines. South Africa made the decision to calculate its third National GHG Inventory in accordance with the 2006 Guidelines despite the fact that they are awaiting approval. The delay between publication and approval relates to the lengthy international negotiation process and the current focus on achieving an internationally binding emission reduction agreement. It is unlikely that there will be significant changes requiring amendment to inventories calculated in accordance with these guidelines following approval which is estimated to be in 2012. One of the most significant changes in the 2006 IPCC Guidelines, relative to the 1996 IPCC Guidelines, was the restructuring of inventory sectors, in particular the combining of agriculture, forestry, and land use change, into one sector. GHG emissions have been classified into the following four categories: Energy: emissions within this sector are from the combustion of fuel and fugitive fuel emissions from stationary and mobile energy activities including: public electricity and heat

Phase 1: Climate Change Scenario
Eastern Cape Climate Change Response Strategy 92
production; petroleum refining; manufacture of solid fuels; other energy industries; manufacturing industries and construction; transport; commercial; residential; agriculture; forestry; fishing; and fugitive emissions from coal mining, coal-to-liquid, oil and natural gas activities. Industrial Processes and Product Use (IPPU): emissions within this sector comprise by-product or fugitive emissions of GHGs from industrial processes. Emissions from the combustion of fuel in industry are reported under Energy. Emissions from the mineral, metal and chemical sectors have been reported in the 2000 GHG Inventory. Waste: emissions within this sector are from waste management including disposal of solid waste on land and wastewater treatment. Agriculture, Forestry and other Land Use (AFOLU): emissions from this sector include anthropogenic emissions from agricultural activities except for fuel combustion (reported under Energy) and sewage emissions (reported under Waste). Activities include enteric fermentation, manure management, agricultural soils, prescribed burning of savannas and field burning of agricultural residues. This sector also includes total emissions from and removals by forest and land use change activities including changes in forest and other woody biomass stocks, forest and grassland conversion, and emissions from and removals by soil.
6.2.2 Regional GHG Inventories
A number of regions around the world have developed GHG Inventories. The Greenhouse Gas Regional Inventory Protocol (GRIP (1)) presents a methodology to allow regions across Europe to develop and prepare emission inventories on a consistent and comparable manner. The methodology is broadly based on the IPCC guidelines and tools have been developed to allow compilers to input activity data and for emissions to be calculated automatically. This methodology incorporates Europe specific emission factors and other inputs and is not appropriate for use in the South African context. The Wellington Region in New Zealand has developed its regional GHG inventory using local data and the IPCC sub sector emission sources and calculation methodologies. A number if areas within the Unites States of America (e.g. San Francisco Bay Area, San Diego, Seattle and District of Columbia) have developed emission inventories with more of a focus on industrial emissions given the availability of data through existing reporting procedures. With the exception of the GRIP project, there is no consistently used methodology for developing an emission inventory on a regional level.
6.3 South Africa’s National GHG Inventory
6.3.1 Existing GHG Inventories
The National Department for Environmental Affairs (DEA) is responsible for the development of South Africa’s National GHG Inventory. South Africa has developed three national
(1) See: http://www.grip.org.uk/inventory.html

Phase 1: Climate Change Scenario
Eastern Cape Climate Change Response Strategy 93
inventories covering the years 1990, 1994 and 2000. The first inventory was published in 1998 using 1990 data and the second was published in 2004 using 1994 data. The 1990 and 1994 inventories were developed using the 1996 IPCC Guidelines for National GHG Inventories (IPCC, 1996) and were summarised in South Africa’s Initial National Communication to the UNFCCC (DEAT, 2000). The first inventory was published in 1998 using 1990 data. It was updated to include 1994 data and the second national inventory was published in 2004. The 1990 and 1994 inventories were developed using the 1996 IPCC Guidelines for National GHG Inventories. South Africa’s third national inventory greenhouse gas inventory has been developed for the year 2000 (2000 GHG Inventory). The 2000 GHG Inventory has been developed using the 2006 IPCC Guidelines. It was published for public comment in 2009 and following independent review is due for publication in 2010. South Africa is one of the first countries to develop a national inventory using the 2006 IPCC Guidelines. Data availability has been a key challenge in developing the 2000 GHG Inventory with most of the data only being available at an aggregated national level rather than point source level. This has made it difficult to disaggregate data (particularly in the energy sector), and in a number of cases no information was available leading to the omission of some sources (e.g. the electronics industry, health sector and some industrial activities). An independent review of the 2000 GHG Inventory was conducted by Environmental Resources Management Southern Africa (Pty) Ltd (ERM) and a series of suggested improvements for future inventories recommended. Key to improving data quality is the suggested development of a national inventory management and data collection framework which requires individual emitting entities above a certain threshold to submit data to government.
6.3.2 Future South African GHG Inventories
DEA have a number of plans in place to improve the completeness and accuracy of the information presented in the inventory and to simplify the data collection process. The first step is to complete the time series of the national inventory so that an annual emissions inventory is available from 2000 to the present. This will initially require a retroactive data collection process and going forward the implementation of a national inventory management and data collection process allowing data to be collected and reviewed and the inventory to be calculated on an annual basis. Following the National Climate Change Summit in March 2009, DEA are developing climate change policies to assist the country with meeting its voluntary commitments to reduce emissions going forward. It is thought that the Green Paper to be published in June 2010 will include an obligation on organisations to report emissions - initially on a voluntary basis with mandatory reporting following for large energy users and heavy industry. As time progresses, the number and type of organisation required by law to report data is likely to expand. DEA are currently developing the Terms of Reference for a web-based inventory management and data collection portal which will hold a wide range of information relating to the emission of greenhouse gases and other pollutants by industry and other organisations in South Africa. This portal will provide those companies and organisations required to report data with an easily accessible platform in which to provide data and will allow DEA to develop national inventories in a simplified manner. Future GHG Inventories will be calculated in accordance with the 2006 IPCC guidelines and/or any future revisions to these. DEA will be issuing the Terms of Reference in spring 2010 with the aim of beginning data collection for the 2001 – 2009 National GHG Inventories in February 2011.

Phase 1: Climate Change Scenario
Eastern Cape Climate Change Response Strategy 94
6.4 Recommended approach to calculating the ECP GHG Inventory
6.4.1 Approach
It is recommended that the Eastern Cape GHG Inventory be developed in close consultation with DEA and that the data collected feed directly into the National GHG Inventory in order to reduce duplicate effort. It is recommended that an annual inventory be developed for the years 2001 – 2008 with an additional year added each year that passes (e.g. add 2009 in 2011, 2010 in 2012 etc). Data collection for the GHG Inventories is a critical challenge and improving the National Inventory will require industry and other organisation to improve their internal monitoring and reporting processes. During development of the 2000 GHG Inventory, a number of stakeholders commented that it would be useful to develop local/regional GHG Inventories in order to allow for more specific actions to be implemented and reductions monitored. Some industry associations voiced significant concern at the increased reporting burden that this could place on their already stretched resources and requested that there be one streamlined reporting procedure. The value of developing Regional Inventories, however, still remains and it is recommended that, in order to overcome the duplicate data requests, the Eastern Cape Department of Economic Development and Environmental Affairs work closely with DEA to facilitate data collection in the province and feed this upwards for inclusion in the National Inventory.
6.4.2 Methodology
It is important that The Eastern Cape GHG Inventory is developed in accordance with the 2006 IPCC Guidelines and is approached in the same manner as South Africa’s National GHG Inventory. In order to ensure consistency, Jongikhaya Witi from DEA’s Atmospheric Quality Information Greenhouse Gas Accounting Directorate should be invited to participate in meetings regarding development of the Eastern Cape Inventory. Jongikhaya has been involved in the development and review of national inventories internationally and is well placed to provide technical advice and guidance during the process. His contact details are: telephone: 012 310 3083; cell: 083 991 9913; email: [email protected]. Error! Reference source not found. lists the greenhouse gases that should be reported in a GHG Inventory. The IPCC guidelines recommend that other air pollutants are reported at the same time to gain a full understanding of the emissions from the activities in question. Table 15 : GHG and air pollution emissions to be reported
Carbon Dioxide - CO2 emissions Carbon Dioxide - CO2 removals Methane - CH4 Nitrous Oxide - N2O Hydrofluorocarbons HFCs Perfluorocarbons - PFCs Sulphur Hexaflouride - SF6 Carbon Monoxide - CO Nitrogen Oxides - NOX Non-methane volatile organic compounds - NMVOCs Sulphur Oxides – SOx
The 2006 IPCC Guidelines divide emission sources and sinks into sectors within similar characteristics. These sectors are aggregated into four broad categories: Energy; Industrial Processes and Product Use (IPPU); Agriculture, Forestry and Other Land Use (AFOLU) and Waste Sectors; with subsectors within each.

Phase 1: Climate Change Scenario
Eastern Cape Climate Change Response Strategy 95
summarises the sectors with emission sources and sinks to be included in GHG Inventories. Given data availability issues, only those sectors in italics and emissions of CO2, CH4, N2O and PFCs from Metal Production were included in the 2000 GHG Inventory. The aim is to develop a more complete and comprehensive inventory in the future which includes all gases in all categories. Emission calculation templates have been developed in conjunction with the 1996 IPCC guidelines to provide a standard methodology for calculating emissions in inventories across the globe. As discussed above, the 2006 IPCC Guidelines have yet to be approved by the UNFCCC and as a result emission calculation templates have yet to be developed specific to these guidelines. During development of the 2000 GHG Inventory for South Africa, the inventory compilers adapted the 1996 IPCC calculation templates to meet the requirements of the 2006 Guidelines. The adapted calculation templates for the IPPU and AFOLU sectors are attached at Appendix 2. These templates provide the framework within which is it recommended that the Eastern Cape GHG Inventory is calculated as they summarise the activity data required and include the equations for conversion of activity data into emissions.

Phase 1: Climate Change Scenario
Eastern Cape Climate Change Response Strategy 96
Table 16: GHG Emission and Sink Categories
Sector Source/Sink
Energy A. Fuel combustion activities
1. Energy industries
a. Main activity electricity and heat production
b. Petroleum refining
c. Manufacture of solid fuels
2. Manufacturing industries and construction
a. Iron and steel
b. Non-ferrous metals
c. Chemicals
d. Pulp, paper and print
e. Food processing, beverages and tobacco
f. Non-metallic minerals
g. Transport equipment
i. Mining (ex. fuels) and quarrying
j. Wood and wood products
k. Construction
l. Textile and leather
m. Non-specified industry
3. Transport
a. Civil aviation
b. Road transportation
c. Railways
d. Water-borne navigation
e. Other transportation
4. Other sectors
a. Commercial / Institutional
b. Residential
c. Agriculture / Forestry / Fishing / Fish farms
5. Non-specified
a. Stationary
b. Mobile
c. Multilateral operations
B. Fugitive emissions from fuels
1. Solid fuels
a. Coal mining and handling
b. Spontaneous combustion and burning coal dumps
2. Oils and natural gas
a. Oil
b. Venting
c. Flaring
d. All other
e. Natural gas
3. Other emissions from energy production

Phase 1: Climate Change Scenario
Eastern Cape Climate Change Response Strategy 97
Sector Source/Sink
Energy (cont)
C. Carbon dioxide transport and storage
1. Transport of CO2
a. Pipelines
b. Ships
c. Other
2. Injections and storage
a. Injection
b. Storage
3. Other Industrial Processes and Product Use (IPPU)
A. Mineral Industry
1. Cement
2. Lime
3. Glass
4. Other Carbonate use
B. Chemical Industry
1. Ammonia
2. Nitric Acid
3. Adipic Acid
4. Caprolactam, Glyoxal and Glyoxylic Acid
5. Ammonia
6. Titanium Dioxide
7. Soda Ash
8. Petrochemical and Carbon Black
9. Fluorochemical production
C. Metal Industry
1. Iron and Steel
2. Ferroalloys
3. Aluminium

Phase 1: Climate Change Scenario
Eastern Cape Climate Change Response Strategy 98
Sector Source/Sink
Industrial Processes and Product Use (IPPU (Cont)
4. Magnesium
5. Lead
6. Zinc
D. Non-Energy Products
1. Lubricant Use
2. Paraffin Wax
E. Electronics Industry
1. IC or semiconductor
2. TFT Flat Panel Display
3. Photovoltaics
4. Heat transfer fluid
F. Fluorinated Substances
1. Aerosols
2. Solvents
3. Other applications
G. Other (please specify)
1. Electrical equipment
2. Other SF6 and PFC's
3. N2O Agriculture, Forestry and Other Land Use (AFOLU)
A. Livestock
1. Enteric fermentation
2. Manure Management
B. Land
1. Forest land
a. Forest land remaining forest land
b. Land converted to forest land
2. Crop land
a. Crop land remaining crop land
b. Land converted to crop land
3. Grassland
a. Grassland remaining grassland
b. Land converted to grassland
4. Wetlands
a. Wetlands remaining wetlands
b. Land converted to wetlands
5. Settlements

Phase 1: Climate Change Scenario
Eastern Cape Climate Change Response Strategy 99
Sector Source/Sink
Agriculture, Forestry and Other Land Use (AFOLU) (Cont)
a. Settlements remaining settlements
b. Land converted to settlements
6. Other land
a. Other land remaining other land
b. Land converted to other land
C. Aggregate sources and non- CO2 source emissions on land
1. Biomass Burning
a. Forest land
b. Crop land
c. Grassland
d. Wetlands
2. Liming
3. Urea Fertiliser
4. Direct N2O Emissions from Managed Soils
5. Indirect N2O Emissions from Managed Soils
6. Indirect N2O Emissions from Manure Management
7. Rice Cultivation Waste A. Solid waste disposal
1. Managed waste disposal sites
2. Unmanaged waste disposal sites
3. Uncategorised waste disposal sites
B. Biological treatment of solid waste
C. Incineration and open burning of waste
1. Waste incineration
2. Open burning of waste
D. Wastewater treatment and discharge
1. Industrial wastewater treatment and discharge
2. Domestic wastewater treatment and discharge
E. Land
6.5 Preliminary GHG Inventory for the Eastern Cape
6.5.1 Introduction
This section reports the results of a preliminary inventory for the Eastern Cape, which is discussed in the context of the National Greenhouse Gas Inventory year 2000 Report for South Africa. It should be emphasised that the development of an inventory at a similar level of rigour and detail as the National Inventory is a vast task requiring a staff complement working over months and years. In contrast the initial inventory for the EC has been undertaken as a task within the limited scope and budget of an overall Eastern Cape Climate Change Response Strategy. As such the results reported here are not authoritative, but rather are given for illustrative purposes.
6.5.2 Detail and Methodology
6.5.2.1 Overall Methodology
The preliminary Eastern Cape GHG inventory was guided by the IPCC 2006 Guidelines for National Greenhouse Gas Inventories. The structure of the inventory was adapted from an

Phase 1: Climate Change Scenario
Eastern Cape Climate Change Response Strategy 100
integrated format developed by Landcare Research in New Zealand for regional reporting, and which represents a consolidation of the IPCC protocol spreadsheets and reporting structure.
6.5.2.2 Emission Factors
Emission factors and fractions were drawn from IPCC 2006 defaults, from the South African Greenhouse Gas Inventory Report for the year 2000, and from other South African Sources.
6.5.2.3 Activity Data
Activity data sources are detailed in each section below.
6.5.2.4 Quality Control and Uncertainty
The confidence in, and appropriateness of, the activity data for the inventory is detailed in each section as a confidence level. Confidence in energy data is high, while confidence in others is low. Cross checks and data quality verification did not form part of the scope of this study.
6.5.3 National Overview
The Greenhouse Gas emissions in South Africa for the year 2000 are given in Figure 25. The energy sector was responsible for 79% of emissions while the Industrial Process and Product Use (IPPU), Agriculture, Forestry and Land use (AFOLU), and Waste sectors where responsible for 14%, 5% and 2% respectively. The dominance of energy sector emissions is linked primarily to the heavy reliance on coal fired power stations for electricity generation in South Africa.
Figure 25: Greenhouse Gas emissions in South Africa for the year 2000 (DEAT 2009).
6.5.4 Overview for the Eastern Cape
In contrast to the South African inventory, the energy sector is responsible for 67% of emissions, while IPPU, AFOLU and Waste are responsible for 1%, 28% and 5% respectively (see Figure 26). However, these figures are deceptive and should be used with caution in that AFOLU is overstated (sources and sinks from forestry and land use have not been included
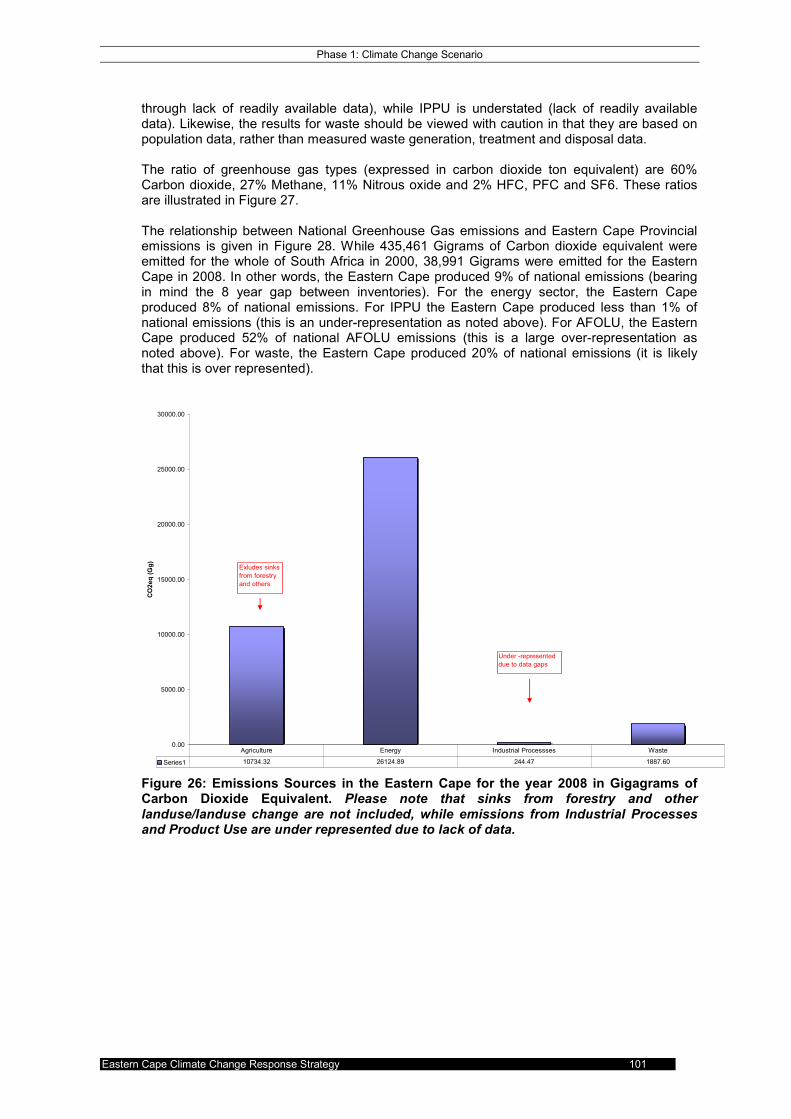
Phase 1: Climate Change Scenario
Eastern Cape Climate Change Response Strategy 101
through lack of readily available data), while IPPU is understated (lack of readily available data). Likewise, the results for waste should be viewed with caution in that they are based on population data, rather than measured waste generation, treatment and disposal data. The ratio of greenhouse gas types (expressed in carbon dioxide ton equivalent) are 60% Carbon dioxide, 27% Methane, 11% Nitrous oxide and 2% HFC, PFC and SF6. These ratios are illustrated in Figure 27. The relationship between National Greenhouse Gas emissions and Eastern Cape Provincial emissions is given in Figure 28. While 435,461 Gigrams of Carbon dioxide equivalent were emitted for the whole of South Africa in 2000, 38,991 Gigrams were emitted for the Eastern Cape in 2008. In other words, the Eastern Cape produced 9% of national emissions (bearing in mind the 8 year gap between inventories). For the energy sector, the Eastern Cape produced 8% of national emissions. For IPPU the Eastern Cape produced less than 1% of national emissions (this is an under-representation as noted above). For AFOLU, the Eastern Cape produced 52% of national AFOLU emissions (this is a large over-representation as noted above). For waste, the Eastern Cape produced 20% of national emissions (it is likely that this is over represented).
0.00
5000.00
10000.00
15000.00
20000.00
25000.00
30000.00
CO2eq (Gg)
Series1 10734.32 26124.89 244.47 1887.60
Agriculture Energy Industrial Processses Waste
Exludes sinks
from forestry
and others
Under -represented
due to data gaps
Figure 26: Emissions Sources in the Eastern Cape for the year 2008 in Gigagrams of Carbon Dioxide Equivalent. Please note that sinks from forestry and other landuse/landuse change are not included, while emissions from Industrial Processes and Product Use are under represented due to lack of data.
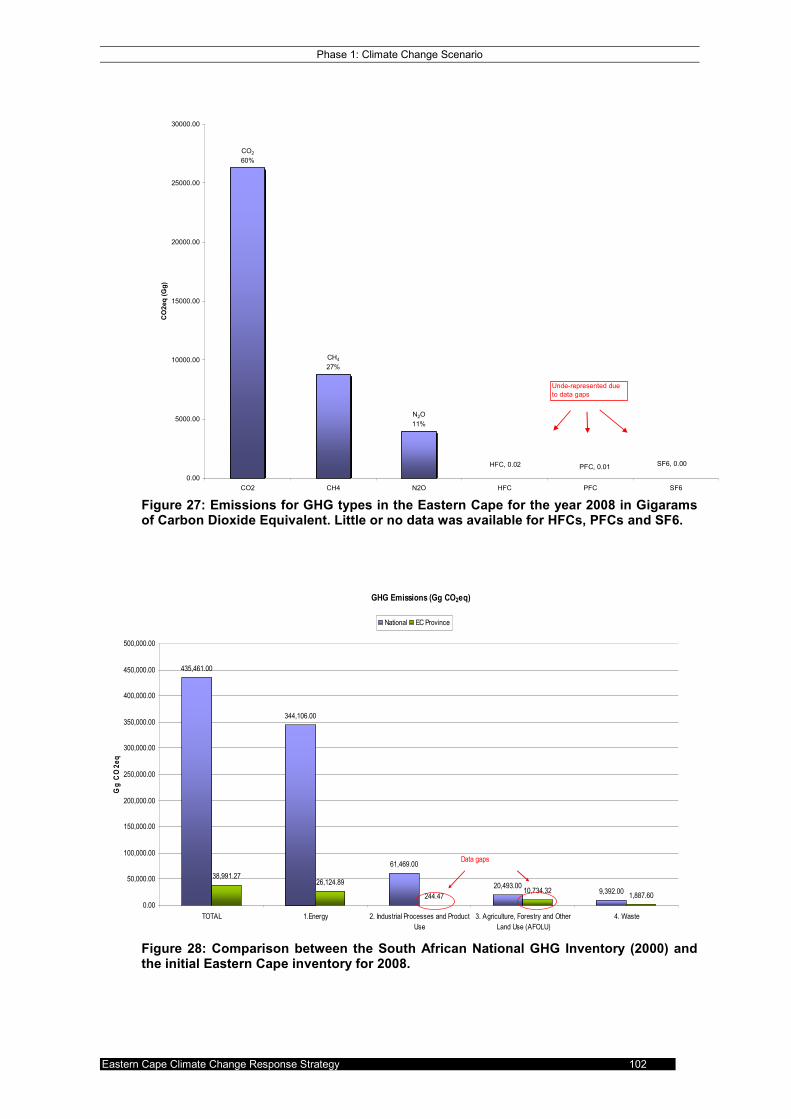
Phase 1: Climate Change Scenario
Eastern Cape Climate Change Response Strategy 102
SF6, 0.00PFC, 0.01HFC, 0.02
N2O
11%
CH4
27%
CO2
60%
0.00
5000.00
10000.00
15000.00
20000.00
25000.00
30000.00
CO2 CH4 N2O HFC PFC SF6
CO2eq (Gg)
Unde-represented due
to data gaps
Figure 27: Emissions for GHG types in the Eastern Cape for the year 2008 in Gigarams of Carbon Dioxide Equivalent. Little or no data was available for HFCs, PFCs and SF6. Figure 28: Comparison between the South African National GHG Inventory (2000) and the initial Eastern Cape inventory for 2008.
GHG Emissions (Gg CO2eq)
435,461.00
344,106.00
61,469.00
20,493.009,392.00
38,991.2726,124.89
244.4710,734.32
1,887.60
0.00
50,000.00
100,000.00
150,000.00
200,000.00
250,000.00
300,000.00
350,000.00
400,000.00
450,000.00
500,000.00
TOTAL 1.Energy 2. Industrial Processes and Product
Use
3. Agriculture, Forestry and Other
Land Use (AFOLU)
4. Waste
Gg C
O2eq
National EC Province
Data gaps

Phase 1: Climate Change Scenario
Eastern Cape Climate Change Response Strategy 103
6.5.5 Energy
The combustion of fossil fuels for energy requirements is among the principal sources of Greenhouse Gas Emissions. Energy sector emissions sources can be classified as:
• Exploitation of primary energy sources, e.g. coal mining;
• Conversion of primary energy sources into more useable energy forms, e.g. refineries and power-plants;
• Use of fuels in stationary applications, e.g. manufacturing industries; and
• Use of fuels in mobile applications, e.g. the transport sector Whereas the South African year 2000 Greenhouse Gas Inventory uses a sector based approach, a reference approach is required for the EC preliminary inventory due to the fact that available activity data for the province has not been disaggregated into sectors. Three major sources of GHG emissions in the Eastern Cape are Petrol and Diesel Combustion, and Electricity Consumption
2. Petrol and Diesel Combustion accounts
respectively for 7082 and 6363 Gg CO2eq annually (1 Gg is equal to 1000 tons). Electricity consumption accounts for 11305 Gg CO2eq annually (see Figure 29).
0.00
2,000.00
4,000.00
6,000.00
8,000.00
10,000.00
12,000.00
CO
2eq (Gg)
Series1 7,081.99 6,363.61 62.22 918.13 39.18 39.18 11,304.79 0.80
Petrol Diesel Aviation Fuel Paraffin Heavy Fuel Oil LPGElectricity
consumptionCoal
2 It should be noted that almost all electricity is imported to the Eastern Cape from other provinces. Technically, GHG emissions from electricity production occur outside of the province. Electricity consumption should be reflected as “energy indirect” emissions in this inventory. However, for the sake of indicating GHG emissions caused by anthropogenic activities in the Eastern Cape, indirect emissions from electricity consumption have been included here.
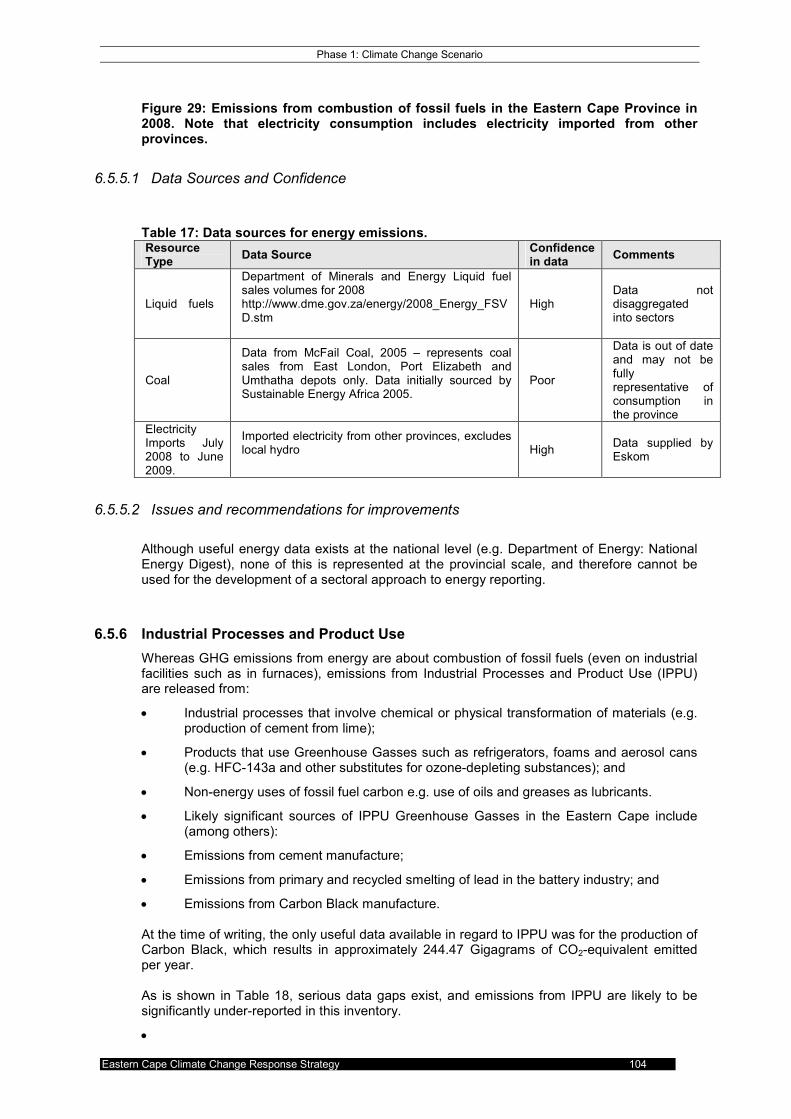
Phase 1: Climate Change Scenario
Eastern Cape Climate Change Response Strategy 104
Figure 29: Emissions from combustion of fossil fuels in the Eastern Cape Province in 2008. Note that electricity consumption includes electricity imported from other provinces.
6.5.5.1 Data Sources and Confidence
Table 17: Data sources for energy emissions. Resource Type
Data Source Confidence in data
Comments
Liquid fuels
Department of Minerals and Energy Liquid fuel sales volumes for 2008 http://www.dme.gov.za/energy/2008_Energy_FSVD.stm
High Data not disaggregated into sectors
Coal
Data from McFail Coal, 2005 – represents coal sales from East London, Port Elizabeth and Umthatha depots only. Data initially sourced by Sustainable Energy Africa 2005.
Poor
Data is out of date and may not be fully representative of consumption in the province
Electricity Imports July 2008 to June 2009.
Imported electricity from other provinces, excludes local hydro
High Data supplied by Eskom
6.5.5.2 Issues and recommendations for improvements
Although useful energy data exists at the national level (e.g. Department of Energy: National Energy Digest), none of this is represented at the provincial scale, and therefore cannot be used for the development of a sectoral approach to energy reporting.
6.5.6 Industrial Processes and Product Use
Whereas GHG emissions from energy are about combustion of fossil fuels (even on industrial facilities such as in furnaces), emissions from Industrial Processes and Product Use (IPPU) are released from:
• Industrial processes that involve chemical or physical transformation of materials (e.g. production of cement from lime);
• Products that use Greenhouse Gasses such as refrigerators, foams and aerosol cans (e.g. HFC-143a and other substitutes for ozone-depleting substances); and
• Non-energy uses of fossil fuel carbon e.g. use of oils and greases as lubricants.
• Likely significant sources of IPPU Greenhouse Gasses in the Eastern Cape include (among others):
• Emissions from cement manufacture;
• Emissions from primary and recycled smelting of lead in the battery industry; and
• Emissions from Carbon Black manufacture. At the time of writing, the only useful data available in regard to IPPU was for the production of Carbon Black, which results in approximately 244.47 Gigagrams of CO2-equivalent emitted per year. As is shown in Table 18, serious data gaps exist, and emissions from IPPU are likely to be significantly under-reported in this inventory.
•
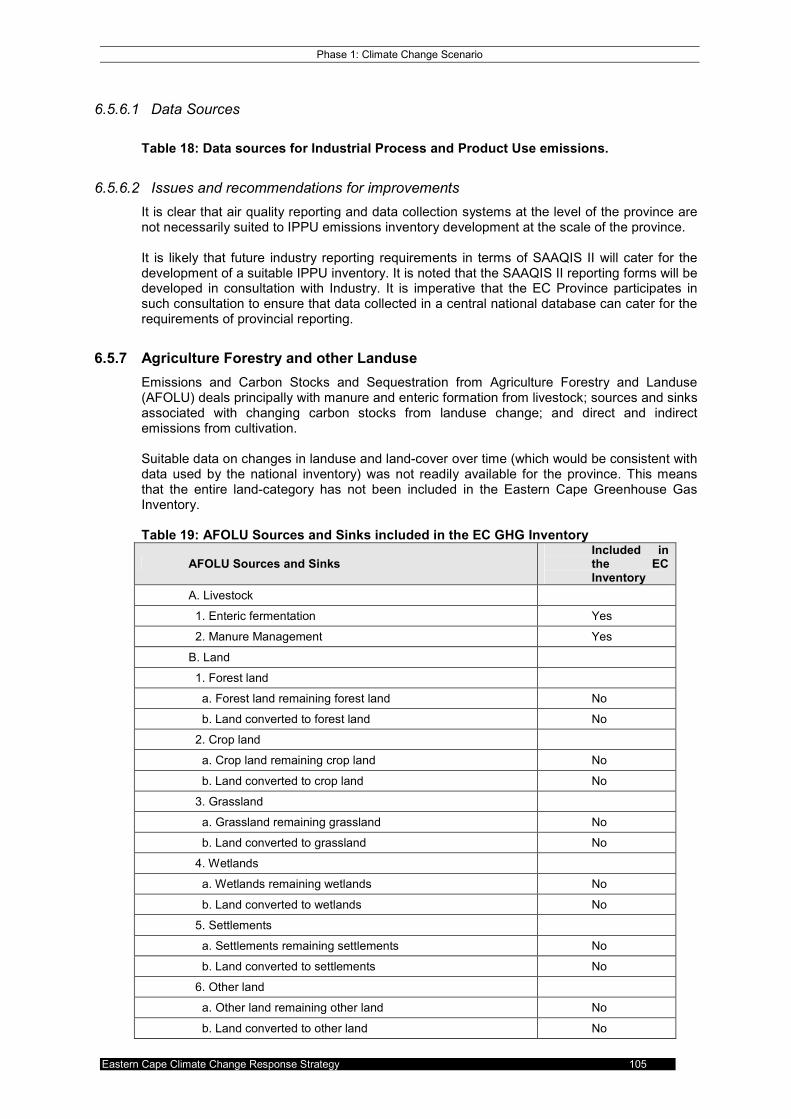
Phase 1: Climate Change Scenario
Eastern Cape Climate Change Response Strategy 105
6.5.6.1 Data Sources
Table 18: Data sources for Industrial Process and Product Use emissions.
6.5.6.2 Issues and recommendations for improvements
It is clear that air quality reporting and data collection systems at the level of the province are not necessarily suited to IPPU emissions inventory development at the scale of the province. It is likely that future industry reporting requirements in terms of SAAQIS II will cater for the development of a suitable IPPU inventory. It is noted that the SAAQIS II reporting forms will be developed in consultation with Industry. It is imperative that the EC Province participates in such consultation to ensure that data collected in a central national database can cater for the requirements of provincial reporting.
6.5.7 Agriculture Forestry and other Landuse
Emissions and Carbon Stocks and Sequestration from Agriculture Forestry and Landuse (AFOLU) deals principally with manure and enteric formation from livestock; sources and sinks associated with changing carbon stocks from landuse change; and direct and indirect emissions from cultivation. Suitable data on changes in landuse and land-cover over time (which would be consistent with data used by the national inventory) was not readily available for the province. This means that the entire land-category has not been included in the Eastern Cape Greenhouse Gas Inventory. Table 19: AFOLU Sources and Sinks included in the EC GHG Inventory
AFOLU Sources and Sinks Included in the EC Inventory
A. Livestock
1. Enteric fermentation Yes
2. Manure Management Yes
B. Land
1. Forest land
a. Forest land remaining forest land No
b. Land converted to forest land No
2. Crop land
a. Crop land remaining crop land No
b. Land converted to crop land No
3. Grassland
a. Grassland remaining grassland No
b. Land converted to grassland No
4. Wetlands
a. Wetlands remaining wetlands No
b. Land converted to wetlands No
5. Settlements
a. Settlements remaining settlements No
b. Land converted to settlements No
6. Other land
a. Other land remaining other land No
b. Land converted to other land No

Phase 1: Climate Change Scenario
Eastern Cape Climate Change Response Strategy 106
C. Aggregate sources and non- CO2 source emissions on land
1. Biomass Burning No
a. Forest land No
b. Crop land No
c. Grassland No
d. Wetlands No
2. Liming No
3. Urea Fertiliser No
4. Direct N2O Emissions from Managed Soils Yes
5. Indirect N2O Emissions from Managed Soils Yes
6. Indirect N2O Emissions from Manure Management Yes
7. Rice Cultivation No
Table 20 gives an indication of emissions from the assessed sources and sinks for Agriculture. Enteric fermentation and Agricultural Soils Management accounted for the majority of emissions. Total emissions are 10,734 Gigagrams of CO2-equivalent emitted per year. It is important to note that the national GHG inventory for the year 2000 registers carbon sinks roughly equal to sources from enteric fermentation and manure management. It is likely that the inclusion of sinks from forestry, cropland and grassland would result in a total for AFOLU which would be well below 10,734 Gigagrams of CO2-equivalent emitted per year. Table 20: Emissions from Agriculture (excludes forestry and landuse change)
CO2 CH4 N2O HFC PFC SF6 Total Emission sources and sinks
[Gg CO2 equivalent per year]
Enteric fermentation 0 6,228.95 0 0 0 0 6,228.95
Manure Management 0 723.08 18.27 0 0 0 741.35 Agricultural Soils (Direct N2O emissions) 0 0 64.25 0 0 0 64.25 Agricultural Soils (Grazing animals) 0 0 2,668.25 0 0 0 2,668.25 Agricultural leaching (Indirect emissions) 0 0 480.98 0 0 0 480.98 Agricultural atmospheric deposition (Indirect emissions) 0 0 549.63 0 0 0 549.63 Field burning of agri. Residues 0 0.67 0.24 0 0 0 0.91
6.5.7.1 Data Sources
Table 21: Data sources for Agricultural Emissions.
Source Type Data Source Confidence in data
Comments
Livestock
Department of Agriculture livestock statistics 2004. http://www.daff.gov.za/
Medium
Inclusion of livestock from former Transkei and Ciskei not indicated.
Crops
National Agricultural Statistics Abstract http://www.nda.agric.za/docs/Abstract_2009.pdf
Medium
Fertilizer
Maize Production Guidelines, National Department of Agriculturewww.nda.agric.za/publications
Poor Not based on direct or measured data

Phase 1: Climate Change Scenario
Eastern Cape Climate Change Response Strategy 107
6.5.7.2 Issues and recommendations for improvements
A GHG inventory for the Eastern Cape can only be meaningfully compared with the National GHG Inventory if the same data and emissions factors are used. If an EC GHG inventory will be developed in more detail in future, it is important that this is done so in consultation with, or even as an element of, the national GHG inventory process.
6.5.8 Waste
The IPCC Guidelines list the main sources of waste emissions as:
• Solid waste disposal (Solid waste disposal sites generate methane from the anaerobic decay of organic waste);
• Biological treatment of solid waste;
• Incineration and open burning of waste; and
• Waste water treatment and discharge (generation of methane from certain anaerobic processes, together with the indirect release of nitrous oxide).
The GHG inventory for the Eastern Cape excludes biological treatment of solid waste and incineration and open burning of waste. Emissions from waste result in 1887.60 Gigagrams of CO2-equivalent per year. Figure 30 gives a breakdown of the sources of GHG emissions from waste.
0.00
200.00
400.00
600.00
800.00
1000.00
1200.00
1400.00
1600.00
1800.00
CO2eq (Gg)
Series1 1627.15 109.40 151.05
Solid Waste Dis. Liquid Waste Treatment Indirect N2O from sewage
Figure 30: Emissions from Waste.
6.5.8.1 Data Sources
Table 22: Data sources for emissions from waste.
Source Type Data Source Confidence in data
Comments
Solid Waste
South African Waste Information Centre, http://www.sawic.org.za Reported waste for year 2008 – Nelson Mandela Metro Only Other data extrapolated from Stats SA Household Data – Community Survey 2007.
Low
No readily available current and reliable measured provincial solid waste data are available.

Phase 1: Climate Change Scenario
Eastern Cape Climate Change Response Strategy 108
Waste Water Extrapolated from Community Survey 2007, Statistics South Africa
Medium
No readily available current and reliable measured provincial waste-water data are available
6.5.8.2 Issues and Recommendations for improvements
The measurement of total waste generation and disposal, let alone the measurement of particular waste streams, is chronically lacking in the Eastern Cape. Until sound waste measurement, data collection, verification and reporting systems are in place, the calculation will need to rely on population data. For purposes of comparison, the activity data, emission factors and assumptions as for the National Inventory will be required. This will require close interaction with between the province and national DEA.
6.5.9 Interaction with SAAQIS
The South African Green Paper on Climate Change Response (2010) notes the following in regard to National Greenhouse Gas reporting: “In order to monitor, verify and report mitigation progress and the efficacy of South Africa’s mitigation interventions, South Africa will –
• Develop, test and commission a web-based greenhouse gas emission reporting system as part of the National Atmospheric Emission Inventory component of the South African Air Quality Information System by 2012.
• Require the mandatory submission of greenhouse gas emission data to the National Atmospheric Emission Inventory by all significant emitters and compilers of greenhouse gas emission related data and/or proxy data by 2013.
• Publish an annual report comparing actual greenhouse gas emission data against the emission trajectory described above by 2014.
• Keep a register of climate actions that result in the mitigation of greenhouse gases and also use this to measure progress against the overall GHG emission trajectory and national reduction targets.”
Based on the intentions of the Green Paper, together with communications with Jongikhaya Witi, it would appear GHG emissions activity data is intended to be collated and synthesised at the national level. It is however essential that the province is consulted in the design of the reporting and data synthesis format of the SAAQIS Greenhouse Gas inventory so that:
• The province can play a role in supporting, monitoring and verifying GHG by provincial emitters;
• The national report can be disaggregated to show provincial emissions; and/or
• Relevant provincial activity data can be extracted from the central information system for purposes of provincial inventory reporting.

Phase 1: Climate Change Scenario
Eastern Cape Climate Change Response Strategy 109
7 REFERENCES
Australian Greenhouse Office, 2006: Climate Change Impacts & Risk Management: A Guide for
Business and Government. Department of Environment and Heritage. Australian Government. Boko, M., I. Niang, A. Nyong, C. Vogel, A. Githeko, M. Medany, B. Osman-Elasha, R. Tabo and P.
Yanda, 2007: Africa. Climate Change 2007: Impacts, Adaptation and Vulnerability. Contribution of Working Group II to the Fourth Assessment Report of the Intergovernmental Panel on Climate Change, M.L. Parry, O.F. Canziani, J.P. Palutikof, P.J. van der Linden and C.E. Hanson, Eds., Cambridge University Press, Cambridge UK, 433-467.
Christensen, J.H., B. Hewitson, A. Busuioc, A. Chen, X. Gao, I. Held, R. Jones, R.K. Kolli, W.-T.
Kwon, R. Laprise, V. Magaña Rueda, L. Mearns, C.G. Menéndez, J. Räisänen, A. Rinke, A. Sarr and P. Whetton, 2007: Regional Climate Projections. In: Climate Change 2007: The Physical Science Basis. Contribution of Working Group I to the Fourth Assessment Report of the Intergovernmental Panel on Climate Change [Solomon, S., D. Qin, M. Manning, Z. Chen, M. Marquis, K.B. Averyt, M. Tignor and H.L. Miller (eds.)]. Cambridge University Press, Cambridge, United Kingdom and New York, NY, USA.
Cromwell, J.E., Smith J.B., and Raucher, R. 2007. Implications of Climate Change for Urban Water
Utilities. Association of Metropolitan Water Agencies. Department of Economic Development and Environmental Affairs. 2010. The Eastern Cape Economic Outlook.
Department of Water Affairs, 2010: Water Services National Information System [Online] Available:
http://www.dwaf.gov.za/dir_ws/wsnis/ . Accessed: March 2010. Easterling, W.E., P.K. Aggarwal, P. Batima, K.M. Brander, L. Erda, S.M. Howden, A. Kirilenko, J.
Morton, J.-F. Soussana, J. Schmidhuber and F.N. Tubiello, 2007: Food, fibre and forest products. Climate Change 2007: Impacts, Adaptation and Vulnerability. Contribution of Working Group II to the Fourth Assessment Report of the Intergovernmental Panel on Climate Change, M.L. Parry, O.F. Canziani, J.P. Palutikof, P.J. van der Linden and C.E. Hanson, Eds., Cambridge University Press, Cambridge, UK, 273-313.
Eastern Cape Socio-economic Consultative Council. 2007. Eastern Cape Forestry Sector Profile,
Forestry and Timber Processing Summit, Mthatha. G Midgley, R Chapman, P Mukheibir, M Tadross, B Hewitson, S Wand, R Schulze, T Lumsden, M
Horan, M Warburton, B Kgope, B Mantlana, A Knowles, A Abayomi, G Ziervogel, R Cullis and A Theron, 2007. Impacts, Vulnerability and Adaptation in Key South African Sectors: An Input into the Long-Term Mitigation Scenarios Process. University of Cape Town. 20pp.
IPCC, 2007: Climate Change 2007: Synthesis Report. Contribution of Working Groups I, II and III to
the Fourth Assessment Report of the Intergovernmental Panel on Climate Change [Core Writing Team, Pachauri, R.K and Reisinger, A. eds.)]. IPCC, Geneva, Switzerland, 104 pp.
Johnston, P., Coop, L., and Lennard, C., 2011. Climate Change Projections and Impacts for the
Eastern Cape region of South Africa. Climate Systems Analysis Group. Cape Town. Report commissioned by Eastern Cape Department of Economic Development and Environmental Affairs.
McMullen, C., and Jabbour , J., 2009: Climate Change Science Compendium. United Nations
Environment Programme. 67pp. Midgley, G.F. , Chapman, R.A. , Hewitson, B. , Johnston, P. , de Wit, M. , Ziervogel, G. , Mukheibir, P.
, van Niekerk, L. , Tadross, M. , van Wilgen, B.W. , Kgope, B. , Morant, P.D. , Theron, A. , Scholes, R.J. , Forsyth, G.G. (2005) A Status Quo, Vulnerability and Adaptation Assessment of the Physical and Socio-economic Effects of Climate Change in the Western Cape. Report to the Western Cape Government, Cape Town, South Africa. CSIR Report No. ENV-S-C 2005-073, Stellenbosch.

Phase 1: Climate Change Scenario
Eastern Cape Climate Change Response Strategy 110
Naidu, S, Hounsome R and Iyer, K., (2006), Climatic Future for Durban, prepared by CSIR NRE, edited by D Roberts, A Mather and M Maganlal, April.
Provide (2009). A profile of the Eastern Cape Province: Demographics, Poverty, Inequality and
Unemployment. Background Paper 2009:1(2). Department of Agriculture. R.E.H. Sims, R.N. Schock, A. Adegbululgbe, J. Fenhann, I. Konstantinaviciute, W. Moomaw, H.B.
Nimir, B. Schlamadinger, J. Torres-Martínez, C. Turner, Y. Uchiyama, S.J.V. Vuori, N. Wamukonya, X. Zhang, 2007: Energy supply. In Climate Change 2007: Mitigation. Contribution of Working Group III to the Fourth Assessment Report of the Intergovernmental Panel on Climate Change [B. Metz, O.R. Davidson, P.R. Bosch, R. Dave, L.A. Meyer (eds)], Cambridge University Press, Cambridge, United Kingdom and New York, NY, USA.
R.E.H. Sims, R.N. Schock, A. Adegbululgbe, J. Fenhann, I. Konstantinaviciute, W. Moomaw, H.B.
Nimir, B. Schlamadinger, J. Torres-Martínez, C. Turner, Y. Uchiyama, S.J.V. Vuori, N. Wamukonya, X. Zhang, 2007: Energy supply. In Climate Change 2007: Mitigation. Contribution of Working Group III to the Fourth Assessment Report of the Intergovernmental Panel on Climate Change [B. Metz, O.R. Davidson, P.R. Bosch, R. Dave, L.A. Meyer (eds)], Cambridge University Press, Cambridge, United Kingdom and New York, NY, USA.
Rudman, P.J. 2007. The Effects of Global Warming on Maize Production: A Case Study Based on
Climatic Data for Vereeniging, Gauteng, South Africa. Unpublished Masters Dissertation. University of Johannesburg.
Schulze, R.E. (ed), 2005. Climate Change and Water Resources in Southern Africa: Studies on
Scenarios, Impacts, Vulnerabilities and Adaptation. Water Research Commission Report 1430./1/05.
Schulze, BC Hewitson, KR Barichievy, MA Tadross, RP Kunz, TG Lumsden, DJM Dlamini, MJC Horan
& DM Knoesen, In Press: Regional aspects of climate change and their secondary impacts on water resources. WRC Report No. 1562/1/13. November 2009
Wilbanks, T.J., P. Romero Lankao, M. Bao, F. Berkhout, S. Cairncross, J.-P. Ceron, M. Kapshe, R.
Muir-Wood and R. Zapata-Marti, 2007: Industry, settlement and society. Climate Change 2007: Impacts, Adaptation and Vulnerability. Contribution of Working Group II to the Fourth Assessment Report of the Intergovernmental Panel on Climate Change, M.L. Parry, O.F. Canziani, J.P. Palutikof, P.J. van der Linden and C.E. Hanson, Eds., Cambridge University Press, Cambridge, UK, 357-390.
.

Phase 1: Climate Change Scenario
Eastern Cape Climate Change Response Strategy 111
Appendix A: Legal and Policy Framework Assessment.

Phase 1: Climate Change Scenario
Eastern Cape Climate Change Response Strategy 112
Appendix B: Climate Change Projections and Impacts for the Eastern Cape Region of South Africa.

PHASE II: PROVINCIAL NEEDS AND TECHNOLOGY ASSESSMENT

Phase 2: Technology Assessment
Eastern Cape Climate Change Strategy ii
CONTENTS
1 PROVINCIAL NEEDS AND TECHNOLOGY ASSESSMENT 6
1.1 Technical options for climate change mitigation 6 1.1.1 Introduction and background 6 1.1.2 Technology options 8
1.1.2.1 The context of technology options in the energy sector 8 1.1.2.2 Energy efficiency 10 1.1.2.3 Solar energy technologies 11 1.1.2.4 Wind energy technologies 14 1.1.2.5 Hydro energy technologies 15 1.1.2.6 Biomass energy technologies 15 1.1.2.7 Nuclear energy 16 1.1.2.8 Carbon capture and storage 17 1.1.2.9 Fuel cells 17 1.1.2.10 Geothermal energy 17 1.1.2.11 Ocean energy 18 1.1.2.12 Organic Waste and Energy 18
1.1.3 Technology options for adaptation 21 1.1.4 Job creation opportunities associated with mitigation technologies 26 1.1.5 Policies and measures 28
1.1.5.1 Market creation and development 28 1.1.5.2 RD&D efforts 28 1.1.5.3 Investments in new technologies 29 1.1.5.4 Tax credits 29 1.1.5.5 Standard setting 29 1.1.5.6 Technology development and transfer 29
1.1.6 Regulatory environment 29 1.1.7 Establishment of a conducive/enabling context for technical options 30 1.1.8 Non-technical policies can significantly contribute to mitigation 31
2 REFERENCES 32

Phase 2: Technology Assessment
Eastern Cape Climate Change Strategy iii
LIST OF FIGURES
Figure 1: Strategic options for climate change mitigation (source: See UNEP/GRID Arendal Maps and Graphics Library, Strategic options for climate change mitigation, http://maps.grida.no/go/graphic/strategic-options-for-climate-change-mitigation) .................................. 6 Figure 2: World abatement of energy-related CO2 emissions in the 450 ppm scenario (Source: World Energy Outlook 2009, IEA) ...................................................................................................................... 7 Figure 3: Centralised, distributed and on-site energy service supply chains – excluding transport........ 9 Figure 4: Example of a Solar Water Heater........................................................................................... 12 Figure 5: Example of a solar photovoltaic array. ................................................................................... 12 Figure 6: Example of a concentrating solar power plant. ...................................................................... 13 Figure 7: Annual solar radiation levels in the EC Province. Source: AGAMA Energy 2009. ................ 13 Figure 8: Example of a wind farm. ......................................................................................................... 14 Figure 9: Distribution of annual average wind speed. Source: AGAMA Energy 2009. ......................... 14 Figure 10: Overview of the processes whereby biomass is transformed to energy Source: Stucley et al............................................................................................................................................................... 15 Figure 11: An experimental biomass gasification and electricity generation unit at a Sawmill close to the town of Alice in the Eastern Cape.................................................................................................... 16 Figure 12: Potential biological productivity in the Eastern Cape. Source: AGAMA Energy 2009. ........ 16 Figure 13: Algal bioreactors which can be used for the extraction of CO2 from power plant or industrial flue gases. Image: www.evworld.com ................................................................................................... 17 Figure 14: A counter-rotational ocean current turbine system as proposed by Cyclocean. Image: Paul Greyshock.............................................................................................................................................. 18 Figure 15: A biomass/organic waste gasification prototype developed in South Africa. ....................... 19 Figure 16: La-Mercy Landfill Gas Electricity Generation Unit. Photo: Engineering News, South Africa................................................................................................................................................................ 20 Figure 17: Piggery wastewater biodigestion and electricity generation facility, Thailand...................... 20 Figure 18: Gross direct jobs for new generation capacity of various energy types (Source: AGAMA Energy 2003) ......................................................................................................................................... 27 Figure 19: 30 year projection of jobs created in the RE sector for RE supply to the EC. Source: AGAMA Energy 2009............................................................................................................................. 28

Phase 2: Technology Assessment
Eastern Cape Climate Change Strategy iv
LIST OF TABLES
Table 1: Summary of installed and technical potential hydropower developments in the Eastern Cape Province (CaBEERE, 2002)................................................................................................................... 15 Table 2: High priority technologies opportunities for mitigation of GHG emissions in the Eastern Cape............................................................................................................................................................... 22 Table 3 : Prioritized technologies for mitigation in the Eastern Cape.................................................... 26 Table 4: Estimated World-wide Employment in the Renewable Energy Sector in 2006. Source: UNEP 2008. ...................................................................................................................................................... 27

Phase 2: Technology Assessment
Eastern Cape Climate Change Strategy v
ACRONYMS AND ABBREVIATIONS
CCS Carbon Capture and Storage CSP Concentrating Solar Power DEDEA Department of Economic Development and Environmental Affairs ELIDZ East London Industrial Development Zone GHG Greenhouse Gas IPCC Intergovernmental Panel on Climate Change IPP Independent Power Producer MW Megawatt NERSA National Energy Regulator of South Africa OTEC Ocean Thermal Energy Conversion PBMR Pebble Bed Modular Reactor PGDP Provincial Growth and Development Plan RD&D Research, Development and Demonstration RECs Renewable Energy Certificates REFiT Renewable Energy Feed in Tariff ROI Return on Investment Solar PV Solar Photovoltaic SWH Solar Water Heater UNFCCC United Nations Framework Convention on Climate Change

Phase 2: Technology Assessment
Eastern Cape Climate Change Strategy 6
1 PROVINCIAL NEEDS AND TECHNOLOGY ASSESSMENT
This section addresses the challenges and opportunities for technologies to mitigate climate change in the Eastern Cape Province. The immediate challenges in the province are to balance the high level objectives of providing:
• economic development and poverty alleviation, and • energy security and local environmental protection
Clearly, this is a dynamic situation and the suggested approach is to identify the key principles at stake and then continuously update the strategy on the basis of technological innovation.
1.1 Technical options for climate change mitigation
1.1.1 Introduction and background
The opportunities for mitigation of climate change impacts by means of technical interventions or programmes are generally well understood and are described in the international literature (IPCC, 2007). Furthermore, these technical responses can be prioritised among the non-technical mitigation opportunities in terms of cost-efficiency as illustrated in Figure 1 in the form of marginal abatement cost (MAC) curves.
Figure 1: Strategic options for climate change mitigation (source: See UNEP/GRID Arendal Maps and Graphics Library, Strategic options for climate change mitigation, http://maps.grida.no/go/graphic/strategic-options-for-climate-change-mitigation)

Phase 2: Technology Assessment
Eastern Cape Climate Change Strategy 7
A key observation from the analysis of the strategic options above is that, apart from some contributions from forestation, livestock and soils, the predominant opportunities for mitigation are in the energy sector. It is clear that the highest priority opportunities are in terms of energy efficiency – both on the demand and the supply side. These are either no-cost or relatively low-cost interventions which realise savings in resource consumption, and also hence costs, and which have attractive paybacks or returns on investment. This observation is confirmed by the findings of the IEA’s World Energy Outlook which highlights the opportunity for energy efficiency to achieve two-thirds of the abatement in 2020. Increased use of renewable energy would
contribute approximately a fifth. These opportunities are illustrated in Figure 2. Figure 2: World abatement of energy-related CO2 emissions in the 450 ppm scenario (Source: World Energy Outlook 2009, IEA) The importance of clean energy, or green, technology – from wind turbines to electric cars to zero-carbon buildings – is enormous (Tomlinson, 2009). Demonstrating its strength, the clean energy sector declined only 6.6 percent in 2009 despite the worst financial downturn in over half a century and Clean energy investments are forecast to grow by 25 percent to $200 billion in 2010 (PEW, 2010). The opportunities in the energy sector are further understood in terms of different levels of response for economies at different levels of income and development. These are summarised in the high-level recommendations of the recent UN Report on Energy for a Sustainable Future (UN, 2010). The Eastern Cape Province exhibits elements of all three of these categorisations and the responses are highly appropriate where applicable in the Province. “Low-income countries need to expand access to modern energy services substantially in order to meet the needs of the several billion people who experience severe energy poverty in terms of inadequate and unreliable access to energy services and reliance on traditional biomass. They need to do so in a way that is economically viable, sustainable, affordable and efficient, and that releases the least amount of GHGs. Middle-income countries need to tackle energy system development in a way that enables them progressively to decouple growth from energy consumption through improved energy efficiency and reduce energy-related GHG emissions through gradually shifting toward the deployment of low-GHG emission technologies. High-income countries face unique challenges. As the large infrastructure investments made in the 1960s and 1970s begin to reach the end of their economic lives, they present opportunities to further decarbonize their energy sectors through new investments in lower-carbon generation capacity. In addition, they will need to reach a new level of performance in terms of energy use. (UN, 2010)”

Phase 2: Technology Assessment
Eastern Cape Climate Change Strategy 8
The economic sectors which are exposed to the biggest risks and opportunities as a consequence of Climate Change in South Africa are identified by Camco and TIPS (2010). These include: • Agriculture, Forestry and Fishing • Mining and Quarrying • Manufacturing • Utilities • Construction • Trade, Catering and Accommodation Services – including retailing industry and
tourism industry • Transport, Storage and Communication including communications industry and
aviation industry and public transport • Financial, Insurance, Real Estate and Business Services With the exception of mining perhaps, the Eastern Cape economy is exposed to risks in all these sectors. This section of the report describes the range of technical options which are available in the Eastern Cape. The International Energy Agency (IEA) has identified the following technologies which are categorised into supply-side and demand-side opportunities (IEA, 2008): Supply Side Demand Side
CCS fossil-fuel power generation Energy efficiency in buildings and appliances Nuclear power plants Heat pumps Onshore and offshore wind Solar space and water heating Biomass IGCC & co-combustion Energy efficiency in transport Photovoltaic systems Electric and plug-in vehicles Concentrating solar power H2 fuel cell vehicles Coal: integrated-gasification combined cycle CCS industry, H2 and fuel transformation Coal: ultra-supercritical Industrial motor systems 2nd generation biofuels
The specific opportunities for technical responses in the Eastern Cape are more specific and particular to the social, economic and environmental context in the province over the short- to medium-term. The most important and promising technologies are described and then the appropriateness of different technology opportunities for conditions in the Eastern Cape are assessed in terms of: • Maturity of the technology. • Opportunities for cooperation with other organizations • Options for promotion within ECP Policies and Sector Plans. The appropriateness of each technology is summarised in Table 2 after the brief technology descriptions below. Excellent resources on the detailed evolution and technology roadmaps for individual technology opportunities are available via the Implementing Agreements of the IEA, (http://www.iea.org/techno/ia.asp), and many other online resources.
1.1.2 Technology options
The characteristics and mitigation potential of different technologies varies and is changing over time with technical innovation and improved use of technologies. Significant efforts have been undertaken internationally and within economic regions and countries to discern the most appropriate roles for different technology options. A pre-eminent series of publications is the Energy Technology Perspectives of the IEA (IEA, 2008). The technology options are summarised in Table 2
1.1.2.1 The context of technology options in the energy sector
The diagram below illustrates the overall energy system in the country as a whole, and the Eastern Cape too, with three characteristic modes of energy service provision, namely:

Phase 2: Technology Assessment
Eastern Cape Climate Change Strategy 9
i) on-site direct energy services provided from energy conversion devices located at the point of demand;
ii) a distributed energy conversion / generation which provides an energy carrier which can be transmitted and/or distributed to appliances for conversion into the desired energy services and,
iii) A centralised energy conversion / generation mode of producing the energy carriers for transmission / distribution through national transmission and distribution infrastructure.
The diagram shows the supply chains for energy services and illustrates the steps in these supply chains where interventions can be considered to mitigate GHG emissions.
Figure 3: Centralised, distributed and on-site energy service supply chains – excluding transport In the case of the Eastern Cape the bulk of the energy services supplied to customers – apart from cooking, water heating and space heating derived from traditional fuelwood – are derived from energy carriers which are effectively imported into the province. It is clear that the opportunities for mitigation of emissions in the energy sector for the Eastern Cape will initially focus on energy efficiency in the energy service supply chains and then addressing the opportunities for i) direct conversion of renewable energy, ii) distributed generation based on renewable energy and finally, iii) consideration of centralised generation options using renewable energy. The initial emphasis on energy efficiency is consistent with the international experience and guidance noted above. Furthermore, the role of technologies (including energy efficiency and renewable energy technologies) can be understood in terms of the maturity of i) the individual technologies and ii) the markets or market applications of the technologies. Most of the technologies described below are technically mature, namely, the technology is stable and with relatively little opportunity for significant innovations to reduce costs. However, despite the maturity of the
On-site direct conversion
• Solar water heaters
• Thermally efficient buildings
• Biogas disgesters
• others
Energy service needs
• Shaft power
• Heating
• Refrigeration
• Cooking
• Pumped water
• others
Primary energy resources
• Coal
• Nuclear
• Solar
• Wind
• Biomass
• others
Energy conversion / generation / refineries
• Eskom generation
• Municipal/RED generation
• IPPs
• Oil refineries
• others
Distributed conversion / generation
• OCGTs / CCGTs
• Gensets
• Mini-hydro
• Wind
• Solar PV
• others
Energy carriers
• Electricity
• Liquid fuels
• Gas
• Woodfuel
• Candles
• others
Appliances / conversion
• Electric motors
• Air-conditioners
• Stoves/cookers
• Geysers
• Lamps
• others
Transmission and distribution

Phase 2: Technology Assessment
Eastern Cape Climate Change Strategy 10
technologies (such as SWH, photovoltaics and wind energy systems) there is limited experience in South Africa and the EC Province with the market applications for these technologies. Scaling up of the markets provides experience which can significantly reduce the costs of energy services derived from renewable energy through scale and efficiency gains.
1.1.2.2 Energy efficiency
As indicated by the IPCC and IEA, energy efficiency is strategically the first priority for mitigation of GHG emissions in the energy sector. Energy efficiency for energy customers Under the prevailing mode of utility or energy commodity supply, energy efficiency on the customers’ side of the meter is dealt with under the concept of “demand side management” (DSM). This approach relies on investments by customers in i) changing patterns of use/consumption and/or ii) more energy efficient machinery or appliances. Changing patterns of use are often achieved at no cost or minimal cost and are clearly the first priority. Typical energy efficient appliance or equipment interventions would include: • Heating and cooling systems - more efficient air-conditioners for more efficient space
heating and cooling • Heat pumps - to substitute immersion water heaters • Appliances • Lighting – switch to better lighting design and technology such as LEDs, CFLs and
efficient area lighting systems Energy efficient appliances and equipment are continuously improving through R&D and innovation which is driven by a combination of policy, regulations and market forces. Energy efficiency for energy generators / distributors Energy efficiency in the electricity supply industry (ESI) is implemented as supply side interventions. These would include all the opportunities in the energy service supply chains on the utility side of the meter such as: smartgrids, more efficient transformers, switchgear, transmission and distribution cabling and more efficient generation. The Eastern Cape does not yet have many energy generators (all the new capacity should be based on low-carbon technologies – see below) and the bulk of the opportunities will be implemented by the licensed electricity distributors in the Province if they are appropriately incentivised. Energy efficiency in the transport sector The technical opportunities in the transport sector are available at four levels, namely i) improved transport planning and city design; ii) improved public transport, for example the Bus Rapid Transit systems introduced in
Johannesburg and Cape Town; iii) higher utilisation of non-motorised transport, for example rail (with the Gautrain
representing an important advance in South Africa); and iv) more efficient personal cars (including internal combustion engines; hybrid vehicles
and electric vehicles). Examples of advances in this area include the planned Joule Electric Car (see text box below).

Phase 2: Technology Assessment
Eastern Cape Climate Change Strategy 11
Energy efficiency in the construction and building sector Energy for buildings is a significant source of GHG emissions. The operation of non-residential and residential building sectors account for around 23% of total emissions for South Africa (UNEP, 2009). In addition, it is estimated that the manufacture of building materials accounts for around 5% of total emissions. The adoption of green building principles will rapidly drive increased energy efficiency in the building sector. 25% of the weighting for points in the GreenStar rating tools for commercial buildings and retail centres are allocated to energy (GBCSA, 2009).
1.1.2.3 Solar energy technologies
Solar water heating Solar water heating (SWH) converts solar energy into hot water for domestic hot water, space heating, pool heating and industrial process heat. SWH is a prime example of direct on-site energy service supply. The key technologies include collectors (glazed flat-plate, unglazed and evacuated tube collectors), storage tanks and control systems. The South African government has identified SWH as a critically important opportunity for displacing electricity demand and has launched a programme to supply and install 1 million SWH systems within five years to 2014.
Information Box: The Joule Electric Car The Joule electric car is the first vehicle to be developed and manufactured by a wholly owned South African company. The makers of the Joule claim that the vehicle is approximately five times more energy efficient than petrol or diesel vehicles. The Joule is battery operated and recharges with electricity from any source. When electricity is obtained from clean sources such as hydro or solar, significant reductions in emissions can be achieved. The rechargeable lithium-ion batteries are recyclable and contain no heavy metals. The company signed a memorandum of understanding with East London’s Industrial Development Zone so that commercial production should begin in 2013, reaching 50000 units a year by 2015. An alternative site for assembly is the Coega IDZ. It is expected that the vehicle assembly will employ more than 2000 people in its assembly operation, while supplier and support activities could create a further 8000 downstream jobs.
Note: The greenhouse gas emissions savings achieved if electricity is sourced from conventional coal-fired sources are not known by the authors of the ECCCRS. (Sources: Business Day, July 27, 2010; http://www.optimalenergy.co.za/ )

Phase 2: Technology Assessment
Eastern Cape Climate Change Strategy 12
Figure 4: Example of a Solar Water Heater.
Solar photovoltaics Solar photovoltaic (PV) technology converts solar energy into direct current electricity which can be converted and connected to the national grid or stored and used in a stand-alone configuration. Solar PV systems are entirely modular and are applicable at any scale from portable appliances (such as solar lanterns/torches and radios) to multi-megawatt grid-connected power stations. Apart from the grid-connected electricity generation opportunities (on households, businesses or at MW-scale) Solar PV systems provide high quality electricity services for communications and lighting in rural areas. The off-grid concession programme implemented under the DoE and NERSA provides access to electricity in a manner which complements grid electrification initiatives.
Figure 5: Example of a solar photovoltaic array.
Solar thermal electricity generation Electricity generation from solar thermal technology has very significant large-scale opportunities in the longer term. The technologies include: parabolic trough, central receiver and parabolic dish systems. Collectively called concentrating solar power (CSP) plants, these systems offer utility-scale power with storage to provide power after sunset. CSP can provide combined heat and power which is particularly useful in desalination plants. CSP system are best suited for areas with high levels of direct solar radiation. Eskom has been planning a 100 MW scale CSP plant in Upington and a proportion (ZAR260 million) of a loan from the World Bank is earmarked to fund this project.
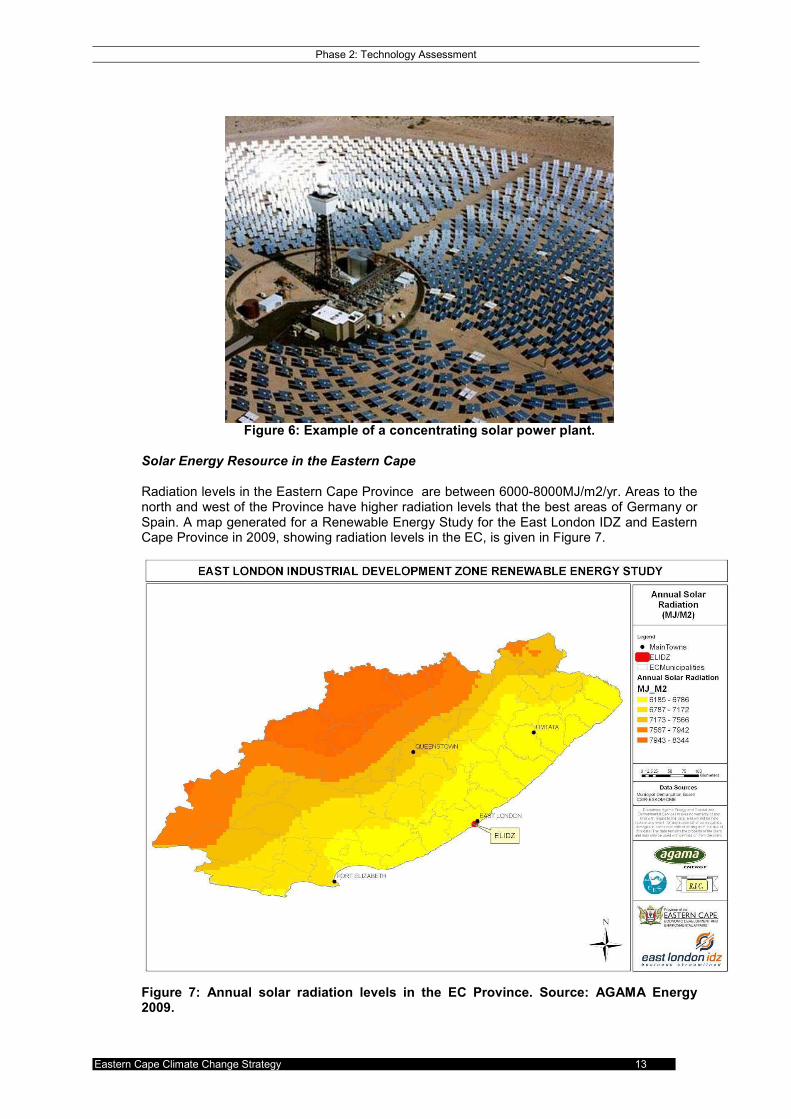
Phase 2: Technology Assessment
Eastern Cape Climate Change Strategy 13
Figure 6: Example of a concentrating solar power plant.
Solar Energy Resource in the Eastern Cape Radiation levels in the Eastern Cape Province are between 6000-8000MJ/m2/yr. Areas to the north and west of the Province have higher radiation levels that the best areas of Germany or Spain. A map generated for a Renewable Energy Study for the East London IDZ and Eastern Cape Province in 2009, showing radiation levels in the EC, is given in Figure 7.
Figure 7: Annual solar radiation levels in the EC Province. Source: AGAMA Energy 2009.

Phase 2: Technology Assessment
Eastern Cape Climate Change Strategy 14
1.1.2.4 Wind energy technologies
Wind energy systems convert kinetic wind energy into electricity and shaft power (for water pumping). Large modern wind turbines operate together in wind farms to produce electricity for utilities. Small turbines are used to meet localised energy needs.
Figure 8: Example of a wind farm. Wind energy is the fastest growing energy technology sector and accounts for more than 50% percent of worldwide clean energy investment in 2009 and almost half of installed clean energy capacity worldwide (PEW, 2010). The South African Wind Energy Association is calling for 25% of the overall electricity generation mix by 2025 to be derived from renewable energy, and, of this target, some 80% could come from wind power. By mid-2010 more than 30 separate wind farms ranging from 8 MW to over 100 MW had been planned for the Eastern Cape. A map generated for a Renewable Energy Study for the East London IDZ and Eastern Cape Province in 2009 (AGAMA Energy 2009), showing the distribution of average annual wind speed in the EC, is given in Figure 9.
Figure 9: Distribution of annual average wind speed. Source: AGAMA Energy 2009.

Phase 2: Technology Assessment
Eastern Cape Climate Change Strategy 15
1.1.2.5 Hydro energy technologies
Hydro energy systems convert potential and kinetic energy in rivers or dams into electricity or shaft power. Hydropower systems are based on very established technology and globally, hydropower accounts for about 90% of all renewable energy power generation (IEA 2008). The Eastern Cape has cumulatively the best hydropower resource in South Africa (CaBEERE, 2002) with the best resources to the east of the province and to the extreme south-west. . Table 1: Summary of installed and technical potential hydropower developments in the Eastern Cape Province (CaBEERE, 2002)
Installed capacity Firm development potential
Small (<10MW)
Large (>10MW)
Load factor
Present production
(GWh/a) Small
(<10MW) Large
(>10MW) Load factor
Possible
production
(GWh/yr)
14,7 53 0,11 to 0,25 144 25,8 1 250 0,75 to 0,3 3 455
1.1.2.6 Biomass energy technologies
Biomass energy systems convert organic matter into thermal or electrical energy. Technologies include efficient wood stoves, biogas digesters, wood gasifiers and cogeneration plant. Landfill gas utilisation relies on internal combustion gensets. The conversion of woody biomass to energy can follow several routes as shown in Figure 10. It can be seen that there are generally four primary energy conversion technologies producing heat, gas, oil or methane. These could feed into engines, turbines or fuel cells (secondary conversion) to produce heat and/or electricity.
Figure 10: Overview of the processes whereby biomass is transformed to energy
Source: Stucley et al The potential for biomass energy in the Eastern Cape is significant for direct onsite energy and distributed energy service provision. This is particularly relevant where large tracts of alien invasive vegetation are cleared, or where there are established commercial forests where biomass residue is readily available.

Phase 2: Technology Assessment
Eastern Cape Climate Change Strategy 16
Figure 11: An experimental biomass gasification and electricity generation unit at a Sawmill close to the town of Alice in the Eastern Cape. A map generated for a Renewable Energy Study for the East London IDZ and Eastern Cape Province in 2009 (AGAMA Energy 2009), showing potential biological productivity in the EC, is given in Figure 12.
Figure 12: Potential biological productivity in the Eastern Cape. Source: AGAMA Energy 2009.
1.1.2.7 Nuclear energy

Phase 2: Technology Assessment
Eastern Cape Climate Change Strategy 17
Nuclear energy systems produce electricity (and heat) by converting the energy released nuclear fission into electricity via a steam cycle. The predominant technology is the pressurised water reactor similar to the existing Eskom plant at Koeberg. New technologies include small and medium scale reactors and 3
rd generation gas-cooled reactors such as the
pebble bed modular reactor (PBMR). At this stage the role for nuclear energy development is beyond the scope of the Eastern Cape Province and current plans by Eskom are to build a plant at Thyspunt in the future.
1.1.2.8 Carbon capture and storage
Carbon capture and storage systems (CCS) are designed to capture emissions from fossil-fuelled generators, transport them and to store them in secure locations (or injection sinks) which are mostly gas-tight geological formations. Eskom has CCS plans for Medupi and Kusile but not applicable in the Eastern Cape in terms of this strategy. The South African Carbon Capture and Storage Atlas for the geological storage of carbon dioxide (CO2) underground. The Atlas shows at a theoretical level the locations for a cumulative 150 Gigatons (Gt) of storage capacity. Most capacity exists offshore. In addition to geological storage, power-plant/industrial flue gas can also serve as a source of CO2 for enhanced microalgae cultivation. Although still at a an experimental/prototype phase, opportunities exist for the extraction of biofuels from algae, the biodigestion of algae to produce methane, the extraction of algae to produce biochar, and the co-firing of algae in power plants/furnaces.
Figure 13: Algal bioreactors which can be used for the extraction of CO2 from power plant or industrial flue gases. Image: www.evworld.com
1.1.2.9 Fuel cells
Fuel cells are devices which convert gaseous reactants into electricity and by-products. The hydrogen fuel cell is a common version which utilises hydrogen as the fuel and oxygen (in air) as the reactant to produce electricity and water. Fuel cells are used in stationary (standby power) and transport (for vehicles) applications.
1.1.2.10 Geothermal energy
Geothermal energy systems provide heat and electrical power by extracting energy from the earth’s core at locations where the localised geology allows access to higher temperatures near the Earth’s surface.
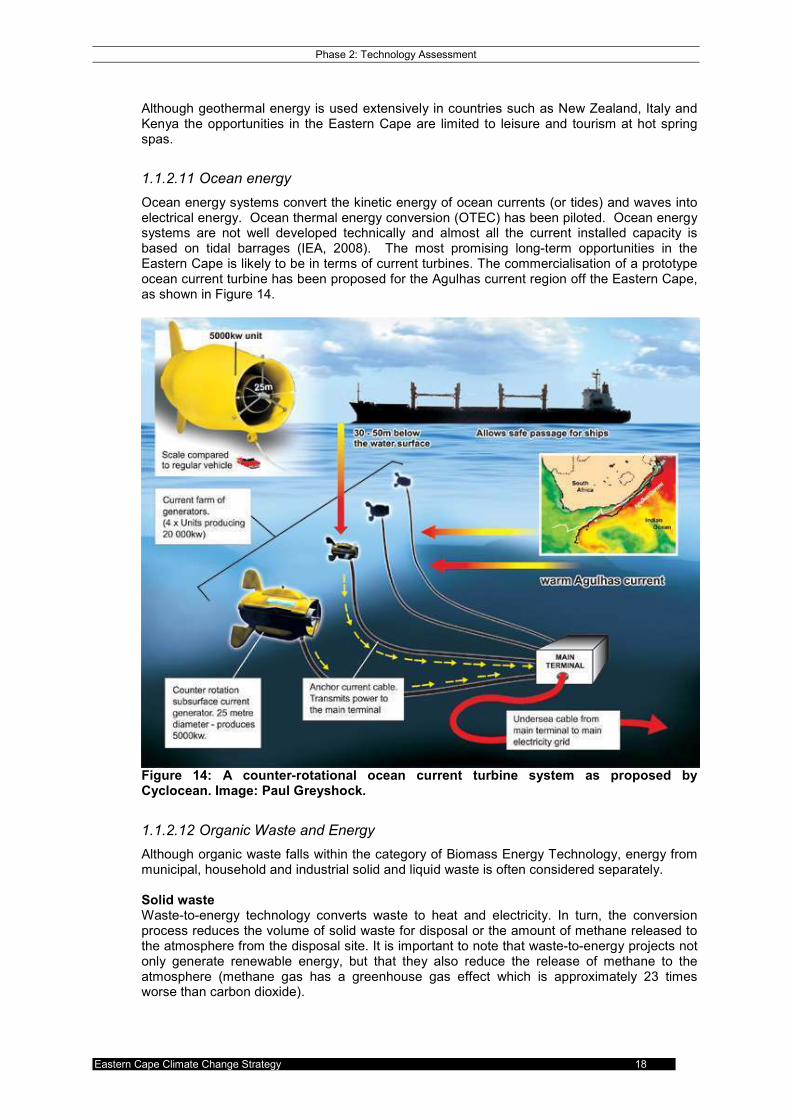
Phase 2: Technology Assessment
Eastern Cape Climate Change Strategy 18
Although geothermal energy is used extensively in countries such as New Zealand, Italy and Kenya the opportunities in the Eastern Cape are limited to leisure and tourism at hot spring spas.
1.1.2.11 Ocean energy
Ocean energy systems convert the kinetic energy of ocean currents (or tides) and waves into electrical energy. Ocean thermal energy conversion (OTEC) has been piloted. Ocean energy systems are not well developed technically and almost all the current installed capacity is based on tidal barrages (IEA, 2008). The most promising long-term opportunities in the Eastern Cape is likely to be in terms of current turbines. The commercialisation of a prototype ocean current turbine has been proposed for the Agulhas current region off the Eastern Cape, as shown in Figure 14.
Figure 14: A counter-rotational ocean current turbine system as proposed by Cyclocean. Image: Paul Greyshock.
1.1.2.12 Organic Waste and Energy
Although organic waste falls within the category of Biomass Energy Technology, energy from municipal, household and industrial solid and liquid waste is often considered separately. Solid waste Waste-to-energy technology converts waste to heat and electricity. In turn, the conversion process reduces the volume of solid waste for disposal or the amount of methane released to the atmosphere from the disposal site. It is important to note that waste-to-energy projects not only generate renewable energy, but that they also reduce the release of methane to the atmosphere (methane gas has a greenhouse gas effect which is approximately 23 times worse than carbon dioxide).

Phase 2: Technology Assessment
Eastern Cape Climate Change Strategy 19
Mitigation options for solid organic waste before landfilling include waste separation and conversion to compost, pyrolysis/gasification and incineration. Pyrolysis and Gasification are reaction processes which break down the organic waste to form synthesis gas and other products. The synthesis gas is fired directly in internal combustion engines to generate electricity and heat.
Figure 15: A biomass/organic waste gasification prototype developed in South Africa (photograph: EECOfuels). Where organic waste has been disposed of in landfills it usually decomposes to form methane rich landfill gas. Landfill gas energy facilities capture the methane and combust it to generate heat and/or electrical energy. A number of successful landfill gas projects exist in South Africa, most notably La Mercy and Marianhill landfill sites in KZN.

Phase 2: Technology Assessment
Eastern Cape Climate Change Strategy 20
Figure 16: La-Mercy Landfill Gas Electricity Generation Unit. Photo: Engineering News, South Africa. Anaerobic digestion of liquid waste Anaerobic digestion as a wastewater treatment process does not require external energy inputs, but rather generates methane rich gas which can be converted to useful energy. Anaerobic digestion results in a 16% reduction in CO2 emissions as compared to conventional sewage treatment. Anaerobic digestion of sewage is a well established treatment technology world-wide, but has not become mainstream in South Africa. The rehabilitation of the Athlone Anaerobic Treatment Works in Cape Town is currently under consideration. In addition to anaerobic digestion of wastewater at municipal works, feasibility studies have shown that significant opportunities exist for the rollout of domestic-scale biodigesters as alternative energy sources in rural households Household-scale biogas digesters provide multiple co-benefits,including waste management (and on-site treatment), energy generation with storage, nutrient management and water management. A household energy survey for South Africa undertaken in 2007 (AGAMA Energy, 2007) included data collected in six villages in the Eastern Cape, The summary of the findings for the EC province were as follows:
Number of eligible HHs
Biogas production
(m3/day)
Capital cost (R million)
O&M cost (Rmillion/a)
Energy cost saved by day
(R)
Time benefits per day (R)
Eastern Cape 109,285 95,233 820 16 191,323 31,016
Figure 17: Piggery wastewater biodigestion and electricity generation facility, Thailand.

Phase 2: Technology Assessment
Eastern Cape Climate Change Strategy 21
1.1.3 Technology options for adaptation
The notion of technology options for adaptation has not been addressed with the same levels of rigour and experience as technologies for mitigation. The key technologies for adaptation are those which could address: Coastal zones – including hard walls/structures to protect; early warning systems; improved materials and systems to cope with marine exposure Water resources – better water management systems including supply-side management; demand side management; cooling/heating systems which operate on lower quality water; flood management; improved waste water treatment; rainwater harvesting; improved agriculture to cope with water shortages Agriculture – encourage different crops; use drip irrigation; minimise wind erosion; adapt farming practices Public health – better urban planning; improved air-conditioning systems; improved mobility systems (public transport, non-motorised transport); catalytic converters; vaccinations; impregnated bednets; improved water and sanitation systems Infrastructure – urban planning to optimise energy, water and waste systems; minimise paved/hard surfaces; efficient mobility systems; protection of infrastructure against physical damage from storms/heat/wind.

Phase 2: Technology Assessment
Eastern Cape Climate Change Strategy 22
Table 2: High priority technologies opportunities for mitigation of GHG emissions in the Eastern Cape
Technology
opportunity
Technology Market sector
application
Maturity of
technology
Owner /
implementer
Policy and
regulatory context
Opportunities for
partnerships
Comments
Energy
efficiency for
customers
Air conditioners
Heat pumps
Refrigerators
Variable speed
drives for motors
Lighting
Commerce
Industry
Agriculture
Households
Very mature
Constantly improving
Excellent
international
experience
Energy service
customers
- Public sector
- Private sector
Planning approvals
to include energy
plans
Inclining block tariffs
Energy labeling of
appliances
National Energy
Efficiency Agency
(NEEA)
Local authority
planning
departments
The bulk (>80%) of
the effort in the
Eastern Cape
E Cape government
to lead
Excellent
manufacturing base
in E. Cape
Energy
efficiency for
utilities
Smartgrids
Intelligent
metering
Energy efficient
TX and DX
More efficient
generation
Energy utilities Smartgrids in first
phase of
implementation
Mature and
constantly improving
Eskom
Local authorities
REDs in future?
Licencing and
reporting to NERSA
subject to efficiency
reporting
Inclining block tariffs
Energy
efficiency in
transport
Planning tools
Public transport
Non-motorised
vehicles
Electric vehicles
All sectors All technologies are
available
Extensive
experience (apart
from EVs at scale)
Fleet owners /
operators
- Public sector
- Private sector
Joule electric vehicle
manufacture
E Cape government
to lead
Energy
efficiency in
buildings
Design tools
Thermal
insulation
High
performance
glazing
Construction
industry
Developers
Mature and
constantly improving
Building owners and
developers
- Public sector
- Private sector
SANS 0204 –
thermal efficiency of
buildings
Construction Industry
Development Board
(CIDB)
Green Building
Council of South
Africa (GBCSA)
Focus on retrofitting
of public and private
sector buildings
SANS 204 to be
made mandatory
The national Energy

Phase 2: Technology Assessment
Eastern Cape Climate Change Strategy 23
Technology
opportunity
Technology Market sector
application
Maturity of
technology
Owner /
implementer
Policy and
regulatory context
Opportunities for
partnerships
Comments
Efficiency Strategy
needs to be
implemented
Solar water
heating
systems
Flat-plate glazed
systems
Evacuated tube
systems
Unglazed
systems
domestic hot
water
commercial hot
water
industrial hot
water and
process heat
pool heating
Very mature and
improving
Households
Businesses
- Public sector
- Private sector
no regulatory
barriers; emerging
national policy /
strategy framework;
opportunities for
RECs, CERs and
VERs
The DoE has
announced a 1
million SWH
programme over 5
years
The SWH
programme in
NMBM is the well
advanced
excellent solar
energy resource
(6000 and 8000
MJ/m2/yr)
Solar PV
systems
Mono- and poly-
crystalline
Thin film
systems
grid- and off-grid
electricity
systems
water pumping
systems
Crystalline
technology very
mature
Thin film technology
increasingly robust
IPPs
Building owners
Off-grid utilities in
operational for over
10 years
REFIT guideline
offers 398 c/kWh for
grid-connected solar
PV > 1 MWp
Off-grid concession
agreements
Domain protocol for
RECs
ELIDZ
IPPs
excellent solar
energy resource
(6000 and 8000
MJ/m2/yr)
Solar
thermal
electricity
generation
Parabolic
troughs
Central receiver
systems
Parabolic dish
systems
Utility power
generation
Parabolic trough
have been
operational for over
20 years
(Sacramento)
Central receiver
systems scaling up
Parabolic dish
systems less mature
IPPs
Local authorities
REFiT guideline
offers
- 314 c/kWh for
CSP trough
without storage
for > 20 MW
- 213 c/kWh for
CSP central
receiver with 6
Eskom
IPPs
excellent solar
energy resource
(6000 and 8000
MJ/m2/yr)
transmission
infrastructure may
need strengthening

Phase 2: Technology Assessment
Eastern Cape Climate Change Strategy 24
Technology
opportunity
Technology Market sector
application
Maturity of
technology
Owner /
implementer
Policy and
regulatory context
Opportunities for
partnerships
Comments
hours of storage
for > 20 MW
CDM
Wind energy
technologies
wind turbines
- Horizontal
axis
- Vertical axis
standalone/off-
grid and grid-
connected
household scale
small wind farm
wind farms
Horizontal axis
machines are well-
established
Vertical axis less well
established
IPPs
Local authorities
REFiT guideline
offers 125 c/kWh for
> 20 MW
RECs, REFSO and
carbon
methodologies
IPPs the Eastern Cape has
an excellent wind
energy resource
Wind energy is
attracting massive
interest
Hydro
energy
technologies
turbines standalone/off-
grid and grid-
connected
micro-hydro
Very well established
and mature
IPPs
Local authorities
REFiT guideline
offers 94 c/kWh for >
1 MW
RECs, REFSO and
carbon
methodologies
IPPs
Working for Energy
the Eastern Cape has
an excellent resource
Biomass
energy
technologies
Energy from
waste / solid
biomass
Biogas
Landfill gas
household waste
management /
thermal energy
agricultural,
industrial and
municipal
systems
cogen from
invasive alien
and managed
wood fuel lots
Combustion systems
(boilers) are well
established and
mature
IPPs
Local authorities
REFiT guideline
offers:
- 118 c/kWh for
solid biomass
for > 1 MW
- 96 c/kWh for
biogas for
>1 MW
- 90 c/kWh for
biogas for
>1 MW
RECs, carbon
project
Working for Water
Working for Energy
IPPs
integrated waste
management,
household energy,
water recycling for
housing excellent co-
digestion potential
with livestock and
organic wastes

Phase 2: Technology Assessment
Eastern Cape Climate Change Strategy 25
Technology
opportunity
Technology Market sector
application
Maturity of
technology
Owner /
implementer
Policy and
regulatory context
Opportunities for
partnerships
Comments
water discharge
quality standards
(DWA)
DWA; National
Environmental
Management Act
Fuel cells
and
electrical
storage
batteries
Fuel cells
electrical
storage batteries
off-grid, backup
power, electric
vehicles
Fuel cells are
commercially
available but not well
established
Electrical storage
batteries are mature
and evolving
NEMA; recycling and
waste management
the three primary
electrical storage
battery
manufacturers are in
E. Cape
electricity backup and
off-grid for energy
services in buildings
electric vehicles
Geothermal
energy
Dry steam
Flash
Binary cycle
District / process
heat
Power
generation
Industry
Very well established
and reliable
Utilities
Industry
No specific provincial
or national policy
n/a No utilizable
resources available in
E. Cape
Ocean
energy
technologies
Ocean current
Wave / tidal
OTEC

Phase 2: Technology Assessment
Eastern Cape Climate Change Strategy 26
1.1.3.1 Recommendations for the most favourable technology options for the province The key technologies for mitigation in the Eastern Cape Province are prioritised in Table 3 below. These represent technologies where the most significant gains in mitigation can be achieved for time, effort and finances invested. This is based on appropriateness of technology and ease of implementation in the Eastern Cape. Table 3 : Prioritized technologies for mitigation in the Eastern Cape.
Technology option Application Comment
1 Energy efficiency in buildings and appliances
- GreenStar rating of buildings
- Efficient airconditioning
- Efficient lighting
Buildings lifetimes exceed 50 years and consequently these lock in emissions or savings for a long time All government / municipal buildings will soon be required to meet a Four Star rating
2 Heat pump technologies
- Heat pumps and efficient water heating
Manufacturing opportunities offer a double return on investment in energy efficiency with heat pumps
3 Solar space and water heating
- Passive solar design standards
- Building standards to include SWH
Highly topical and appropriate within the context of the DoE Strategic Framework for SWH and 1 million SWH target
4 Energy efficiency in transport
- Fuel efficiency standards
- Electric vehicles - Plan for non-
motorised transport
Security of supply issues are important too Exposure to price risks in the future costs of carbon based fuels
5 Industrial energy efficiency
- Efficient motors and drives
Effective frameworks and mechanisms (beyond Eskom’s DSM scheme) are required to enable / accelerate these investments
6 Smart grids and metering systems
- Upgrade metering - Introduce
intelligence in the network
Local authorities (and REDs in future?) will benefit in higher levels of service delivery and deferred investments for new capacity
7 Biomass energy systems
- Energy from waste - Agricultural and
household biogas
The E. Cape has a significant resource for on-site and distributed energy service provision
8 Wind energy systems - Utility-scale wind farms
- Small scale mini-grid and stand-alone systems
The E. Cape has some of the best wind regimes in SA Infrastructure can be implemented more quickly than other systems (subject to EIA approvals)
9 Hydro energy systems - Small and medium scale systems
The E. Cape has the best resource in the country and some excellent experience with existing capacity
10 Solar PV systems - Stand-alone systems for household electrification
- Grid-connected PV on buildings and for utility generation
Increased access to energy services can be rapidly addressed Grid-connected systems can also be implemented very quickly but the costs are currently still high for good ROIs
1.1.4 Job creation opportunities associated with mitigation technologies
Although Climate Change has many negative social and economic implications, the necessary adjustment of global modes of production to a more sustainable, low carbon economy is likely

Phase 2: Technology Assessment
Eastern Cape Climate Change Strategy 27
to result in many opportunities for the generation of “green” jobs. Currently green job creation is taking place in both the rich countries and in some of the major developing economies. As an illustration, employment in the renewables sector in Germany increased from 66,600 to 259,100 between 1998 and 2006 (UNEP 2008). Table 4 shows that over 2.3 million jobs world-wide were attributable to the Renewable Energy Sector in 2006, with the greatest number of jobs coming from renewable biomass. Table 4: Estimated World-wide Employment in the Renewable Energy Sector in 2006. Source: UNEP 2008.
RE Type Number of Jobs
Wind 300,000
Solar PV 170,000
Solar Thermal 624,000
Biomass 1,174,000
Hydropower 39,000-plus
Geothermal 25,000
Renewables, Combined 2,332,000-plus
A study by AGAMA Energy in 2003 gives details of the relative number of jobs per Terawatt Hour (TWh) for different energy generation types (see Figure 18). Renewable energy technologies result in more jobs per unit energy than nuclear, coal and gas, while significant numbers of jobs are created in the Biogas, Bioethanol, Solar Water Heating and Biodiesel industries.
Comparison of Job Creation Potential of Various Energy Generation Technologies
0
2000
4000
6000
8000
10000
12000
14000
16000
18000
Jobs/T
Wh
equiv
ale
nt
Jobs/TWheq 80 130 700 952 1341 3778 8733 16318
Nuclear Gas Coal
Renewable
Energy
Technologies
Biogas BioethanolSolar Water
HeatingBiodiesel
Figure 18: Gross direct jobs for new generation capacity of various energy types (Source: AGAMA Energy 2003) AGAMA Energy (2009) generated projections of the job creation potential of renewable energy in the Eastern Cape based on the following scenario (among other variables):
• 9% Renewable Energy in the provincial energy mix by 2013 and15% by 2018 as suggested by the Minister of Minerals and Energy in March 2009 (DME, 2009); and
• 27% Renewable Electricity in the provincial energy mix by 2030 as modelled in the Long Term Mitigation Scenarios (Winkler, 2007).

Phase 2: Technology Assessment
Eastern Cape Climate Change Strategy 28
• A growth in provincial electricity demand to greater than 40 000 GWh/pa by 2038.
0.0
20000.0
40000.0
60000.0
80000.0
100000.0
120000.0
20092010
20112012
20132014
20152016
20172018
20192020
20212022
20232024
20252026
20272028
20292030
20312032
20332034
20352036
20372038
Jobs
Energy Efficiency
Rural Biogas
Biodiesel
Bioethanol
SolarWaterHeating
Hydro
BioEnergy
Wind
Solar PV
Solar Thermal
Figure 19: 30 year projection of jobs created in the RE sector for RE supply to the EC. Source: AGAMA Energy 2009. Based on the scenario, the job creation potential for supply of RE to the Eastern Cape Province is given in Figure 19. It is projected that up to 112,000 jobs will be created if renewable energy forms 35% of the Eastern Cape energy mix by 2038.
1.1.5 Policies and measures
1.1.5.1 Market creation and development
Market opportunities attract interest from stakeholders and draw in investment in anticipation of returns. Consequently it is important to understand market approaches to stimulating investment in energy technologies which have mitigation benefits. Traditionally markets in the energy sector have been either highly regulated, as in the case of the electricity sector, or poorly understood, as in the case of biomass energy and solar water heating. A distinction can be made between markets for energy carriers – such as electricity and LPG - and energy services (as illustrated in Figure 3). The REFIT guidelines are intended to create a market for electricity generated from renewable energy. Similarly, regulations regarding Green Building codes or appliance labelling for energy efficiency will stimulate markets for more efficient buildings and energy efficient appliances. The key challenge in market making is to minimise market distortions which establish negative structural and/or institutional legacies. The increasing trend towards disclosure of ‘carbon footprints’ in business is influencing management and procurement practices in terms of energy (and other inputs). This trend is creating a market for energy audits, carbon inventories and investments in energy efficiency and certified Green Power using Renewable Energy Certificates.
1.1.5.2 RD&D efforts
Research and development and demonstration (RD&D) are critical both in terms of innovation for better efficiency as well as for supporting the industrial capacity to supply, install and operate systems which can mitigate GHG emissions. Clearly RD&D efforts need to be identified and driven within the context of the industrial policy of the country and the province.

Phase 2: Technology Assessment
Eastern Cape Climate Change Strategy 29
Measures to support RD&D include protecting intellectual property rights, funding and human capital development. The province has good infrastructure and institutions for RD&D in the form of universities and industrial capacity. An example of an RD&D initiative which the province could implement would be technology prizes for climate change mitigation. These could be linked to the National Science Week which is held annually in Grahamstown.
1.1.5.3 Investments in new technologies
Technologies have direct and important benefits in terms of mitigation of GHG emissions but there are deeper economic benefits of embracing new technologies. Emerging economies such as India and China have established themselves as world leaders by means of a combination of investments in new technololgies and a complementary industrial strategy. renewable energy companies in emerging economies have an important role. China’s Suntech is the third largest manufacturer of solar cells in the world and India’s Suzlon is one of the world’s five biggest makers of wind turbines. Companies of this kind see the shift to a low carbon economy as an opportunity, not a threat, with wider implications for national policy (Findlay M and Dimsdale T, 2009).
1.1.5.4 Tax credits
Fiscal and tax incentives in the form of rebates can be an attractive mechanism for incentivising a shift towards cleaner energy service solutions and other GHG mitigation options. Credits or rebates can take the form of accelerated depreciation of assets, reduced property taxes or allowances under income tax regulations. Often these rebates can be coupled to charges or tariffs which place a surcharge on high emission practices.
1.1.5.5 Standard setting
Standards are a powerful tool for disseminating new technologies and good practices, developing global markets and supporting the harmonization of government policies on energy efficiency and renewable sources on a global scale. Energy performance standards help:
• minimize product energy performance testing and verification costs for increasingly globalized energy-using equipment markets,
• enable energy performance to be compared on a common basis across broad economic and political groupings,
• facilitate adoption of more efficient product manufacturing, and • accelerate transfer of best practice in policy settings.
Wherever possible, it is recommended that standards are adopted or developed to drive compliance with good practice – especially in terms energy efficiency for buildings, appliances and transport.
1.1.5.6 Technology development and transfer
Clearly, and as in the case of many smaller countries or provinces, it is unlikely that the Eastern Cape Province will be able to innovate and develop all the technologies (and supporting systems) for mitigation of GHG on provincial budgets alone. The challenge then is to encourage technology development and transfer in partnership with other stakeholders. The high-level commitments from COP15 on technology development and deployment in the emerging economies – and the associated issue of NAMAs – is highly relevant to the Eastern Cape. The initiative of the ELIDZ in commissioning a study on renewable energy for the ELIDZ is an excellent example of a pro-active effort to attract technology development and transfer within the context of the ‘Green Economy’. Support to build effective innovation systems not just narrow technology transfer (Tomlinson et al, 2008)
1.1.6 Regulatory environment
Effective implementation of services which can benefit from technologies which mitigate GHG emissions is highly dependent on a good regulatory environment. Key regulatory mechanisms include:

Phase 2: Technology Assessment
Eastern Cape Climate Change Strategy 30
• Standards and Codes of Practice • Access to markets • Licencing • Tariffs – including inclining block tariffs
A key question is the institutional environment for regulatory oversight. At this stage, in the electricity sector, the centralised, highly regulated, bureaucratic energy generation and transmission market is constricting the development of an independent RE production sector. Either decentralisation and deregulation is regulation is required, or an enabling institutional framework (in which real capacity exists) should be set up. Conversely, local planners could use regulations to encourage technology rollout by linking requirements for energy efficiency and other technology options into planning permission (building plans, rezoning, EIA RODs, SDFs). However, for these requirements to have any teeth, they need to be backed up by legislation, adopted policy, guidelines and/or scientific evidence of effectiveness. Interestingly, the requirements by the financial services sector for financing or funding infrastructure investments often provides the rate-determining regulatory constraints (or opportunities) for more effective systems.
1.1.7 Establishment of a conducive/enabling context for technical options
The question of how the province can support rollout/implementation is a complex one as it needs to address the challenge of how to shape and enable long run investment decisions under conditions of high uncertainty.
Difficult problems are often stuck in “impossible” loops which make it difficult for policy makers to see a way out; this can be addressed in several ways: –“Reframing the problem” to bring in new constituencies and approaches: e.g. “climate change is about investing to secure the benefits of a stable climate” –Looking to the long term: e.g. “is our fisheries management system robust to a changing climate and rising environmental consciousness?” –Bundling multiple policy benefits: e.g. “investment to prevent instability and conflict in Central Asia will benefit the UK’s WMD, terrorism, energy and OC policy priorities” (Mabey, 2006)
Ideally, the province would need to take the initiative to create a virtuous circle of demonstrating the feasibility of emissions cuts so decision makers commit to credible targets for market pull. Linked to the vision and commitment which is required to take the initial steps it is important to work with the process of engaging with stakeholders, the politics, while developing the policy –effectively building a delivery coalition around the idea or overall goal. Many energy efficiency technologies and practices are already highly cost-effective but are held back by additional barriers which include: • lack of awareness of the cost-effective savings potential, • missing or partial information on energy efficiency performance and lack of common
metrics, • lack of consideration of system and process energy efficiency issues, • split incentives e.g. the different economic incentives which exist between
developers/landlords who procure energy using equipment and tenants who pay the energy bill, and
• the fact that energy efficiency is often a minor determinant of capital-acquisition decisions and is bundled-in with more important decision factors.
A key enabling mechanism for accelerating mitigation is monitoring and evaluation (M&E). This can begin with voluntary initiatives such as the Carbon Disclosure Project (www.cdproject.net) which could then be adopted as mandatory, or compliance based, frameworks for driving a transition. Larger companies in SA have been reporting their

Phase 2: Technology Assessment
Eastern Cape Climate Change Strategy 31
emissions under the CDP and these M&E activities are highlighting trends and priorities for investment in better systems. It is suggested that monitoring and evaluation at the provincial level could track the following indicators which are categorised into access and quality criteria, namely (adapted from Lee H et al, 2010): Access to clean electricity (from licensed electricity distributors / AMEU) • Access to electricity • Renewables % of electricity generation • Efficiency of distribution • Quality of supply Intensity emissions trends • Emissions intensity trend for the province • Emissions intensity trend in manufacturing sector • Emissions trend in the five (or so) largest companies
1.1.8 Non-technical policies can significantly contribute to mitigation
As indicated above, the availability of technology is not sufficient, in isolation, to drive mitigation. An enabling environment is required within the framework of a social compact. Key considerations in motivating a broader non-technical approach include the observations that values, lifestyles and ambitions for the future are powerful drivers for change (or not). Changes in lifestyles and behaviour patterns can contribute to climate change mitigation by means of:
• occupant behaviour, cultural patterns, consumer choices in buildings • reduction of car usage and efficient driving, improved urban planning and more
availability of public transport • behaviour in industrial organizations
Other non-technical policies which need to be factored in include:
• Macro-economic policy: taxes, subsidies, other fiscal policies, structural adjustment • Trade policy: “embodied carbon”, removing barriers for low-carbon products, domestic
energy sources • Emery security policy: efficient energy use, domestic energy sources (low- high
carbon) • Access to modern energy: bio-energy, poverty tariffs • Air quality policy: clean fuel • Bank lending policies: lending for efficiency/ renewable energy, avoid lock-in into old
technologies in developing countries • Insurance policy: Differentiated premiums, liability insurance exclusion, improved
conditions for green products

Phase 2: Technology Assessment
Eastern Cape Climate Change Strategy 32
2 REFERENCES
CaBEERE. (2002). Baseline study - hydropower in South Africa. Pretoria: Department of Minerals and Energy, CaBEREE Project. Camco and TIPS (2010) Climate Change: Risks and Opportunities for the South African Economy: An Assessment of Mitigation Response Measures, British High Commission, May 2010 Findlay M and Dimsdale T (2009) Climate Action in Major Emerging Economies: Brazil, China, India, Mexico and South Africa, November 2008 (updated January 2009) (updated January 2009) GBCSA (2009) Green Star SA - Office v1: Rating Tool Fact Sheet, Green Building Council of SA, www.gbcsa.org.za IEA (2008) Energy Technology Perspectives 2008: ScenarIos and Strategies to 2050 - In support of the G8 Plan of Action, OECD/IEA, Paris. IPCC (2007) http://www.ipcc.ch/publications_and_data/ar4/wg3/en/contents.html accessed on 21 April 2010. Mabey N (2006) Practical Sustainable Development: the challenge of long term strategy in day to day government, Presentation, E3G, London http://www.e3g.org/programmes/systems/ accessed on 18 May 2010 PEW (2010) Who’s Winning the Clean Energy Race?: Growth, Competition and Opportunity in the World’s Largest Economies, The PEW Charitable Trusts, Washington DC Stucley, R. et al. (2004), Biomass Energy production in Australia, Status, Costs and Opportunities for Major technologies. Bioenergy Australia, RIRDC Publication No 04/031 Tomlinson S (2009) Guardian: Shane Tomlinson on Green Technology, Interview 23 Novewmber 2009, http://www.e3g.org/about/news-articles/guardian-shane-tomlinson-on-green-technology/ (accessed on 14 May 2010) Tomlinson S, Zorlu P and Langley C (2008) Innovation and Technology Transfer Framework for a Global Climate Deal, E3G/Chatham House, 2008 UN (2010) Energy for a Sustainable Future: Summary Report and Recommendations, The Secretary-General’s Advisory Group on Energy and Climate Change (Agecc), 28 April 2010, United Nations, New York UNEP (2009) Greenhouse Gas Emission Baselines and Reduction Potentials from Buildings in South Africa: A Discussion Document, United Nations Environment Programme. Lee, H.; MacGillivray, A.; Begley, P.; Zayakova, E. (2010) ‘The Climate Competitiveness Index 2010’, UNEP / AccountAbility, ISBN 978-1-901693-67-6 UNEP (2008): Green Jobs: Towards decent work in a sustainable, low-carbon world. Available online: http://www.unep.org/greeneconomy/ AGAMA Energy, 2003. Employment Potential of Renewable Energy in South Africa. Prepared for the Sustainable Energy and Climate Change Partnership. November 2003. AGAMA Energy, 2009: East London Industrial Development Zone Renewable Energy Study. November 2009. AGAMA Energy, 2007, South African national rural domestic biogas feasibility assessment, August 2007.

Phase 3: Climate Change Response
Eastern Cape Climate Change Strategy i
PHASE III: Guideline Document on Sectoral Climate Change Action Plans

Phase 3: Climate Change Response
Eastern Cape Climate Change Strategy ii
CONTENTS
1 GUIDELINE DOCUMENT ON SECTORAL CLIMATE CHANGE ACTION PLANS 2
2 ADAPTATION TO CLIMATE CHANGE RISKS OF EXTREME SIGNIFICANCE 3
2.1 Integrated programmes as a cross-sectoral framework for climate change adaptation 5
2.2 Adaptation Categories 6
2.3 Coastal Infrastructure and Livelihoods 7 2.3.1 Overview 7 2.3.2 Response Options 8
2.4 Water Scarcity 10 2.4.1 Overview 10 2.4.2 Response Options 10
2.5 Flood Management 12 2.5.1 Overview 12 2.5.2 Response Options 12
2.6 Responses to increased risk of wildfires 13 2.6.1 Overview 13 2.6.2 Response Options 13
2.7 Managing the effects of increased temperature on human lives 15 2.7.1 Overview 15 2.7.2 Response Options 15
2.8 Food security 17 2.8.1 Overview 17 2.8.2 Response Options 17
3 GREENHOUSE GAS EMISSIONS MITIGATION 18
3.1 Mainstreaming GHG Mitigation in Provincial and Local Government 22 3.1.1 Overview of the issue and opportunity 22
3.2 Promotion of Renewable Energy in the EC 23 3.2.1 Overview of the issue and opportunity 23
3.3 Mitigation and Opportunities for Sustainable Livelihoods 25 3.3.1 Overview of the issue and opportunity 25
3.4 Mitigation in Solid Waste and Wastewater Treatment 26 3.4.1 Overview of the issue and opportunity 26
3.5 Greenhouse Gas Mitigation in Transport 27 3.5.1 Overview of the issue and opportunity 27
4 CLIMATE CHANGE RESPONSE FINANCE AND SUPPORT 29
4.1 Multilateral and Bilateral Finance for Climate Change Response 29

Phase 3: Climate Change Response
Eastern Cape Climate Change Strategy iii
4.2 National and Local Sources of finance 31
4.3 Other sources of support 31
5 INSTITUTIONAL ARRANGEMENTS FOR PROVINCIAL CLIMATE CHANGE RESPONSE 33
5.1 National Institutional Arrangements 33
5.2 Provincial Institutional Arrangements 35
6 REFERENCES 36

Phase 3: Climate Change Response
Eastern Cape Climate Change Strategy iv
LIST OF FIGURES
Figure 1: Climate Change Response Cycle (Source: IPCC 2001).......................................................... 2 Figure 2: Programmatic framework for multi-sectoral adapative response planning. ............................. 5 Figure 3: Comparison of recent estimates of sea level rise in 2100, relative to 1990 levels................... 7 Figure 4: Loss of infrastructure at Cape Town Harbour under 2.5m(blue), 4.5m (red) and 6.5 m (orange) sea-level rise scenarios............................................................................................................. 8 Figure 5: Fire frequency atlas for South Africa showing the number of fires between 2000 and 2007. Light yellow indicates 1 to 2 fires; dark red indicates more than 8 fires. Source: South African Risk and Vulnerability Atlas (2010). ...................................................................................................................... 13 Figure 6: Diagram illustrating the link between climate change and effects to human health (Source: WHO, 2003). .......................................................................................................................................... 15 Figure 8: Framework for source-category based evaluation of emissions reduction targets and opportunities. ......................................................................................................................................... 18 Figure 9: Framework for multi-sectoral mitigation programmes. ........................................................... 20 Figure 10: The 200kW gassifier installed at Melani village north of the Alice Campus. Source and Photo: S Mamphweli. ............................................................................................................................. 25

Phase 3: Climate Change Response
Eastern Cape Climate Change Strategy v
LIST OF TABLES
Table 1: Impacts of extreme significance to the province as identified in the systematic risk assessment.............................................................................................................................................. 3 Table 2: Recommended programmes in response to the impacts of extreme significance identified in the systematic risk assessment. .............................................................................................................. 6 Table 3: First order matrix for the evaluation of targets and opportunities according to emissions categories. ............................................................................................................................................. 19 Table 4: Proposed integrated mitigation programmes........................................................................... 20 Table 5: Passenger fuel efficiency for five passenger transport modes (Source: UNEP 2008)............ 28 Table 6: Multilateral and Bi-Lateral Climate Change adaptation and mitigation funds (Source: http://www.climatefundsupdate.org/listing 2010) ................................................................................... 30 Table 7: Multilateral and Bi-Lateral Climate Change adaptation and mitigation funds – pledged and disbursed (Source: http://www.climatefundsupdate.org/listing 2010).................................................... 31

Phase 3: Climate Change Response
Eastern Cape Climate Change Response Strategy 1
ACRONYMS AND ABBREVIATIONS
AR4 IPCC 4th Assessment Report DEDEA Department of Economic Development and Environmental
Affairs DoE Department of Energy ECCCRS East Cape Climate Change Response Strategy FPA Fire Protection Association GHG Greenhouse Gas IDP Integrated Development Plan IPCC Intergovernmental Panel on Climate Change IPP Independent Power Producer PGDP Provincial Growth and Development Plan PSDP Eastern Cape Provincial Spatial Development Plan SDF Spatial Development Framework UNFCCC United Nations Framework Convention on Climate Change

Phase 3: Climate Change Response
Eastern Cape Climate Change Response Strategy 2
1 GUIDELINE DOCUMENT ON SECTORAL CLIMATE CHANGE ACTION PLANS
The previous phases of the Eastern Cape Climate Change Response Strategy have highlighted the impacts and implications of projected future climate changes. The current section deals with response options available to the Eastern Cape Government in terms of mitigation and adaptation options.
Figure 1: Climate Change Response Cycle (Source: IPCC 2001)
The above figure indicates the elements of the overall climate change response cycle that this section will be dealing with, namely adaptation planning and mitigation planning.
Phase 3: Response Planning.

Phase 3: Climate Change Response
Eastern Cape Climate Change Response Strategy 3
2 ADAPTATION TO CLIMATE CHANGE RISKS OF EXTREME SIGNIFICANCE
Phase 1 of the Eastern Cape Climate Change Response report provides a systematic climate change impact risk assessment. This process identified (in addition to other low, medium and high significance risks) potential risks of extreme significance relating to key provincial government sectors, plans and programmes. These risks are described in the table below.
Table 1: Impacts of extreme significance to the province as identified in the systematic risk assessment
Primary Impact (Manifestation)
2nd Order Impact 3
rd Order Impact
Likelihood
Consequence
Significance
More hot days and heat waves
Increased frequency of fire danger index reaching high-extreme, coupled with berg-wind conditions
Risk of major loss of livestock, grazing, crops and infrastructure. Threats to financial sustainability of existing commercial and subsistence farming operation and rural livelihoods; Reduced food security.
Almost certain
Major Extreme
Increased storm severity/ Extreme weather events.
Increased erosion and inundation of coastal land, wetlands and estuaries
Increased damage to/loss of coastal property and infrastructure and increased insurance premiums
Almost certain
Major Extreme
More hot days and heat waves
Increased frequency of fire danger index reaching high-extreme, coupled with berg-wind conditions
Risk of major and widespread loss of standing stocks and threats to financial sustainability of existing operations in the forestry sector.
Almost certain
Major Extreme
More hot days and heat waves
Increased morbidity and mortality in elderly and infirm (e.g. HIV/AIDS patients)
Increased strain on health services
Almost certain
Major Extreme
Higher mean temperatures
Coupled with increased rainfall, spread in range of diseases and vectors, including cholera, malaria and bilharzia.
General increase in occurrence of disease; exacerbation of effects on people with HIV/AIDS, the elderly and the poor.
Almost certain
Major Extreme
Increased storm severity/ Extreme weather events.
Increased storm surges coupled with sea level rise and flooding from both climate change causes and catchment hardening.
Direct threat to livelihoods, services and infrastructure in coastal low lying areas.
Almost certain
Major Extreme
Increased storm severity/ Extreme weather events.
Coupled with more intense rain, catchment hardening due to urban development, and reduced integrity of water catchments: increased risk of flooding or flash floods
Direct threat to infrastructure within flood-prone areas; Direct threat to human life.
Almost certain
Major Extreme
More hot days and heat waves
Increased frequency of fire danger index reaching high-extreme
Increased fire frequency increases direct threat to human life, threats to
Almost certain
Major Extreme

Phase 3: Climate Change Response
Eastern Cape Climate Change Response Strategy 4
livelihood and infrastructure (economic and social systems).
More hot days and heat waves
Increased morbidity and mortality in elderly and infirm (e.g. HIV/AIDS patients)
Direct threat to livelihoods and social services
Almost certain
Major Extreme
Higher mean temperatures
Increased evaporation, reduced soil moisture, reduced runoff and river baseflow.
Compounded by reduced MAP, systemic water shortages will limit economic growth potential to the south-west.
Almost certain
Major Extreme
Sea level rise
Coupled with storm surges and flood events exacerbated by catchment hardening, inundation and wave damage to coastal low lying areas.
Direct threat to livelihoods, services and infrastructure in coastal low lying areas.
Almost certain
Major Extreme
Increased storm severity/ Extreme weather events.
Crop damage from hail and wind and heavy rain
Increased risk of crop failure; threats to commercial and subsistence agriculture, rural livelihoods and food security.
Likely Major Extreme
Longer dry spells and increased likelihood/ severity of droughts
Increased risk/frequency of dryland crop-failure; Increased mortality and reduced productivity among livestock.
Threats to commercial and subsistence agriculture, rural livelihoods and food security.
Likely Major Extreme
More hot days and heat waves
Heat waves coupled with dry conditions may increase the risk of uncontrollable shack fires in informal settlements
Threat to human life. Threats to urban livelihoods and increased strain on urban disaster management systems.
Likely Catastrophic
Extreme
Increased storm severity/ Extreme weather events.
Increased frequency of storm surges
Reduced safety of personnel and increased frequency of injury or loss of life
Almost certain
Major Extreme
It should be noted that this chapter deals only with extreme risks as identified through the Climate Change Response Development Process. This does not diminish the importance of risks that have been identified as high, medium or low in the risk assessment process. The following should also be noted:
• This document is considered a first iteration, and should be regularly reviewed and developed further as information becomes available or as circumstances in the province change;
• The extreme risks identified and discussed in this document are considered cross-cutting and broadly relevant to the province. Other risks identified as high- or medium- might have higher relevance at the local scale or in the context of a particular department.
• Although certain risks might not have been assessed as extreme from the perspective and scale of the province as a whole, certain risks might be considered extreme from the perspective of a certain department, agency or locality. For example, although the risk of reduced food security may not be an extreme threat to the social and economic collapse of the province, the same risk may be an extreme threat to a rural poor household or to the mandate of the Provincial Department of Agriculture and Rural Development.

Phase 3: Climate Change Response
Eastern Cape Climate Change Response Strategy 5
• Each provincial department, municipality or other agency should apply the risk assessment process to their own circumstances and then develop internally relevant response plans.
2.1 Integrated programmes as a cross-sectoral framework for climate change adaptation
The impacts of extreme significance identified in Table 1 are broadly relevant to many sectors. It follows that responses to such impacts cannot be dealt with by each sector or department in isolation. Rather, integrated response programmes are required where multiple sectors and departments contribute to a common climate change issue to ensure effective adaptation responses. A programmatic framework for such multi-sectoral planning is described below.
Figure 2: Programmatic framework for multi-sectoral adaptive response planning. Category specific response programmes are introduced in the sections below. The detailed response programmes are set out in Appendix 1. It should be noted that the Response Programmes are working documents which require further refinement, regular review and updating. The programmes in their current format are initial proposals which require review by relevant departments or stakeholders. As such they should be considered as starter documents and not as a final product.
Common climate change impact affecting many sectors or departments
Adaptation objectives common to many sectors or departments
Cross-Cutting/Integrated Response Programme:
Mapping; Regulations; Standards and Specifications. Support Programmes
Programme Custodian: Champion and existing or new forum or committee
Programme Participants: Affected departments, agencies and sectors
1st Generation Action Plan:
Objectives, Targets, Allocation of Responsibility, KPAs, Budgets, Key Stakeholders; Relevant Policy and Legislation

Phase 3: Climate Change Response
Eastern Cape Climate Change Response Strategy 6
2.2 Adaptation Categories
The impacts of extreme significance as identified in Table 1 have been grouped into adaptive response programmes as given in Table 2 below. Table 2: Recommended programmes in response to the impacts of extreme significance identified in the systematic risk assessment.
Adaptation Category Adaptation objective
Coastal Infrastructure and Livelihoods
• Increased resilience of coastal infrastructure and resources to the effects of sea-level rise, storm-surges, flooding and increased sea temperature (fisheries).
• Improved response to the impacts of extreme coastal events.
Water Scarcity
• Mainstreaming climate change induced water scarcity in institutional decision-making and planning in water stressed areas in the Eastern Cape Province.
• Effective water resources management and efficient water use throughout the Eastern Cape Province.
Flood Management
• Flood prevention
• Reducing vulnerability to flooding events;
• Improved response to the impacts of flooding events
Responses to increased risk of wildfires • Improved wildfire prevention and suppression
Managing the effects of increased temperature on human lives
• Societal adaptation to human health impacts from temperature increases associated with climate change.
Food security • Incorporating Climate Change acclimatization and resilience in provincial food security programmes.
The details of the adaptive response options and response programmes are developed in the sections below.

Phase 3: Climate Change Response
Eastern Cape Climate Change Response Strategy 7
2.3 Coastal Infrastructure and Livelihoods
2.3.1 Overview
Coastal infrastructure and livelihoods are directly threatened by combined manifestations of Climate Change including the combined incidence of sea-level change, storm surges and flood events. Human life, coastal infrastructure and livelihoods are threatened by coastal inundation and erosion. Recent findings subsequent to the release of the IPCC 4th Assessment Report are given below. A better understanding of the behaviour of large ice sheets combined with observations of rapid melting have raised projections of 21st-century global sea level rise. New estimates of average global sea level rise by 2100 are significantly larger than in the AR4, as shown in the figure below. The AR4 projected an average sea level rise of 0.18 to 0.59 meters by the end of the 21st century. This estimate was driven mostly by the thermal expansion of the oceans as the water warms. However, due to an inability to model how ice moves in large, land-based ice sheets (i.e., the Greenland and Antarctic ice sheets), the IPCC did “not assess the likelihood, nor provide a best estimate or an upper bound for sea level rise”. The upper end of the AR4 projection should not, therefore, be interpreted as an upper limit; in fact, it likely underestimates future sea level rise.
Figure 3: Comparison of recent estimates of sea level rise in 2100, relative to 1990 levels. Sea level rise in the city of Cape Town A series of four reports under the Global Climate Change and Adaptation: A Sea-Level Rise Risk Assessment (2008) provides a comprehensive assessment of sea level rise and associated risks in the City of Cape Town. The study assesses the risks associated with sea level rise under three broad scenarios summarised below:
Description Sea level rise Impact Probability
Scenario 1 Present Day very Worst Scenario
2m in sheltered environments, 4.5m in exposed environments, and 6.5m in very exposed environments
About 25 km2 covered by the sea (1% of Cape Metro) albeit for a short time.
95% chance in next 25 years
Scenario 2 Scenario at the End of the Next Decade
Same as above but with shorter return periods Expected whenever an extreme storm occurs at same time as Equinox spring high tide
About 60 km2 covered by sea (2% of total Metro) for a short period.
85% chance in next 25 years
Scenario 3 Polar Ice Sheet Melt Scenario
6.5 metre sea-level rise linked to the melting of the Greenland and West Antarctic ice shelves, and involving permanent inundation
Permanent inundation of about 95 km2 of land around the Cape coastline (4% of Metro)
20% chance in next 25 years

Phase 3: Climate Change Response
Eastern Cape Climate Change Response Strategy 8
Excludes impacts of tidal surges and storms
Also of interest is that net ice loss will set in with a global average warming in excess of 2°C, marking the onset of an accelerating ice melt contribution to sea level rise. The complete elimination of the Greenland Ice Sheet will eventually lead to a contribution to sea level rise of 7m. These temperatures correspond to those of the last inter-glacial of 125,000 years ago, when sea level was 4 to 6 m higher than present levels. Around the Cape Peninsula the sea level at this time is reasonably well marked as the 18 foot wave cut platform.
Figure 4: Loss of infrastructure at Cape Town Harbour under 2.5m (blue), 4.5m (red) and 6.5 m (orange) sea-level rise scenarios.
2.3.2 Response Options
Response Options (answering the question: How can the province support/provide an enabling environment for risk reduction and impact mitigation?)
• Mapping of coastal land exposed to the risk of inundation and inclusion in national/provincial risk Atlas.
• Planning restrictions on - or risk averse approaches to - development in coastal low lying areas including wetlands, estuaries and shores. Inclusion of these restrictions in spatial planning.
• Promulgation of standards and specifications for applications within the coastal risk zone.
• Prioritising informal settlements within coastal risk zone for formal resettlement/allocation of social housing.
• Increased coastal defences where infrastructure is already in place (coastal roads, ports, pipelines).
• Improved catchment and stormwater management to limit compound effect of freshwater flooding.
• Development of coastal early warning systems.
• Increased support to and collaboration with Provincial and Municipal Disaster Management Centres ((Key performance area 3: Disaster management planning and implementation).
• Increased support to and collaboration with Provincial and Municipal Disaster Management Centres (Key performance area 4: Disaster response and recovery).

Phase 3: Climate Change Response
Eastern Cape Climate Change Response Strategy 9
• Development of specific response and contingency plans for key coastal infrastructure within the coastal risk zone.
For further details please see Response Programmes Section.

Phase 3: Climate Change Response
Eastern Cape Climate Change Response Strategy 10
2.4 Water Scarcity
2.4.1 Overview
Over the next 30 to 60 years, Mean Annual Runoff is projected to decrease in water catchments to the Southwest of the province (see for example Schulze et al, in press). Water resources in the Fish to Tsitsikama Water Management Area are already close to, or fully, allocated. This means that there is an absolute limit to the future availability of water resources for social and economic requirements, including requirements for basic human needs, agriculture and industrial processes. Water resource management issues in the Eastern Cape include:
• Over-abstraction of existing resources for irrigation, manufacturing and urban requirements, resulting in deterioration of downstream water quality, quantity and ecological integrity;
• Threats to water quality, quantity and aquatic ecosystem integrity due to catchment degradation;
• Threats to water quality, quantity and aquatic ecosystem integrity due to land-use change in catchments;
• Threats to water quality from sub-standard effluent releases as a result of poorly managed and poorly maintained waste-water treatment works and sewage reticulations.
• Threats to ecological integrity of fresh-water resources due to damming of existing resources.
Some of the secondary impacts of climate change on water resources include:
• Changes to baseflows and stormflows and their variabilities;
• Changes to annual streamflows and their variabilities;
• Changes to sediment yield and its variability; and
• Changes to irrigation water requirements and associated losses.
It is likely that the above threats will be compounded by the impacts of future climate change. The possibility of reduced precipitation together with increased rates of evaporation caused by climate change may result in an absolute reduction in the availability of water to the Southwest of the province. This will have major social and economic consequences. For example scarce water resources will limit growth in manufacturing and agro-industrial processing, both foundations of the local economy.
2.4.2 Response Options
Possible response options available to the province are given below.
• Promote effective water management systems and institutions.
• Develop effective and accountable catchment management agencies to ensure sustainable water use, regulation of water use, and improved monitoring.
• Undertake an integrated water resources study to determine the effects of climate change on future water supply and demand and to understand the consequences of not taking action1.
• Research and implement water demand management measures (as per successes in Cape Town)2.
1 This work to this end has been initiated through the DWA reconciliation studies.

Phase 3: Climate Change Response
Eastern Cape Climate Change Response Strategy 11
• Mainstream climate change driven water conservation and demand management in municipal decision-making (particularly Cacadu LMs and DMs).
• Optimise the re-use of waste water and avoid marine outfalls.
• Ensure avoidance of water losses through continual system maintenance and leak detection.
• Incentivise rainwater harvesting at the household and commercial scale.
• Promote education and awareness and instill a culture of water conservation.
• Promote the environmental health of water catchments including the conservation and rehabilitation of wetlands and the eradication of alien invasive vegetation.
• Promote investment in industry sectors and industrial processes that are less reliant on bulk water supply.
• Include water demand and conservation issues in the Environmental Impact Assessment Process.
• Maintain water quality standards through optimal operation and maintenance of waste-water treatment works.
• Ensure the early implementation of water restrictions during extended periods of drought.
For further details please see Response Programmes Section.
2 Water Demand Management has been initiated in parts of the Algoa and Amathole systems.

Phase 3: Climate Change Response
Eastern Cape Climate Change Response Strategy 12
2.5 Flood Management
2.5.1 Overview
Superimposed on the background of gradual increases and decreases in mean annual precipitation in the province, climate change is projected to result in less predicable, more extreme events. This will include longer and dryer dry periods; and wetter, more intense wet periods. Climate change is likely to increase not only the frequency of flooding events, but also the intensity of flood events. The increased risk of flooding due to climate change is exacerbated by the reduced ability of water catchments to absorb flood pulses. This is caused by:
• Losses of wetlands which absorb flood waters and release them over a longer period of time; and
• Catchment hardening as a result of increased urbanization and deterioration in landcover.
A complicating factor is that poorly planned urban sprawl and informal urbanisation often results in developments and human settlement taking place in flood-prone areas or within 1:10, 1:50 and 1:100 year historical flood lines. The combination of climate change, catchment deterioration and unplanned or poorly planned urban settlement is highly likely to result in disastrous future scenarios.
2.5.2 Response Options
Possible response options available to the province are given below.
• Maintain and improve the integrity of wetlands and other aquatic environments;
• Maintain and improve the integrity of water catchments;
• Reduce settlement and urban development in areas vulnerable to flooding;
• Encourage flood-water retention and increased infiltration in urban design and development;
• Map a standardized set of 1:50 and 1:100 year floodlines using projected, rather than historical, data;
• Increasing capacity in early warning and disaster management institutions, focusing on the implementation of best practices in communication (national, provincial and local) and integrated disaster response.
For further details please see Response Programmes Section.

Phase 3: Climate Change Response
Eastern Cape Climate Change Response Strategy 13
2.6 Responses to increased risk of wildfires
2.6.1 Overview
As shown in the map below, the Eastern Cape Province is prone to veld and forest fires, with the greatest frequency of fires in the east and north of the province. The risk of wildfires is a product of increased temperature and winds, reduced humidity and increased fuel load. Simulations project warmer winters and springs. Coupled with increased intensity and duration of dry periods, increased occurrence of “berg winds”, and an increased fuel load from warmer, wetter summers in the east, there is a high likelihood of increased risk of wildfires in late winter and early spring.
Figure 5: Fire frequency atlas for South Africa showing the number of fires between 2000 and 2007. Light yellow indicates 1 to 2 fires; dark red indicates more than 8 fires. Source: South African Risk and Vulnerability Atlas (2010).
2.6.2 Response Options
Possible response options available to the province are given below.
• Increased provincial support to Fire Protection Associations.
• Increased presence of Working on Fire bases in the Eastern Cape Province.
• Improved fire risk awareness (especially on days of high-extreme fire danger).
• Increased support to and collaboration with Provincial and Municipal Disaster Management Centres (KPA 2: Risk assessment and monitoring).
• Increased support to and collaboration with Provincial and Municipal Disaster Management Centres (KPA 2: Risk assessment and monitoring).
• Increased provincial support to Fire Protection Associations.
• Increased presence of Working on Fire bases in the Eastern Cape Province.

Phase 3: Climate Change Response
Eastern Cape Climate Change Response Strategy 14
• Increased support to and collaboration with Provincial and Municipal Disaster Management Centres ((Key performance area 3: Disaster management planning and implementation).
• Increased support to and collaboration with Provincial and Municipal Disaster Management Centres (Key performance area 4: Disaster response and recovery).
For further details please see Response Programmes Section.

Phase 3: Climate Change Response
Eastern Cape Climate Change Response Strategy 15
2.7 Managing the effects of increased temperature on human lives
2.7.1 Overview
Mid- to long-term projections indicate that annual average temperatures are expected to increase by approximately 2°C at the coast and by between 3°C and 4°C inland. There is also a stronger likelihood of temperature extremes (experienced as heat waves). These climate changes are expected to have negative effects on human health, including the following:
• An increase in the frequency of heatwaves is indirectly linked to increased deaths among children, the elderly and the infirm (with particularly risk to those with HIV/AIDS). Poor communities with inadequate housing and services are particularly prone to the effects of heat-waves.
• Increased mean temperature coupled with increased rainfall has already been demonstrated to result in the spread in range of vector-borne diseases. This includes malaria, cholera and tick-borne diseases.
• Increased rainfall and temperature increases the risk of food-borne and water-borne infections.
The direct effects of increased temperature on human lives should be considered in combination with other indirect effects of climate change on social and economic systems, such as the effect of increased floods and droughts on poor communities. In particular, poor households relying on subsistence agriculture are particularly prone to a complex of health and livelihood issues that are exacerbated by climate change.
Figure 6: Diagram illustrating the link between climate change and effects to human health (Source: WHO, 2003).
2.7.2 Response Options
Possible response options available to the province are given below.
• Improved passive thermal design standards for social housing (for example adoption of SANS 204).
• Accelerated provision of formal/social housing.

Phase 3: Climate Change Response
Eastern Cape Climate Change Response Strategy 16
• Reduction in co-stressors among urban and rural poor to improve resilience (for example improved nutrition, water and sanitation, wellness).
• Education for shack fire prevention.
• Promotion of safe fuels and cooking/lighting facilities in informal settlements (the use of paraffin, candles and open fires in informal settlements for energy needs is a primary cause of runaway shack fires).
• Increased readiness of emergency and health services during heat waves.
• Dedicated heat-stress response equipment in community clinics.
• Installation of fire hydrants in informal settlements.
• Increased support to and collaboration with Provincial and Municipal Disaster Management Centres (Key performance area 4: Disaster response and recovery).
• Development of specific response and contingency plans for key coastal infrastructure within the coastal risk zone.
For further details please see Response Programmes Section.
Phase 3: Climate Change Response
Eastern Cape Climate Change Response Strategy 17
2.8 Food security
Poor communities and the social and economic structures of the province are sufficiently at risk to warrant the development of a “Food Security” response programme under the Eastern Cape Climate Change Response Strategy.
2.8.1 Overview
The Southern African Regional Climate Change Programme notes the following in regard to the impacts of Climate Change on food security:
“Scientists predict that the greater variability in and volatility of temperature and rainfall cycles in Africa resulting from climate change will alter the land area suitable for agricultural or livestock production, while increasing the frequency of flooding and drought. Grain yields are expected to decline due to increased rainfall variability, which may result in the need for grain imports, increasing the food prices and hence the cost of living. Desertification rates are also expected to increase. Poor people are most vulnerable to climate change. This is due partly to the fact that poverty is often linked to a higher reliance on natural resources—for example when farming for subsistence. This exacerbates their vulnerability, leading to further degradation of natural resources and creating a vicious circle of yet more environmental degradation and even greater vulnerability. Impacts on agriculture include the degree to which crops/farmers can adapt to changing climates, the suitability of specific staple or cash crops in marginal regions, and the threat of increasing variability in the form of higher frequency of dry or wet years”.
Although food security is considered as an issue which relates mostly to poor communities, it should be noted that food security also represents a strategic risk to the Province. This has particular reference to the possibility of future food price shocks related to global population expansion and issues of future water scarcity and oil scarcity associated with the notion of “peak oil”. The stronger the provincial commercial and subsistence food production system, the less vulnerable the Province is to food price and scarcity shocks.
2.8.2 Response Options
Possible response options available to the province are given below.
• Promote the planting of crops that are appropriate to a climate and soil region, and that are able to withstand climate extremes.
• Promote the harvesting and storage of water at the subsistence level.
• Promote the adoption of cultivation techniques that improve soil moisture retention and general crop resilience.
• Prioritise support to existing food security programmes.

Phase 3: Climate Change Response
Eastern Cape Climate Change Response Strategy 18
3 GREENHOUSE GAS EMISSIONS MITIGATION
Phase II introduced various technologies appropriate for Greenhouse Gas mitigation in the Province. The current section describes the greenhouse gas impact sources of highest categories and outlines possible mitigation action plans for the Province.
Greenhouse gas emission mitigation programmes should respond to emission sources of the highest significance. Figure 7 highlights the emissions source category of the highest significance, which in the case of South Africa and the Eastern Cape are energy sources from the combustion of fossil fuels (power stations, transport, furnaces and boilers, and others). A systematic method for developing mitigation opportunities and programmes involves an evaluation of emissions source categories (see Figure 8). The categories used in this report are the same as those used for the South African Greenhouse Gas Inventory and IPCC guidelines for Greenhouse Gas Inventories (2006).
Figure 8: Framework for source-category based evaluation of emissions reduction targets and opportunities.
The framework described in Figure 8 is further developed in Table 3.
Evaluate Emissions Sources
Energy: Define and Evaluate Mitigation
Options
Waste: Define and Evaluate Mitigation
Options
AFoLU: Define and Evaluate Mitigation
Options
IPPU: Define and Evaluate Mitigation
Options
Integrated Mitigation Programmes
GHG Emissions (Gg CO2eq)
435,461.00
344,106.00
61,469.00
20,493.009,392.00
38,991.2726,124.89
244.4710,734.32
1,887.600.00
50,000.00
100,000.00
150,000.00
200,000.00
250,000.00
300,000.00
350,000.00
400,000.00
450,000.00
500,000.00
TOTAL 1.Energy 2. Industrial Processes and ProductUse
3. Agriculture, Forestry and OtherLand Use (AFOLU)
4. Waste
Gg CO2eq
National EC Province
Data gaps
Figure 7: Greenhouse gas emissions in the Eastern Cape (2008) relative to emissions for South Africa as a whole (2000) – See GHG section of Phase I report.

Phase 3: Climate Change Response
Eastern Cape Climate Change Response Strategy 19
Table 3: First order matrix for the evaluation of targets and opportunities according to emissions categories.
National (2000)
EC Prov (2008)
Opportunities for Abatement
Opportunities for sequestration National Targets
Quantified Targets for EC
Activity Targets for EC
Gg CO2e Gg CO2e Quantity Activity Detail
TOTAL
435,461.00 38,991.27
Copenhagen Accord Pledge: 34% below business as usual by 2025.
Climate Change Response Policy White Paper 2010; SAAQIS.
1.Energy
344,106.00 26,124.89
Energy Efficiency, Renewable Energy, Cogeneration including utilization of waste gases and heat.
Carbon Capture and Storage
IRP II; RE White-Paper Review.
2. Industrial Processes and Product Use
61,469.00 244.47 Adoption of low-carbon technologies
Carbon Capture and Storage Not known
Mandatory emissions reporting for scheduled processes.
Monitoring and Support for SAAQIS reporting
3. Agriculture, Forestry and Other Land Use (AFOLU)
20,493.00 10,734.32
Methane destruction and low carbon management practices.
Increased density and extent of soil and above-ground biomass stocks Not known Not known
Emission reductions mainstreamed into Landcare, WfW and DoA objectives.
4. Waste
9,392.00 1,887.60
Low Carbon Waste Management Practices and Methane Capture, Use and Destruction
Disposal of biochar Not known
NEM:Waste Management.
Number waste sorting facilities in operation; % Landfills offering incentives for separated organic waste. Number facilities offering facilities for beneficiation of organic waste.
High confidence in input data Medium confidence in input data
Low confidence in input data or no data available

Phase 3: Climate Change Response
Eastern Cape Climate Change Response Strategy 20
As with adaptation, mitigation activities would be relevant to many sectors. This means that mitigation activities should not be dealt with by each sector or department in isolation. Rather, integrated mitigation programmes are required where multiple sectors and departments contribute to a common mitigation objective. As with adaptation, a programmatic framework for such multi-sectoral mitigation planning is described in Figure 9 below.
Figure 9: Framework for multi-sectoral mitigation programmes.
Drawing from phase two of the ECCCRS process and from the framework for source-category based evaluation of emissions reduction targets and opportunities, a set of pragmatic greenhouse gas mitigation programmes is proposed. These are developed in the section below and introduced in Table 4 below.
Table 4: Proposed integrated mitigation programmes. Mitigation Category Mitigation objective
Mainstreaming GHG Mitigation in Provincial and Local Government and in Industry
• Mainstreaming GHG Mitigation in Decision-making at all levels of government within the Eastern Cape Province
• Promoting GHG Mitigation in Provincial and Local Government Operations.
• Promoting Greenhouse Gas Reporting in Industry.
Promotion of Renewable Energy in the EC
• Create an enabling environment for investment in, implementation and use of clean energy in the Eastern Cape.
Mitigation and opportunities for Rural Livelihoods
• Facilitate integrated lead projects that promote sustainable livelihoods and local economic development while achieving (tradable) emission reductions.
Mitigation in Solid Waste and Wastewater Treatment
• Reduction in organic waste to landfill, renewable energy from waste, and methane use or destruction.
Greenhouse Gas Mitigation in Transport
• Facilitate shift to low greenhouse gas modes of transport and transport systems.
Category specific mitigation programmes are introduced in the sections below. The detailed programmes are set out in Appendix 2. It should be noted that the Mitigation Programmes are working documents which require regular review and revision. The programmes in their current format are initial proposals which require review by relevant departments or stakeholders. As such they should be considered as starter documents and not as a final product.
Greenhouse gas mitigation opportunities common to many departments
Mitigation objectives common to many departments
Cross-Cutting/Integrated Response Programme:
Regulations; Standards and Specifications; Support Programmes
Programme Custodian: Champion and existing or new forum or committee
Programme Participants: Participating departments, agencies and sectors
1st Generation Action Plan:
Objectives, Targets, Allocation of Responsibility, KPAs, Budgets, Key Stakeholders; Relevant Policy and Legislation

Phase 3: Climate Change Response
Eastern Cape Climate Change Response Strategy 21

Phase 3: Climate Change Response
Eastern Cape Climate Change Response Strategy 22
3.1 Mainstreaming GHG Mitigation in Provincial and Local Government
3.1.1 Overview of the issue and opportunity
• South Africa has a per-capita carbon footprint (Greenhouse Gas Emissions Footprint) that is higher than the international average. These emissions, no matter where they originate from, contribute directly to global warming which causes climate changes.
• South Africa is a signatory to the Kyoto Protocol and is therefore obligated to combat climate change.
• In December 2009 and January 2010 at the Copenhagen Accord the presidency pledged a 34% reduction in emissions below business as usual by 2025;
• All entities, including those in the Eastern Cape, have a responsibility to collectively contribute to a reduction in Greenhouse Gas Emissions caused by human activities.
• As per Section 29 of the National Environmental Management: Air Quality Act, the National Minister or Provincial MEC has the power to declare Greenhouse Gasses as Priority Air Pollutants. Entities emitting within the given category will need to submit and implement pollution prevention plans.
• As per Section 26 of the National Environmental Management: Air Quality Act, the National Minister or Provincial MEC has the power to declare fossil fuels as Controlled Fuels. This allows among others, the opportunity to
• Establish standards for the use of the controlled fuel in combustion processes;
• Establish standards for the manufacture or sale of the controlled fuel;
• Establish specifications for the composition of controlled fuels;

Phase 3: Climate Change Response
Eastern Cape Climate Change Response Strategy 23
3.2 Promotion of Renewable Energy in the EC
3.2.1 Overview of the issue and opportunity
Effective implementation of services which can benefit from technologies which mitigate GHG emissions is highly dependent on a good regulatory and institutional environment. Key regulatory mechanisms in the Renewable Energy (RE) Industry include: • Procurement guidelines and procedures for renewable energy services; • Standards and Codes of Practice; • Secure and long-term access to markets; • Licensing and permitting; and • Clear guidance and mechanisms for RE – inclining block tariffs. A key question is the institutional environment for regulatory oversight. At this stage, in the electricity sector, the centralised, highly regulated, bureaucratic energy generation and transmission sector is arguably constricting the development of an independent RE production sector in the province. Either decentralisation or deregulation is required, or an enabling institutional framework (in which real capacity exists) should be set up. Conversely, local planners could use regulations to encourage technology rollout by linking requirements for energy efficiency and other technology options into planning permissions (building plans, rezoning, EIA RODs, SDFs). However, for these requirements to have any effect, they need to be backed up by legislation, adopted policy, guidelines and/or scientific evidence of effectiveness. Furthermore, the role of renewable energy is broader than only electricity generated on the national grid from renewable energy and includes direct and on-site provision of energy services, such as heated water, and decentralized (off grid) generation of electricity or gas. It is apparent that three bottlenecks to unlocking the industry exist in the Province, namely:
• Institutional fragmentation and lack of clarity, information and support in regard to (among others):
• Licensing;
• Permitting;
• Environmental authorisation;
• Zoning and municipal permission;
• Power purchase agreements;
• Grid access and transmission codes of practice;
• Regulatory conditions; and
• Access to incentives.
The above deterrents to investment can be overcome at the provincial level by the formation of a provincial renewable energy board or investment one-stop-shop to coordinate or streamline the regulatory process, facilitate access to decision-makers, and guide the investor through the various regulatory hurdles associated with independent power production.
• Independent access to markets. In other words, where Independent Power Producers (IPPs) are not selected for Eskom/DoE/Independent System Operator Power Purchase Agreements, they should have recourse to independently supplying directly to purchasers of clean energy. The province can facilitate an independent Clean Energy Market in order to attract investors through the formation of a Clean Energy Purchasing Power Pool, or supporting the independent brokerage of clean energy. Ideally such arrangements would resolve the difference between the long term investment cycle of IPPs (20 years) and the short term purchase cycle of industry (3 to 5 years).

Phase 3: Climate Change Response
Eastern Cape Climate Change Response Strategy 24
• Investors are currently deterred by the lack of supporting services and infrastructure in the province. In particular there is a requirement for appropriate skills, testing facilities, R&D facilities and maintenance services. The province can improve the RE investment climate by establishing a Clean Energy Centre or Clean Energy Incubator. Such a centre should incorporate, among others:
• Technology testing and certification facilities;
• Training and skills development facilities;
• Research and development facilities.

Phase 3: Climate Change Response
Eastern Cape Climate Change Response Strategy 25
3.3 Mitigation and Opportunities for Sustainable Livelihoods
3.3.1 Overview of the issue and opportunity
Although GHG emissions primarily occur as a result of urban and industrial activity, opportunities exist in rural areas for emission mitigation projects. Mitigation projects have a high employment ratio and therefore go hand in hand with rural development projects. Climate change mitigation has the potential to reform rural-urban settlement relationships and patterns. The potential of renewable energy for sustainable settlements and local economic development is illustrated by the example of the experimental biomass gasification unit at Melanie Village near Alice in the Tyume River valley (Mamphweli and Meyer 2008). The system is designed to run a 200 kW generator at 75% capacity, utilising 150 kg of biomass per hour. Biomass feedstock is sourced from wood waste generated at a nearby sawmill. The wood waste would otherwise be incinerated. Energy generated from biomass residue is considered to be renewable. 200kW of electricity generated for 16 hours a day for a year produces 1,168 MWh of renewable electricity. This results in avoided emissions from coal fired power stations of 1,144 tons of CO2e. In addition to renewable energy generation, the project is intended as a rural community upliftment initiative. Ten previously unemployed people have been contracted and trained as gasifier operators. The draft business plan indicates that employee numbers could be doubled through establishment of small business enterprises. Those activities identified in the business plan will need new skills, requiring funding for skills-development. The electricity generated from the producer gas will be available to a bakery and a grain mill, and business plans for these two enterprises have been completed .
Figure 10: The 200kW gassifier installed at Melani village north of the Alice Campus. Source and Photo: S Mamphweli. Other opportunities exist in carbon sequestration from reforestation and sustainable landuse management practices; and waste to energy projects.

Phase 3: Climate Change Response
Eastern Cape Climate Change Response Strategy 26
3.4 Mitigation in Solid Waste and Wastewater Treatment
3.4.1 Overview of the issue and opportunity
Organic waste contributes to Greenhouse Gas Emissions by the release of methane gas through decomposition under anaerobic conditions (in other words when the waste is not exposed to air). Methane gas has 21 times the greenhouse gas effect of Carbon dioxide. In other words, 1 ton of methane is the equivalent of 21 tons of Carbon dioxide. Methane gas is most often generated when organic waste such as garden waste, wood, food waste, paper and cardboard are disposed of at landfill, or when sewage sludge or wastewater/effluent is treated in anaerobic digesters or in certain settling ponds where the biogas is allowed to vent to the atmosphere. Greenhouse gas emissions from solid waste can be avoided by the diversion of organic waste streams from landfill and the conversion to compost (composting does not generate methane) or conversion to energy. Emissions from waste-water can be avoided through the capture of methane and use as an energy source. Greenhouse gas emissions are also caused through the inefficient use of electricity in waste-water treatment. Certain treatments systems and technologies are more efficient than others.

Phase 3: Climate Change Response
Eastern Cape Climate Change Response Strategy 27
3.5 Greenhouse Gas Mitigation in Transport
3.5.1 Overview of the issue and opportunity
The combustion of petrol, diesel and aviation fuel accounted for the emission of 13,494,876 tons of Carbon Dioxide in the Eastern Cape in 2008. This represents more than half of emissions from all energy sources and 35% of emissions from all sources combined in the province. Private passenger transport is the dominant mode in the transport sector and accounts for the majority of fuel use. Even a 10% shift from private to public modes of passenger transport will result in a significant reduction in Greenhouse Gas Emissions and local air pollution. The deputy minister of transport, on the 26th of October 2010, noted the following in regard to green transport (Engineering News Online 27/10/2010):
• Removing excess road use and improving efficiencies on South Africa's roads seems to be the most viable option to reducing the transport sector's carbon emissions in the short term.
• South Africans, especially middle-class users, are largely still dependent on the use of private vehicles.
• It is necessary to make it more expensive for people and freight to use their cars and trucks on the roads and move them onto other modes of transport
• Viable transport alternative would be required, which would take significant investment to put in place.
• The absence of significant investment over the last 30-plus years has lead to the degradation of the country's rail system. It will cost more to refurbish the system than to recapitalise it and procure new systems.
• The recapitalisation would take place in stages over the next 18 years.
• The recapitalisation will have a strong local focus in terms of procurement and manufacturing of the fleet and technologies.
The World Watch Institute recommends the following for a shift to greener transport systems:
• Substantial and sustained investments in rail and light rail (while limiting highway spending principally to repairs of crumbling infrastructure such as bridges).
• Overhauling policies to stimulate denser settlements that permit public transit, reduce reliance on motorized transportation, and make biking and walking realistic options.
• Overall, such a course would stimulate innovation, reduce carbon emissions and air pollutants, inject urban and suburban areas with new vigor and vitality, and generate or retain large numbers of well-paying jobs.
A shift from private road transport to other forms of transport would facilitate improved fuel efficiency per passenger kilometre.

Phase 3: Climate Change Response
Eastern Cape Climate Change Response Strategy 28
Table 5: Passenger fuel efficiency for five passenger transport modes (Source: UNEP 2008)

Phase 3: Climate Change Response
Eastern Cape Climate Change Response Strategy 29
4 CLIMATE CHANGE RESPONSE FINANCE AND SUPPORT
In many instances Climate Change response projects are expected to require funding beyond local and national budgetary capacity. This is illustrated by the United Nations Convention Framework on Climate Change report on climate change finance (UNFCCC 2007). The report notes that additional investment and financial flows in 2030 to address climate change is likely to amount to 0.3 to 0.5% of global domestic product in 2030 and 1.1 - 1.7% of global investment in 2030. The annual cost for developing countries to adapt to a changing climate has been estimated by the UNFCCC Secretariat at $28-67 billion in 2030 (Caravani et al 2010). The UNFCCC (2007) report states that mitigation measures needed to return global greenhouse gas emissions to current levels by 2030 require an increase in global investments and financial flows of between USD 200-210 billion per annum. The report notes that huge investment flows are needed in the energy sector. For energy supply US$ 432 billion is projected to be invested annually into the power sector. Of this amount, US$ 148 billion needs to be shifted to renewable energy, Carbon Dioxide Capture and Storage (CCS), nuclear and hydro. Investment into fossil fuel supply is expected to continue to grow, but at a reduced rate. Failure to achieve changes in investment and financial flows for mitigation will lead to unsustainable development paths and “lock-in” effects for the next 20-30 years. This will lead to higher emissions, more climate change impacts, and larger investment and financial flows needs for adaptation in the longer-term. In regard to adaptation, particular attention will need to be given to developing countries. While only 20-25 per cent of investment currently occurs in developing countries, due to expected rapid economic growth, a large share of investment and financial flows will be needed in developing countries. As a result of their economic growth, the energy demand in developing countries will increase substantially.
4.1 Multilateral and Bilateral Finance for Climate Change Response
The obligation of developed countries to assist developing countries in responding to climate change is well recognizes. Numerous Multilateral and Bilateral sources of finance for climate change response are available. Details are given in the tables below. For a detailed list of projects, see Appendix 3.

Phase 3: Climate Change Response
Eastern Cape Climate Change Response Strategy 30
Table 6: Multilateral and Bi-Lateral Climate Change adaptation and mitigation funds (Source: http://www.climatefundsupdate.org/listing 2010) Fund Type Administered by Areas of focus Date
operational Adaptation Fund Multilateral Adaptation Fund Board Adaptation 2009
Amazon Fund (Fundo Amazônia) Multilateral Brazilian Development Bank (BNDES) Mitigation - general, Adaptation, Mitigation - REDD 2009
Clean Technology Fund Multilateral The World Bank Mitigation - general 2008
Congo Basin Forest Fund Multilateral African Development Bank Mitigation - REDD 2008
Environmental Transformation Fund - International Window Bilateral Government of the United Kingdom Mitigation - general, Adaptation 2008 Forest Carbon Partnership Facility Multilateral The World Bank Mitigation - REDD 2008
Forest Investment Program Multilateral The World bank Mitigation - REDD 2009
GEF Trust Fund - Climate Change focal area Multilateral The Global Environment Facility (GEF) Mitigation - general, Adaptation 2006 GEF Trust Fund - Climate Change focal area (GEF 5) Multilateral The Global Environment Facility (GEF) Mitigation - general, Adaptation 2010
Global Climate Change Alliance Multilateral The European Commission Mitigation - general, Adaptation, Mitigation - REDD 2008 Global Energy Efficiency and Renewable Energy Fund Multilateral European Commission Mitigation - general 2008
Hatoyama Initiative - private sources Bilateral Government of Japan Mitigation - general, Adaptation 2008
Hatoyama Initiative - public sources Bilateral Government of Japan Mitigation - general, Adaptation 2008
Indonesia Climate Change Trust Fund Multilateral Indonesia’s National Development Planning Agency Multiple foci 2010
International Climate Initiative Bilateral Government of Germany Mitigation - general, Adaptation, Mitigation - REDD 2008
International Forest Carbon Initiative Bilateral Government of Australia Mitigation - REDD 2007
Least Developed Countries Fund Multilateral The Global Environment Facility (GEF) Adaptation 2002
MDG Achievement Fund – Environment and Climate Change thematic window
Multilateral UNDP Mitigation - general, Adaptation 2007
Pilot Program for Climate Resilience Multilateral The World Bank Adaptation 2008
Scaling-Up Renewable Energy Program for Low Income Countries
Multilateral The World Bank Mitigation - general 2009
Special Climate Change Fund Multilateral The Global Environment Facility (GEF) Adaptation 2002
Strategic Climate Fund Multilateral The World Bank Mitigation - general, Adaptation, Mitigation - REDD 2008 Strategic Priority on Adaptation Multilateral The Global Environment Facility (GEF) Adaptation 2004
UN-REDD Programme Multilateral UNDP Mitigation - REDD 2008

Phase 3: Climate Change Response
Eastern Cape Climate Change Response Strategy 31
Table 7: Multilateral and Bi-Lateral Climate Change adaptation and mitigation funds – pledged and disbursed (Source: http://www.climatefundsupdate.org/listing 2010).
Fund Acronym Pledged (USD mn)
Disbursed (USD mn)
Date operational
Adaptation Fund AF $197.05 $9.46 2009
Amazon Fund (Fundo Amazônia) FA $1,000.00 $59.91 2009
Clean Technology Fund CTF $4,387.75 $9.30 2008
Congo Basin Forest Fund CBFF $165.00 $17.42 2008
Forest Carbon Partnership Facility FCPF $221.24 $4.41 2008
Forest Investment Program FIP $562.10 $2.00 2009
GEF Trust Fund - Climate Change focal area (GEF 4) GEF4 $1,032.92 $1,023.49 2006
GEF Trust Fund - Climate Change focal area (GEF 5) GEF5 $1,359.38 $0.00 2010
Global Climate Change Alliance GCCA $204.15 $8.10 2008
Global Energy Efficiency and Renewable Energy Fund GEEREF $169.50 $0.00 2008
Hatoyama Initiative HI $15,000.00 $5,319.89 2008
International Climate Initiative ICI $519.60 $258.02 2008
International Forest Carbon Initiative IFCI $243.57 $66.10 2007
Least Developed Countries Fund LDCF $221.45 $141.96 2002
MDG Achievement Fund – Environment and Climate Change thematic window MDG $89.50 $61.84 2007
Pilot Program for Climate Resilience PPCR $981.84 $9.01 2008
Scaling-Up Renewable Energy Program for Low Income Countries SREP $300.13 $0.00 2009
Special Climate Change Fund SCCF $147.78 $97.17 2002
UN-REDD Programme UN-REDD $87.10 $38.19 2008
$26,890.06 $7,126.27
4.2 National and Local Sources of finance
A sample of grants and funds available in South Africa is given below:
• Finance and Subsidies offered through the Department of Energy (DoE) Renewable Energy Finance and Subsidy Office (REFSO).
• Funds Managed by the Industrial Development Corporation (IDC). The IDC has been tasked with raising R12 Billion in capital to fund the growth of South Africa’s green industrial economy. The fund will be allocated for renewable energy generation; manufacturing downstream components; resources and waste management; and energy management.
• The World Bank's Clean Technology Fund: In November 2010, the World Bank Clean Technology Fund announced its intention to invest US $85-million in renewable energy and co-generation projects in South Africa.
• Development Bank of Southern Africa: The DBSA has a strong focus on funding environmentally beneficial projects.
4.3 Other sources of support
It should be noted that support may not necessarily be purely in the form of lump sums of money. Other forms of support include:

Phase 3: Climate Change Response
Eastern Cape Climate Change Response Strategy 32
• The secondment of human resources for dedicated climate change posts within critical departments;
• The financing of training and capacity development;
• Mentoring programmes.
Phase 3: Climate Change Response
Eastern Cape Climate Change Response Strategy 33
5 INSTITUTIONAL ARRANGEMENTS FOR PROVINCIAL CLIMATE CHANGE RESPONSE
5.1 National Institutional Arrangements
(The following is taken from the brief developed for this project by IMBEWU Sustainability Legal Specialists.) Climate change is the ultimate cross-cutting issue, which concerns each sphere of the South African Government (national, provincial and municipal). It is also indicated in the South African Green Paper on Climate Change (2010) that most of the actions in terms of climate change will take place at the provincial and municipal levels (the traditional implementation spheres of the South African Government). The national government is traditionally responsible for defining the national policy and regulatory framework in terms of a specific matter. The national government also traditionally determines the strategic direction and approach to address a specific matter. Within the national government, all national departments have to integrate climate change considerations within their area of jurisdiction. Traditionally, the role of the various national departments can be categorised as follows:
• The DEA is the lead department in terms of climate change.
• There are also other keys departments which strongly support the DEA in defining the actions to address climate change, from a mitigation and adaptation perspective.
• Then they are other departments which are qualified as supporting departments as they will strongly assist in developing and addressing the required supporting tools necessary to implement the proposed actions and interventions determine by the keys departments.
This categorisation is not an official one, but it has been developed by IMBEWU to facilitate the understating of the roles of the various national departments. According to the South African Green Paper on Climate Change (2010), climate change considerations have to be integrated and mainstreamed in the actions of all national departments, all government spheres and all organs of state. There are also other stakeholders, which should be considered and engaged with, including business and industry, civil society, organised labour and the science community. Various coordinating entities (formal and informal) also exist to facilitate co-operative governance The following diagram presents an overview of the current institutional framework relevant in terms of climate change.

Phase 3: Climate Change Response
Eastern Cape Climate Change Response Strategy 34
LEAD
DEPARTEMENT
KEY
DEPARTEMENTS
SUPPORTING
DEPARTEMENTS
Department of Environmental Affairs
(DEA)
Lead department to develop the national climate change policy
Department of Agriculture, For-
estry and Fishery DAFF
Department of Coopera-
t ive Govern-ance
Department of Energy
DoE
Ministry of Economic
Development
Department of Higher Edu-
cation and Training
Department of Inter-national Relations
and Cooperation DIRC
Department of Labour
Department of Mineral
Resources DMR
National Treasury
Department of Public
Enterprises DPE
Department of Public
Works DPW
Department of Rural Development and
Land Reform DRDLR
Department of Science and
Technology DST
Department of Social Devel-
opment DSD
Department of Trade and
Industry DTI
Department of Tourism
Department of Transpor
DoT
DEA
Natural Resources including water
CABINET and PRESIDENCY (including the Ministry for National Plan-
ning and for Performance, Monitoring, Evaluation and Administration
Inter-Ministerial Committee on Climate Change
Coordination committee at Cabinet (executive level) to ensure coordina-t ion and alignment of actions with national policies and legislat ion.
Intergovernmental
Committee on Climate Change
Exchange of in formation, consultation,
agreement assistance and support among the spheres of government.
The Clusters of the Froum of South African Directors-General (FOSAD
Clusters)
• Economic sectors and employ-
ment
• Infrastructure development
• International Cooperation,
trade and security
They Provide guidance and strategic
leadership
ADAPTATION MITIGATION
Coordinating entities
MINMEC, MINTECH and tech-nical working groups
South African Local Government Association (SALGA)
NATIONAL GOVERNMENT
PROVINCIAL GOVERNMENT
LOCAL GOVERNMENT
MUNICIPALITIES
OTHER STAKEHOLDERS
CIVIL SOCIETY
i.e. WWF, Earthlife, WWF, religious and
other communities based NGO’s
SOUTH AFRICAN INSTITUTIONAL FRAMEWORK RELATED TO CLIMATE CHANGE
INDUSTRY and BUSINES
Main sectors in terms of adaptation: water, agricul-ture, human health, and others natural resources
sector (terrestrial, marine, commercial forestry and
fisheries
ORGANISED LABOUR
i.e. Unions
SCIENCE COMMUNITY
i.e. CSIR, universities,
NEDLAC (The National Economic Devel-
opment and Labour Council)
BUSA Business Unity South Africa
NBI National Business Initiative
Sectoral chambers (i.e . Chamber of Mine), Foundations (Fossil
Fuels Foundation of Southern Africa) associations, groupings)
Informal Groups
National Committee on Climate Change
Advise and consult Multidisciplinary
Public/Private interactions

Phase 3: Climate Change Response
Eastern Cape Climate Change Response Strategy 35
5.2 Provincial Institutional Arrangements
The development of institutional arrangements for the climate change response strategy is beyond the scope of the current process. However, since climate change response is entirely cross-cutting and can only be achieved through coordination among many departments, the strategy is best situated in conjunction with other relevant provincial plans and policies including the Provincial Growth and Development Plan, the Provincial Spatial Development Plan and the Provincial Industrial Development Strategy. Key supporting competencies (in addition to Department of Economic Development and Environmental Affairs) include the Office of the Premier, Treasury and Local Government and Traditional Affairs (who hold the competencies for planning, disaster management and local government).
Phase 3: Climate Change Response
Eastern Cape Climate Change Response Strategy 36
6 REFERENCES
Boko, M., I. Niang, A. Nyong, C. Vogel, A. Githeko, M. Medany, B. Osman-Elasha, R. Tabo and P. Yanda, 2007: Africa. Climate Change 2007: Impacts, Adaptation and Vulnerability. Contribution of Working Group II to the Fourth Assessment Report of the Intergovernmental Panel on Climate Change, M.L. Parry, O.F. Canziani, J.P. Palutikof, P.J. van der Linden and C.E. Hanson, Eds., Cambridge University Press, Cambridge UK, 433-467. CSIR, 2010: South African Risk and Vulnerability Atlas. Intergovernmental Panel on Climate Change (2006) Eggleston HS., Buendia L, Miwa K, Ngara T and Tanabe K (eds) 2006 IPCC Guidelines for National Greenhouse Gas Inventories (Volume 1-5), Prepared by the National Greenhouse Gas Inventories Programme, Published by Institute for Global Environmental Strategies, Japan. Mamphweli S., Meyer E., 2008: A biomass gasification project in the rural Eastern Cape. S. Afr. j. sci Schulze, BC Hewitson, KR Barichievy, MA Tadross, RP Kunz, TG Lumsden, DJM Dlamini, MJC Horan & DM Knoesen, In Press: Regional aspects of climate change and their secondary impacts on water resources. WRC Report No. 1562/1/13. November 2009 World Health Organisation, 2003: Climate Change and Human Health - Risks and Responses. WHO, UNEP, WMO.
United Nations Environment Programme (UNEP) 2008: Green Jobs: Towards Decent Work in a Sustainable, Low-Carbon World, UNEP/ILO/IOE/ITUC, September 2008. UNFCCC (United Nations Framework Convention on Climate Change). (2007). Investment and Financial Flows to Address Climate Change.S Bonn, Germany: UNFCC. unfccc.int/cooperation_and_support/financial_mechanism/items/4053.php

Phase 3: Climate Change Response
Eastern Cape Climate Change Response Strategy 37
Appendix 1: Adaptation Programmes
Please note that the Response Programmes are working documents which require further development, annual review and modification. The programmes in their current format are initial proposals which require review by other departments or stakeholders. As such they should be considered as starter documents and not as a final product.

Phase 3: Climate Change Response
Eastern Cape Climate Change Response Strategy 38
Coastal Infrastructure and Livelihoods

39 CONTROLLED DOCUMENT - REFER TO LATEST VERSION DMS
Date: August 2010
Revision No: Draft for development
Prepared By:
DEDEA
CLIMATE CHANGE PROGRAMME ------------- Adaptation
Approved By:
CC Programme Coastal Infrastructure and Livelihoods
Programme Custodian
Provincial Coastal Committee (PCC)3
Objective(s): Overall objective:
• Increased resilience of coastal infrastructure and resources to the effects of sea-level rise, storm-surges, flooding and increased sea temperature (fisheries).
• Improved response to the impacts of extreme coastal events. Sub-objectives: 1 Mainstreaming of coastal climate change adaptation in institutional decision
making and planning, with consolidated planning processes and frameworks. 2 Improved data availability (access to and distribution of information). 3 Improved capacity for disaster prevention and response.
Target(s): Targets:
• Inclusion of vulnerable coastal areas and coastal vulnerability considerations in provincial and municipal planning (e.g. SDFs , SDPs, IDPs , EMFs and provincial departmental plans) by 2012.
• Promulgation, development and/or updating of regulations, specifications and/or standards for infrastructure within vulnerable or susceptible coastal areas.
• Inclusion of Climate Change based coastal vulnerability in the strategic planning and development planning of programme stakeholders by 20xx
• Completion of a high resolution coastal vulnerability mapping exercise by 20xx (including sea level rise and inundation scenarios).
• Natural and artificial coastal defenses need to be strengthened and maintained.
• Sufficient allocation of budget and human resources to disaster management institutions in regard to coastal related issues by 20xx. Explore the formation of a coastal disaster relief fund4.
• Research on the threats to the livelihoods of poor communities within, or relying on, vulnerable coastal resources5.
• Development of a coastal early warning and response system.
3 Note that the Membership and function of the PCC with respect to climate change response needs to be clear. The TOR on Climate Change response needs to be unambiguous. 4 Explore alternative funding sources such as climate change adaptation funds. 5 Explore the options for diversification from reliance on coastal resources. Consider not only subsistence livelihoods, but also commerce and tourism.
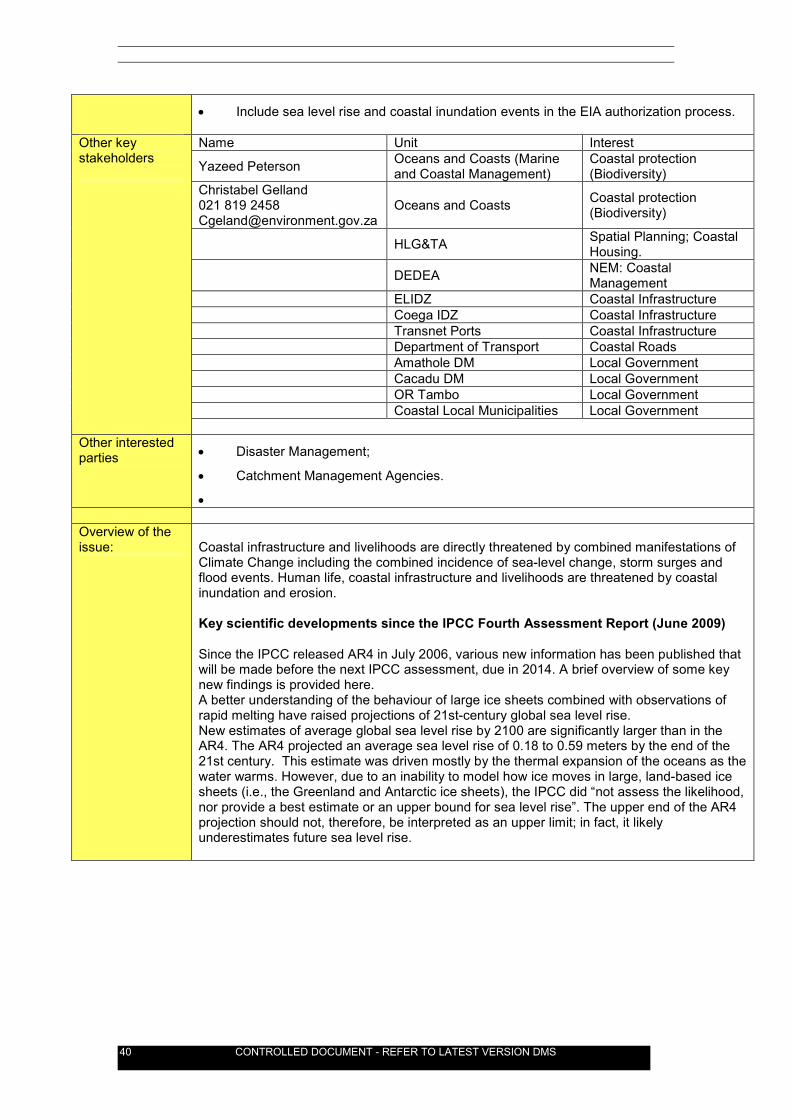
40 CONTROLLED DOCUMENT - REFER TO LATEST VERSION DMS
• Include sea level rise and coastal inundation events in the EIA authorization process. Name Unit Interest
Yazeed Peterson Oceans and Coasts (Marine and Coastal Management)
Coastal protection (Biodiversity)
Christabel Gelland 021 819 2458 [email protected]
Oceans and Coasts Coastal protection (Biodiversity)
HLG&TA Spatial Planning; Coastal Housing.
DEDEA NEM: Coastal Management
ELIDZ Coastal Infrastructure Coega IDZ Coastal Infrastructure Transnet Ports Coastal Infrastructure Department of Transport Coastal Roads Amathole DM Local Government Cacadu DM Local Government OR Tambo Local Government Coastal Local Municipalities Local Government
Other key stakeholders
Other interested parties
• Disaster Management;
• Catchment Management Agencies.
• Overview of the issue:
Coastal infrastructure and livelihoods are directly threatened by combined manifestations of Climate Change including the combined incidence of sea-level change, storm surges and flood events. Human life, coastal infrastructure and livelihoods are threatened by coastal inundation and erosion. Key scientific developments since the IPCC Fourth Assessment Report (June 2009) Since the IPCC released AR4 in July 2006, various new information has been published that will be made before the next IPCC assessment, due in 2014. A brief overview of some key new findings is provided here. A better understanding of the behaviour of large ice sheets combined with observations of rapid melting have raised projections of 21st-century global sea level rise. New estimates of average global sea level rise by 2100 are significantly larger than in the AR4. The AR4 projected an average sea level rise of 0.18 to 0.59 meters by the end of the 21st century. This estimate was driven mostly by the thermal expansion of the oceans as the water warms. However, due to an inability to model how ice moves in large, land-based ice sheets (i.e., the Greenland and Antarctic ice sheets), the IPCC did “not assess the likelihood, nor provide a best estimate or an upper bound for sea level rise”. The upper end of the AR4 projection should not, therefore, be interpreted as an upper limit; in fact, it likely underestimates future sea level rise.

41 CONTROLLED DOCUMENT - REFER TO LATEST VERSION DMS
Comparison of recent estimates of sea level rise in 2100, relative to 1990 levels.
Sea level rise in the city of Cape Town A series of four reports under the Global Climate Change and Adaptation: A Sea-Level Rise Risk Assessment. 2008, provides a comprehensive assessment of sea level rise and associated risks in the City of Cape Town. The study assesses the risks associated with sea level rise under three broad scenarios summarised below: Description Sea level rise Impact Probability
Scenario 1
Present Day very Worst Scenario
2m in sheltered environments, 4.5m in exposed environments, and 6.5m in very exposed environments
About 25 km2 covered by the sea (1% of Cape Metro) albeit for a short time.
95% chance in next 25 years
Scenario 2
Scenario at the End of the Next Decade
Same as above but with shorter return periods Expected whenever an extreme storm occurs at same time as Equinox spring high tide
About 60 km2 covered by sea (2% of total Metro) for a short period.
85% chance in next 25 years
Scenario 3
Polar Ice Sheet Melt Scenario
6.5 metre sea-level rise linked to the melting of the Greenland and West Antarctic ice shelves, and involving permanent inundation Excludes impacts of tidal surges and storms
Permanent inundation of about 95 km2 of land around the Cape coastline (4% of Metro)
20% chance in next 25 years
Also of interest is that net ice loss will set in with a global average warming in excess of 2°C, marking the onset of an accelerating ice melt contribution to sea level rise. The complete elimination of the Greenland Ice Sheet will eventually lead to a contribution to sea level rise of 7m. These temperatures correspond to those of the last inter-glacial of 125,000 years ago, when sea level was 4 to 6 m higher than present levels. Around the Cape Peninsula the sea level at this time is reasonably well marked as the 18 foot wave cut platform.
Locality All coastal jurisdictions Existing Policies, Programme(s)/ Project(s)
• TNPA Climate Change Risk Assessment;
• Provincial Spatial Development Programme.
• National Climate Change Response White Paper (2010);
• White Paper for Sustainable Coastal Development (2000)

42 CONTROLLED DOCUMENT - REFER TO LATEST VERSION DMS
• Ethikwini (Durban) Climate Change Strategy
• City of Cape Town: Global Climate Change and Adaptation: A Sea-Level Rise Risk Assessment. 2008
Regulatory and Legislative Framework
Relevant legislation
• Constitution
• National Environmental Management Act
• National Environmental Management: Integrated Coastal Management Act
• Disaster Management Act [No. 57 of 2002]
Management Tool(s): • Climate Systems Analysis Group Climate Change Projections.
• GIS spatial modeling.
Indicators of State of Risk • What is the current sea level compared to pre-industrial levels?
• Number of inundations in the Eastern Cape per year (how to define?)
• What areas are vulnerable to two metre sea-level rise?
Risk Management Performance Indicators
• Number of IDPs, SDFs and Departmental Strategic Plans which explicitly recognise climate change threats to vulnerable coastal areas.
• Relevant budget allocation to disaster management;
• Publication of coastal vulnerability maps.
• Number of IDPs, SDFs and Departmental Strategic Plans which explicitly respond to climate change threats to vulnerable coastal areas.
• Relevant budget allocation to disaster management;
• Effective operation of an early warning and response system.

43 CONTROLLED DOCUMENT - REFER TO LATEST VERSION DMS
CLIMATE CHANGE PROGRAMMES
Adaptation
Programme Title: Coastal Infrastructure and Livelihoods
OBJECTIVE(S)
Overall objective:
• Increased resilience of coastal infrastructure and resources to the effects of sea-level rise, storm-surges, flooding and increased sea temperatures (fisheries).
Sub-objectives:
• Mainstreaming of coastal climate change adaptation in institutional decision making and planning, with consolidated planning processes and frameworks.
Target(s): • Inclusion of Climate Change based coastal vulnerability in the strategic planning and development planning of programme
stakeholders by 20xx
• Inclusion of vulnerable coastal areas and coastal vulnerability considerations in provincial and municipal planning (e.g. SDFs, SDPs, IDPs, EMFs and provincial departmental plans) by 2012.
• Promulgation, development and/or updating of regulations, specifications and/or standards for infrastructure within vulnerable or susceptible coastal areas.
No Activity Responsible Person Budget
Requirements Starting Date Completion Date Comments
1 Convene a Climate Change Coastal Vulnerability Forum
Provincial Coastal Committee Chair
January 20xx January 20xx May be a sub-committee of the Provincial Coastal Committee with a specific climate change mandate.
2 Sourcing of human and financial resources for the mainstreaming of coastal climate change vulnerability in decision-
Provincial Coastal Committee Chair
R240,000.00 March 20xx March 20xx Possible dedicated secretariat.

44 CONTROLLED DOCUMENT - REFER TO LATEST VERSION DMS
making. 3 Deployment of human
resources in support of relevant decision-makers (key-stakeholders)
Financing institution or Programme Secretariat.
R340,000.00 March 20xx Ongoing. May be housed within DEDEA?

45 CONTROLLED DOCUMENT - REFER TO LATEST VERSION DMS
CLIMATE CHANGE PROGRAMMES
Adaptation
Programme Title: Coastal Infrastructure and Livelihoods
OBJECTIVE(S)
Overall objective:
• Increased resilience of coastal infrastructure and resources to the effects of sea-level rise, storm-surge, flooding and increased sea temperature (fisheries).
Sub-objectives:
• Improved data availability (access to and distribution of information).
Target(s):
Completion of a high resolution coastal vulnerability mapping exercise by 20xx (including sea level rise and inundation scenarios).
No Activity Responsible Person Budget Requirements
Starting Date Completion Date Comments
1 Commission a coastal vulnerability mapping and reporting exercise.
HLG&TA R250,000.00 March 20xx September 20xx Should have a higher resolution, but align, with the national climate change vulnerability atlas. Should align with EC PSDP.
2 Commission a coastal infrastructure risk audit.
HLG&TA R250,000.00 March 20xx September 20xx
3 Output should be integrated into a climate change response spatial decision support tool.
Decision support tool should form a separate project.

46 Eastern Cape Climate Change Response Strategy
CLIMATE CHANGE PROGRAMME
Adaptation
Programme Title: Coastal Infrastructure and Livelihoods
OBJECTIVE(S)
Overall objective:
• Increased resilience of coastal infrastructure and resources to the effects of sea-level rise, storm-surges, flooding and increased sea temperature (fisheries).
Sub-objectives:
• Improved capacity for disaster prevention and response.
Target(s):
• Sufficient allocation of budget and human resources to disaster management institutions in regard to coastal related issues by 20XX. Explore the formation of a coastal disaster relief fund.
• Research on the threats to the livelihoods of poor communities within, or relying on, vulnerable coastal resources.
• Development of a coastal early warning and response system.
No Activity Responsible Person Budget Requirements
Starting Date Completion Date Comments
1 Report on budgetary requirements for coastal disaster management.
HLG&TA March 20xx September 20xx
2 Commission a coastal lives and livelihoods disaster risk assessment.
HLG&TA R250,000.00 March 20xx September 20xx
3 Commission a coastal early warning and response system feasibility report and business plan.
HLG&TA and DEDEA R250,000.00 March 20xx September 20xx

47 Eastern Cape Climate Change Response Strategy
Water Scarcity Planning

48 Eastern Cape Climate Change Response Strategy
Date: August 2010
Revision No: Draft for development
Prepared By:
DEDEA
CLIMATE CHANGE PROGRAMME ------------- Adaptation
Approved By:
CC Programme Water Resource Scarcity Planning
Programme Custodian
DWA Directorate: Water Resource Planning and Reconciliation Strategy Steering Committee
Objective(s): Objective:
• Mainstreaming climate change induced water resource scarcity in institutional decision-making and planning in water stressed areas in the Eastern Cape Province.
• Effective water resources management and efficient water use throughout the Eastern Cape Province.
Target(s):
Mainstreaming climate change induced water scarcity in institutional decision-making and planning.
• Ensure that detailed climate change considerations are included in DWA internal strategic perspectives and in Eastern Cape Reconciliation strategies6.
• Include detailed climate change induced water resource scarcity considerations, water demand management, and water conservation in relevant IDPs, Departmental Strategic Planning and Water Services Management Plans by 20xx.
• Include water demand and conservation issues in the Environmental Impact Assessment Process7 by 20xx.
Effective water resources management and efficient water use.
• Undertake an integrated water resources study to determine the effects of climate change on future water supply and demand in WMA15 and to understand the consequences on not taking action by 20xx.
• Establish a Catchment Management Strategy for WMA15 that takes into account future water scarcity by 20xx
• Draft and implement a water conservation and water demand management strategy8 (as per successes in Cape Town and efforts in Nelson Mandela Bay) by 20xx:
• Undertake an integrated water resources study to determine the effects of
6 Include not only projections for changes in Mean Annual Precipitation, but also changes to water balances and storage requirements as a result of increased evaporation associated with higher temperatures and more extreme and variable inter and intra seasonal precipitation patterns. 7 Although DEDEA or DEA may not have authority over water licensing and services, it may include water demand and conservation in the assessment of impacts and associated conditions of authorization. 8 Water demand management falls under the authority of Water Services Authorities such as district municipalities.
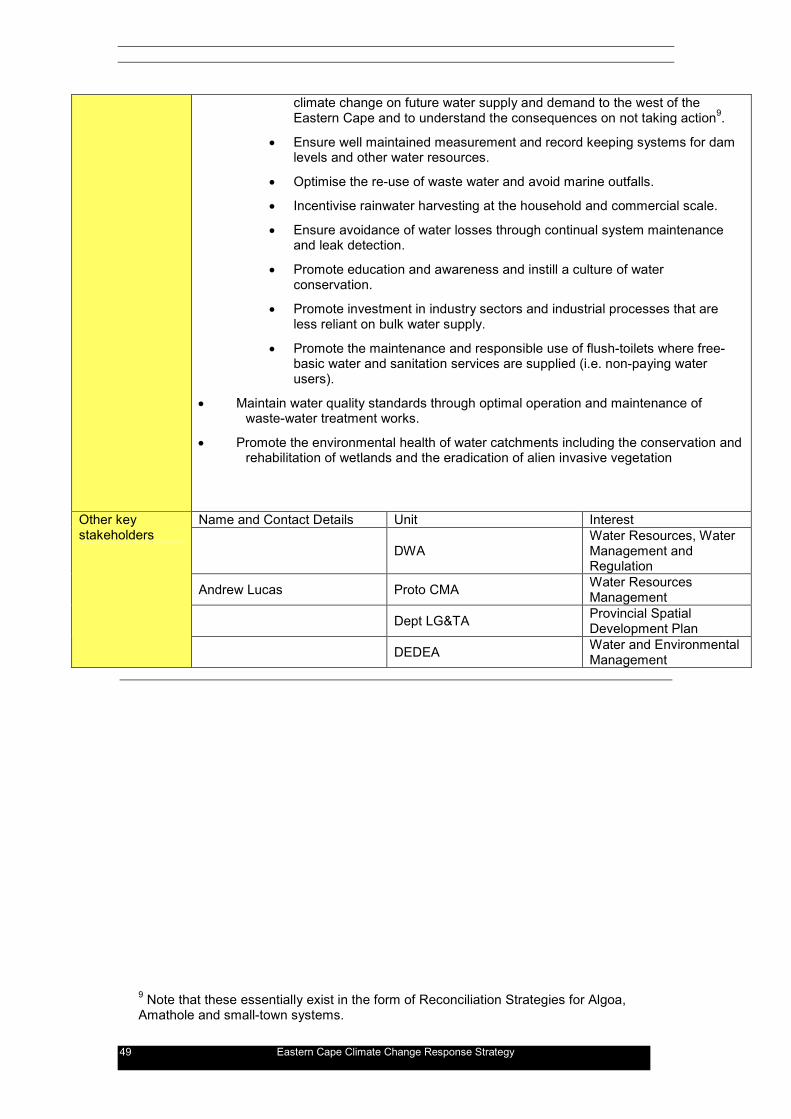
49 Eastern Cape Climate Change Response Strategy
climate change on future water supply and demand to the west of the Eastern Cape and to understand the consequences on not taking action9.
• Ensure well maintained measurement and record keeping systems for dam levels and other water resources.
• Optimise the re-use of waste water and avoid marine outfalls.
• Incentivise rainwater harvesting at the household and commercial scale.
• Ensure avoidance of water losses through continual system maintenance and leak detection.
• Promote education and awareness and instill a culture of water conservation.
• Promote investment in industry sectors and industrial processes that are less reliant on bulk water supply.
• Promote the maintenance and responsible use of flush-toilets where free-basic water and sanitation services are supplied (i.e. non-paying water users).
• Maintain water quality standards through optimal operation and maintenance of waste-water treatment works.
• Promote the environmental health of water catchments including the conservation and rehabilitation of wetlands and the eradication of alien invasive vegetation
Name and Contact Details Unit Interest
DWA Water Resources, Water Management and Regulation
Andrew Lucas Proto CMA Water Resources Management
Dept LG&TA Provincial Spatial Development Plan
Other key stakeholders
DEDEA Water and Environmental Management
9 Note that these essentially exist in the form of Reconciliation Strategies for Algoa, Amathole and small-town systems.

50 Eastern Cape Climate Change Response Strategy
Agri EC and Relevant Water Boards
Agricultural Water Use
Cacadu DM Water Service Providers/Sanitation
NMBM Water Service Providers LMs Water Service Providers Department of Agriculture Agricultural Water Use Coega IDZ Industrial Water Use East London IDZ Industrial Water Use
PERCI Commercial and Industrial Water Use
BKCOB Commercial and Industrial Water Use
Amatola Water Water Board, Water services.
Note that most of the above stakeholders are already part of the Algoa, Amathole and All-town Reconciliation Strategy Steering Committees. However committees may not be well attended.
Other interested parties
Tourism Associations (e.g. EC Parks and Tourism)
Relevant Policies, Programme(s)/Project(s)
• Current drought disaster management responses in NMBM;
• Working for Water;
• Provincial Spatial Development Plan
• PGDP
• Industrial Development Strategy
• Rural development Strategy
• Provincial Coastal management Plan
• DM and LM IDPs, WSDPs. sector pans
Overview of the issue:
Over the next 30 to 60 years, Mean Annual Runoff is projected to decrease significantly in water catchments to the Southwest of the province. Water resources in the Fish to Tsitsikama Water Management Area are already close to, or fully, allocated. This means that there is an absolute limit to the future availability of water resources for social and economic requirements, including requirements for basic human needs, agriculture and industrial processes. Water resource management issues in the Eastern Cape include:
• Over-abstraction of existing resources for irrigation, manufacturing and urban requirements, resulting in deterioration of downstream water quality, quantity and ecological integrity;
• Threats to water quality, quantity and aquatic ecosystem integrity due to catchment degradation;
• Threats to water quality, quantity and aquatic ecosystem integrity due to land-use change in catchments;
• Threats to water quality from sub-standard effluent releases as a result of poorly managed and poorly maintained waste-water treatment works and sewage reticulations.
• Threats to ecological integrity of fresh-water resources due to damming of existing resources.
Some of the secondary impacts of climate change on water resources include:

51 Eastern Cape Climate Change Response Strategy
• Changes to baseflows and stormflows and their variabilities;
• Changes to annual streamflows and their variabilities;
• Changes to sediment yield and its variability; and
• Changes to irrigation water requirements and associated losses. It is likely that the above threats will be compounded by the impacts of future climate change. Projections of reduced precipitation together with increased rates of evaporation caused by climate change will result in an absolute reduction in the availability of water to the Southwest of the province. This will be compounded by more extreme and variable rainfall/dry episodes within and between seasons. This will have major social and economic consequences. For example scarce water resources will limit growth in manufacturing and agro-industrial processing, both foundations of the local economy.
Locality All jurisdictions Regulatory and Legislative Framework
Relevant legislation
• Constitution
• National Water Act (1998)
• Water Services Act [No. 108 of 1997]
• Disaster Management Act [No. 57 of 2002]
• National Environmental Management Act
• National Environmental Management : Integrated Coastal Management Act Relevant policy
• National Climate Change Response White Paper (2010);
• Provincial Environmental Implementation Plan (2010) Permit and reporting requirements
• Water-use licensing under the National Water Act. Links to other plans, authorities, regulations;
• City of Cape Town Water Conservation and Water Demand Management Strategy 2007. http://www.capetown.gov.za/en/Water/Pages/WaterDemandManagement.aspx
Management Tool(s): • Integrated Water Resources Management tools;
• ACRU hydrological modeling (Schultze et al, UKZN) and others
• Various tools developed by Water Research Commission (www.wrc.org.za)
Performance Indicators • Adoption of an Integrated Water Resources Plan including a Water Conservation and
Water Demand Management Strategy by Water Services Authorities.
• Number of IDPs, SDFs and Departmental Strategic Plans which explicitly respond to climate change threats to water availability in the Southwest.
• Relevant budget allocation to Water Conservation and Water Demand Management.
• Official recognition of projected water scarcity in EIA processes

52 Eastern Cape Climate Change Response Strategy

53 Eastern Cape Climate Change Response Strategy
CLIMATE CHANGE PROGRAMME
Adaptation
Programme Title: Water Scarcity in WMA 12 & 15
OBJECTIVE(S)
Objective:
• Mainstreaming climate change induced water scarcity in institutional decision-making and planning in water stressed areas in the Eastern Cape Province.
Target(s):
• Establish a Catchment Management Strategy for WMA15 that takes into account future water scarcity by 20XX.
• Include detailed climate change induced water resource scarcity considerations, water demand management, and water conservation in relevant IDPs, Departmental Strategic Planning and Water Services Management Plans by 20XX
No Activity Responsible Person Budget
Requirements Starting Date Completion Date Comments
2 Sourcing of human and financial resources for the mainstreaming of water scarcity in Municipal decision-making.
DWA R240,000.00 March 20xx March 20xx Possible dedicated secretariat.
3 Deployment of human resources in support of relevant decision-makers (key-stakeholders)
DWA R340,000.00 March 20xx Ongoing. May be housed within DWA?

54 Eastern Cape Climate Change Response Strategy
CLIMATE CHANGE PROGRAMME
Adaptation
Programme Title: Water Scarcity in WMA 12 & 15
OBJECTIVE(S)
Overall objective:
• Effective water resources management and efficient water use throughout the Eastern Cape Province.
Target(s):
• Undertake an integrated water resources and supply study to determine the effects of climate change on future water supply and demand in WMA15 and to understand the consequences of not taking action by 20xx.
• Research and implement a water conservation and water demand management strategy in District Municipalities. Project Initiated by August 20xx.
No Activity Responsible Person Budget
Requirements Starting Date Completion Date Comments
1 Commission an Integrated Water Resources Study to investigate the impact of future water scarcity.
DWA R500,000.00 March 20xx September 20xx
2 Draft a water conservation and water demand management strategy for western regions
DWA or Cacadu DM R500,000.00 September 20xx September 20xx

55 Eastern Cape Climate Change Response Strategy
Flood Management

56 Eastern Cape Climate Change Response Strategy
Date: August 2010
Revision No: Draft for development
Prepared By:
DEDEA
CLIMATE CHANGE PROGRAMME ------------- Adaptation
Approved By:
CC Programme Flood Management
Programme Custodian
Dept Local Government and Traditional Affairs (EC) - Spatial Planning and Land Development.
Objective(s): Overall objective:
• Flood prevention;
• Reducing vulnerability to flooding events;
• Improved response to the impacts of flooding events Sub-objectives: 1 Ensure landuse planning and development that promotes reduced storm water
runoff. 2 Mainstreaming of increased risk of flooding in institutional decision making and
planning; 3 Improved data availability; 4 Improved capacity for disaster prevention and response.
Target(s): Targets:
• Promulgation and effective enforcement of stormwater management measures, regulations and guidelines (both in rural and urban areas).
• Maintain and improve environmental integrity of catchments, watercourses and wetlands in order to ensure infiltration and abatement.
• Inclusion of zones vulnerable to flooding in SDFs and SDPs10 by 20xx
• Promulgation of regulations, specifications and/or standards for infrastructure within areas vulnerable to flooding.
• Inclusion of Climate Change based flooding in the strategic planning and development planning of programme stakeholders by 20xx
• Completion of a high-resolution provincial floodline mapping exercise (to a standardized methodology, and using projected rainfall data rather than historical rainfall data) by 20xx. This should be coupled with an information dissemination system to relevant authorities and planners.
• Sufficient allocation of budget and human resources to disaster management institutions by 20xx.
• Research on the threats to the livelihoods of poor communities within flood zones.
• Development of a flooding early warning and response system.
10 Prioritise informal settlements in flood-prone areas.

57 Eastern Cape Climate Change Response Strategy
• Develop disaster response plans based on lessons learned from historical flood disaster areas (national and international).
Name Unit Interest LG&TA Provincial Planning
LG&TA Provincial Disaster Management
DEDEA Integrated Environmental Management and EIA
DWA Integrated Water Resources and Catchment Management
Working for Water Catchment Management Working for Wetlands Catchment Management Transnet Ports Flooding of ports
Department of Transport Transport infrastructure prone to flooding
District Municipalities Local Government Spatial Planning and Authorisation
Local Municipalities Local Government Spatial Planning and Authorisation
Other key stakeholders
Other interested parties
Catchment Management Agencies.
Overview of the issue:
Superimposed on the background of gradual increases and decreases in mean annual precipitation in the province, climate change is projected to result in less predicable, more extreme events. This will include longer and dryer dry periods; and wetter, more intense wet periods associated with increased energy in the systems. Climate change is likely to increase not only the frequency of flooding events, but also the intensity of flood events. The increased risk of flooding due to climate change is exacerbated by the reduced ability of water catchments to absorb flood pulses. This is caused by:
• Losses of wetlands which absorb flood waters and release them over a longer period of time; and
• Catchment hardening as a result of increased urbanization and deterioration in landcover.
A complicating factor is that poorly planned urban sprawl and informal urbanisation often results in developments and human settlement taking place in flood-prone areas or within 1:10, 1:50 and 1:100 year historical flood lines. The combination of climate change, catchment deterioration and unplanned or poorly planned urban settlement is highly likely to result in disastrous future scenarios.
Locality Low-lying and flood prone areas in all jurisdictions. Existing Policies, Programme(s)/Project(s)
• EC Provincial Spatial Development Plan;
• Local and district spatial development frameworks and landuse planning tool;
• National Water Act: DWA 1 in 100 year floodline.
Regulatory and Relevant legislation

58 Eastern Cape Climate Change Response Strategy
Legislative Framework
• Municipal Systems Act (2000)
• National Water Act (1998) Permit and reporting requirements
• Municipal planning approval processes;
• Environmental Authorisations under the 2010 EIA regulations.
Management Tool(s): • Climate Systems Analysis Group Climate Change Projections.
• GIS spatial modeling.
• Existing floodline determinations
Indicators of State of Risk • Number of flood-events reported per year in the province;
• Number of human lives lost to floods in the Province.
• Total infrastructure and human settlement exposed to flooding.
• Total infrastructure lost due to flooding events in the Province.
Risk Management Performance Indicators
• Number of IDPs, SDFs and Departmental Strategic Plans which explicitly recognise flood risk zones.
• Relevant budget allocation to disaster management;
• Generation of a provincial map of flood-lines under a standardised methodology.
• Relevant budget allocation to disaster management;
• Effective operation of an early warning and response system.

59 Eastern Cape Climate Change Response Strategy
CLIMATE CHANGE PROGRAMMES
Adaptation
Programme Title: Flood Management
OBJECTIVE(S)
Overall objective:
• Reducing vulnerability to flooding events;
• Improved response to the impacts of flooding events Sub-objectives:
• Mainstreaming of increased risk of flooding in institutional decision making and planning
Target(s): • Inclusion of zones vulnerable to flooding in SDFs and SDPs by 20xx.
• Promulgation of regulations, specifications and/or standards for infrastructure within areas vulnerable to flooding.
• Inclusion of Climate Change based flooding in the strategic planning and development planning of programme stakeholders by 20xx.
No Activity Responsible Person Budget Requirements
Starting Date Completion Date Comments
1 Convene a flood-vulnerability and prevention forum.
LG&TA January 20xx January 20xx May be a sub-committee of an existing committee, but with a specific climate change mandate.
2 Sourcing of human and financial resources for the mainstreaming of flood vulnerability in decision-making.
LG&TA R240,000.00 March 20xx March 20xx Possible dedicated secretariat. Could be the same secretariat as for coastal climate change risk.
3 Deployment of human resources in support of
Financing institution or Programme
R340,000.00 March 20xx Ongoing. May be housed within LG&TA or DEDEA?

60 Eastern Cape Climate Change Response Strategy
relevant decision-makers (key-stakeholders)
Secretariat.

61 Eastern Cape Climate Change Response Strategy
CLIMATE CHANGE PROGRAMMES
Adaptation
Programme Title: Flood Management
OBJECTIVE(S)
Overall objective:
• Reducing vulnerability to flooding events;
• Improved response to the impacts of flooding events. Sub-objectives:
• Improved data availability.
Target(s): • Completion of a high-resolution provincial floodline mapping exercise (to a standardized methodology, and using
projected rainfall data rather than historical rainfall data) by 20xx. This should be coupled with an information dissemination system to relevant authorities and planners.
No Activity Responsible Person Budget
Requirements Starting Date Completion Date Comments
1 Commission a floodline and vulnerability mapping and reporting exercise.
HLG&TA R500,000.00 March 20xx September 20xx Should align with EC PSDP and coastal risk mapping exercise. Output should be integrated into a climate change response spatial decision support tool. Decision support tool should form a separate project, but should align with the coastal risk mapping exercise.

62 Eastern Cape Climate Change Response Strategy
CLIMATE CHANGE PROGRAMME
Adaptation
Programme Title: Flood Management
OBJECTIVE(S)
Overall objective:
• Reducing vulnerability to flooding events;
• Improved response to the impacts of flooding events. Sub-objectives:
• Improved capacity for disaster prevention and response. Target(s):
• Sufficient allocation of budget and human resources to disaster management institutions by 20xx.
• Research on the threats to the livelihoods of poor communities within flood zones.
• Development of a flooding early warning and response system.
No Activity Responsible Person Budget Requirements
Starting Date Completion Date Comments
1 Report on budgetary requirements for flood disaster management.
LG&TA March 20xx September 20xx
2 Commission a flooding and livelihoods disaster risk assessment.
LG&TA R250,000.00 March 20xx September 20xx
3 Commission a flooding early warning and response system feasibility report and business plan.
LG&TA and DEDEA R250,000.00 March 20xx September 20xx
63 Eastern Cape Climate Change Response Strategy
Responses to Increased Risk of Wildfires

64 Eastern Cape Climate Change Response Strategy
Date: August 2010
Revision No: Draft for development
Prepared By:
DEDEA
CLIMATE CHANGE PROGRAMME ------------- Adaptation
Approved By:
CC Programme Responses to increased risk of wildfires
Programme Custodian
Provincial Disaster Management
Objective(s): Overall objective:
• Improved wildfire prevention and suppression. Sub-objectives: 1 Increased collaboration among, and provincial support to, Working on Fire and
Fire Protection Associations. 2 Improved fire risk awareness (especially on days of high-extreme fire danger). 3 Improved response capacity within Provincial Disaster Management
Target(s): Targets:
• Convene a provincial fire protection forum including Disaster Management, Working on Fire and all FPAs;
• Completed survey of effectiveness of, and institutional and material support required by, all FPAs in the Eastern Cape Province by 20xx;
• Initiate general public fire danger and burning prohibition awareness campaigns (undertaken annually during fire season).
• Increased budget allocation to Provincial Disaster Management in relation to wildfires for the following KPAs:
• KPA 2: Risk assessment and monitoring;
• KPA 3: Disaster management planning and implementation;
• KPA 4: Disaster response and recovery. Name Unit Interest
National Department of Agriculture, Forestry and Fisheries.
Forestry as competent authority for National Veld and Forest Fire Act 101 of 1998
Dept LG&TA Disaster Management Centre
Provincial Department of Agriculture
Threats to agricultural infrastructure, assets and operations including threats to rural livelihoods.
Other key stakeholders
All Fire Protection Associations in the Province
Structure for implementing fire prevention and control measures.

65 Eastern Cape Climate Change Response Strategy
Working on Fire Structure for assistance in fire prevention and control
DEDEA Strategic Responses to Climate Change Risks
DWA Working for Water and links to fire risk
Other interested parties
Municipal Disaster Management.
Overview of the issue:
As shown in the map below, the Eastern Cape Province is prone to veld and forest fires, with the greatest frequency of fires in the central, east and north of the province. The risk of wildfires is a product of increased temperature and winds, reduced humidity and increased fuel load. Simulations project warmer winters and springs. Coupled with increased intensity and duration of dry periods, increased occurrence of “berg winds”, and an increased fuel load from warmer, wetter summers in the east, there is a high likelihood of increased risk of wildfires in late winter and early spring.
Fire frequency atlas for South Africa showing the number of fires between 2000 and 2007. Light yellow indicates 1 to 2 fires; dark red indicates more than 8 fires. Source: South African Risk and Vulnerability Atlas (2010).
Locality All jurisdictions Existing Policies, Programme(s)/Project(s)
• Working on Fire
• Provincial, District and Local Municipal Risk and Disaster Management Plans
Regulatory and Legislative Framework
Relevant legislation
• National Veld and Forest Fire Act 101 of 1998
• Disaster Management Act [No. 57 of 2002]
Management Tool(s): • NDVI for fuel load;

66 Eastern Cape Climate Change Response Strategy
• GIS for monitoring and spatial data collection;
• South African Weather Service early warning.
Indicators of State of Risk • Number of days in year when fire danger index reaches high-extreme in the Eastern
Cape.
• Number of fire days per year relative to number of days in the year with a fire danger rating of high-extreme;
Risk Management Performance Indicators
• Total number of hectares burned by uncontrolled fires per year (separate for veld and forests);
• Financial cost of damage caused by uncontrolled fires per year;
• Number of human lives lost to uncontrolled fires per year.

67 Eastern Cape Climate Change Response Strategy
CLIMATE CHANGE PROGRAMMES
Adaptation
Programme Title: Responses to increased risk of wildfires
OBJECTIVE(S)
Overall objective: Improved fire prevention and suppression Sub-objectives: - Increased collaboration among, and provincial support to, Working on Fire and Fire Protection Associations.
Target(s):
• Convene a provincial fire protection forum including Disaster Management, Working on Fire and all FPAs;
• Completed survey of effectiveness of, and institutional and material support required by, all FPAs in the Eastern Cape Province by 20xx.
No Activity Responsible Person Budget
Requirements Starting Date Completion Date Comments
1 Convene a provincial fire protection forum including Disaster Management, Working on Fire and all FPAs
Dept LG & TA R50,000.00 March 20xx Ongoing
2 Undertake survey of effectiveness of, and institutional and material support required by, all FPAs in the Eastern Cape Province.
Dept LG & TA R100,000.00 March 20xx March 20xx Review opportunities for EC Umbrella FPA along the lines of KZN FPA.

68 Eastern Cape Climate Change Response Strategy
CLIMATE CHANGE PROGRAMMES
Adaptation
Programme Title: Responses to increased risk of wildfires
OBJECTIVE(S)
Overall objective:
• Improved wildfire prevention and suppression. Sub-objectives:
• Improved fire risk awareness (especially on days of high-extreme fire danger).
Target(s): • Initiate general public fire danger and burning prohibition awareness campaigns (undertaken annually during fire
season).
No Activity Responsible Person Budget Requirements
Starting Date Completion Date Comments
1 Initiate general public fire danger and burning prohibition awareness campaigns (undertaken annually during fire season).
Dept LG & TA or Working on fire
R1000,000.00 March 20xx Ongoing Coordinate with provincial fire plan.
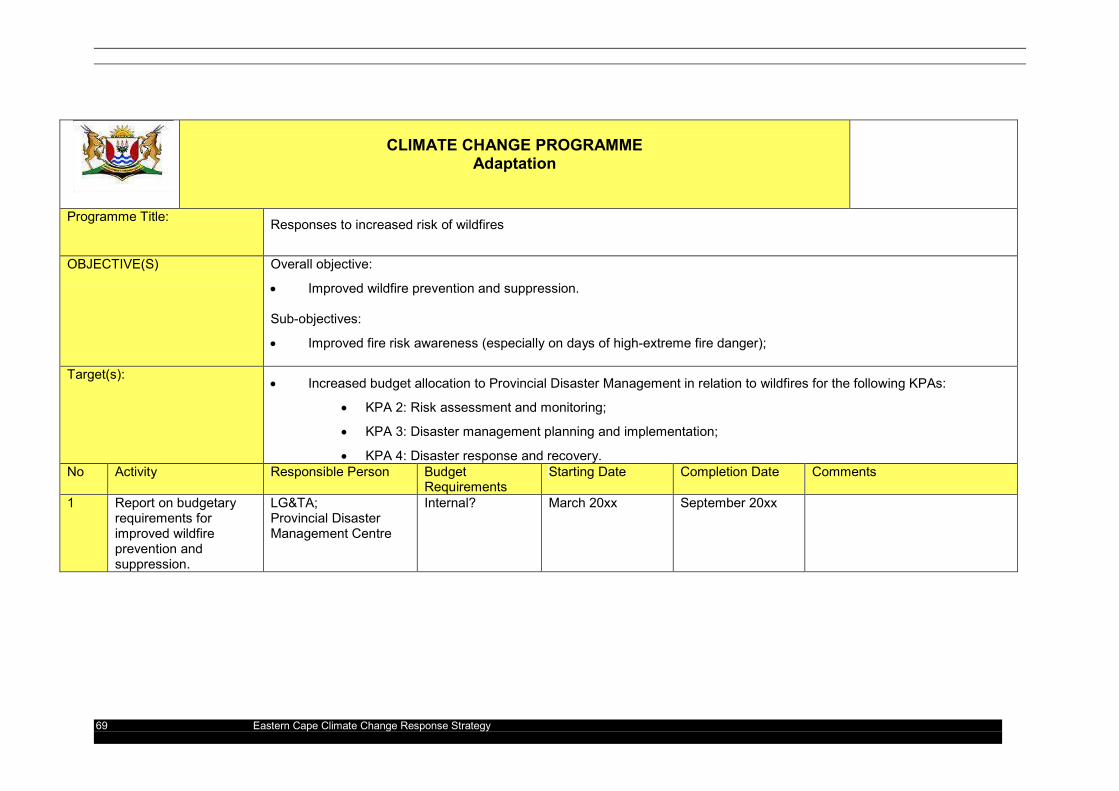
69 Eastern Cape Climate Change Response Strategy
CLIMATE CHANGE PROGRAMME
Adaptation
Programme Title: Responses to increased risk of wildfires
OBJECTIVE(S)
Overall objective:
• Improved wildfire prevention and suppression. Sub-objectives:
• Improved fire risk awareness (especially on days of high-extreme fire danger);
Target(s): • Increased budget allocation to Provincial Disaster Management in relation to wildfires for the following KPAs:
• KPA 2: Risk assessment and monitoring;
• KPA 3: Disaster management planning and implementation;
• KPA 4: Disaster response and recovery. No Activity Responsible Person Budget
Requirements Starting Date Completion Date Comments
1 Report on budgetary requirements for improved wildfire prevention and suppression.
LG&TA; Provincial Disaster Management Centre
Internal? March 20xx September 20xx

70 Eastern Cape Climate Change Response Strategy
Managing the effects of increased temperature on human lives

71 Eastern Cape Climate Change Response Strategy
Date: August 2010
Revision No: Draft for development
Prepared By:
DEDEA
CLIMATE CHANGE PROGRAMME ------------- Adaptation
Approved By:
CC Programme Managing the effects of increased temperature on human lives
Programme Custodian
Eastern Cape Department of Health; Municipal Health Services, EC Agriculture.
Objective(s): Overall objective:
• Societal adaptation to human health impacts from temperature increases associated with climate change.
Sub-objectives: 1 Improved health preparedness for heat waves including education
programmes. 2 Prevention of vector borne diseases associated with temperature increases. 3 Improved resilience in rural livelihoods (including agricultural subsistence)
Target(s): Targets:
• Development of a heat-wave management and response plan11 by 20xx.
• Development of a vector borne-disease and infection prevention and management plan by 20xx.
• Introduction of a water borne and vector borne disease monitoring programme12 by 20xx.
Name Unit Interest
Eastern Cape Department of Health
Healthcare Responses
Housing Eastern Cape
Passive thermal design and technology interventions for social housing;
Eastern Cape Department of Social Development
Social services as it relates to marginal communities and community resilience
District Municipalities Water services and sanitation
Local Municipalities Water services and sanitation
District Municipalities Environmental Health
Other key stakeholders
Local Municipalities Environmental Health
11 Should include both a prevention and a management element. 12 Includes a system for surveillance of rodents and water courses. It should be noted that municipal health departments have a strong role to play in regard to monitoring and surveillance in the context of a provincial reporting system.

72 Eastern Cape Climate Change Response Strategy
Eastern Cape Department of Local Government and Traditional Affairs
Disaster Management
Eastern Cape Department of Agriculture
Rural Development and Agriculture.
Other interested parties
• Rhodes University Environmental Science Department;
• South African Institute of Environmental Health;
• Promotion of Rural Livelihoods Programme (RuLiv).
• Eastern Cape Social and Economic Consultative Council (ECSECC)
• Other affected and interested stakeholders. Overview of the issue:
Mid- to long-term projections indicate that annual average temperatures are expected to increase by approximately 2°C at the coast and by between 3°C and 4°C inland. There is also a stronger likelihood of temperature extremes (experienced as heat waves). These climate changes are expected to have negative effects on human health, including the following: An increase in the frequency of heatwaves is indirectly linked to increased deaths among children, the elderly and the infirm (with particularly risk to those with HIV/AIDS). Poor communities with inadequate housing and services are particularly prone to the effects of heat-waves. Increased mean temperature coupled with increased rainfall has already been demonstrated to result in the spread in range of vector-borne diseases. This includes malaria, cholera and tick-borne diseases. Increased temperature coupled with local air pollution is likely to exacerbate existing respiratory diseases and conditions such as tuberculosis and asthma. Increased rainfall and temperature increases the risk of food-borne and water-borne infections. The direct effects of increased temperature on human lives should be considered in combination with other indirect effects of climate change on social and economic systems, such as the effect of increased floods and droughts on poor communities.
Diagram illustrating the link between climate change and effects to human health.

73 Eastern Cape Climate Change Response Strategy
Locality All jurisdictions Existing Policies, Programme(s)/Project(s)
Provincial Spatial Development Plan; Department of Agriculture and Rural Development: Rural Development and Agrarian Transformation Strategy.
Regulatory and Legislative Framework
Relevant legislation
• Constitution;
• National Health Act (2003)
• Disaster Management Act [No. 57 of 2002]
• International Health Regulations Act (1974)
• National building regulations. Permit and reporting requirements
• None to date.
Management Tool(s): • Municipal health and environmental inspections;
• Food licensing and pest control;
• Water quality monitoring;
• Local weather stations and disease early warning systems. Indicators of State of Risk • Recorded annual average temperature, records of extreme heat conditions against
comparative records of mortality.
• Disease Incidence.
• Number and geographical distribution of reported water-borne and vector-borne diseases and infections per year (against population in the province).
• Disease surveillance including the spread of disease vectors.
Risk Management Performance Indicators
As per targets above

74 Eastern Cape Climate Change Response Strategy
CLIMATE CHANGE PROGRAMME
Adaptation
Programme Title: Managing the effects of increased temperature on human lives
OBJECTIVE(S)
Overall objective:
• Societal adaptation to human health impacts from temperature increases associated with climate change. Sub-objectives:
• Improved health preparedness for heat waves including education programmes. Target(s):
Development of a heat-wave management and response plan by 20xx.
No Activity Responsible Person Budget Requirements
Starting Date Completion Date Comments
1 Convene an Integrated Climate Change and Health Response Committee
Department of Health and District Municipal Health Departments.
Convene an Integrated Climate Change and Health Response Committee
Department of Health
2 Develop an Integrated heat-wave management and response plan.
Department of Health and District Municipal Health and Disaster Management Departments.
Develop an Integrated heat-wave management and response plan.
Department of Health
An initial preparedness audit and gap analysis should be undertaken.
3

75 Eastern Cape Climate Change Response Strategy
CLIMATE CHANGE PROGRAMME
Adaptation
Programme Title: Managing the effects of increased temperature on human lives
OBJECTIVE(S)
Overall objective: Societal adaptation to human health impacts from temperature increases associated with climate change. Sub-objectives: Prevention of vector and waster borne diseases associated with temperature increases
Target(s): Prevention of vector and waster borne diseases associated with temperature increases
No Activity Responsible Person Budget Requirements
Starting Date Completion Date Comments
1 Convene an Integrated Climate Change and Health Response Committee
Department of Health R20,000 March 20xx Ongoing Committee to manage both heat wave and temperature related disease risk.
2 Development of a vector borne-disease and infection prevention and management plan by 20xx.
Department of Health R250,000 March 20xx March 20xx
3 Introduction of a water borne and vector borne disease monitoring programme by 20xx.
Department of Health R250,000 March 20xx Ongoing

76 Eastern Cape Climate Change Response Strategy
Food Security13
13 Currently under review by Eastern Cape Department of Agriculture and Rural Development

77 Eastern Cape Climate Change Response Strategy
Date: August 2010
Revision No: Draft for development
Prepared By:
DEDEA
CLIMATE CHANGE PROGRAMME ------------- Adaptation
Approved By:
CC Programme Managing Risks to Food Security
Programme Custodian
Eastern Cape Department of Agriculture and Rural Development
Objective(s): Overall objective:
• Incorporating Climate Change Acclimatization and Resilience in provincial food security programmes.
Target(s): Targets:
• By 20xx , include awareness, training, mechanisms and techniques that specifically deal with climate change risk, in existing rural food security programmes.
Name Unit Interest
Eastern Cape Department of Agriculture and Rural Development
Agriculture and Rural Development.
Eastern Cape Department of Social Development
Food security projects under the umbrella of Social Development.
Eastern Cape Social and Economic Consultative Council (ECSECC)
Rural development
Other key stakeholders
Other interested parties
• Rhodes University Environmental Science Department;
• Promotion of Rural Livelihoods Programme (RuLiv).
• Eastern Cape Appropriate Technology Unit
• Overview of the issue:
The Southern African Regional Climate Change Programme notes the following in regard to the impacts of Climate Change on food security:
Scientists predict that the greater variability in and volatility of temperature and rainfall cycles in Africa resulting from climate change will alter the land area suitable for agricultural or livestock production, while increasing the frequency of flooding and drought. Grain yields are expected to decline due to increased rainfall variability, which may result in the need for grain imports, increasing the food prices and hence the cost of living. Desertification rates are also expected to increase. Poor people are most vulnerable to climate change. This is due partly to the fact that poverty is often linked to a higher reliance on natural resources—for example when farming for subsistence. This exacerbates their vulnerability, leading to further degradation of natural resources and creating a vicious circle of yet more environmental degradation and even greater vulnerability. Impacts on agriculture include the degree to which crops/farmers can adapt to changing climates, the
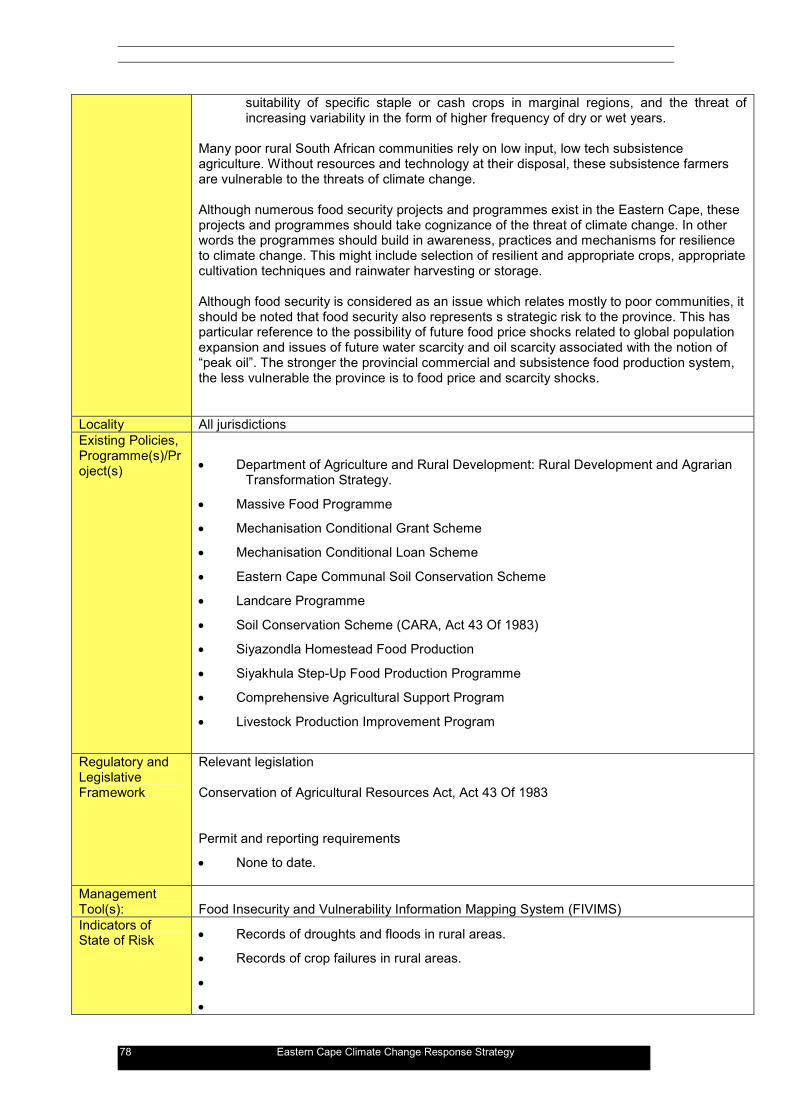
78 Eastern Cape Climate Change Response Strategy
suitability of specific staple or cash crops in marginal regions, and the threat of increasing variability in the form of higher frequency of dry or wet years.
Many poor rural South African communities rely on low input, low tech subsistence agriculture. Without resources and technology at their disposal, these subsistence farmers are vulnerable to the threats of climate change. Although numerous food security projects and programmes exist in the Eastern Cape, these projects and programmes should take cognizance of the threat of climate change. In other words the programmes should build in awareness, practices and mechanisms for resilience to climate change. This might include selection of resilient and appropriate crops, appropriate cultivation techniques and rainwater harvesting or storage. Although food security is considered as an issue which relates mostly to poor communities, it should be noted that food security also represents s strategic risk to the province. This has particular reference to the possibility of future food price shocks related to global population expansion and issues of future water scarcity and oil scarcity associated with the notion of “peak oil”. The stronger the provincial commercial and subsistence food production system, the less vulnerable the province is to food price and scarcity shocks.
Locality All jurisdictions Existing Policies, Programme(s)/Project(s)
• Department of Agriculture and Rural Development: Rural Development and Agrarian Transformation Strategy.
• Massive Food Programme
• Mechanisation Conditional Grant Scheme
• Mechanisation Conditional Loan Scheme
• Eastern Cape Communal Soil Conservation Scheme
• Landcare Programme
• Soil Conservation Scheme (CARA, Act 43 Of 1983)
• Siyazondla Homestead Food Production
• Siyakhula Step-Up Food Production Programme
• Comprehensive Agricultural Support Program
• Livestock Production Improvement Program
Regulatory and Legislative Framework
Relevant legislation Conservation of Agricultural Resources Act, Act 43 Of 1983 Permit and reporting requirements
• None to date.
Management Tool(s):
Food Insecurity and Vulnerability Information Mapping System (FIVIMS)
Indicators of State of Risk • Records of droughts and floods in rural areas.
• Records of crop failures in rural areas.
•
•

79 Eastern Cape Climate Change Response Strategy
Risk Management Performance Indicators
As per targets above

80 Eastern Cape Climate Change Response Strategy
CLIMATE CHANGE PROGRAMME
Adaptation
Programme Title: Managing Risks to Food Security
OBJECTIVE(S)
Overall objective:
• Incorporating Climate Change Acclimatization and Resilience in provincial food security programmes.
Target(s):
By 20xx, include awareness, training, mechanisms and techniques that specifically deal with climate change risk, in existing rural food security programmes.
No Activity Responsible Person Budget Requirements
Starting Date Completion Date Comments
1 Update existing provincial food security programmes to include training, techniques and appropriate technology that specifically responds to climate change risks.
Eastern Cape Department of Agriculture and Rural Development
20xx 20xx A useful starting point would be a gap analysis of existing food security programmes.

81 Eastern Cape Climate Change Response Strategy
Appendix 2: Mitigation Programmes
Please note that the Mitigation Programmes are working documents which require further development, annual review and modification. The programmes in their current format are initial proposals which require review by other departments or stakeholders. As such they should be considered as starter documents and not as a final product.

82 Eastern Cape Climate Change Response Strategy
Mainstreaming GHG Mitigation in Provincial and Local Government

83 Eastern Cape Climate Change Response Strategy
Date: August 2010
Revision No: Draft for development
Prepared By:
DEDEA
CLIMATE CHANGE PROGRAMME ------------- Mitigation
Approved By:
CC Programme Mainstreaming GHG Mitigation in Provincial and Local Government and in Industry
Programme Custodian
Office of the Premier
Objective(s): Objective:
• Mainstreaming GHG Mitigation in Decision-making at all levels of government within the Eastern Cape Province
• Promoting GHG Mitigation in Provincial and Local Government Operations.
• Promoting Greenhouse Gas reporting in Industry.
Target(s): Mainstreaming GHG Mitigation in Decision-making.
• Situate Eastern Cape as a champion for energy and carbon efficiency
• Conduct regular awareness campaigns and ensuing political championship (for example link GHG mitigation to changes in economic model (status quo not sustainable), service delivery model, savings and efficiency in operations of government.
• Include climate change mitigation considerations in Provincial Departmental Planning and Municipal IDPs and other Sector Plans by 20xx
• Formally include requirements for GHG Impact Assessment in Environmental Impact Assessment Processes by 2012.
• Formally include the requirement for energy conservation in the granting of municipal planning permission by 20xx
• Undertake a study to consider the declaration of GHGs as Priority Pollutants, and fossil fuels as Controlled Fuels respectively, in terms of NEM: AQA 2004 (by 20xx).
• Building public sector technical competency to address Climate Change and GHG Mitigation (policy analysis, strategy development, technology development, strategy application, monitoring and reporting)
Promoting GHG Mitigation in Provincial and Local Government Operations
• 20% energy savings in provincial and local government buildings (as per DoE DG announcement) by 2014.
• Development of GHG inventories (carbon footprints) and mitigation activities in provincial government departments by 2014 (including upstream in supplier industries).
• Include GHG mitigation in SMS performance agreements by 2014
• Adopt Green Building codes/energy saving requirements for new and refurbished Government Building

84 Eastern Cape Climate Change Response Strategy
• Set targets for and commence pilot retrofitting of social and RDP housing, and government institutions like schools and clinics by 2012.
Promoting Greenhouse Gas Reporting in Industry
• Understand the nature of emissions from industry in EC and set informed targets, balancing the need for carbon emissions reductions and job creation.
• Assist large industrial greenhouse gas emitters in the province in reporting Scope 1 Greenhouse Gas emissions to the South African Air Quality Information System by 20XX.
• Assist large industrial greenhouse gas emitters in the province in establishing Greenhouse Gas Inventories and reporting protocols in terms of ISO 14064 by 20XX.
Name and contact details Unit Interest DEDEA NEM: Air Quality Act Office of the premier Strategy Custodian
Department of Health Environmental Health and Municipal Health
Department of Local Government
Municipal Support
Department of Public Works Construction and building specifications
Department of Agriculture Alternative Agriculture
Department of Transport Fleet Management
Eskom Demand Side Management
SALGA Mitigation in local government and in IDPs
All sister departments Mitigation and decision-making in Provincial Departments
District Municipalities
Mitigation and decision-making in local government. Awareness and Learning. Environmental Health
Local Municipalities
Mitigation and decision-making in local government. Awareness and Learning. Environmental and Municipal Health.
Metros Mitigation and decision-making in local government.
Coega IDZ Greenhouse Gas Reporting in Industry
East London IDZ Greenhouse Gas Reporting in Industry
ECDC Greenhouse Gas Reporting in Industry
PERCI Greenhouse Gas Reporting in Industry
BKCOB Greenhouse Gas Reporting in Industry
Other key stakeholders

85 Eastern Cape Climate Change Response Strategy
Other interested parties
• ECSECC
• Rural Development Agency Overview of the issue:
• South Africa has a per-capita carbon footprint (Greenhouse Gas Emissions Footprint) that is higher than the international average. These emissions, no matter where they originate from, contribute directly to global warming which causes climate changes.
• SA is a signatory to the Kyoto Protocol and is therefore obligated to combat climate change.
• In December 2009 and January 2010 at the Copenhagen Accord the presidency pledged a 34% reduction in emissions below business as usual by 2025;
• All entities, including those in the Eastern Cape, have a responsibility to collectively contribute to a reduction in Greenhouse Gas Emissions caused by human activities.
• As per Section 29 of the National Environmental Management: Air Quality Act, the National Minister or Provincial MEC has the power to declare Greenhouse Gasses as Priority Air Pollutants. Entities emitting within the given category will need to submit and implement pollution prevention plans.
• As per Section 26 of the National Environmental Management: Air Quality Act, the National Minister or Provincial MEC has the power to declare fossil fuels as Controlled Fuels. This allows among others, the opportunity to
• Establish standards for the use of the controlled fuel in combustion processes;
• Establish standards for the manufacture or sale of the controlled fuel;
• Establish specifications for the composition of controlled fuels;
• Valerie Geen (National Business Institute) notes the following in the 2010 South African Carbon Disclosure Report: “Globally the green race is on and South Africa has also joined the trend by beginning the process of transforming the country’s economy to a low carbon intensive one. Companies that identified opportunities associated with this change will have the competitive advantage whilst those who procrastinate are likely to be faced with reputational, physical and regulatory risks that can undermine their competitiveness. As international and local investors become increasingly interested in the long term safety of their assets and investments on behalf of their clients and as weather patterns change and threats to energy and water security become in themselves, drivers of change, business is required to take the lead in forecasting and finding solutions to new challenges.
• 74% of South Africa’s JSE top 100 companies reported to the Carbon Disclosure Project in 2010. This is the fourth highest reporting rate in the world.
Locality All provincial and local government jurisdictions in the Eastern Cape Relevant Policies, Programme(s)/Project(s)
• Kyoto Protocol
• Copenhagen Accord (2009)
• Pledge by the president of South Africa under the Copenhagen Accord: 34% reduction in emissions below business as usual by 2025;
• 2008 Cabinet 2°C policy and Long Term Mitigation Scenarios.
• Outcome 10
• IRPII
• Power Conservation Programme (Reintroduced by DoE);
• National Climate Change Response Policy White Paper 2010 (In Draft);

86 Eastern Cape Climate Change Response Strategy
• National Greenhouse Gas Inventory Programme;
• SAAQIS
• Climate Change Strategy and Action Plan for the Western Cape.
• Eastern Cape Renewable Energy Study (DEDEA and ELIDZ)
Regulatory and Legislative Framework
Relevant legislation
• Constitution
• National Environmental Management: Air Quality Act. Permit and reporting requirements
• Permitting and reporting of emissions for scheduled activities under the National Environmental Management: Air Quality Act.
Links to other plans, authorities, regulations; www.capegateway.gov.za/.../climate_change_strategy_final_draft_june2007.pdf
Management Tool(s): • ISO 50001 Energy Management Systems;
• ISO 14064 Guidelines for Greenhouse Gas Inventories;
• World Resources Institute and World Business Council for Sustainable Development Greenhouse Gas Protocol.
Performance Indicators
• Number of IDPs, SDFs and Departmental Strategic Plans which explicitly deal with sustainable energy, GHG inventories and GHG mitigation;
• Number of government and local government institutions that have initiated GHG inventories;
• Relevant budget allocation for GHG mitigation activities;
• Official recognition of GHG impacts in EIA processes;
• Combined GHG footprint of all provincial and local government operations.

87 Eastern Cape Climate Change Response Strategy
CLIMATE CHANGE MITIGATION
Projects
Programme Title: Mainstreaming GHG Mitigation in Provincial and Local Government and in Industry
OBJECTIVE(S)
Objective: • Mainstreaming GHG Mitigation in Decision-making at all levels of government within the Eastern Cape Province.
Target(s):
• Include climate change mitigation considerations in Provincial Departmental Planning and Municipal IDPs and other Sector Plans by 20xx
• Formally include requirements for GHG Impact Assessment in Environmental Impact Assessment Processes by 20xx
• Formally include the requirement for energy conservation in the granting of municipal planning permission by 20xx
No Activity Responsible Person Budget Requirements
Starting Date Completion Date Comments
1 Convene a Provincial GHG Mitigation Forum/Committee
DEDEA or Office of the Premier
January 20xx January 20xx
2 Sourcing of human and financial resources for the mainstreaming of GH mitigation in decision-making.
DEDEA R240,000.00 March 20xx March 20xx Possible dedicated secretariat.
3 Deployment of human resources in support of relevant decision-makers (key-stakeholders)
Financing institution or Programme Secretariat.
R340,000.00 March 20xx Ongoing. Housed within DEDEA
4 Commission a study of, and adopt, criteria for
DEDEA Integrated Environmental
R200,000 March 20xx March 20xx

88 Eastern Cape Climate Change Response Strategy
Assessing Greenhouse Gas Impacts in the Environmental Authorisation Process.
Management.
Commission a study of, and adopt, energy conservation criteria for approving building and development plans.
SALGA R250,000 March 20xx March 20xx
Undertake a study to consider the declaration of GHGs as Priority Pollutants, and fossil fuels as Controlled Fuels respectively, in terms of NEM: AQA 2004 (by 20xx).
DEDEA R500,000 March 20xx March 20xx The study should focus on the opportunities for mitigation that might be facilitated by the activation of sections 26 and 29 of NEM:AQA. The study should focus on ensuring that mitigation could be achieved through pragmatic and practical implementation of the legislation. The study should include an impact assessment of the implementation of the legislation. The implementation of the legislation should not unduly burden the local economy.

89 Eastern Cape Climate Change Response Strategy
CLIMATE CHANGE MITIGATION
PROGRAMME
Programme Title: Mainstreaming GHG Mitigation in Provincial and Local Government and in Industry
OBJECTIVE(S)
Overall objective: • Promoting GHG Mitigation in Provincial and Local Government Operations.
Target(s):
• 20% energy savings in provincial and local government buildings (as per DoE DG announcement) by 20xx
• Development of GHG inventories (carbon footprints) and mitigation activities in provincial government departments by 20xx (including upstream in supplier industries).
No Activity Responsible Person Budget
Requirements Starting Date Completion Date Comments
1 Formulate and adopt a common framework and guidelines for reporting and auditing energy use and savings in Government Buildings.
DEDEA R250,000.00 March 20xx September 20xx Need to align with the updated Power Conservation Scheme introduced by Dept of Energy.
2 Formulate and adopt a common framework and guidelines for reporting GHG emissions caused by Provincial and Local Government Dept operations in the EC.
DEDEA R250,000.00 March 20xx September 20xx Reporting and auditing guidelines should conform to principles of ISO 14064.
3 Commission the development of a GHG Emissions Inventory for DEDEA Operations
DEDEA R250,000.00 September 20xx March 20xx Reporting and auditing guidelines should conform to principles of ISO 14064.

90 Eastern Cape Climate Change Response Strategy
(Excluding Coega IDZ and ELIDZ)

91 Eastern Cape Climate Change Response Strategy
CLIMATE CHANGE MITIGATION
Projects
Programme Title: Mainstreaming GHG Mitigation in Provincial and Local Government and in Industry
OBJECTIVE(S)
Objective: • Promoting Greenhouse Gas Reporting in Industry
Target(s):
• Assist large industrial greenhouse gas emitters in the province in reporting Scope 1 Greenhouse Gas emissions to the South African Air Quality Information System by 20XX.
• Assist large industrial greenhouse gas emitters in the province in establishing Greenhouse Gas Inventories and reporting protocols in terms of ISO 14064 by 20XX.
No Activity Responsible Person Budget
Requirements Starting Date Completion Date Comments
1 Promote the formation of Greenhouse Gas reporting sub-committees in the BKCOB and PERCI.
DEDEA Air Quality Management
January 20xx January 20xx
2 Initiate Greenhouse Gas reporting awareness and technical training workshops among the largest industrial emitters in the province.
DEDEA Air Quality Management
R150 000,00 January 20xx January 20xx

92 Eastern Cape Climate Change Response Strategy
Promotion of Renewable Energy in the Eastern Cape NOTE: This programme draws from the outcomes of the Eastern Cape Renewable Energy Working Group workshop held on the 22nd of November 2010.

93 Eastern Cape Climate Change Response Strategy
Date: August 2010
Revision No: Draft for development
Prepared By:
DEDEA
CLIMATE CHANGE PROGRAMME ------------- Mitigation
Approved By:
CC Programme Promotion of clean energy in the EC
Programme Custodian
DEDEA MEC’s Clean Energy Champion Group (Ultimately the custodian is the MEC for DEDEA – in mean time the programme sits with ELIDZ)
Objective(s): Goal: That the EC is the most enabling provincial environment for Clean Energy investment and implementation in the country. Overall objective:
• Create an enabling environment for investment in, and implementation and use of clean energy14 in the Eastern Cape15
Sub-objectives: 1 Initiate a provincial renewable energy coordination body to
promote and facilitate renewable energy markets and investment in the Eastern Cape (including renewable energy one-stop-shop).
2 Development of enabling regulatory mechanisms and incentives. 3 Initiate the development of a renewable energy centre/incubator
by 20xx 4
Initiate a clean energy purchasing pool by 20xx
Target(s): Targets:
• Formation of a provincial renewable energy coordination body to promote and facilitate renewable energy markets and investment in the Eastern Cape. The functions of the body should include:
• National lobbying
• Provincial policy alignment
• Investor interface (one-stop-shop)
• Implementation.
• Development of enabling regulatory mechanisms and incentives.
• Initiate a renewable energy Strategic Environmental Assessment
14 Clean Energy should be aligned with the objectives the national growth path and “Green Economy” imperative. 15 Ensure alignment with the provincial Renewable Energy Strategy.
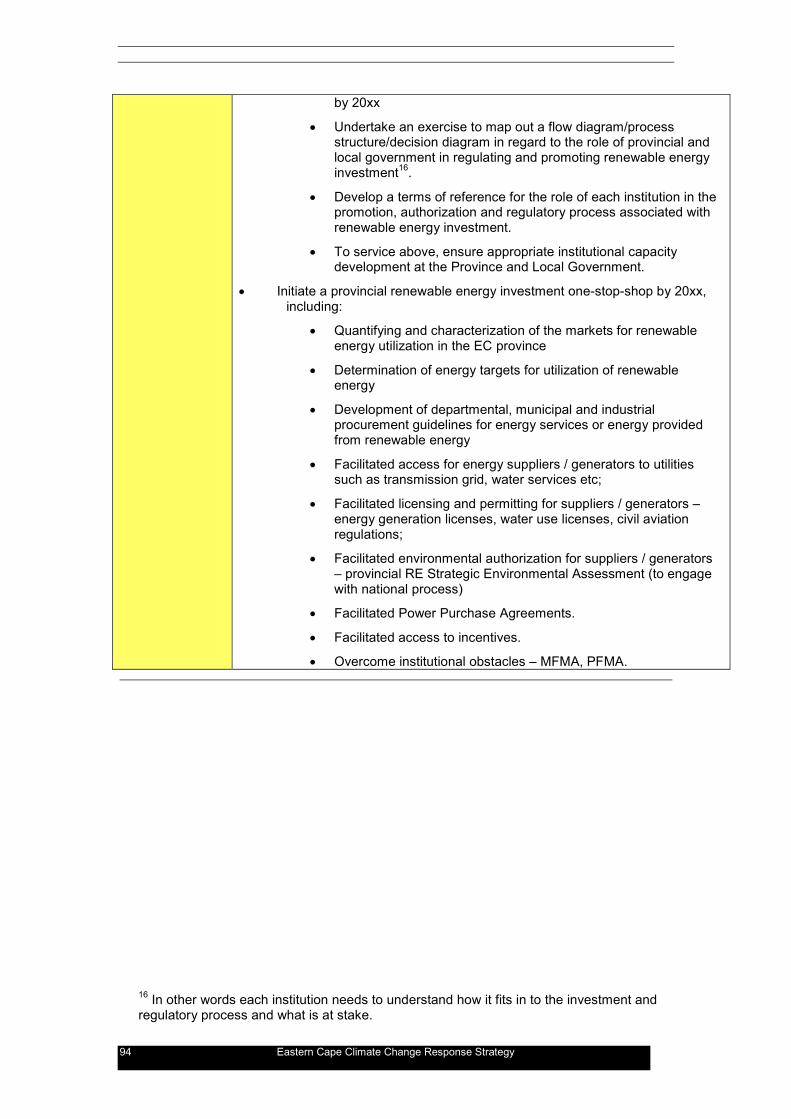
94 Eastern Cape Climate Change Response Strategy
by 20xx
• Undertake an exercise to map out a flow diagram/process structure/decision diagram in regard to the role of provincial and local government in regulating and promoting renewable energy investment16.
• Develop a terms of reference for the role of each institution in the promotion, authorization and regulatory process associated with renewable energy investment.
• To service above, ensure appropriate institutional capacity development at the Province and Local Government.
• Initiate a provincial renewable energy investment one-stop-shop by 20xx, including:
• Quantifying and characterization of the markets for renewable energy utilization in the EC province
• Determination of energy targets for utilization of renewable energy
• Development of departmental, municipal and industrial procurement guidelines for energy services or energy provided from renewable energy
• Facilitated access for energy suppliers / generators to utilities such as transmission grid, water services etc;
• Facilitated licensing and permitting for suppliers / generators – energy generation licenses, water use licenses, civil aviation regulations;
• Facilitated environmental authorization for suppliers / generators – provincial RE Strategic Environmental Assessment (to engage with national process)
• Facilitated Power Purchase Agreements.
• Facilitated access to incentives.
• Overcome institutional obstacles – MFMA, PFMA.
16 In other words each institution needs to understand how it fits in to the investment and regulatory process and what is at stake.

95 Eastern Cape Climate Change Response Strategy
• Initiate a renewable energy centre/incubator by 20xx, incorporating:
• Technology testing and certification facilities;
• Training and skills development facilities;
• Research and development facilities.
• Initiate a clean energy purchasing pool by 20xx Name Unit Interest
DEDEA Economic Development and reporting
DEDEA Environmental Authorisation
DEDEA Provincial Emissions Reductions
EC Provincial Renewable Energy Working Group.
Promotion and coordination of RE in the EC.
Eskom Grid Connection, Transmission and Power Purchase.
ECDC Renewable Investment Promotion
IDC Green Energy Investment
National Department of Energy
Policy and administrative support
DNA Registration of carbon projects under the CDM
NERSA Licensing.
DEDEA Strategic Responses to Climate Change Risks
Local Municipalities Municipal reticulation and Power Purchase
ELIDZ and Coega IDZ
Investment promotion and technology support.
Border-Kei Chamber of Commerce
Investment and Market Development
Port Elizabeth Regional Chamber of Commerce and Industry
Investment and Market Development
Other key stakeholders
Other interested parties
• Businesses (and other) customers for renewable energy services
• Regional Electricity Distributor
• Private sector suppliers and service providers Overview of the issue:
Effective implementation of services which can benefit from technologies which mitigate GHG emissions is highly dependent on a good regulatory and institutional environment. Key regulatory mechanisms in the Renewable Energy Industry include: • Procurement guidelines and procedures for renewable energy services • Standards and Codes of Practice • Secure and long-term access to markets

96 Eastern Cape Climate Change Response Strategy
• Licensing and permitting • Clear guidance and mechanisms for RE – inclining block tariffs A key question is the institutional environment for regulatory oversight. At this stage, in the electricity sector, the centralised, highly regulated, bureaucratic energy generation and transmission sector is arguably constricting the development of an independent RE production sector in the province. Either decentralisation or deregulation is required, or an enabling institutional framework (in which real capacity exists) should be set up. Conversely, local planners could use regulations to encourage technology rollout by linking requirements for energy efficiency and other technology options into planning permission (building plans, rezoning, EIA RODs, SDFs). However, for these requirements to have any teeth, they need to be backed up by legislation, adopted policy, guidelines and/or scientific evidence of effectiveness. Furthermore, the role of renewable energy is broader than only electricity generated on the national grid from renewable energy and includes direct and on-site provision of energy services, such as heated water, and decentralised generation of electricity or gas. It is apparent that three bottlenecks to unlocking the industry exist in the province, namely:
• Institutional fragmentation and lack of clarity, information and support in regard to (among others):
• Licensing;
• Permitting;
• Environmental authorisation;
• Zoning and municipal permission;
• Power purchase agreements;
• Grid access and transmission codes of practice;
• Regulatory conditions; and
• Access to incentives.
• The above deterrents to investment can be overcome at the provincial level by the formation of a provincial renewable energy board or investment one-stop-shop to coordinate or streamline the regulatory process, facilitate access to decision-makers, and guide the investor through the various regulatory hurdles associated with independent power production.
• Independent access to markets. In other words, where Independent Power Producers (IPPs) are not selected for Eskom/DoE/Independent System Operator Power Purchase Agreements, they should have recourse to independently supplying directly to purchasers of clean energy. The province can facilitate an independent Clean Energy Market in order to attract investors through the formation of a Clean Energy Purchasing Power Pool, or supporting the independent brokerage of clean energy. Ideally such arrangements would resolve the difference between the long term investment cycle of IPPs (20 years) and the short term purchase cycle of industry (3 to 5 years).
• Investors are currently deterred by the lack of supporting institutions, services and infrastructure in the province. In particular there is a requirement for appropriate skills, testing facilities, R&D facilities and maintenance services. The province can improve the RE investment

97 Eastern Cape Climate Change Response Strategy
climate by establishing a Clean Energy Centre or Clean Energy Incubator. Such a centre should incorporate, among others:
• Technology testing and certification facilities;
• Training and skills development facilities;
• Research and development facilities.
Locality All jurisdictions Existing Policies, Programme(s)/Project(s)
• Provincial Energy Strategy Development Process (In Process)
• ELIDZ Renewable Energy Study (AGAMA Energy)
• Renewable Energy Feed-in Tariff (REFIT), Regulatory Guidelines (National);
• The Biofuels Industrial Strategy of South Africa (2007)
• White Paper on Renewable Energy Policy, 2003 (currently under review)
• National Industrial Policy Action Plan.
Regulatory and Legislative Framework
Relevant legislation
• Electricity Act, 1987
• National Energy Regulator Act, 2004 (No. 40 of 2004)
• Energy Act, 2008 Electricity Distribution Industry (EDI) Restructuring Bill (April 2003)
• National Environmental Management Act (Act 107 of 1998)
• National Environmental Management: Air Quality Act (Act 163 of 2004)
Management Tool(s): • Wind Atlas for South Africa (South African Wind Energy Programme)
• Data in Renewable Energy Strategy (DEDEA and ELIDZ)
Indicators of State • Access to energy services
• Proportion of renewable energy in provincial energy mix;
• Ration of installed energy in the Eastern Cape against National total installed energy.
• Provincial GHG emissions avoided through renewable energy generation
• Employment in the renewable energy sector
• Water consumption by the renewable energy sector
• Economic activity.
Management Performance Indicators
As for targets

98 Eastern Cape Climate Change Response Strategy
CLIMATE CHANGE PROGRAMMES
Mitigation
Programme Title: Promotion of Renewable Energy in the EC
OBJECTIVE(S)
Overall objective:
• Create an enabling environment for investment in, and implementation and use of clean energy in the Eastern Cape. Sub-objectives:
• Initiate a provincial renewable energy body to promote and facilitate renewable energy markets and investment in the Eastern Cape (including renewable energy one-stop-shop).
Target(s):
• Initiate a provincial renewable energy investment one-stop-shop by 20xx, including:
• Quantifying and characterization of the markets for renewable energy
• Determination of energy targets for utilization of renewable energy
• Development of departmental, municipal and industrial procurement guidelines for energy services or energy provided from renewable energy
• Facilitated access for energy suppliers / generators to utilities such as transmission grid, water services etc;
• Facilitated licensing and permitting for suppliers / generators – energy generation licenses, water use licenses, civil aviation regulations;
• Facilitated environmental authorization for suppliers / generators – provincial RE Strategic Environmental Assessment (to engage with national process)
• Facilitated Power Purchase Agreements.
• Facilitated access to incentives.
• Overcome institutional obstacles – MFMA, PFMA.

99 Eastern Cape Climate Change Response Strategy
No Activity Responsible Person Budget Requirements
Starting Date Completion Date Comments
1 Commission a concept study and business plan for the formation of a provincial renewable energy facilitatory body
DEDEA Economic Development
R250,000.00 March 20xx August 20xx Study to assess and recommend an institutional structure and lines of communication to suit the goals of the renewable energy body Study to assess the potential legal position and potential statutory powers of the body.
2 Commission a study to quantify and characterise the markets for renewable energy utilization in the EC province
DEDEA Economic Development
R500,000.00 March 20xx August 20xx The study should be aligned to the Purchasing Pool action plan.

100 Eastern Cape Climate Change Response Strategy
CLIMATE CHANGE PROGRAMMES
Mitigation
Programme Title: Promotion of Renewable Energy in the EC
OBJECTIVE(S)
Overall objective: - Create an enabling environment for investment in, and implementation and use of clean energy in the Eastern Cape Sub-objectives: - Initiate a clean energy purchasing pool by 20xx
Target(s): - Initiate a clean energy purchasing pool by 20xx
No Activity Responsible Person Budget Requirements
Starting Date Completion Date Comments
1 Commission a Renewable Energy Purchasing Pool feasibility study and business plan.
DEDEA Economic Development
R350,000.00 March 20xx August 20xx Study should generate a database of willing buyers with data on how much renewable energy is required, over what period the energy is required and what the customer is willing to pay for certified renewable energy.

101 Eastern Cape Climate Change Response Strategy
CLIMATE CHANGE PROGRAMME
Mitigation
Programme Title: Promotion of Renewable Energy in the EC
OBJECTIVE(S)
Overall objective:
• Create an enabling environment for investment in, and implementation and use of clean energy in the Eastern Cape Sub-objectives:
• Initiate the development of a renewable energy centre/incubator by 20xx Target(s):
• Initiate a renewable energy centre/incubator by 20xx, incorporating:
• Technology testing and certification facilities;
• Training and skills development facilities;
• Research and development facilities.
No Activity Responsible Person Budget Requirements
Starting Date Completion Date Comments
1 Commission a feasibility study and business plan for a provincial renewable energy centre or incubator.
DEDEA Economic Development
R 500,000.00 March 20xx August 20xx Study to incorporate: Technology testing and certification facilities; Training and skills development facilities; Research and development facilities. Possible functions of the body to include: Facilitated access to utilities such
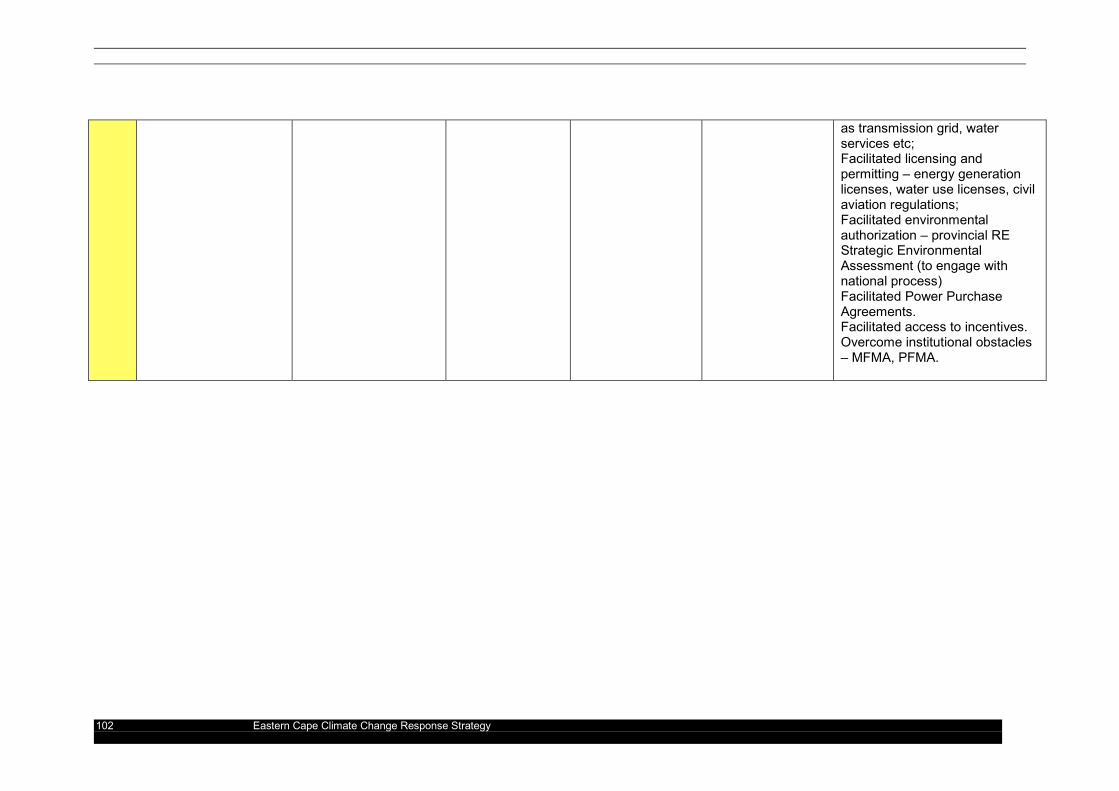
102 Eastern Cape Climate Change Response Strategy
as transmission grid, water services etc; Facilitated licensing and permitting – energy generation licenses, water use licenses, civil aviation regulations; Facilitated environmental authorization – provincial RE Strategic Environmental Assessment (to engage with national process) Facilitated Power Purchase Agreements. Facilitated access to incentives. Overcome institutional obstacles – MFMA, PFMA.

103 Eastern Cape Climate Change Response Strategy
CLIMATE CHANGE PROGRAMME
Mitigation
Programme Title: Promotion of Renewable Energy in the EC
Outcomes of the EC Renewable Energy Working Group Workshop: 22 Nov 2010 – Policy and Regulatory Sub-Group.

104 Eastern Cape Climate Change Response Strategy

105 Eastern Cape Climate Change Response Strategy

106 Eastern Cape Climate Change Response Strategy
Mitigation and Opportunities for Rural Livelihoods

107 Eastern Cape Climate Change Response Strategy
Date: August 2010
Revision No: Draft for development
Prepared By:
DEDEA
CLIMATE CHANGE PROGRAMME ------------- Mitigation
Approved By:
CC Programme Mitigation and Opportunities for Sustainable Rural and Urban Settlement.
Programme Custodian
DEDEA (Economic Development)
Objective(s): Overall objective:
• Facilitate integrated lead projects that promote sustainable livelihoods and local economic development17 while achieving (tradable) emission reductions.
Target(s): Targets:
• Initiate provincial indigenous reforestation/rehabilitation programmes for registration as a carbon offset project by 20xx
• Initiate provincial rural lead projects: rural renewable energy generation and use centre and carbon offset project by 20xx.
• Initiate provincial rural lead projects: emission reductions and renewable energy from the diversion and utilization of organic waste by 20xx.
Name Unit Interest DEDEA Economic Development
DEDEA Environmental Rehabilitation
DEDEA Provincial Emissions Reductions
DEDEA Energy from Waste
Eskom Grid Connection, Transmission and Power Purchase.
ECDC Renewable Investment Promotion
National Department of Energy
Regulatory
NERSA Licensing.
DEDEA Strategic Responses to Climate Change Risks
Working for Energy Biomass Residue to Energy
South African National Energy Research Institute (SANERI)
Resources
SANBI Climate Change and Biodiversity
Other key stakeholders
Working for Water Biomass Revenue
17 Rural renewable energy and mitigation programmes may have implications for rural-urban configurations, population migration, and transport.

108 Eastern Cape Climate Change Response Strategy
Expanded public works programme.
Job creation.
Other interested parties
• Rhodes University Environmental Science Department
• R3G Restoration Research Group (Rhodes University and NMMU).
• Eastern Cape Social and Economic Consultative Forum (ECSECC)
• RuLiv.
Overview of the issue:
Although GHG emissions primarily occur as a result of urban and industrial activity, opportunities exist in rural areas for emission mitigation projects. Mitigation projects have a high employment ratio and therefore go hand in hand with rural development projects. Climate change mitigation has the potential to reform rural-urban settlement relationships and patterns. The potential of renewable energy for sustainable settlements and local economic development is illustrated by the example of the experimental biomass gasification unit at Melanie Village near Alice in the Tyume River valley (Mamphweli and Meyer 2008). The system is designed to run a 200 kW generator at 75% capacity, utilising 150 kg of biomass per hour. Biomass feedstock is sourced from wood waste generated at a nearby sawmill. The wood waste would otherwise be incinerated. Energy generated from biomass residue is considered to be renewable. 200kW of electricity generated for 16 hours a day for a year produces 1,168 MWh of renewable electricity. This results in avoided emissions from coal fired power stations of 1,144 tons of CO2e. In addition to renewable energy generation, the project is intended as a rural community upliftment initiative. Ten previously unemployed people have been contracted and trained as gasifier operators. The draft business plan indicates that employee numbers could be doubled through establishment of small business enterprises. Those activities identified in the business plan will need new skills, requiring funding for skills-development. The electricity generated from the producer gas will be available to a bakery and a grain mill, and business plans for these two enterprises have been completed Other opportunities exist in carbon sequestration from reforestation and sustainable landuse management practices; and waste to energy projects.
Locality All jurisdictions Existing Policies, Programme(s)/Project(s)
• Provincial Energy Strategy Development Process (In Process)
• ELIDZ Renewable Energy Study
• Renewable Energy Feed-in Tariff (REFIT), Regulatory Guidelines (National);
• The Biofuels Industrial Strategy of South Africa (2007)
• White Paper on Renewable Energy Policy, 2003 (currently under review)
• National Industrial Policy Action Plan.
Regulatory and Legislative Framework
• Relevant legislation
• Electricity Act, 1987
• National Energy Regulator Act, 2004 (No. 40 of 2004)
• Energy Act, 2008 Electricity Distribution Industry (EDI) Restructuring Bill (April 2003)
• National Environmental Management Act (Act 107 of 1998)
• National Environmental Management: Air Quality Act (Act 163 of 2004)

109 Eastern Cape Climate Change Response Strategy
Management Tool(s):
Indicators of State • Ratio of renewable energy in provincial energy mix;
• Ratio of installed energy in the Eastern Cape against National total installed energy.
• Provincial GHG emissions avoided through renewable energy generation.
• Ratio of renewable energy in provincial energy mix;
• Ratio of installed energy in the Eastern Cape against National total installed energy.
• Provincial GHG emissions avoided through renewable energy generation.
Management Performance Indicators
• As per targets, and tons of CO2e avoided through these projects.

110 Eastern Cape Climate Change Response Strategy
CLIMATE CHANGE PROGRAMMES
Mitigation
Programme Title: Mitigation and Opportunities for Rural Livelihoods
OBJECTIVE(S)
Overall objective:
• Facilitate integrated lead projects that promote sustainable livelihoods and local economic development while achieving (tradable) emission reductions.
Target(s):
• Initiate provincial indigenous reforestation/rehabilitation programme for registration as a carbon offset project by 20xx
No Activity Responsible Person Budget Requirements
Starting Date Completion Date Comments
1 Commission a concept study and business plan for a reforestation/rehabilitation programme which takes advantage of formal/informal carbon finance and climate change mitigation funds.
DEDEA Economic Development
R250,000.00 March 20xx August 20xx Draw from work already undertaken by the R3G Restoration Group in regard to rehabilitation with Spek Boom.

111 Eastern Cape Climate Change Response Strategy
CLIMATE CHANGE PROGRAMMES
Mitigation
Programme Title: Mitigation and Opportunities for Rural Livelihoods
OBJECTIVE(S)
Overall objective:
• Facilitate integrated lead projects that promote sustainable livelihoods and local economic development while achieving (tradable) emission reductions.
Target(s):
• Initiate provincial rural lead project: rural renewable energy generation and use centre and carbon offset project by 20xx.
No Activity Responsible Person Budget
Requirements Starting Date Completion Date Comments
1 Commission a concept study and business plan for a rural renewable energy generation and use centre and carbon offset project by 20xx.
DEDEA Economic Development
R250,000.00 March 20xx August 20xx Draw from lessons learned at Fort Hare community biomass electricity generation project. Draw from research of CSIR and Steve Szewczuk on rural off-grid energy in the EC. Distributed rural energy generation centres should be seen as catalysts for local economic development. Emphasis should be placed on the development or testing of a rural energy model for further rollout.

112 Eastern Cape Climate Change Response Strategy
CLIMATE CHANGE PROGRAMMES
Mitigation
Programme Title: Mitigation and Opportunities for Rural Livelihoods
OBJECTIVE(S)
Overall objective:
• Facilitate integrated lead projects that promote sustainable livelihoods and local economic development while achieving (tradable) emission reductions
Target(s):
• Initiate provincial rural lead projects: emission reductions and renewable energy from the diversion and utilization of organic waste by 20xx.
No Activity Responsible Person Budget
Requirements Starting Date Completion Date Comments
1 Commission a concept study and business plan for a waste-based emission reductions and renewable energy project.
DEDEA Economic Development
R250,000.00 March 20xx August 20xx Elements of the project include: Waste separation at source; Waste sorting post-separation; Formalised measurement of organic diverted from landfill; and Renewable energy generation from organic waste.

113 Eastern Cape Climate Change Response Strategy
Mitigation in Solid Waste and Wastewater Treatment

114 Eastern Cape Climate Change Response Strategy
Date: August 2010
Revision No: Draft for development
Prepared By:
DEDEA
CLIMATE CHANGE PROGRAMME ------------- Mitigation
Approved By:
CC Programme
Mitigation in Solid Waste and Wastewater Treatment
Programme Custodian
DEDEA Waste Management
Objective(s): Overall objective:
• Reduction in organic waste to landfill, renewable energy from waste, and methane use or destruction
Sub-objectives: 1 Reduction in organic waste to landfill 2 Conversion of organic portion of waste to compost or energy; and
methane use or destruction. 3 Promote provincial pilot waste to energy projects.
Target(s): Targets:
• Campaign for reduction in organic waste streams in household waste;
• Separation of organic canteen, industrial, catering and garden waste from waste-stream at source or through waste-sorting facilities;
• Promotion of organic waste beneficiation projects, including composting projects and waste to energy projects from pyrolysis, gasification, incineration and bio-digestion.
Name Unit Interest
DEDEA Provincial Integrated Waste Management
NMBM Nelson Mandela Bay BRT
BCM BCM BRT
Local Municipalities Solid Waste Management
District Municipalities Water and Waste Water Treatment
IWMSA-EC Industry Association
Other key stakeholders
Other interested parties
• Businesses
• Private Waste Management Companies.

115 Eastern Cape Climate Change Response Strategy
Overview of the issue:
Organic waste contributes to Greenhouse Gas Emissions by the release of methane gas through decomposition under anaerobic conditions (in other words when the waste is not exposed to air). Methane gas has 23 times the greenhouse gas effect of Carbon dioxide. In other words, 1 ton of methane is the equivalent of 23 tons of Carbon dioxide. Methane gas is most often generated when organic waste such as garden waste, wood, food waste, paper and cardboard are disposed of at landfill, or when sewage sludge or wastewater/effluent is treated in anaerobic digesters or in certain settling ponds where the biogas is allowed to vent to the atmosphere. Greenhouse gas emissions from solid waste can be avoided by the diversion of organic waste streams from landfill and the conversion to compost (composting does not generate methane) or conversion to energy. Emissions from waste-water can be avoided through the capture of methane and use as an energy source. Greenhouse gas emissions are also caused through the inefficient use of electricity in waste-water treatment. Certain treatments systems and technologies are more efficient than others.
Locality All jurisdictions Existing Policies, Programme(s)/Project(s)
• National Waste Management Strategy
• Eastern Cape Integrated Waste Management Plan
• District and Local Municipal Waste Management Plans
• National Green Economy Summit.
Regulatory and Legislative Framework
Relevant legislation
• National Environmental Management: Waste Management Act;
• National Environmental Management: Air Quality Act.
Management Tool(s): • National Waste Information System
Indicators of State • Organic waste-stream as a percentage of total waste going to landfill;
• Tons of organic waste disposed of in landfill per year;
• Tons of organic waste composted or beneficiated as energy per year.
• Number of successfully operating waste sorting facilities operating in the province;
• Number of garden refuse stations or composting facilities operating at landfills in the province;
• Number of waste-to-energy projects successfully operating in the province;
• Established pilot programmes of recycling, biogas or composting.
Management Performance Indicators
As for targets

116 Eastern Cape Climate Change Response Strategy
CLIMATE CHANGE PROGRAMMES
Mitigation
Programme Title: Mitigation in Solid Waste and Wastewater Treatment
OBJECTIVE(S)
Overall objective:
• Reduction in organic waste to landfill, renewable energy from waste, and methane use or destruction Sub-objectives:
• Reduction in organic waste to landfill Target(s):
• Campaign for reduction in organic waste streams in household waste;
• Separation of organic canteen, industrial, catering and garden waste from waste-stream at source or through waste-sorting facilities.
• No Activity Responsible Person Budget
Requirements Starting Date Completion Date Comments
1 Initiation of a feasibility study and business plan for a household organic waste separation and recycling/composting plan and awareness campaign.
DEDEA Waste Management
R250,000.00 March 20xx August 20xx Should be integrated with a household waste paper and cardboard collection or drop-off system. Project to focus on job-creation potential of waste management. The project needs to cut across the income range. In other words from Duncan Village to Bunkers Hill.
Initiate a provincial review DEDEA Waste R250,000.00 March 20xx August 20xx Organics have value and should

117 Eastern Cape Climate Change Response Strategy
of incentives for waste separation at source, and disincentives for disposal or organic waste at landfill sites.
Management stay in the community.
Initiate a provincial management audit of current and planned waste sorting facilities in the province. This should be in parallel with an awareness campaign for such facilities.
DEDEA Waste Management
R250,000.00 March 20xx August 20xx The audit should aim to understand success stories and obstacles to the successful operation of such facilities. The Audit should highlight lessons learned to date and recommendations for the successful operation of waste sorting facilities.
Engage with retail outlets in regard to the development of corporate green policies/waste management policies where recycling is promoted.
DEDEA Waste Management
Ongoing Ongoing

118 Eastern Cape Climate Change Response Strategy
CLIMATE CHANGE PROGRAMMES Mitigation
Programme Title: Mitigation in Solid Waste and Wastewater Treatment
OBJECTIVE(S)
Overall objective:
• Reduction in organic waste to landfill, renewable energy from waste and methane use or destruction Sub-objectives:
• Promote provincial pilot waste to energy projects. Target(s):
• Promotion of organic waste beneficiation projects, including composting projects and waste to energy projects from pyrolysis, gasification, incineration and bio-digestion.
No Activity Responsible Person Budget
Requirements Starting Date Completion Date Comments
1 Identify and promote the development of at least one waste separation or diversion and conversion to energy project.
DEDEA Waste Management
R300,000.00 March 20xx August 20xx Strong opportunities exist and studies are under way for sewage anaerobic biodigestion and methane-to-energy projects. A DBSA feasibility study is underway for the anaerobic treatment of sewage that is currently released as a marine outfall.

119 Eastern Cape Climate Change Response Strategy
Greenhouse Gas Mitigation in Transport Note that the programme detailed below focuses on modal shift in transport and efficient transport systems and planning. The programme does not deal with fuel efficiency in motor vehicles since it is expected that incentives and penalties associated with fuel efficiency will be dealt with at a national level (for example the National Carbon Tax on new passenger vehicles introduced in September 2010).

120 Eastern Cape Climate Change Response Strategy
Date: August 2010
Revision No: Draft for development
Prepared By:
DEDEA
CLIMATE CHANGE PROGRAMME ------------- Mitigation
Approved By:
CC Programme
Greenhouse Gas Mitigation in Transport
Programme Custodian
MEC for Eastern Cape Department and Transport
Objective(s): Overall objective:
• Facilitate shift to low greenhouse gas modes of transport and transport systems
Sub-objectives: 1 Effective mass transit and rail systems in cities integrated with
regional transport systems; 2 Disincentives18 and incentives for shift from private to public modes of
transport. 3 Urban planning and SDFs to support urban/settlement densification
and alignment around transport corridors to make mass transport more feasible.
Target(s): Targets:
• Effective and integrated city and regional transport systems (including mass transport) operational by 2013.
• Undertake a study of options and mechanisms for promoting a modal shift towards the use of public transport systems, including a study of possible incentive schemes
• Reassess urban planning and transport infrastructure to optimize use in terms of GHG emissions.
• Provincial government and municipalities to shift to carbon efficient fleets by 20XX19.
• Name Unit Interest
NMBM Nelson Mandela Bay BRT
BCM BCM BRT
Other key stakeholders
EC Dept Roads and Transport
Provincial Transport Planning
18 A shift from private to public modes of transport will require an extensive mindset change. 19 Appropriate procurement by provincial and local government will influence public perception and support the local manufacture of low carbon vehicles.

121 Eastern Cape Climate Change Response Strategy
Treasury Finance and subsidies
Metrorail Urban Passenger Rail
Passenger Rail Agency of South Africa
Urban and Regional Passenger Rail
National Transport Response Strategy.
National DoT Management of Subsidies.
Other interested parties
Businesses (and other) customers for renewable energy services Private transport corporations and taxi industries.
Overview of the issue:
The combustion of petrol, diesel and aviation fuel accounted for the emission of 13,494,876 tons of Carbon Dioxide in the Eastern Cape in 2008. This represents more than half of emissions from all energy sources and 35% of emissions from all sources combined in the province. Private passenger transport is the dominant mode in the transport sector and accounts for the majority of fuel use. Even a 10% shift from private to public modes of passenger transport will result in a significant reduction in Greenhouse Gas Emissions and local air pollution. The deputy minister of transport, on the 26th of October 2010, noted the following in regard to green transport (Engineering News Online 27/10/2010): • Removing excess road use and improving efficiencies on South Africa's roads seems to be the most viable option to reducing the transport sector's carbon emissions in the short term. • South Africans, especially middle-class users, are largely still dependent on the use of private vehicles. • It is necessary to make it more expensive for people and freight to use their cars and trucks on the roads and move them onto other modes of transport • Viable transport alternative would be required, which would take significant investment to put in place. • The absence of significant investment over the last 30-plus years has lead to the degradation of the country's rail system. It will cost more to refurbish the system than to recapitalise it and procure new systems. • The recapitalisation would take place in stages over the next 18 years. • The recapitalisation will have a strong local focus in terms of procurement and manufacturing of the fleet and technologies. The world watch institute recommends the following for a shift to greener transport systems: • Substantial and sustained investments in rail and light rail (while limiting highway spending principally to repairs of crumbling infrastructure such as bridges). • Overhauling policies to stimulate denser settlements that permit public transit, reduce reliance on motorized transportation, and make biking and walking realistic options. • Overall, such a course would stimulate innovation, reduce carbon emissions and air pollutants, inject urban and suburban areas with new vigor and vitality, and generate or retain large numbers of well-paying jobs. A shift from private road transport to other forms of transport would facilitate

122 Eastern Cape Climate Change Response Strategy
improved fuel efficiency per passenger kilometre. Efficiencies for different transport modes are given in Table 4. Passenger fuel efficiency for five passenger transport modes (Source: UNEP 2008)
Locality All jurisdictions Existing Policies, Programme(s)/Project(s)
• Proposed BRT system for BCM;
• Proposed BRT project for Nelson Mandela Bay municipality;
• Provincial and Municipal Transport Plans;
• Metrorail Plan (sections relevant to EC)
• Transnet Plan (sections relevant to EC)
Regulatory and Legislative Framework
Relevant legislation
• White Paper on National Transport Policy (1996)
Management Tool(s):
Indicators of State • Passenger modal split;
• Number of new passenger vehicles registered per year;
• Annual Provincial Petrol and Diesel consumption.
• Management Performance Indicators
As for targets

123 Eastern Cape Climate Change Response Strategy
CLIMATE CHANGE PROGRAMMES
Mitigation
Programme Title: Greenhouse Gas Mitigation in Transport
OBJECTIVE(S)
Overall objective:
• Facilitate shift to low greenhouse gas modes of transport and transport systems Sub-objectives:
• Effective mass transit and rail systems in cities integrated with regional transport systems; Target(s):
•
• Effective and integrated city and regional transport systems (including mass transport) operational by 20xx
No Activity Responsible Person Budget Requirements
Starting Date Completion Date Comments
1 Formation of a provincial integrated passenger transport task team with a greenhouse gas emission reduction mandate.
EC Dept Roads and Transport
R100,000.00 March 20xx Ongoing

124 Eastern Cape Climate Change Response Strategy
CLIMATE CHANGE PROGRAMMES
Mitigation
Programme Title: Greenhouse Gas Mitigation in Transport
OBJECTIVE(S)
Overall objective:
• Facilitate shift to low greenhouse gas modes of transport and transport systems Sub-objectives:
• Disincentives and incentives for shift from private to public modes of transport. Target(s):
• Undertake a study of options and mechanisms for promoting a modal shift towards the use of public transport systems, including a study of possible incentive schemes
No Activity Responsible Person Budget Requirements
Starting Date Completion Date Comments
1 Undertake a study of options and mechanisms for promoting a modal shift towards the use of public transport systems, including a study of possible incentive schemes
EC Dept Roads and Transport
R500,000.00 March 20xx March 20xx

125 Eastern Cape Climate Change Response Strategy
Appendix 3: List of Climate Change Adaptation and Mitigation Projects Funded by Multilateral and Bilateral Climate Change Funds (March 2011)

126 Eastern Cape Climate Change Response Strategy
List of Climate Change Adaptation and Mitigation Projects Funded by Multilateral and Bilateral Climate Change Funds (Source: Climate Funds Update20)
Disbursed to: name and link Fund (click for overview)
Amount disbursed (USD millions)
25,000 Solar Roofs International Climate Initiative $4.65
100% renewable island of Santa Cruz, Galapagos Islands International Climate Initiative $1.13
1000 Roofs Programme: Disseminating Solar Thermal Hot Water Production International Climate Initiative $1.55
A Policy Forum of Power Sector Regulatory Frameworks for On-grid Renewable Energies GEF Trust Fund - CC focal area $1.00
Achieving Conservation and Improving Livelihoods through the Sustainable Management of Community-Based Forest Operations in Cameroon Congo Basin Forest Fund $1.72
Achieving Reduction in GHG Emissions through Advanced Energy Efficiency Technology in Electric Motors GEF Trust Fund - CC focal area $0.25
Action for the Development of Marshall Islands Renewable Energies (ADMIRE) GEF Trust Fund - CC focal area $0.98
Action Plan for Sustainable Energy Supply for the 2014 Winter Olympics in Sochi International Climate Initiative $0.28
Adaptation in the coastal zones of Mozambique Adaptation in the coastal zones of Mozambique Least Developed Countries Fund $4.43
Adaptation to CC and Conservation of Biodiversity through Protection and Sustainable Use of Wetlands International Climate Initiative $1.35
Adaptation to CC Impacts in Mountain Forest Ecosystems of Armenia Strategic Priority on Adaptation $1.05
Adaptation to CC Impacts on the Coastal Wetlands Special CC Fund $4.50
Adaptation to CC in Arid Lands (KACCAL) Special CC Fund $6.50
Adaptation to CC in the Nile Delta Through Integrated Coastal Zone Management Special CC Fund $4.00
Adaptation to CC through Effective Water Governance Special CC Fund $3.00
Adaptation to CC to Sustain Jordan’s MDG Achievements MDG Achievement Fund – Environment and CC thematic window $1.33
Adaptation to CC Using Agrobiodiversity Resources in the Rain Fed Highlands of Yemen Strategic Priority on Adaptation $4.62
Adaptation to CC - Responding to Coastline Change and its Human Dimensions in West Africa through Integrated Coastal Area Management Strategic Priority on Adaptation $4.36
Adaptation to coastal erosion in vulnerable areas Adaptation Fund
Adaptation to the effects of drought and CC in Agro-ecological Zone 1 and 2 in Zambia Least Developed Countries Fund $3.45
Adapting to CC and Conserving Biological Diversity International Climate Initiative $3.64
Adapting to CC by Improving Water Resources Management International Climate Initiative $2.25
Adapting to CC through the Improvement of Traditional Crops and Livestock Farming Strategic Priority on Adaptation $1.09
Adapting Water Resource Management in Comoros to Increase Capacity to Cope with CC Least Developed Countries Fund $3.40
Addressing CC Risks on Water Resources in Honduras: Increased Systemic Resilience and Reduced Vulnerability of the Urban Poor Adaptation Fund
20 http://www.climatefundsupdate.org/

127 Eastern Cape Climate Change Response Strategy
Adequação ambiental da propriedade rural: controle de desmatamento de conservação da biodiversidade da Amazônia Legal (TNC-Brasil) Amazon Fund (Fundo Amazônia) $8.80
Adrar Solar Initiative and Decentralized Electrification in the Northern Coastline of Mauritania through Hybrid (Wind/Diesel) Systems GEF Trust Fund - CC focal area $2.70
Advancing the Micronesia Challenge through New Protected Areas International Climate Initiative $2.09
Advice on Implementing the Sustainable Energy Financing Facility International Climate Initiative $2.91
African Carbon Asset Development (ACAD) Facility International Climate Initiative $1.62
African Rift Geothermal Development Facility (ARGeo) GEF Trust Fund - CC focal area $17.75
Alternatives to Mangrove Destruction for Women's Livelihoods in Central Africa Congo Basin Forest Fund $0.38
Armenia Energy Efficiency Project GEF Trust Fund - CC focal area $1.82
ARPA (Fundo Brasileiro para a Biodiverdidade - Funbio)Programas Bolsa Floresta Associação, Renda e Programas de Apoio (Fundação Amazonas Sustentável - FAS) Amazon Fund (Fundo Amazônia) $11.00
Asia Pacific Forestry Skills and Capacity Building International Forest Carbon Initiative $6.60
Barrier Removal to Namibian Renewable Energy Programme (NAMREP), Phase II GEF Trust Fund - CC focal area $2.60
Barrier Removal to the Cost-Effective Development and Implementation of Energy Standards and Labeling Project (BRESL) GEF Trust Fund - CC focal area $6.80
BECCAP: Basic Energy CC Adaptation Programme International Climate Initiative $2.40
Benin Energy Efficiency Program GEF Trust Fund - CC focal area $1.82
Bilateral package of support on forests and climate International Forest Carbon Initiative $6.50
Biodiversity Conservation through Preparatory Measures for Avoided Deforestation (REDD) in the Merang Peat Forest Area International Climate Initiative $2.18
Bioenergy for Sustainable Rural Development GEF Trust Fund - CC focal area $3.00
Bioenergy in the Caribbean International Climate Initiative $0.40
Biomass Energy for Employment and Energy Security Project GEF Trust Fund - CC focal area $0.97
Bonobo Conservation Concession in Equateur Province in Democratic Republic of Congo Congo Basin Forest Fund $0.00
Building Adaptive Capacity and Resilience to CC in Afghanistan Least Developed Countries Fund $4.90
Building Adaptive Capacity and Resilience to CC in the Water Sector in Cape Verde Least Developed Countries Fund $3.00
Building Capacity to Establish National Greenhouse Gas Inventories for the Forestry Sector International Climate Initiative $4.65
Building Foundations for Success: Community Participation is Central to REDD Congo Basin Forest Fund $2.03
Building the Capacity of the Agriculture Sector in DR Congo to Plan for and Respond to the Additional Threats Posed by CC on Food Production and Security Least Developed Countries Fund $3.00
Building the Local Capacity for Promoting Energy Efficiency in Private and Public Buildings GEF Trust Fund - CC focal area $0.98
Buildings Sector Energy Efficiency Project (BSEEP) GEF Trust Fund - CC focal area $5.00
Bus Rapid Transit and Pedestrian Improvements in Jakarta GEF Trust Fund - CC focal area $5.81
Business Networks for Climate Protection and Energy Efficiency International Climate Initiative $0.67
Capacity Development for Climate Protection International Climate Initiative $2.55
Carbon Accounting data purchase International Forest Carbon Initiative $3.00
Carbon-Financed Forest Management in Tropical Rainforest Heritage of Sumatra International Climate Initiative $0.78
Catalytic Investments for Geothermal Power GEF Trust Fund - CC focal area $2.73
CDM Watch: strengthening civil society participation in Southern countries in implementing and developing the CDM International Climate Initiative $0.46

128 Eastern Cape Climate Change Response Strategy
CD-REDD: Reducing Emissions from Deforestation in Developing Countries International Climate Initiative $1.12
CF Industrial Energy Efficiency for Malaysian Manufacturing Sector (IEEMMS) GEF Trust Fund - CC focal area $4.20
CF: Industrial Energy Efficiency GEF Trust Fund - CC focal area $3.17
CF: Industrial Energy Efficiency GEF Trust Fund - CC focal area $3.62
CF: Promoting Energy Efficiency in the Industries through System Optimization and Energy Management Standards GEF Trust Fund - CC focal area $2.18
Chiller Energy Efficiency Project GEF Trust Fund - CC focal area $2.60
Chiller Energy Efficiency Project GEF Trust Fund - CC focal area $3.66
Chiller Energy Efficiency Project - under the Programmatic Framework for Energy Efficiency GEF Trust Fund - CC focal area $6.30
China Energy Efficiency Promotion in Industry GEF Trust Fund - CC focal area $4.00
CIFOR International Forest Carbon Initiative $2.30
Cities in Asia develope Climate Sensitive Adaptation Plans International Climate Initiative $2.18
CleanTech Fund GEF Trust Fund - CC focal area $1.00
Climate Adaptation for Rural Livelihoods and Agriculture (CARLA) Least Developed Countries Fund $3.00
CC adaptation project in the areas of watershed management and water retention Least Developed Countries Fund $5.00
CC Adaptation Project, Phase I Special CC Fund $4.97
CC Mitigation and Primary Forest Conservation – A Best-Practice Management Scheme for Wild Coffee Forests in Ethiopia International Climate Initiative $4.78
CC Mitigation in Five Representative Ecosystems International Climate Initiative $2.33
CC Risk Management in Egypt MDG Achievement Fund – Environment and CC thematic window $2.86
CC scenarios for the Congo Basin International Climate Initiative $2.28
Climate Finance Innovation Support Facility International Climate Initiative $2.98
Climate Impacts: Global and Regional Adaptation Support Platform (CI: GRASP) International Climate Initiative $2.70
Climate Protection and Distributed Energy Supply - Indo-German Energy Forum International Climate Initiative $1.83
Climate protection and electric transport International Climate Initiative $5.25
Climate Protection and Renewable Energy as an Opportunity for the Private Sector, Policy-Makers and Civil Society International Climate Initiative $0.23
Climate Protection in Nature-Based Tourism International Climate Initiative $1.23
Climate Protection Programme in Support of the South African Department of Environmental Affairs International Climate Initiative $3.87
Climate-Neutral Energy Supply for Rural Areas International Climate Initiative $3.89
Climate-Related Modernisation of National Forest Policy and Piloting of REDD Measures International Climate Initiative $4.05
Climate-resilient Infrastructure Planning and Coastal Zone Development Special CC Fund $3.40
Climate-Tolerant Restoration of Degraded Bioregions International Climate Initiative $1.78
Coal Fired Generation Rehabilitation Project GEF Trust Fund - CC focal area $45.40
Coastal and Marine Resources Management in the Coral Triangle of the Pacific Strategic Priority on Adaptation $1.00
Coastal and Marine Resources Management in the Coral Triangle: Southeast Asia Strategic Priority on Adaptation $1.00
Cogen for Africa GEF Trust Fund - CC focal area $5.25
Community Based Adaptation to CC through Coastal Afforestation Least Developed Countries Fund $3.30
Community Based Adaptation (CBA) Programme Strategic Priority on Adaptation $5.51

129 Eastern Cape Climate Change Response Strategy
ComSolar: Marketing solar energy in urban regions and industrial zones International Climate Initiative $7.35
Concentrating Solar Power Technology Transfer for Electricity Generation in Namibia (NAM CSP TT) GEF Trust Fund - CC focal area $1.72
Conservancy Adaptation Project Special CC Fund $3.80
Conservation and Sustainable Management of the Natural and Cultural Heritage of the Yasuní Biosphere Reserve MDG Achievement Fund – Environment and CC thematic window $2.95
Conservation of the Altai-Sayan ecoregion in Russia International Climate Initiative $4.49
Conservation of the Altai-Sayan Region International Climate Initiative $2.70
Conserving biodiversity in Peru’s tropical rainforest from the climate perspective International Climate Initiative $4.50
Conserving Forest Ecosystems in Amazonia International Climate Initiative $2.92
Conserving Mountain Forests International Climate Initiative $3.25
Conserving the Atlantic Coastal Forests International Climate Initiative $3.00
Conserving Virgin Forests in the Bikin Region International Climate Initiative $3.76
Conserving Wetlands in the Cape Floristic Region International Climate Initiative $3.00
Conserving Wetlands in the Cape Floristic Region 1 International Climate Initiative $3.00
Contribution Agreement with UNEP Global CC Alliance $0.00
Converting a Production Facility to the Manufacture of Climate-Friendly Air-Conditioning Equipment International Climate Initiative $3.00
Converting Air-Conditioning Equipment in Public Buildings to Natural Refrigerants International Climate Initiative $1.27
Converting the Production of Commercial Refrigeration Equipment to Natural Refrigerants International Climate Initiative $1.94
Cooperation Platform for the Conservation of Species-Rich and Carbon-Storing Ecosystems International Climate Initiative $1.58
Coping with Drought and CC (ET) Special CC Fund $1.00
Coping with Drought and CC (MZ) Special CC Fund $0.96
Coping with Drought and CC (ZB) Special CC Fund $0.98
Coral Triangle Initiative International Climate Initiative $2.04
Country Advisory Services Forest Carbon Partnership Facility $1.59
CO-EFFICIENCY: Improving Energy Efficiency in Buildings in Colombia through Synergies between Environmental Conventions GEF Trust Fund - CC focal area $0.98
Creating Markets for Renewable Power in Ukraine GEF Trust Fund - CC focal area $8.45
Credit Programme for Balkan Energy Efficiency Initiative International Climate Initiative
Credit Programme for Balkan Green Financing International Climate Initiative
Credit Programme for Climate Protection CHI International Climate Initiative
Credit Programme for Climate Protection CRO International Climate Initiative
Credit Programme for Climate Protection TUR International Climate Initiative
Credit Programme for Climate-Friendly Refrigeration Equipment International Climate Initiative
Credit Programme for Energy Efficiency CHI International Climate Initiative
Credit Programme for Energy Efficiency PHI International Climate Initiative
Credit Programme for Energy Efficiency UKR International Climate Initiative
Credit Programme for Renewable Energy Sources International Climate Initiative
Demonstration of Fuel Cell Bus Commercialization in China, Phase 2 GEF Trust Fund - CC focal area $5.77

130 Eastern Cape Climate Change Response Strategy
Design and Implementation of Pilot CC Adaptation Measures in the Andean Region Special CC Fund $6.90
design of national Strategic Programs for Climate Resilience (SPCR Pilot Program for Climate Resilience
design of national Strategic Programs for Climate Resilience (SPCR) Pilot Program for Climate Resilience
design of national Strategic Programs for Climate Resilience (SPCR) Pilot Program for Climate Resilience
design of national Strategic Programs for Climate Resilience (SPCR) Pilot Program for Climate Resilience
design of national Strategic Programs for Climate Resilience (SPCR) Pilot Program for Climate Resilience
design of national Strategic Programs for Climate Resilience (SPCR) Pilot Program for Climate Resilience
design of national Strategic Programs for Climate Resilience (SPCR) Pilot Program for Climate Resilience
design of national Strategic Programs for Climate Resilience (SPCR) Pilot Program for Climate Resilience
design of national Strategic Programs for Climate Resilience (SPCR) Pilot Program for Climate Resilience
design of national Strategic Programs for Climate Resilience (SPCR) Pilot Program for Climate Resilience
Developing a Climate Adaptation Strategy for Santiago de Chile and a Network of Megacities International Climate Initiative $2.14
Developing a climate strategy for the SOCAR company International Climate Initiative $0.19
Developing a National Energy Action Plan International Climate Initiative $0.23
Developing Core Capacity to Address Adaptation to CC in Productive Coastal Zones Least Developed Countries Fund $3.10
Development and Implementation of a Standards and Labeling Programme in Kenya with Replication in East Africa GEF Trust Fund - CC focal area $2.00
Development and Implementation of Climate Policy International Climate Initiative $3.54
Development of a National Adaptation Program of Action (NAPA) ERI Least Developed Countries Fund $0.20
Development of a National Adaptation Programme of Action YEM Least Developed Countries Fund $0.20
Development of a Strategy for the Deployment of Mini-Biogas Systems in Pig Production for a Distributed Energy Supply International Climate Initiative $0.33
Disaster Prevention and Adaptation to CC in Remote Himalayan Villages International Climate Initiative $0.20
Documentary Film: Energy Efficiency in Buildings International Climate Initiative $0.59
Economic Analysis of Adaptation Options in Support of Decision Making Special CC Fund $1.00
Economics of CC International Climate Initiative $0.79
Eco-Industrial Parks in Andra Pradesh International Climate Initiative $1.02
Eco-Transport in City Clusters: Model Development & Pilots GEF Trust Fund - CC focal area $4.80
Effective Management of Protected Areas in the Peruvian Amazon Region, Phase II International Climate Initiative $4.50
Elaboration du Programme d’Action National pour l’Adaptation aux Changements Climatiques Least Developed Countries Fund $0.20
Electricity Sector Efficiency Improvement Project GEF Trust Fund - CC focal area $4.50
Emergency program for solar power generation and lighting for Haiti, as a consequence of the Earthquake in Port au Prince. GEF Trust Fund - CC focal area $1.00
Enabling activities for Preparing India's Second National Communication to UNFCCC GEF Trust Fund - CC focal area $3.50
Enabling Activities for the Preparation of a National Adaptation Plan of Action ANG Least Developed Countries Fund $0.20
Enabling Activities for the Preparation of National Adaptation Programmes of Action (NAPAs) AFG Least Developed Countries Fund $0.20
Enabling Activities for the Preparation of Turkey's Second National Communication to the UNFCCC GEF Trust Fund - CC focal area $0.50
Enabling Activities to Facilitate the Preparation of a National Adaptation Plan of Action (NAPA) HAI Least Developed Countries Fund $0.20
Enabling Activities to Facilitate the Preparation of a National Adaptation Plan of Action (NAPA) RWA Least Developed Countries Fund $0.20
Enabling China to Prepare Its Second National Communications to UNFCCC GEF Trust Fund - CC focal area $5.00

131 Eastern Cape Climate Change Response Strategy
Enabling pastoral communities to adapt to CC and restoring rangeland environments MDG Achievement Fund – Environment and CC thematic window $1.35
Encouraging the Setting Up and Consolidation of an Energy Service Market in Chile GEF Trust Fund - CC focal area $2.36
Energy Campaign for the Hotel and Restaurant Industry International Climate Initiative $0.21
Energy Conservation in Small Sector Tea Processing Units in South India. GEF Trust Fund - CC focal area $0.95
Energy Conservation (to the Ministry of Industry) Indonesia CC Trust Fund
Energy Development and Access Project (formerly) Development of Renewable Energy and Energy Efficiency GEF Trust Fund - CC focal area $5.50
Energy Efficiency Action Plan for the Kho Khao Holiday Island International Climate Initiative $0.71
Energy Efficiency and Cogeneration Investment Scale-Up and Biomass Pilot GEF Trust Fund - CC focal area $2.41
Energy Efficiency Codes in Residential Buildings and Energy Efficiency Improvement in Commercial and Hospital Buildings in Morocco GEF Trust Fund - CC focal area $3.00
Energy Efficiency Financing GEF Trust Fund - CC focal area $13.50
Energy Efficiency Improvements in the Indian Brick Industry GEF Trust Fund - CC focal area $0.70
Energy Efficiency in New Construction in the Residential and Commercial Buildings Sector in Mongolia (under Frame Work for Promoting Low Greenhouse Gas Emissions in Buildings: 3787) GEF Trust Fund - CC focal area $0.98
Energy Efficiency in the Industrial Sector GEF Trust Fund - CC focal area $2.73
Energy Efficiency Investment Support Framework GEF Trust Fund - CC focal area $1.00
Energy Efficiency Loan Programme International Climate Initiative
Energy Efficiency Programme for Mountainous Regions International Climate Initiative $0.15
Energy Efficiency Project GEF Trust Fund - CC focal area $15.16
Energy Efficiency Standards and Labeling of Building Appliances GEF Trust Fund - CC focal area $0.97
Energy Efficiency Standards and Labels in Colombia (S&L Colombia) GEF Trust Fund - CC focal area $2.50
Energy Efficiency Standards and Labels in Peru GEF Trust Fund - CC focal area $2.00
Energy Efficient Design and Construction in Residential Sector GEF Trust Fund - CC focal area $4.57
Energy Efficient Lighting in Residential and Public Buildings GEF Trust Fund - CC focal area $6.50
Energy for Sustainable Development in the Caribbean (ESD-Caraibes) GEF Trust Fund - CC focal area $4.86
Energy Recovery from Sludge Gases at a Municipal Sewage Treatment Plant International Climate Initiative $2.89
Energy-efficiency in Urban Districts International Climate Initiative $6.75
Engaging the Banking Sector in Financing Sustainable Energy International Climate Initiative $0.31
Enhancing Adaptive Capacity and Resilience to CC in the Agriculture Sector in Mali Least Developed Countries Fund $3.00
Enhancing Climate Risk Management and Adaptation in Burundi (ECRAMB) Least Developed Countries Fund $3.08
Enhancing Resilience of Vulnerable Coastal Areas to CC Risks Least Developed Countries Fund $2.90
Enhancing Resilience to CC by Mainstreaming Adaptation Concerns into Agricultural Sector Development in Liberia Least Developed Countries Fund $2.38
Environment and CC MDG Achievement Fund – Environment and CC thematic window $6.98
Environment and climate training for managers International Climate Initiative $0.39
Environment Mainstreaming and Adaptation to CC MDG Achievement Fund – Environment and CC thematic window $5.21

132 Eastern Cape Climate Change Response Strategy
Establishing an African Eco-label International Climate Initiative $3.90
Establishing and implementing an innovation platform for a German-Russian modernisation partnership with the Sverdlovsk region International Climate Initiative $0.17
Establishing Sustainable Liquid Biofuels Production Worldwide (A Targeted Research Project) GEF Trust Fund - CC focal area $0.97
Estado do Pará Amazon Fund (Fundo Amazônia) $8.75
Evaluation and Development of a Modernised, Expanded Network of Protected Areas International Climate Initiative $2.99
Excellence Enhancement Centre International Climate Initiative $2.49
Expanding access to environmental finance - Reversing the decline in forest ecosystem services MDG Achievement Fund – Environment and CC thematic window $3.17
Expansion Strategy for Grid Connected Renewables International Climate Initiative $4.50
FA for Sector Budget Support on Environment and Natural Resources Global CC Alliance $3.06
FA with the Ministry of Finance and Economic Affairs+ TA Global CC Alliance $0.78
Fifth National Communication to the UNFCCC GEF Trust Fund - CC focal area $2.71
Financing Agreement for GBS Global CC Alliance $0.00
Financing Agreement for GBS Global CC Alliance $0.80
Financing Agreement + TA Global CC Alliance $0.11
Financing Energy Efficiency and Renewable Energy Investments for CC Mitigation GEF Trust Fund - CC focal area $3.00
Financing Energy Efficiency at Micro, Small and Medium Enterprises (MSMEs) GEF Trust Fund - CC focal area $11.30
Financing Public Building Efficiency GEF Trust Fund - CC focal area $4.57
First Regional Micro/Mini-Hydropower Capacity Development and Investment in Rural Electricity Access in Sub-Saharan Africa GEF Trust Fund - CC focal area $18.58
Forest Restoration International Climate Initiative $7.23
Formulation of a National Adaptation Programme of Action (NAPA) for Solomon Islands Least Developed Countries Fund $0.20
Formulation of the National Adaptation Action Plan Least Developed Countries Fund $0.20
From Halogenated Refrigerants to Climate-Friendly Hydrocarbons - Showcase Production of Environmentally Sound Air-Conditioning Systems International Climate Initiative $3.00
GEF-World Bank-China Urban Transport Partnership Program (CUTPP) GEF Trust Fund - CC focal area $21.00
Geothermal Power Generation Development Program GEF Trust Fund - CC focal area $4.00
Ghana Urban Transport GEF Trust Fund - CC focal area $7.00
GHG Mitigation and Waste Management in Marga-Marga International Climate Initiative $3.59
Global Adaptation Learning Mechanism: Learning By Doing Lake Balaton Integrated Vulnerability Assessment, Early Warning and Adaptation Strategies Strategic Priority on Adaptation $0.79
Global Energy Assessment: Developing Policy Tools for Jointly Reducing Energy Poverty and Greenhouse Gas Emissions GEF Trust Fund - CC focal area $1.00
Global Knowledge Transfer on Energy Efficiency International Climate Initiative $0.29
Greening the Tea Industry in East Africa GEF Trust Fund - CC focal area $2.85
Grid-connected Photovoltaic Project GEF Trust Fund - CC focal area $1.00
Grid-Connected Rooftop Photovoltaic Systems GEF Trust Fund - CC focal area $1.16
Hanoi Urban Transport Development GEF Trust Fund - CC focal area $9.80
Harapan Rainforest – Pilot Restoration of a Degraded Forest Ecosystem on Sumatra International Climate Initiative $10.07

133 Eastern Cape Climate Change Response Strategy
IBRD's Egypt: Wind Power Development Project Clean Technology Fund
Identification and Implementation of Adaptation Response Measures in the Drini-Mati River Deltas Strategic Priority on Adaptation $0.98
Implementation of a CDM Project for CO2 Savings with Rural Electrification in Villages and Small Towns International Climate Initiative $4.12
Implementation of Pilot Adaptation Measures in Coastal Areas of Dominica, St. Lucia and St. Vincent & the Grenadines Strategic Priority on Adaptation $2.62
Implementing NAPA Priority Interventions to Build Resilience and Adaptive Capacity of the Agriculture Sector to CC NIGER Least Developed Countries Fund $3.50
Implementing NAPA Priority Interventions to Build Resilience in the Agriculture and Water Sectors to the Adverse Impacts of CC SUD Least Developed Countries Fund $3.00
Implementing NAPA Priority Interventions to Build Resilience in the most Vulnerable Coastal Zones in Djibouti Least Developed Countries Fund $2.00
Implementing Pilot CC Adaptation Measures in Coastal Areas of Uruguay Strategic Priority on Adaptation $1.10
IMPROVE: Increase Product Efficiency in Venezuela (RESUBMISSION) GEF Trust Fund - CC focal area $4.09
Improvement of a protected area system in the Komi Republic International Climate Initiative $4.49
Improvement of Early Warning System to Reduce Impacts of CC and Capacity Building to Integrate CC into Development Plans Least Developed Countries Fund $1.60
Improving Conditions for Sustainable Energy and Climate Policy International Climate Initiative $7.39
Improving Conditions for Sustainable Energy and Climate Policy International Climate Initiative $7.39
Improving Energy Efficiency and Promoting Renewable Energy in the Agro-Food and other Small and Medium Enterprises (SMEs) in Ukraine GEF Trust Fund - CC focal area $5.14
Improving Energy Efficiency in Buildings GEF Trust Fund - CC focal area $0.90
Improving Energy Efficiency in Industry GEF Trust Fund - CC focal area $5.90
Improving Energy Efficiency in the Water Sector International Climate Initiative $1.68
Improving Kiln Efficiency in the Brick Making Industry in Bangladesh GEF Trust Fund - CC focal area $3.00
Improving Know-How for the Application of Renewable Energy Technologies International Climate Initiative $0.97
Improving the energy efficiency of lighting and building appliances GEF Trust Fund - CC focal area $4.45
Improving the Energy Efficiency of Small and Medium-Sized Enterprises International Climate Initiative $1.95
Improving the Energy Policy Setting for Renewable Energies and Grid-Connected Pilot Wind Energy Project International Climate Initiative $1.50
Improving the Resilience of the Agriculture Sector in Lao PDR to CC Impacts Least Developed Countries Fund $4.45
Increased Access to Electricity Services GEF Trust Fund - CC focal area $4.50
Increased Resilience and Adaptation to Adverse Impacts of CC in Guinea's Vulnerable Coastal Zones Least Developed Countries Fund $2.97
Increasing Resilience of Coastal Areas and Community Settlements to CC Least Developed Countries Fund $3.00
Increasing Resilience to CC and Natural Hazards Least Developed Countries Fund $2.58
Increasing resilience to climate impacts of vulnerable communities and critical ecosystems in the Eastern Himalayas of India International Climate Initiative $0.26
Increasing Resilience to Climate Variability and Hazards Least Developed Countries Fund $3.00
IND Energy Efficiency Improvements in Commercial Buildings - under the Programmatic Framework for Energy Efficiency GEF Trust Fund - CC focal area $5.20
IND Improving Energy Efficiency in the Indian Railway System - under the Programmatic Framework for Energy Efficiency GEF Trust Fund - CC focal area $5.20
Industrial Energy Efficiency in Key Sectors GEF Trust Fund - CC focal area $5.45
Industrial Energy Efficiency (IEE) GEF Trust Fund - CC focal area $3.95
Information and Knowledge Management for REDD Pilot Project in the Merang Peat Forest Area International Climate Initiative $0.93
Innovative Insurance Products for CC Adaptation International Climate Initiative $3.50

134 Eastern Cape Climate Change Response Strategy
Insurance Instruments for Adaptation to CC International Climate Initiative $3.00
Integrated Adaptation Programme to Combat the Effects of CC on Agricultural Production and Food Security Least Developed Countries Fund $3.10
Integrated and adaptive management of environmental resources and climatic risks in High Andean micro-watersheds MDG Achievement Fund – Environment and CC thematic window $2.89
Integrated and Sustainable Management of Transboundary Water Resources in the Amazon River Basin Strategic Priority on Adaptation $2.20
Integrated Approach for Zero Emission Project Development in the New Town of Boughzoul GEF Trust Fund - CC focal area $8.24
Integrated Carbon Sequestration Project in Sudan GEF Trust Fund - CC focal area $3.65
Integrated Coastal Zone Management Least Developed Countries Fund $4.50
Integrated Energy Services for Small Localities of Rural Mexico GEF Trust Fund - CC focal area $15.00
Integrated Land and Ecosystem Management to Combat Land Degradation and Deforestation in Madhya Pradesh Strategic Priority on Adaptation $0.22
Integrated Microhydro Development and Application Program (IMIDAP), Part I GEF Trust Fund - CC focal area $2.00
Integrated National Adaptation Plan: High Mountain Ecosystems, Colombia's Caribbean Insular Areas and Human Health (INAP) Strategic Priority on Adaptation $6.17
Integrated Protected Area in the Ngiri Rainforest International Climate Initiative $1.99
Integrated Renewable Biomass Energy Development Project GEF Trust Fund - CC focal area $9.20
Integrating Adaptation to CC into Agricultural Production and Food Security in Sierra Leone Least Developed Countries Fund $2.64
Integrating CC in Development Planning and Disaster Prevention to Increase Resilience of Agricultural and Water Sectors Special CC Fund $4.35
Integrating CC into the Management of Priority Health Risks Special CC Fund $1.72
Integrating CC Risk into Community-Level Livestock and Water Management in the Northwestern Lowlands Least Developed Countries Fund $3.00
Integrating CC Risks into Resilient Island Planning Least Developed Countries Fund $4.25
Integrating CC Risks into the Agriculture and Health Sectors in Samoa Least Developed Countries Fund $2.00
Integrating CC risks into water and flood management by vulnerable mountainous communities in the Greater Caucasus region of Azerbaijan Special CC Fund $2.70
Integrating Climate Resilience into Agricultural Production for Food Security in Rural Areas Least Developed Countries Fund $2.11
Integrating Vulnerability and Adaptation to CC into Sustainable Development Policy Planning and Implementation in Southern and Eastern Africa Strategic Priority on Adaptation $1.09
Integration of CC Adaptation and Mitigation Measures in the Management of Natural Resources in Four Priority Watersheds of Panama MDG Achievement Fund – Environment and CC thematic window $1.53
Integration of CC Risk and Resilience into Forestry Management (ICCRIFS) Least Developed Countries Fund $2.40
Integration of ecosystems and Adaptation to CC in the Colombian Massif MDG Achievement Fund – Environment and CC thematic window $3.98
International Climate Protection Scholarships for Young Management Professionals from Developing and Emerging Countries International Climate Initiative $8.90
Investing in Energy Efficiency in China’s Industry International Climate Initiative $0.61
Involving Bagyéli Indigenous Peoples in the Sustainable Management of Campo Ma'an National Park Congo Basin Forest Fund $0.00
Kalimantan Forests and Climate Partnership (FFCP) International Forest Carbon Initiative $12.20
Kathmandu Sustainable Urban Transport (SUT) Project GEF Trust Fund - CC focal area $2.82
Kiribati Adaptation Program - Pilot Implementation Phase Strategic Priority on Adaptation $2.07
LAC Regional Sustainable Transport and Air Quality Project GEF Trust Fund - CC focal area $20.80
Lac Tumba & Ngiri Forest Reserves International Climate Initiative $1.65

135 Eastern Cape Climate Change Response Strategy
Lake Balaton Integrated Vulnerability Assessment, Early Warning and Adaptation Strategies Strategic Priority on Adaptation $1.13
Land and Water Optimization Project Strategic Priority on Adaptation $0.70
LGGE Energy Efficiency Buildings Codes GEF Trust Fund - CC focal area $3.46
LGGE Improving Energy Efficiency in Buildings GEF Trust Fund - CC focal area $1.05
LGGE Improving Energy Efficiency in Low-Income Households and Regions of Romania GEF Trust Fund - CC focal area $2.97
LGGE Improving Energy Efficiency in Residential Buildings in the Republic of Belarus GEF Trust Fund - CC focal area $4.50
LGGE Improving Energy Efficiency in the Residential Building Sector GEF Trust Fund - CC focal area $2.52
LGGE Policy Reforms and Market Transformation of the Energy Efficient Buildings Sector in the I.R. Iran GEF Trust Fund - CC focal area $4.00
LGGE Promoting Energy Efficiency and Renewable Energy in Buildings in Jamaica GEF Trust Fund - CC focal area $2.36
LGGE Promoting Energy Efficiency in Buildings in Eastern Africa GEF Trust Fund - CC focal area $2.85
LGGE Promoting Energy Efficiency in Commercial Buildings in Thailand (PEECB) GEF Trust Fund - CC focal area $3.64
LGGE Promotion of energy efficient lighting in Kazakhstan GEF Trust Fund - CC focal area $3.40
Liaison office for Sino-German climate dialogue International Climate Initiative $0.39
Lighting and Appliances Efficiency Project GEF Trust Fund - CC focal area $7.12
Lighting Market Transformation in Peru GEF Trust Fund - CC focal area $1.64
Lighting the "Bottom of the Pyramid" GEF Trust Fund - CC focal area $5.40
Local and regional environmental management for the management of natural resources and provision of environmental services MDG Achievement Fund – Environment and CC thematic window $3.44
Low Carbon Campaign for Commonwealth Games 2010 Delhi GEF Trust Fund - CC focal area $0.80
Low Carbon Economic Zones International Climate Initiative $0.61
Mainstreaming Adaptation to CC Into Water Resources Management and Rural Development Special CC Fund $5.00
Mainstreaming CC in Integrated Water Resources Management in Pangani River Basin Special CC Fund $1.00
Mainstreaming environmental governance: linking local and national action in Bosnia and Herzegovina MDG Achievement Fund – Environment and CC thematic window $1.34
Mainstreaming Local Environmental Management in the Planning Process MDG Achievement Fund – Environment and CC thematic window $3.82
Management and Innovative Sustainable Exploitation of Forest Resources Congo Basin Forest Fund $1.54
Market Development and Promotion of Solar Concentrators based Process Heat Applications in India GEF Trust Fund - CC focal area $4.40
Market Transformation for Efficient Biomass Stoves for Institutions and Small and Medium-Scale Enterprises GEF Trust Fund - CC focal area $0.98
Market Transformation for Energy Efficiency in Buildings GEF Trust Fund - CC focal area $13.50
Market Transformation of Energy Efficient Appliances in Turkey GEF Trust Fund - CC focal area $2.71
Market Transformation of Energy-Efficient Bricks and Rural Buildings (MTEBRB) GEF Trust Fund - CC focal area $7.00
Market Transformation through Energy Efficiency Standards and Labelling of Appliances in South Africa GEF Trust Fund - CC focal area $6.00
Master Plan to Harness Biogas Potential in Rio Grande do Sul International Climate Initiative $0.17
Mata Atlântica Forest Conservation II International Climate Initiative $4.50
Mechanism for Voluntary Mitigation of Greenhouse Gas Emissions in Colombia GEF Trust Fund - CC focal area $2.70
Mexico Efficient Lighting and Appliances Clean Technology Fund

136 Eastern Cape Climate Change Response Strategy
Mexico Renewable Energy Plan Clean Technology Fund
Mexico Rural Development GEF Trust Fund - CC focal area $10.50
Mexico's Private Sector Wind Development (Sub-Project- IFC's EDF La Ventosa) Clean Technology Fund
Mexico's Urban Transport Transformation Program Clean Technology Fund
Micro-turbine Cogeneration Technology Application Project (MCTAP) GEF Trust Fund - CC focal area $2.59
Mini-Grids Based on Small Hydropower Sources to Augment Rural Electrification GEF Trust Fund - CC focal area $3.35
Mitigation Options of Greenhouse Gas (GHG) Emissions in Key Sectors in Brazil GEF Trust Fund - CC focal area $4.18
Modernisation of Transport in Lviv International Climate Initiative $0.61
Mokshda Green Cremation System for Energy and Environment Conservation GEF Trust Fund - CC focal area $0.98
Mongolia Livestock Sector Adaptation Project Special CC Fund $1.50
Multi Donor Trust Fund Office (International Support) UN-REDD Programme $8.69
Multiplying Best Practice in Adaptation to CC International Climate Initiative $1.29
Municipal Credit Programme for Climate Protection International Climate Initiative
Municipios verdes (Imazon) Amazon Fund (Fundo Amazônia) $5.34
Namibia Energy Efficiency Programme (NEEP) In Buildings GEF Trust Fund - CC focal area $0.86
National Adapation Programme of Action BAN Least Developed Countries Fund $0.20
National Adaptation Plan of Action for the Central African Republic CAR Least Developed Countries Fund $0.20
National Adaptation Plan of Action GUI Least Developed Countries Fund $0.20
National Adaptation Plan of Action MAL Least Developed Countries Fund $0.20
National Adaptation Plan of Action MAU Least Developed Countries Fund $0.20
National Adaptation Plan (NAPA) for United Republic of Tanzania Least Developed Countries Fund $0.20
National Adaptation Program of Action BUR Least Developed Countries Fund $0.20
National Adaptation Program of Action LAO Least Developed Countries Fund $0.20
National Adaptation Program of Action MAL Least Developed Countries Fund $0.20
National Adaptation Program of Action SEN Least Developed Countries Fund $0.20
National Adaptation Programme of Action COM Least Developed Countries Fund $0.20
National Adaptation Programme of Action DJI Least Developed Countries Fund $0.20
National Adaptation Programme of Action GAM Least Developed Countries Fund $0.20
National Adaptation Programme of Action to CC NEP Least Developed Countries Fund $0.20
National Adaptation Programme of Action to CC (NAPA) Formulation Project TL Least Developed Countries Fund $0.20
National Adaptation Programme of Action VAN Least Developed Countries Fund $0.20
National Adaptation Programme of Action (NAPA) BHU Least Developed Countries Fund $0.20
National Adaptation Programme of Action (NAPA) CON DR Least Developed Countries Fund $0.20
National Adaptation Programme of Action (NAPA) ETH Least Developed Countries Fund $0.20
National Adaptation Programme of Action (NAPA) KIR Least Developed Countries Fund $0.20
National Adaptation Programme of Action (NAPA) LES Least Developed Countries Fund $0.19
National Adaptation Programme of Action (NAPA) MOZ Least Developed Countries Fund $0.20

137 Eastern Cape Climate Change Response Strategy
National Adaptation Programme of Action (NAPA) SUD Least Developed Countries Fund $0.20
National Adaptation Programme of Action (NAPA) TUV Least Developed Countries Fund $0.20
National Adaptation Programme of Action (NAPA) UGA Least Developed Countries Fund $0.20
National Communications to the UNFCCC GEF Trust Fund - CC focal area $25.00
NGO Development Grants International Forest Carbon Initiative $0.70
Nigeria Urban Transport GEF Trust Fund - CC focal area $4.50
Olhos D’Água da Amazônia (Municipio de Alta Floresta) Amazon Fund (Fundo Amazônia) $1.49
Organisation of Municipal Climate Initiatives International Climate Initiative $0.74
Ouagadougou Transport Modal Shift GEF Trust Fund - CC focal area $0.91
Pacific Adaptation to CC Project (PACC) Special CC Fund $13.13
Pacific Mangroves Initiative International Climate Initiative $3.44
Package of bilateral support International Forest Carbon Initiative $0.40
Pakistan Sustainable Transport Project GEF Trust Fund - CC focal area $4.85
Participatory Coastal Zone Restoration and Sustainable Management in the Eastern Province of Post-Tsunami Sri Lanka Strategic Priority on Adaptation $2.10
Partnership for the Development of Community Forests Congo Basin Forest Fund $1.79
PAS Low Carbon-Energy Islands - Accelerating the Use of Energy Efficient and Renewable Energy Technologies in Tuvalu, Niue and Nauru GEF Trust Fund - CC focal area $1.30
PAS: Promoting Energy Efficiency in the Pacific GEF Trust Fund - CC focal area $5.25
Phasing out Incandescent Lamps through Lighting Market Transformation in Vietnam GEF Trust Fund - CC focal area $3.00
Phasing out slash-and-burn farming with biochar Congo Basin Forest Fund $0.47
Phasing-out Incandescent Lamps & Energy Saving Lamps Promotion (PILESLAMP) GEF Trust Fund - CC focal area $14.00
Philippines Sustainable Energy Finance Program GEF Trust Fund - CC focal area $5.30
Pigs for Kilowatts - Utilising Pig Slurry to Produce Biogas International Climate Initiative $0.17
Pilot Project for Methane Mitigation and Recovery from Hydroelectric Power Reservoirs GEF Trust Fund - CC focal area $2.65
Piloting CC Adaptation to Protect Human Health Special CC Fund $4.50
Policy Board (International Support) UN-REDD Programme $13.33
Portfolio Approach to Distributed Generation Opportunity (PADGO) (Phase 1) GEF Trust Fund - CC focal area $3.60
Power Sector Policy Reform to Promote Small Hydropower Development in the Republic of Montenegro GEF Trust Fund - CC focal area $0.98
Preparation of a National Action Plan for Adaptation in Mali Least Developed Countries Fund $0.20
Preparation of a National Action Program to Adapt to CCs MADAG Least Developed Countries Fund $0.20
Preparation of a National Adaptation Plan of Action STP Least Developed Countries Fund $0.20
Preparation of a National Adaptation Plan of Action (NAPA) LIB Least Developed Countries Fund $0.20
Preparation of a National Adaptation Programme of Action CV Least Developed Countries Fund $0.20
Preparation of a National Programme of Action for Adaptation to CC SL Least Developed Countries Fund $0.20
Preparation of National Adaptation Programme of Action (NAPA) MYA Least Developed Countries Fund $0.20
Preparation of the National Adaptation Programme of Action (NAPA) ZAM Least Developed Countries Fund $0.20
Preparatory Workshops for Negotiators from Developing Countries on the UNFCCC Bali Road Map International Climate Initiative $3.71

138 Eastern Cape Climate Change Response Strategy
Preserving Biodiversity in the Nyungwe Forest International Climate Initiative $2.42
PREVENT - Providing Support to Delegations from Least Developed Countries and Small Island Developing States for the Post-2012 Climate Negotiations International Climate Initiative $1.74
PROBIO - Electricity Production from Biomass in Uruguay GEF Trust Fund - CC focal area $0.95
Producing energy from waste and sewage International Climate Initiative $3.04
Productive Uses of Renewable Energy in Chitral District, Pakistan (PURE-Chitral) GEF Trust Fund - CC focal area $0.95
Programas Bolsa Floresta Associação, Renda e Programas de Apoio (Fundação Amazonas Sustevel - FAS) Amazon Fund (Fundo Amazônia) $10.56
Programme of Action for Adaptation to CC CAM Least Developed Countries Fund $0.20
Programme of Action for Adaptation to CC SAM Least Developed Countries Fund $0.20
Programme of Activities (PoA) for Energy Efficiency Improvement in Buildings International Climate Initiative $0.19
Project for the Elaboration of the National Programme of Action for Adaptation for CC (NAPA) Least Developed Countries Fund $0.20
Projects unknown Hatoyama Initiative - public sources
Projects unknown Hatoyama Initiative - public sources
Projects unknown Hatoyama Initiative - public sources
Projeto Sementes do Portal (Instituto Ouro Verde) Amazon Fund (Fundo Amazônia) $2.97
Promote Energy Efficiency in Buildings GEF Trust Fund - CC focal area $2.62
Promoting and Strengthening an Energy Efficiency Market in the Industry Sector GEF Trust Fund - CC focal area $2.64
Promoting Autonomous Adaptation at the community level in Ethiopia Least Developed Countries Fund $5.31
Promoting Clean Electric Buses for the Beijing Olympics (CEBBO) GEF Trust Fund - CC focal area $1.00
Promoting Climate-Resilient Water Management and Agricultural Practices Least Developed Countries Fund $1.85
Promoting Community Land Tenure Rights in the Congo Basin Congo Basin Forest Fund $0.73
Promoting Energy Efficiency and Renewable Energy in Selected Micro SME Clusters in India - under the Programmatic Framework for Energy Efficiency GEF Trust Fund - CC focal area $7.17
Promoting Energy Efficiency in Public Buildings GEF Trust Fund - CC focal area $3.25
Promoting Energy Efficient Room Air Conditioners (PEERAC) Project GEF Trust Fund - CC focal area $6.26
Promoting Leadership in Developing CCS International Climate Initiative $0.15
Promoting Low Carbon Transport in India International Climate Initiative $2.60
Promoting Renewable Energy in Mae Hong Son Province GEF Trust Fund - CC focal area $2.99
Promoting Sustainable Biomass Energy Production and Modern Bio-Energy Technologies GEF Trust Fund - CC focal area $2.00
Promoting Sustainable Energy in the Bahamas GEF Trust Fund - CC focal area $1.00
Promoting Sustainable Energy Production and Use from Biomass in Pakistan GEF Trust Fund - CC focal area $1.82
Promoting Sustainable Rural Biomass Energy GEF Trust Fund - CC focal area $1.70
Promoting Sustainable Transport in Latin America (NESTLAC) GEF Trust Fund - CC focal area $0.96
Promoting Sustainable Transport Solutions for East Africa GEF Trust Fund - CC focal area $2.85
Promoting Wind Energy and Other Renewables in Morocco International Climate Initiative $1.99
Promotion of a Wind Power Market GEF Trust Fund - CC focal area $6.00
Promotion of Energy Efficient Cooking, Heating and Housing Technologies (PEECH) GEF Trust Fund - CC focal area $0.98

139 Eastern Cape Climate Change Response Strategy
Promotion of Environmentally Sustainable Transport in Metropolitan Managua GEF Trust Fund - CC focal area $3.88
Promotion of Sustainable and Climate-Compatible Rural Development in Lara and Falcon States PROSALAFA-GEF: GEF Trust Fund - CC focal area $3.64
Protecting Health from CC 6 1 1 International Climate Initiative $1.50
Protecting Health from CC - Albania International Climate Initiative $1.50
Protecting Health from CC Tajikistan International Climate Initiative $1.50
Protecting Health from CC - Kyrgyzstan International Climate Initiative $1.50
Protecting Health from CC - Macedonia International Climate Initiative $1.50
Protecting Health from CC - Russia International Climate Initiative $1.50
Protecting Health from CC - Uzbekistan International Climate Initiative $1.50
Provincial Energy Efficiency Scale-Up Program GEF Trust Fund - CC focal area $13.39
Préparation du Plan d’Action National d’Adaptation du Burundi aux changements climatiques Least Developed Countries Fund $0.20
Préparation du Programme d’Action National pour l’Adaptation aux Changements Climatiques (NAPA) NIGER Least Developed Countries Fund $0.20
Préparation du Programme d’Action National pour l’Adaptation aux Changements Climatiquesn (NAPA) CHAD Least Developed Countries Fund $0.20
Public Awareness on CC (to the Bureau of Met, Climate and Geophysics, BMKG) Indonesia CC Trust Fund
Public Private Partnership Programme and Climate Protection International Climate Initiative $2.66
Quantifying carbon stocks and emissions in the forests of Cameroon and the Republic of Congo Congo Basin Forest Fund $1.74
Readiness preparation formulation grant - Lao Forest Carbon Partnership Facility $0.09
Readiness preparation formulation grant - Costa Rica Forest Carbon Partnership Facility $0.16
Readiness preparation formulation grant - DRC Forest Carbon Partnership Facility $0.19
Readiness preparation formulation grant - Ethiopia Forest Carbon Partnership Facility $0.19
Readiness preparation formulation grant - Gabon Forest Carbon Partnership Facility $0.00
Readiness preparation formulation grant - Ghana Forest Carbon Partnership Facility $0.20
Readiness preparation formulation grant - Guyana Forest Carbon Partnership Facility $0.00
Readiness preparation formulation grant - Kenya Forest Carbon Partnership Facility $0.17
Readiness preparation formulation grant - Liberia Forest Carbon Partnership Facility $0.08
Readiness preparation formulation grant - Nepal Forest Carbon Partnership Facility $0.15
Readiness preparation formulation grant - ROC Forest Carbon Partnership Facility $0.09
Readiness preparation formulation grant - Uganda Forest Carbon Partnership Facility $0.10
Readiness preparation formulation grant - Vanuatu Forest Carbon Partnership Facility $0.00
Reconciling the Needs of the Logging Industry with those of Forest Dependent People Congo Basin Forest Fund $0.00
Reducing CC-induced Risks and Vulnerabilities from Glacial Lake Outbursts in the Punakha-Wangdi and Chamkhar Valleys Least Developed Countries Fund $3.45
Reducing Disaster Risks from Wildfire Hazards Associated with CC Special CC Fund $3.54
Reducing GHG Emissions from Road Transport in Russia’s Medium-sized Cities GEF Trust Fund - CC focal area $5.40
Reducing Greenhouse Gas Emissions through Improved Energy Efficiency in the Industrial Sector GEF Trust Fund - CC focal area $1.24
Reducing Greenhouse Gas Emissions through Improved Energy Efficiency in the Industrial Sector in Moldova GEF Trust Fund - CC focal area $0.96
Reducing Greenhouse Gases by Recovering Volatile Hydrocarbons at Petrol Stations International Climate Initiative $0.40
Reducing methane emissions using a mechanical-biological waste-treatment plant (MBT) in the city of Gaobeidian International Climate Initiative $4.80

140 Eastern Cape Climate Change Response Strategy
Reducing the Carbon Footprint of Major Sporting Events, FIFA 2010 and the implementation of the national greening programme in liaison with 2010 FIFA LOC GEF Trust Fund - CC focal area $1.00
Reducing Vulnerability to CC by Establishing Early Warning and Disaster Preparedness Systems and Support for Integrated Watershed Management in Flood Prone Areas Least Developed Countries Fund $3.16
Reforestation of Degraded Areas and Promoting Value-Addition for Non-Timber Forest Products in the Sanaga Maritime Region of Cameroon Congo Basin Forest Fund $0.40
Refrigerator Recycling Programme International Climate Initiative $6.02
Removal of Barriers to Energy Efficiency and Energy Conservation in Buildings GEF Trust Fund - CC focal area $0.91
Removal of Barriers to Solar PV Power Generation in Mauritius, Rodrigues and the Outer Islands GEF Trust Fund - CC focal area $2.01
Removing Barriers to Energy Efficiency Improvements in the State Sector in Belarus GEF Trust Fund - CC focal area $1.40
Renewable Energy Accelerator Program (REAP Clean Technology Fund
Renewable Energy and Rural Electricity Access (RERA) GEF Trust Fund - CC focal area $3.50
Renewable Energy Project GEF Trust Fund - CC focal area $3.00
Renewable Energy Project (RREP) GEF Trust Fund - CC focal area $10.00
Restoration of Forests in the Talish Region International Climate Initiative $0.24
Restoring Peatlands International Climate Initiative $3.86
Reversing Environmental Degradation and Rural Poverty through Adaptation to CC in Drought Stricken Areas in Southern India: A Hydrological Unit Pilot Project Approach Strategic Priority on Adaptation $1.00
Reversing Environmental Degradation and Rural Poverty through Adaptation to CC in Drought Stricken Areas in Southern India: A Hydrological Unit Pilot Project Approach (under India: SLEM) GEF Trust Fund - CC focal area $0.86
Rural Electrification GEF Trust Fund - CC focal area $10.00
Rural Electrification Phase II GEF Trust Fund - CC focal area $1.82
Rural Infrastructure (Electrification Sector) GEF Trust Fund - CC focal area $2.35
Rural Livelihoods CC Adaptation Support Programme Special CC Fund $2.63
RUS Improving Efficiency in Public Buildings in the Russian Federation - under the Energy Efficiency Umbrella Program GEF Trust Fund - CC focal area $9.21
RUS Improving Urban Housing Efficiency in the Russian Federation - under the Energy Efficiency Umbrella Program GEF Trust Fund - CC focal area $9.67
RUS Market Transformation Programme on Energy Efficiency in GHG-Intensive Industries in Russia GEF Trust Fund - CC focal area $15.39
RUS: Building Energy Efficiency in the North West of Russia GEF Trust Fund - CC focal area $5.84
RUS: Standards and Labels for Promoting Energy Efficiency GEF Trust Fund - CC focal area $7.81
RUS: Transforming the Market for Efficient Lighting GEF Trust Fund - CC focal area $7.02
Sankuru Community "Fair Trade" Carbon Initiative: Innovative Management of Community-controlled Protected Areas Congo Basin Forest Fund $0.00
Second National Communication of Brazil to the UNFCCC GEF Trust Fund - CC focal area $3.40
Second National Communication of Peru to the UNFCCC GEF Trust Fund - CC focal area $1.80
Second Natural Resource Management Project Strategic Priority on Adaptation $0.69
Secretaria de Desenvolvimento Sustentável - Governo do Amazonas Amazon Fund (Fundo Amazônia) $11.00
Securing natural carbon sinks and habitats in the Heart of Borneo International Climate Initiative $1.30
SFM Mitigating CC through Sustainable Forest Management and Capacity Building in the Southern States of Mexico (States of Campeche, Chiapas and Oaxaca) GEF Trust Fund - CC focal area $5.00

141 Eastern Cape Climate Change Response Strategy
Sino-German Platform for Renewable Energies - Wind Environment Research & Training Center International Climate Initiative $5.79
Sino-Singapore Tianjin Eco-City Project (SSTECP) GEF Trust Fund - CC focal area $6.16
Small Hydro Power Development GEF Trust Fund - CC focal area $0.95
Small Scale Hydro Power Development in Haiti GEF Trust Fund - CC focal area $0.98
SMILE: Solar-Hybrid Microturbine Systems for Cogeneration in Agro-Industry International Climate Initiative $2.30
Solar pilot project, Florianopolis International Climate Initiative $0.66
Solar Thermal Tower Power Plant International Climate Initiative $1.10
Solar Water Heating Market Transformation and Strengthening Initiative, Phase 1 GEF Trust Fund - CC focal area $12.00
SolarChill: Deploying Solar-Powered Environmentally Sound Freezers and Refrigerators in Off-Grid Areas International Climate Initiative $3.00
Solidarity and (Gender) Justice in the Greenhouse International Climate Initiative $0.20
South Africa Energy Efficiency Program Clean Technology Fund
South Africa Sustainable Energy Acceleration Program Clean Technology Fund
SPWA-CC Energy Efficiency Project GEF Trust Fund - CC focal area $1.82
SPWA-CC Installation of multi purpose mini-hydro infrastructure (for energy & irrigation ) GEF Trust Fund - CC focal area $1.76
SPWA-CC Mini-grids based on Renewable Energy (small-hydro and biomass) Sources to Augment Rural Electrification GEF Trust Fund - CC focal area $2.62
SPWA-CC Promoting Energy Efficiency in Residential and Public Sector in Nigeria GEF Trust Fund - CC focal area $2.68
SPWA-CC Promoting market based development of small to medium scale renewable energy systems in Cape Verde. GEF Trust Fund - CC focal area $1.72
SPWA-CC Promoting Mini Grids Based on Small Hydropower for Productive Uses in Sierra Leone GEF Trust Fund - CC focal area $1.76
SPWA-CC Promoting of Appliance Energy Efficiency and Transformation of the Refrigerating Appliances Market in Ghana. (under West Africa Energy Pgrogram:3789) GEF Trust Fund - CC focal area $1.72
SPWA-CC Promoting Renewable Energy Based Mini Grids for Productive Uses in Rural Areas in The Gambia GEF Trust Fund - CC focal area $1.76
SPWA-CC Promoting renewable energy based mini-grids for rural electrification and productive uses GEF Trust Fund - CC focal area $1.76
SPWA-CC Promotion of Jatropha Curcas as a resource of Bioenergy in Burkina-Faso GEF Trust Fund - CC focal area $1.31
SPWA-CC: Integration of Greenhouse Gas Emission Reductions in Niger's Rural Energy Service Access program GEF Trust Fund - CC focal area $1.77
Stabilizing carbon emissions in the Sangha Tri-National forest complex through sustainable financing and improved livelihoods Congo Basin Forest Fund $0.92
State-Owned Properties for Projects to Generate Electricity from Renewable Sources International Climate Initiative $1.38
State-Owned Properties for Projects to Generate Electricity from Renewable Sources International Climate Initiative $1.38
Stimulus facility for Programmes of Activities International Climate Initiative
Strategic Environmental Policy Dialogue Forums with Newly Industrialising Countries (Phase II) International Climate Initiative $1.95
Strategic Environmental Policy Dialogue Forums with Newly Industrialising Countries International Climate Initiative $0.89
Strategic Support for the Autonomous Village Energy Programme 'Desa Mandiri Energi' International Climate Initiative $0.37
Strengthened Approach for the Integration of Sustainable Environmental Management into the ANDS/PRSP MDG Achievement Fund – Environment and CC thematic window $4.03
Strengthening Adaptation Capacities and Reducing the Vulnerability to CC in Burkina Faso Least Developed Countries Fund $2.90
Strengthening Adaptive Capacities to Address CC Threats on Sustainable Development Strategies for Coastal Communities in Haiti Least Developed Countries Fund $3.50
Strengthening Environmental Governance in the face of Climate Risks in Guatemala MDG Achievement Fund – Environment and CC thematic window $2.52

142 Eastern Cape Climate Change Response Strategy
Strengthening National Climate Policy and Strategies for Adapting to CC International Climate Initiative $1.05
Strengthening of The Gambia’s CC Early Warning Systems Least Developed Countries Fund $0.93
Strengthening Resilience and Adaptive Capacity to CC in Guinea-Bissau’s Agrarian and Water Sectors Least Developed Countries Fund $4.00
Strengthening the Capacity of Vulnerable Coastal Communities to Address the Risk of CC and Extreme Weather Events Special CC Fund $0.87
Strengthening the Philippines’ Institutional Capacity to Adapt to CC MDG Achievement Fund – Environment and CC thematic window $2.49
Sugarcane Renewable Electricity (SUCRE) GEF Trust Fund - CC focal area $7.80
Support for Implementation of the Finance Facility 'Sustainable Energy and Carbon Market' International Climate Initiative $3.63
Support for the Sustainable Use of Protected Areas in Amazonia (ARPA) International Climate Initiative $8.25
Support to Sustainable Transport Management in Dushanbe GEF Trust Fund - CC focal area $0.97
Support to Sustainable Transportation System in the City of Belgrade GEF Trust Fund - CC focal area $0.95
Support to the Adaptation of Vulnerable Agricultural Production Systems Least Developed Countries Fund $3.50
Supporting Structures for the LifeWeb Initiative International Climate Initiative $1.35
Supporting the Introduction of Standards for Natural Refrigerants International Climate Initiative $0.45
Sustainability of the Miombo Ecoregion through the Enlargement and Improved Management of Protected Areas International Climate Initiative $3.09
Sustainable and climate-friendly development in Veraguas Province -Proyecto Participa GEF Trust Fund - CC focal area $1.50
Sustainable Development of Coastal Protected Forests in Bac Lieu Province International Climate Initiative $2.40
Sustainable Economic Development through Renewable Energy Applications (SEDREA) GEF Trust Fund - CC focal area $0.98
Sustainable Energy Advisory Facility (SEAF) for Latin America and the Caribbean International Climate Initiative $0.54
Sustainable energy and water supply for the University of Accra International Climate Initiative $1.66
Sustainable Energy Development Project (SEDP) GEF Trust Fund - CC focal area $4.50
Sustainable Energy Finance Program Clean Technology Fund
Sustainable Energy Finance Program (V-SEF) Clean Technology Fund
Sustainable Energy Financing GEF Trust Fund - CC focal area $9.48
Sustainable Energy Framework for Barbados GEF Trust Fund - CC focal area $1.00
Sustainable Energy Program GEF Trust Fund - CC focal area $5.50
Sustainable Forest Management International Climate Initiative $2.14
Sustainable Land, Water and Biodiversity Conservation and Management for Improved Livelihoods in Uttarakhand Watershed Sector Strategic Priority on Adaptation $0.34
Sustainable Land-use Management for the Production of Biomass International Climate Initiative $3.62
Sustainable Management of the Water Resources of the la Plata Basin with Respect to the Effects of Climate Variability and Change Strategic Priority on Adaptation $1.09
Sustainable Mobility in the City of Bratislava GEF Trust Fund - CC focal area $0.93
Sustainable Palm Oil Production for Bioenergy International Climate Initiative $5.14
Sustainable Participatory Management of Natural Resources to Promote Ecosystem Health and Resilience in the Thar Desert Ecosystem Strategic Priority on Adaptation $0.25
Sustainable Peat Land Management (to the Ministry of Agriculture) Indonesia CC Trust Fund
Sustainable Public Transport and Sport: A 2010 Opportunity GEF Trust Fund - CC focal area $11.00

143 Eastern Cape Climate Change Response Strategy
Sustainable Regeneration of Alluvial Forests in Gorno-Badakhshan International Climate Initiative $1.56
Sustainable Rural Livelihood Security through Innovations in Land and Ecosystem Management Strategic Priority on Adaptation $2.95
Sustainable Transport GEF Trust Fund - CC focal area $6.90
Sustainable Transport in the City Of Almaty GEF Trust Fund - CC focal area $5.00
Sustainable Urban Mobility International Climate Initiative $1.63
Sustainable Urban Transport Project GEF Trust Fund - CC focal area $22.50
Sustainable Use of Biogas from Agro Industrial and Solid Waste Applications GEF Trust Fund - CC focal area $2.91
Sustaining Agricultural Biodiversity in the Face of CC Strategic Priority on Adaptation $1.10
Switching from Fossil Fuels to Biofuels on the Galapagos Islands International Climate Initiative $1.47
Switching from Fossil Fuels to Biofuels on the Galapagos Islands International Climate Initiative $1.47
Switching Supermarkets from Halogenated to Natural Refrigerants International Climate Initiative $2.40
Switching XPS Foam Production from F-Gases to Climate-Friendly CO2 Technology International Climate Initiative $4.63
São Tome and Príncipe: Adaptation to CC Least Developed Countries Fund $3.25
Tanzania Energy Development and Access Project (TEDAP) GEF Trust Fund - CC focal area $6.50
Technical Assistance to Francophone LDCs to Implement the UNFCCC8/CP8 Decision Least Developed Countries Fund $0.21
Technical Assistance - Nepal Pilot Program for Climate Resilience $0.22
Technical Assistance - Zambia Pilot Program for Climate Resilience $1.50
Technology Need Assessment on CC GEF Trust Fund - CC focal area $5.00
Technology Needs Assessments Special CC Fund $8.18
Technology Transfer and Market Development for Small-Hydropower in Tajikistan GEF Trust Fund - CC focal area $2.00
Thailand's Renewable Energy Accelerator Program Clean Technology Fund
The carbon market and China’s new buildings International Climate Initiative $1.95
The China CC Partnership Framework MDG Achievement Fund – Environment and CC thematic window $11.98
Thermal Power Efficiency GEF Trust Fund - CC focal area $19.70
Third National Communication to the UNFCCC GEF Trust Fund - CC focal area $5.72
Third National Communication to the United Nations Framework Convention on CC GEF Trust Fund - CC focal area $2.44
To promote the implementation of national and transboundary integrated water resource management that is sustainable and equitable given expected CC. Special CC Fund $1.67
Togo Efficient Lighting Program (under West Africa Energy Program: 3789) GEF Trust Fund - CC focal area $1.82
Training Local 'Gold Standard' Experts International Climate Initiative $1.47
Transfer Renewable Energy & Efficiency (TREE) International Climate Initiative $1.61
Transformation of the Rural PV Market (prev. Energy Sector Reform) GEF Trust Fund - CC focal area $1.70
TREE Programme - Transfer Renewable Energy & Efficiency International Climate Initiative $3.04
Trigeneration in Tamil Nadu House, Delhi International Climate Initiative $1.50
Trinational Forest Conservation Area International Climate Initiative $2.17
Tropical Forest Conservation in the Guiana Shield Ecoregion International Climate Initiative $3.37

144 Eastern Cape Climate Change Response Strategy
TT-Pilot : Promotion and Development of Local Wind Technologies in Mexico GEF Trust Fund - CC focal area $5.00
TT-Pilot (GEF -4): Bamboo Processing for Sri Lanka GEF Trust Fund - CC focal area $2.36
TT-Pilot (GEF-4): CC Related Technology Transfer for Cambodia: Using Agricultural Residue Biomass for Sustainable Energy Solutions GEF Trust Fund - CC focal area $1.69
TT-Pilot (GEF-4): Construction of 1000 Ton per day Municipal Solid Wastes Composting Unit in AKOUEDO Abidjan GEF Trust Fund - CC focal area $2.63
TT-Pilot (GEF-4): DHRS Irrigation Technology Pilot Project to face CC Impact Special CC Fund $2.00
TT-Pilot (GEF-4): Introduction of Renewable Wave Energy Technologies for the Generation of Electric Power in Small Coastal Communities in Jamaica Special CC Fund $0.72
TT-Pilot (GEF-4): Overcoming Policy, Market and Technological Barriers to Support Technological Innovation and South-South Technology Transfer: The Pilot Case of Ethanol Production from Cassava GEF Trust Fund - CC focal area $2.60
TT-Pilot (GEF-4): Promotion and Development of Local Solar Technologies in Chile GEF Trust Fund - CC focal area $2.73
TT-Pilot (GEF-4): Realizing Hydrogen Energy Installations on Small Islands through Technology Co-operation GEF Trust Fund - CC focal area $2.68
TT-Pilot (GEF-4): Renewable CO2 Capture and Storage from Sugar Fermentation Industry in Sao Paulo State Special CC Fund $2.65
TT-Pilot (GEF-4): Solar Chill: Commercialization and Transfer GEF Trust Fund - CC focal area $2.58
TT-Pilot (GEF-4): Technology Transfer: Typha-based Thermal Insulation Material Production in Senegal GEF Trust Fund - CC focal area $2.00
TT-Pilot (GEF-4)- Green Truck Demonstration Project GEF Trust Fund - CC focal area $4.20
Turkey Private Sector Sustainable Energy Financing Facility (TurSEFF) Clean Technology Fund
Turkey's Commercializing Sustainable Energy Finance Program Clean Technology Fund
Turkey's Private Sector Renewable Energy and Energy Efficiency Project Clean Technology Fund
TV programme initiative on sustainability International Climate Initiative $2.80
Ukraine Renewables Direct Lending Facility Clean Technology Fund
Unknown Adaptation Fund $0.00
UN-REDD national programme - Bolivia UN-REDD Programme $0.00
UN-REDD national programme - Democratic Republic of Congo UN-REDD Programme $7.38
UN-REDD national programme - Indonesia UN-REDD Programme $5.64
UN-REDD national programme - Panama UN-REDD Programme $2.17
UN-REDD national programme - Papua New Guinea UN-REDD Programme $0.00
UN-REDD national programme - Tanzania UN-REDD Programme $4.28
UN-REDD national programme - Viet Nam UN-REDD Programme $4.38
UN-REDD national programme - Zambia UN-REDD Programme $1.68
UN-REDD Programme Cambodia UN-REDD Programme $0.00
UN-REDD Programme Paraguay UN-REDD Programme $0.00
UN-REDD Programme Philippines UN-REDD Programme $0.00
UN-REDD Programme Solomon Islands UN-REDD Programme $0.00
Uruguay Wind Energy Programme (UWEP) GEF Trust Fund - CC focal area $0.95
Utilising Alcoholic Fermentation Residues International Climate Initiative $0.25
Vietnam Clean Production and Energy Efficiency Project GEF Trust Fund - CC focal area $2.37

145 Eastern Cape Climate Change Response Strategy
Vulnerability Assessment and Adaptation Programme for CC in the Coastal Zone of Cambodia Considering Livelihood Improvement and Ecosystems Least Developed Countries Fund $1.64
Wind Hybrid Power Generation (WHyPGen) Marketing Development Initiatives GEF Trust Fund - CC focal area $2.16
Yemen Geothermal Development Project GEF Trust Fund - CC focal area $1.00
YUS Indigenous Forest Reserve International Climate Initiative $7.20
Zambezi Valley Market Led Smallholder Development Strategic Priority on Adaptation $1.69
Least Developed Countries Fund $0.63
Forest Carbon Partnership Facility $2.09

146 Eastern Cape Climate Change Response Strategy
IMBEWU ASSESSMENT OF NATIONAL INSTITUTIONAL ARRANGEMENTS

PHASE 4: COMMUNICATIONS, EDUCATION AND PUBLIC AWARENESS STRATEGY

Phase IV: Communication, Education and Public Awareness.
Eastern Cape Climate Change Strategy 2010 ii
CONTENTS
1 EASTERN CAPE CLIMATE COMMUNICATIONS, EDUCATION AND PUBLIC AWARENESS STRATEGY 1
1.1 Communication of climate change issues 3 1.1.1 Communicating Climate Concerns 3 1.1.2 Communicating differently 3 1.1.3 Communication methodologies 5
1.2 Communications relating to the ECCCRS 10 1.2.1 Focussed communication: Provincial Legislature and Local Government
Councillors. 10 1.2.2 Focussed communication: Provincial and Local Government
Departments. 11 1.2.3 Focussed communication: Affected sectors 12 1.2.4 Focussed communication: Response Programme Committees 13 1.2.5 General climate change education and awareness 14
2 AWARENESS WORKSHOP 16
3 REFERENCES 18

Phase IV: Communication, Education and Public Awareness.
Eastern Cape Climate Change Strategy 2010 iii
LIST OF FIGURES
Figure 1: Internal working group meeting. ............................................................................................. 16 Figure 2: Stakeholder meeting - breakaway session............................................................................. 16 Figure 3: Stakeholder meeting............................................................................................................... 17

Phase IV: Communication, Education and Public Awareness.
Eastern Cape Climate Change Strategy 2010 iv

Phase IV: Communication, Education and Public Awareness.
Eastern Cape Climate Change Strategy 2010 1
1 EASTERN CAPE CLIMATE COMMUNICATIONS, EDUCATION AND PUBLIC AWARENESS STRATEGY
Policy makers, businesses, the media and the public are increasingly interested in the complex issue of climate change. This generates a multitude of information and opinions about climate change, and presents significant challenges in accurately and effectively communicating the issue. The purpose of this section of the Eastern Cape Climate Change Response Strategy (ECCCRS) is to provide a framework and approach to communicating climate change issues in the Eastern Cape Province. While the recently released National Climate Change Response Green Paper (2010) does not provide specific strategies relating to climate change communications, it does provide the following guidance:
Information and Communication technology One of the key information challenges is to get required information to interested and affected people as quickly as possible and to ensure that the information is provided in a format that is accessible and useful to the target audience. This is especially important in respect of early warning systems where people need to take specific actions to reduce risks to themselves, their families and property. In order to meet this challenge, South Africa will:
• Ensure that all information systems referred to above implement effective communication strategies that ensure that information reaches the target audience efficiently and effectively.
• Explore and develop new and novel ways of communicating information, especially the communication of information to people who have no access to telephonic or other forms of electronic communication. In this regard, the use of radio and also of community networks, such as messages disseminated through schools, hospitals, churches etc should also be explored.
In addition to the National Greenhouse Gas Response Green Paper, the South African Long Term Mitigation Scenarios (2007) notes the following in regard to Greenhouse Gas Mitigation (p22). “One of the most compelling results of LTMS is that although most of the significant emissions reductions need to be within the energy sector, the technology-based actions, even when all carried out together, do not “close the gap”. Hence one must turn to the least studied of the possible options – social behaviour. Changes in social behaviour, whether driven by policy, education, or awareness, may yet prove to have large scale and low cost mitigation effects. Changes in social behaviour may be relevant to a number of sectors.
• Human habitation, urban planning and the built environment are all areas where social change and new patterns, approaches and expectations will likely have significant mitigation effects.
• The distance between work, home and other life functions is also a factor.
• Modal shifts to public transport, moves away from individual car ownership towards the operation of shared vehicles, and other transport shifts deserve study. Business, commerce and consumption are currently heavily linked to transport of people. Much of this could potentially be replaced by, for example, internet-based interfaces.
• Food production and consumption, as well as the localisation of these activities, are also examples worthy of study.
• Population growth, but more importantly the growth of an urbanised population with high commodity expectations, could also be studied to see which changes may result in emissions reductions and how these might be driven.

Phase IV: Communication, Education and Public Awareness.
Eastern Cape Climate Change Strategy 2010 2
• Tree planting and greening of towns is important.”
It follows that climate change communication and awareness may be one of the most important elements in climate change response.
The communications of climate change issues can be broken into two main components:
• Communication aimed at promoting climate change awareness among broader society, including communities, business, community groups (e.g. NGOs), and government.
• Communication aimed at fostering effective implementation of climate change mitigation and adaptation projects and programmes involving various stakeholders or participants (e.g. government, climate change specialists, project implementing agencies.)
The ECCCRS needs to consider how the outcomes and programmes coming out of the study (particularly those mentioned in phase III) are communicated to various stakeholders ranging from the general public to government officials and participants in adaptation and mitigation action plans. This phase of the process therefore outlines a climate change communications, education and public awareness strategy for the ECCCRS. According to the proposed scope of the project, the following specific communication elements needed to be addressed:
• Education and the dissemination of relevant climate change information, to the general public, the media, laypeople and schools.
• Communications, education and training relating to climate change and the ECCCRS, with a focus on provincial and local government departments and officials.
• Communications and information about climate change and relevant adaptation and mitigation responses, with a focus on specific sectors (including vulnerable sectors) – for example industry, agriculture, vulnerable communities.

Phase IV: Communication, Education and Public Awareness.
Eastern Cape Climate Change Strategy 2010 3
1.1 Communication of climate change issues
As climate change is a global problem with wide-ranging impacts, it is essential that the climate change message is communicated successfully to as many different groups as possible, including the general public, the private sector, the public sector, and politicians. As discussed in previous phases, action on climate change consists of two complementary elements. Mitigation is concerned with the causes of global warming and calls for the reduction of greenhouse gas emissions while adaptation is concerned with the impacts of a changing climate on society, the economy and the environment, and promotes activities to reduce vulnerability to extreme weather events and other longer term changes in our climate. This section provides an approach to raising the level of awareness of the opportunities and threats brought about by climate change, and to encourage people to accept their responsibilities to adapt to, and mitigate against its impacts. This approach provides a framework for delivering key messages on climate change issues to target audiences and discusses the actions recommended to raise awareness of climate change and its impacts, and the communication of these actions.
1.1.1 Communicating Climate Concerns Climate change is a complex issue. The complexity of the issue makes it difficult to understand, and causes controversy. It is also difficult to discern changes over short time-periods (five years) as normal variability masks the climate change trends. The messages that need to be clearly communicated are:
• That climate change is real and the effects are long-term;
• It is possible to adapt to the impacts of climate change and to mitigate the causes; and
• There are risks to the “do-nothing” option
It is also important to recognise the potential conflicts that exist between the long-term changes climate change will bring and the short-term priorities that individuals and organisations work according to. The mechanisms available include:
• Promoting credible sources of information;
• Preparing and utilising material on climate change;
• Integrating the climate change issue in related communications;
• Responding to questions and requests for information from the community; and
• Proactive outreach to community groups and leaders
It is also vital that champions from within the private and public sector are identified and educated of the importance of climate change and the actions that they and others can take to climate change.
1.1.2 Communicating differently Based on work done in the UK (ESPACE 2007), it has been found that there are 6 themes that should drive work to raise awareness. These 6 themes can serve as a checklist against which any suggested initiatives on communication and awareness raising should be selected and judged (see Appendix 1). They are described as the “Rules of the Game”, and excerpts are given below.
Challenging the habits of climate change communication

Phase IV: Communication, Education and Public Awareness.
Eastern Cape Climate Change Strategy 2010 4
There is a need to communicate climate change in a different way from traditional approaches. People are rarely motivated to act by threats to their long-term survival. In fact, when it comes to climate change, people are not even normally motivated by concern for their children’s future. It is also important not to create fear about climate change without showing what people can do about it. If people can simply avoid frightening issues, or put them to the back of their minds, they will. It is often not helpful to criticise behaviour that people consider normal in their home or family. Instead, it is useful to make behaviour that reduces the threat of climate change seem positive and desirable. It is not useful to rely solely on logic, facts or even money-saving incentives – people need to be inspired and provoked.
To raise awareness and stimulate change, people need to better understand the big picture and be able to relate this to specific or limited action. This relates strongly to feedback of how small actions are part of the biggest picture. Information should be appropriate and should be given where it matters. Recommendations for the ECCRS:
A communications plan should ensure that people and organisations understand the general concept of climate change and how their individual actions can contribute to the overall climate change adaptation and mitigation process. Awareness of climate change is widespread, but at the ‘wrong’ level “Climate change” by itself is too wide and too remote a subject for the general population without a link to immediate issues. Meeting people on their own terms is crucial It is difficult to create a meaningful link between the wider climate change issues and local or individual experience and action. Initiatives that people regard as relevant can then be linked to the wider climate change agenda and to raising climate change awareness. For adaptation and mitigation messages to be effective, it is necessary to provide examples of people and organisations doing something about climate change. Recommendations for the ECCRS:
A communications plan should ensure that people and organisations understand the linkages between their local experience of climate and weather and the wider and future ramifications of climate change. Action is a much better starting point than information for raising awareness Any initiative needs to stimulate greater awareness through change. Limited or apparently superficial change may lead to deeper behavioural change. Evidence suggests that people are more likely to move to awareness from action than the other way around. However, awareness- raising will not happen automatically with action, but needs to be a planned goal of any programme. Most people are already doing something they think will help. A key theme is the relationship between this specific action of individuals, groups and organisations to a larger picture. The larger picture is ultimately climate change itself. Action must therefore be linked to information. Recommendations for the ECCRS:
“Learning by doing” is a highly effective form of education and awareness raising. The ECCCRS communication process should be action oriented and linked to specific information and learning outcomes. People’s internal sense of agency (the feeling that their actions are meaningful) must be reinforced

Phase IV: Communication, Education and Public Awareness.
Eastern Cape Climate Change Strategy 2010 5
Agency will be created when people know what to do, decide to do it and have the infrastructure necessary to allow them to do it. People will not sustain action if there are barriers preventing them from taking meaningful action. Each person’s contribution is so small that we must create a wider context and remove as many barriers as possible. Experience has shown that external barriers will lead to a resistance in establishing awareness. Groups and networks are vital for awareness raising and initiatives This relates to social groups that may already exist, e.g. schools, communities, etc., or to networks that may be established for specific actions/ initiatives. This relates to both individual initiatives and to the linking or ‘networking’ of initiatives. Recommendations for the ECCRS:
As with the previous recommendations, the ECCCRS communication process should be action oriented and linked to specific information and learning outcomes. People need to understand how their individual action fits into the bigger picture.
1.1.3 Communication methodologies As with the previous section, the substance of the following paragraphs is largely based on ESPACE (2007). Target audiences Targeting the communication according to stakeholder type can often be crucial to increasing awareness. Therefore, the most appropriate media needs to be selected for each sector or type of stakeholder. Recommendations for the ECCRS:
The ECCRS should structure the communication according to the target community or sector. Different types of communication will be required for government departments, business and industry sectors, and schools and community groups respectively. Attention should be paid to appropriate use of language, particularly among rural communities where English is not the common language of communication.
Branding and key messages Branding messages is important in helping to develop a recognisable link to the project. The private sector acknowledges the tremendous ‘brand value’ to be gained from an established identity. Familiarity often brings reassurance and competitive ‘edge’. It is therefore important to develop brands or messages that:
• Utilise formats that build awareness;
• Develop a single minded proposition that will be attractive to all communities/ businesses;
• Educate on the reasons for changing to illustrate key success factors;
• Encourage the community to convert – good for the environment = good for you = ‘feel good’ factor; and
• Builds on established branding and key messages (e.g. “Tomorrow’s Climate, Today’s Challenge”).
A key message of a communication strategy is that:
• Everyone has a role to play by reducing their contribution to climate change (mitigation); and
• Climate change will impact everyone – we all need to adapt (adaptation).
In addition, the following should be taken into account:

Phase IV: Communication, Education and Public Awareness.
Eastern Cape Climate Change Strategy 2010 6
• Climate change advice can add value and credibility;
• Climate change policies and measures should be integrated with other environmental issues and mainstream policies;
• Flexibility in policy making should be maintained to deal with uncertainty; and
• Flexibility in policy and regulation should also allow innovation.
There are also a number of risks that should be considered:
• Lack of resources reduces ability to deliver messages;
• Lack of effective partnership for communication of messages; and
• Other immediate policy pressures squeeze out incorporation of climate change in other partner’s activities.
Recommendations for the ECCCRS: The Eastern Cape Climate Change Response Strategy should ensure alignment in branding and delivery of messages with the National Strategy. A key message of the strategy should be that “everyone has a role to play in reducing emission (mitigation) and everyone will be affected by climate change (adaptation). It is critical to ensure that resources are available to deliver climate change messages. To this end, the EC Province should ensure alignment and access to the national strategy and resources. It is critical to ensure that the EC Province facilitates partnerships with other entities (both national and local) in delivering the climate change message. Public Relations Maintaining good relations with the public is very important for creating an environment in which the audience is receptive to the message. PR practice looks after reputation with the aim of earning understanding and can help to influence opinion and behaviour. Public relations should aim to:
• Build a strong and positive reputation of the organisation over time;
• Engage the reader, listener or viewer more fully;
• Provide credibility through endorsement of third parties;
• Foster prestige and reputation;
• Attract media attention thereby promoting the project;
• Display commitment to stakeholders (customers, partners and target audience) through demonstration;
• Create and maintain respectability in the eyes of the stakeholders; and
• Maintain resources through the goodwill of partners, politicians and managers
PR activities include media briefings, celebrity management, media releases, media launches, community consultation and media coverage evaluation. Recommendation:
The ECCCRS should ensure credibility in following through with publicised aims and objectives;

Phase IV: Communication, Education and Public Awareness.
Eastern Cape Climate Change Strategy 2010 7
The ECCCRS should seek endorsement from high profile figures within the community. This can include local celebrities, ambassadors, or people in influential positions. These relationships are important and should be carefully fostered. Seasonality Climate change issues are most likely to be raised in people’s minds at times of extreme weather (storms, floods, droughts, heat waves). It is important to be in a position to exploit these times to maximum benefit. Recommendation The ECCCRS should pre-prepare press releases that put climate change perspective on extreme weather events to enable quick response times. Using Different Channels A key part of successful promotion is in knowing the most effective channels of communication to reach the target audience. The pros and cons of the available options have to be considered. The core approach should be to target press and radio to reach households and businesses in the community. The priority of the communications work is to convey the message that all sectors and communities need to do, is to undertake simple changes. The mixed media of visual press and aural radio can be used to convey a variety of messages and spur to action in different ways. All media usage needs to be cost effective in their reach of the target audience and the communities as a whole. Recommendation:
The ECCCRS should work through existing communication channels and networks; and utilise organisations such as the business associations, professional associations and community groups. Television and Radio The cost of using this form of media for advertising can be restrictive. Radio broadcasts especially on local stations are both more affordable and can be used to target more specific audiences. Recommendation: The ECCCRS should work with the existing departmental communications team to identify good opportunities for TV and Radio coverage and work to ensure initiatives are promoted to TV and Radio where appropriate.
Printed Media Surveys have shown that the public do like to receive information via leaflets or newsletters. As such they are heavily relied upon as a key promotional tool. They are also relatively inexpensive to produce and provide relatively low cost advertising. Posters in particular are suitable for placing in public places. There are however, sustainability questions surrounding the publication of excess numbers of leaflets.
Recommendation: The ECCCRS should work with the existing departmental communications team to ensure printed media are utilised effectively. Electronic media

Phase IV: Communication, Education and Public Awareness.
Eastern Cape Climate Change Strategy 2010 8
As the availability of electronic media increases, the internet offers the ability to provide up-to-date and creative information. A website can have lower cost advantages and can act as a primary focus for campaigns and a source of contact for the target audience. Direct mail can appear “faceless”, whereas marketing via direct-e-mail helps overcome this potential barrier. On-line activities also enable closer contact with the audience, enabling awareness building. Recommendation Continue to develop the Eastern Cape climate change web pages and intranet pages, incorporating interactive elements where appropriate and possibly link to the PSDP. Stakeholder Engagement Stakeholder engagement is an effective way of embedding messages and achieving long-term change. Stakeholder engagement allows the creation of active networks through establishing contacts. In short, stakeholders help provide:
• Endorsement for the communication campaign, extend the campaign reach and maintain momentum;
• Reassurance of the target audience that the scheme is official, reputable and trustworthy;
• Financial and in-kind contributions enabling cost effective use of resources (time and money);
Although anyone can be considered a stakeholder, in this context stakeholders are those influential individuals or groups that have a vested interest in the campaign success. They could be funders / contributors, decision makers or influencers. Recommendations: Develop a programme of contact with District and Local Municipalities, and important associations, organisations and sectors, to ensure climate change is on the agenda of key partnerships. Ensure the dissemination of the ECCCRS message to District and Local Municipalities through district and local municipal environmental forums. Facilitate Climate Change workshops and summits focussing on climate change issues directly relevant to the Eastern Cape and affected sectors and groups. Direct Engagement To establish community based initiative it is necessary to identify the range of community groups that are accessible, and to understand their values. This will help target specific messages to engage the group to support your objectives. Community groups that have the following characteristics should be targeted.
• An established community activity;
• A good communications vehicle; and
• Clear community boundaries to help monitor impact.
Recommendation: The ECCCRS should support climate change response projects among community groups, sectors and businesses. This will facilitate the process of “learning by doing”. Examples of existing projects include the Wildlife and Environment Society of South Africa (WESSA) Eco-Schools programme. Advertising

Phase IV: Communication, Education and Public Awareness.
Eastern Cape Climate Change Strategy 2010 9
Advertising is a non-personal communication tool with the principal aim of creating awareness. Although it doesn’t focus on a specific target audience it can have powerful impact and a wide reach. Traditional awareness raising campaigns rely extensively on advertising using any on or a combination of radio, TV, newspapers, posters, leaflets and direct marketing. Advertising is thought to be a powerful influence on consumers especially when the benefits are aligned with the target audience values and aspirations or the intended action is convenient and tangible. Advertising repetition is important in maintaining awareness. Advertising and awareness raising alone is not strong enough to achieve sustainable behaviour change particularly for social issues. Advertising also has inherent cost implications.
Recommendations: The ECCCRS should work with the existing departmental communications team to develop posters / banners to use in public places and include advertising and promotion of the other climate change communication elements.

Phase IV: Communication, Education and Public Awareness.
Eastern Cape Climate Change Strategy 2010 10
1.2 Communications relating to the ECCCRS
Five types of audience, and associated communication approaches, are recommended for the ECCRS. These are:
• Provincial legislature and local government councillors;
• Provincial and local government departments;
• Affected industry and service sectors;
• Relevant committees associated with the response programmes recommended in Phase III of the ECCCRS; and
• The general public. These are outlined in more detail below. Please note that a pro-forma business plan for the further development and rollout of the ECCCRS communication, awareness and education plan is set out in Appendix 2.
1.2.1 Focussed communication: Provincial Legislature and Local Government Councillors.
It is critical that the ECCCRS is endorsed by provincial and local politicians. Without effective communication to the politicians, it is unlikely that the ECCCRS will be accorded appropriate priority in regard to provincial and local governance. Aim
• All political members of provincial legislature and local councils should understand and embrace the reality of climate change, and acknowledge the role of provincial and local government in climate change response.
Target groups
• The Premier;
• MECs;
• Members of the provincial legislature;
• Mayors;
• Councillors of District and Local municipalities; Content and message All political members of provincial legislature and local councils should embrace the fact that:
• Everyone has a role to play in reducing emissions (mitigation) and everyone will be affected by climate change (adaptation);
• Climate Change will directly impact the priority objectives of the province and district and local municipalities, including food security, poverty alleviation and job creation, and that climate change adaptation needs to be incorporated into future plans and objectives;
• Greenhouse Gas Mitigation includes, among others, opportunities for local economic development and job-creation;
• Through the National Climate Change Response Green Paper, Provincial and Local Government will play a critical role in climate change response;

Phase IV: Communication, Education and Public Awareness.
Eastern Cape Climate Change Strategy 2010 11
• The ECCCRS is the mechanism through which prioritised, coordinated and cross cutting climate change response actions can take place.
• Appropriate resources should be allocated in support of the prioritised outcomes of the ECCCRS.
Methodologies
• Presentations to key portfolio committees;
• Workshops for the provincial legislature;
• Workshops for councillors;
• The development of ECCCRS policy briefs with key policy recommendations for each portfolio committee.
Branding Development and adoption of a brand by legislature. General comment
• One a provincial climate change message is adopted all sections of provincial and local government should conform to this single clear message. If each government department and DM/LM takes up different messages, there would be confusion among the general public and private sector.
• Climate Change Response considerations should be formally included in appropriate portfolio committees.
• All politicians to be invited to a formal launch of the ECCCRS.
1.2.2 Focussed communication: Provincial and Local Government Departments.
Aim
• Communications, education and training relating to climate change and the ECCCRS, with a focus on provincial and local government departments and officials.
Target groups
• Premier’s office and Treasury;
• Departments (DEDEA, Agriculture, transport, health, LG & TA, public works and others);
• Relevant District and Local municipal departments. Content and message
• Every department has a role to play in reducing emission (mitigation) and every department will be directly and/or indirectly affected by climate change (adaptation);
• The mandates and objectives of most departments will be affected by climate change;
• Through the National Climate Change Response Green Paper, Provincial and Local Government will play a critical role in climate change response;
• The ECCCRS is the mechanism through which prioritised, coordinated and cross cutting climate change response actions can take place. To this end departments and municipalities must participate in appropriate provincial climate change programmes;
Methodologies

Phase IV: Communication, Education and Public Awareness.
Eastern Cape Climate Change Strategy 2010 12
• Workshops;
• Focus group meetings for departments with high vulnerability;
• Presentations to key cluster and planning meetings, particularly IDP meetings;
• Intranet;
• Internal informational material;
• Technical briefs should be developed for provincial and municipal managers. Branding
• Consider branding the EC climate change strategy. General comment
• Each department must understand its impacts on other departments, and the cross-cutting nature of climate change response. A silo approach to climate change response will not work;
• Initiate a discussion for a policy;
• Each Climate Change response programme, policy or action should develop an associated communication plan for relevant and specific target groups;
• The communication strategy should be associated with the gazetting of a policy;
• The challenge is to target interventions to make sure that departments work together or relate to programmes;
• There is the need for a tiered communication approach where the message sent out to different levels must be appropriate to those levels;
• At the higher level, the message is that a consolidated and cooperative approach to climate change is essential;
• The competency in each municipality or department should be catered to and where there are common issues to many municipalities or departments, focus-group meeting between these departments should be encouraged. Although Climate Change should be included in IDP and sector plans, it will be necessary to review the capacity required to assist local government to achieve this. The possibility of a dedicated municipal support unit, with a particular focus on supporting climate change in the IDP consultative process, may be required.
• It would be useful to have a uniform set of presentations appropriate for use by all departments.
• Relevant representatives to be invited to a formal launch of the ECCCRS.
1.2.3 Focussed communication: Affected sectors Climate change is likely to affect all sectors, systems and plans. Aim
• Communications and information about climate change and relevant adaptation and mitigation responses, with a focus on specific sectors (including vulnerable sectors) – for example industry, agriculture, vulnerable communities.
Target groups
• Priority sectors for adaptation and mitigation should be identified and targeted initially;
• Industry organisations such as farming co-ops, business chambers and professional associations;

Phase IV: Communication, Education and Public Awareness.
Eastern Cape Climate Change Strategy 2010 13
• Municipal sector departments. Content and message:
• Every sector has a role to play in reducing emission (mitigation) and every sector will be directly and/or indirectly affected by climate change (adaptation);
• Sector specific technical briefs should be developed from the ECCCRS;
• Climate Change response should be included in all sector plans, including IDPs, WSDPs, SDFs, IWMPs and LED.
• Relevant sector representatives must actively participate in the ECCCRS response programmes and actions.
Methodology
• Direct presentations to industry and sector organisations;
• Sector specific working groups;
• Glossy reports and brochures similar to the Provincial Spatial Development Plan, 2010 (PSDP)
• Website ( Similar to PSDP) Branding As with PSDP General comment
• Open a two way communication between government and industry;
• Initiate a discussion for a policy;
• Each Climate Change response programme, policy or action should develop an associated communication plan for relevant and specific target groups and sectors;
• Relevant representatives to be invited to a formal launch of the ECCCRS.
1.2.4 Focussed communication: Response Programme Committees The ECCCRS proposes 11 response programmes which would be lead by specially constituted committees, or which would form part of existing structures, forums or committees. The response programmes are likely to be effective only if there is full buy-in from the appropriate stakeholders, while in turn, the outcomes of the programmes should be communicated to the relevant target groups. Aim
• The ECCCRS should ensure that target stakeholders for each programme are informed to the extent that sufficient buy-in and commitment to the relevant programme is achieved;
• The outcomes of each programme should be communicated to the relevant target groups.
Target groups
• Stakeholders as listed in each response programmes; Content and message:
• As listed in each response programme;

Phase IV: Communication, Education and Public Awareness.
Eastern Cape Climate Change Strategy 2010 14
Methodology
• Direct presentations to relevant stakeholder groups;
• Targeted communication with specific (or champion) individuals from each group;
• Programme specific workshops;
• Email circulars;
• Website ( Similar to PSDP) Branding As with PSDP General comment
• Each Climate Change response programme, policy or action should develop an associated communication plan for relevant and specific target groups and sectors;
• These committees should inform further communication objectives/targets;
• Relevant representatives to be invited to a formal launch of the ECCCRS.
1.2.5 General climate change education and awareness There has been a growing realisation by Government and climate change specialists that there is a need for a co-ordinated climate change communications campaign to change public attitudes and behaviour relating to climate change. Although climate change is increasingly given attention in the media, messages directly relevant to the ECCCRS should be disseminated to the public. Aim
• Education and the dissemination of relevant climate change information, to the general public, the media, laypeople and schools.
Target groups The following target groups have been identified:
• General public;
• Schools;
• Community based organisations;
• Appropriate NGOs; and
• Appropriate media representatives. Content and message
• Every person has a role to play in reducing emission (mitigation) and every person will be directly affected by climate change (adaptation);
• The ECCCRS is the mechanism through with Climate Change response in the province is going to be coordinated;
• Priority impacts and responses relevant to the province should be communicated;
• The mitigation and adaptation responses can offer important opportunities for social and economic development;
• Response projects and success stories should be showcased.

Phase IV: Communication, Education and Public Awareness.
Eastern Cape Climate Change Strategy 2010 15
Methodologies
• Inclusion of climate change in the school curriculum;
• Learning by doing (introducing and publicising adaptation and mitigation projects in schools and communities);
• General climate change communication through traditional media (press, radio, TV, leaflets);
• Climate Change events (leveraging publicity opportunities for the ECCCRS on days such as world climate day);
• Partnerships (for example promoting awareness of the ECCCRS through existing channels such as environmental interest groups).
Branding
• Consider branding the EC climate change strategy General comment
• Need to link in with existing strategies – e.g.
• HIV/Aids;
• Nelson Mandela Bay communication strategy for saving water;
• PSDP.
• Consider engaging a communications company to develop a full communications programme and strategy;
• Ensure that indigenous language media are effectively used;
• Relevant representatives to be invited to a formal launch of the ECCCRS.

Phase IV: Communication, Education and Public Awareness.
Eastern Cape Climate Change Strategy 2010 16
2 AWARENESS WORKSHOP To date the development of the Eastern Cape Climate Change Response Strategy (ECCCRS) has included engagement and consultation workshops involving relevant stakeholders. It is recommended that a broader awareness workshop is held in order to expand the exposure of the ECCCRS to a broad set of stakeholders. It should be remembered that climate change response is a dynamic process which must factor in changing circumstances. The ECCCRS is intended to be a “live” document, which should be constantly revised in response to, among others, ongoing workshops, meetings and other communications.
Figure 1: Internal working group meeting.
Figure 2: Stakeholder meeting - breakaway session.

Phase IV: Communication, Education and Public Awareness.
Eastern Cape Climate Change Strategy 2010 17
Figure 3: Stakeholder meeting.
Phase IV: Communication, Education and Public Awareness.
Eastern Cape Climate Change Strategy 2010 18
3 REFERENCES Government of the Republic of South Africa, 2010: National Climate Change Response Green Paper. Pretoria. Scenario Building Team 2007. Long Term Mitigation Scenarios: Technical Summary, Department of Environment Affairs and Tourism, Pretoria, October 2007 European Spatial Planning: Adapting to Climate Events (ESPACE), 2007: Climate Change Communication Strategy: A West Sussex Case Study. UK Department of Communities and Local Government,

Phase IV: Communication, Education and Public Awareness.
Eastern Cape Climate Change Strategy 2010 19
Appendix 1 - The Rules of the Game
Principles of Climate Change Communication
(Note that this section is taken from ESPACE, 2007)
Section 1: Blowing Away Myths 1. Challenging habits of climate change communication. Don’t rely on concern about children’s future or human survival instincts. Recent surveys show that people without children may care more about climate change than those with children. “Fight or flight” human survival instincts have a time limit measured in minutes – they are little use for a change in climate measured in years. Don’t create fear without agency. Fear can create apathy if individuals have no ‘agency’ to act upon the threat. Use fear with great caution. Don’t attack or criticise home or family. It is unproductive to attack that which people hold dear. 2. Forget the climate change detractors. Those who deny climate change science are irritating, but unimportant. The argument is not about if we should deal with climate change, but how we should deal with climate change. 3. There is no ‘rational man’. The evidence discredits the ‘rational man’ theory – we rarely weigh objectively the value of different decisions and then take the clear self-interested choice. 4. Information can’t work alone. Providing information is not wrong; relying on information alone to change attitudes is wrong. Remember also that money messages are important, but not that important. Section 2: A New Way of Thinking 5. Climate change must be ‘front of mind’ before persuasion works. Telling the public to take notice of climate change will only be successful when people realise (or remember) that climate change relates to them. 6. Use both peripheral and central processing. Attracting attention to an issue can change attitudes, but peripheral messages can be just as effective. 7. Link climate change mitigation to positive desires/aspirations. Traditional marketing links products to the aspirations of their target audience. Linking climate change mitigation to home improvement, self-improvement, green spaces or national pride are all worth investigating. 8. Use transmitters and social learning. People learn through social interaction, and some people are better teachers and trendsetters than others. Targeting these people will ensure that messages are transmitted effectively. 9. Beware the impacts of cognitive dissonance. Confronting someone with the difference between their attitude and their actions on climate change will make them more likely to change their attitude than their actions. Section 3: Linking Policy and Communications 10. Everyone must use a clear and consistent explanation of climate change.

Phase IV: Communication, Education and Public Awareness.
Eastern Cape Climate Change Strategy 2010 20
The public knows that climate change is important, but is less clear on exactly what it is and how it works. 11. Government policy and communications on climate change must be consistent. Don’t ‘build in’ inconsistency and failure from the start. Section Four: Audience Principles 12. Create ‘agency’ for combating climate change. Agency is created when people know what to do, decide for themselves to do it, have access to the infrastructure in which to act, and understand that their contribution is important. 13. Make climate change a ‘home’ not ‘away’ issue. Climate change is global issue, but we will feel its impact at home – and we can act on it at home. 14. Raise the status of climate change mitigation behaviours. Research shows that energy efficiency behaviours can make you seem poor and unattractive. We must work to overcome these emotional assumptions. 15. Target specific groups. A classic marketing rule, and one not always followed by climate change communications from government and other sources. Section Five: Style Principles 16. Create a trusted, credible, recognised voice on climate change. We need trusted organisations and individuals that the media call upon to explain the implications of climate change to the average citizen. 17. Use emotions and visuals. Another classic marketing rule: changing behaviour by disseminating information doesn’t always work, but emotions and visuals usually do. Section Six: Effective Management 18. The context affects everything. The prioritisation of these principles must be subject to ongoing assessments of the UK situation on climate change. 19. The communications must be sustained over time. All the most successful public awareness campaigns have been sustained consistently over many years. 20. Partnered delivery of messages will be more successful. Experience shows that partnered delivery is often a key component for projects that are large, complex and have many stakeholders.

Eastern Cape Climate Change Strategy 2010 21
Appendix 2 – Draft Communications Programme for Rollout
Date: March 2011
Revision No: 0
Prepared By:
DEDEA
CLIMATE CHANGE
PROGRAMME -------------
Communication Approved By:
CC Programme Rollout of a Climate Change Communication Programme in the Eastern Cape
Programme Custodian
Department of Economic Development and Environmental Affairs
Objective(s): • Development of a detailed communications plan and set of materials for the Eastern
Cape Climate Change Response Strategy;
• Initiation of procedures to resource and rollout the Climate Change communications programmes to relevant stakeholders in the Eastern Cape.
Target(s): • Completion of a detailed communications plan for the Eastern Cape Climate Change
Response Strategy, together with budget, and initial communication materials by 20XX
• The communications programme is sufficiently resourced to allow rollout by 20XX.
Name and contact details Unit Interest
Lyndon Mardon DEDEA NEM: Air Quality Act
Sixolile Makaule DEDEA Communications
Office of the premier Strategy Custodian
Tony Williams Department of Local Government and Traditional Affairs.
Communication with local government.
SALGA Communication with local government.
Government Communication and Information Service
Alignment with national message.
DEA Alignment with national communications process.
Other key stakeholders
Other interested parties
• ECSECC
• All sister departments
• District Municipalities
• Local Municipalities
• Metros
• Coega IDZ
• East London IDZ

Eastern Cape Climate Change Strategy 2010 22
• ECDC
• Port Elizabeth Regional Chamber of Commerce and Industry
• Border-Kei Chamber of Commerce
• Rural Development Agency
Overview of the issue:
Climate change communication and awareness may be one of the most important elements in climate change response. The communications of climate change issues can be broken into two main components:
• Communication aimed at promoting climate change awareness among broader society, including communities, business, community groups (e.g. NGOs), and government.
• Communication aimed at fostering effective implementation of climate change mitigation and adaptation projects and programmes involving various stakeholders or participants (e.g. government, climate change specialists, project implementing agencies.)
The Eastern Cape Climate Change Response Strategy (ECCCRS) sets out a number of desired and required outcomes and programmes in order to ensure effective climate change response in the Province. Without effective communication and engagement with all relevant stakeholders, the ECCCRS is unlikely to gain suitable traction and achieve broad uptake. The communications challenge is broad in that stakeholders range from the general public, to provincial and local government officials, to politicians, to the private sector and to participants in adaptation and mitigation action plans. It follows that a tiered, focussed and suitably resourced communications development and rollout process is necessary. The ECCCRS sets out certain recommendations and messages to be incorporated into a communications programme that incorporates individually tailored approaches to different classes of stakeholders. These recommendations need to be developed further into a detailed plan, together with suitable communications materials. Thereafter, a full rollout
programme needs to be resourced and executed.
Relevant Policies, Programme(s)/Project(s)
• National Climate Change Response Green Paper (2010);
• Long Term Mitigation Scenarios (2007);
• Outcome 10 of the 12 Presidential service level outcomes;
• National commitment to greenhouse gas reductions (January 2010);
• COP 17, UNFCCC, Durban 2011.
Regulatory and Legislative Framework
• National Environmental Management Act (Act 107 of 1998);
• National Environmental Management: Air Quality Act (Act 163 of 2004)
Management Tool(s):
To be determined by DEDEA communications
Performance Indicators
To be determined by DEDEA communications

Eastern Cape Clim
ate Change Strategy
2010
23
CLIM
ATE CHANGE M
ITIGATION
Projects
Programme Title:
Rollout of a Climate Change Communication Programme in the Eastern Cape
OBJECTIVE(S)
•
Development of a detailed communications plan and set of materials for the Eastern Cape Clim
ate Change Response
Strategy
Target(s):
•
Completion of a detailed communications plan for the Eastern Cape Clim
ate Change Response Strategy, together with
budget, and initial communication m
aterials by 20XX
Activity
Responsible
Person
Budget
Requirem
ents
Starting
Date
Completion
Date
Comments
Develop a detailed
communications plan
building on the
recommendations from
phase IV of the
ECCCRS
DEDEA Environmental
Affairs together with
DEDEA
communications.
R200,000.00
June 2011
November 2011
The communication plan should
set up the roadmap, budget
requirements and human
resource requirements for the full
rollout phase. It is critical that the
communications process
promotes individual ownership of
the clim
ate change issue.
Develop suitable
materials, including key
messages, branding,
pamphlets, booklets,
media releases,
technical briefs and
policy briefs for
publication at rollout.
DEDEA Environmental
Affairs together with
DEDEA
communications
R300,000.00
June 2011
November 2011
Materials to draw from details of
the ECCCRS reports, and from
other credible sources such as
IPCC AR4 and other South
African submissions to the
UNFCCC.
Peoples’ direct experience of
potential clim
ate change should

Eastern Cape Clim
ate Change Strategy
2010
24
be appealed to. For example,
experiences of extreme weather
events.

Eastern Cape Clim
ate Change Strategy
2010
25
CLIM
ATE CHANGE M
ITIGATION
PROGRAMME
Programme Title:
Rollout of a Climate Change Communication Programme in the Eastern Cape
OBJECTIVE(S)
•
Initiation of procedures to resource and rollout the Clim
ate Change communications programmes to relevant stakeholders
in the Eastern Cape.
Target(s):
•
The communications programme is sufficiently resourced to allow rollout by 20XX.
Activity
Responsible
Person
Budget
Requirem
ents
Starting
Date
Completion
Date
Comments
Full rollout of the
communications
programme as set up in
previous objective.
DEDEA Environmental
Affairs together with
DEDEA
communications.
R10,000, 000.00
October 2012
Open
Programme to include m
ass
engagement with the general public
and schools, inclusion of clim
ate
change in school curricula, and
focussed engagement with target
groups and sectors.


![Home [] · Web viewDepartment of Economic Development, Tourism and Environmental Affairs in KwaZulu-Natal, Head Office, BEE Directorate Department of Economic Development, Tourism](https://img.pdfslide.us/doc/110x75/610d0709d2a95815c0601d38/home-web-view-department-of-economic-development-tourism-and-environmental.jpg)