Embed Size (px)
Citation preview
Department of Defense
Legacy Resource Management Program
PROJECT NUMBER (14-758)
Renewable Energy Development on Department of Defense Installations in the Desert Southwest:
Identifying Impacts to Species at Risk – Journal
Publication
Title: Challenges in Wildlife Conservation in the Presence of Solar Energy Development in
Desert Ecosystems.
MARTIN D. PIORKOWSKI – Project Biologist, Arizona Game and Fish Department, 5000 W
Carefree Hwy, Phoenix Arizona 85086, USA, [email protected], corresponding
author
R. NATE GWINN – Biologist, Arizona Game and Fish Department, 5000 W Carefree Hwy,
Phoenix Arizona 85086, USA, [email protected]
JOEL M. DIAMOND – Regional Supervisor, Arizona Game and Fish Department, 5000 W
Carefree Hwy, Phoenix Arizona 85086, USA, [email protected]
MICHAEL F. INGRALDI – State Supervisor, Arizona Game and Fish Department, 5000 W
Carefree Hwy, Phoenix Arizona 85086, USA, [email protected]
Abstract
The deserts of the southwestern United States (U.S.) contain some of the highest biological
diversity in the U.S. with many highly endemic species listed under some sensitive status
designation. The impacts presented by solar development on the presence and distribution of
small mammal and reptile communities must be examined to identify risk to both common and
sensitive status species, in turn providing direction for future solar development. We designed a
study to assess the presence and distribution of two taxa across three military installations in the
southwestern U.S. through three primary objectives which address differences in both small
mammal and reptiles communities across a gradient of distances from the photo-voltaic solar
arrays. Our trapping efforts occurred from 7 November 2014 – 17 July 2015 from which we
caught 10 species of small mammals and 15 species of reptiles. Results from these efforts
indicated that species richness, species diversity, and abundance estimates are all highest at
distance between 20 m and 400 m from the solar facility, suggesting that few individuals are
utilizing solar arrays. The likely mechanism of this response is displacement into the surrounding
habitat. We speculate that the construction and maintenance of these solar arrays creates
unsuitable or low quality habitat for these small mammal and reptile communities. This is likely
due to the fossorial nature of these communities in the Desert Southwest and their dependence on
suitable low compaction soils for burrows. Based on these results, we detail recommendations on
future solar development considerations, such as prioritizing solar development on disturbed
lands.
2
Introduction
The high biodiversity of the Sonoran and Mohave deserts present an increased probability of
conflict between at risk species management and renewable energy development (Lovich and
Bainbridge 1999, Mittermeier et al. 2002, Randall et al. 2010, Lovich and Ennen 2011).
Specifically, there is limited empirical information on the impact of renewable energy
development on wildlife or at risk species. The limited work that has been conducted on the
impact of renewable energy development has focused on wind facilities (Gill 2005, Kuvlesky et
al. 2007). Thus, there is an absence of data on the impact of solar development on at risk species
(Lovich and Ennen 2011; Turney and Fthenakis 2011; Northrup and Wittemyer 2013). While
one model has been proposed to develop a wildlife centered suitability index for solar
development (Stoms et al. 2013), it is based on broad scale habitat patterns rather than site
specific data collection. Therefore, the site specific impacts of solar development exist only in
compliance documents and other sources of “gray” literature (Lovich and Ennen 2011), and
focus on hydrologic impacts and not at risk species (Duane and McIntyre 2011).
The majority of diversity in the Sonoran and Mohave deserts is made up of birds,
mammals, and reptiles with many of the terrestrial at risk wildlife composed of small mammals
and reptiles (Randall et al. 2010). Since many of the at risk species in the Sonoran and Mohave
deserts are small mammals and reptiles (Randall et al. 2010) any evaluation of the impact of
solar development on at risk species should be focused on these taxa. Small mammals are often
used as indicators of ecosystem health across a variety of habitats (Chase et al. 2000, Pearce and
Venier 2005). Thompson and Thompson (2005) suggest that reptiles are also indicators of
ecosystem health. Thus, by monitoring these two taxa together we can better assess the impact of
solar development on the landscape.
3
Sustaining and conserving suitable habitats and resources for at risk species allow
military installations to manage potential risk and maintain compliance with federal regulations
such as the Endangered Species Act (ESA). In addition, a memorandum of understanding
between the Department of Defense (DoD) and the International Association of Fish and
Wildlife Agencies directs the management of natural resources on military installations under
provisions of the Sikes Act (USC 1960). Although many small mammal and reptile species on
military lands are not currently protected under the ESA, they represent species that could affect
DoD actions in the future if habitat degradation results in species listing under the ESA. Meeting
federal compliance is vital to mission implementation and to maintaining military training
activities across installations. Therefore, the impacts to small mammal and reptile communities
presented by renewable energy development on DoD lands must be identified to avoid conflicts
between wildlife at risk and military operations.
The qualitative term “Soft Footprint” has been used to suggest a low impact physical
disturbance (Gatlin 2012). This is usually expressed as a surface maintenance similar to the
surrounding landscape. This term suggests that if there is a “soft footprint” there are also “hard”
and potential “intermediate” footprints. Although these terms are not specifically defined and
prone to subjectivity, we define these terms as follows: soft footprint – surface maintenance
similar to the surrounding landscape; intermediate footprint – surface maintenance is modified
from surrounding landscape but is limited in vegetation composition and structure; and hard
footprint – highly modified surface maintenance to eliminate and discourage vegetative growth
and ground permeability often resulting from gravel or stone deposition. The types of footprints
as defined above may have varying levels of effect on the surrounding wildlife community.
4
Mitigating the potential impacts that utility-scale solar energy developments may have on
at risk species and communities requires that we identify the spatial extent at which the impacts
occur. Only when the extent of the impacts is known can appropriate mitigation strategies be
developed. The overall goal of this study was to answer the critical questions: 1) What impacts
do solar developments have on wildlife communities and Species at Risk in the Desert
Southwest; and 2) At what spatial-scale should mitigation occur? An opportunity to evaluate
these questions arose with the installation of utility-scale solar developments on Department of
Defense (DoD) managed lands in the Sonoran and Mohave deserts. The Sonoran Desert Military
Ranges Conservation Partnership Team and collaborators at the Yuma Proving Ground (YPG),
Davis-Monthan Air Force Base (DMAFB), and Edwards Air Force Base (EAFB) identified the
evaluation of solar development impacts as a priority project to help implement their Net Zero
Energy concept (Booth et al. 2010). Our specific objectives were: 1) quantify differences in
reptile and small mammal diversity and abundance between solar development sites and un-
impacted sites on DoD installations; 2) identify the spatial extent of solar development impacts
on wildlife communities with application to Species at Risk; and 3) evaluate the mitigation value
of “soft-footprint” solar development when compared to standard “hard-footprint” development.
By interpreting the results of this study, we developed a set of data-driven management
recommendations that can provide useful guidance on both existing and future solar
developments.
Methods
Study Area – Our study areas consisted of three DoD installations within the Mohave and
Sonoran deserts (Figure 1). Each installation had an existing photo-voltaic solar array.
5
DMAFB is located in Pima County within the city limits of Tucson, Arizona totaling
approximately 43 km2. DMAFB lie in an ecotone zone where the Arizona Upland subdivision of
the Sonoran Desert intersects with Chihuahuan Desert grassland (Brown, 1994). Plant species
that occur in this area include prickly pear (Opuntia spp.), cholla (Cylindropuntia spp.), and
saguaro (Carnegiea gigantea) cacti, mesquite (Prosopis spp.), palo verde (Parkinsonia spp.),
creosote bush (Larrea tridentata), acacia (Acacia spp.), yucca (Yucca spp.), as well as numerous
species of native and exotic grasses. The Tucson basin is characterized by broad alluvial fans,
dissected upland bajadas, and four major mountain ranges: the Santa Catalina, Tucson, Santa
Rita, and Rincon mountains. DMAFB lies between 773 m and 891 m in elevation with average
precipitation between 27.9 and 33.0 cm/yr. Average temperatures range from 4⁰C for lows
during the winter to 38⁰C for highs during the summer.
YPG lies within La Paz and Yuma counties near Yuma, Arizona and totals approximately
3,450 km². The Lower Colorado River Subdivision of the Sonoran Desert is the predominate
vegetative community. This vegetative community is the largest and most arid component within
the Sonoran Desert and characterized by extremely drought-tolerant plant species such as
creosote bush (Larrea tridentata), bursage (Ambrosia spp.), palo verde (Parkinsonia spp.) and
cacti (e.g., prickly pear cacti [Opuntia spp.] and saguaro [Carnegiea gigantea]) (Olson and
Dinerstein 2002, Brown 1994). The broad, flat, and sparsely vegetated desert plains of YPG are
dissected by numerous incised washes that support ironwood (Olneya tesota), smoketree
(Psorothamnus spinosus), acacia (Acacia spp.), mesquite (Prosopis spp.) and numerous shrub
species. Elevated hills and mountain slopes within the Arizona Upland Subdivision of the
Sonoran Desert are vegetated with, cacti and agave (Agave spp.). Elevation on YPG ranges from
6
sea level to 878 m with average precipitation is approximately 3 cm/yr. Average temperatures
range from 8⁰C for lows during the winter to 42⁰C for highs during the summer.
EAFB lies within Kern, Los Angeles, and San Bernardino counties near Lancaster,
California and totals approximately 1,262 km². EAFB lies completely in the Mojave Desert.
Dominant vegetation on our EAFB sites included creosote bush (Larrea tridentata), white
bursage (Ambrosia dumosa), saltbush (Atriplex confertifolia), blackbrush (Coleogyne
ramosissima), as well as numerous annual forbs and grasses (Brown, 1994). Elevation on EAFB
ranges from 690 m to 1,039 m with average precipitation is between 15.2 and 17.8 cm/yr.
Average temperatures range from 1⁰C for lows during the winter to 36⁰C for highs during the
summer months.
Study Design – We developed a trap design to measure the ecological gradient of a
small mammal and reptile communities from an anthropogenic disturbance by reviewing
different trap designs, arrangements, and appropriate analyses to measure community
effects. We reviewed literature on three different trapping designs: grid (Dice 1938, Pelikan
et al. 1964, Southern 1973), web (Anderson et al. 1983), and transect (Read et al. 1988,
Pearson and Ruggiero 2003). Each had advantages and disadvantages, but the assessment
for this study related to understanding the dynamics of the small mammal and reptile
communities in relation to disturbance. Therefore, we chose a hybrid design of grids and
transects based on recommendations from the literature.
Our design included two super-transects on opposite sides of the solar facility and
directed away from the source of disturbance within homogeneous habitat. Each super-transect
originated at the fence line surrounding the solar facility (this appeared to be the most obvious
and consistent barrier) and extended away from the facility. A super-transect consisted of up to 5
7
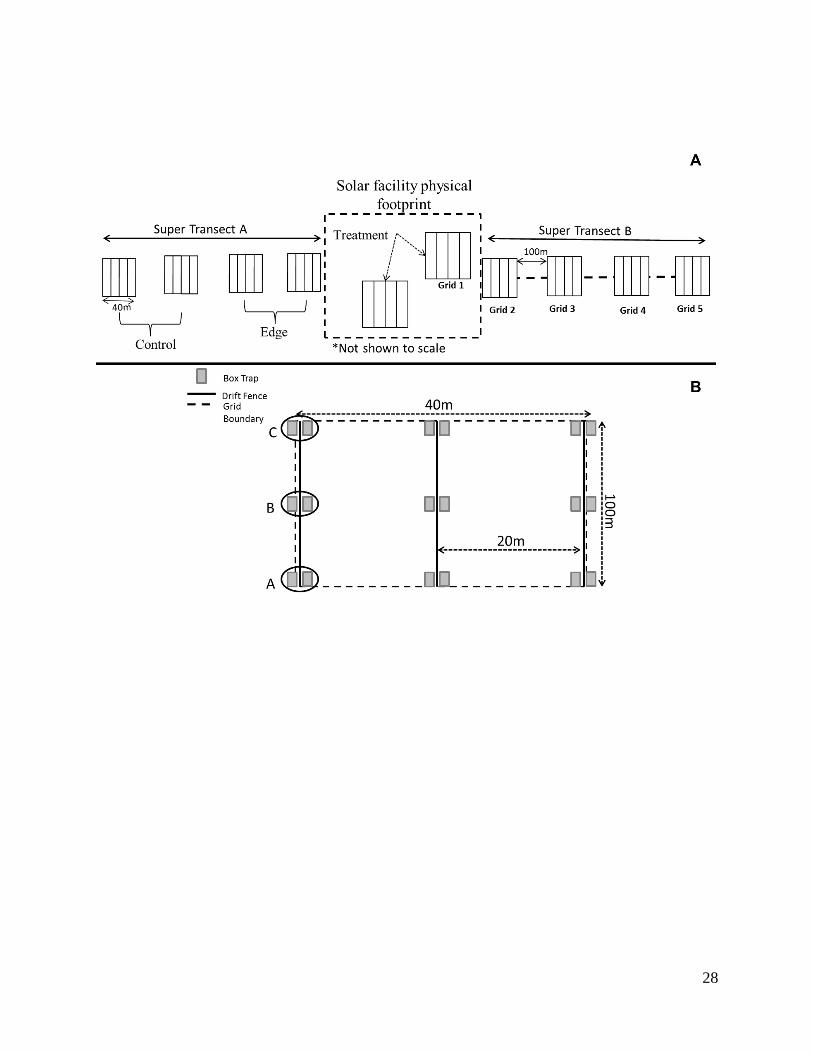
grids spaced with 100 m intervals. A grid consisted of up to 50 traps set in a 40 x 100 m
rectangle with traps spaced 10 m apart. Our first grid was located within the solar fence
boundary and extending along the super-transect line for 40 m at which a 100 m interval was
measured before the placement of the next grid. This continued until a maximum of 5 trap grids
were placed along both super-transect lines. The grids within the solar facility represented the
“Treatment” (Figure 2) with grids 2 and 3 representing the potential “edge” and grids 4 and 5
representing the “control” or un-impacted site. The 100m interval between grids was based on a
literature review of the primary taxonomic families home range sizes with average home range
diameters of ~27.2 m for Heteromyidae (Maza et al. 1973, Schroder 1979, Braun 1985), ~55.6
m for Cricetidae (Cranford 1977, Thompson 1982, Lynch et al, 1994, Ribble et al. 2002,
Shurtliff et al. 2005), ~152.9 m for Sciuridae (Bradley 1967, Drabek 1973, Ortega 1990,
Boellstorff and Owings 1995), and ~84.2 m for Soricidae (Blair 1940, Hawes 1977, Kollars
1995) of small mammals found within our study area. With the exception of a few sciurid
species, most small mammals have home ranges smaller than the 100 m interval distance. We
assumed for comparison purposes that at least the furthest grids away from the solar facility on
each of the super-transects were un-impacted by the disturbance associated with the facility.
These “controls” were set as our baseline comparison for “treatment” effect. At each military
installation we were able to sample areas at least three home ranges away from the solar facility
as summarized in the literature review of home range sizes using the basic configurations of
Figure 2.
Modification for reptile grids included 3 transects per grid while maintaining the super-
transect design. Each grid was composed of 3 transects with 3 paired box traps (total of 6 traps)
placed along each transect (identified by a drift fence with substrate along the bottom instead of a
8
trench). No trenches were dug for the drift fence due to inconsistent digging requirement and
potentially significant cultural areas at each installation. Complete independence between the
two grids within the solar facility and the first grid along the super-transect was not be possible
in all cases; however, for data analysis we will assume independence. For EAFB reptile trapping,
we were not able to set complete grids for Super Transect B due to cultural sensitivity concerns.
An archeologist was able to position at least a single transect of traps for grids 4 and 5.
We conducted three trapping sessions each for small mammals and reptiles. We trapped
small mammals for eight consecutive days approximately once a month from mid-November
2014 through early April 2015. We conducted three similar trapping sessions for reptiles which
consisted of a single 8-day trapping session with approximately one session each month from
April through July 2015. All traps were individually marked with a unique number for
identification purposes.
For small mammals, we used 600 folding Sherman Model LFATDG live traps (7.62 X
8.89 X 22.86 cm). Traps were baited with sweet feed as traps were opened. A handful of cotton
batting or poly-fill was placed inside each trap to provide insulation. Traps were opened one hour
prior to sunset and left open during the night. We began checking traps one hour prior to sunrise.
Trap stations were marked no more than 1 m away with a pinflag. Trapped animals were
identified to species, weighed, sexed, and had the following metrics taken: tail length, body
length, length of the hind foot and pinnae (ear) length. Animals were placed in 1-gallon re-
sealable bags to be weighed. Bags were discarded as they become soiled or developed holes.
Each animal was marked using standard techniques (Silvy 2012) with a numeric ear tag and
colored washer so we could identify individuals during subsequent trapping efforts. Application
of ear tags included iodine to prevent possible infection (Silvy 2012). Animals were handled for
9
no more than 5 minutes, using standard methods described in Wilson et al. (1996), so as to
reduce stress and released promptly at the point of capture after all metrics were taken. All traps
were sanitized between each trapping session with QUAT 128 disinfectant.
For reptiles (lizards and snakes) we utilized box traps with funnel entrances. These traps
were built specifically for this project to maximize the breadth of species that may be captured.
Box traps were constructed with a wood frame and 3.18 mm aluminum mesh and a funnel
opening (~3.81 – 4.45 cm) on both ends of the box with an incline angle of ~ 20⁰. Traps had a
removable insulated lid (to reduce heat exposure) which could be opened to remove specimens
caught in the trap. Captured individuals were marked with either a toe-clip for small and
potential juveniles (McDiarmid et al. 2012) or permanent marker for adults. Animals were
released promptly at the point of capture after being measured and marked. Traps were checked
daily between 0600 hrs and 1100 hrs.
Analyses – Spellerberg and Fedor (2003) suggest more rigorous use of the definitions
between species richness and species diversity. For this reason we provided information for both
the Shannon-Wiener index for diversity and providing species richness measurements as
described in Kessler et al. (2001). For each installation, we pooled data between the two super-
transects for each unique grid number to generate species diversity indices (Shannon–Weiner
Index; Shannon and Weaver 1949, Magurran, 2004), species richness (Kessler et al. 2001) and
relative abundance estimates using mark-recapture methods. These unique grid numbers
represented generally similar distances from the solar facility. In this way, we increased our
species representation and inferences by sampling more area along a similar distance from the
facility.
10
By using the furthest grids as controls and comparison of each grid closer to the solar
facility, we calculated changes across each of the super-transects to the treatment estimates. We
compared the rate of change across this gradient and identified the extent of impact as defined by
the “edge.”
We evaluated species diversity and abundance based on the physical construction of each
solar facility. Prior to this study, we identified three military installations with different types of
solar installation ranging from “hard” to “soft” footprint design. DMAFB included 18.8 ha of
solar development in our focus area and included both a “hard” footprint which included a
graded surface compacted and leveled with coarse stone below the solar panels. The “soft”
footprint design included a graded surface but revegetated with grasses to help control erosion.
YPG is characterized by a 1.4 ha “hard” footprint design as it was graded and terraced with
coarse stone. EAFB was compacted, but native soil was left in place and was likely more of a
“soft” footprint design consisting of 3.2 ha.
Results
Our trapping efforts (Table 1) occurred from 7 November 2014 – 2 April 2015 for small
mammals and 21 April 2015 – 17 July 2015 for reptiles. We successfully trapped 10 species of
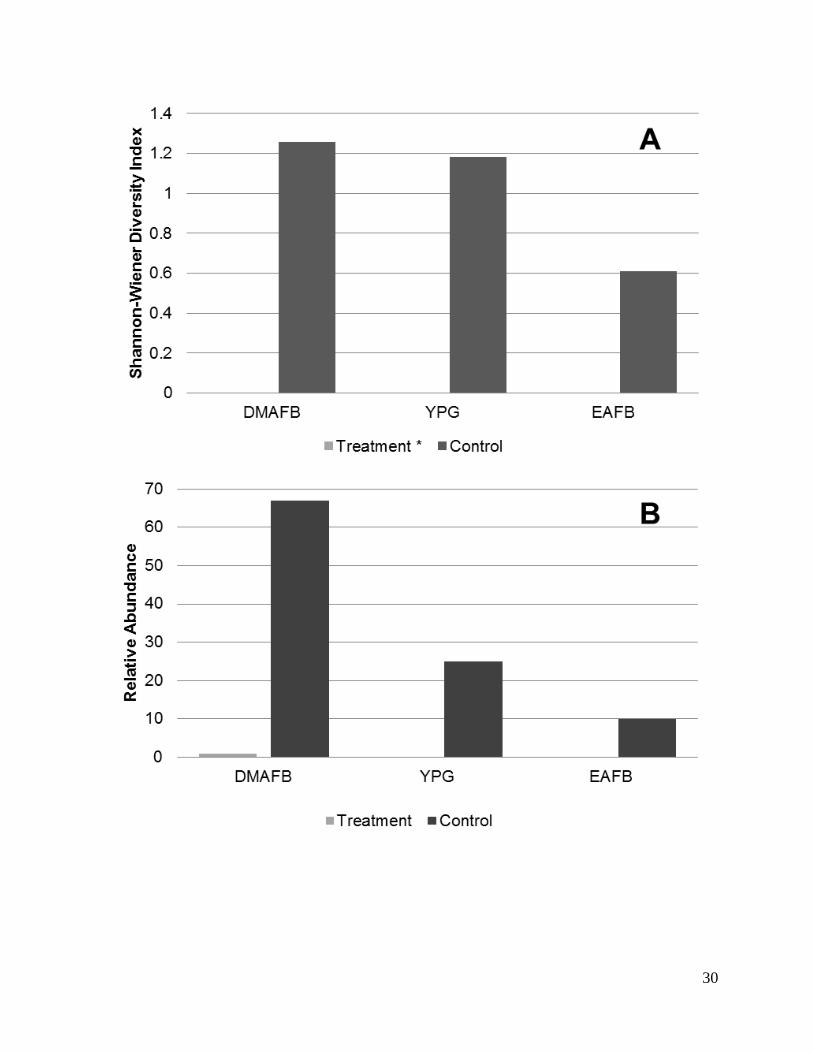
small mammals and 15 species of reptiles for all installations combined (Table 1). We captured a
single individual small mammal (Dipodomys merriami) on the DMAFB solar array. This
produced no measurable results on the treatment areas of either YPG or EAFB. For reptiles, we
captured a total of 15 reptiles within the solar arrays at all installations combined (Table 1).
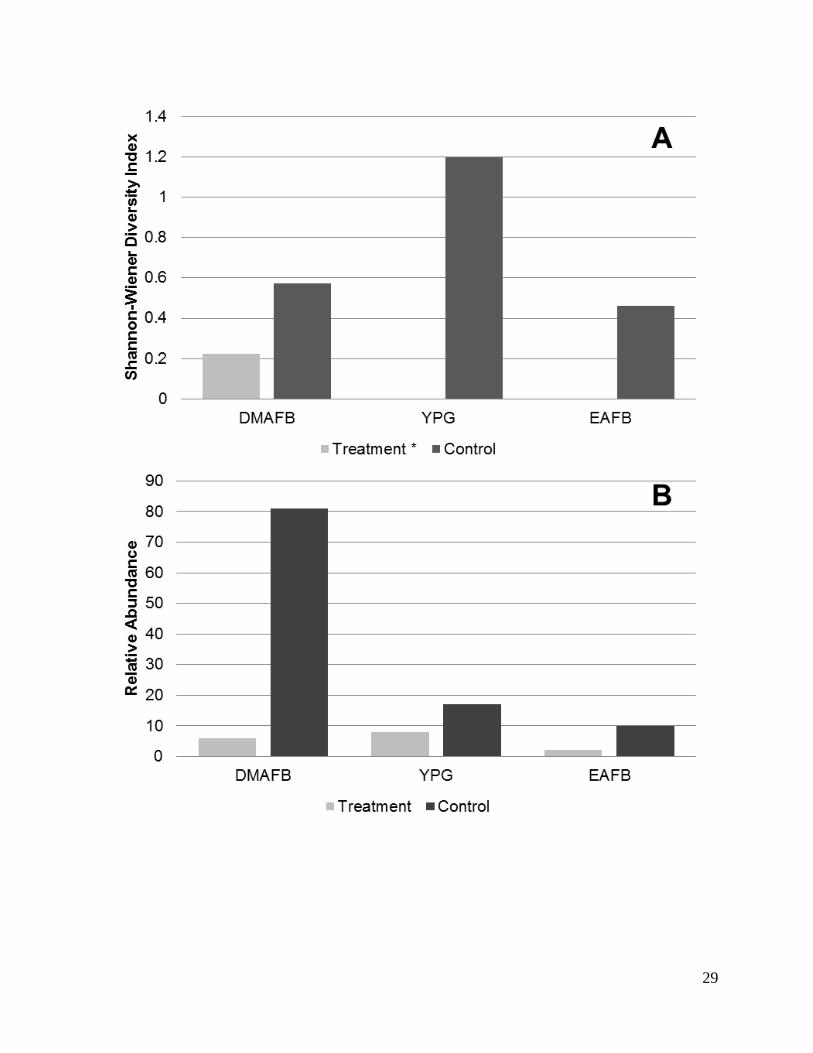
DMAFB had the highest diversity, while YPG had the highest abundance (Figures 3 and 4).
YPG reptile abundance consisted of a single species, Uta stansburiana. Our control sites
indicated the inverse with YPG having the greatest diversity and DMAFB having the highest
11
abundance of reptiles (Figure 3B). In all cases treatment sites resulted in lower metrics than
controls. Species richness was highest at intermediate distances for both small mammals (Table
2) and reptiles (Table 3). This is represented by Grids 2-4 for each solar array.
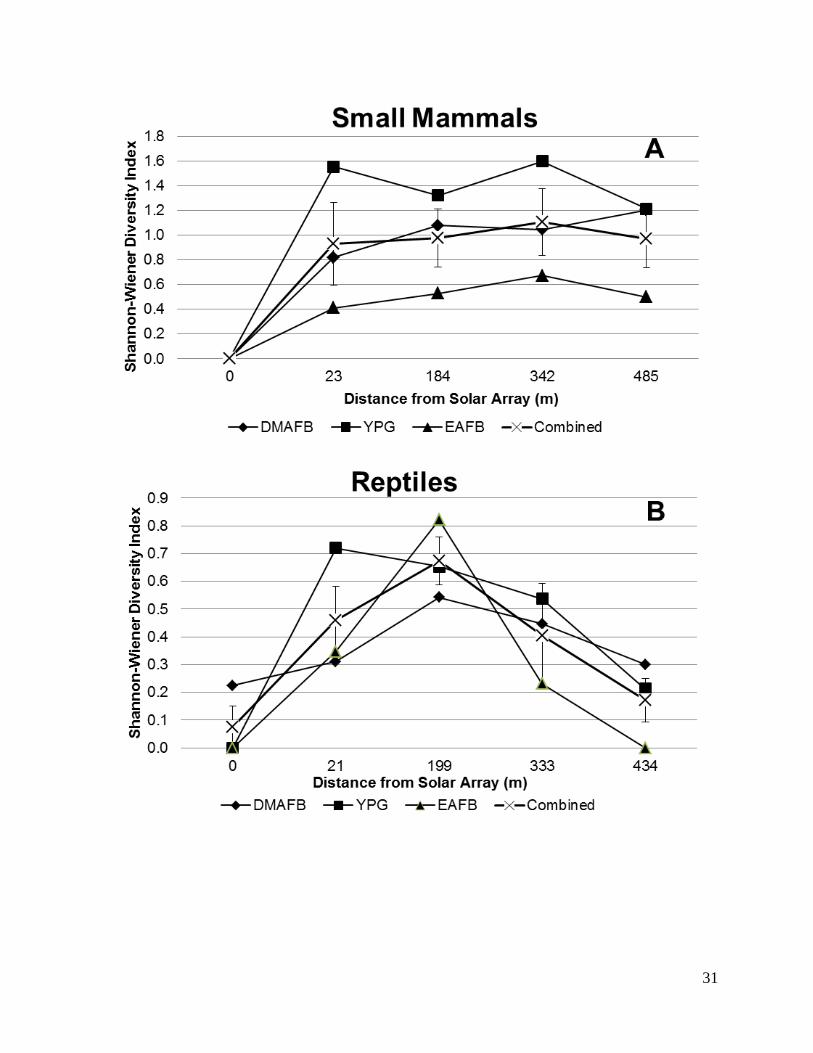
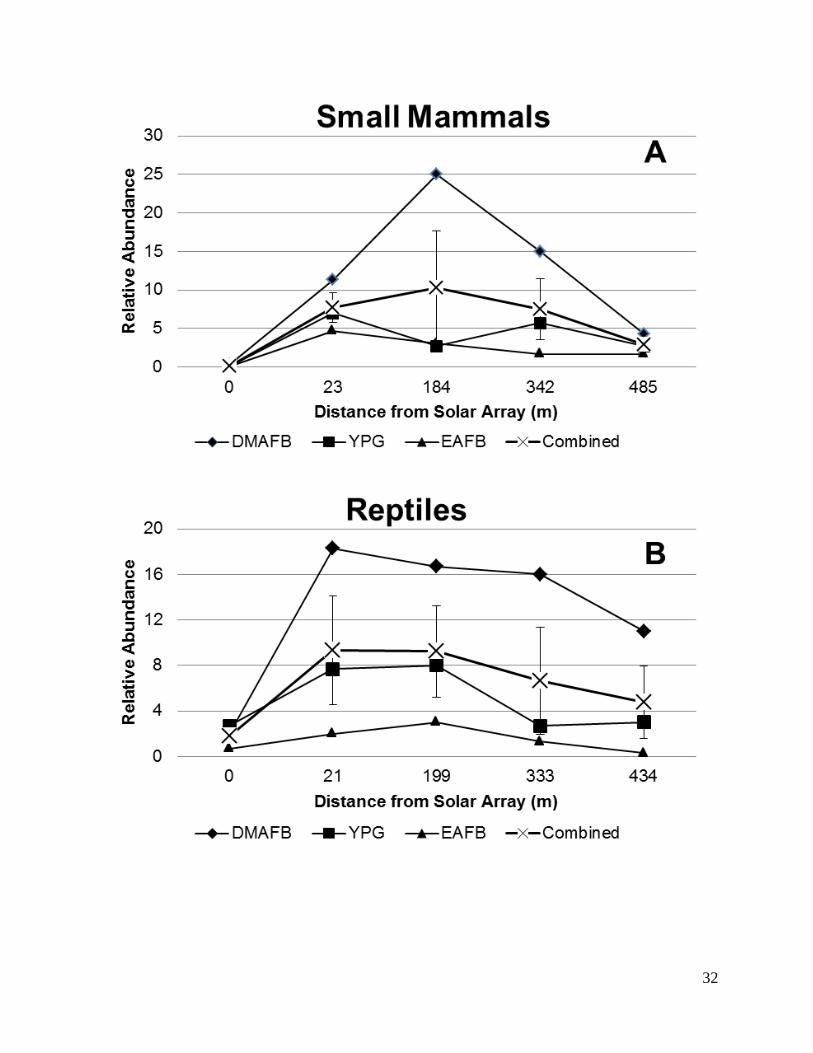
Diversity and relative abundance metrics varied at each trapping distance for both small
mammals and reptiles (Figures 5 and 6). Diversity of small mammals species using the Shannon-
Wiener Diversity Index resulted in indices of H = 1.21, 1.77, and 0.52 for DMAFB, YPG, and
EAFB respectively. Figure 5 displays the relationship between diversity and average distance
from the solar array. Relative abundance measurements also indicate that numbers are highest at
intermediate distances (Figure 6) with the highest recorded relative abundances at DMAFB and
lowest at EAFB.
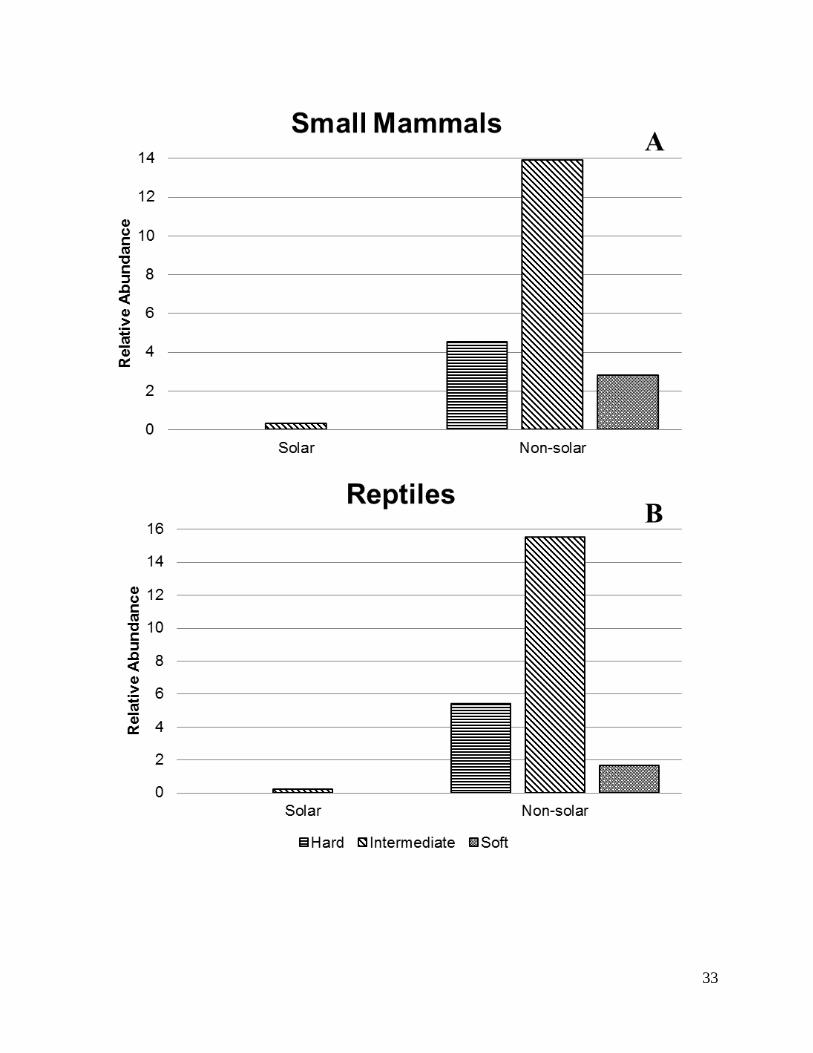
Our trapping efforts within the solar arrays resulted in a combined 17 captured
individuals including both small mammals and reptiles. Only the intermediate type of footprint
(DMAFB) captured any individuals within the solar array (Figure 7).
Discussion
This study was designed to quantify potential impacts solar energy development may have on
species at risk in desert landscapes. We used small mammal and reptile communities to estimate
the impact of three solar developments located on military lands. Our results suggest that the
wildlife communities within the solar facility developments were displaced almost completely as
hypothesized by Lovich and Ennen (2011) and Northrup and Wittemyer (2013). Our findings
indicate that communities of these two taxa disperse into the nearest available habitat around the
facility. We detected increased diversity and abundance in these taxa at 300-400m from the solar
array. These results suggest that the physical footprint regardless of intensity (Hard, Intermediate
12
or Soft) displaces the wildlife community completely. Our findings also indicate that the
displacement of the wildlife community results in a halo of increased diversity and abundance at
300-400m from the solar facility. These results can inform wildlife management decisions while
maintaining military missions. Developing highly disturbed areas for solar development may
cause the least impact to existing wildlife communities (Stoms et al. 2013) with minimal
displacement of existing animals. For this reason we encourage installations to assess existing
disturbed lands for solar development which will reduce displacement risk to both small
mammal and reptile communities.
We report on three different aspects of species composition; species richness, diversity
and abundance. We used these three aspects to evaluate the impact of solar development to
establish community assemblages of small mammals and reptiles. Our results concerning the
solar array versus our control sites indicate that solar development eliminates area as potential
habitat for small mammals and reptiles. Our findings also indicate that species richness, diversity
and abundance of these two taxa were negatively correlated with the presence of the solar array
(Figures 3-6). These findings also provide a baseline that can be used to compare richness,
diversity and species abundance across time (Bejder et al. 2006). Our extensive trapping efforts
detected so few individuals within the solar array that our species richness, diversity, and
abundance estimates were functionally zero. Given that these three solar arrays have been
established for several years (multiple species generations) enough time has passed to allow for
recolonization if the habitat was suitable, yet no recolonization has occurred. These findings
suggest that the development of these solar arrays lead to the loss of the site as wildlife habitat
and quantify similar to observations by Lovich and Ennen (2011).
13
Our results suggest that both small mammals and reptiles avoided these solar arrays. In
addition, species richness, diversity and abundance increased with distance from the solar array.
This pattern is similar to the response of these taxa to road development (Findlay and Houlahan
1997, Fahrig and Rytwinski 2009) and land conversion (Findlay and Houlahan 1997). While, this
pattern of response to development was observed by Lovich and Ennen (2011), other researchers
found no consistent response of small mammals to anthropogenic disturbance (Rosa and
Bissonette 2007). We found a consistent bell-shaped curve distribution across distance for
species richness, diversity, and abundance for all three solar energy facilities. The tails of this
curve occurred at the solar array and at the control. The peak of species richness, diversity and
abundance was observed at an intermediate distance (300 to 400m) from the solar array (Tables
2 and 3; Figures 3-6). This was likely due to displacement and subsequent dispersal of these two
taxa (Lidicker 1975) into the surrounding landscape. This halo of increased species richness,
diversity and abundance at 300 to 400m from the solar array suggests that disturbance from the
construction of the solar arrays may have altered the potential carrying capacity (Robbins 1973)
in the adjacent landscape.
Comparison of “soft” and “hard” footprint designs does not generally suggest
measureable differences. However, we conclude that in all cases species richness is ≤ to
surrounding species richness (Tables 2 and 3), but we do not suggest direct comparisons due to
the unique species composition at each facility. Figure 7 indicates that relative abundance is
nearly non-existent as compared to the surrounding landscape in all cases. This contradicts
previously held perceptions of “soft” footprint design and potential benefits for at risk species
such as the Mohave ground squirrel (Xerospermophilus mohavensis; Gatlin 2012). It is possible
that due to the construction of these solar arrays in these environments, the disturbance and
14
displacement impacts may be permanent regardless of the surface maintenance. There are
examples of small mammals avoiding areas of high soil compaction (Malizia et al. 1991; Ignacio
et al. 2007) likely due to high energy costs adversely affecting thermoregulation (Vleck 1991).
Considering that each of these sites was within either Sonoran or Mohave deserts, this may well
be the case in our different footprint types. This has been laboratory tested with some species
suggesting that high soil compaction results in little to no burrowing activity (Ducey et al. 1993).
This question of soil compaction should be explored further to assess potential mitigation
alternatives for this type of disturbance during the construction of solar arrays.
From this study we find that some general practices may be conducive to more effective
placement and maintenance of solar facilities in desert landscapes but may be relevant to any
landscape. Combined natural resource management in collaboration with successful
development, operation, and maintenance of renewable energy sources are paramount to
continued build-out and support of these renewable energy alternatives. It is important to note
that these suggestions are specific to photo-voltaic solar arrays and may not be applicable to
other types of solar energy generation technology such as concentrated solar power technology
or heliostat power plants (a.k.a. power towers).
New solar development should be focused on disturbed or recently disturbed landscapes.
Prioritizing solar development on disturbed lands will likely expedite the process by
reducing time associated with various compliance processes especially environmental by
reducing potential impact to species at risk.
Initial surveys should be conducted on a proposed solar development site to identify any
potential sensitive status species. This should include identifying features that may attract
or concentrate small mammals and/or reptiles.
15
If at risk species are identified during an initial survey, monitor the immediate and
adjacent areas (up to 400 m for the proposed solar development) to determine if any
mitigation measures are warranted.
A wildlife biologist should document any active burrows within the proposed solar
development. Attempts should be made to relocated any individuals within the proposed
solar development and relocate those individuals at least 400 m outside of the immediate
impact area immediately prior to construction to reduce collapsing active burrows on
existing wildlife. This will also reduce the level of dispersal into the adjacent landscape
thus reducing stress on already limited resources within desert landscapes.
As most solar arrays are typically fenced (chain-linked) for security purposes, we suggest
installing low to the ground openings (during construction) to allow wildlife to move
through the fence rather than digging under the fence. This can help maintain the
integrity of the fence for a longer duration.
Conclusions
We conclude that the development and operations of a solar array does not produce “edge” as
defined by Murcia (1995). However, the effect of this type of development on existing small
mammal and reptile communities has measurable impacts. This effect is primarily observed as
displacement (Lovich and Ennen 2011, Northrup and Wittemyer 2013) where the area physically
developed for the solar array is generally considered non-habitat or low-quality habitat for these
communities as measured by three metrics: species richness, species diversity, and relative
abundance. On open desert landscapes, the development of solar arrays will likely create islands
of non- or low-quality habitat increasing heterogeneity in the landscape. Furthermore, the
increase in abundance adjacent to solar arrays may unbalance the equilibrium of that habitat
16
beyond its carrying capacity. The results presented in the paper will need to be considered as
solar generation continues to scale up and solar arrays become more prominent on desert
landscapes.
Acknowledgments
This project was financially supported by the Department of Defense Legacy Resource through
the administration of project # 14-758. We would like to extend our appreciation to Chris Melisi,
Woodrow Crumbo, Emily Scobie, Eduardo Moreno, and Nathanial Foley for their invaluable
support with field survey efforts, construction, and installation of trapping grids associated with
this project. This manuscript has benefitted from the review and comments of our Department of
Defense partners Kevin Wakefield, Daniel Steward, and Thomas Rademacher for logistical
support, review and comments throughout this project. Finally, we would like to extend our
gratitude Timothy Wade, Renee Wilcox, Haley Nelson, and Pamela Kennedy for project
administration, development, and draft review.
References Cited
Anderson, D.R., K.P. Burnham, G.C. White and D.L. Otis. 1983. Density estimation of small
mammal populations using a trapping web and distance sampling methods. Ecology 64:
674-680.
Bejder, L., A. Samuels, H. Whitehead, N. Gales, J. Mann, R. Connor, M. Heithaus, J. Watson-
Capps, C. Flaherty, and M. Krützen. 2006. Decline in relative abundance of bottlenose
dolphins exposed to long-term disturbance. Conservation Biology 20: 1791-1798.
Blair, W. F. 1940. Notes on home ranges and populations of the short-tailed shrew. Ecology 21:
284-288.
17
Boellstorff, D. E. and D. H. Owings. 1995. Home range, population structure, and spatial
organization of California ground squirrels. Journal of Mammalogy 76: 551-561.
Booth, S., J. Barnett, K. Burman, J. Hambrick, and R. Westby. 2010. Net zero energy military
installations: a guide to assessment and planning. National Renewable Energy Laboratory
Technical Report NREL/TP-7A2-48876. August, 2010. pp. 55.
Bradley, W. G. 1967. Home range, activity patterns, and ecology of the antelope ground squirrel
in southern Nevada. The Southwestern Naturalist. 12: 231-251.
Braun, S. E. 1985. Home range and activity patterns of the giant kangaroo rat, Dipodomys
ingens. Journal of Mammalogy 66: 1-12.
Camp, R.J., R.L. Knight, H.A.L. Knight, M.W. Sherman, and J.Y. Kawashima. 1993. Food
habits of nesting common ravens in the eastern Mohave Desert. Southwestern Naturalist
38: 163-165.
Chase, M.K., W.B. Kristan III, A.J. Lynam, M.V. Price, and J.T. Rotenberry. 2000. Single
species as indicators of species richness and composition in California coastal sage scrub
birds and small mammals. Conservation Biology 14: 474-487.
Cranford, J. A. 1977. Home range and habitat utilization by Neotoma fuscipes as determined by
radiotelemetry. Journal of Mammalogy 58: 165-172.
Dale, V.H., L.A. Joyce, S. McNulty, R.P. Neilson, M.P. Ayres, M.D. Flannigan, P.J. Hanson,
L.C. Irland, A.E. Lugo, C.J. Peterson, D. Simberloff, F.J. Swanson, B.J. Stocks, and B.M.
Wotton. 2001. Climate change and forest disturbances. BioScience 51: 723-724.
Drabek, C. M. 1973. Home range and daily activity of the round-tailed ground squirrel,
Spermophilus tereticaudus neglectus. American Midland Naturalist 89: 287-293.
18
Duane, T.P., and S. McIntyre. 2011. Water, work, wildlife, and wilderness: the collaborative
federal public lands planning framework for utility-scale solar energy development in the
desert Southwest. Environmental Law, 41: 1093.
Ducey, P.L., D.R. Formanowicz, Jr., L. Boyet, J. Mailloux, and R.A. Nussbaum. 1993.
Experimental examination of burrowing behavior in Caecilians (Amphibia:
Gymnophiona): effects of soil compaction on burrowing ability of four species.
Herpetologica 49: 450-457.
Duda, J.J., A.J. Krzysik, and J.E. Freilich. 1999. Effects of drought on desert tortoise movement
and activity. Journal of Wildlife Management 63: 1181-1192.
Edwards Air Force Base (EAFB). 2014. Drought puts Edwards pets at risk from predators.
published online 27 January 2014, http://www.edwards.af.mil/News/Article-
Display/Article/829308/drought-puts-edwards-pets-at-risk-from-predators accessed 11
November 2016.
Edwards Air Force Base (EAFB). 2015. Drought puts Edwards pets at risk from predators.
published online 28 April 2015, http://www.edwards.af.mil/News/Article-
Display/Article/828793/drought-puts-edwards-pets-at-risk-from-predators accessed 11
November 2016.
Ehrlich, P.R., D.D. Murphy, M.C. Singer, C.B. Sherwood, R.R. White, and I.L. Brown. 1980.
Extinction, reduction, stability and increase: the responses of checkerspot butterfly
(Euphydryas) populations to the California drought. Oecologia 46: 101-105.
Fahrig, L. and T. Rytwinski. 2009. Effects of roads on animal abundance: an empirical review
and synthesis. Ecology and Society, 14: 21
19
Findlay, C.S. and J. Houlahan. 1997. Anthropogenic correlates of species richness in
southeastern Ontario wetlands. Conservation Biology 11: 1000-1009.
Gatlin, A. 2012. Edwards solar plant could set project standards. Strata Equity Group: Real
Estate Investments. Published online 15 August 2012,
http://www.strataequity.com/edwards-solar-plant-could-set-project-standards.html
accessed 12 November 2016.
Gill, A.B. 2005. Offshore renewable energy: ecological implications of generating electricity in
the coastal zone. Journal of Applied Ecology 42: 605–615.
Gwinn, N.R., G.H. Palmer, and J.L. Koprowski. 2011. Sigmodon arizonae (Rodentia:
Cricetidae). Mammalian Species 43: 149-154.
Hawes, M. L. 1977. Home range, territoriality, and ecological separation in sympatric shrews,
Sorex vagrans and Sorex obscurus. Journal of Mammalogy 58: 354-367.
Herbst, C. and P. Kumazawa. 2013. Two-year drought raises risk of predators attacking pets.
published online 28 May 2013 http://www.edwards.af.mil/News/Article-
Display/Article/393991/two-year-drought-raises-risk-of-predators-attacking-pets
accessed 11 November 2016.
Ignacio, T., M. Díaz, J. Martíniz-Padilla, R. Bonal, J. Viñuela, and J. Fargallo. 2007. Cattle
grazing, raptor abundance and small mammal communities in Mediterranean grasslands.
Basic and Applied Ecology 8: 565-575.
Kenagy, G. J. 1973. Daily and seasonal patterns of activity and energetics in a Heteromyid
rodent community. Ecology 54: 1201-1219.
20
Kessler, M., S.K. Herzog, J. Fjeldsa, and K. Bach. 2001. Species richness and endemism of plant
and bird communities along two gradients of elevation, humidity, and land use in the
Bolivian Andes. Diversity and Distribution 7: 61-77.
Kollars, T. M. Jr. 1995. Home ranges and population densities of shrews (Soricidae) inhabiting a
spruce plantation in Bavaria, Germany. Acta Theriologica 40: 219-222.
Kuvlesky, W.P., L.A. Brennan, M.L. Morrison, K.K. Boydston, B.M. Ballard, and F.C.Bryant.
2007. Wind energy development and wildlife conservation: challenges and opportunities.
Journal of Wildlife Management 71: 2487-2498.
Lidicker, W.Z. 1975. The role of dispersal in the demography of small mammals. In: Small
Mammals: Their Productivity and Population Dynamics. pp. 103-128. Edited by F.B.
Golley, K. Petrusewicz and L. Ryszkowski. Cambridge University Press, Cambridge.
Lovich JE, and D. Bainbridge. 1999. Anthropogenic degradation of the southern California
desert ecosystem and prospects for natural recovery and restoration. Environmental
Management 24: 309–326.
Lovich, J.E., and J.R. Ennen. 2011. Wildlife conservation and solar energy development in the
desert southwest, United States. BioScience, 61: 982-992.
Lynch, M. F., A. L. Fesnock and D. VanVuren. 1994. Home range and social structure of the
dusky-footed woodrat (Neotoma fuscipes). Northwestern Naturalist 75: 73-75.
MAGURRAN, A.E. 2004. Measuring biological diversity. Blackwell Science, Malden
Massasschusetts.
Malizia, A.I., A.I. VAssallo, and C. Busch. 1991. Population and habitat characteristics of two
sympatric species of Ctenomys (Rodentia: Octodontidae). Acta Theriologica 36: 87-94.
21
Maza, B. G., N. R. French and A. P. Aschwanden. 1973. Home range dynamics in a population
of Heteromyid rodents. Journal of Mammalogy 54: 405-425.
Mittermeier, R., C.G. Mittermeier, G.P. Robles, G. Fonseca, T. Brooks, J. Pilgrim, W.R.
Konstant. eds. 2002. Wilderness: Earth’s Last Wild Places. Conservation International.
Murcia, M. 1995. Edge effects in fragmented forests: implications for conservation. Trends in
Ecology and Evolution 10: 58-62.
Northrup, J.M., and G. Wittemyer. 2013. Characterising the impacts of emerging energy
development on wildlife, with an eye towards mitigation. Ecology Letters, 16: 112-125.
Ortega, J. C. 1990. Home-range size of adult rock squirrels (Spermophilus variegatus) in
southeastern Arizona. Journal of Mammalogy. 71: 171-176.
Pearce, J. and L. Venier. 2005. Small mammals as bioindicators of sustainable boreal forest
management. Forest Ecology and Management 208: 153-175.
Randall, J.M., S.S. Parker, J. Moore, B. Cohen, L. Crane, B. Christian, D. Cameron, J.B.
MacKenzie, K. Klausmeyer, S. Morrison. 2010. Mojave Desert Ecoregional Assessment.
unpublished report, The Nature Conservancy. (11 November 2016;
http://www.clarkcountynv.gov/airquality/dcp/Documents/Library/other%20reports/collab
/Mojave%20Desert%20Ecoregional%20Assessment%202010.pdf)
Ribble, D. O., A. E. Wurtz, E. K. McConnell, J. J. Buegge and K. C. Welch Jr. 2002. A
comparison of home ranges of two species of Peromyscus using trapping and
radiotelemetry data. Journal of Mammalogy 83: 260-266.
Robbins, C.T. 1973. The biological basis for the determination of carrying capacity. PhD Thesis,
Cornell University, Ithaca, New York. pp. 239.
22
Schroder, G. D. 1979. Foraging behavior and home range utilization of the bannertail kangaroo
rat (Dipodomys spectabillis). Ecology 60: 657-665.
Shurtliff, Q. R., D. E. Pearse and d. S. Rogers. 2005. Parentage analysis of the canyon mouse
(Peromyscus crinitus): Evidence for multiple paternity. Journal of Mammalogy 86: 531-
540.
Spellerberg, I.F. and P.J. Fedor. 2003. A tribute to Claude Shannon (1916-2001) and a plea for
more rigorous use of species richness, species diversity and the ‘Shannon-Wiener’ index.
Global Ecology and Biogeography 12(3): 177-179.
Thompson, S. D. 1982. Spatial utilization and foraging behavior of the desert woodrat, Neotoma
lepida lepida. Journal of Mammalogy. 63: 570-581.
Thompson, G.G. and S.A. Thompson. 2005. Mammals or reptiles, as surveyed by pit-traps, as
bioindicators of rehabilitation success for mine sites in the goldfields region in western
Australia? Pacific Conservation Biology 11: 268-286.
Dice, L. R. 1938. Some census methods for mammals. Journal of Wildlife Management 2: 433-
446.
Pearson, D. E. and L. F. Ruggiero. 2003. Transect versus grid trapping arrangements for
sampling small mammal communities. Wildlife Society Bulletin 31: 454-459.
Pelikan, J., G. Zejda and V. Holisova. 1964. On the question of investigating small mammals by
the quadrat method. Acta Theriologica 9:1-23.
Read, V.T., K.W. J. Malafant and K. Myers. 1988. A comparison of grid and index-line trapping
methods for small mammal surveys. Australian Wildlife Research 15: 673-687.
Rosa, Silvia, and John Bissonette. 2007. “Roads and Desert Small Mammal Communities:
Positive Interaction?” In Proceedings of the 2007 International Conference on Ecology
23
and Transportation, edited by C. Leroy Irwin, Debra Nelson, and K.P. McDermott.
Raleigh, NC: Center for Transportation and the Environment, North Carolina State
University, pp. 562-566.
Shannon, C.E. and W. Weaver. 1949. The mathematical theory of communication. University of
Illinois Press, Urbana.
Southern, H. L. 1973. A yardstick for measuring population of small rodents. Mammal Review
3: 1-10.
Stahler, D., B. Heinrich, and D. Smith. 2002. Common ravens, Corvus corax, preferentially
associate with grey wolves, Canis lupus, as a foraging strategy in winter. Animal
Behaviour 64: 283-290.
Stoms, D.M., S.L. Dashiell, and F.W. Davis. 2013. Siting solar energy development to minimize
biological impacts. Renewable Energy, 57: 289-298.
Turney, D. and V. Fthenakis. 2011. Environmental impacts from the installation and operation of
large-scale solar power plants. Renewable and Sustainable Energy Reviews 15: 3261-
3270.
Vleck, D. 1991. The energy cost of borrowing by the pocket gopher Thomomys bottae.
Physiology Zoology 52: 122-136.
24
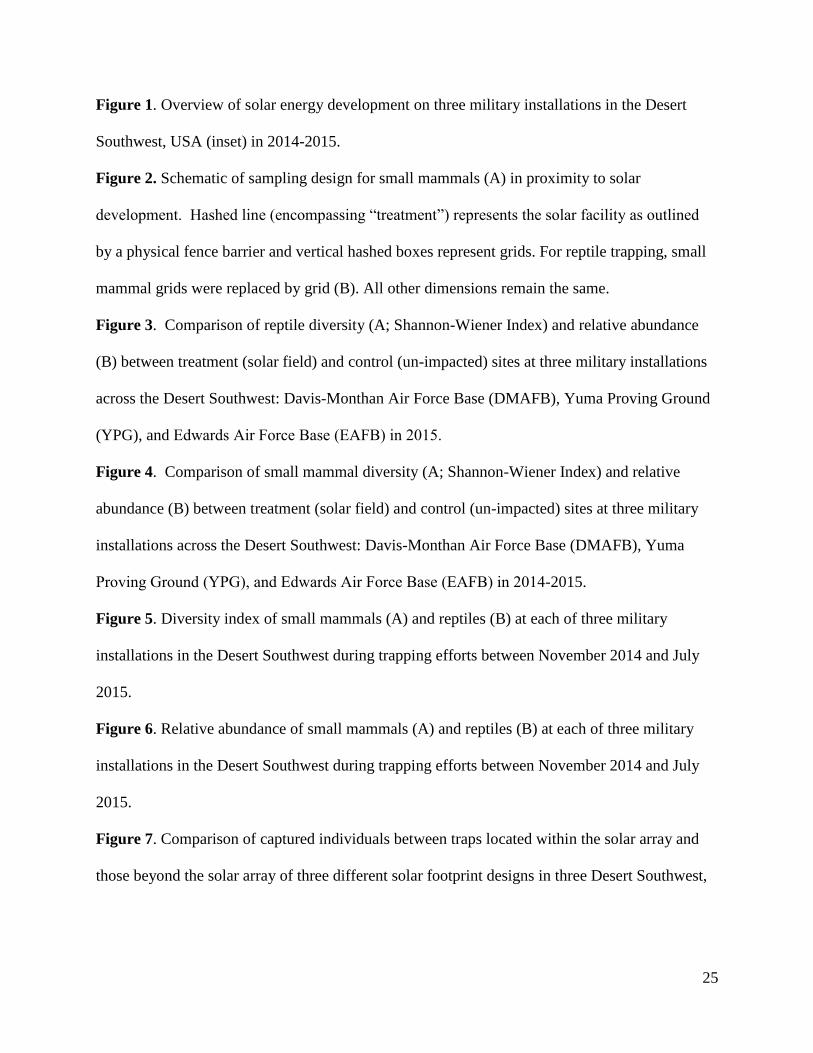
Figure 1. Overview of solar energy development on three military installations in the Desert
Southwest, USA (inset) in 2014-2015.
Figure 2. Schematic of sampling design for small mammals (A) in proximity to solar
development. Hashed line (encompassing “treatment”) represents the solar facility as outlined
by a physical fence barrier and vertical hashed boxes represent grids. For reptile trapping, small
mammal grids were replaced by grid (B). All other dimensions remain the same.
Figure 3. Comparison of reptile diversity (A; Shannon-Wiener Index) and relative abundance
(B) between treatment (solar field) and control (un-impacted) sites at three military installations
across the Desert Southwest: Davis-Monthan Air Force Base (DMAFB), Yuma Proving Ground
(YPG), and Edwards Air Force Base (EAFB) in 2015.
Figure 4. Comparison of small mammal diversity (A; Shannon-Wiener Index) and relative
abundance (B) between treatment (solar field) and control (un-impacted) sites at three military
installations across the Desert Southwest: Davis-Monthan Air Force Base (DMAFB), Yuma
Proving Ground (YPG), and Edwards Air Force Base (EAFB) in 2014-2015.
Figure 5. Diversity index of small mammals (A) and reptiles (B) at each of three military
installations in the Desert Southwest during trapping efforts between November 2014 and July
2015.
Figure 6. Relative abundance of small mammals (A) and reptiles (B) at each of three military
installations in the Desert Southwest during trapping efforts between November 2014 and July
2015.
Figure 7. Comparison of captured individuals between traps located within the solar array and
those beyond the solar array of three different solar footprint designs in three Desert Southwest,
25

2014-2015. Relative abundance was measured as the average number of individuals captured per
footprint type.
26
Edwards AFB
■ California
[:/ ] Arizona Sonoran Desert
~ Colorado Sonoran Desert
~ Mojave Desert
- Solar_Boundaries
0 70 140 210
Kilometers
N
+
Utah
. . . . . . . . . . . . . . . . . . . . . . . . . . . . . . . . . . .
. . . . . . . . . . . . . . . . . . . . . . . . . . . . . . . . . . . . . . . . ....... .. . .. .. ..... . ..
. . - . . . . . . . . . . . . . . . . . . . . . . . . . . . . . . . . . . . . . . . . . . . . . . . . . . . . . . . . . . . . . ..... .. .. .. .. . .... . .. . . . . . . . . . . . . . . . . . . . . . . ·· ·· ·· · ·•···•····•· ... . . - . . . . . . . . . . . . . . . . . . . . . . . . . . . . . . . . . . . . . . .
ti~'.;,ii~Mdtiti\~n . '· ....... ..... .. .. ...... .... . . . . . . . . . . . . .
27
Solar facility physical footprint
I- - - - - - - - - - - - -1
Super Transect A : Treatment ['-,,, ill] : Super Transect B
[III] [III] [III] [III] i [[I]/ .... G,;a, ilIIf-iIIIJ--rnn- {II] < 40m> L_ __j "d ~ : : Grid2 Grid3 Grid4 Gn 5
~ Edge L ____________ _ 1
Control *Not shown to scale
D Box Trap
-- Drift Fence Grid Boundary
C
B
A
40m -----------------------------------------------------➔
□ ----------
□□
❖ I I I
I : I
I I I I I
I : I
□ l] ! g I :3 I I
2Qm I : ------------- ,:o, I !
_________ oo_ ________ _ bi '+'
B
28
)( A Q) "C 1.2 .s >, ~ 1 1/) ... Q)
> i5 0.8 ... Q) C: a, 0.6
~ § 0.4 C: C: 1 0.2 (/)
0 DMAFB YPG EAFB
• Treatment* • Control
1.4
29
90 B
80
a, 70 CJ
~ 60 "C
§ 50 .c "; 40 > i 30 a> o::: 20
10
0 DMAFB YPG EAFB
■ Treatment ■ Control
>< A Q)
"g 1.2 >, :: 1 Ill ... Q)
> i5 0.8 ... Q)
i 0.6
~ § 0.4 C: C: 1 0.2 (/)
0 DMAFB YPG EAFB
■Treatment* ■ Control
1.4
30
70
60 B Q)
~ 50 (U
"C § 40 .c <C GI 30 > ;
: 20 c:::
10
0 DMAFB YPG EAFB
■ Treatment ■ Control
>< Q) ,:, 1.6 C: ;. 1.4 --~ 1.2 > i5 1.0
~ 0.8
i 0.6 C: 0.4 0 2 0.2 (G
~ 0.0
Small Mammals
Distance from Solar Array (m)
~DMAFB -a-YPG ...,._EAFB - X-Combined
1.8
0.9 >< ,8 0.8 C:
~0.7 'in t 0.6 > i5 0.5 'Q)
i 0.4
~ 0.3 C: g 0.2 C: 10.1 (/')
0.0
Reptiles
0 21 199 333 434 Distance from Solar Array (m)
~ DMAFB -a-YPG .....,_ EAFB - x -Combined
31
a, 25 CJ C:
_g 20 C: :::,
~ 15 Q)
.2: 10 1o ai 0::: 5
0
Small Mammals
23 184 342
Distance from Solar Array (m)
-+-DMAFB ---YPG ......,_EAFB - x-Combined
A
485
30
32
20
~ 16 C: (G
"C c: 12 :::, .c <C Q) 8 > i ai 4 0:::
0
Reptiles
...
0 21 199 333
Distance from Solar Array (m)
-+-DMAFB ---YPG ......,_EAFB - x-Combined
B
434
Small Mammals A
12
Q)
CJ 10 C: (0 ,, C: 8 :::, .0 <( Q)
> 6
i ai 4 0:::
2
0 Solar Non-solar
14
Reptiles
33
B 16
14
~ 12 C: (0 ,, 10 C: :::, .0 8 <( Q)
> 6 i ai 4 0:::
2
0 Solar Non-solar
El Hard ISl lntermediate IISoft
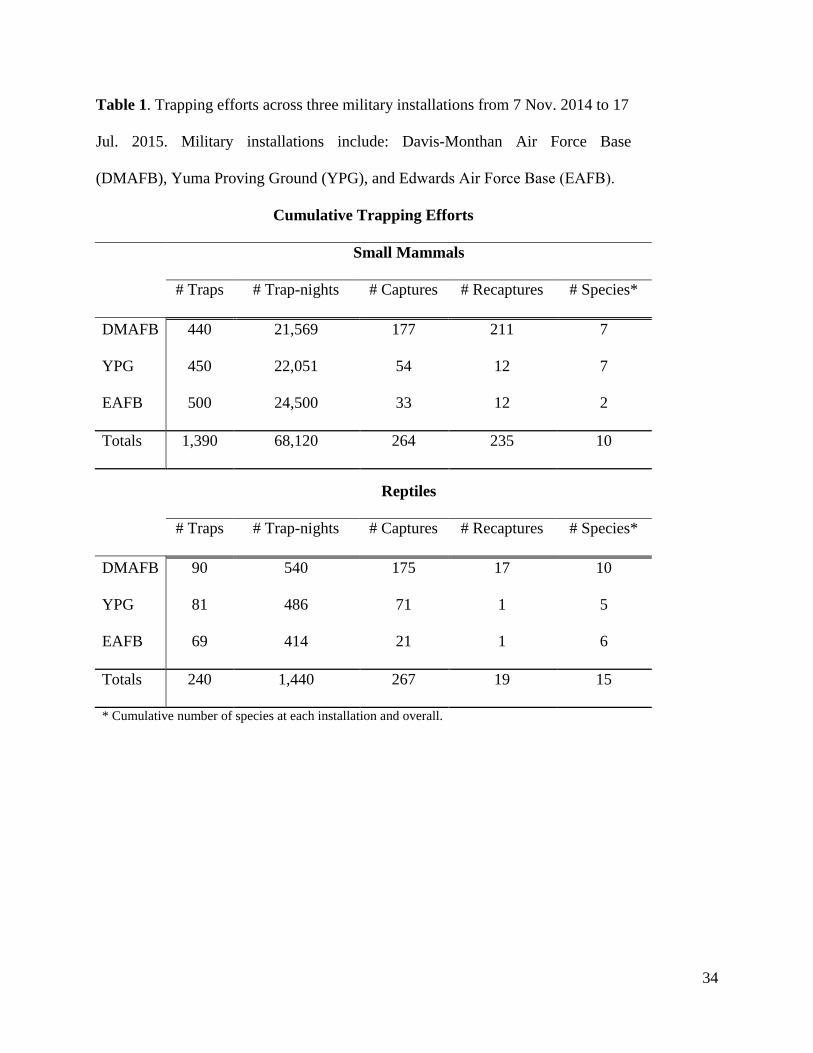
Table 1. Trapping efforts across three military installations from 7 Nov. 2014 to 17
Jul. 2015. Military installations include: Davis-Monthan Air Force Base
(DMAFB), Yuma Proving Ground (YPG), and Edwards Air Force Base (EAFB).
Cumulative Trapping Efforts
Small Mammals
# Traps # Trap-nights # Captures # Recaptures # Species*
DMAFB 440 21,569 177 211 7
YPG 450 22,051 54 12 7
EAFB 500 24,500 33 12 2
Totals 1,390 68,120 264 235 10
Reptiles
# Traps # Trap-nights # Captures # Recaptures # Species*
DMAFB 90 540 175 17 10
YPG 81 486 71 1 5
EAFB 69 414 21 1 6
Totals 240 1,440 267 19 15
* Cumulative number of species at each installation and overall.
34
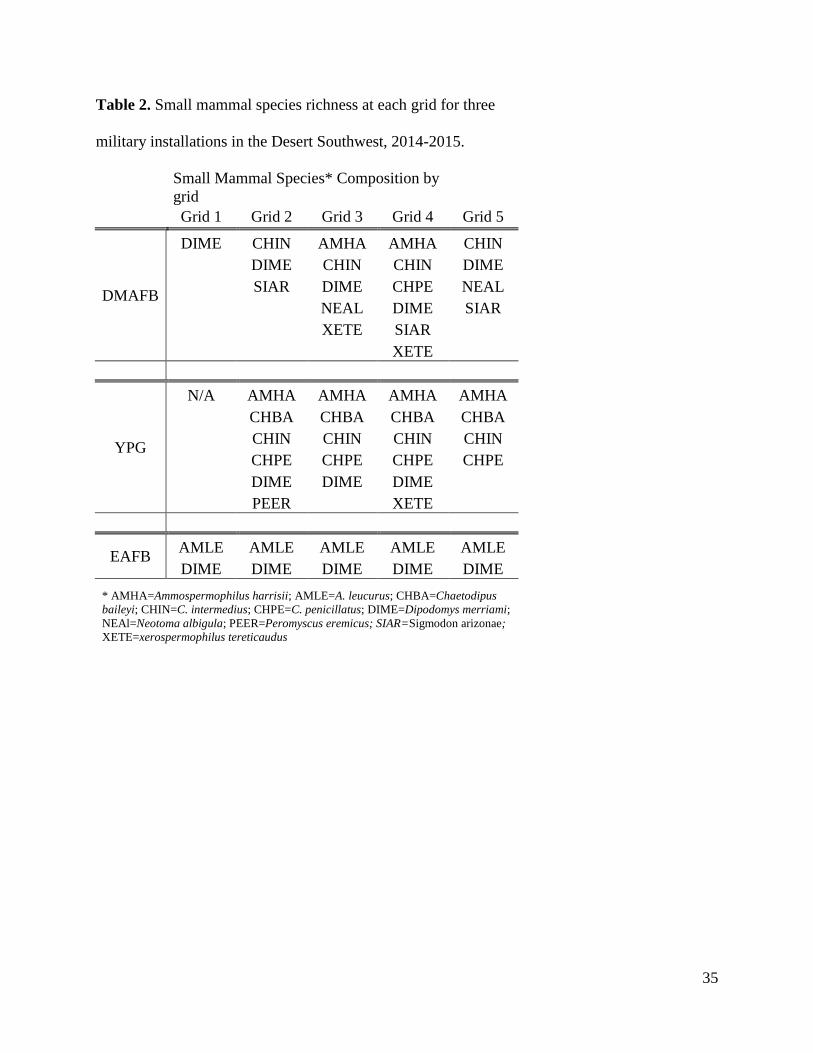
Table 2. Small mammal species richness at each grid for three
military installations in the Desert Southwest, 2014-2015.
Small Mammal Species* Composition by
grid
Grid 1 Grid 2 Grid 3 Grid 4 Grid 5
DMAFB
DIME
CHIN
DIME
SIAR
AMHA
CHIN
DIME
NEAL
XETE
AMHA
CHIN
CHPE
DIME
SIAR
XETE
CHIN
DIME
NEAL
SIAR
YPG
N/A
AMHA
CHBA
CHIN
CHPE
DIME
PEER
AMHA
CHBA
CHIN
CHPE
DIME
AMHA
CHBA
CHIN
CHPE
DIME
XETE
AMHA
CHBA
CHIN
CHPE
EAFB AMLE
DIME
AMLE
DIME
AMLE
DIME
AMLE
DIME
AMLE
DIME
* AMHA=Ammospermophilus harrisii; AMLE=A. leucurus; CHBA=Chaetodipus
baileyi; CHIN=C. intermedius; CHPE=C. penicillatus; DIME=Dipodomys merriami;
NEAl=Neotoma albigula; PEER=Peromyscus eremicus; SIAR=Sigmodon arizonae;
XETE=xerospermophilus tereticaudus
35
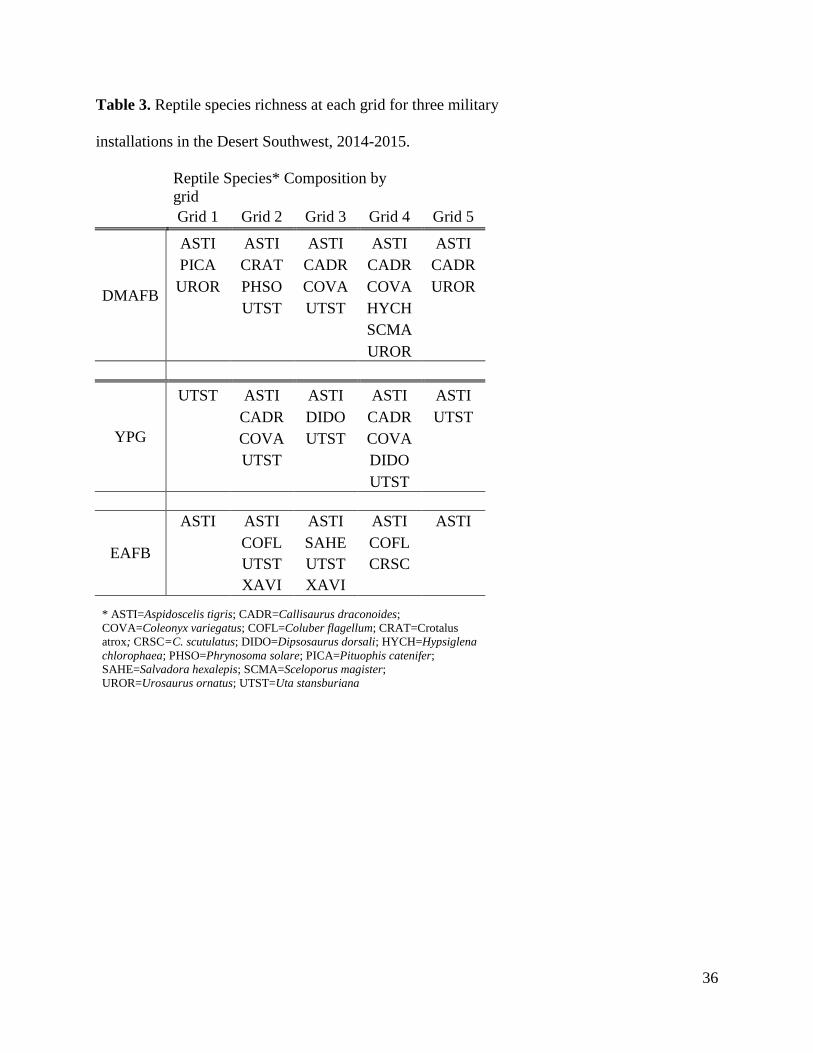
Table 3. Reptile species richness at each grid for three military
installations in the Desert Southwest, 2014-2015.
Reptile Species* Composition by
grid
Grid 1 Grid 2 Grid 3 Grid 4 Grid 5
ASTI ASTI ASTI ASTI ASTI
PICA CRAT CADR CADR CADR
DMAFB UROR PHSO
UTST
COVA
UTST
COVA
HYCH
UROR
SCMA
UROR
UTST ASTI ASTI ASTI ASTI
YPG
CADR
COVA
DIDO
UTST
CADR
COVA
UTST
UTST DIDO
UTST
ASTI ASTI ASTI ASTI ASTI
EAFB
COFL
UTST
XAVI
SAHE
UTST
XAVI
COFL
CRSC
* ASTI=Aspidoscelis tigris; CADR=Callisaurus draconoides;
COVA=Coleonyx variegatus; COFL=Coluber flagellum; CRAT=Crotalus
atrox; CRSC=C. scutulatus; DIDO=Dipsosaurus dorsali; HYCH=Hypsiglena
chlorophaea; PHSO=Phrynosoma solare; PICA=Pituophis catenifer;
SAHE=Salvadora hexalepis; SCMA=Sceloporus magister;
UROR=Urosaurus ornatus; UTST=Uta stansburiana
36