Embed Size (px)
Citation preview
METRIC
MIL-STD-469B24 June 1996 SUPERSEDING MIL-STD-469A 2 December 1991
DEPARTMENT OF DEFENSEINTERFACE STANDARD FOR
RADAR ENGINEERING INTERFACE REQUIREMENTS,ELECTROMAGNETIC COMPATIBILITY
METRIC
AMSC N7193 AREA EMCS
MIL-STD-469B
ii
FOREWORD
1. This military standard is approved for use by all departments and agencies of the Department ofDefense.
2. This standard covers the interface r equirements necessary to ensure control of the electromagneticemission and susceptibility characteristics of military radar equipment and systems operating in all intendedelectromagnetic environments (EMEs). The engineering interface cha racteristics set forth in this documentare considered necessary for electromagnetic (EM) spectrum conservation and electromagneti ccompatibility (EMC).
3. The expanding application of radar for various military functions and purposes places increase ddemands upon the occupancy of the electromagnetic spectrum. Control of the electromagnetic emissionand susceptibility characteristics of radar equipment and syst ems is essential for conserving the limited EMspectrum that is available.
4. The interface requirements stated herein are not intended to prohibit or inhibit the free an dunrestricted research in the development of new radar systems which promise an increase in effectiveness.The minimum interface requirements given herein satisfy the Radar Spectrum E ngineering Criteria; Section5.3 in the National Telecommunications and Information Administration (NTIA) Manual of Regulationsand Procedures for Federal Radio Frequency Management. The NTIA standards are approved for use byagencies and establishments of the Federal Government and constitute the minimum acceptable standardsfor electromagnetic spectrum management. Interface requireme nts more stringent than the NTIA standardsare provided herein for radar equipment and systems that operate in critical EMEs. When these situationsexist, the intent of the requirements shall be applied with best engineering judgement and with the approvalof the contracting activity.
5. Beneficial comments (recommendations, additions, deletions) and any pertinent data which maybe of use in improving this document should be addressed to: Commander, Naval Sea Systems Command,SEA 03R42, 2531 Jefferson Davis Highway, Arlington, VA 22242-5160 by using the self-addresse dStandardization Document Improvement Proposal (DD Form 1426) appearing at the end of this documentor by letter.
MIL-STD-469B
iii
CONTENTS
PARAGRAPH PAGE
1. SCOPE . . . . . . . . . . . . . . . . . . . . . . . . . . . . . . . . . . . . . . . . . . . . . . . . . . . . . . . . . . 11.1 Scope . . . . . . . . . . . . . . . . . . . . . . . . . . . . . . . . . . . . . . . . . . . . . . . . . . . . . . . . . . . 11.2 Application . . . . . . . . . . . . . . . . . . . . . . . . . . . . . . . . . . . . . . . . . . . . . . . . . . . . . . . 1
2. APPLICABLE DOCUMENTS . . . . . . . . . . . . . . . . . . . . . . . . . . . . . . . . . . . . . . . . 12.1 General . . . . . . . . . . . . . . . . . . . . . . . . . . . . . . . . . . . . . . . . . . . . . . . . . . . . . . . . . . 12.2 Government documents . . . . . . . . . . . . . . . . . . . . . . . . . . . . . . . . . . . . . . . . . . . . . . 12.2.1 Specifications, standards, and handbooks . . . . . . . . . . . . . . . . . . . . . . . . . . . . . . . . . 12.3 Non-government publications . . . . . . . . . . . . . . . . . . . . . . . . . . . . . . . . . . . . . . . . . 22.4 Order of precedence . . . . . . . . . . . . . . . . . . . . . . . . . . . . . . . . . . . . . . . . . . . . . . . . . 2
3. DEFINITIONS . . . . . . . . . . . . . . . . . . . . . . . . . . . . . . . . . . . . . . . . . . . . . . . . . . . . 23.1 Definitions . . . . . . . . . . . . . . . . . . . . . . . . . . . . . . . . . . . . . . . . . . . . . . . . . . . . . . . . 23.1.1 Active spaceborne sensor . . . . . . . . . . . . . . . . . . . . . . . . . . . . . . . . . . . . . . . . . . . . 23.1.2 Circular aperture array . . . . . . . . . . . . . . . . . . . . . . . . . . . . . . . . . . . . . . . . . . . . . . . 23.1.3 Planar phased array radar . . . . . . . . . . . . . . . . . . . . . . . . . . . . . . . . . . . . . . . . . . . . . 23.1.4 Plane of reference . . . . . . . . . . . . . . . . . . . . . . . . . . . . . . . . . . . . . . . . . . . . . . . . . . . 23.1.5 Primary radar . . . . . . . . . . . . . . . . . . . . . . . . . . . . . . . . . . . . . . . . . . . . . . . . . . . . . . 23.1.6 Receiver . . . . . . . . . . . . . . . . . . . . . . . . . . . . . . . . . . . . . . . . . . . . . . . . . . . . . . . . . . 23.1.7 Rectangular aperture array . . . . . . . . . . . . . . . . . . . . . . . . . . . . . . . . . . . . . . . . . . . . 33.1.8 Selectivity . . . . . . . . . . . . . . . . . . . . . . . . . . . . . . . . . . . . . . . . . . . . . . . . . . . . . . . . 33.1.9 Sensitivity . . . . . . . . . . . . . . . . . . . . . . . . . . . . . . . . . . . . . . . . . . . . . . . . . . . . . . . . 33.1.10 Signal processor . . . . . . . . . . . . . . . . . . . . . . . . . . . . . . . . . . . . . . . . . . . . . . . . . . . 33.1.11 Signal substitution . . . . . . . . . . . . . . . . . . . . . . . . . . . . . . . . . . . . . . . . . . . . . . . . . . 33.1.12 Spacebased radiolocation system, class 1 . . . . . . . . . . . . . . . . . . . . . . . . . . . . . . . . 33.1.13 Spacebased radiolocation system, class 2 . . . . . . . . . . . . . . . . . . . . . . . . . . . . . . . . 33.1.14 Spurious emission, inband . . . . . . . . . . . . . . . . . . . . . . . . . . . . . . . . . . . . . . . . . . . . . 33.1.15 Standard response . . . . . . . . . . . . . . . . . . . . . . . . . . . . . . . . . . . . . . . . . . . . . . . . . . . 33.1.16 Standard test frequencies . . . . . . . . . . . . . . . . . . . . . . . . . . . . . . . . . . . . . . . . . . . . . . 33.1.17 Transmitter . . . . . . . . . . . . . . . . . . . . . . . . . . . . . . . . . . . . . . . . . . . . . . . . . . . . . . . . 33.1.18 Tunability . . . . . . . . . . . . . . . . . . . . . . . . . . . . . . . . . . . . . . . . . . . . . . . . . . . . . . . . . . 33.2 Acronyms . . . . . . . . . . . . . . . . . . . . . . . . . . . . . . . . . . . . . . . . . . . . . . . . . . . . . . . . . 43.3 Symbols . . . . . . . . . . . . . . . . . . . . . . . . . . . . . . . . . . . . . . . . . . . . . . . . . . . . . . . . . . 5
4. GENERAL REQUIREMENTS . . . . . . . . . . . . . . . . . . . . . . . . . . . . . . . . . . . . . . . . 84.1 Radar equipment and subsystems . . . . . . . . . . . . . . . . . . . . . . . . . . . . . . . . . . . . . . . 84.1.1 Joint acquisitions . . . . . . . . . . . . . . . . . . . . . . . . . . . . . . . . . . . . . . . . . . . . . . . . . . . 94.1.2 North Atlantic Treaty Organization (NATO) acquisitions . . . . . . . . . . . . . . . . . . . . 94.1.3 Self-compatibility . . . . . . . . . . . . . . . . . . . . . . . . . . . . . . . . . . . . . . . . . . . . . . . . . . . 94.1.4 Radar spectrum management (RSM) . . . . . . . . . . . . . . . . . . . . . . . . . . . . . . . . . . . . . 94.1.5 Radar spectrum management (RSM) test plan . . . . . . . . . . . . . . . . . . . . . . . . . . . . . 94.1.6 Test procedures . . . . . . . . . . . . . . . . . . . . . . . . . . . . . . . . . . . . . . . . . . . . . . . . . . . . 94.2 Tailoring of this standard . . . . . . . . . . . . . . . . . . . . . . . . . . . . . . . . . . . . . . . . . . . . . . 9
MIL-STD-469B
iv
CONTENTS
PARAGRAPH PAGE
5. DETAILED REQUIREMENTS . . . . . . . . . . . . . . . . . . . . . . . . . . . . . . . . . . . . . . . 105.1 Scope . . . . . . . . . . . . . . . . . . . . . . . . . . . . . . . . . . . . . . . . . . . . . . . . . . . . . . . . . . . . 105.2 Application . . . . . . . . . . . . . . . . . . . . . . . . . . . . . . . . . . . . . . . . . . . . . . . . . . . . . . . 115.2.1 Special application . . . . . . . . . . . . . . . . . . . . . . . . . . . . . . . . . . . . . . . . . . . . . . . . . . 125.2.2 Application determination . . . . . . . . . . . . . . . . . . . . . . . . . . . . . . . . . . . . . . . . . . . . 125.2.3 Test parameters . . . . . . . . . . . . . . . . . . . . . . . . . . . . . . . . . . . . . . . . . . . . . . . . . . . . 125.3 Transmitter limits . . . . . . . . . . . . . . . . . . . . . . . . . . . . . . . . . . . . . . . . . . . . . . . . . . 135.3.1 Transmitter emission bandwidth . . . . . . . . . . . . . . . . . . . . . . . . . . . . . . . . . . . . . . . 135.3.2 Transmitter emission levels . . . . . . . . . . . . . . . . . . . . . . . . . . . . . . . . . . . . . . . . . . . 135.3.3 Transmitter frequency tolerance . . . . . . . . . . . . . . . . . . . . . . . . . . . . . . . . . . . . . . . . 135.3.4 Transmitter tunability . . . . . . . . . . . . . . . . . . . . . . . . . . . . . . . . . . . . . . . . . . . . . . . 135.3.5 Special EMC requirements, group D radars . . . . . . . . . . . . . . . . . . . . . . . . . . . . . . 165.4 Antenna limits . . . . . . . . . . . . . . . . . . . . . . . . . . . . . . . . . . . . . . . . . . . . . . . . . . . . . 165.5 Receiver limits . . . . . . . . . . . . . . . . . . . . . . . . . . . . . . . . . . . . . . . . . . . . . . . . . . . . 165.5.1 Receiver acceptance bandwidth . . . . . . . . . . . . . . . . . . . . . . . . . . . . . . . . . . . . . . . . 165.5.2 Receiver susceptibility characteristics . . . . . . . . . . . . . . . . . . . . . . . . . . . . . . . . . . . 165.5.3 Receiver tunability . . . . . . . . . . . . . . . . . . . . . . . . . . . . . . . . . . . . . . . . . . . . . . . . . 165.5.4 Receiver frequency tolerance . . . . . . . . . . . . . . . . . . . . . . . . . . . . . . . . . . . . . . . . . 185.5.5 Receiver oscillator radiation . . . . . . . . . . . . . . . . . . . . . . . . . . . . . . . . . . . . . . . . . . 18
6. NOTES . . . . . . . . . . . . . . . . . . . . . . . . . . . . . . . . . . . . . . . . . . . . . . . . . . . . . . . . . . 196.1 Intended use . . . . . . . . . . . . . . . . . . . . . . . . . . . . . . . . . . . . . . . . . . . . . . . . . . . . . . 196.2 Issue . . . . . . . . . . . . . . . . . . . . . . . . . . . . . . . . . . . . . . . . . . . . . . . . . . . . . . . . . . . . . 196.2.1 Issue of DoDISS . . . . . . . . . . . . . . . . . . . . . . . . . . . . . . . . . . . . . . . . . . . . . . . . . . . . 196.3 Associated Data Item Descriptions (DIDs) . . . . . . . . . . . . . . . . . . . . . . . . . . . . . . . 206.4 International standardization agreements . . . . . . . . . . . . . . . . . . . . . . . . . . . . . . . . . 206.5 Subject term (key word) listing . . . . . . . . . . . . . . . . . . . . . . . . . . . . . . . . . . . . . . . . 206.6 Changes from previous issue . . . . . . . . . . . . . . . . . . . . . . . . . . . . . . . . . . . . . . . . . . 20
TABLES
I Definitions of radar categories . . . . . . . . . . . . . . . . . . . . . . . . . . . . . . . . . . . . . . . . 10II Radar emission and susceptibility requirements summary . . . . . . . . . . . . . . . . . . . . 11III Test parameters and radar tuned frequencies . . . . . . . . . . . . . . . . . . . . . . . . . . . . . . 12IV Transmitter emission bandwidth limits for B . . . . . . . . . . . . . . . . . . . . . . . . . . 1340 dB
V Transmitter maximum emission levels outside B range . . . . . . . . . . . . . . . . . . 1440 dB
VI Frequency range for emission level requirements . . . . . . . . . . . . . . . . . . . . . . . . . . 15VII Frequency tolerance limits . . . . . . . . . . . . . . . . . . . . . . . . . . . . . . . . . . . . . . . . . . . 15VIII Antenna characteristics limits . . . . . . . . . . . . . . . . . . . . . . . . . . . . . . . . . . . . . . . . . . 17IX Receiver acceptance bandwidth and susceptibility limits . . . . . . . . . . . . . . . . . . . . . . 18X Receiver radiation limits . . . . . . . . . . . . . . . . . . . . . . . . . . . . . . . . . . . . . . . . . . . . . 19
MIL-STD-469B
v
CONTENTS
APPENDIX A PAGE
PARAGRAPHS
10. SCOPE AND APPLICATION . . . . . . . . . . . . . . . . . . . . . . . . . . . . . . . . . . . . . . . . 2110.1 Scope . . . . . . . . . . . . . . . . . . . . . . . . . . . . . . . . . . . . . . . . . . . . . . . . . . . . . . . . . . . . 2110.2 Application . . . . . . . . . . . . . . . . . . . . . . . . . . . . . . . . . . . . . . . . . . . . . . . . . . . . . . . 21
20. APPLICABLE DOCUMENTS . . . . . . . . . . . . . . . . . . . . . . . . . . . . . . . . . . . . . . . . 2120.1 Government documents . . . . . . . . . . . . . . . . . . . . . . . . . . . . . . . . . . . . . . . . . . . . . . 2120.1.1 Specifications, standards, and handbooks . . . . . . . . . . . . . . . . . . . . . . . . . . . . . . . . 21
30. INSTRUMENTATION . . . . . . . . . . . . . . . . . . . . . . . . . . . . . . . . . . . . . . . . . . . . . 21
40. RADAR TRANSMITTER MEASUREMENTS . . . . . . . . . . . . . . . . . . . . . . . . . . . 2440.1 Requirements summary . . . . . . . . . . . . . . . . . . . . . . . . . . . . . . . . . . . . . . . . . . . . . . 2440.2 Power output . . . . . . . . . . . . . . . . . . . . . . . . . . . . . . . . . . . . . . . . . . . . . . . . . . . . . . 2440.2.1 Objective . . . . . . . . . . . . . . . . . . . . . . . . . . . . . . . . . . . . . . . . . . . . . . . . . . . . . . . . . 2440.2.2 Requirements . . . . . . . . . . . . . . . . . . . . . . . . . . . . . . . . . . . . . . . . . . . . . . . . . . . . . 2440.2.3 Application notes . . . . . . . . . . . . . . . . . . . . . . . . . . . . . . . . . . . . . . . . . . . . . . . . . . . 2540.2.4 Procedure . . . . . . . . . . . . . . . . . . . . . . . . . . . . . . . . . . . . . . . . . . . . . . . . . . . . . . . . 2540.2.5 Sample calculations . . . . . . . . . . . . . . . . . . . . . . . . . . . . . . . . . . . . . . . . . . . . . . . . . 2640.3 Pulse width and rise time . . . . . . . . . . . . . . . . . . . . . . . . . . . . . . . . . . . . . . . . . . . . . 2740.3.1 Objective . . . . . . . . . . . . . . . . . . . . . . . . . . . . . . . . . . . . . . . . . . . . . . . . . . . . . . . . . 2740.3.2 Requirements . . . . . . . . . . . . . . . . . . . . . . . . . . . . . . . . . . . . . . . . . . . . . . . . . . . . . 2740.3.3 Application notes . . . . . . . . . . . . . . . . . . . . . . . . . . . . . . . . . . . . . . . . . . . . . . . . . . . 2740.3.4 Procedure . . . . . . . . . . . . . . . . . . . . . . . . . . . . . . . . . . . . . . . . . . . . . . . . . . . . . . . . 2840.3.5 Sample calculation . . . . . . . . . . . . . . . . . . . . . . . . . . . . . . . . . . . . . . . . . . . . . . . . . . 2940.4 Emission bandwidth . . . . . . . . . . . . . . . . . . . . . . . . . . . . . . . . . . . . . . . . . . . . . . . . 2940.4.1 Objective . . . . . . . . . . . . . . . . . . . . . . . . . . . . . . . . . . . . . . . . . . . . . . . . . . . . . . . . . 2940.4.2 Requirements . . . . . . . . . . . . . . . . . . . . . . . . . . . . . . . . . . . . . . . . . . . . . . . . . . . . . 2940.4.3 Application notes . . . . . . . . . . . . . . . . . . . . . . . . . . . . . . . . . . . . . . . . . . . . . . . . . . . 2940.4.4 Procedure . . . . . . . . . . . . . . . . . . . . . . . . . . . . . . . . . . . . . . . . . . . . . . . . . . . . . . . . 3040.4.5 Sampling calculations . . . . . . . . . . . . . . . . . . . . . . . . . . . . . . . . . . . . . . . . . . . . . . . 3240.5 Spurious emission . . . . . . . . . . . . . . . . . . . . . . . . . . . . . . . . . . . . . . . . . . . . . . . . . . 3340.5.1 Objective . . . . . . . . . . . . . . . . . . . . . . . . . . . . . . . . . . . . . . . . . . . . . . . . . . . . . . . . . 3340.5.2 Requirements . . . . . . . . . . . . . . . . . . . . . . . . . . . . . . . . . . . . . . . . . . . . . . . . . . . . . 3440.5.3 Application notes . . . . . . . . . . . . . . . . . . . . . . . . . . . . . . . . . . . . . . . . . . . . . . . . . . . 3440.5.4 Procedures . . . . . . . . . . . . . . . . . . . . . . . . . . . . . . . . . . . . . . . . . . . . . . . . . . . . . . . . 3440.5.5 Sample calculations . . . . . . . . . . . . . . . . . . . . . . . . . . . . . . . . . . . . . . . . . . . . . . . . . 36
MIL-STD-469B
vi
APPENDIX A
PARAGRAPHS PAGE
40.6 Frequency stability . . . . . . . . . . . . . . . . . . . . . . . . . . . . . . . . . . . . . . . . . . . . . . . . . 3740.6.1 Objective . . . . . . . . . . . . . . . . . . . . . . . . . . . . . . . . . . . . . . . . . . . . . . . . . . . . . . . . . 3740.6.2 Requirements . . . . . . . . . . . . . . . . . . . . . . . . . . . . . . . . . . . . . . . . . . . . . . . . . . . . . 3740.6.3 Application notes . . . . . . . . . . . . . . . . . . . . . . . . . . . . . . . . . . . . . . . . . . . . . . . . . . . 3740.6.4 Procedure . . . . . . . . . . . . . . . . . . . . . . . . . . . . . . . . . . . . . . . . . . . . . . . . . . . . . . . . 3840.6.5 Sample calculations . . . . . . . . . . . . . . . . . . . . . . . . . . . . . . . . . . . . . . . . . . . . . . . . . 3840.7 Transmitter tunability . . . . . . . . . . . . . . . . . . . . . . . . . . . . . . . . . . . . . . . . . . . . . . . 3840.7.1 Objective . . . . . . . . . . . . . . . . . . . . . . . . . . . . . . . . . . . . . . . . . . . . . . . . . . . . . . . . . 3840.7.2 Requirements . . . . . . . . . . . . . . . . . . . . . . . . . . . . . . . . . . . . . . . . . . . . . . . . . . . . . 3840.7.3 Application notes . . . . . . . . . . . . . . . . . . . . . . . . . . . . . . . . . . . . . . . . . . . . . . . . . . . 3840.7.4 Procedure . . . . . . . . . . . . . . . . . . . . . . . . . . . . . . . . . . . . . . . . . . . . . . . . . . . . . . . . 3840.7.5 Sample calculations . . . . . . . . . . . . . . . . . . . . . . . . . . . . . . . . . . . . . . . . . . . . . . . . . 39
50. RADAR ANTENNA MEASUREMENTS . . . . . . . . . . . . . . . . . . . . . . . . . . . . . . . 3950.1 Requirements summary . . . . . . . . . . . . . . . . . . . . . . . . . . . . . . . . . . . . . . . . . . . . . . 3950.2 Antenna characteristics . . . . . . . . . . . . . . . . . . . . . . . . . . . . . . . . . . . . . . . . . . . . . . 3950.2.1 Objective . . . . . . . . . . . . . . . . . . . . . . . . . . . . . . . . . . . . . . . . . . . . . . . . . . . . . . . . . 3950.2.2 Requirements . . . . . . . . . . . . . . . . . . . . . . . . . . . . . . . . . . . . . . . . . . . . . . . . . . . . . 3950.2.3 Application notes . . . . . . . . . . . . . . . . . . . . . . . . . . . . . . . . . . . . . . . . . . . . . . . . . . . 3950.2.4 Procedure . . . . . . . . . . . . . . . . . . . . . . . . . . . . . . . . . . . . . . . . . . . . . . . . . . . . . . . . 4050.2.5 Sample calculations . . . . . . . . . . . . . . . . . . . . . . . . . . . . . . . . . . . . . . . . . . . . . . . . . 42
60. RADAR RECEIVER MEASUREMENTS . . . . . . . . . . . . . . . . . . . . . . . . . . . . . . . 4360.1 Requirements summary . . . . . . . . . . . . . . . . . . . . . . . . . . . . . . . . . . . . . . . . . . . . . . 4360.2 Overall selectivity . . . . . . . . . . . . . . . . . . . . . . . . . . . . . . . . . . . . . . . . . . . . . . . . . . 4360.2.1 Objective . . . . . . . . . . . . . . . . . . . . . . . . . . . . . . . . . . . . . . . . . . . . . . . . . . . . . . . . . 4360.2.2 Requirements . . . . . . . . . . . . . . . . . . . . . . . . . . . . . . . . . . . . . . . . . . . . . . . . . . . . . 4360.2.3 Application notes . . . . . . . . . . . . . . . . . . . . . . . . . . . . . . . . . . . . . . . . . . . . . . . . . . . 4360.2.4 Procedure . . . . . . . . . . . . . . . . . . . . . . . . . . . . . . . . . . . . . . . . . . . . . . . . . . . . . . . . 4460.2.5 Sample calculations . . . . . . . . . . . . . . . . . . . . . . . . . . . . . . . . . . . . . . . . . . . . . . . . . 4460.3 Spurious response . . . . . . . . . . . . . . . . . . . . . . . . . . . . . . . . . . . . . . . . . . . . . . . . . . 4560.3.1 Objective . . . . . . . . . . . . . . . . . . . . . . . . . . . . . . . . . . . . . . . . . . . . . . . . . . . . . . . . . 4560.3.2 Requirements . . . . . . . . . . . . . . . . . . . . . . . . . . . . . . . . . . . . . . . . . . . . . . . . . . . . . 4560.3.3 Application notes . . . . . . . . . . . . . . . . . . . . . . . . . . . . . . . . . . . . . . . . . . . . . . . . . . . 4560.3.4 Procedure . . . . . . . . . . . . . . . . . . . . . . . . . . . . . . . . . . . . . . . . . . . . . . . . . . . . . . . . 4560.3.5 Sample calculation . . . . . . . . . . . . . . . . . . . . . . . . . . . . . . . . . . . . . . . . . . . . . . . . . 4660.4 Receiver tunability and frequency stability . . . . . . . . . . . . . . . . . . . . . . . . . . . . . . . 4660.4.1 Objective . . . . . . . . . . . . . . . . . . . . . . . . . . . . . . . . . . . . . . . . . . . . . . . . . . . . . . . . . 4660.4.2 Requirements . . . . . . . . . . . . . . . . . . . . . . . . . . . . . . . . . . . . . . . . . . . . . . . . . . . . . 4660.4.3 Application notes . . . . . . . . . . . . . . . . . . . . . . . . . . . . . . . . . . . . . . . . . . . . . . . . . . . 4660.4.4 Procedure . . . . . . . . . . . . . . . . . . . . . . . . . . . . . . . . . . . . . . . . . . . . . . . . . . . . . . . . 4760.4.5 Sample calculations . . . . . . . . . . . . . . . . . . . . . . . . . . . . . . . . . . . . . . . . . . . . . . . . . 4860.5 Receiver radiation . . . . . . . . . . . . . . . . . . . . . . . . . . . . . . . . . . . . . . . . . . . . . . . . . . 4860.5.1 Objective . . . . . . . . . . . . . . . . . . . . . . . . . . . . . . . . . . . . . . . . . . . . . . . . . . . . . . . . . 48
MIL-STD-469B
vii
APPENDIX A
PARAGRAPHS PAGE
60.5.2 Requirements . . . . . . . . . . . . . . . . . . . . . . . . . . . . . . . . . . . . . . . . . . . . . . . . . . . . . 4860.5.3 Application notes . . . . . . . . . . . . . . . . . . . . . . . . . . . . . . . . . . . . . . . . . . . . . . . . . . . 4860.5.4 Procedure . . . . . . . . . . . . . . . . . . . . . . . . . . . . . . . . . . . . . . . . . . . . . . . . . . . . . . . . 4960.5.5 Sample calculations . . . . . . . . . . . . . . . . . . . . . . . . . . . . . . . . . . . . . . . . . . . . . . . . . 49
FIGURES
1. Transmitter power output measurement block diagram . . . . . . . . . . . . . . . . . . . . . . 502. Sample transmitter power output data form A . . . . . . . . . . . . . . . . . . . . . . . . . . . . . 513. Sample transmitter power output data form B . . . . . . . . . . . . . . . . . . . . . . . . . . . . . 524. Determination of t and t (pulse waveform) . . . . . . . . . . . . . . . . . . . . . . . . . . . . . . . 53r
5. Transmitter pulse width, rise time and PRF measurement block diagram . . . . . . . . 546. Sample transmitter pulse width data form A . . . . . . . . . . . . . . . . . . . . . . . . . . . . . . 557. Sample transmitter pulse width data form B . . . . . . . . . . . . . . . . . . . . . . . . . . . . . . 568. Sample transmitter pulse width or rise time data form . . . . . . . . . . . . . . . . . . . . . . 579. Spectrum analyzer alpha factor (a) versus bandwidth (b) pulse width
(t) product . . . . . . . . . . . . . . . . . . . . . . . . . . . . . . . . . . . . . . . . . . . . . . . . . . . . . . . 5810. Transmitter emission characteristics measurement block diagram . . . . . . . . . . . . . 5911. Sample transmitter emission spectrum photograph data form . . . . . . . . . . . . . . . . . 6012. Sample transmitter emission spectrum data form . . . . . . . . . . . . . . . . . . . . . . . . . . 6113. Illustration of emission spectrum photographs, overlap and analyzer
bandwidth increased . . . . . . . . . . . . . . . . . . . . . . . . . . . . . . . . . . . . . . . . . . . . . . . . 6214. Sample transmitter closed system spurious emission data form A . . . . . . . . . . . . . . 6315. Sample transmitter closed system spurious emission data form B . . . . . . . . . . . . . . 6416. Sample transmitter closed system spurious emission data form C . . . . . . . . . . . . . . 6517. Sample transmitter open field spurious emission data form A . . . . . . . . . . . . . . . . . 6618. Sample transmitter open field spurious emission data form B . . . . . . . . . . . . . . . . . 6719. Sample transmitter open field spurious emission data form C . . . . . . . . . . . . . . . . . 6820. Transmitter frequency stability measurement block diagram . . . . . . . . . . . . . . . . . 6921. Sample transmitter frequency stability data form A . . . . . . . . . . . . . . . . . . . . . . . . 7022. Sample transmitter frequency stability data form B . . . . . . . . . . . . . . . . . . . . . . . . 7123. Antenna pattern and median gain measurement block diagram . . . . . . . . . . . . . . . . 7224. Sample antenna pattern data format (sample antenna pattern) . . . . . . . . . . . . . . . . . 7325. Receiver response characteristics measurement block diagram 10 GHz . . . . . . 7426. Receiver response characteristics measurement block diagram > 10 GHz . . . . . . . 7527. Sample pulsed receiver data form . . . . . . . . . . . . . . . . . . . . . . . . . . . . . . . . . . . . . . 7628. Sample nonpulsed receiver selectivity data form . . . . . . . . . . . . . . . . . . . . . . . . . . . 7729. Sample receiver selectivity data form A . . . . . . . . . . . . . . . . . . . . . . . . . . . . . . . . . 7830. Sample receiver selectivity data form B . . . . . . . . . . . . . . . . . . . . . . . . . . . . . . . . . 79
MIL-STD-469B
viii
APPENDIX A
FIGURES PAGE
31. Sample receiver spurious response data form A . . . . . . . . . . . . . . . . . . . . . . . . . . . 8032. Sample receiver spurious response data form B . . . . . . . . . . . . . . . . . . . . . . . . . . . 8133. Receiver tunability and frequency stability measurement block diagram . . . . . . . . 8234. Sample receiver tunability and frequency data form . . . . . . . . . . . . . . . . . . . . . . . . 8335. Sample receiver tunability data form . . . . . . . . . . . . . . . . . . . . . . . . . . . . . . . . . . . . 8436. Sample frequency stability data form . . . . . . . . . . . . . . . . . . . . . . . . . . . . . . . . . . . 8537. Receiver oscillator radiation measurements block diagram . . . . . . . . . . . . . . . . . . . 8638. Sample receiver oscillator radiation data form B . . . . . . . . . . . . . . . . . . . . . . . . . . . 8739. Sample receiver oscillator radiation data form A . . . . . . . . . . . . . . . . . . . . . . . . . . 8840. Sample power density measurements data sheet (directed beam antennas) . . . . . . . 89
MIL-STD-469B
1
1. SCOPE
1.1 Scope. This standard establishes the engineering interface requirements to control th eelectromagnetic emission and susceptibility characteristics of all new military radar equipment and systemsoperating between 100 megahertz (MHz) and 100 gigahertz (GHz), to ensure EMC in all intende doperational environments, and to conserve the frequency spectrum available to military radar systems.
1.2 Application. The interface requirements presented herein apply to radar equipment and systemsdesigned or acquired for use by activities and agencies of the Department of Defense (DoD). Th eapplicable portions of this standard are mandatory for use by all departments and agencies of th eDepartment of Defense unless waived by the cognizant proj ect office with recommendation from the EMCorganization within the procuring acti vity’s command. The applicability of the emission and susceptibilityrequirements are dependent upon the type of equipment or subsystem, its mission and intended installation.
2. APPLICABLE DOCUMENTS
2.1 General. The documents listed in this section ar e specified in sections 3, 4, and 5 of this standard.This section does not include documents cited in other sections of this standard or recommended fo radditional information or as examples. While every effort has been made to ensure completeness of thislist, document users are cautioned that they must meet all specified requirements documents cited i nsections 3, 4, and 5 of this standard, whether or not they are listed.
2.2 Government documents.
2.2.1 Specifications, standards, and handbooks. The following specifications, standards, an dhandbooks form a part of this document to the extent specified herein. Unless otherwise specified, the issueof these documents are those listed in the issue of the Department of Defense Index of Specifications andStandards (DoDISS) and supplement thereto, cited in the solicitation (see 6.2).
STANDARDS
MILITARY
MIL-STD-461 Electromagnetic Emission and Susceptibility Req uirements for the Controlof Electromagnetic Interference
HANDBOOK
MILITARY
MIL-HDBK-237 Electromagnetic Compatibility Management Guide f or Platforms, Systemsand Equipment
(Unless otherwise indicated, copies of federal and military specifications, standards, and handbooks areavailable from the Standardization Documents Order Desk, Building 4D, 700 Robbins Avenue ,Philadelphia, PA 19111-5094.)

MIL-STD-469B
2
2.3 Non-government publications. The following documents form a part of this document to th eextent specified herein. Unless otherwise specified, the issues of the documents which are DoD adoptedare those listed in the issue of the DoDISS cited in the solicitation. Unless otherwise specified, the issuesof documents not listed in the DoDISS are the issues of the documents cited in the solicitation (see 6.2).
AMERICAN NATIONAL STANDARD INSTITUTE (ANSI)
ANSI C63.14 American National Standard Dictionary for Technologies o fElectromagnetic Compatibility (EMC), Electroma gnetic Pulse (EMP), andElectrostatic Discharge (ESD).
(Application for copies should be addressed to the Institute of Electrical and Electronics Engineers ,Inc., 445 Hoes Lane, P.O. Box 1331, Piscataway, NJ 08855-1331.)
2.4 Order of precedence. In the event of a conflict between the text of this document and th ereferences cited herein the text of this document takes precedence. Nothing in this document, however ,supersedes applicable laws and regulations unless a specific exemption has been obtained.
3. DEFINITIONS
3.1 Definitions. The terms used in this standard are defined in ANSI C63.14. In addition, th efollowing terms shall be defined as specified herein.
3.1.1 Active spaceborne sensor. Active spaceborne sensor is a measuring instrument in the eart hexploration service, or in the space researc h service, by means of which physical measurements of variousphenomena are obtained through transmission and reception of radio waves.
3.1.2 Circular aperture array. A circular aperture is defined as the shape of the array configurationof a planar-array antenna in which the elements are located within a circular area.
3.1.3 Planar phased array. A planar array is a phased-array antenna in which the array elements arein one plane.
3.1.4 Plane of reference. A plane of reference is a location in the radio frequency (RF) transmissionpath, established as close to the antenna as is practicable, where the antenna transmission line i sdisconnected from the transmitter or receiver, when necessary, for insertion of couplers, adapters, o rtransitions to be connected to measurement instrumentation.
3.1.5 Primary radar. A radiodetermination system based on the comparison of reference signals withradio signals reflected from the position to be determined.
3.1.6 Receiver. A receiver is equipment necessary for receiving modulated RF signals and convertingthem to a form that is suitable for signal processing, visual display, or audio presentation.
MIL-STD-469B
3
3.1.7 Rectangular aperture array. A rectangular aperture is defined as the shape of the arra yconfiguration of a planar-array antenna in which the elements are located within a rectangular area.
3.1.8 Selectivity. Selectivity is a measure of a receiver's ability to discriminate against signals o nadjacent frequencies (usually expressed as a curve in which the input signa l power at an adjacent frequency,relative to the on-tune power that produces the same response, is plotted against frequency).
3.1.9 Sensitivity. Sensitivity is the minimum input signal required to produce an output signal o rindication that satisfies a specified requirement.
3.1.10 Signal processor. Signal processor is a device that processes the output signal of a receiverto utilize the information contained in the signal for such purposes as supplying tracking error signals ,complex waveform decoding, automatic gain control (AGC) for its syst ems, target identification, electroniccounter-countermeasures (ECCM), and clutter mapping.
3.1.11 Signal substitution. Signal substitution is a method of measuring signals by using a calibratedsignal generator whose output is similar to that of the unknown signal and substitutes for the unknow nsignal to produce an identical response.
3.1.12 Spacebased radiolocation system, class 1. Spacebased radiolocation system, class 1, is aradiolocation system in spac e, the primary function of which is the detection and location of objects on ornear the surface of the earth.
3.1.13 Spacebased radiolocation system, class 2. Spacebased radiolocation system, class 2, is aradiolocation system installed aboard a spacecraft for the purpose of determining the relative positions orvelocities of one or more extravehicular objects.
3.1.14 Spurious emission, inband. A spurious emission inband is any spurious emission of atransmitter or system that is within the assigned frequency tuning range for the system.
3.1.15 Standard response. Standard response is a repeatable indication of radar operationa lperformance (as specified in the radar system procurement specification) that is accessible through th ereceiver or signal processor for use in measurement of receiver selectivity or sensitivity.
3.1.16 Standard test frequencies. Standard test frequencies are that set of frequencies to whic htransmitters or receivers are tuned during the test procedures. At least three such frequencies exist in thetuning band designated for each equipment are located at the lower limit, center, and upper limit of th etuning range in each band, and designated to l ow (F ), mean (F ), and high (F ), standard test frequencies,L M H
respectively.
3.1.17 Transmitter. A transmitter is equipment needed to generate a modulated RF signal and feedthe modulated signal to an antenna for radiation into space as electromagnetic waves.
3.1.18 Tunability. Tunability is the ability of a radar system to perform its specified acquisition ortracking functions or both by maintaining adequate transmitter power output and receiver sensitivity overthe designated tuning range.
MIL-STD-469B
4
3.2 Acronyms. The acronyms used in this standard are defined as specified below:
ACF Antenna Coupling Factor (dB)
AFC Automatic Frequency Control
AGC Automatic Gain Control
AMSDL Acquisition Management Systems and Data Requirements Control List
ANSI American National Standards Institute
COTS Commercial-Off-The-Shelf
CW Continuous Wave
DoD Department of Defense
DoDISS Department of Defense Index of Specifications and Standards
ECCM Electronic Counter-Countermeasures
EM Electromagnetic
EMC Electromagnetic Compatibility
EME Electromagnetic Environment
EMI Electromagnetic Interference
EMP Electromagnetic Pulse
EMR Electromagnetic Radiation
FM Frequency Modulation
FSVM Frequency Selective Voltmeter Receiver
IF Intermediate Frequency
MPMVS Mid pulse minimum visible signal (dBm)
MIL-STD-469B
5
MVS (MDS) Minimum visible signal (minimum discernable signal) (dBm)
NATO North Atlantic Treaty Organization
NAVSEA Naval Sea Systems Command
NDI Non-developmental Item
NTIA National Telecommunications and Information Administration
PRF Pulse repetition frequency (Hz)
RF Radio Frequency
RSM Radar Spectrum Management
STANAG Standardization Agreement
VSWR Voltage standing-wave ratio
3.3 Symbols. The symbols used in this standard are defined as specified below:
A Attenuation (dB)
Alpha factor = pulse versus CW sensitivity of a receiver (dB)
Alpha factor for radar signal received (dB)R
A Attenuation of signal sampling device, main line to sample port, (dB)S
B Frequency bandwidth (MHz)
B Bandwidth at ( x) dB response level (MHz)(x)dB
B Bandwidth of the frequency deviation. (T he total frequency shift during the pulsec
duration in MHz)
B Bandwidth of the frequency deviation (peak difference between instantaneou sd
frequency of the modulated wave and the carrier frequency) (FM/CW radarsystems), in MHz
B Frequency selective voltmeters bandwidth (MHz)FSVM
MIL-STD-469B
6
B Nominal bandwidth (spectrum analyzer) at 3 dB points (Hz)NOM
B Maximum range over which the carri er frequency will be shifted for a frequencys
hopping radar (MHz)
BW Bandwidth of test instrument (MHz)
d Pulse compression ratio
dB Decibels
dBm Decibels referenced to one milliwatt
dBi Decibels gain referenced to isotropic radiator
D Antenna aperture dimension (meters)
erf Error function
F Frequency
F Waveguide cutoff frequency (MHz)co
F Receiver local oscillator frequency (MHz)LO
f Modulation rate (in frequency modulation) (MHz/sec)MOD
f Frequency separation between first null points, above and below f , in radarN o
signal frequency spectrum (MHz)
F High standard test frequency (MHz)H
F Low standard test frequency (MHz)L
F Mean standard test frequency (MHz)M
F Maximum test frequency (GHz)MAX
F Minimum test frequency (GHz)MIN
F Radar fundamental frequency (MHz)o
F Sweep width (Hz)S
MIL-STD-469B
7
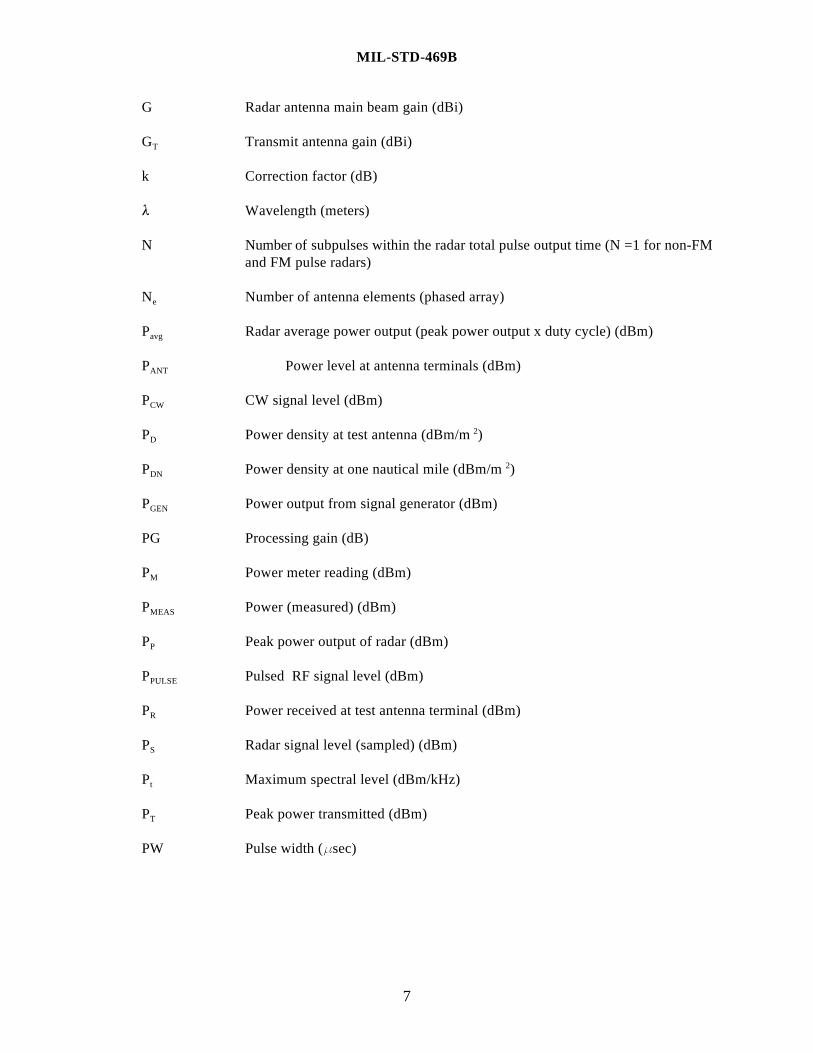
G Radar antenna main beam gain (dBi)
G Transmit antenna gain (dBi)T
k Correction factor (dB)
Wavelength (meters)
N Number of subpulses within the radar total pulse output time (N =1 for non-FMand FM pulse radars)
N Number of antenna elements (phased array)e
P Radar average power output (peak power output x duty cycle) (dBm)avg
P Power level at antenna terminals (dBm) ANT
P CW signal level (dBm)CW
P Power density at test antenna (dBm/m )D2
P Power density at one nautical mile (dBm/m )DN2
P Power output from signal generator (dBm)GEN
PG Processing gain (dB)
P Power meter reading (dBm)M
P Power (measured) (dBm)MEAS
P Peak power output of radar (dBm)P
P Pulsed RF signal level (dBm)PULSE
P Power received at test antenna terminal (dBm)R
P Radar signal level (sampled) (dBm)S
P Maximum spectral level (dBm/kHz)t
P Peak power transmitted (dBm)T
PW Pulse width ( sec)
MIL-STD-469B
8
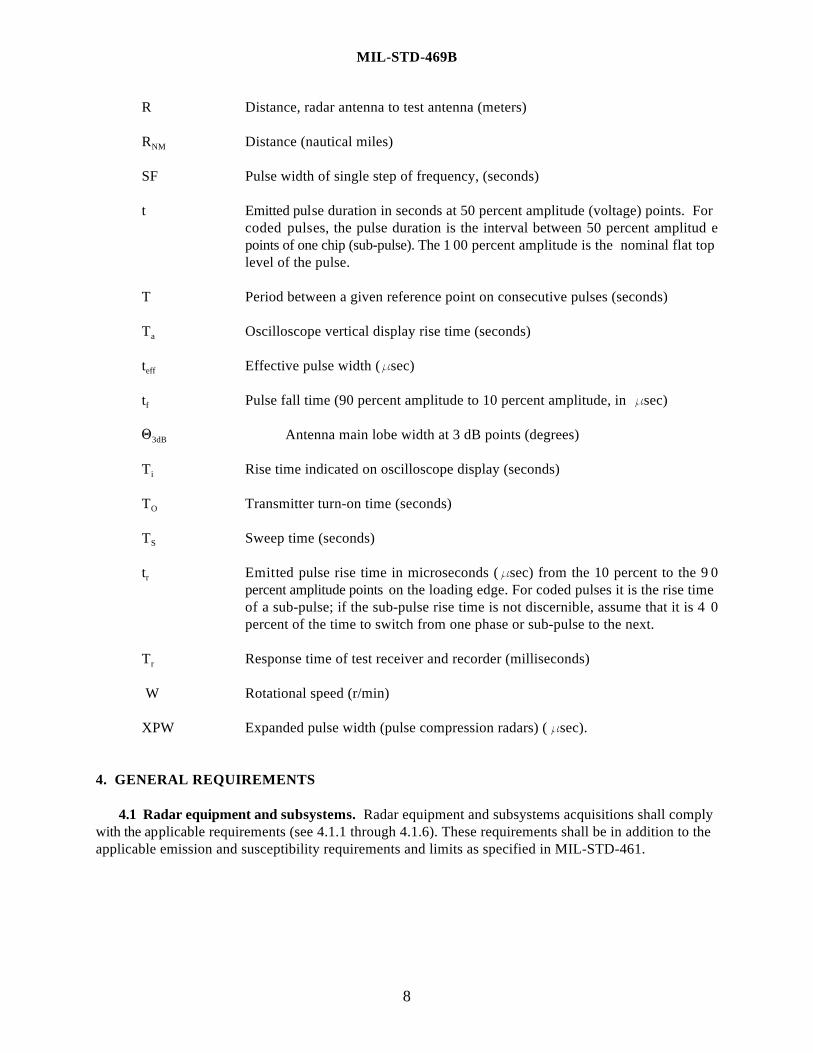
R Distance, radar antenna to test antenna (meters)
R Distance (nautical miles)NM
SF Pulse width of single step of frequency, (seconds)
t Emitted pulse duration in seconds at 50 percent amplitude (voltage) points. Forcoded pulses, the pulse duration is the interval between 50 percent amplitud epoints of one chip (sub-pulse). The 1 00 percent amplitude is the nominal flat toplevel of the pulse.
T Period between a given reference point on consecutive pulses (seconds)
T Oscilloscope vertical display rise time (seconds)a
t Effective pulse width ( sec)eff
t Pulse fall time (90 percent amplitude to 10 percent amplitude, in sec)f
Antenna main lobe width at 3 dB points (degrees)3dB
T Rise time indicated on oscilloscope display (seconds)i
T Transmitter turn-on time (seconds)O
T Sweep time (seconds)S
t Emitted pulse rise time in microseconds ( sec) from the 10 percent to the 9 0r
percent amplitude points on the loading edge. For coded pulses it is the rise timeof a sub-pulse; if the sub-pulse rise time is not discernible, assume that it is 4 0percent of the time to switch from one phase or sub-pulse to the next.
T Response time of test receiver and recorder (milliseconds) r
W Rotational speed (r/min)
XPW Expanded pulse width (pulse compression radars) ( sec).
4. GENERAL REQUIREMENTS
4.1 Radar equipment and subsystems. Radar equipment and subsystems acquisitions shall complywith the applicable requirements (see 4.1.1 through 4.1.6). These requirements shall be in addition to theapplicable emission and susceptibility requirements and limits as specified in MIL-STD-461.
MIL-STD-469B
9
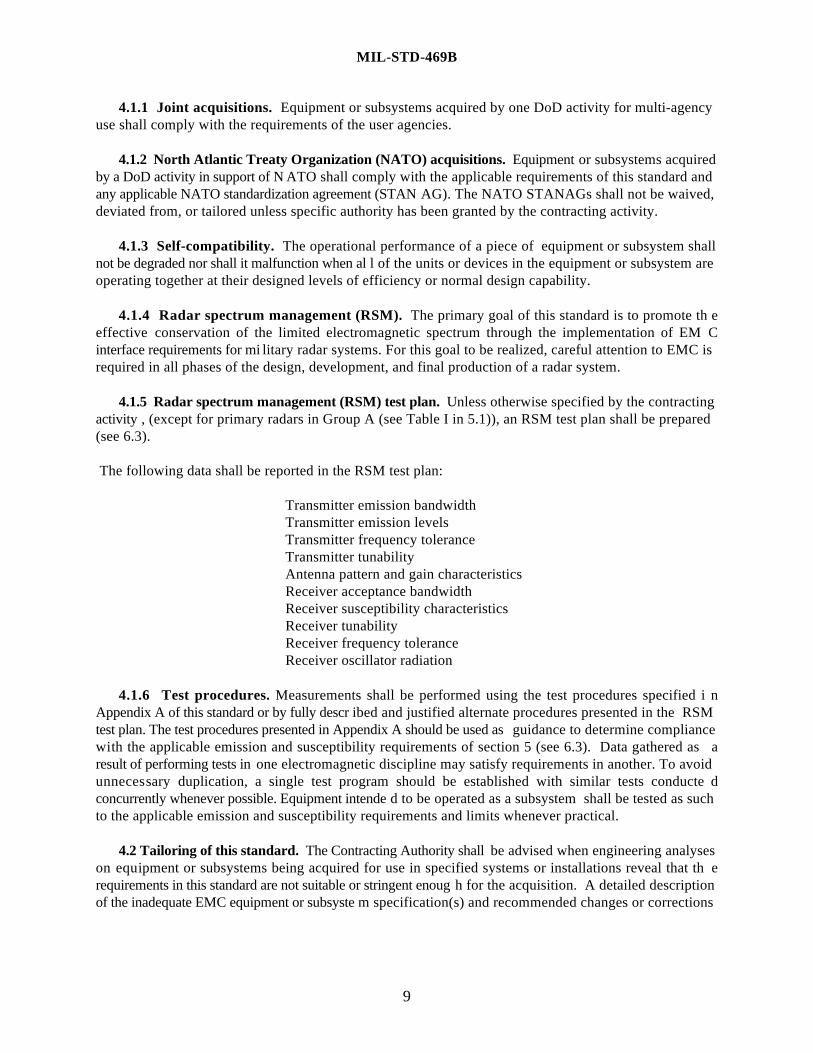
4.1.1 Joint acquisitions. Equipment or subsystems acquired by one DoD activity for multi-agencyuse shall comply with the requirements of the user agencies.
4.1.2 North Atlantic Treaty Organization (NATO) acquisitions. Equipment or subsystems acquiredby a DoD activity in support of N ATO shall comply with the applicable requirements of this standard andany applicable NATO standardization agreement (STAN AG). The NATO STANAGs shall not be waived,deviated from, or tailored unless specific authority has been granted by the contracting activity.
4.1.3 Self-compatibility. The operational performance of a piece of equipment or subsystem shallnot be degraded nor shall it malfunction when al l of the units or devices in the equipment or subsystem areoperating together at their designed levels of efficiency or normal design capability.
4.1.4 Radar spectrum management (RSM). The primary goal of this standard is to promote th eeffective conservation of the limited electromagnetic spectrum through the implementation of EM Cinterface requirements for mi litary radar systems. For this goal to be realized, careful attention to EMC isrequired in all phases of the design, development, and final production of a radar system.
4.1.5 Radar spectrum management (RSM) test plan. Unless otherwise specified by the contractingactivity , (except for primary radars in Group A (see Table I in 5.1)), an RSM test plan shall be prepared(see 6.3).
The following data shall be reported in the RSM test plan:
Transmitter emission bandwidthTransmitter emission levelsTransmitter frequency toleranceTransmitter tunabilityAntenna pattern and gain characteristicsReceiver acceptance bandwidthReceiver susceptibility characteristicsReceiver tunabilityReceiver frequency toleranceReceiver oscillator radiation
4.1.6 Test procedures. Measurements shall be performed using the test procedures specified i nAppendix A of this standard or by fully descr ibed and justified alternate procedures presented in the RSMtest plan. The test procedures presented in Appendix A should be used as guidance to determine compliancewith the applicable emission and susceptibility requirements of section 5 (see 6.3). Data gathered as aresult of performing tests in one electromagnetic discipline may satisfy requirements in another. To avoidunnecessary duplication, a single test program should be established with similar tests conducte dconcurrently whenever possible. Equipment intende d to be operated as a subsystem shall be tested as suchto the applicable emission and susceptibility requirements and limits whenever practical.
4.2 Tailoring of this standard. The Contracting Authority shall be advised when engineering analyseson equipment or subsystems being acquired for use in specified systems or installations reveal that th erequirements in this standard are not suitable or stringent enoug h for the acquisition. A detailed descriptionof the inadequate EMC equipment or subsyste m specification(s) and recommended changes or corrections
MIL-STD-469B
10
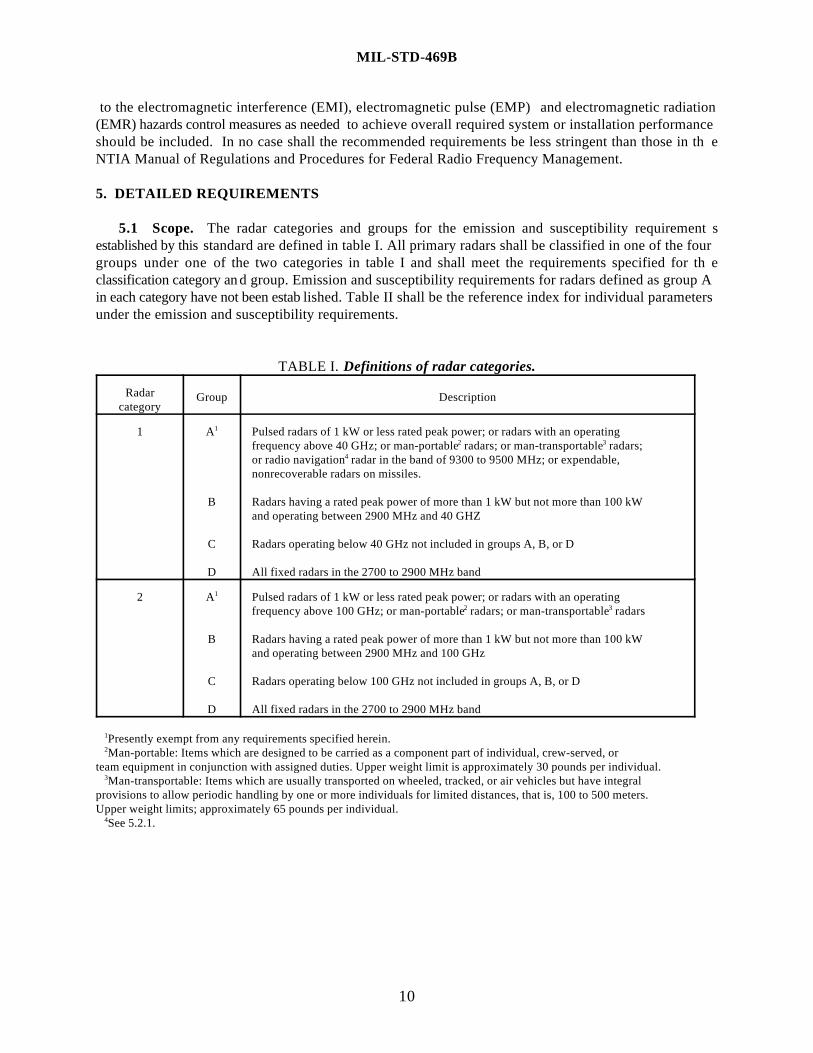
to the electromagnetic interference (EMI), electromagnetic pulse (EMP) and electromagnetic radiation(EMR) hazards control measures as needed to achieve overall required system or installation performanceshould be included. In no case shall the recommended requirements be less stringent than those in th eNTIA Manual of Regulations and Procedures for Federal Radio Frequency Management.
5. DETAILED REQUIREMENTS
5.1 Scope. The radar categories and groups for the emission and susceptibility requirement sestablished by this standard are defined in table I. All primary radars shall be classified in one of the fourgroups under one of the two categories in table I and shall meet the requirements specified for th eclassification category and group. Emission and susceptibility requirements for radars defined as group Ain each category have not been estab lished. Table II shall be the reference index for individual parametersunder the emission and susceptibility requirements.
TABLE I. Definitions of radar categories.
Radarcategory
Group Description
1 A Pulsed radars of 1 kW or less rated peak power; or radars with an operating1
B Radars having a rated peak power of more than 1 kW but not more than 100 kW
C Radars operating below 40 GHz not included in groups A, B, or D
D All fixed radars in the 2700 to 2900 MHz band
frequency above 40 GHz; or man-portable radars; or man-transportable radars;2 3
or radio navigation radar in the band of 9300 to 9500 MHz; or expendable,4
nonrecoverable radars on missiles.
and operating between 2900 MHz and 40 GHZ
2 A Pulsed radars of 1 kW or less rated peak power; or radars with an operating1
B Radars having a rated peak power of more than 1 kW but not more than 100 kW
C Radars operating below 100 GHz not included in groups A, B, or D
D All fixed radars in the 2700 to 2900 MHz band
frequency above 100 GHz; or man-portable radars; or man-transportable radars2 3
and operating between 2900 MHz and 100 GHz
Presently exempt from any requirements specified herein.1
Man-portable: Items which are designed to be carried as a component part of individual, crew-served, or2
team equipment in conjunction with assigned duties. Upper weight limit is approximately 30 pounds per individual. Man-transportable: Items which are usually transported on wheeled, tracked, or air vehicles but have integral3
provisions to allow periodic handling by one or more individuals for limited distances, that is, 100 to 500 meters.Upper weight limits; approximately 65 pounds per individual. See 5.2.1.4
MIL-STD-469B
11
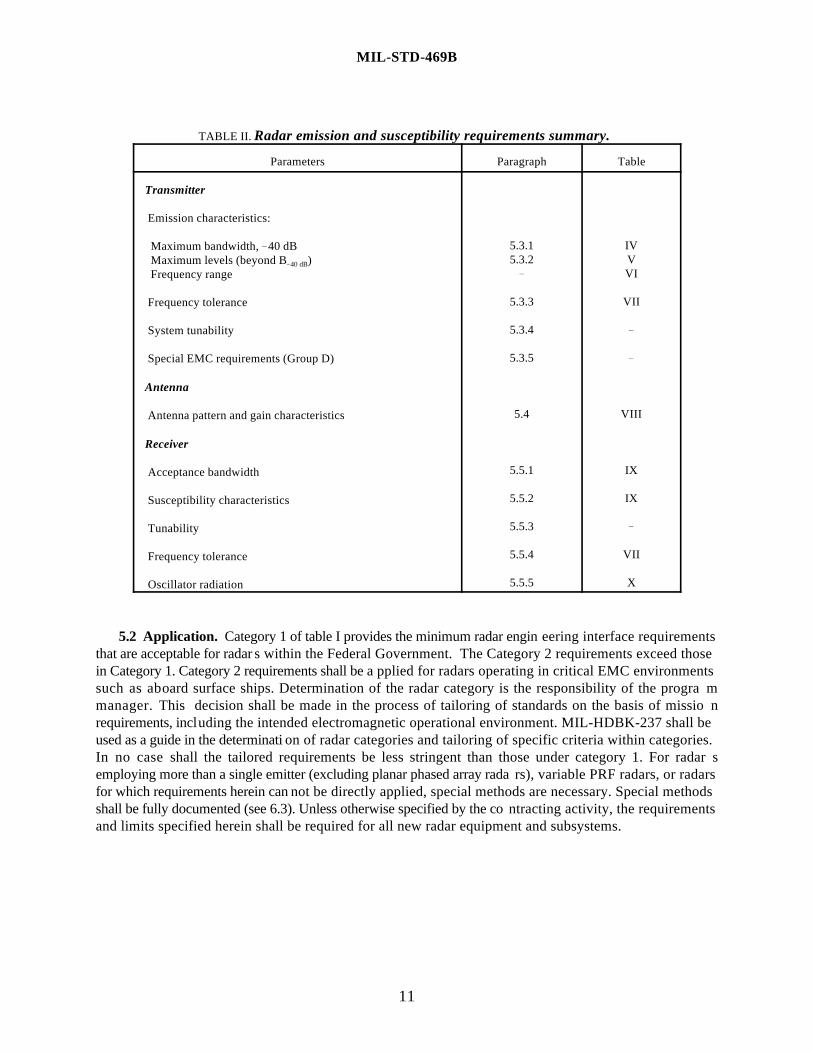
TABLE II. Radar emission and susceptibility requirements summary.
Parameters Paragraph Table
Transmitter
Emission characteristics:
Maximum bandwidth, 40 dB Maximum levels (beyond B )40 dB
Frequency range
Frequency tolerance
System tunability
Special EMC requirements (Group D)
Antenna
Antenna pattern and gain characteristics
Receiver
Acceptance bandwidth
Susceptibility characteristics
Tunability
Frequency tolerance
Oscillator radiation
5.3.1 IV5.3.2 V
VI
5.3.3 VII
5.3.4
5.3.5
5.4 VIII
5.5.1 IX
5.5.2 IX
5.5.3
5.5.4 VII
5.5.5 X
5.2 Application. Category 1 of table I provides the minimum radar engin eering interface requirementsthat are acceptable for radar s within the Federal Government. The Category 2 requirements exceed thosein Category 1. Category 2 requirements shall be a pplied for radars operating in critical EMC environmentssuch as aboard surface ships. Determination of the radar category is the responsibility of the progra mmanager. This decision shall be made in the process of tailoring of standards on the basis of missio nrequirements, including the intended electromagnetic operational environment. MIL-HDBK-237 shall beused as a guide in the determinati on of radar categories and tailoring of specific criteria within categories.In no case shall the tailored requirements be less stringent than those under category 1. For radar semploying more than a single emitter (excluding planar phased array rada rs), variable PRF radars, or radarsfor which requirements herein can not be directly applied, special methods are necessary. Special methodsshall be fully documented (see 6.3). Unless otherwise specified by the co ntracting activity, the requirementsand limits specified herein shall be required for all new radar equipment and subsystems.
MIL-STD-469B
12
5.2.1 Special application. In the special case where government radio navigation radars operate inthe shared government/non-government band 9300-9500 MHz, an acceptable degree of EMC is deemedto be that degree of compatibility associated with commer cial-off-the-shelf (COTS) or non-developmentalitem (NDI) radar equipment. The vast prepondera nce of the use of this band by non-government domesticand foreign ships and aircra ft creates a situation where relatively inexpensive COTS or NDI equipment isavailable and at the same time equipment improvements w hich might be incorporated unilaterally by smallnumbers of government stations would hav e little effect on the band as a whole. Accordingly, governmentradio navigation radars to be operated in this band, having a rat ed peak power of 100 kW or less, are placedin group A with the understandi ng that government agencies would procure COTS or NDI equipment andthat this exemption will be re-examined should the situation in this band change.
5.2.2 Application determination. The requirements under group B shall be applied to class 1Spacebased radar systems on a case by case basis as determined by the contracting activity. Th erequirements under group B or group C shall be determined by the contracting activity for application, ona case by case basis, to class 2 Spacebased radar systems and active spaceborne sensors.
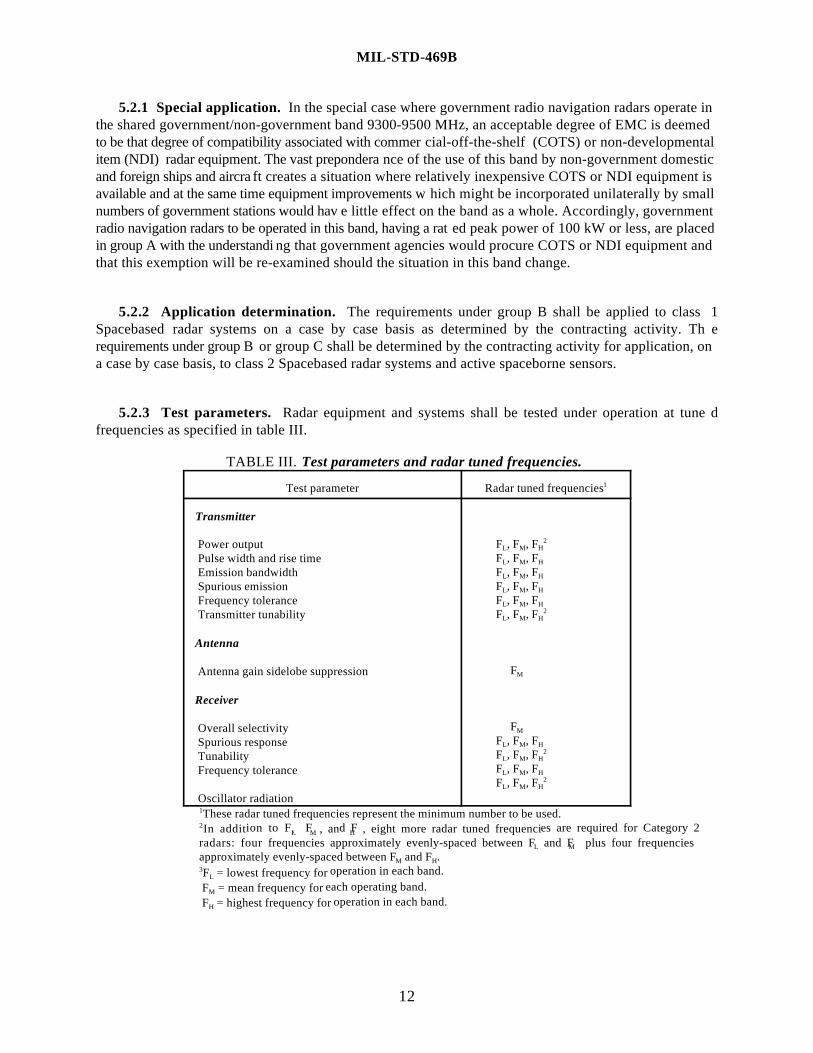
5.2.3 Test parameters. Radar equipment and systems shall be tested under operation at tune dfrequencies as specified in table III.
TABLE III. Test parameters and radar tuned frequencies.
Test parameter Radar tuned frequencies1
Transmitter Power output Pulse width and rise time Emission bandwidth Spurious emission Frequency tolerance Transmitter tunability
Antenna
Antenna gain sidelobe suppression
Receiver
Overall selectivity Spurious response Tunability Frequency tolerance
Oscillator radiation
F , F , FL M H2
F , F , FL M H
F , F , FL M H
F , F , FL M H
F , F , FL M H
F , F , FL M H2
FM
FM
F , F , FL M H
F , F , FL M H2
F , F , FL M H
F , F , FL M H2
These radar tuned frequencies represent the minimum number to be used.1
ion to F F d F es are required for Category 2 In addit , 2L M H, an , eight more radar tuned frequenci
radars: four frequencies approximately evenly-spaced between F and F plus four frequencies L M
approximately evenly-spaced between F and F .M H
operation in each band.F3L = lowest frequency for
each operating band. F = mean frequency forM
operation in each band. F = highest frequency forH
MIL-STD-469B
13
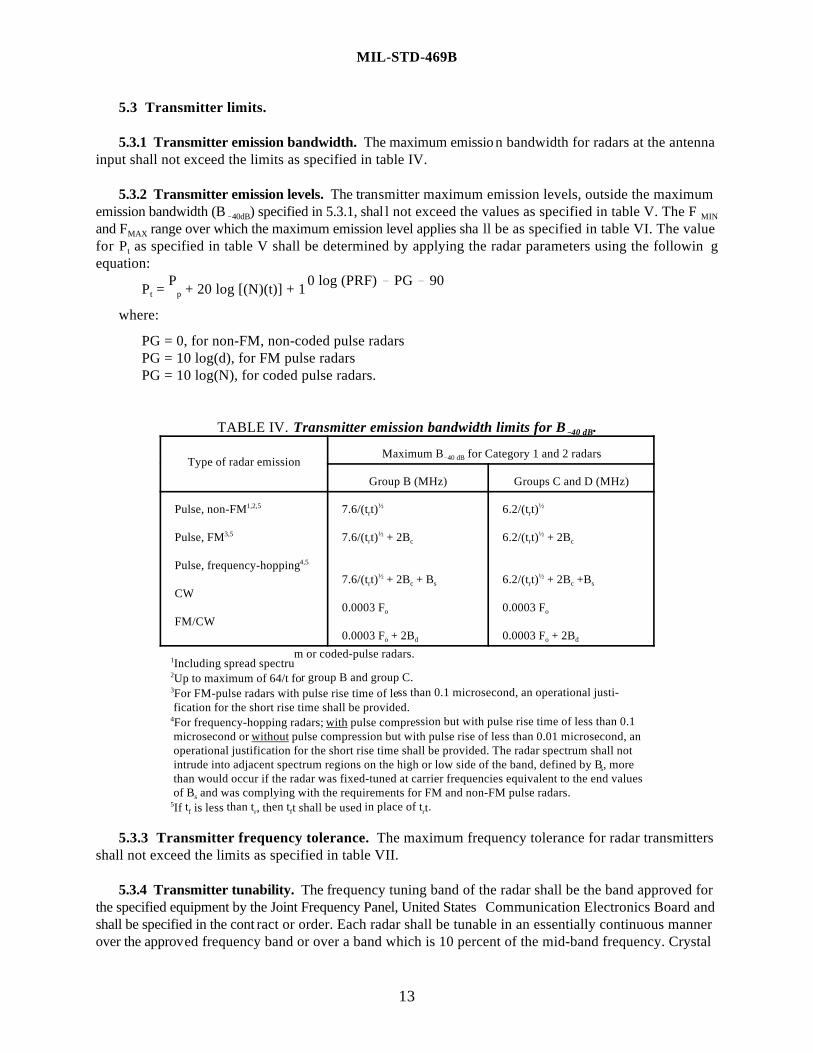
5.3 Transmitter limits.
5.3.1 Transmitter emission bandwidth. The maximum emission bandwidth for radars at the antennainput shall not exceed the limits as specified in table IV.
5.3.2 Transmitter emission levels. The transmitter maximum emission levels, outside the maximumemission bandwidth (B ) specified in 5.3.1, shal l not exceed the values as specified in table V. The F40dB MIN
and F range over which the maximum emission level applies sha ll be as specified in table VI. The valueMAX
for P as specified in table V shall be determined by applying the radar parameters using the followin gt
equation: P 0 log (PRF) PG 90 P = + 20 log [(N)(t)] + 1t p
where:
PG = 0, for non-FM, non-coded pulse radars PG = 10 log(d), for FM pulse radars PG = 10 log(N), for coded pulse radars.
TABLE IV. Transmitter emission bandwidth limits for B .40 dB
Type of radar emissionMaximum B for Category 1 and 2 radars40 dB
Group B (MHz) Groups C and D (MHz)
Pulse, non-FM 7.6/(t t) 6.2/(t t)1,2,5
Pulse, FM 7.6/(t t) + 2B 6.2/(t t) + 2B3,5
Pulse, frequency-hopping4,5
CW
FM/CW
r½
r c½
7.6/(t t) + 2B + B 6.2/(t t) + 2B +Br c s½
0.0003 F 0.0003 Fo
0.0003 F + 2B 0.0003 F + 2Bo d
r½
r c½
r c s½
o
o d
m or coded-pulse radars.Including spread spectru1
r group B and group C. Up to maximum of 64/t fo2
ss than 0.1 microsecond, an operational justi-For FM-pulse radars with pulse rise time of le3
fication for the short rise time shall be provided. ssion but with pulse rise time of less than 0.1For frequency-hopping radars; with pulse compre4
microsecond or without pulse compression but with pulse rise of less than 0.01 microsecond, an operational justification for the short rise time shall be provided. The radar spectrum shall not intrude into adjacent spectrum regions on the high or low side of the band, defined by B, mores
than would occur if the radar was fixed-tuned at carrier frequencies equivalent to the end values of B and was complying with the requirements for FM and non-FM pulse radars. s
t than t en t in place of t .If is less5f r f r, th t shall be used t
5.3.3 Transmitter frequency tolerance. The maximum frequency tolerance for radar transmittersshall not exceed the limits as specified in table VII.
5.3.4 Transmitter tunability. The frequency tuning band of the radar shall be the band approved forthe specified equipment by the Joint Frequency Panel, United States Communication Electronics Board andshall be specified in the cont ract or order. Each radar shall be tunable in an essentially continuous mannerover the approved frequency band or over a band which is 10 percent of the mid-band frequency. Crystal
0.5B -40 dB
B -40 dB
X dB
F MIN
Pt
Pt -40 dB
F MAX
B -X dB
F 0
MIL-STD-469B
14
controlled radars conform to this requirement if operation at any f requency across the band can be achievedwith a crystal change. Radar systems under group D shall be tunable continuously over the entire 2700 to2900 MHz band.
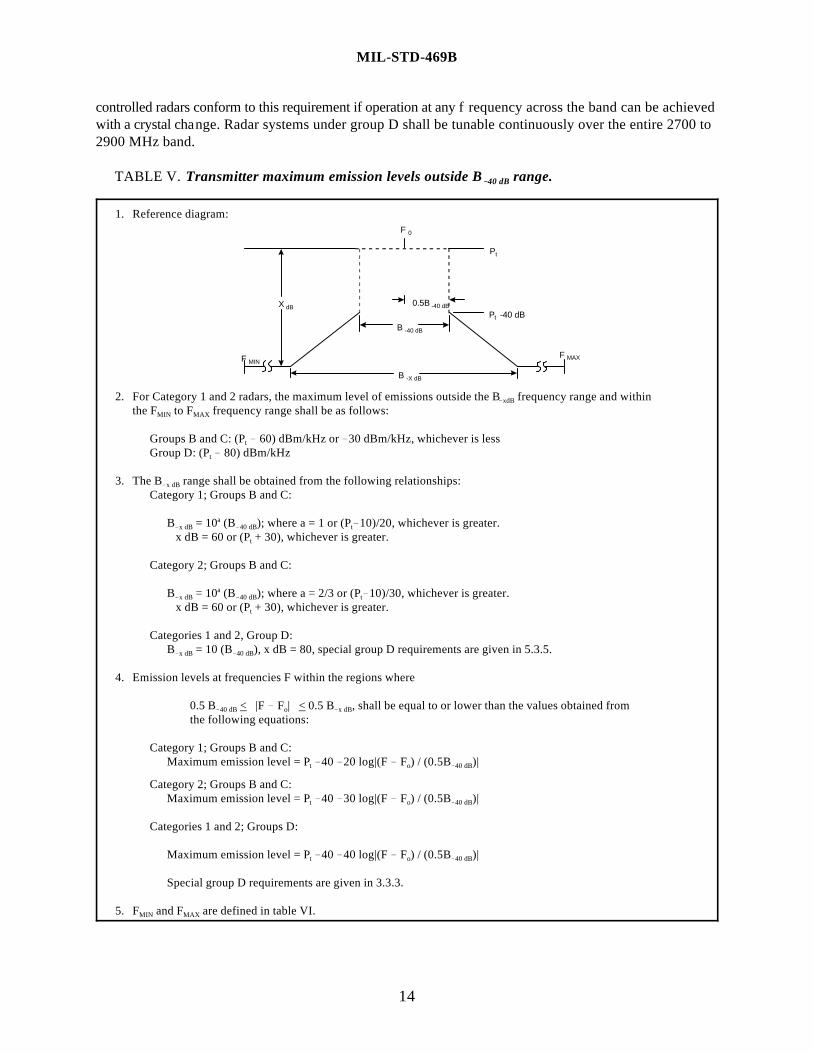
TABLE V. Transmitter maximum emission levels outside B range.40 dB
1. Reference diagram:
2. For Category 1 and 2 radars, the maximum level of emissions outside the B frequency range and withinxdB
the F to F frequency range shall be as follows:MIN MAX
Groups B and C: (P 60) dBm/kHz or 30 dBm/kHz, whichever is less t
Group D: (P 80) dBm/kHzt
3. The B range shall be obtained from the following relationships: x dB
Category 1; Groups B and C:
B = 10 (B ); where a = 1 or (P 10)/20, whichever is greater.x dB 40 dB ta
x dB = 60 or (P + 30), whichever is greater.t
Category 2; Groups B and C:
B = 10 (B ); where a = 2/3 or (P 10)/30, whichever is greater.x dB 40 dB ta
x dB = 60 or (P + 30), whichever is greater.t
Categories 1 and 2, Group D:B = 10 (B ), x dB = 80, special group D requirements are given in 5.3.5.x dB 40 dB
4. Emission levels at frequencies F within the regions where
0.5 B < |F F | < 0.5 B , shall be equal to or lower than the values obtained from40 dB o x dB
the following equations:
Category 1; Groups B and C: Maximum emission level = P 40 20 log|(F F ) / (0.5B )|t o 40 dB
Category 2; Groups B and C:
Maximum emission level = P 40 30 log|(F F ) / (0.5B )| t o 40 dB
Categories 1 and 2; Groups D:
Maximum emission level = P 40 40 log|(F F ) / (0.5B )| t o 40 dB
Special group D requirements are given in 3.3.3.
5. F and F are defined in table VI. MIN MAX
MIL-STD-469B
15
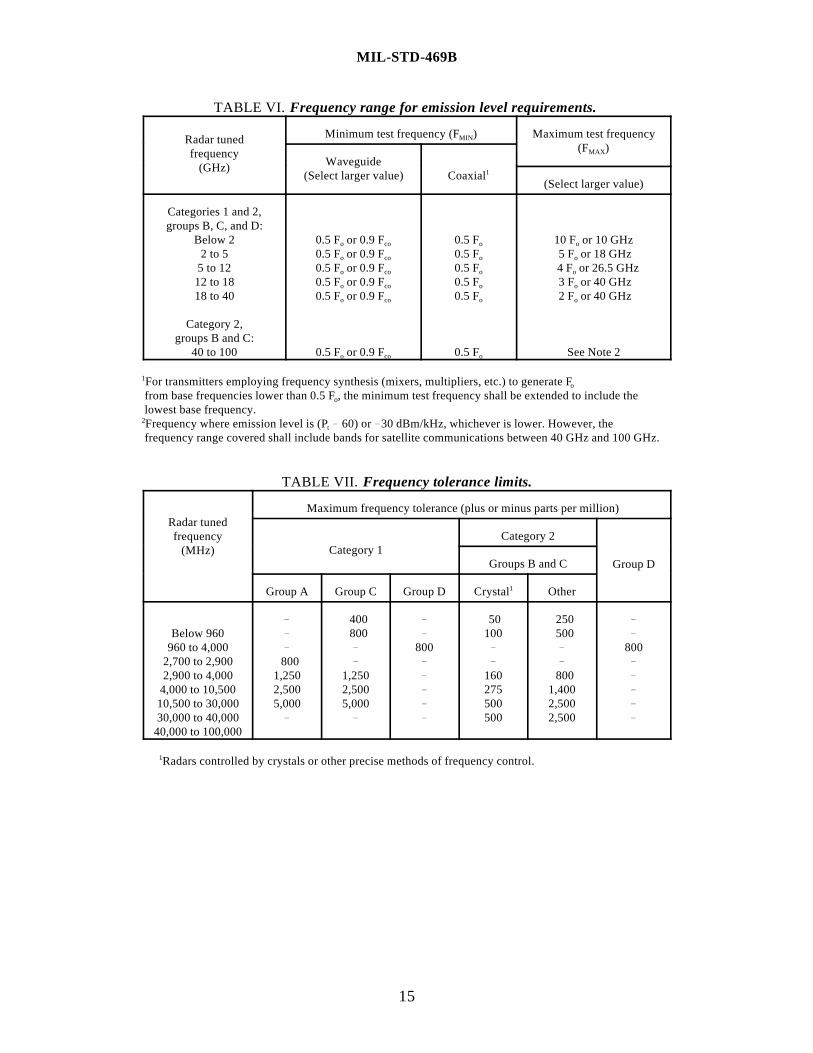
TABLE VI. Frequency range for emission level requirements.
Minimum test frequency (F ) Maximum test frequencyRadar tuned(F )frequency
(GHz)
MIN
MAX
Waveguide(Select larger value) Coaxial1
(Select larger value)
Categories 1 and 2,groups B, C, and D:
Below 2 0.5 F or 0.9 F 0.5 F 10 F or 10 GHz2 to 5 0.5 F or 0.9 F 0.5 F 5 F or 18 GHz
5 to 12 0.5 F or 0.9 F 0.5 F 4 F or 26.5 GHz12 to 18 0.5 F or 0.9 F 0.5 F 3 F or 40 GHz18 to 40 0.5 F or 0.9 F 0.5 F 2 F or 40 GHz
Category 2,groups B and C:
40 to 100 0.5 F or 0.9 F 0.5 F See Note 2
o co
o co
o co
o co
o co
o co
o
o
o
o
o
o
o
o
o
o
o
For transmitters employing frequency synthesis (mixers, multipliers, etc.) to generate F1
o
from base frequencies lower than 0.5 F , the minimum test frequency shall be extended to include theo
lowest base frequency.Frequency where emission level is (P 60) or 30 dBm/kHz, whichever is lower. However, the2
t
frequency range covered shall include bands for satellite communications between 40 GHz and 100 GHz.
TABLE VII. Frequency tolerance limits.
Radar tunedfrequency
(MHz)
Maximum frequency tolerance (plus or minus parts per million)
Category 1Category 2
Group DGroups B and C
Group A Group C Group D Crystal Other1
Below 960 800 100 500960 to 4,000 800 800
2,700 to 2,900 8002,900 to 4,000 1,250 1,250 160 800
4,000 to 10,500 2,500 2,500 275 1,40010,500 to 30,000 5,000 5,000 500 2,50030,000 to 40,000 500 2,500
40,000 to 100,000
400 50 250
Radars controlled by crystals or other precise methods of frequency control.1
MIL-STD-469B
16
5.3.5 Special EMC requirements, group D radars. Radar systems in the 2700 to 2900 MHz ban d(Group D) which operate in close proximity to other equipment in this band or operate in areas specifiedin Annex D of the NTIA Manual shall be designed and constructed to permit, without modification to thebasic equipment, field incorporation of system EMC provisions. These provisions include the followingrequirements and recommendations:
a. Emission levels. The radar emission levels at the antenna input shall be not greater than the valuesobtainable from the curves in table V. At the frequency ±B /2 displaced from F , the level shall( 40 dB) o
be at least 40 dB below the maximum value. Beyond the frequencies ±B /2 from F , the( 40 dB) o
equipment shall have the capability to achieve at least the 80 dB per decade roll-off lines of tableV. The emission levels shall be below the a ppropriate dB per decade roll-off lines of table V downto a x dB level that is 80 dB below the maximum power density.
b. Radar system PRF. The radar system shall be designed to operate with an adjustable puls erepetition frequency(s) (PRFs), with a nominal difference of plus or minus 1 percent (minimum).This will permit the selection of PRF's to allow certain types of receiver interference suppressioncircuitry to be effective.
c. Receiver interference suppression circuitry. Radar systems in this band shall have provision sincorporated into the system to suppress pulsed inter ference. The following information is intendedfor use as an aid in the design and development of receiver signal processing circuitry or softwareto suppress ac pulsed interference. A description of the parametric range of the expecte denvironmental signal characteristics at the receiver IF output is:
Peak interference-to-noise ratio: < 50 dB Pulse width: 0.5 to 4.0 sec
PRF: 100 to 2000 pps
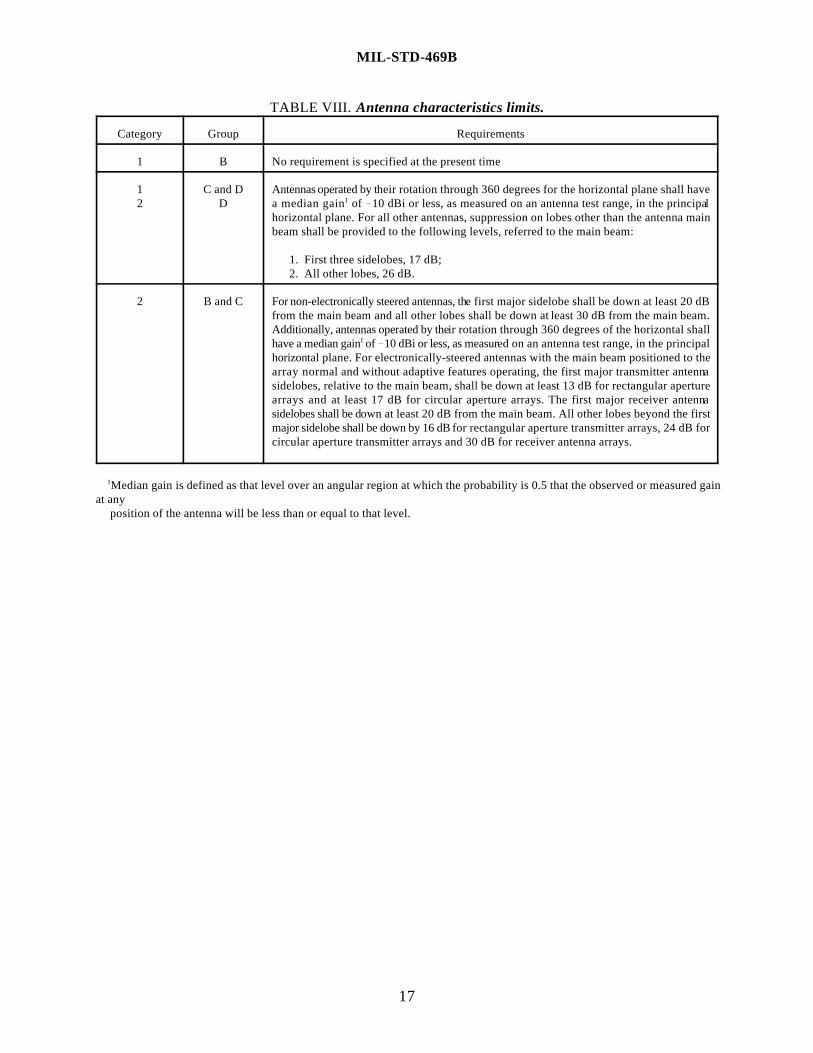
5.4 Antenna limits. The radar antenna characteristics shall s atisfy the requirements as specified in tableVIII.
5.5 Receiver limits.
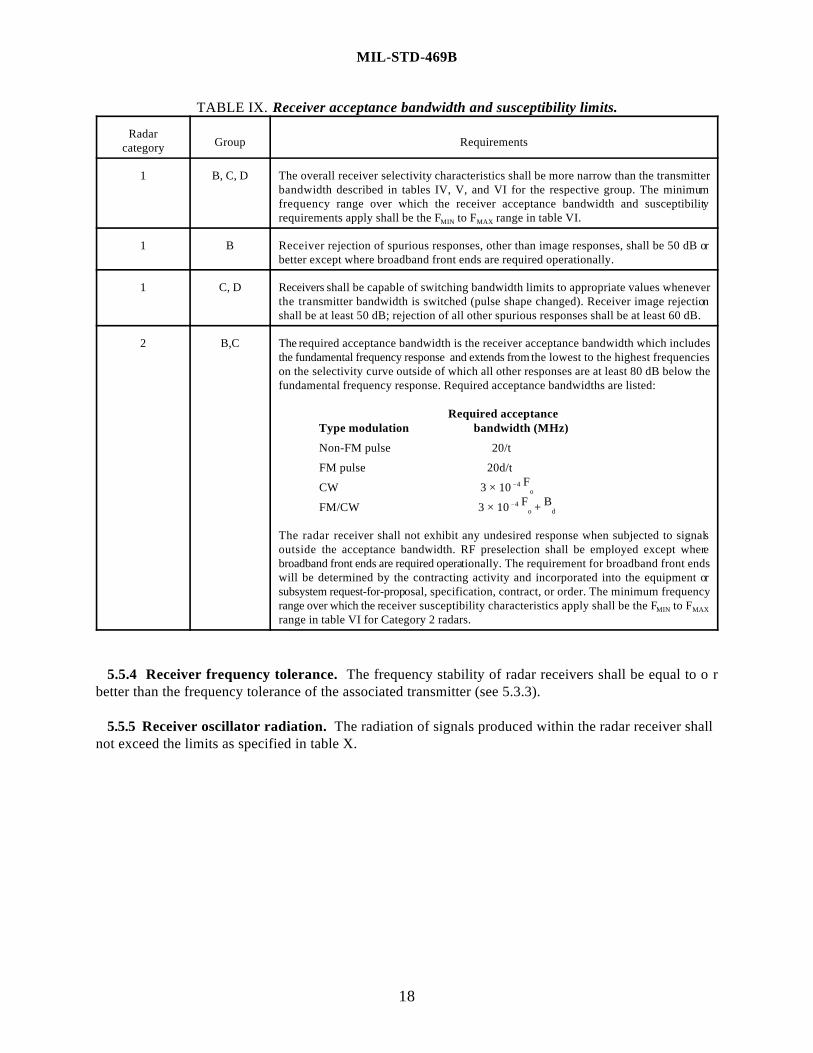
5.5.1 Receiver acceptance bandwidth. The radar receiving system required acceptance bandwidthsshall be as specified in table IX.
5.5.2 Receiver susceptibility characteristics. The rejection of signals outside the required receive racceptance bandwidth shall be equal to or greater than the values as specified in table IX for the designatedradar category and group.
5.5.3 Receiver tunability. The tunability of the radar receiver shall be commensurate with that of theassociated radar transmitter. Requirements for radar transmitters shall be as specified in 5.3.4.
MIL-STD-469B
17
TABLE VIII. Antenna characteristics limits.
Category Group Requirements
1 B No requirement is specified at the present time
1 C and D Antennas operated by their rotation through 360 degrees for the horizontal plane shall have2 D a median gain of 10 dBi or less, as measured on an antenna test range, in the principal1
horizontal plane. For all other antennas, suppression on lobes other than the antenna mainbeam shall be provided to the following levels, referred to the main beam:
1. First three sidelobes, 17 dB; 2. All other lobes, 26 dB.
2 B and C For non-electronically steered antennas, the first major sidelobe shall be down at least 20 dBfrom the main beam and all other lobes shall be down at least 30 dB from the main beam.Additionally, antennas operated by their rotation through 360 degrees of the horizontal shallhave a median gain of 10 dBi or less, as measured on an antenna test range, in the principal1
horizontal plane. For electronically-steered antennas with the main beam positioned to thearray normal and without adaptive features operating, the first major transmitter antennasidelobes, relative to the main beam, shall be down at least 13 dB for rectangular aperturearrays and at least 17 dB for circular aperture arrays. The first major receiver antennasidelobes shall be down at least 20 dB from the main beam. All other lobes beyond the firstmajor sidelobe shall be down by 16 dB for rectangular aperture transmitter arrays, 24 dB forcircular aperture transmitter arrays and 30 dB for receiver antenna arrays.
Median gain is defined as that level over an angular region at which the probability is 0.5 that the observed or measured gain1
at any position of the antenna will be less than or equal to that level.
MIL-STD-469B
18
TABLE IX. Receiver acceptance bandwidth and susceptibility limits.
Radarcategory Group Requirements
1 B, C, D The overall receiver selectivity characteristics shall be more narrow than the transmitterbandwidth described in tables IV, V, and VI for the respective group. The minimumfrequency range over which the receiver acceptance bandwidth and susceptibilityrequirements apply shall be the F to F range in table VI.MIN MAX
1 B Receiver rejection of spurious responses, other than image responses, shall be 50 dB orbetter except where broadband front ends are required operationally.
1 C, D Receivers shall be capable of switching bandwidth limits to appropriate values wheneverthe transmitter bandwidth is switched (pulse shape changed). Receiver image rejectionshall be at least 50 dB; rejection of all other spurious responses shall be at least 60 dB.
2 B,C The required acceptance bandwidth is the receiver acceptance bandwidth which includesthe fundamental frequency response and extends from the lowest to the highest frequencieson the selectivity curve outside of which all other responses are at least 80 dB below thefundamental frequency response. Required acceptance bandwidths are listed:
Required acceptance Type modulation bandwidth (MHz)
Non-FM pulse 20/t
FM pulse 20d/tF CW 3 × 10 4
o
F B FM/CW 3 × 10 +4o d
The radar receiver shall not exhibit any undesired response when subjected to signalsoutside the acceptance bandwidth. RF preselection shall be employed except wherebroadband front ends are required operationally. The requirement for broadband front endswill be determined by the contracting activity and incorporated into the equipment orsubsystem request-for-proposal, specification, contract, or order. The minimum frequencyrange over which the receiver susceptibility characteristics apply shall be the F to FMIN MAX
range in table VI for Category 2 radars.
5.5.4 Receiver frequency tolerance. The frequency stability of radar receivers shall be equal to o r
better than the frequency tolerance of the associated transmitter (see 5.3.3).
5.5.5 Receiver oscillator radiation. The radiation of signals produced within the radar receiver shallnot exceed the limits as specified in table X.
MIL-STD-469B
19
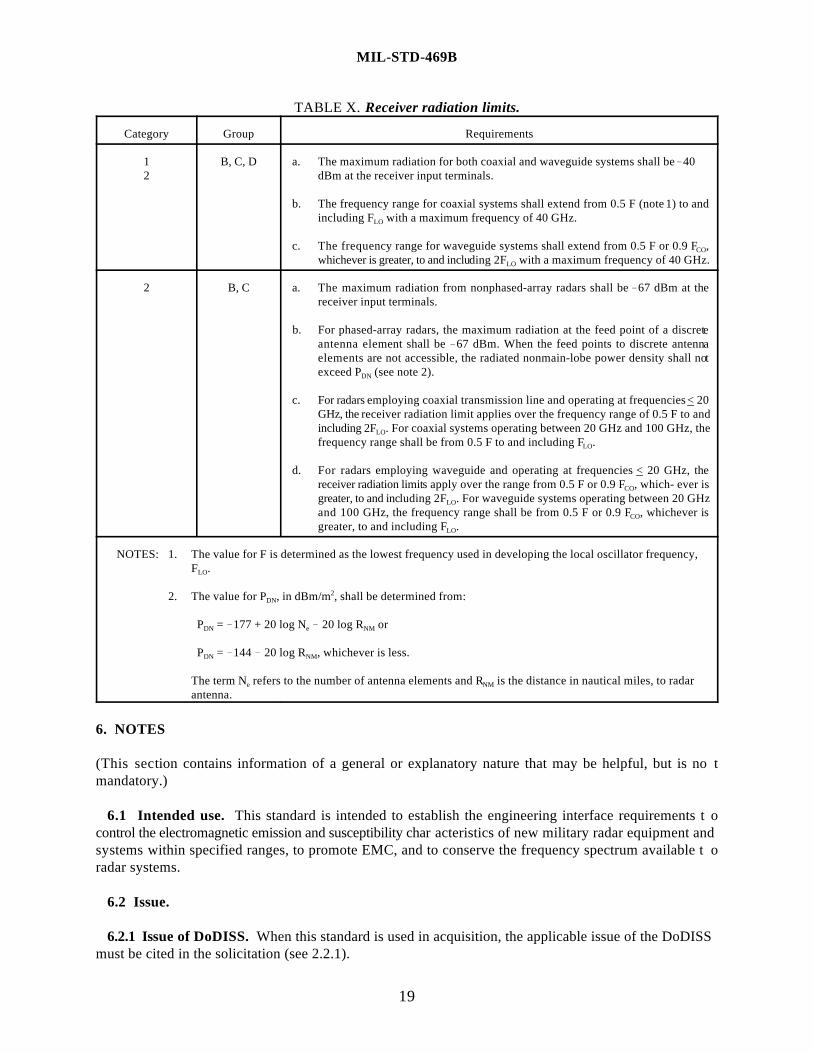
TABLE X. Receiver radiation limits.
Category Group Requirements
1 B, C, D a. The maximum radiation for both coaxial and waveguide systems shall be 402 dBm at the receiver input terminals.
b. The frequency range for coaxial systems shall extend from 0.5 F (note 1) to andincluding F with a maximum frequency of 40 GHz.LO
c. The frequency range for waveguide systems shall extend from 0.5 F or 0.9 F ,CO
whichever is greater, to and including 2F with a maximum frequency of 40 GHz.LO
2 B, C a. The maximum radiation from nonphased-array radars shall be 67 dBm at thereceiver input terminals.
b. For phased-array radars, the maximum radiation at the feed point of a discreteantenna element shall be 67 dBm. When the feed points to discrete antennaelements are not accessible, the radiated nonmain-lobe power density shall notexceed P (see note 2). DN
c. For radars employing coaxial transmission line and operating at frequencies < 20GHz, the receiver radiation limit applies over the frequency range of 0.5 F to andincluding 2F . For coaxial systems operating between 20 GHz and 100 GHz, theLO
frequency range shall be from 0.5 F to and including F .LO
d. For radars employing waveguide and operating at frequencies < 20 GHz, thereceiver radiation limits apply over the range from 0.5 F or 0.9 F , which- ever isCO
greater, to and including 2F . For waveguide systems operating between 20 GHzLO
and 100 GHz, the frequency range shall be from 0.5 F or 0.9 F , whichever isCO
greater, to and including F .LO
NOTES: 1. The value for F is determined as the lowest frequency used in developing the local oscillator frequency,F .LO
2. The value for P , in dBm/m , shall be determined from:DN2
P = 177 + 20 log N 20 log R orDN e NM
P = 144 20 log R , whichever is less.DN NM
The term N refers to the number of antenna elements and R is the distance in nautical miles, to radare NM
antenna.
6. NOTES
(This section contains information of a general or explanatory nature that may be helpful, but is no tmandatory.)
6.1 Intended use. This standard is intended to establish the engineering interface requirements t ocontrol the electromagnetic emission and susceptibility char acteristics of new military radar equipment andsystems within specified ranges, to promote EMC, and to conserve the frequency spectrum available t oradar systems.
6.2 Issue.
6.2.1 Issue of DoDISS. When this standard is used in acquisition, the applicable issue of the DoDISSmust be cited in the solicitation (see 2.2.1).
MIL-STD-469B
20
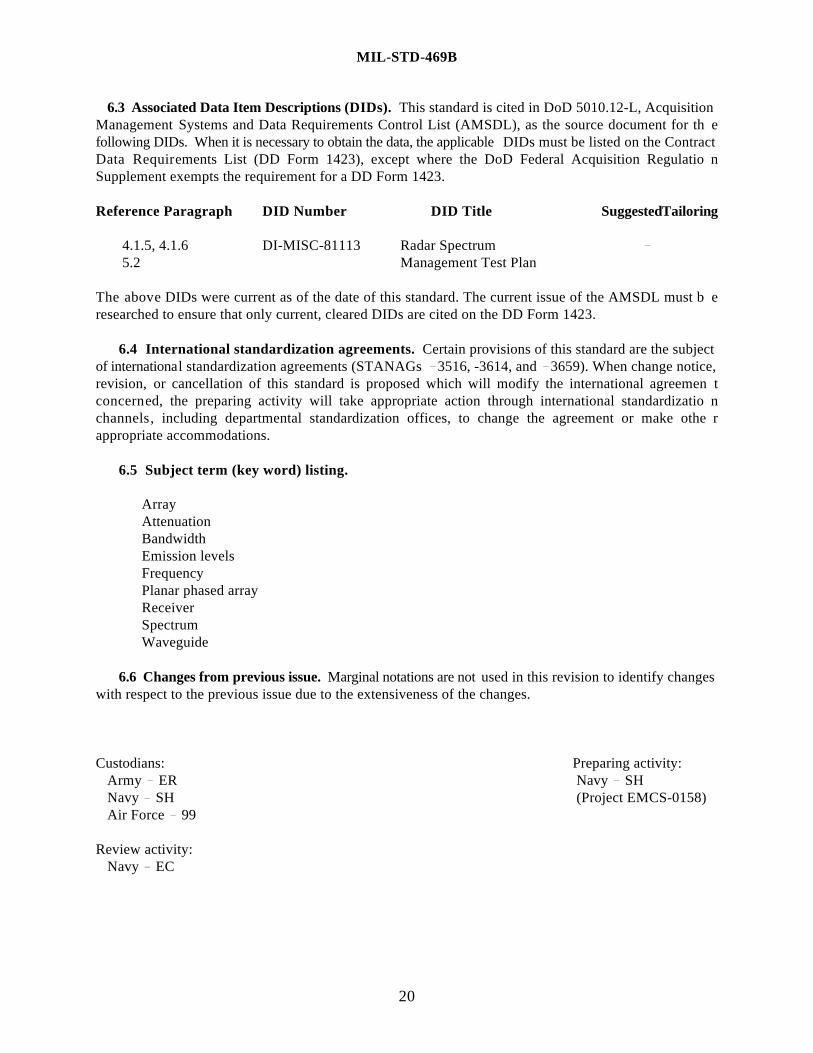
6.3 Associated Data Item Descriptions (DIDs). This standard is cited in DoD 5010.12-L, AcquisitionManagement Systems and Data Requirements Control List (AMSDL), as the source document for th efollowing DIDs. When it is necessary to obtain the data, the applicable DIDs must be listed on the ContractData Requirements List (DD Form 1423), except where the DoD Federal Acquisition Regulatio nSupplement exempts the requirement for a DD Form 1423.
Reference Paragraph DID Number DID Title Suggested Tailoring
4.1.5, 4.1.6 DI-MISC-81113 Radar Spectrum 5.2 Management Test Plan
The above DIDs were current as of the date of this standard. The current issue of the AMSDL must b eresearched to ensure that only current, cleared DIDs are cited on the DD Form 1423.
6.4 International standardization agreements. Certain provisions of this standard are the subjectof international standardization agreements (STANAGs 3516, -3614, and 3659). When change notice,revision, or cancellation of this standard is proposed which will modify the international agreemen tconcerned, the preparing activity will take appropriate action through international standardizatio nchannels, including departmental standardization offices, to change the agreement or make othe rappropriate accommodations.
6.5 Subject term (key word) listing.
ArrayAttenuationBandwidthEmission levelsFrequency Planar phased arrayReceiverSpectrumWaveguide
6.6 Changes from previous issue. Marginal notations are not used in this revision to identify changeswith respect to the previous issue due to the extensiveness of the changes.
Custodians: Preparing activity:Army ER Navy SHNavy SH (Project EMCS-0158)Air Force 99
Review activity:Navy EC
MIL-STD-469B
21
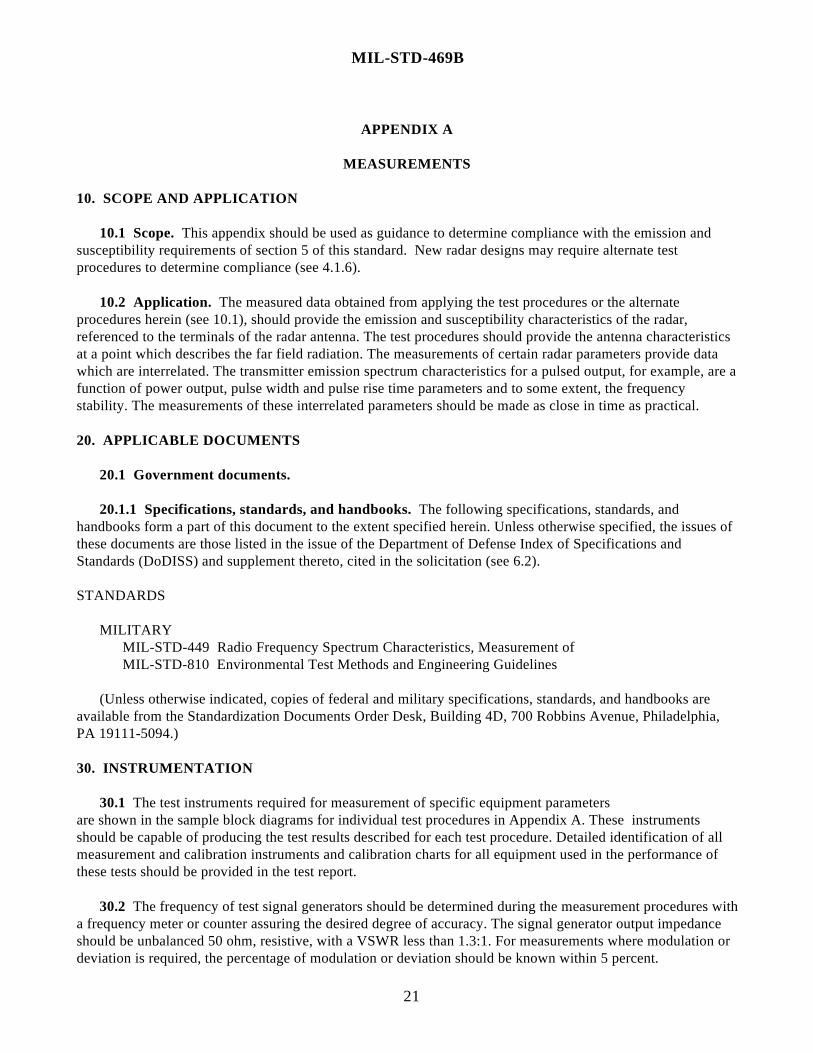
APPENDIX A
MEASUREMENTS
10. SCOPE AND APPLICATION
10.1 Scope. This appendix should be used as guidance to determine compliance with the emission andsusceptibility requirements of section 5 of this standard. New radar designs may require alternate testprocedures to determine compliance (see 4.1.6).
10.2 Application. The measured data obtained from applying the test procedures or the alternateprocedures herein (see 10.1), should provide the emission and susceptibility characteristics of the radar,referenced to the terminals of the radar antenna. The test procedures should provide the antenna characteristicsat a point which describes the far field radiation. The measurements of certain radar parameters provide datawhich are interrelated. The transmitter emission spectrum characteristics for a pulsed output, for example, are afunction of power output, pulse width and pulse rise time parameters and to some extent, the frequencystability. The measurements of these interrelated parameters should be made as close in time as practical.
20. APPLICABLE DOCUMENTS
20.1 Government documents.
20.1.1 Specifications, standards, and handbooks. The following specifications, standards, andhandbooks form a part of this document to the extent specified herein. Unless otherwise specified, the issues ofthese documents are those listed in the issue of the Department of Defense Index of Specifications andStandards (DoDISS) and supplement thereto, cited in the solicitation (see 6.2).
STANDARDS
MILITARYMIL-STD-449 Radio Frequency Spectrum Characteristics, Measurement ofMIL-STD-810 Environmental Test Methods and Engineering Guidelines
(Unless otherwise indicated, copies of federal and military specifications, standards, and handbooks areavailable from the Standardization Documents Order Desk, Building 4D, 700 Robbins Avenue, Philadelphia,PA 19111-5094.)
30. INSTRUMENTATION
30.1 The test instruments required for measurement of specific equipment parameters are shown in the sample block diagrams for individual test procedures in Appendix A. These instrumentsshould be capable of producing the test results described for each test procedure. Detailed identification of allmeasurement and calibration instruments and calibration charts for all equipment used in the performance ofthese tests should be provided in the test report.
30.2 The frequency of test signal generators should be determined during the measurement procedures witha frequency meter or counter assuring the desired degree of accuracy. The signal generator output impedanceshould be unbalanced 50 ohm, resistive, with a VSWR less than 1.3:1. For measurements where modulation ordeviation is required, the percentage of modulation or deviation should be known within 5 percent.
MIL-STD-469B APPENDIX A
22
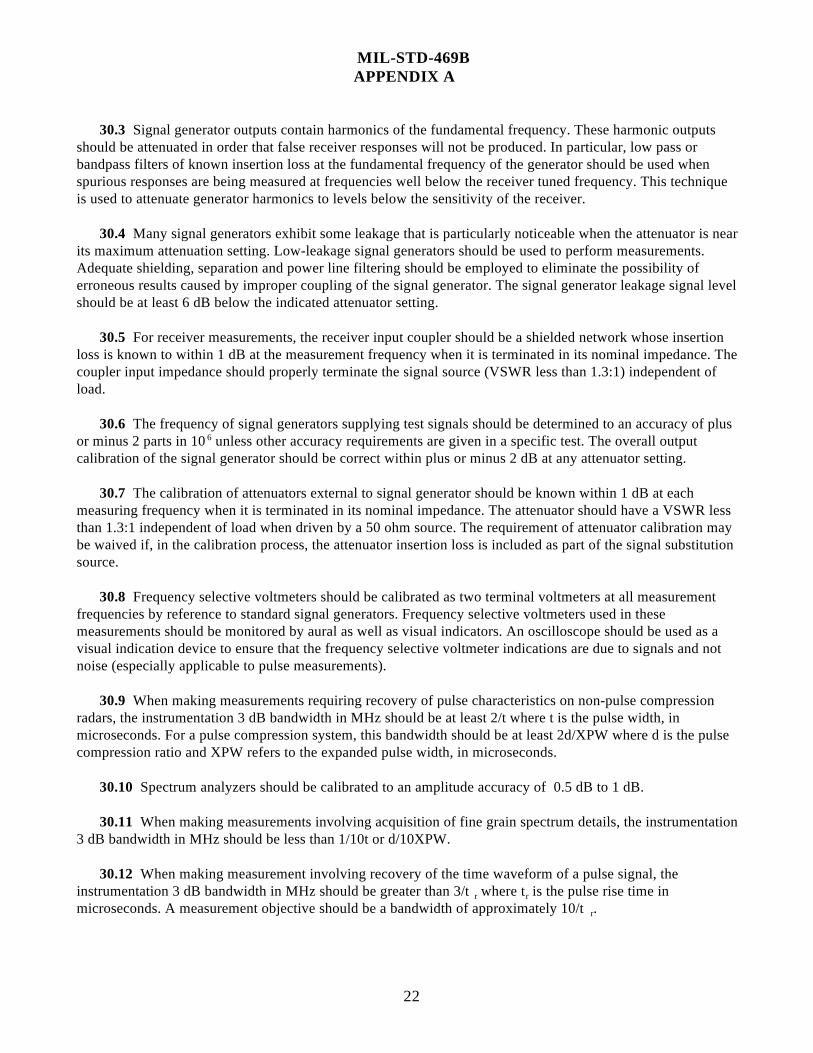
30.3 Signal generator outputs contain harmonics of the fundamental frequency. These harmonic outputsshould be attenuated in order that false receiver responses will not be produced. In particular, low pass orbandpass filters of known insertion loss at the fundamental frequency of the generator should be used whenspurious responses are being measured at frequencies well below the receiver tuned frequency. This techniqueis used to attenuate generator harmonics to levels below the sensitivity of the receiver.
30.4 Many signal generators exhibit some leakage that is particularly noticeable when the attenuator is nearits maximum attenuation setting. Low-leakage signal generators should be used to perform measurements. Adequate shielding, separation and power line filtering should be employed to eliminate the possibility oferroneous results caused by improper coupling of the signal generator. The signal generator leakage signal levelshould be at least 6 dB below the indicated attenuator setting.
30.5 For receiver measurements, the receiver input coupler should be a shielded network whose insertionloss is known to within 1 dB at the measurement frequency when it is terminated in its nominal impedance. Thecoupler input impedance should properly terminate the signal source (VSWR less than 1.3:1) independent ofload.
30.6 The frequency of signal generators supplying test signals should be determined to an accuracy of plusor minus 2 parts in 10 unless other accuracy requirements are given in a specific test. The overall output6
calibration of the signal generator should be correct within plus or minus 2 dB at any attenuator setting.
30.7 The calibration of attenuators external to signal generator should be known within 1 dB at eachmeasuring frequency when it is terminated in its nominal impedance. The attenuator should have a VSWR lessthan 1.3:1 independent of load when driven by a 50 ohm source. The requirement of attenuator calibration maybe waived if, in the calibration process, the attenuator insertion loss is included as part of the signal substitutionsource.
30.8 Frequency selective voltmeters should be calibrated as two terminal voltmeters at all measurementfrequencies by reference to standard signal generators. Frequency selective voltmeters used in thesemeasurements should be monitored by aural as well as visual indicators. An oscilloscope should be used as avisual indication device to ensure that the frequency selective voltmeter indications are due to signals and notnoise (especially applicable to pulse measurements).
30.9 When making measurements requiring recovery of pulse characteristics on non-pulse compressionradars, the instrumentation 3 dB bandwidth in MHz should be at least 2/t where t is the pulse width, inmicroseconds. For a pulse compression system, this bandwidth should be at least 2d/XPW where d is the pulsecompression ratio and XPW refers to the expanded pulse width, in microseconds.
30.10 Spectrum analyzers should be calibrated to an amplitude accuracy of 0.5 dB to 1 dB.
30.11 When making measurements involving acquisition of fine grain spectrum details, the instrumentation3 dB bandwidth in MHz should be less than 1/10t or d/10XPW.
30.12 When making measurement involving recovery of the time waveform of a pulse signal, theinstrumentation 3 dB bandwidth in MHz should be greater than 3/t where t is the pulse rise time inr r
microseconds. A measurement objective should be a bandwidth of approximately 10/t .r
MIL-STD-469B APPENDIX A
23
30.13 For transmitter testing a sampling device should be used, where needed, to measure the output levelof each signal component emitted. The coupling factor of the device should be known within 1 dB at eachmeasurement frequency. The requirement for sampling device calibration should be waived if the devicecoupling loss is included when signal levels are substituted for calibration levels.
30.14 Power meters used for measuring the sampled output from transmitters, measuring reference outputsfrom signal generators, or other power measurements, should have a full scale accuracy within 5 percent of theindicated power.
30.15 Radar operation.
30.15.1 Condition for measurements. The equipment to be measured should be set up so that it closelyapproximates the normal operating conditions. The steps specified in the operation and maintenance portions ofthe radar technical manual should be performed prior to the measurements. The equipment should be aligned inaccordance with the pertinent instructions, such that it is represented under normal operating conditions, notdeliberately optimized at specific operating frequencies used in the measurements.
30.15.2 Radar tuned frequencies. Measurements should be made with the radar tuned to each of thefrequencies as specified in table III for the appropriate radar category. If the radar operates over more than onefrequency band, that is, multiple bands, the criteria for selecting radar tuned frequencies should be applied toeach band.
30.16 Test sites.
30.16.1 Selection criteria. In the receiver measurements for both coaxial and waveguide systems, the testsite should normally be in the vicinity of the radar system. This location provides for convenient injection oftest signals and extraction of signal outputs during the measurement of receiver parameters. The transmitterrequirements refer to the radar antenna terminals. Therefore, the measurement of transmitter signals should bemade as close as practical to the antenna terminals. The transmitter output test points should be selected as theplane of reference for transmitter measurements in the following order of preference:
a. Closed system with system signal sampler at the antenna inputb. Closed system with test signal sampler inserted at the antenna inputc. Closed system with radar signal sampler or test signal sampler located at or beyond the transmitter
output and before the radar antenna inputd. Open-field reception of the radiated radar emission with a calibrated test antenna.
A near field antenna test range may be used in lieu of an open field test site for phased array antennas. Theupper end of the test frequency range for closed system transmitter measurements will be limited by thecharacteristics of the device used to sample the radar output signal and by the characteristics of the transmissionline between the sampling device and the radar antenna feed. Open field measurements should be used fordetermining transmitter characteristics beyond the upper end of the range for closed system measurements.Antenna characteristics should be measured from an open field test site. An anechoic chamber may be used inlieu of an open field test site, providing the chamber will approximate free space conditions over the range ofmeasurement frequencies.
30.16.2 Closed system test sites. Receiver tests should be made closed system. Transmitters using coaxialsystems should be made closed system up to the frequency where the device for sampling the radar signalcannot provide a reliable correlation of the measured data to radar antenna input levels. Transmitters using
MIL-STD-469B APPENDIX A
24
waveguide systems should be tested up to the frequency where the device for sampling the in-guide signal failsto provide a reliable correlation of the measured data to the radar antenna input levels. The maximumfrequency for making closed system measurements on radars employing waveguide transmission line should bethe cutoff frequency for the first higher order mode of propagation in the waveguide.
30.16.3 Open field test site. Radar emissions at frequencies exceeding the upper values specified (see30.16.2) and radar antenna characteristics should be measured in the open field or an anechoic chamber whichapproximates free space conditions. Unless otherwise specified, the minimum separation between the radarantenna and the test antenna at the open field site should be D / or 3 , whichever is larger, where D is the1 1
2
maximum aperture dimension of the radar antenna and is the wavelength at the radar F . If the test antennao
aperture (D ) is larger than D /10, then the +2 1 minimum radar antenna-to-test site separation should be (D 1
D ) / . The expected power density (P ) at the test site should be calculated using the equation:2 D2
P = P + G (20 log R) 11.0D T T
where R is the horizontal separation between the equipment antenna and the test antenna. The measured powerdensity should be no more than 2 dB below the calculated value. If the variation is greater than plus or minus 3dB, tests should not be continued without the approval of the contracting activity.
30.17 Radar receiver standard response. The standard response for pulsed receivers should be theminimum visible signal (MVS) except for the overall selectivity test, where the standard response will be themid-pulse minimum visible signal (MPMVS). The standard response will normally be measured at the receivervideo output with a test oscilloscope. Where a particular piece of equipment or system (because of its uniqueconfiguration or type of modulation) cannot be measured in accordance with this definition, a differentdefinition that is representative of the operational performance requirements of that equipment or system shouldbe designated and employed upon approval of the contracting activity's technical representative or otherdesignated technical authority.
40. RADAR TRANSMITTER MEASUREMENTS
40.1 Requirements summary. The radar transmitter measurement and procedures described in thissection provide data for comparison to emission characteristics, frequency tolerance and system tunabilityrequirements and limits (see 5.3).
40.2 Power output.
40.2.1 Objective. The objective of this test is to determine the ability of a radar system to deliver theminimum rated power output over the approved frequency band.
40.2.2 Requirements. Radar systems should produce the minimum rated power output when tuned overthe approved frequency band.
40.2.3 Application notes.
40.2.3.1 The radar power output should be measured with the radar tuned to each operating frequency asspecified in table III.
MIL-STD-469B APPENDIX A
25
40.2.3.2 For radar systems having multiple modulation modes or frequency bands, the power outputmeasurements should be performed for each mode and band combination. The transmitter frequency stability(see 40.6) and tunability (see 40.7) should be performed at the same time as the power output tests.
40.2.3.3 For phased array systems with less than fifteen transmitters/tubes the power output of eachtransmitter/tube should be measured. For phased array systems with fifteen or more transmitters/tubes, thepower should be either measured in the far-field or statistically determined by measuring the power outputs of aselected number of transmitters/tubes. The transmitters/tubes to be tested should be determined using a table ofrandom numbers for selection. Initially fifteen of the transmitters/tubes should be selected for measurementspurposes. The standard deviation of the measured data, corrected for any antenna amplitude weighting factor,should be calculated. If the standard deviation is greater than 2.0 dB, additional transmitters/tubes should bemeasured. The number of transmitters/tubes to be measured should be determined using the student tdistribution. The mean of the measured data should be calculated giving the power output per transmitter. Thetotal power output should then be the mean power output in watts, corrected for antenna weighting, times thetotal number of transmitters.
40.2.3.4 If the pulse shape of the transmitter output pulse is essentially rectangular, i.e., t and t are lessr f
than t/10, and the pulse width and PRF values are known or measured, the radar peak output should bedetermined by measuring the average power output and converting the measured value to peak power outputusing the radar duty cycle factor.
40.2.3.5 If the radar modulation is complex, for example, the pulse width or PRF parameters are not easilydetermined, the radar peak power output should be measured.
40.2.3.6 The test receiver for direct measurement of the radar peak power output should be a frequencyselective voltmeter (FSVM) or broadband crystal detector, depending upon the bandwidth required forreproducing the radar pulse envelope. The criteria for determining the bandwidth required is BW = 2/t.
40.2.4 Procedure. The test setup block diagram for tranmitter power output measurement is shown on figure 1. The procedures for this test should be as specified in 40.2.4.1 through 40.2.4.4.
40.2.4.1 The radar should be tuned to one of the specified operating frequencies and adjusted for its normaloperating conditions. Attenuators, if necessary, should be connected to the signal sampler as shown on figure 1.
40.2.4.2 For average power measurements, the power meter reading (P ) should be noted. Pulse width (t)M
and PRF measured values should be obtained as described in 40.3.
40.2.4.3 For peak power measurements with the FSVM as the test receiver, attenuation should be insertedat the signal sampler to yield a peak level of minus 10 dBm or less at the FSVM input. After tuning the FSVMfor maximum response, the meter reading should be noted for reference. Tune the test signal generator to theFSVM frequency. With the test signal generator set for CW output, reference the output level (set for minus 10dBm or less) to a selected value on the power meter. Set the test signal generator to pulsed output. The width ofthe output pulse should be adjusted to the value obtained from the following equation:
PW = t; non-pulse compression radarTEST
orPW = XPW; pulse compression radarTEST
MIL-STD-469B APPENDIX A
26
Signal substitute the test signal generator to the FSVM input. The output level should be adjusted to regain thereference FSVM reading obtained with the radar signal. Note the resulting level as P .GEN
40.2.4.4 If the broadband crystal detector with oscilloscope is used for the test receiver, the attenuator atthe signal sampler should be adjusted to yield a level within the detector linear range. With the oscilloscopeadjusted for a stable pulse display, note maximum display amplitude for reference. Adjust the test signalgenerator pulse width and reference the signal generator power level to the power meter as described for themeasurements with the FSVM test receiver. Signal substitute the test signal generator output to the broadbandcrystal detector and adjust the output level to regain the reference oscilloscope display amplitude. Note theresulting level as P .GEN
40.2.5 Sample calculations.
40.2.5.1 A sample calculation of the peak power output, using the measured average power, is as follows:
Measured data:
Transmitter tuned frequency (F ): 5000 MHzo
Pulse width (t): 1.3 microseconds PRF: 650 pps
7 dBm Power meter reading (P ): 1.M
0 dB Attenuation inserted (A ): 0.1
.0 dB Signal sampler coupling factor (A ): 50S
0 dB Transmission line attenuation, signal sampler to antenna (A ): 1.2
The average power output is calculated as follows:
P = P + A + A Aavg M S 1 2
= 1.7 dBm + 50.0 dB + 0.0 dB 1.0 dB
= 47.3 dBm
The peak power output (P , in dBm) is determined from the duty cycle (t)(PRF) using the followingp
relationship:
P log (t × PRF)
P = + 60.0 - 10 p avg
therefore,
10 log (1.3 × 650)P = 47.3 dBm + 60.0 -p
= 47.3 dBm + 30.7 dB = 78.0 dBm.
40.2.5.2 A sample calculation of peak power output from measured peak power data follows:
Measured data:
MIL-STD-469B APPENDIX A
27
0 MHz Transmitter frequency (F ): 500o
.0 dBm Signal generator substitution level (P ): 11GEN
.0 dB Attenuation inserted (A ): 401
.0 dB Signal sampler coupler factor (A ): 502
0 dB Transmission line attenuation, signal sampler to antenna (A ): 1.2
The peak power output at the radar antenna is calculated as follows:
P = P + A + A Ap GEN S 1 2
= 11.0 dBm + 50.0 dB + 40.0 dB 1.0 dB
= 78.0 dBm.
40.2.5.3 Sample data forms for recording peak or average power output data are shown on figures 2 and3.
40.3 Pulse width and rise time.
40.3.1 Objective. The objective of this test is to determine the amplitude versus time characteristics ofthe RF pulse at the transmitter output.
40.3.2 Requirements. This procedure should be used to determine pulse width and rise time wheneverthose values must be experimentally determined for use in other tests required by this standard.
40.3.3 Application notes. The results from this test have a number of essential applications, as follows:(1) verifying that the pulse width is within specified equipment tolerances, (2) converting measuredtransmitter average power output levels to peak power output levels and (3) calculations which determine theradar emission bandwidth and emission level.
40.3.3.1 The pulse width test procedure should include any measurements that are needed for determiningthe radar pulse envelope, in the time domain, at the radar output. The response of the test setup and anyfactors needed for relating the test point level to the antenna input level must be known.
40.3.3.2 The 3 dB bandwidth of the instrumentation used for recovering the time waveform of the pulsewidth and rise time should be greater than 3/t where t is the pulse rise time in microseconds. A measurementr r
objective should be 10/t .r
40.3.3.3 The points used for determining the pulse width should be as shown on figure 4. Rise timeshould be determined from the 10 to 90 percent points, relative to the nominal flat top level.
40.3.3.4 The test oscilloscope is the basic instrument for measuring the amplitude versus timecharacteristics of the transmitter's pulsed emission. The test procedure consists of detecting the RF pulse witha crystal detector and measuring the resultant pulse envelope with the test oscilloscope. One advantage of thismethod is that the oscilloscope frequency response must accommodate only the video frequencies comprisingthe pulse envelope rather than frequency components near the transmitter fundamental. The disadvantages arethat the detector input level should approach the upper end of the detector linear dynamic range and the
MIL-STD-469B APPENDIX A
28
detector conversion efficiency must be known or obtained through supplemental calibrations. If attenuatorsare necessary for reducing the signal level at the crystal detector input, the least attenuation that preventsdetector overload and maintains the level within the linear range characteristic of the detector should be used.
40.3.3.5 A typical block diagram of the test setup for pulse width and risetime measurements is shown onfigure 5. When the crystal detector and oscilloscope are used for recovering the RF pulse the followingprecautions should be observed:
a. The characteristic impedance of all interconnecting cables should match the impedance of thedevices being connected.
b. The test oscilloscope input should be terminated to match the detector output and interconnectingcable impedance.
c. The bandwidth of the crystal detector system should be greater than 3/t , where t is ther r
transmitter pulse rise time, with the transmitter fundamental as the mid-bandwidth frequency.The oscilloscope bandwidth should be greater than 3/t . A measurement objective for both ther
crystal detector system and test oscilloscope should be a bandwidth of approximately 10/t .r
40.3.3.6 The linearity of the crystal detector or test oscilloscope assembly should be checked to ensureadequate definition of the amplitude points where the level is 10 to 90 percent of the nominal flat top level. Toperform this check, increase the attenuation inserted, in selected steps, and note the oscilloscope responseobtained after each step. The data from the rise time tests should provide definition of voltage points whichare one-tenth of the nominal flat top level (see figure 4). The dynamic range of the test set up should be atleast 26 dB (1/20 voltage) below the nominal flat top level.
40.3.4 Procedure. The block diagram of the equipment setup should be as shown on figure 5.
40.3.4.1 Pulse width measurements: Set the test oscilloscope for a direct current (dc) input and adjust thesynchronization (trigger threshold) for a stable single pulse display. Set the oscilloscope sweep rate to thevalue that displays a complete pulse and covers as much calibrated horizontal scale as possible. The pulseenvelope at the baseline should cover at least 1/3 of the horizontal scale. Set the oscilloscope verticalsensitivity to obtain a pulse height which covers more than 1/3 of the calibrated vertical range to obtain goodreadability, then photograph the display.
40.3.4.2 Rise time measurement: Increase the sweep rate of the oscilloscope time base to display the risetime (10 to 90 percent point) over at least 1/3 of the oscilloscope horizontal width. Photograph the display andnote oscilloscope control setting.
40.3.4.3 Pulse repetition frequency (PRF) measurements: Slow the test oscilloscope sweep rate until twopulses are seen on the display. Note the time (T), in seconds, between corresponding points on the two pulses.The radar PRF should be calculated as PRF = 1/T. For radars having more than one interpulse period, eachdifferent interpulse time should be measured.
40.3.5 Sample calculation.
40.3.5.1 The data in the rise time photographs should be compared to the rise time capability of the testoscilloscope. The rise time of the test oscilloscope (T ) should be less than 1/3 times the indicated rise timea
shown in the photograph (T ) i.e.:i
T < 1/3 T .a i
MIL-STD-469B APPENDIX A
29
40.3.5.2 Sample data forms for pulse width, risetime, and PRF measurements are shown on figures 6through 8.
40.4 Emission bandwidth.
40.4.1 Objective. The objective of this test is to determine the radar emission characteristics forcomparison to the emission limits specified in 5.3.1.
40.4.2 Requirements. The radar emission bandwidth at the B points and over the rolloff region40dB
extending beyond each B point should not exceed the values as specified in table IV and the emission40dB
limits as specified in table V for the applicable radar category.
40.4.3 Application notes. The pulse width and rise time should be measured for each transmittermodulation mode and tuned frequency used in the radar emission bandwidth test. For phased array systemswith less than fifteen transmitters or tubes, the power output of each transmitter or tube should be measured.For phased-array systems with fifteen or more transmitters or tubes, the power should be either measured inthe far-field or statistically determined by measuring the power outputs (corrected for any antenna weighing)of a selected number of transmitters or tubes. The transmitters or tubes to be tested should be determinedusing a table of random numbers for selection. Initially, fifteen of the transmitters or tubes should be selectedfor measurement purposes. The standard deviation of measured data should be calculated. If the standarddeviation is greater than 2.0 dB, additional transmitters or tubes should be measured. The number oftransmitters or tubes to be measured can be determined using the student-t distribution. The mean of themeasured data should be calculated giving the power output per transmitter or tube. The total power output isthen the mean power output in watts, corrected for any antenna weighing, times the total number oftransmitters or tubes. A power meter with a recorder output is desirable to permit recording a sample level ofthe transmitter power output providing a permanent record of any power fluctuation occurring during this test.
40.4.3.1 For certain radars such as frequency hopping or pulse compression radars, it may be necessary tosupplement the data which shows the B points on a single photograph with additional analyzer40dB
presentations in which the frequency sweep width is narrowed to show greater rolloff detail. Theadditional data is needed to show the relationship between the 40 dB emission bandwidth frequencies and thelowest and highest transmit frequencies (frequency hopping radars) or the end points of the frequencydeviation (pulse compression radars).
40.4.3.2 To obtain the power spectral level at the signal sampler (or antenna) output of a pulse type radar,it is essential to know the IF bandwidth of the spectrum analyzer. With all analyzer controls unchanged,connect the signal generator to the analyzer and tune it for a centered frequency display. With a CW output,determine the signal generator output level required for a mid-scale vertical display. Record this value as P .1
Repeat this procedure except with the signal generator output pulse-modulated with a 2.0 microseconds widthat the radar PRF (pulse repetition frequency). Record this value as P . Calculate the alpha factor from the2
relationship, alpha factor (dB) = P (dBm) P (dBm). Using the alpha factor, the bandwidth-pulsewidth (B×t)1 2
product is determined (see figure 9). The (B×t) product divided by 2 × 10 yields the analyzer IF bandwidth6
(B). The IF bandwidth of the spectrum analyzer must be detemined for each frequency used in the radaremission bandwidth test.
40.4.3.3 In the data reduction, the signal sampler coupler factor is required for converting the powerspectral levels of the sampled signal into the equivalent levels at the radar antenna input. If the signal sampleris not located at the antenna input, the attenuation of the transmission line components between the samplerand the antenna should be determined for use in the data reduction. When emission spectrum data are
MIL-STD-469B APPENDIX A
30
obtained in the open field, the overall coupling from the radar antenna terminals to the test antenna terminalsis required for application in the data reduction. The coupling factors and attenuation values are required overthe entire frequency range covered by the emission spectrum measurements.
40.4.4 Procedure. The block diagram for the transmitter emission test is shown on figure 10. This testshould normally be performed as a closed system test in accordance with the test point selection priority list(see 30.16.1).
40.4.4.1 The test procedure for closed system measurements applies to open-field measurements exceptthat the point of measurement is the test antenna terminals rather than signal sampler output. Therefore, theantenna-to-antenna coupler factor replaces the signal sampler coupling factor in the data reduction process. Ineither case, the radar signal level at the sample point is termed P .2
40.4.4.2 If open-field measurements are necessary, the test antenna should be located as described (see50.2). With the radar antenna scan stopped, the alignment of the radar and test antenna should be adjusted formaximum signal at the test antenna terminals. The test antenna polarization should be the same as that of theradar antenna.
40.4.4.3 With the sample point connected to the spectrum analyzer through the appropriate transmissionline and calibrated attenuators, the analyzer should be tuned until the radar signal spectrum appears centeredon the analyzer display. This adjustment is performed using the maximum analyzer bandwidth. The finalanalyzer bandwidth should be selected using the following procedure:
a. Adjust external attenuators for an on-scale display.b. Decrease the analyzer bandwidth in increments (a 1:3:10 sequence is normally available) and
photograph the resulting displays.c. Determine the maximum analyzer bandwidth for which the shape of the spectrum display
(envelope) is independent of the bandwidth setting (i.e., no longer changes as bandwidth isreduced).
d. The analyzer bandwidth determined in step c. should be used for obtaining emission spectrumdata (photographs) at the radar F and required points in the spectrum away from F (e.g. B ).o o 40dB
The analyzer IF bandwidth (3 dB) determined in step c. should satisfy the relationship B >1.7 PRF forNOM
pulse radars. The analyzer controls and external attenuators should be adjusted to provide the maximumamplitude on-scale display that does not result in overloading the analyzer input. The analyzer should bechecked for signal overload as follows. After the analyzer controls and external attenuators are set, a 10 dBexternal attenuator should be added at the analyzer input. The amplitude of the spectrum envelope shoulddecrease by a corresponding 10dB over all parts of the display. If a 10dB decrease is not noted, the analyzercontrols and external attenuators should be changed as required to produce the desired 10 dB decrease whenthe overload check is performed. After verifying that overload is not occurring, the 10 dB attenuator addedfor the check should be removed.
40.4.4.4 The analyzer sweep width should be adjusted for an optimum display showing the first nullpoints on each side of the maximum emission at F . The sweep time should be selected to satisfy theo
following inequality:
(B ) (T /F )>5NOM s s2
MIL-STD-469B APPENDIX A
31
where:
B = spectrum analyzer IF bandwidth (3 dB), in Hz NOM
T = sweep time, secondss
F = sweep width, in Hz .s
Other controls should be set in accordance with the analyzer operating manual, the control settings recorded,and then the display should be photographed.
40.4.4.5 The analyzer display should be calibrated as follows: Connect a calibrated CW signal generatorto the spectrum analyzer, then tune it to the center of the analyzer display. Adjust the generator level toproduce a display at the top horizontal graticule line. Record the signal generator frequency and output level.Adjust and record the generator level for each horizontal line. Tune the signal generator frequency so that thedisplay is coincident with the right-hand end of the analyzer display. Increase or decrease the signal generatoroutput as required to attain a display at the middle horizontal graticule line. Note the generator output leveland frequency at this point, then tune the generator to the left-hand end of the display and repeat the process.If the levels at the analyzer display end points differ by greater than 2 dB from the mid-frequency level, selectadditional points across the display frequency range as necessary to describe the overall linearitycharacteristics.
40.4.4.6 The test setup should be reconnected to the radar signal sample point. The analyzer sweep widthshould be increased for an optimum display of the radar emission at the 40 dB points below the maximumlevel at F . The analyzer sweep rate should be changed as necessary to satisfy the (B ) (T /F )>5o NOM s s
2
requirement. The display should be photographed and the calibration procedure performed as described forthe first photograph.
40.4.4.7 The next part of the procedure requires a tunable preselector which tracks with the sweepfrequency of the spectrum analyzer inserted at the analyzer input. After reconnecting the test setup to theradar signal sample point, the spectrum analyzer should be tuned above the radar F until the 40 dB downo
amplitude point appears near the low frequency end of the display. Remove part of the calibrated inputattenuation to raise the entire spectrum display higher on the analyzer screen. In removing the attenuation, thelevel applied to the preselector and analyzer should be maintained below the value which produces overloador signal compression in the display. The amplitude of the overall spectrum envelope, at the minus 40 dBamplitude and lower, should be raised on the display by an amount equal to the attenuation removed. Thelevel at the minus 40 dB amplitude point should remain on scale. The analyzer sweep width which will showthe upper end-point of the spectrum rolloff region should be selected. The analyzer sweep rate should beadjusted to satisfy the criteria given for the first two photographs. The display should be photographed andcalibrated using the procedure given for the first photograph. The procedure described should be repeatedwith the spectrum analyzer tuned below the radar F .o
40.4.4.8 The procedure for CW and FM/CW radars is similar to that for pulsed radars described aboveexcept that it is not necessary to determine the alpha factor and the criteria for selecting the analyzerbandwidth is as follows:
F re F thea. For a CW radar, select the analyzer IF bandwidth (B) such that B <(3×10 ) , whe5
o o is radar tuned frequency, in Hz.
b. For FM/CW radars, select the analyzer IF bandwidth (B) such that B <(3×10 )F or B < 0.55o
F , whichever is less. F is the modulation rate for the FM.MOD MOD
MIL-STD-469B APPENDIX A
32
For non-pulse radars, the tracking preselector can be replaced with a passive rejection filter, tuned to the radarF , when measuring emission levels in the rolloff region.o
40.4.4.9 For phased array systems, procedures should be repeated (see 40.4.4 through 40.4.4.8) with thesystem operating in its normal search mode.
40.4.5 Sampling calculations. The emission spectrum measurement results consist of the emissionspectrum photographs and the associated frequency and amplitude calibration data together with insertionloss, coupling factor, and other calibrations as needed to obtain the power spectral level, in dBm/kHz, at theinput to the radar antenna. Sample emission spectrum data forms are shown on figures 11 through 13. Datareduction is required to yield a direct comparison of the radar performance to the specification limits.
40.4.5.1 Sample calculations which obtain the power spectral level in dBm/kHz from the measured datashould follow. Calculations are based on pulse radar having the measured characteristics, listed below, and anearly rectangular RF pulse envelope. Other conditions are that there are no sub-pulses within the pulse, andthat the pulses are not FM or otherwise encoded.
Measured data at transmitter F :o
0 MHz Transmitter tuned frequency (F ): 500o
Frequency separation, first spectrum nulls (from photo): 1.54 MHz
Radar PRF: 650 ppslsewidth) Spectrum analyzer alpha factor, 20.0 dB (2 × 10 second pu6
.0 dB Measured signal sampler coupling factor (A ): 50s
.0 dB Attenuation inserted at analyzer input (A ): 301
rum peak: 24.7 dBm Signal generator CW calibration level (P ) at emission spectcw
(A removed)1
dB. Attenuation, signal sampler to radar antenna (A ): 02
40.4.5.2 The first step in the data reduction calculates the spectrum analyzer IF bandwidth B from themeasurement with the 2 microsecond test pulsewidth described (see 40.4.3.2). An alpha factor of minus 20 dBprovides B×t = 0.067 (see figure 9). Therefore, (B)(2 × 10 ) = 0.067 which gives B = 33.5 kHz.6
40.4.5.3 The effective radar pulsewidth (t ) is determined from the equation t = 2/f , where f is theeff eff N N
frequency between the upper and lower first null points of the emission spectrum. Where f = 1.545 MHz, N
t = 2/(1.54 × 10 ) = 1.3 × 10 seconds.eff6 6
40.4.5.4 With the spectrum analyzer bandwidth and the effective radar pulsewidth known, the product is:B×t = (33.5 × 10 ) (1.3 × 10 ) = 0.044.eff
3 6
Applying B×t (see figure 10), the pulse versus CW sensitivity for the radar signal (alpha R) is 23.6 dB.eff
40.4.5.5 The peak level P of the radar emission at the radar antenna input is given by:p
P = P + A + A A alpha R.p CW 1 s 2
MIL-STD-469B APPENDIX A
33
Substituting alpha R and the measured values for the remaining factors in the equation gives:
P = 24.7 + 30.0 0.0 + 50.0 + 23.6p
= 78.9 dBm.
40.4.5.6 The last step consists of calculating the maximum power spectral level (P ), in dBm/kHz ast
follows:
P = P + 20 log (N × t) + 10 log PRF PG 90t p
where:P = maximum power spectral level, dBm/kHzt
ower, dBmP = peak pp
N = number of subpulses in the pulset = emitted pulse duration, microsecondsPRF = pulse repetition frequency, HzPG = processing gain.
The conditions for this example are: (1) no subpulses contained in the pulse (N = 1), and (2) non-FM, non-encoded pulses (PG = 0). Therefore, the calculation of P gives:t
P = 78.9 + 20 log (1 × 1.3) + 10 log 650 0 90t
= 19.3 dBm/kHz.
The value for P is needed for evaluating the end points of the emissions levels in the rolloff region. Thet
criteria for determining the dB below F level at the end point of each rolloff region is 60 dB or (P + 30) dB,o t
whichever is greater. Evaluating (P + 30) dB gives 49.3 dB. Therefore, the 60 dB value applies to the radar int
this example since (P + 30) is less than 60 dB.t
40.5 Spurious emission.
40.5.1 Objective. The objective of this test is to measure the power spectral level of all emissionsoutside the B frequency range; these emissions are not determined by the radar emission bandwidth test.-40dB
40.5.2 Requirements. Emissions outside the B frequency range should have a power spectral level-40dB
below the maximum values (see 5.3.2).
40.5.3 Application notes. For groups B and C radars, this test defines the radar emissions characteristicsdown to levels 60 dB or (P + 30) dB, whichever is greater, below the maximum emission level of the radart
fundamental (F ). For group D radars, the radar emission characteristics are defined down to levels 80 dBo
below the maximum F level. These regions above and below F are referenced herein as the rolloff frequencyo o
region. The spurious emission tests should extend from the end points of the measured rolloff frequencyregions to the limits of the applicable test frequency range specified (see table VI). The test results shouldprovide the power spectral level, in dBm/kHz, referenced to the terminals of the radar antenna. The spuriousemission test procedure should be applied over those portions of the required test frequency range where theradar emission bandwidth test procedure has insufficient sensitivity to verify compliance with the dynamicrange, 60 dB or (P + 30) dB below the maximum spectral level of F over the specified test frequency range.t o
MIL-STD-469B APPENDIX A
34
40.5.3.1 The spurious emission test should be performed for each radar tuned frequency and operatingmode specified for emission bandwidth tests (see 5.3.2).
40.5.3.2 The output power should be measured using a thermal-type power meter and an appropriatesignal sampler. The system directional coupler should be used, if available, and should be calibrated over therange of frequencies measured. For phased arrays the output power should be measured as specified in40.2.33. The number of transmitters selected should be determined using a table of random numbers. Initiallyfifteen of the transmitters should be selected for measurement purposes. The standard deviation of themeasured data should be calculated. If the standard deviation is greater than 2.0 dB, additional transmittersshould be measured. The number of transmitters to be measured can be determined using the student-tdistribution. The mean of the measured data should be calculated giving the power output per transmitter. Thetotal power output is then the mean power output in watts, corrected for any antenna weighing function timesthe total number of transmitters.
40.5.3.3 The first part of the spurious emission test procedure supplements the emission bandwidth, asnecessary, for defining the power spectral level in the rolloff region. The procedure consists of increasing thespectrum analyzer IF bandwidth to capture more spectral power in frequency regions away from the radarfundamental but with a loss in the detail for the spectrum lobes. The result is an increase in the amplitude ofthe spectrum envelope relative to the analyzer noise level. A correction factor (k) should be determined forrelating the data measured with the increased analyzer IF bandwidth to the data from the radar emissionbandwidth test.
40.5.3.4 The second part of the spurious emission test procedure should be applied only when thespectrum analyzer, at maximum IF bandwidth, produces insufficient dynamic range in the measured data; thatis, dynamic range is less than the 60 dB or (P + 30) dB, whichever is required. The second part of thet
procedure should be required for adequate measurement sensitivity between the end points of the spectrumrolloff regions and the limits of the required test frequency range. In the second part of the test procedure, thespectrum analyzer in the test setup should be replaced with a tunable receiver (frequency selective RFvoltmeter, FSVM). A correction factor (k) should be used for relating the data measured with FSVM to radaremission bandwidth data.
40.5.3.5 The spurious emission test should be performed for each radar transmitter tuned frequency andoperational mode used in the emission spectrum test (see 40.4).
40.5.4 Procedures. Refer to procedures as shown on figure 10 for a typical block diagram of this test.Tune the radar transmitter to a standard test frequency and most used operating mode. Adjust the outputpower to the nominal level. Record the measured transmitter power at the start of this test and at intervals of30 minutes or less (more frequently if a noticeable change occurs). A power meter with a recorder output isdesirable to permit recording a sample level of the transmitter radiated power output providing a permanentrecord of any power fluctuations occurring during this test.
40.5.4.1 The procedure should be described for spurious emissions above the radar tuned frequency (F ).o
It should be assumed that the radar emission bandwidth procedure has been completed to a frequency aboveF where the emission level is less than 5 dB above the spectrum analyzer noise level. The analyzer IFo
bandwidth should be increased and the frequency sweep range should be tuned for a spectrum display whichoverlaps the upper end of the sweep range of the previous spectrum photograph. The overlap region shouldinclude amplitudes which are at least 15 dB above the analyzer noise presentation in the previous photograph.The results from the process of changing the bandwidth and overlapping sweep ranges should be as shown on
MIL-STD-469B APPENDIX A
35
figure 13. Note the increase (k, in dB) of the spectrum envelope produced by increasing the analyzer IFbandwidth for identical frequency sectors. In the example as shown on figure 13, k equals 19.5 dB.Photograph the display and calibrate the analyzer frequency and amplitude scales using the procedure given(see 40.4.4.5).
40.5.4.2 When it is necessary to employ the second part of the spurious emission test procedure (wherethe FSVM replaces the spectrum analyzer), the process for obtaining the k factor should be modified slightly.Using the radar emission bandwidth photograph which shows the rolloff spectrum region for reference, afrequency toward the end of the rolloff where the display amplitude is 10 to 15 dB above the noise should beselected. The FSVM should be tuned about this frequency for a maximum response, and the amplitude forreference noted. A calibrated pulsed RF signal should be substituted at the input to the FSVM. The PRF of thepulsed RF signal should be set to equal the radar PRF. The RF pulsewidth (t) should be adjusted to satisfy thefollowing:
t > 2/BFSVM
ency of the pulsed RF signal should be adjustedwhere B is the nominal instrument bandwidth. The frequFSVM
for maximum response on the FSVM, then the signal level adjusted to obtain the reference FSVM response.The frequency of the pulsed RF signal should be measured and the value along with the signal level noted.The CW signal level corresponding to the amplitude of the spectrum envelope should be determined in thephotograph at the frequency noted. The k factor, in dB, should be determined by comparing the CW signallevel (from the photograph), P , to the pulsed RF signal level, P , as follows:CW PULSE
Pk = P PULSE CW
where:d P n dBm.
P an are iPULSE CW
40.5.4.3 When spurious emissions, which are 20 dB or more above the test receiver noise level, are foundthe spectrum analyzer test receiver should be used to determine the power spectral level. The analyzerbandwidth should be returned to the original value used in the radar emission bandwidth test.
40.5.4.4 After the upper frequency limit has been reached (see table VI), the analyzer should be tuned tothe frequency corresponding to the lower frequency of the maximum allowable emission bandwidth and thescan for spurious emission should begin below the operating frequency. The entire scan should be performedfor each of the three standard test frequencies and at the maximum duty cycle. The same tests should beperformed at the mid-standard test frequency using the mean pulsewidth and repetition rate of the system.
40.5.4.5 Spurious emissions measurement test procedures in the open field should be the same as thosefor the closed system tests except that additional measurements should be made to determine the antennacoupling factor (ACF) from the terminals of the radar antenna to the terminals of the test antenna in the openfield over the test frequency range. When the ACF coupling factor is known, it should not be essential for theradar-to-test antenna distance to satisfy the minimum distance requirement given for the radar antenna patterntest. The polarization, bearing, and elevation of the radar and test antennas should be adjusted for maximumsignal transfer over each portion of the test frequency range.
40.5.4.6 For the antenna coupling measurement at each frequency, a calibrated CW signal should beapplied to the radar antenna input. The level received at the test antenna terminals should be measured withthe spectrum analyzer or FSVM. Signal substitution with a calibrated CW signal generator should be used for
MIL-STD-469B APPENDIX A
36
determining reference response readings obtained on the analyzer or FSVM. When the antenna coupling ismeasured for radar antennas having waveguide transmission line input, adapters and transition sections shouldbe employed over appropriate portions of the measurement frequency range.
40.5.5 Sample calculations. The results from the spurious emission measurements will consist ofspectrum analyzer photograph or FSVM readings with associated calibration data, measured k factors asnecessary plus additional test data such as signal sampler or radar-to-test antenna coupling and insertion lossespreceding the point for substituting the calibration signals. Sample spurious emission data forms are shown(see figures 14 through 19).
40.5.5.1 To determine the power spectral level in dBm/kHz from the measured data, use the followingsample calculations as a guide:
Measured data at transmitter F (5000 MHz):o
Frequency separation, first spectrum nulls (from photo): 1.54 MHz
Radar PRF: 650 pps
Spectrum analyzer alpha factor for a 2-microsecond pulsewidth: 20.0 dB.0 dB Measured signal sampler coupling factor (A ): 50s
.0 dB Attenuation inserted at analyzer input (A ): 301
rum peak: 24.7 dBm Signal generator CW calibration level (P ) at emission spectCW
(A removed)1
dB Attenuation, signal sampler to radar antenna (A ): 02
kHz. Nominal spectrum analyzer IF bandwidth (B ): 30NOM
First, apply the data analysis procedures given (see 40.4.5) to obtain the maximum spectral level at F whicho
is 19.3 dBm/kHz. Next consider that the power spectral level at 40 MHz above F is desired but the spectrumo
envelope is only 4 dB above the noise level, which also increases when the bandwidth is changed. Assumethat the k factor resulting from the change in bandwidth (see 40.5.4.1) is analyzed at 15 MHz above F (whereo
the power spectral level is 35 dB below the maximum spectral level at F ). With the following data obtained:o
Signal generator (SG) CW level (P ) at F (frequency of spectrum peak), A removed CW o 1
and 30 kHz B : 24.7 dBmNOM
t F MHz, A d 30 kHz B 7 dBm SG CW level (P ) a + 15 removed anCW,A o 1 NOM: 59. SG CW level (P ) at F + 15 MHz, A removed and 100 kHz B : 49.2 dBmCW,B o 1 NOM
SG CW level (P ) at F + 40 MHz, A removed and 100 kHz B : 58.5 dBm.CW,C o 1 NOM
The k factor should be determined as:
k = P PCW,A CW,B
= 59.7 dBm ( 49.2 dBm)= 10.5 dB.
With the analyzer bandwidth of 100 kHz, the CW level at F + 40 MHz (P ) is measured 58.5 dBm.o CW,C
Adding the k factor to compensate for the increase of analyzer bandwidth, the equivalent CW level (P ) forCW,D
B = 30 kHz is:NOM
MIL-STD-469B APPENDIX A
37
P = P + kCW,D CW,C
= 58.5 dBm + ( 10.5 dB)= 69.0 dBm.
Comparing the resulting level to the CW level at the spectrum maximum obtains 24.7 dBm ( 69.0 dBm) =44.3 dB below maximum power spectral level. The power spectral level at F was 19.3 dBm/kHz. Therefore,o
the power spectral level at F + 40 MHz is 19.3 dBm/kHz 44.3 dB = 25.0 dBm/kHz.o
40.6 Frequency stability.
40.6.1 Objective. The objective of this test should be to determine the frequency stability of the radartransmitter.
40.6.2 Requirements. Radar transmitters should achieve a frequency tolerance no larger than that given(see 5.3.3) for the appropriate radar category.
40.6.3 Application notes. This test should be performed in-line using the system directional coupler orother suitable coupling devices. The radar transmitter should be tuned to an operating frequency near themidpoint of the tuning band. If the radar system operates on more than one band, the tests should beperformed for each band. The preferred test technique should be to automatically measure and record thefrequency.
40.6.3.1 The transmitter output signal should be obtained from the transmitter signal sampler or a testsignal sampler inserted between the transmitter output and antenna input. Alternative test points between thetransmitter frequency determining circuits and the final output should be used providing that (1) the frequencyat the point of measurement equals the final output frequency and (2) connection of the test instrumentationshould not alter the transmitter operation. The attenuators in the diagram should be needed to reduce thesignal levels to within the input level capabilities of the test instrumentation.
40.6.3.2 The test instrumentation should provide a measurement accuracy which is equal to or better than5 percent of the specified maximum frequency tolerance. For example, a group C, category 1, radar operatingat 100 MHz would have a maximum tolerance of: (400/10 ) (100 × 10 Hz) = 0.04 MHz. For a measurement6 6
accuracy of 5 percent, the frequency should be determined within 5 percent of 0.04 MHz = 2000 Hz or 20parts per 10 at the operating frequency of 100 MHz.6
40.6.3.3 The transmitter frequency stability should be measured at the highest and lowest temperature forwhich the equipment is designed to operate. Temperatures should be established and maintained inaccordance with procedures specified in MIL-STD-810, methods 501.1 and 502.1.
40.6.4 Procedure. The frequency stability measurement block diagram should be as shown on figure 20.The test duration should be a minimum of 4 hours with the following measurement intervals:
a. Within first hour: After transmitter turn-on, at time T , measure frequency at 10-second intervals o
during first 2 minutes of operation. Beginning at times of T + n minutes, where n = 5, 10, 15...o
up to 60, measure frequency at 10-second intervals for a period of 1 minute.b. Over next 3 hours: Measure frequency at times of T + 60 + n minutes where n = 0, 10, 20, 30...o
up to and including n = 180.
MIL-STD-469B APPENDIX A
38
40.6.5 Sample calculations. The results from the frequency stability measurements consist of thetransmitter frequency and times of measurement plus test particulars such as mode of transmitter operation,ambient temperature, and time from cold start to first frequency measurement. It is possible that a givensystem may be intended to be kept at a condition other than cold as its normal off mode. An explanationshould be provided when the system under test is not operated from a cold start. Sample data sheets to be usedfor reporting test details and measurement results are shown on figures 21 and 22.
40.6.5.1 A sample calculation to determine the frequency stability at one measurement follows:
Frequency at transmitter cold start (T ) = 2100.031 Mhzo
Frequency after 5 minutes of operation (T + 5) = 2100.014 MHzo
F(T 5)|Frequency tolerance = |F(T ) o o +
= |2100.031 2100.014|
= 0.017 MHz.
40.7 Transmitter tunability.
40.7.1 Objective. The objective of this test is to determine the ability of the radar transmitter to tuneover its approved frequency band.
40.7.2 Requirements. Each radar should be tunable in an essentially continuous manner (see 5.3.4).
40.7.3 Application notes. The procedure for the transmitter tunability test consists of performing thetransmitter power output and output frequency test with the transmitter tuned, in turn, to each of the requiredtest frequencies. The test procedures for measuring the transmitter power output and operating frequency aredescribed (see 40.2 and 40.6). Refer to 40.2 and 40.6 for the individual test procedures; the selection of therequired test frequencies is described in 40.7.4. In the initial selection for each radar band, at least 11 testfrequencies should be used, as specified herein: F , F , F ; four frequencies approximately evenly spacedL M H
between F and F , and four frequencies approximately evenly spaced between F and F . In the absence ofL M M H
specific requirements for power output in the radar procurement specification, test criteria for radar systemtunability should be derived from system specifications that define operational performance requirements.
40.7.4 Procedure. At each tuned frequency, the transmitter should be adjusted for normal operation asdescribed by the system operating manual. Any efforts to optimize the equipment operation at a particularfrequency should not be attempted unless the procedure is described in the manual.
40.7.4.1 The measured power output values should be compared to the radar specifications. If measuredvalues differ by more than 2 dB from the specification values, additional frequencies should be tested near thefrequency where the discrepancy is noted in order to describe the problem. For systems which are fixed-tunedor have less than 11 operating frequencies, the number of test frequencies should be reduced to the maximumavailable.
40.7.5 Sample calculations. The sample calculations for obtaining the transmitter power output frommeasured data are described (see 40.2). Sample data forms for recording the power output results are shown(see figures 2 and 3).
MIL-STD-469B APPENDIX A
39
50. RADAR ANTENNA MEASUREMENTS
50.1 Requirements summary. The radar antenna measurements and procedures described in thissection should provide data to be compared to the radar antenna characteristics, requirements, and limitsspecified in 5.4.
50.2 Antenna characteristics.
50.2.1 Objective. For antennas operated by their rotation through 360 degrees of the horizontal plane,the objective should be to determine the median gain of the antenna, in the principal horizontal plane, bymeasurement of the antenna pattern. Median gain should be defined as that level over an angular region atwhich the probability is 50 percent that the observed or measured gain at any position of the antenna will beless than or equal to that level. For other antennas, the objective should be to determine the antenna pattern,including the sidelobe levels, relative to the main lobe.
50.2.2 Requirements. The radar antenna should provide sidelobe characteristics within the limits (see5.4) for the appropriate radar category.
50.2.3 Application notes. For radar systems other than the types described, appropriate test proceduresshould be determined and described in a test plan developed for the cognizant activity directing the test. Uponapproval of the test plan and subsequent execution of the tests, any departure from the test plan shouldrequire approval. Guidance in planning antenna pattern and median gain tests on these types of systems shouldbe provided as specified in MIL-STD-449.
50.2.3.1 The spatial distribution of power radiated into space, if site effects are minimized, shoulddescribe the amount of relative antenna gain existing in directions removed from the main beams of anantenna. The recorded information, commonly referred to as antenna patterns, presents a graphicalrepresentation of the energy distribution about the system antenna.
50.2.3.2 The primary procedure uses the radar transmitter, operating in its normal mode with the ratedpower output, as the transmit signal source. A secondary procedure, which replaces the radar transmitter witha substitute signal source such as a high level CW signal generator is acceptable. With either transmit signalsource, the power level delivered to the radar antenna terminals should be measured and the results noted inthe test data.
50.2.3.3 Mechanically rotatable antennas should be tested (see 50.2.4 through 50.2.4.5). Systems withelectronic beam-scanning and limited or no mechanical rotational ability, yet with antennas small and lightenough for mounting on a mechanically-rotatable platform, should use the procedure (see 50.2.4 through50.2.4.5). Electronic beam-scanning antennas which cannot be mechanically rotated should use theprocedures listed (see 50.2.4.6 and 50.2.4.7).
50.2.3.4 The receiving test antenna should be positioned at a location which is separated from the radarantenna by a distance (R) determined from the following equation.
R > (D + D )/wavelength of test frequency1 22 2
MIL-STD-469B APPENDIX A
40
where D and D are the maximum aperture dimensions for the radar and test antennas respectively, and all1 2
parameters are in the same dimensional units. The test antenna height should coincide with a horizontal planethrough the radar antenna. Both the test antenna site and the path to the radar antenna should be free fromobstructions and objects which could cause reflections. Elevate the test antenna for the maximum receivedsignal level.
50.2.3.5 For those systems where the test antenna cannot be located in the radar main beam maximum,this measurement should be performed using near-field measurement techniques. If near- field techniques areemployed, the equivalent far-field patterns should be determined using appropriate techniques beforecomparing the results to the requirements (see 5.4).
50.2.3.6 The antenna pattern recording system (test receiver plus recorder) should have a dynamic rangeof at least (G + 20)dB where G is the gain, in dB, of the radar antenna main beam, with a minimum of 40 dBfor the system. The dynamic range can be expanded by removing attenuation at the test receiver input, thenobtaining a second antenna pattern recording. With this procedure, the second recording should show thehigher pattern levels off-scale but the lower levels should be reproduced. The calibration procedure should beas described for the initial antenna pattern recording which shows the main lobe on-scale.
50.2.3.7 Statistical measurements of the transmitted beam should be taken with the main beam scanningthe solid sector in the normal scanning mode. Time should be allowed at each test position and frequency forat least 10 complete scan cycles of the solid scan sector to be made by the main beam. Where possible, thescanning measurements should be synchronized in time so that the outputs of each complete scan cycle shouldbe correlated with the other scan cycles. The output data should be used to determine the statistical mean andthe deviation from the mean of the power density for the fundamental frequency at each test point. Forfrequency-scanning or frequency-agile radars, either a receiver bandwidth wide enough to encompass theradar scanning bandwidth or a number of receivers, each tuned to a separate frequency employed in the agilemode, should be used. As an alternate, for frequency agile radars with a limited number of discretefrequencies, one receiver should be used. The receiver can be tuned successively to each frequency andstatistics collected.
50.2.3.8 The procedures for measuring the receiver antenna patterns should be similar to those specifiedfor the transmit pattern, except that the test signal is radiated from each test site location to the array antenna.
50.2.4 Procedure. The block diagram for the antenna pattern test should be as shown on figure 23. Thistest should be performed at the mid-band test frequency, or at the horizon frequency forfrequency-to-elevation scanning radars.
50.2.4.1 The output of the test antenna should be connected to the input of the test receiver via a length oftransmission line with attenuators as required to prevent overloading. The test receiver should be adjusted asdescribed for measuring the peak level of the radar signal (see 40.2).
50.2.4.2 With the radar and test antennas aligned for maximum power transfer, the test receiver should betuned for maximum response at the radar fundamental frequency (F ). For frequency-to- elevation scanningo
radars, the test receiver should be tuned to the horizon beam frequency. The recorder should connect to thetest receiver. The recorder gain controls should be adjusted for nearly full scale deflection of the recorder pen.The level and frequency of the radar F should be measured using the procedure given for measuring peako
power output (see 40.2). In this test the signal sample should be provided by the test antennas rather than froma signal sampler. Calculate the radar power density using the following equation:
MIL-STD-469B APPENDIX A
41
P = P 20 log ( ) GR + 11.0D R
where:P = power density at test antenna, dBm/mD
2
dar F nna terminals, dBmP = ra level at test anteR o
, dB, and = 300/f ers.G = test antenna gainR MHz, met The power density at the test antenna should be compared to the expected F power density level. Theo
measured power density (equation on previous page) should agree within 2 dB of the expected power density(equation below). The equation for the main beam power density is:
P = P + G 20 log R 11.0D T T
where:
P = power density at test antenna, dBm/mD2
P = radar peak transmitted power, dBmT
al main beam gain, dBG = radar antenna nominT
R = distance from radar antenna to test antenna, meters.
50.2.4.3 With all instrumentation set as specified, rotate the system antenna and start the recorder. Therecorder should be operated to obtain two complete 360 degree sweeps of the system antenna on therecording. The recorder response times and antenna rotational speeds necessary to give at least 1 dB accuracyin the antenna pattern recording should be obtained from the followingequation:
W < 50 /T3dB r
where:
W = rotational speed, r/min= 3 dB width of antenna main lobe, degrees3dB
r and instrumentation, milliseconds.T = response time of the test receiver
50.2.4.4 To calibrate the antenna pattern recording, the main beam of the radar antenna should bere-aligned for a maximum received level on the test antenna. Additional attenuation should be inserted in theline from the test antenna, in 5 dB steps. After each 5 dB increase, the resulting deflection of the recorder penshould be marked.
50.2.4.5 For antennas that can be elevated, an antenna pattern measurement should be performed in thevertical plane using the procedure described for the azimuthal pattern recording.
50.2.4.6 For electronic beam-scanning antenna which cannot be mechanically rotated, the followingprocedures should be used. The test antenna should be placed sequentially at 10 equally spaced angularpositions, with the test antenna positioned as high as possible but not above the lowest elevation of the systemantenna main beam maximum for the following tests. The test antenna positions should be on a semi-circulararc starting at the azimuth boresight location and ending 180 degrees offset in azimuth. One each of the testpositions should be at each end of the specified arc. (Phased array systems are usually symmetrical by design;the mirror image of the test positions with associated data should be reflected to the other side of theantenna.)
MIL-STD-469B APPENDIX A
42
50.2.4.7 The azimuthal beam-scanning measurement should be performed if the main beam can be easilysteered at will. The main beam of the phased array should be steered as close as possible to the elevation ofthe test antenna and, with the elevation constant, should be sequentially stepped in azimuth through thecomplete scan sector. The azimuthal beam-scanning measurement should be taken with the test antenna at theazimuthal array normal test position, at the test position nearest the maximum angle of the scan sector, at anoptional test position, and at the test position 180 degrees in azimuth from the array normal test position.
50.2.5 Sample calculations. The results from the antenna characteristics measurements consist ofantenna pattern recording (strip chart or polar format) and associated calibration data such as attenuationinserted, cable loss, system antenna rotation rate, relative amplitude level, and test receiver and recorderresponse times. A sample antenna pattern recording (strip chart format) is shown (see figure 24).
50.2.5.1 A sample calculation to determine the power density measured at the test site from measureddata follows:
Transmitter tuned frequency (F ): 3000 MHzo
.0 dBm Signal generator calibration level at peak of antenna pattern mainlobe (P ): 13GEN
.0 dB Attenuation inserted at test receiver input (A ): 501
5 dB Attenuation, coax to test antenna (A ): 1.2
dBi Test antenna gain (G ): 16R
Wavelength = 300/3000 = 0.10 meters.
The received level at the test antenna is determined from:
P = P + A + AR GEN 1 2
= 13.0 + 50.0 + 1.5= 38.5 dBm.
Next, the power density at the test antenna is calculated (see 50.2.4.2) as follows:
P = P 20 log ( ) G + 11.0D R R
= 38.5 20 log(0.1) 16.0 + 11.0= 53.5 dBm/m .2
The sample calculation for the expected power density assumes the following parameters:
Radar antenna power input (P ): 90.0 dBmT
0 dBi Radar antenna gain (G ): 25.T
Distance from radar antenna to test antenna (R): 316 meters.
Using the equation (see 50.2.4.2) the expected power density at the test site is calculated as follows:
P = P + G 20 log(R) 11.0D T T
= 90.0 + 25.0 20 log(316) 11.0= 54.0 dBm/m .2
MIL-STD-469B APPENDIX A
43
60. RADAR RECEIVER MEASUREMENTS
60.1 Requirements summary. The radar receiver measurements and procedures described in thissection provide data for comparison to the acceptance bandwidth, susceptibility characteristics, frequencytolerance, tunability and oscillator radiation requirements and limits (see 5.5).
60.2 Overall selectivity.
60.2.1 Objective. The objective of this test is to determine the receiver response characteristics at andnear the receiver tuned and image frequencies.
60.2.2 Requirements. The overall receiver selectivity characteristics should satisfy the requirements(see 5.5) for the appropriate category of radar.
60.2.3 Application notes. In the first part of the test, the receiver response to test signals at and near theradar tuned frequency should be determined. In the second part, the response to test signals at and near thereceiver image frequency should be determined. Both parts should be performed with the radar receiver tunedto the mid-frequency of its tuning range (F ). If the receiver switches bandwidth during its operation, this testM
should be repeated for each bandwidth used in the radar operation.
60.2.3.1 The receiver selectivity characteristics give an indication of the overall gain and sensitivity ofthe receiver at its tuned frequency as well as its responses at frequencies slightly removed from the tunedfrequency. The selectivity characteristics are mostly determined by the IF amplifier tuned circuits and shouldbe fairly symmetrical about the center frequency. The level of these responses near the fundamental andimage frequency indicate the ability of the receiver to discriminate against off-channel radiation through theacceptance bandwidth or selectivity.
60.2.3.2 The radar receiver measurements specified herein should be performed on all receivers of thesame radar except in the case of phased array radars with more than fifteen identical parallel receivers. Forthese radars fifteen of the receivers should be selected through the use of a table of random numbers. Thestandard deviation of the measured data, corrected for any antenna weighing, should be calculated. If thestandard deviation is greater than 2.0 dB, additional receivers should be measured. The number of receivers tobe measured should be determined using the student-t distribution. The total receiver response (all receivers)should then be determined statistically.
60.2.3.3 For pulsed radar receivers, the test signal generator should be modulated with a pulsed signalwhich is approximately 10 times the longest operating pulsewidth for the tuned circuit being measured. Thewide pulsewidth produces a relatively narrow energy spectrum in comparison to the receiver bandwidth. Thisnarrow spectrum avoids erroneous bias buildup in the receiver's gain control circuits. In addition, the narrowspectrum provides a close approximation of the CW selectivity characteristics of the receiver.
60.2.3.4 For nonpulsed receivers, the test signal should be unmodulated (CW). The point for measuringthe receiver output should be past the receiver second detector, if possible, and should give a signal whichrepresents normal operation of the system.
60.2.4 Procedure. The block diagram of the test setup should be as shown on figures 25 and 26.
MIL-STD-469B APPENDIX A
44
60.2.4.1 The test frequency should be tuned about F for an optimum response at the receiver output. TheM
test signal level should be reduced to obtain midpulse minimum visible signal (MPMVS) at the receiveroutput. The receiver video output should be observed at the output of the video detector using a widebandwidth oscilloscope. With the MPMVS output established, the frequency and level of the test signalgenerator should be recorded. The insertion loss of test devices between the point where power level isreferenced and the receiver input should be determined.
60.2.4.2 The test signal generator level should be increased to 3 dB above the tuned frequency (F )o
MPMVS level. The generator frequency should be tuned above F to regain the MPMVS response at theo
receiver output. This test signal frequency should be measured and noted. This procedure should be repeatedwith the generator frequency tuned below F . The procedure should be repeated above and below F with theo o
test signal level increased in steps to 6, 12, 20, 40, 60 and, if possible, 80 and 100 dB above the MPMVSsensitivity level at F .o
60.2.4.3 The procedure should be repeated for frequencies at and near the receiver image response. Inthis case, the maximum test signal level should not be required to exceed 60 dB above the MPMVS sensitivitylevel measured at F .o
60.2.5 Sample calculations. The selectivity measurement results consist of frequencies corresponding tospecified amplitude response levels and associated information such as receiver operating mode, bandwidthand test point. Sample selectivity data forms are shown (see figures 27 through 30).
60.2.5.1 A sample calculation to illustrate the procedure to determine the incremental frequency valuesand bandwidth follows:
Measured data:868 MHz Radar tuned frequency (F ): 3001.o
655 MHz Frequency at 6 dB response above F : 3003.o
997 MHz Frequency at 6 dB response below F : 2999.o
The incremental frequency above F (+ F) is calculated aso
+ F = 3003.655 MHz 3001.868 MHz= 1.787 MHz
F = 3001.868 MHz 2999.997 MHz= 1.871 MHz
The 6 dB bandwidth (BW) is calculated from
BW = |+ F| + | F|
= 1.787 + 1.871
= 3.658 MHz
60.3 Spurious response.
60.3.1 Objective. The objective of this test is to determine the response characteristics of the radarreceiver to signals at frequencies outside the range of the selectivity test.
MIL-STD-469B APPENDIX A
45
60.3.2 Requirements. The required spurious response characteristics of radar receivers should be asspecified (see 5.5).
60.3.3 Application notes. The receiver input reference point should be selected at, or as close aspossible to, the connection point of the transmission line to the system antenna (antenna terminals). Where itis not practical to establish the receiver input reference point at the system antenna, additional measurementsshould be obtained to describe the transmission line loss between the point which is used and the systemantenna terminals.
60.3.3.1 The range of test signal frequencies are specified in 5.5. The test signal generator should bemodulated with a pulse of the same width as the system pulse and triggered by the system trigger. For systemsusing waveguide transmission line, the signal generator output should be applied at the receiver input throughappropriate waveguide transitions and adapters to ensure, as much as possible, dominant mode incidence tothe receiver. Adapters and transitions should be changed as necessary to correspond with the test signalfrequency. Filters should be used to prevent unwanted signal generator outputs from entering the receiver.Attenuators should be inserted at the receiver input to provide a better match between the test signal sourceand the plane of reference.
60.3.4 Procedure. Typical block diagrams of the test setup for spurious response measurements shouldbe as shown on figures 25 and 26.
60.3.4.1 The receiver should be tuned to F and adjusted for normal operation in the selected mode. WithM
the test signal generator set to the low end of the required frequency range, the test signal level should beadjusted at the receiver input such that the value exceeds the measured receiver sensitivity level by at least 10dB plus the spurious response rejection value specified in table IX for the appropriate radar category. Startingat the low end of the required frequency range, the frequency of the test signal generator should be increaseduntil a response is observed on the receiver output monitor. The receiver response and point for monitoringshould be the same (see 60.2) as that used for measuring the overall selectivity. With the frequency of the testsignal adjusted for a maximum response, the test signal level should be reduced to obtain the MPMVSresponse (see 60.2) (MDS for pulse radars). The test signal generator output level and frequency should benoted. After adjusting the test signal generator level to be value described for the start of the test, the testsignal frequency should be increased until another spurious response is located. The scan and measurementprocedure should be repeated for all spurious responses up to the maximum test frequency as specified (seetable VI) for the emission bandwidth test.
60.3.4.2 The spurious response test procedure should be repeated for each receiver tuned frequencyspecified and each mode and band of receiver operation.
60.3.5 Sample calculation. The results from the spurious response measurements typically consist oftest signal generator level and frequency at each spurious frequency point plus associated information such asattenuation inserted and insertion losses of adapters transitions and cables. Sample data forms are shown (seefigures 31 and 32).
60.3.5.1 A sample calculation to obtain the spurious response level follows:
Measured data:
Receiver tuned frequency: 3650 MHz
Test pulse width: 5.0 microseconds
MIL-STD-469B APPENDIX A
46
PRF: 650 ppsSignal generator level (P ): 20.0 dBmGEN
Signal generator frequency: 4203.615 MHz0 dBAttenuation inserted (A ): 5.1
2 dBCable loss (A ): 2.2
8 dB.Adapter loss (A ): 0.3
The power input at the receiver input plane of reference (P ) is calculated as follows:R
P = P A A AR GEN 1 2 3
= 20.0 5.0 2.2 0.8= 28.0 dBm.
60.4 Receiver tunability and frequency stability.
60.4.1 Objective. The objectives of this test should be to verify that the radar receiver is tunable over therequired frequency range and that the frequency stability is within the frequency tolerance specified. This testshould also verify that crystal controlled receivers achieve the tunability requirements of operation atessentially any frequency across the band with a crystal change.
60.4.2 Requirements. The frequency stability of receivers should be commensurate with or better thanthe frequency tolerance of the associated transmitter. The frequency tolerance requirements for radartransmitters, which apply to radar receivers should be as specified (see 5.3.3 and 5.5.4) and tunabilityrequirements should be as specified (see 5.3.4 and 5.5.3). The frequencies to be measured for the tunabilitytest should be selected in accordance with 40.7 for transmitter tunability. The frequencies to be selected forthe frequency stability test should be F , F , and F as specified in table III. The receiver frequency stabilityL M H
test requirement should be waived for radar systems which normally employ automatic frequency control(AFC) or similar means for maintaining the receiver tuned frequency equal to the transmitter frequency. Thereceiver tunability and frequency stability test should be performed with the radar system or equipmentoperating at nominal environmental temperatures as specified and the minimum and maximum environmentaltemperatures as specified.
60.4.3 Application notes. A measure of the tunability of a radar receiver is its ability to attain ratedsensitivity over its operating band. The receiver tunability should be determined from measurements of thereceiver sensitivity at each test frequency as specified. Unless otherwise specified for the receiver nominalparameters, the standard output response should be minimum discernable signal (MDS) observed on the testoscilloscope display. If the required sensitivity of the receiver is not specified over the operating band, theminimum signal level and corresponding receiver standard response should be established by the contractingactivity and included in the test plan.
60.4.3.1 A measure of the frequency stability of a radar receiver is the ability of its frequency producingcircuits to maintain the receiver tuned frequency within the frequency tolerance specified.
60.4.4 Procedure. The receiver tunability and frequency stability measurements should be performed asa closed system test. The block diagram is shown on figure 33.
MIL-STD-469B APPENDIX A
47
60.4.4.1 The tunability test should begin by tuning the radar receiver for normal operation on one of thetest frequencies specified. The test signal should be modulated to equal the nominal characteristics for whichthe radar system or equipment specifications are given. The test signal should be triggered from the radarmodulation trigger, with a delay to place the signal at an equivalent range such that any sensitivity timecontrol (STC) is not activated (unless allowance for the effect of STC has been made in establishing thestandard response). The test signal should be tuned to the receiver frequency. The receiver output should bemonitored with the oscilloscope. The generator level should be adjusted to obtain the standard response at thereceiver output. The generator frequency should be measured with the frequency counter and the valuerecorded along with the receiver output level required for the receiver output standard response. Theprocedure should be repeated for the remaining receiver test frequencies as specified. The entire procedureshould be performed with the radar system or equipment operating under the environmental temperatureconditions as specified.
60.4.4.2 The receiver frequency stability should be determined by accurately measuring the frequencystability of the local oscillator frequency with the frequency counter. In case of the multiple conversionreceiver, the frequency of all local oscillators should be measured. The time over which the receiver stabilityis measured should include the stability requirements specified by the contracting activity or contract. Thefrequency stability test should also include the frequency measurement over a period of 4 hours at thefollowing intervals:
a. Within first hour: After receiver turn-on, at time T , measure frequency at 10-second intervalso
during first 2 minutes of operation. Beginning at times of T + n minutes, where n = 5, 10, 15... upo
to 60, measure frequency at 10-second intervals for a period of 1 minute.b. Over the next 3 hours: Measure frequency at time of T + 60 + n minutes where n = 0, 10, 20,o
30... up to and including n = 180.
The turn-on time in a. from a cold start may vary from one piece of equipment to another. Turn-on time willbe defined as "the earliest time, from a cold start, that the equipment is intended to radiate and receivesignals". The receiver tuned frequencies at each point over the required time interval should be determinedfrom the measured local oscillator frequency and the receiver intermediate frequency. The variation in thereceiver tuned frequency at times T + n compared to the tuned frequency at time T should not exceed theo o
frequency tolerance as specified.
60.4.4.3 Sample data forms for recording receiver tunability and frequency stability measurements resultsare shown on figures 34, 35, and 36.
60.4.5 Sample calculations. The results from the receiver tunability measurements typically consist ofthe receiver sensitivity measured at the required test frequency (see 60.4.2). Sample calculations for spuriousresponse (see 60.3.5) are applicable for sensitivity measurements. The results from the receiver frequencystability test consist of receiver local oscillator(s) frequency measurements and associated information such asmode of receiver operation, cold start time, turn-on time, and time for each frequency measurement point.
60.4.5.1 In the stability data reduction, the measured local oscillator frequency is first converted to theequivalent frequency at the receiver input.
Measured data:T 764 MHzLocal oscillator frequency at start of test (F , lo o): 1250.
Local oscillator frequency at time T (F , T ): 1250.748 MHz1 lo 1
MIL-STD-469B APPENDIX A
48
MHzReceiver intermediate frequency (F ): 30IF
Local oscillator frequency relative to receiver tuned frequency: above.
Receiver tuned frequency is determined as follows:F = F Fo lo IF
therefore,F ,T = 1250.764 30o o
= 1220.764 MHzF ,T = 1250.748 30o 1
= 1220.748 MHz.
The frequency tolerance at time T is calculated as follows:1
T F TFrequency tolerance = |F , , |o o o 1
= 1220.764 1220.748
= 0.016 MHz.
60.5 Receiver radiation.
60.5.1 Objective. The objective of this test is to determine the level of receiver radiated signals at thereceiver input terminals.
60.5.2 Requirements. No receiver radiations should exceed the maximum values as specified in table Xfor the appropriate radar category.
60.5.3 Application notes. Energy that is generated within the radar receiver by local oscillators andother signal producing circuits may be radiated from the radar system antenna. In this manner, the receiveracts as a transmitter and may emit energy which becomes interference to nearby equipment.
60.5.3.1 To provide assurance that the receiver oscillator radiation meets the requirement, the level of thelocal oscillator fundamental signal should be determined for all transmitter frequencies which are selected foruse in the transmitter tunability test (see 40.7).
60.5.3.2 The test receiver should be a spectrum analyzer or a frequency selective voltmeter (FSVM). Thesensitivity of the test receiver should be at least 5 dB greater than the specification limit, measured at the inputto the transmission line leading to the test receiver.
60.5.3.3 If numerous oscillator emissions are found in the frequency scan, it may be advantageous todisplay sequential frequency sectors on the spectrum analyzer, photograph each display and perform thecalibration procedure as described for spurious emission (see 40.5). This alternate procedure is especiallyapplicable to frequency scanning or frequency hopping radars where the scan sequence cannot be stopped forsingle frequency analysis.
60.5.3.4 Over frequency regions where no oscillator radiations are detected, the sensitivity of the testreceiver setup should be checked at points over the scan range to demonstrate the required measurementsensitivity. The insertion loss of the adapter used at the receiver input should be determined for eachfrequency where oscillator radiation is measured.
MIL-STD-469B APPENDIX A
49
60.5.4 Procedure. This test should be performed as a closed system test. A typical block diagram of thetest setup is shown on figure 37. Disconnect the transmission line to the system antenna at the nearestavailable breakpoint external to the equipment enclosure. Terminate the transmission line on the receiver sideof the disconnect point in an adapter as necessary to match the transmission line to the test receiver.
60.5.4.1 For each of the test frequencies as specified in table III, start at the low extreme of the frequencyrange as specified in table X and increase the test receiver frequency until a signal is detected. Tune the testreceiver for maximum response and record the response level on the data sheet as shown on figure 38.Connect the coaxial cable leading to the test receiver to a CW signal generator. Tune generator to obtain afrequency matching that of the reference analyzer response. Adjust the generator level to duplicate thereference response level. Record the generator frequency (measured with the frequency counter) and levelreadings. Continue the frequency scan until the next oscillator emission is found. Repeat entire procedure justdescribed for each oscillator emission encountered in the frequency range as specified in table X.
60.5.5 Sample calculations. The results from receiver oscillator radiation measurements consist ofsignal generator CW substitution level and frequency and associated test data such as adapter loss. Sampleoscillator radiation data forms are shown (see figures 38 and 39).
60.5.5.1 A sample calculation to obtain the receiver oscillator radiation level follows:
Measured data:Signal generator frequency: 1250.764 MHz
.0 dBmSignal generator level (P ): 38GEN
4 dB.Adaptor loss (A ) = 1.1
The oscillator radiation level (P ) is calculatedCW
P = P + ACW GEN 1
= 38.0 + 1.4= 36.6 dBm.
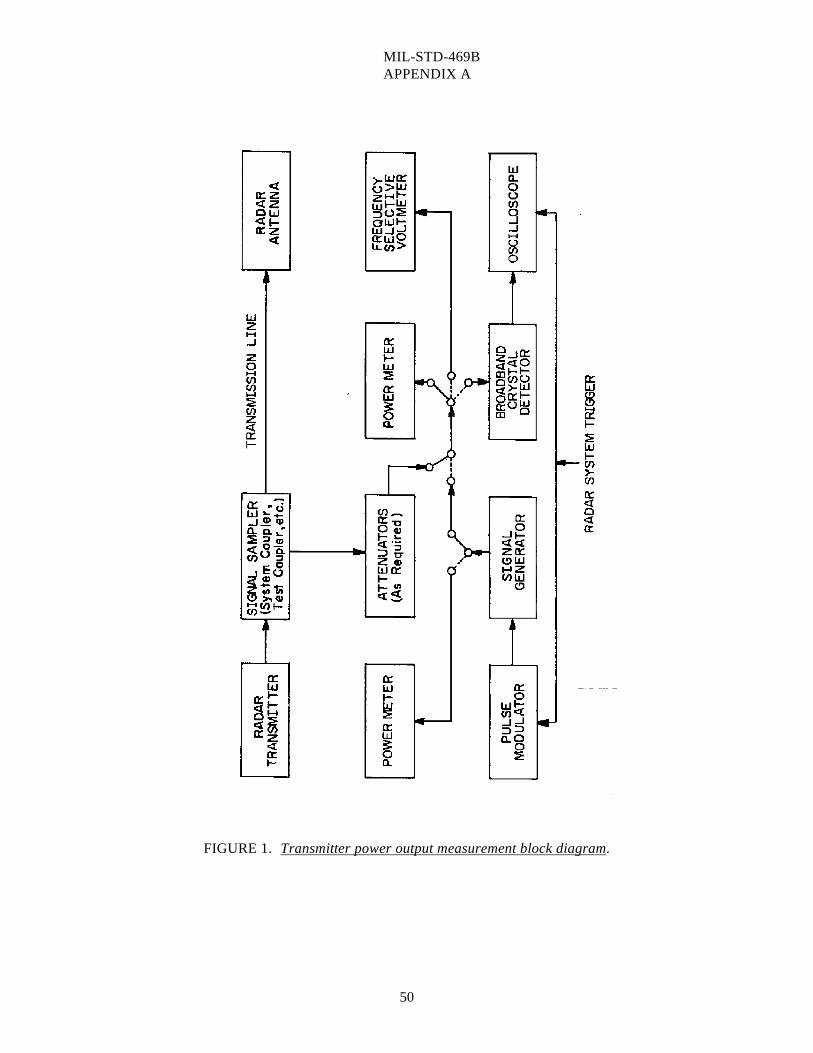
MIL-STD-469B APPENDIX A
50
FIGURE 1. Transmitter power output measurement block diagram.
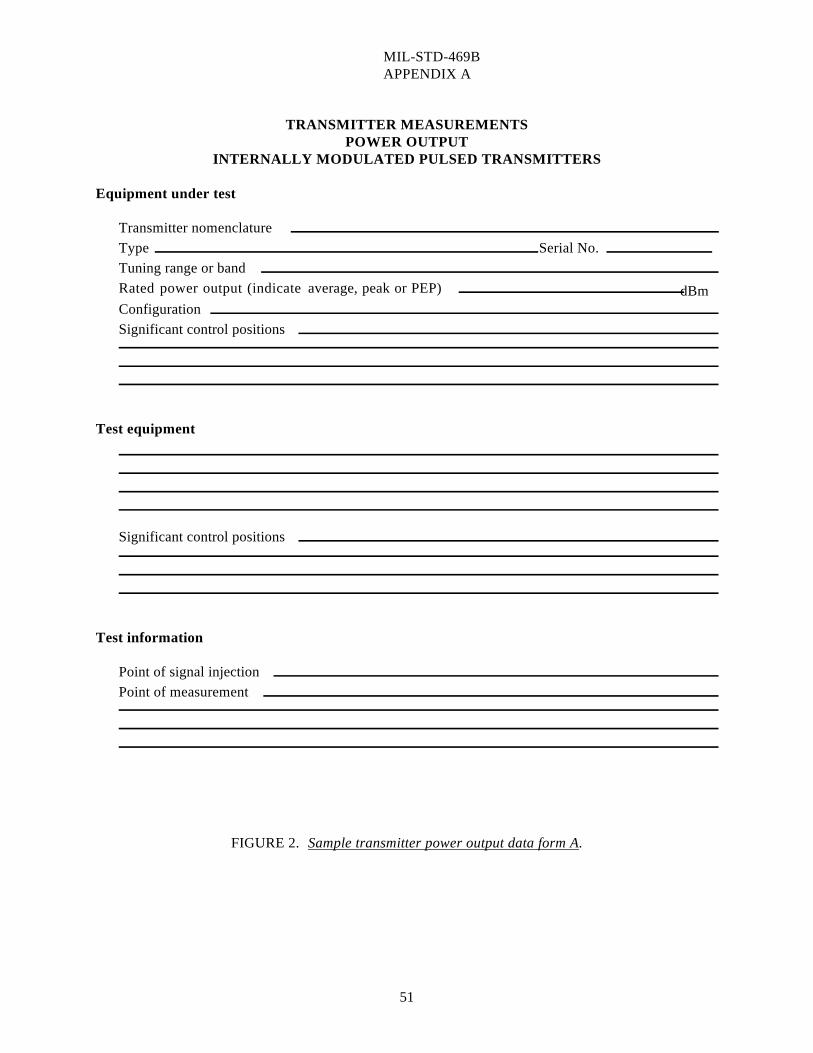
MIL-STD-469B APPENDIX A
51
TRANSMITTER MEASUREMENTSPOWER OUTPUT
INTERNALLY MODULATED PULSED TRANSMITTERS
Equipment under test
Transmitter nomenclature Type Serial No. Tuning range or band
Rated power output (indicate average, peak or PEP) dBm Configuration Significant control positions
Test equipment
Significant control positions
Test information
Point of signal injection Point of measurement
FIGURE 2. Sample transmitter power output data form A.
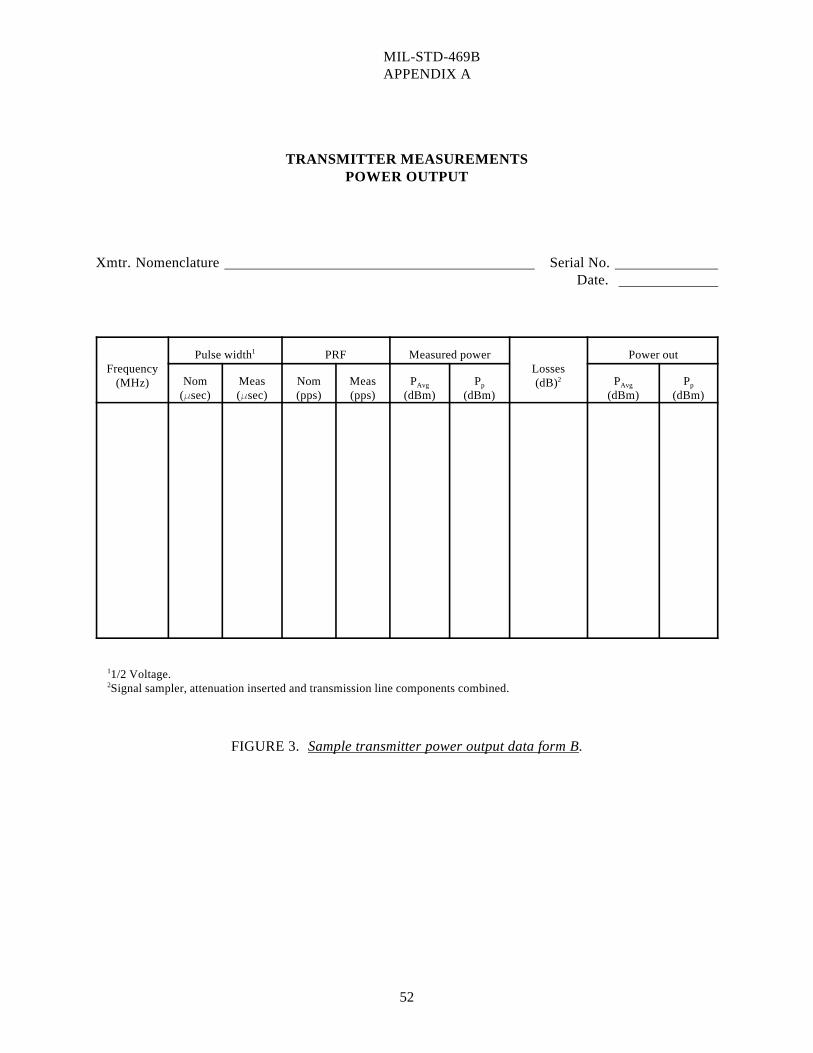
MIL-STD-469B APPENDIX A
52
TRANSMITTER MEASUREMENTSPOWER OUTPUT
Xmtr. Nomenclature Serial No. Date.
Frequency Losses(MHz) (dB)
Pulse width PRF Measured power Power out1
2Nom Meas Nom Meas P P P P( sec) ( sec) (pps) (pps) (dBm) (dBm) (dBm) (dBm)
Avg p Avg p
1/2 Voltage.1
Signal sampler, attenuation inserted and transmission line components combined.2
FIGURE 3. Sample transmitter power output data form B.
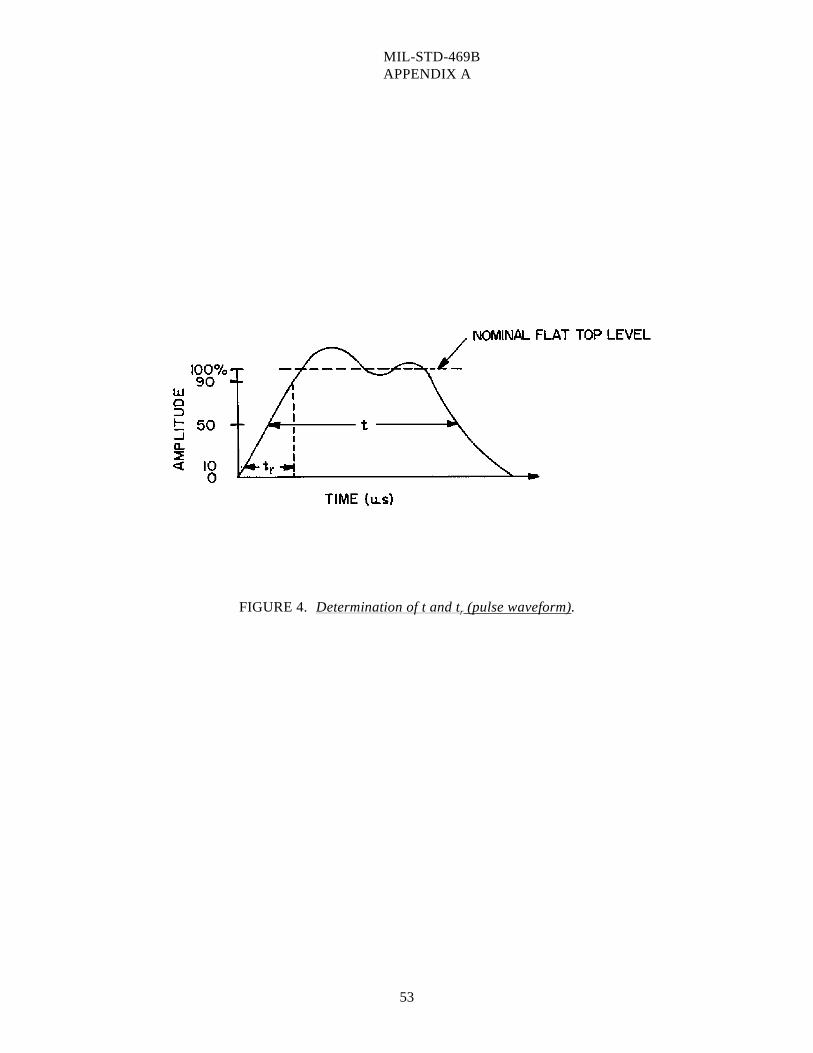
MIL-STD-469B APPENDIX A
53
FIGURE 4. Determination of t and t (pulse waveform).r
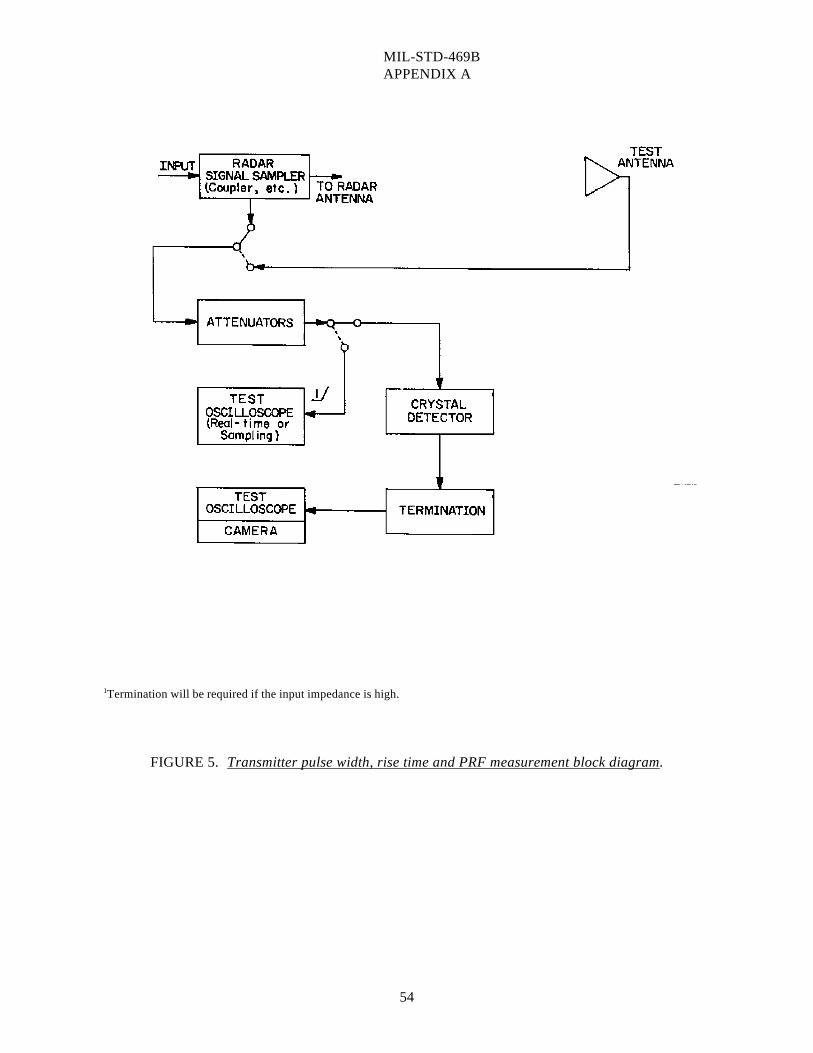
MIL-STD-469B APPENDIX A
54
Termination will be required if the input impedance is high.1
FIGURE 5. Transmitter pulse width, rise time and PRF measurement block diagram.

MIL-STD-469B APPENDIX A
55
Equipment under test
Transmitter nomenclature Type Serial No. . . Tuning range or band
Modulation Mod. BW . . Pulse width sec, PRF pps
Configuration Significant control positions
Test equipment
Significant control positions
Test information
Point of signal injection Point of measurement
FIGURE 6. Sample transmitter pulse width data form A.
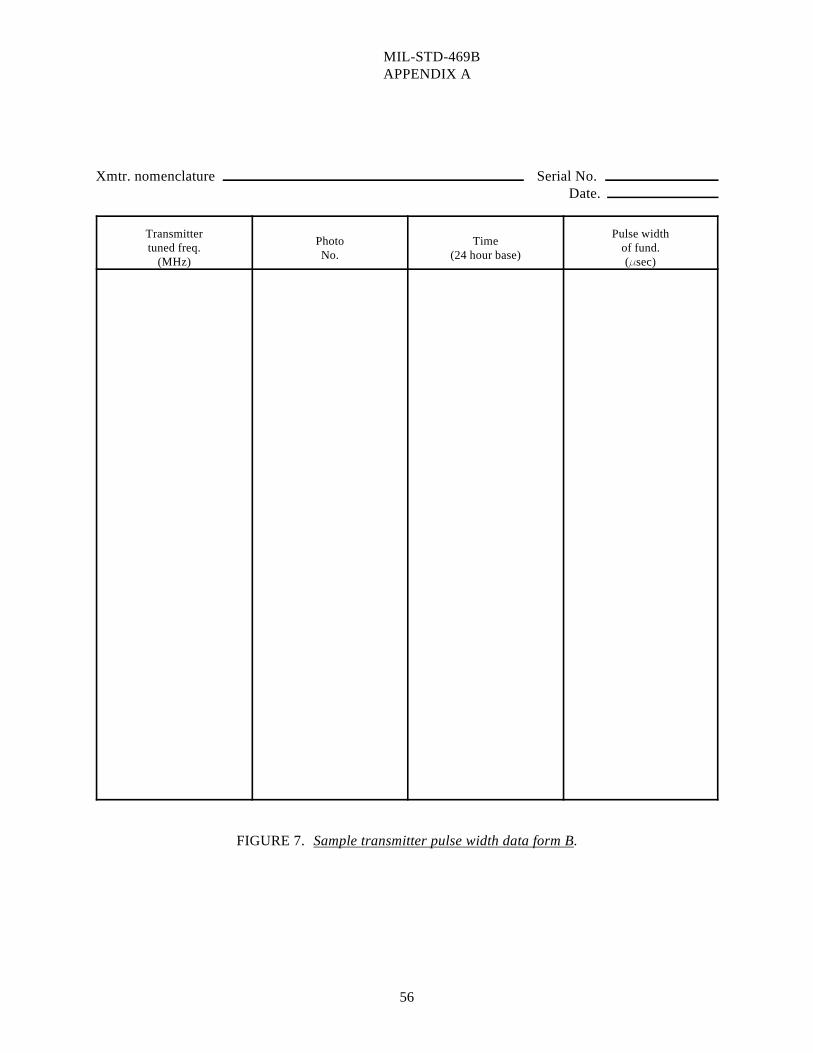
MIL-STD-469B APPENDIX A
56
Xmtr. nomenclature Serial No. Date.
Transmitter Pulse widthtuned freq. of fund.
(MHz) ( sec)
PhotoNo. (24 hour base)
Time
FIGURE 7. Sample transmitter pulse width data form B.
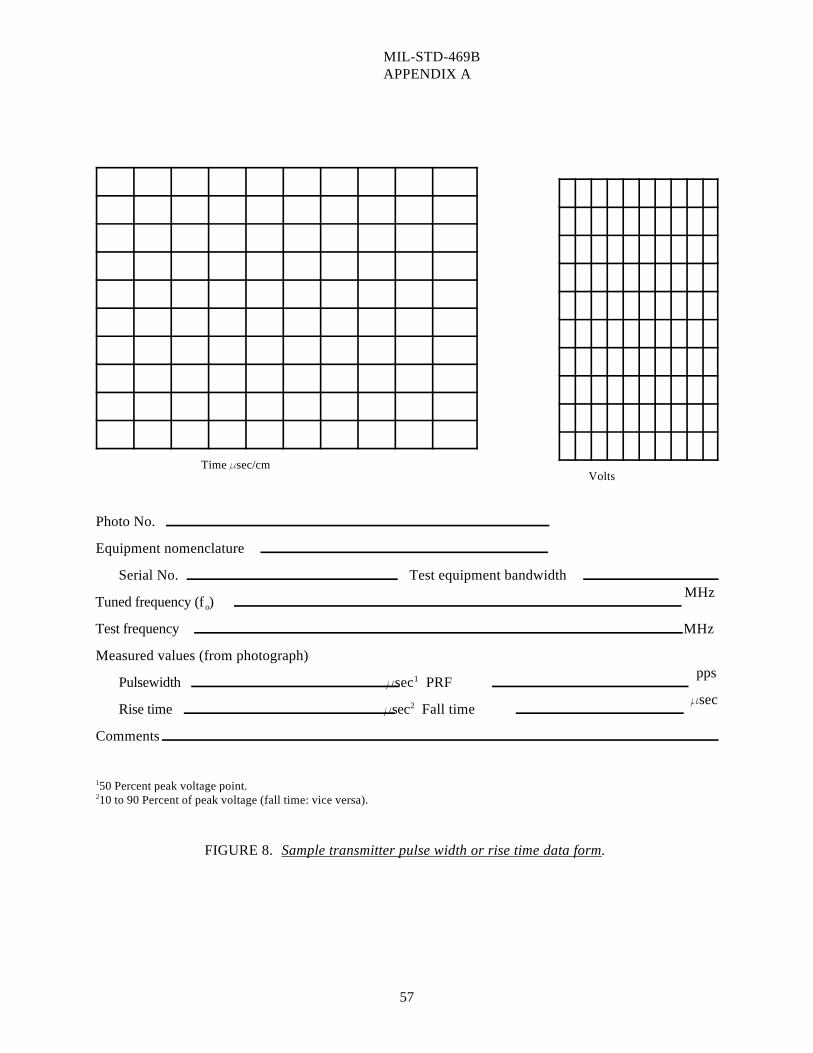
MIL-STD-469B APPENDIX A
57
Time sec/cm Volts
Photo No.
Equipment nomenclature
Serial No. Test equipment bandwidth MHz
Tuned frequency (f ) o
Test frequency MHz
Measured values (from photograph) pps
Pulsewidth sec PRF 1
secRise time sec Fall time 2
Comments
50 Percent peak voltage point.1
10 to 90 Percent of peak voltage (fall time: vice versa).2
FIGURE 8. Sample transmitter pulse width or rise time data form.
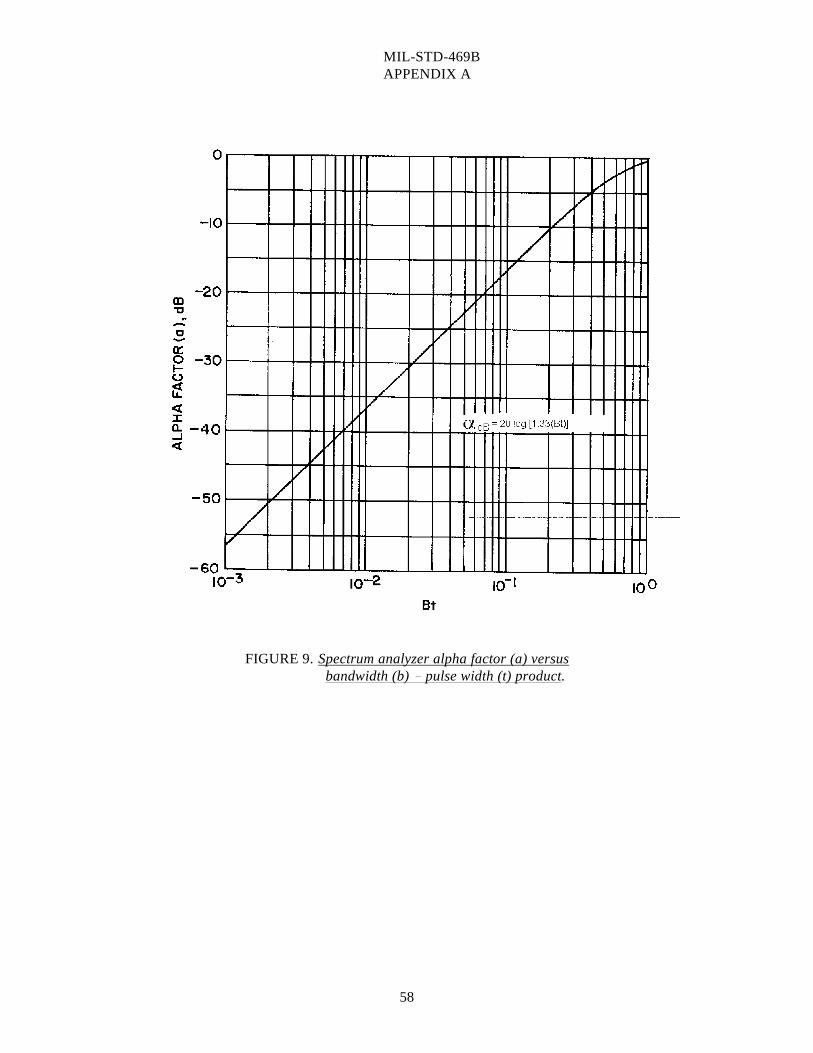
MIL-STD-469B APPENDIX A
58
FIGURE 9. Spectrum analyzer alpha factor (a) versus bandwidth (b) pulse width (t) product.
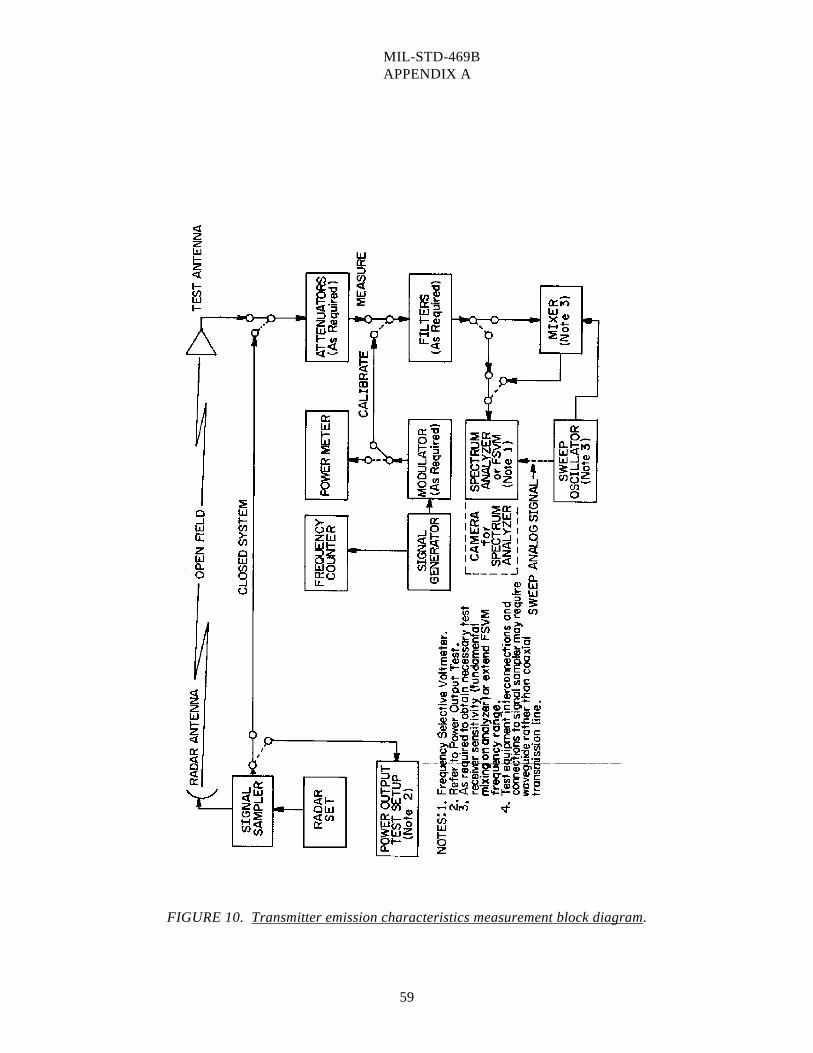
MIL-STD-469B APPENDIX A
59
FIGURE 10. Transmitter emission characteristics measurement block diagram.

MIL-STD-469B APPENDIX A
60
Amplitude linearity correction (dB)
Frequency (MHz) Sig. gen. output (dBm)
Photo number Date
Transmitter tuned frequency MHz Peak power output dBm
Spectrum analyzer:
Bandwidth kHz
Sweep width MHz Sweep rate Hz
Comments
NOTE: Each vertical and horizontal reticle should be calibrated either with an attached calibrated curve or by scaling thephotograph.
FIGURE 11. Sample transmitter emission spectrum photograph data form.
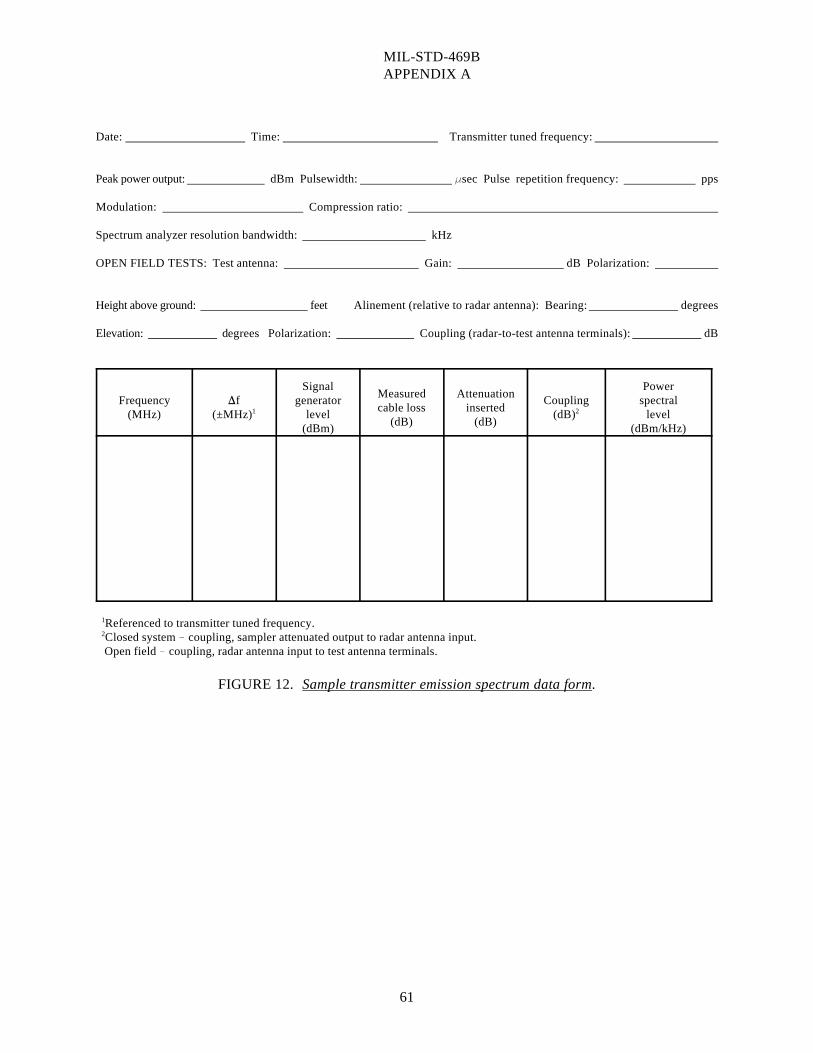
MIL-STD-469B APPENDIX A
61
Date: Time: Transmitter tuned frequency:
Peak power output: dBm Pulsewidth: sec Pulse repetition frequency: pps
Modulation: Compression ratio:
Spectrum analyzer resolution bandwidth: kHz
OPEN FIELD TESTS: Test antenna: Gain: dB Polarization:
Height above ground: feet Alinement (relative to radar antenna): Bearing: degrees
Elevation: degrees Polarization: Coupling (radar-to-test antenna terminals): dB
Frequency f generator Coupling spectral(MHz) (±MHz) level (dB) level1
Signal Power
(dBm) (dBm/kHz)
Measuredcable loss inserted
(dB) (dB)
Attenuation2
Referenced to transmitter tuned frequency.1
Closed system coupling, sampler attenuated output to radar antenna input.2
Open field coupling, radar antenna input to test antenna terminals.
FIGURE 12. Sample transmitter emission spectrum data form.
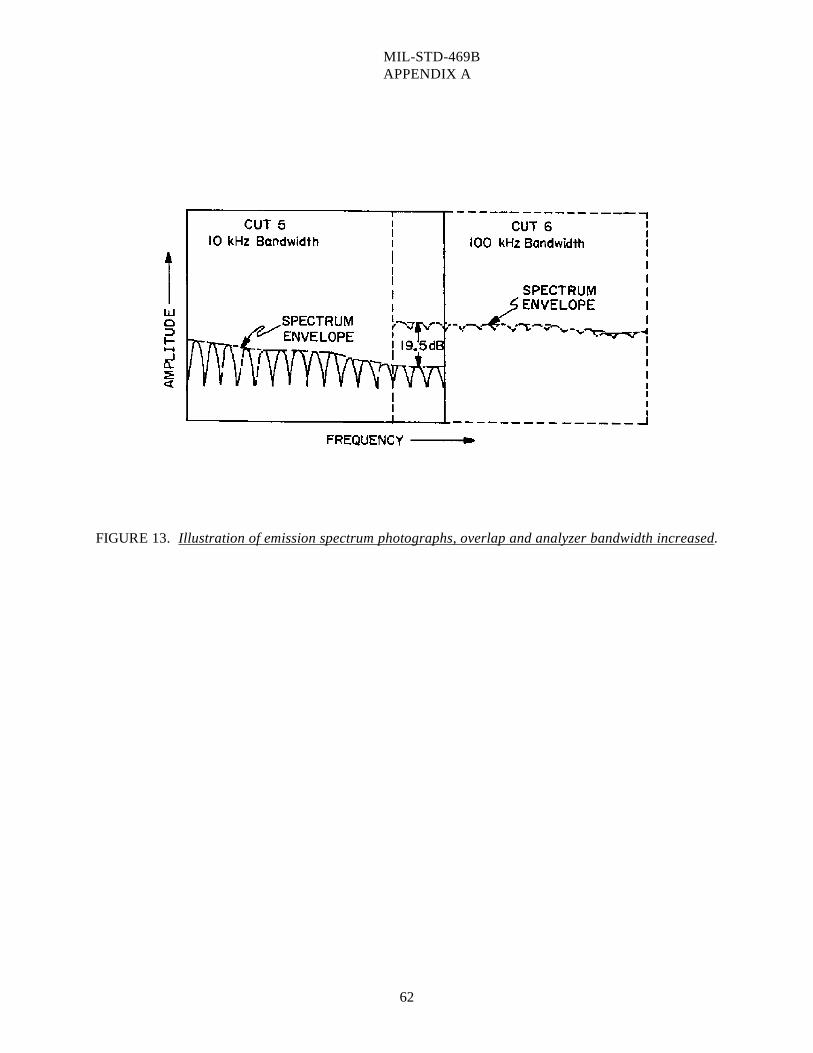
MIL-STD-469B APPENDIX A
62
FIGURE 13. Illustration of emission spectrum photographs, overlap and analyzer bandwidth increased.
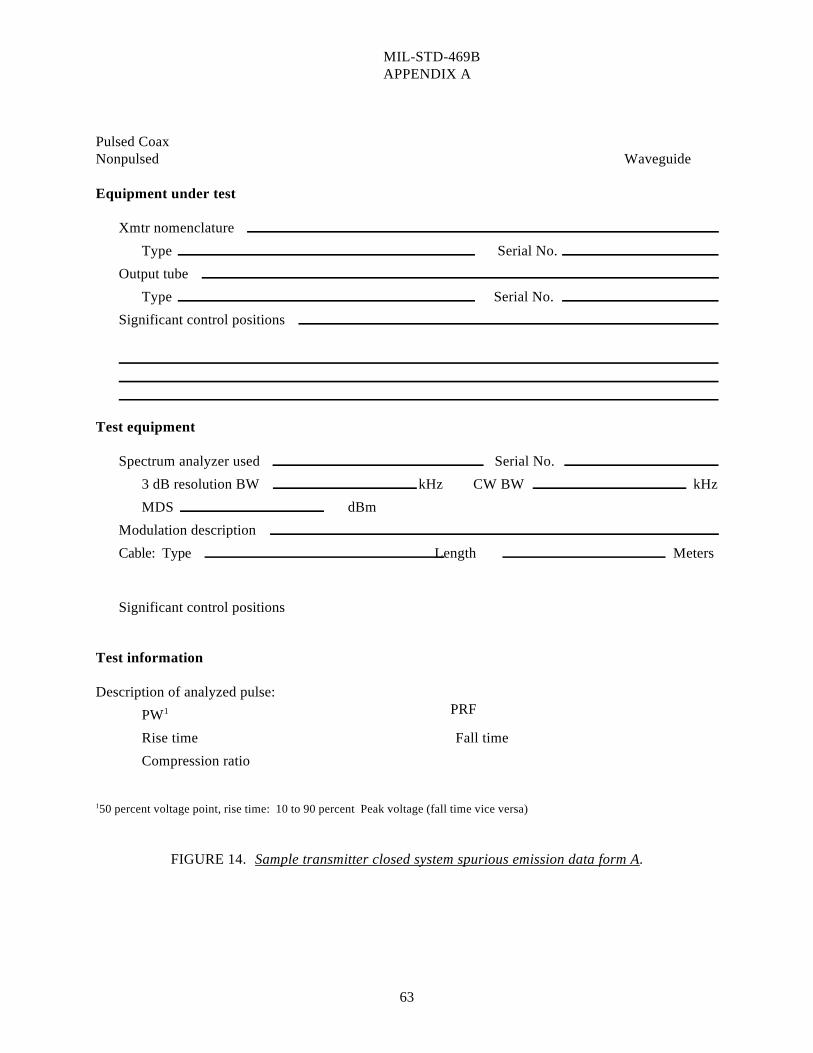
MIL-STD-469B APPENDIX A
63
Pulsed CoaxNonpulsed Waveguide
Equipment under test
Xmtr nomenclature
Type Serial No.
Output tube
Type Serial No.
Significant control positions
Test equipment
Spectrum analyzer used Serial No.
3 dB resolution BW kHz CW BW kHz
MDS dBm
Modulation description
Cable: Type Length Meters
Significant control positions
Test information
Description of analyzed pulse: PRF PW 1
Rise time Fall time
Compression ratio
50 percent voltage point, rise time: 10 to 90 percent Peak voltage (fall time vice versa)1
FIGURE 14. Sample transmitter closed system spurious emission data form A.
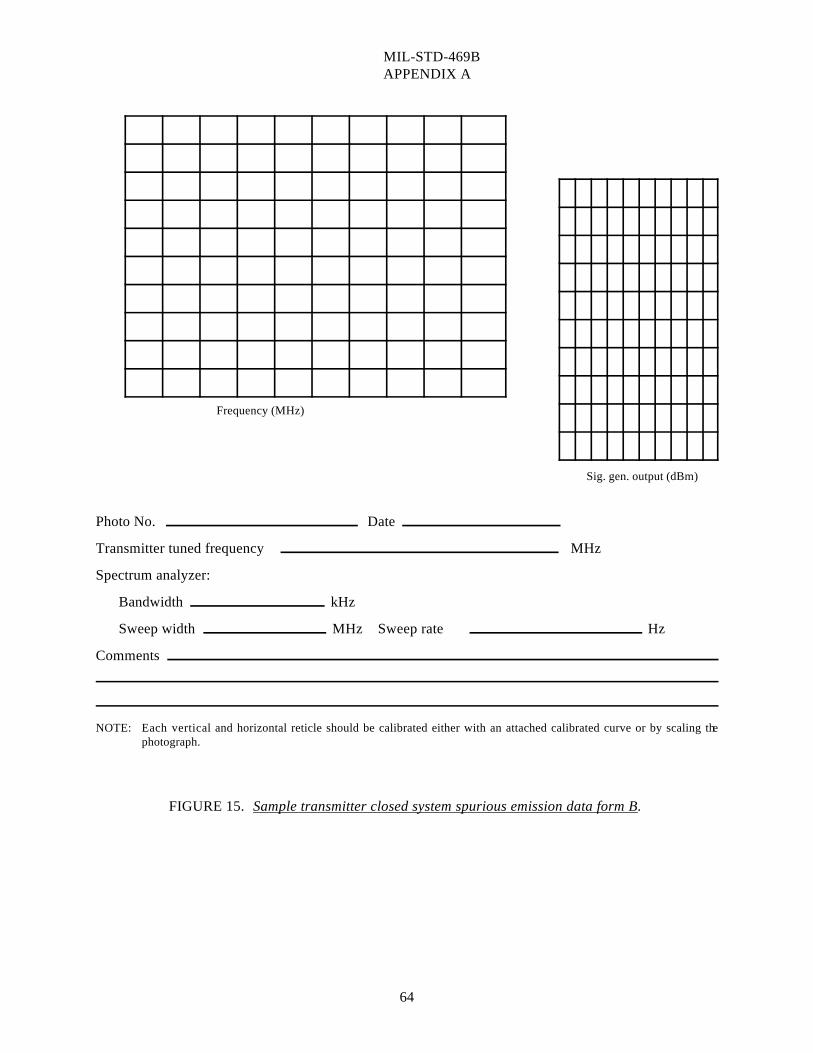
MIL-STD-469B APPENDIX A
64
Frequency (MHz)
Sig. gen. output (dBm)
Photo No. Date
Transmitter tuned frequency MHz
Spectrum analyzer:
Bandwidth kHz
Sweep width MHz Sweep rate Hz
Comments
NOTE: Each vertical and horizontal reticle should be calibrated either with an attached calibrated curve or by scaling thephotograph.
FIGURE 15. Sample transmitter closed system spurious emission data form B.
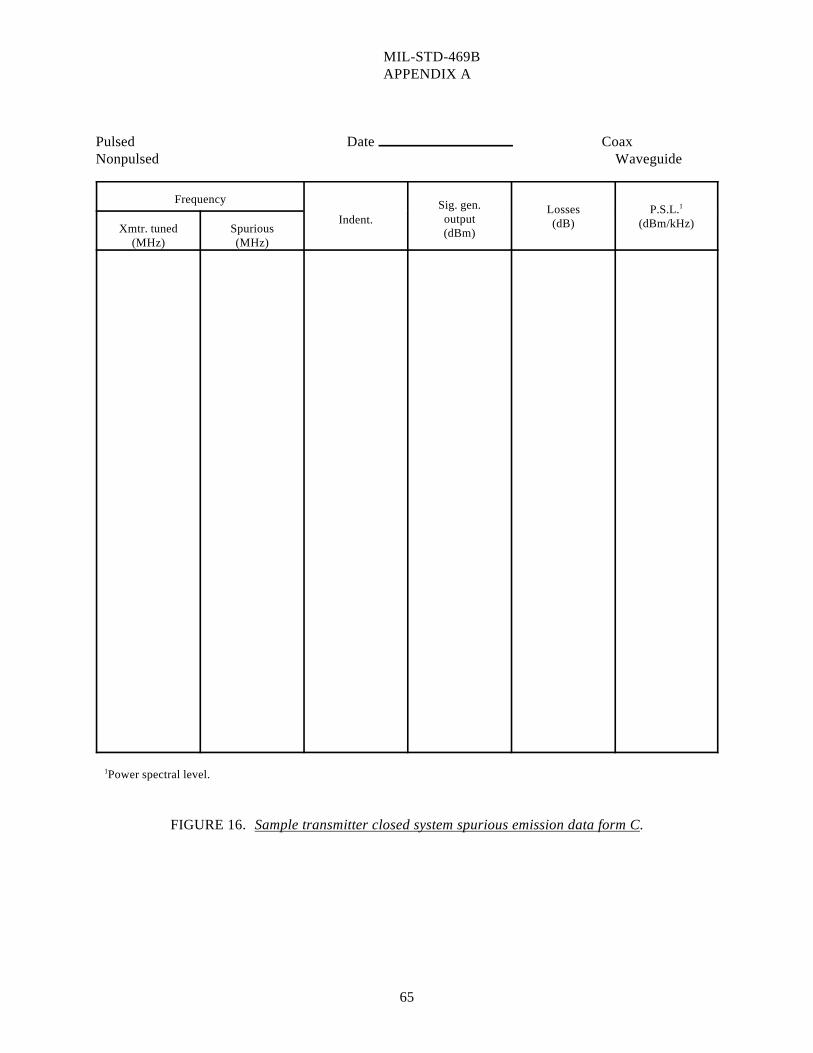
MIL-STD-469B APPENDIX A
65
Pulsed Date CoaxNonpulsed Waveguide
Frequency
Indent.Sig. gen.output(dBm)
Losses(dB) (dBm/kHz)
P.S.L.1
Xmtr. tuned Spurious(MHz) (MHz)
Power spectral level.1
FIGURE 16. Sample transmitter closed system spurious emission data form C.
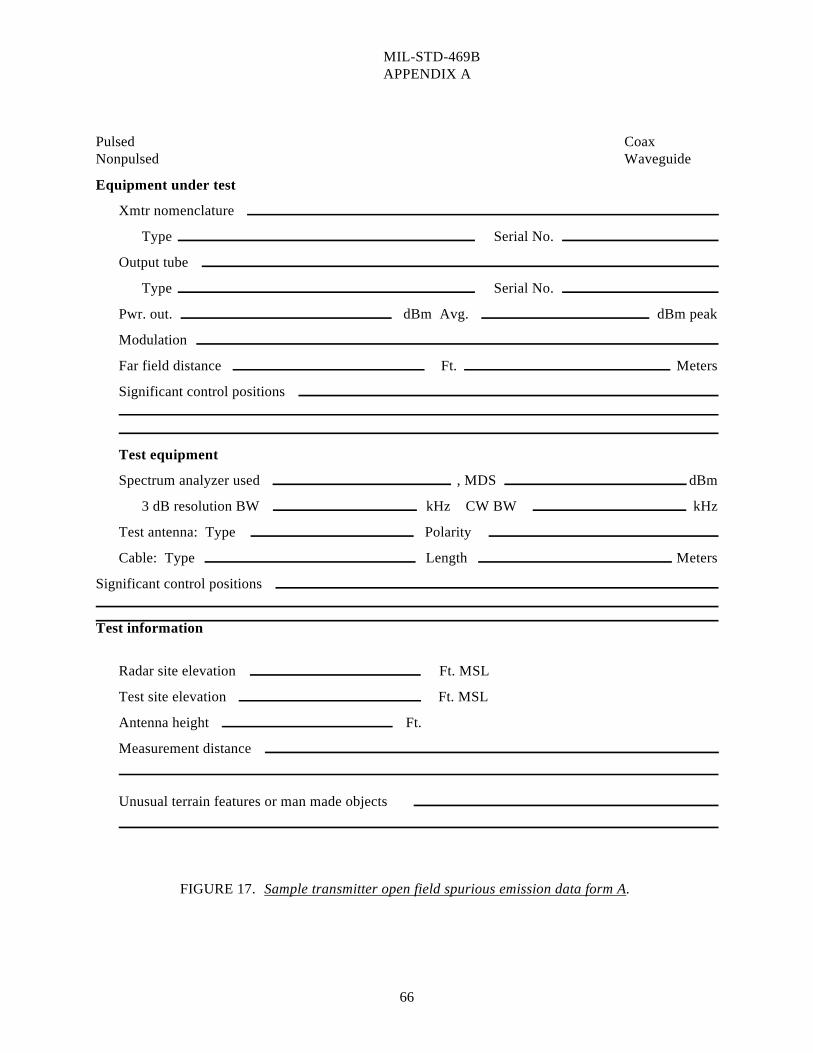
MIL-STD-469B APPENDIX A
66
Pulsed CoaxNonpulsed Waveguide
Equipment under test
Xmtr nomenclature
Type Serial No.
Output tube
Type Serial No.
Pwr. out. dBm Avg. dBm peak
Modulation
Far field distance Ft. Meters
Significant control positions
Test equipment
Spectrum analyzer used , MDS dBm
3 dB resolution BW kHz CW BW kHz
Test antenna: Type Polarity
Cable: Type Length Meters
Significant control positions
Test information
Radar site elevation Ft. MSL
Test site elevation Ft. MSL
Antenna height Ft.
Measurement distance
Unusual terrain features or man made objects
FIGURE 17. Sample transmitter open field spurious emission data form A.
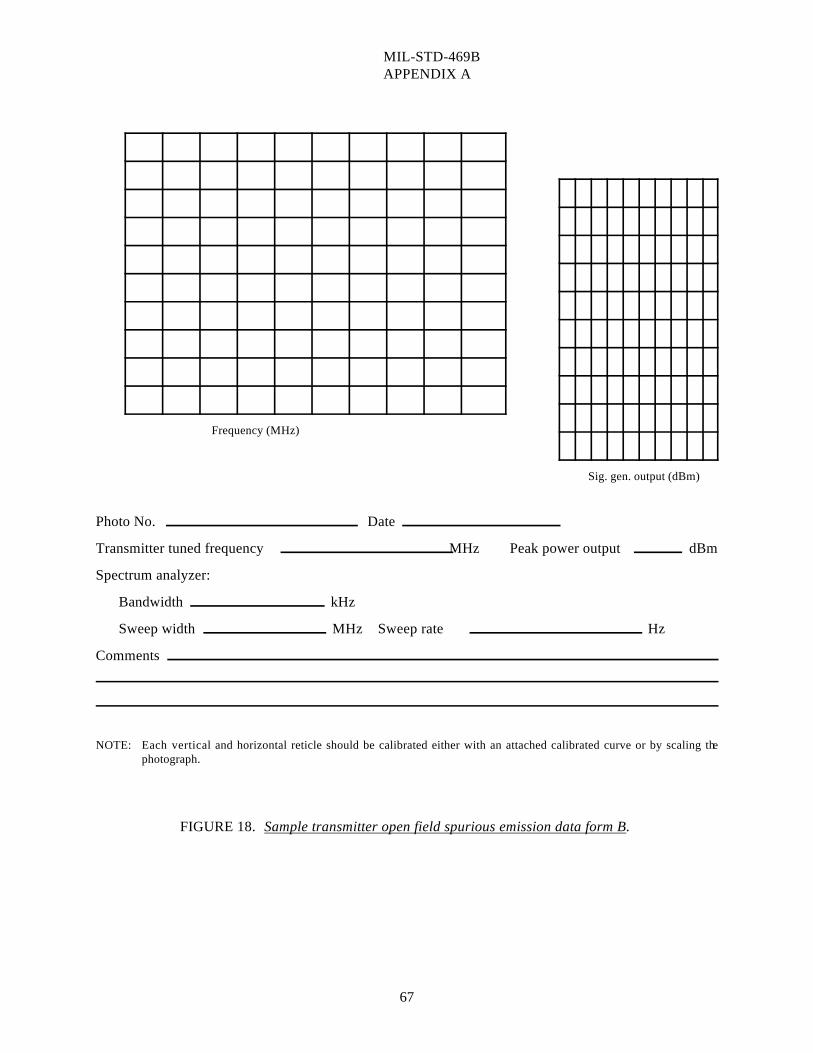
MIL-STD-469B APPENDIX A
67
Frequency (MHz)
Sig. gen. output (dBm)
Photo No. Date
Transmitter tuned frequency MHz Peak power output dBm
Spectrum analyzer:
Bandwidth kHz
Sweep width MHz Sweep rate Hz
Comments
NOTE: Each vertical and horizontal reticle should be calibrated either with an attached calibrated curve or by scaling thephotograph.
FIGURE 18. Sample transmitter open field spurious emission data form B.
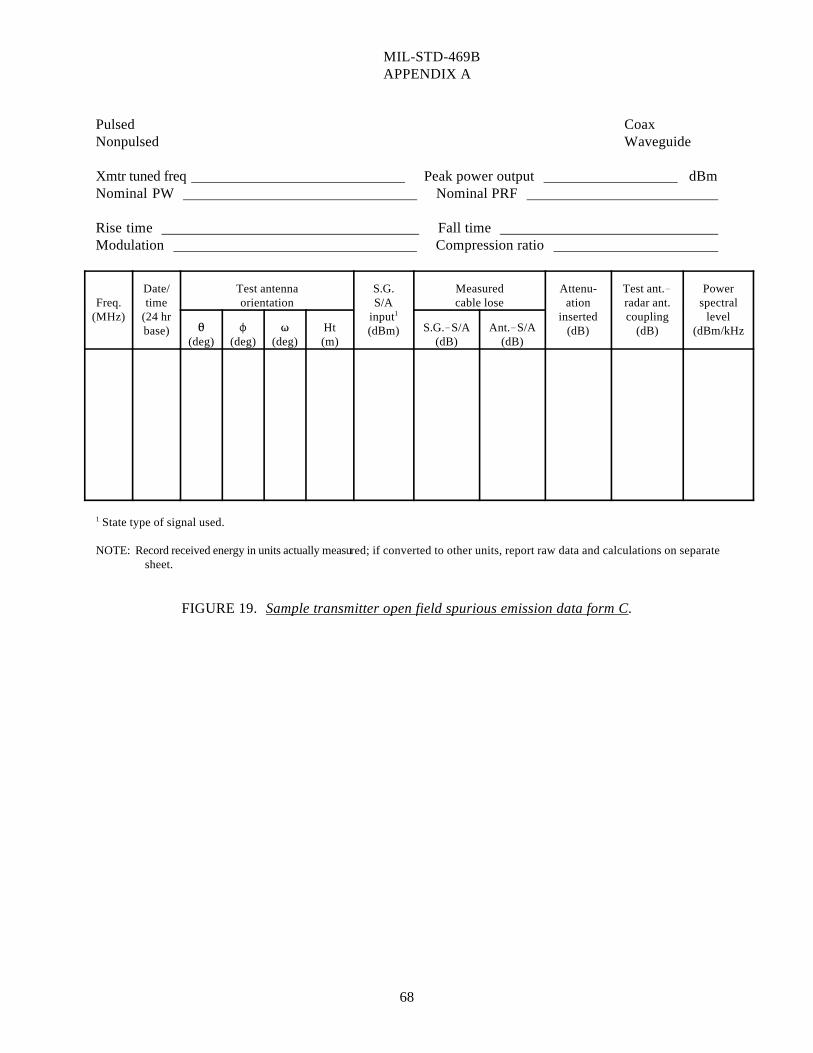
MIL-STD-469B APPENDIX A
68
Pulsed CoaxNonpulsed Waveguide
Xmtr tuned freq Peak power output dBmNominal PW Nominal PRF
Rise time Fall time Modulation Compression ratio
Freq. time orientation S/A cable lose ation radar ant. spectral(MHz) (24 hr input inserted coupling level
Date/ Test antenna S.G. Measured Attenu- Test ant. Power
base) (dBm) (dB) (dB) (dBm/kHz
1
Ht S.G. S/A Ant. S/A(deg) (deg) (deg) (m) (dB) (dB)
State type of signal used.1
NOTE: Record received energy in units actually measured; if converted to other units, report raw data and calculations on separate sheet.
FIGURE 19. Sample transmitter open field spurious emission data form C.
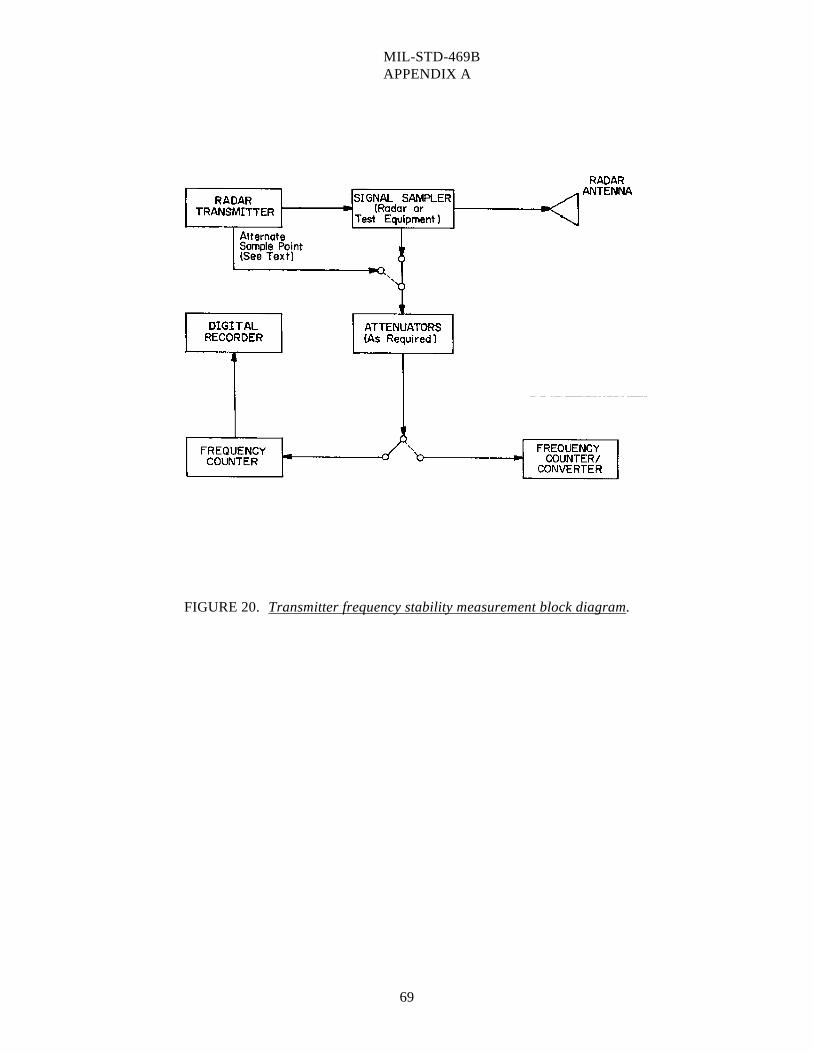
MIL-STD-469B APPENDIX A
69
FIGURE 20. Transmitter frequency stability measurement block diagram.
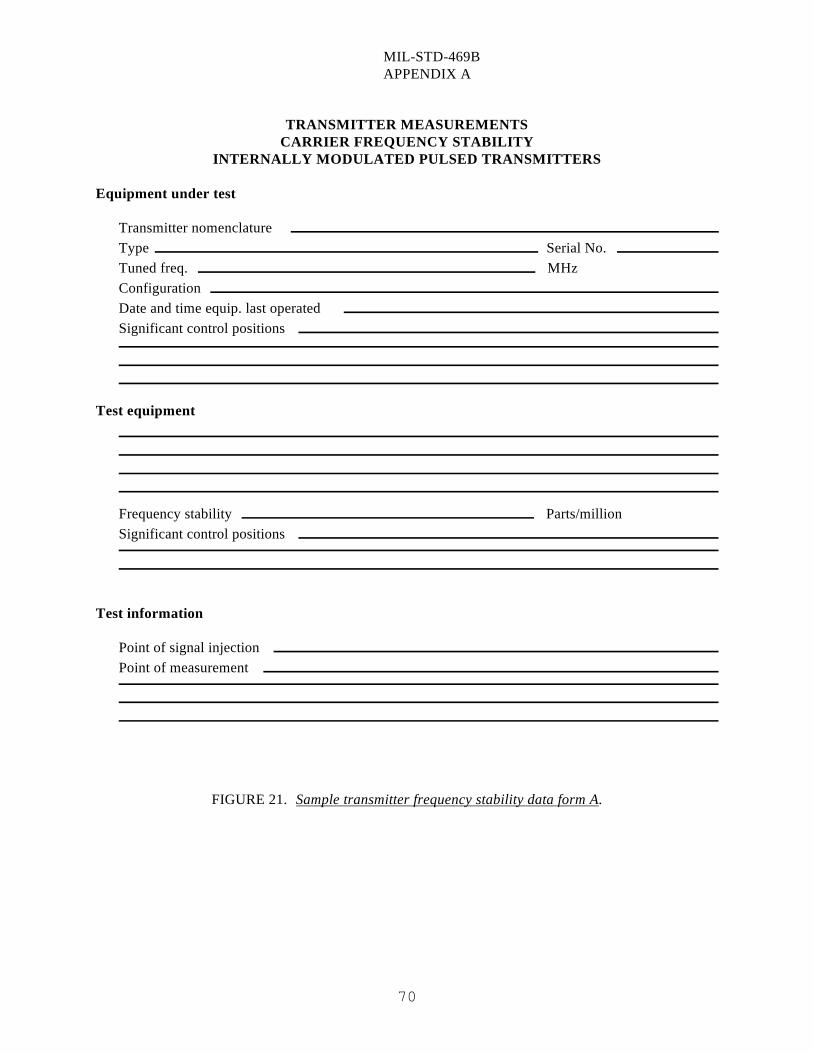
MIL-STD-469B APPENDIX A
70
TRANSMITTER MEASUREMENTSCARRIER FREQUENCY STABILITY
INTERNALLY MODULATED PULSED TRANSMITTERS
Equipment under test
Transmitter nomenclature Type Serial No. Tuned freq. MHzConfiguration Date and time equip. last operated Significant control positions
Test equipment
Frequency stability Parts/million Significant control positions
Test information
Point of signal injection Point of measurement
FIGURE 21. Sample transmitter frequency stability data form A.
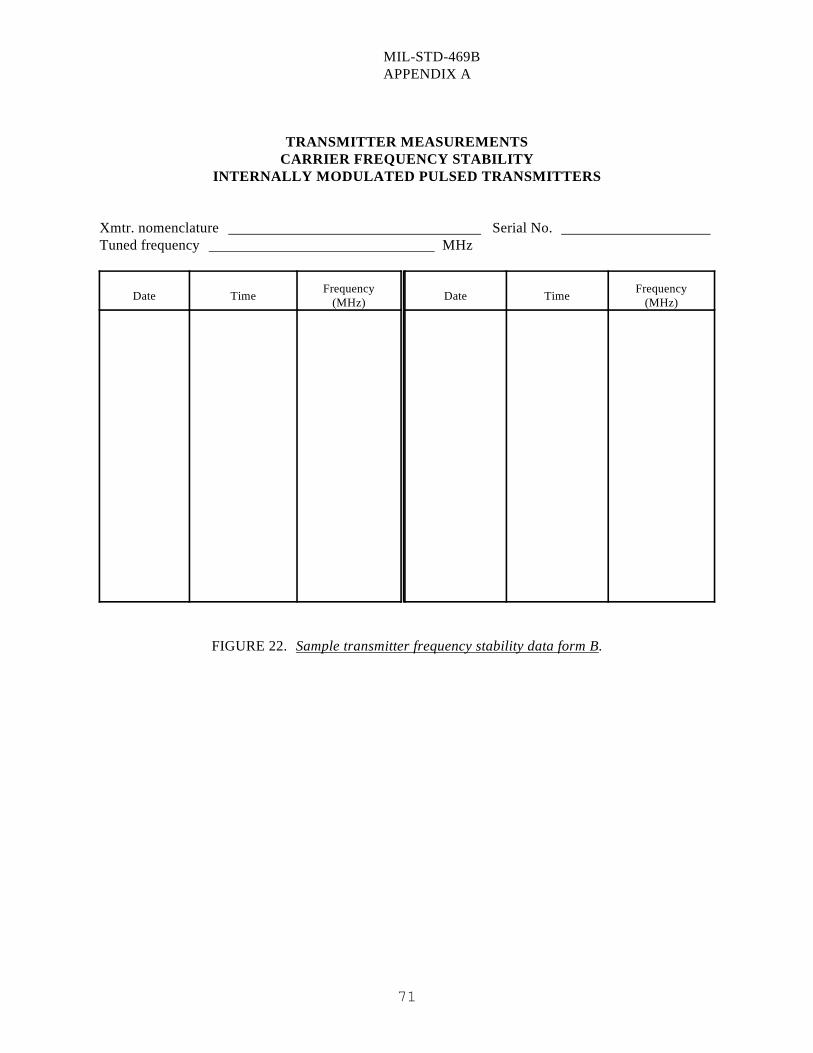
MIL-STD-469B APPENDIX A
71
TRANSMITTER MEASUREMENTSCARRIER FREQUENCY STABILITY
INTERNALLY MODULATED PULSED TRANSMITTERS
Xmtr. nomenclature Serial No. Tuned frequency MHz
(MHz) (MHz)Date Time Frequency FrequencyDate Time
FIGURE 22. Sample transmitter frequency stability data form B.
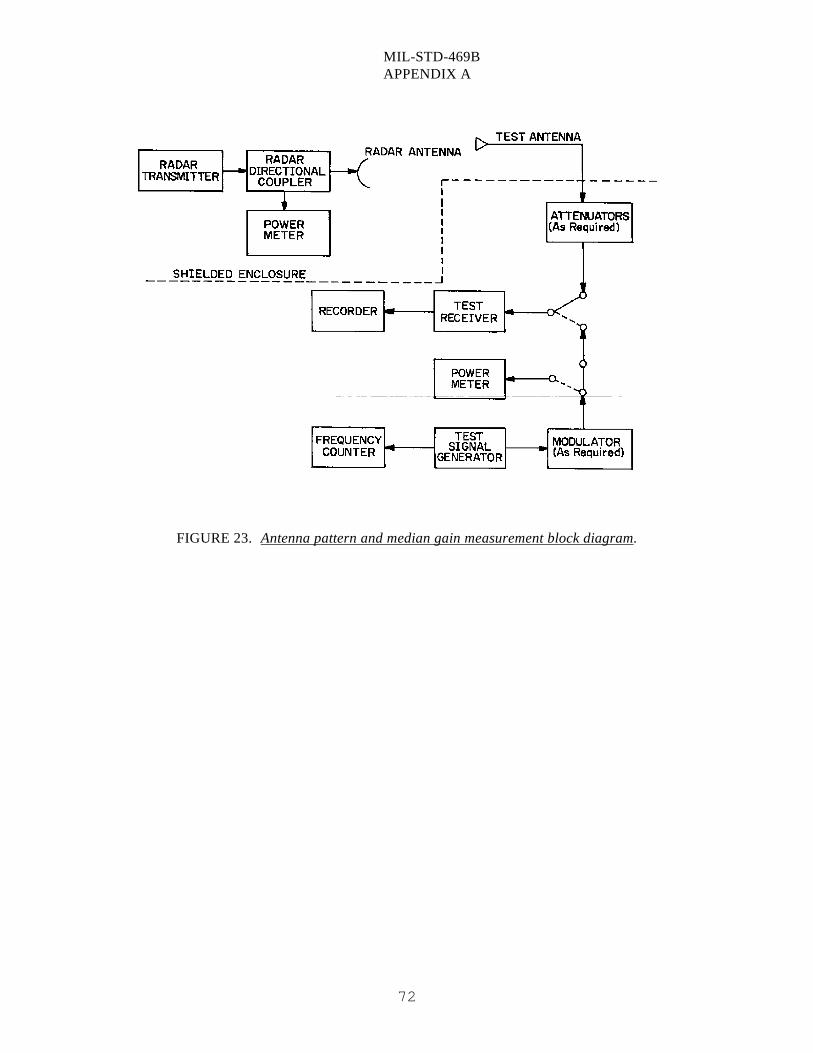
MIL-STD-469B APPENDIX A
72
FIGURE 23. Antenna pattern and median gain measurement block diagram.
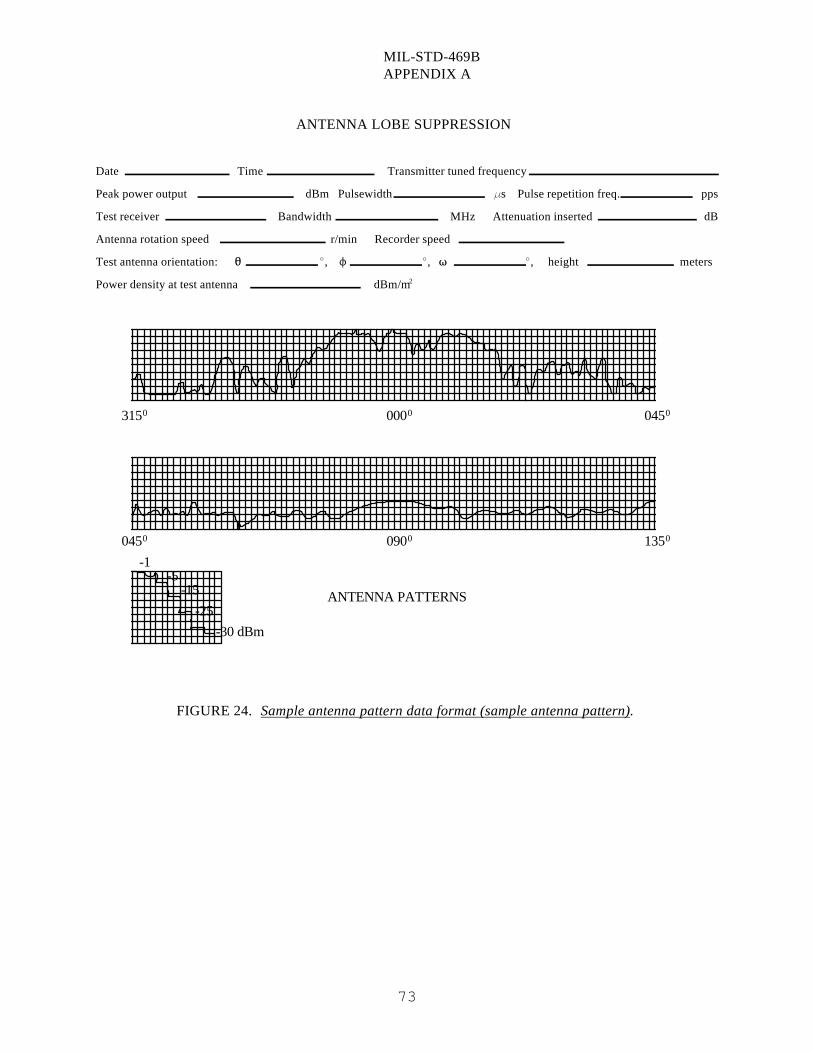
0000
0900
3150 0450
1350 0450
ANTENNA PATTERNS
-1-5
-15-25
-30 dBm
MIL-STD-469B APPENDIX A
73
ANTENNA LOBE SUPPRESSION
Date Time Transmitter tuned frequency
Peak power output dBm Pulsewidth s Pulse repetition freq. pps
Test receiver Bandwidth MHz Attenuation inserted dB
Antenna rotation speed r/min Recorder speed
Test antenna orientation: , , , height meters
Power density at test antenna dBm/m 2
FIGURE 24. Sample antenna pattern data format (sample antenna pattern).
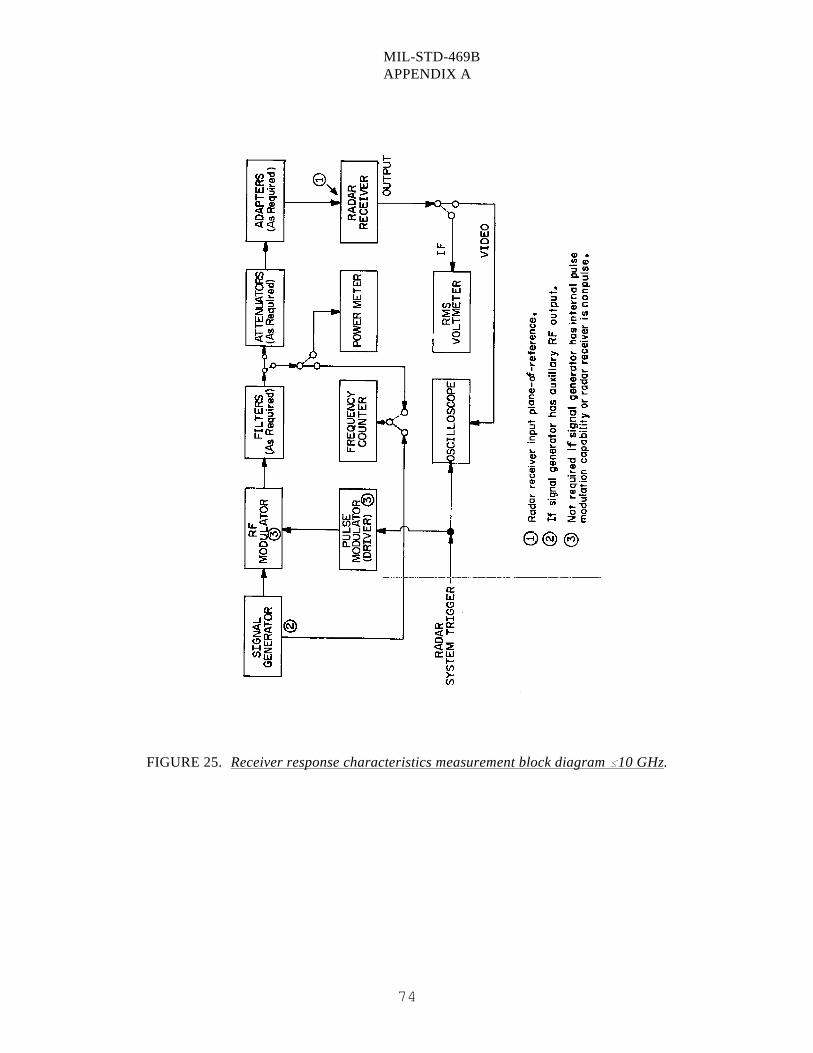
MIL-STD-469B APPENDIX A
74
FIGURE 25. Receiver response characteristics measurement block diagram 10 GHz.
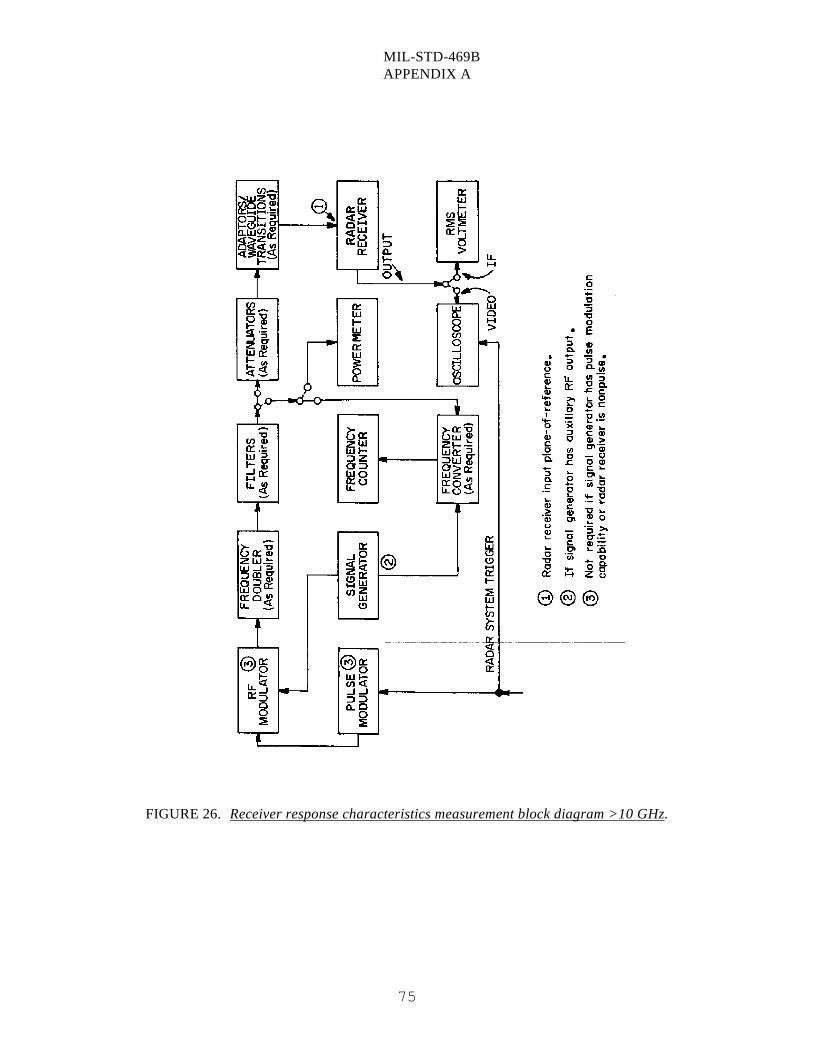
MIL-STD-469B APPENDIX A
75
FIGURE 26. Receiver response characteristics measurement block diagram >10 GHz.
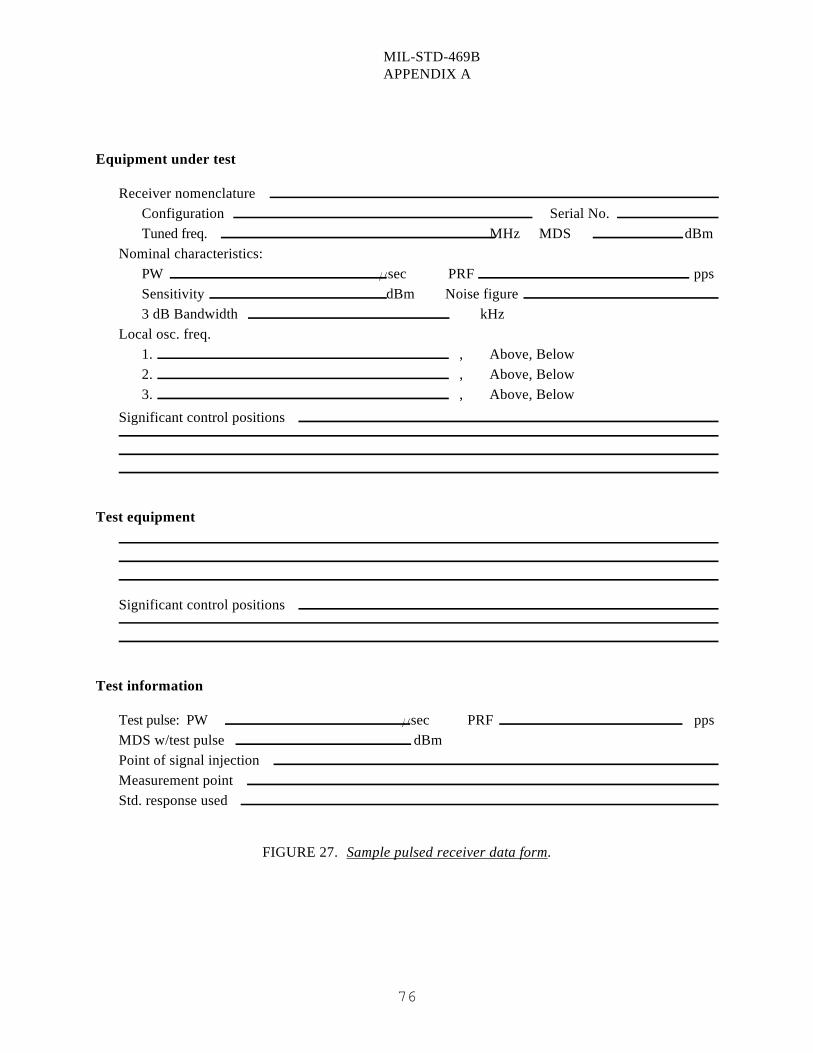
MIL-STD-469B APPENDIX A
76
Equipment under test
Receiver nomenclature Configuration Serial No. Tuned freq. MHz MDS dBm
Nominal characteristics:PW sec PRF ppsSensitivity dBm Noise figure3 dB Bandwidth kHz
Local osc. freq.1. , Above, Below2. , Above, Below3. , Above, Below
Significant control positions
Test equipment
Significant control positions
Test information
Test pulse: PW sec PRF ppsMDS w/test pulse dBmPoint of signal injection Measurement point Std. response used
FIGURE 27. Sample pulsed receiver data form.
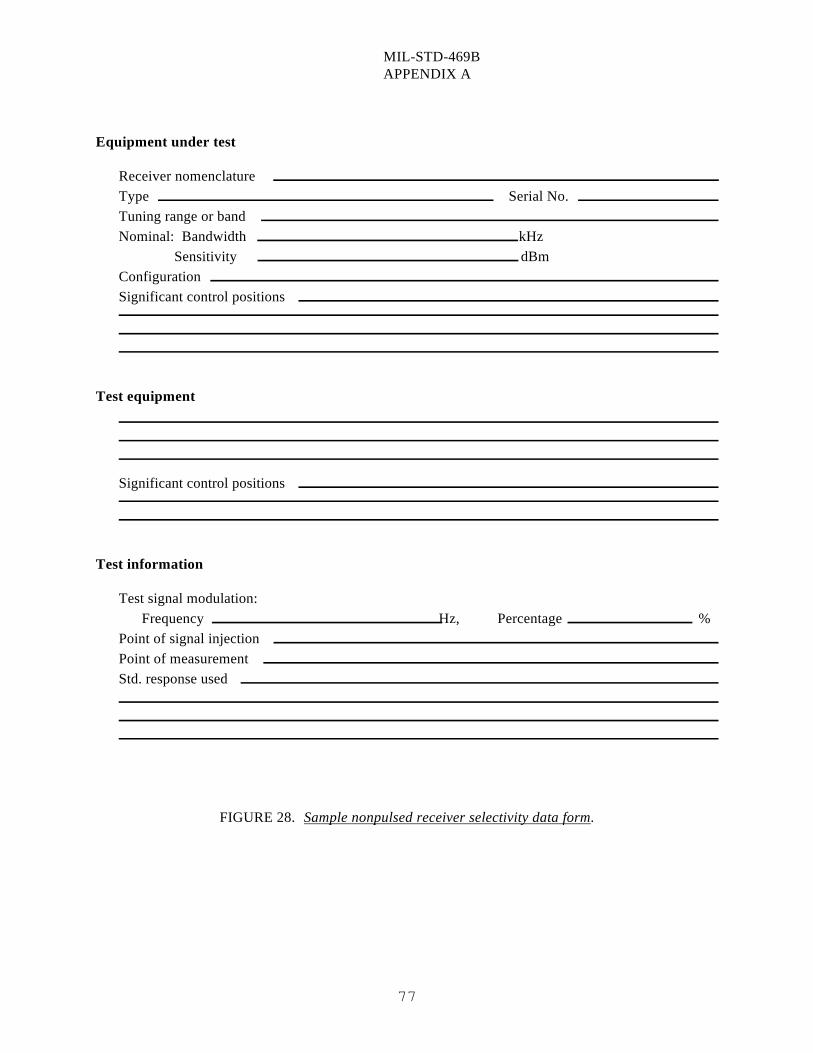
MIL-STD-469B APPENDIX A
77
Equipment under test
Receiver nomenclature Type Serial No.Tuning range or band Nominal: Bandwidth kHz Sensitivity dBmConfiguration Significant control positions
Test equipment
Significant control positions
Test information
Test signal modulation:Frequency Hz, Percentage %
Point of signal injection Point of measurement Std. response used
FIGURE 28. Sample nonpulsed receiver selectivity data form.
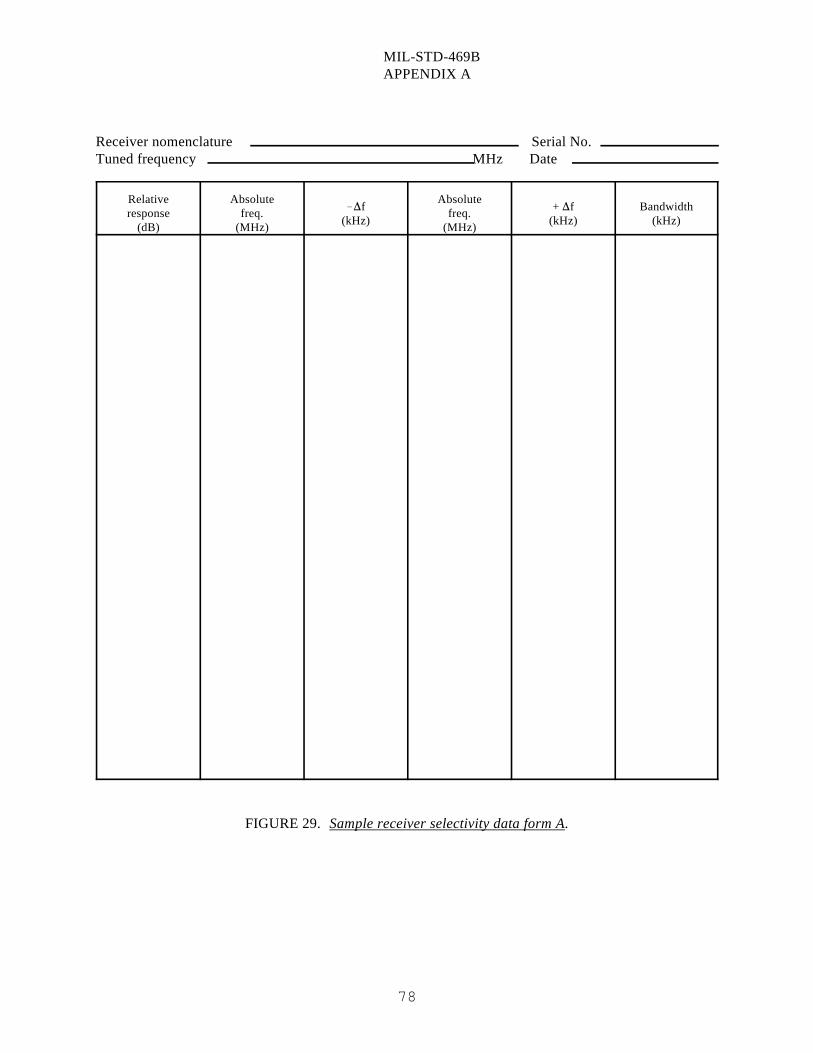
MIL-STD-469B APPENDIX A
78
Receiver nomenclature Serial No.Tuned frequency MHz Date
Relative Absolute Absoluteresponse freq. freq.
(dB) (MHz) (MHz)
f(kHz) (kHz) (kHz)
+ f Bandwidth
FIGURE 29. Sample receiver selectivity data form A.
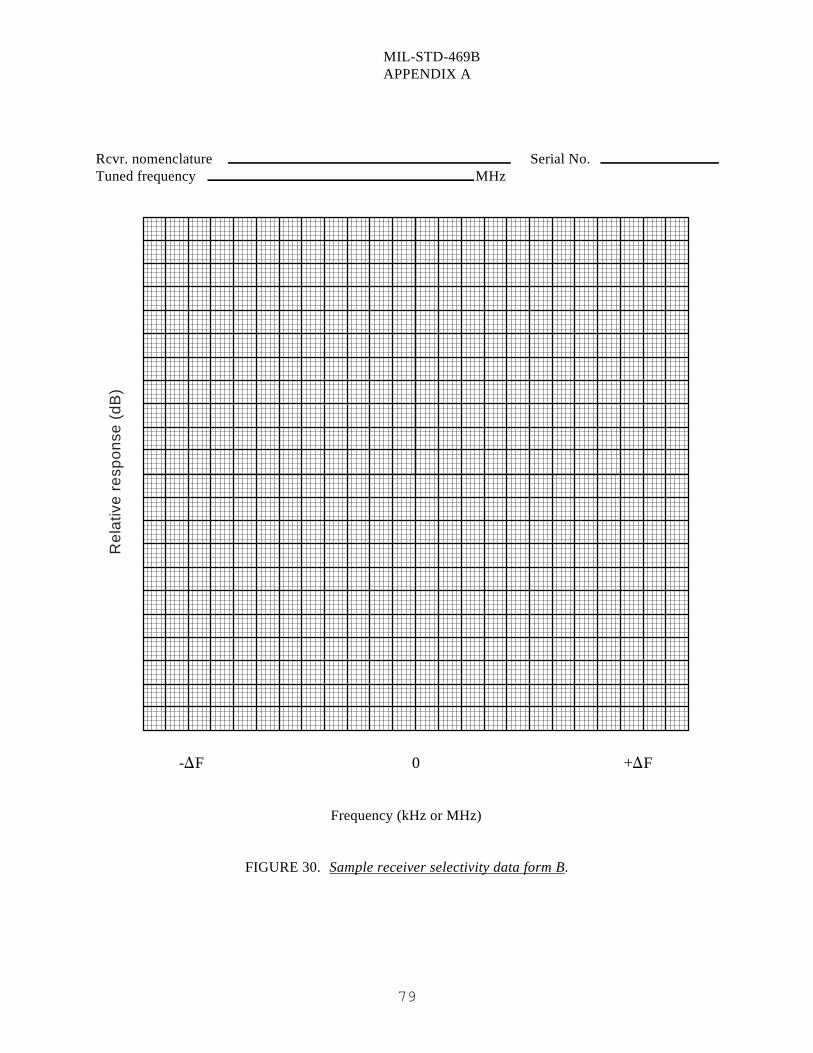
Rel
ativ
e re
spon
se (
dB)
MIL-STD-469B APPENDIX A
79
Rcvr. nomenclature Serial No. Tuned frequency MHz
- F 0 + F
Frequency (kHz or MHz)
FIGURE 30. Sample receiver selectivity data form B.
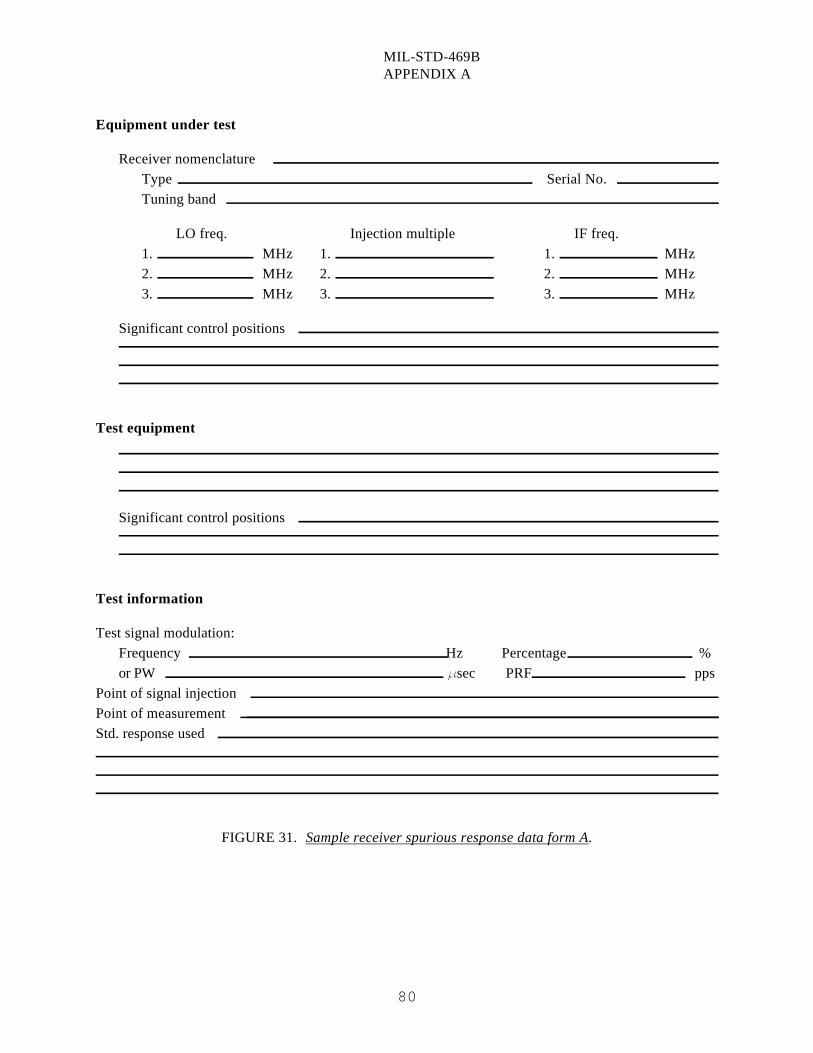
MIL-STD-469B APPENDIX A
80
Equipment under test
Receiver nomenclature Type Serial No.Tuning band
LO freq. Injection multiple IF freq.1. MHz 1. 1. MHz2. MHz 2. 2. MHz3. MHz 3. 3. MHz
Significant control positions
Test equipment
Significant control positions
Test information
Test signal modulation:Frequency Hz Percentage %or PW sec PRF pps
Point of signal injection Point of measurement Std. response used
FIGURE 31. Sample receiver spurious response data form A.
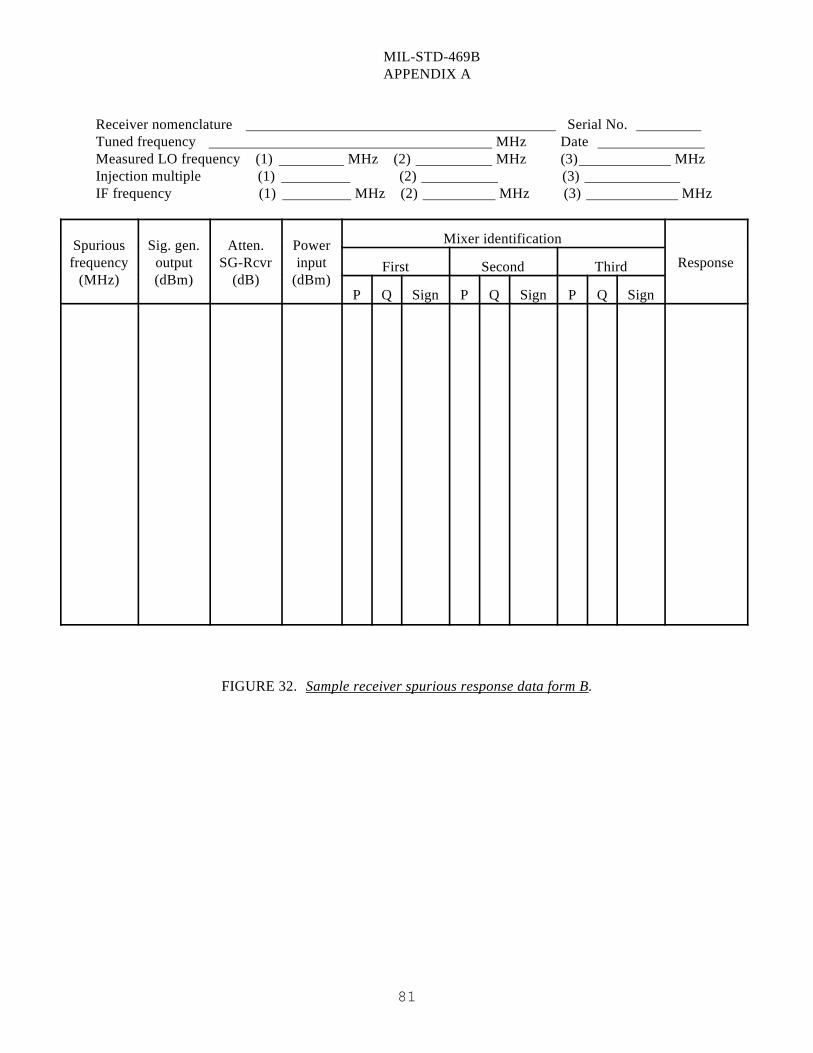
MIL-STD-469B APPENDIX A
81
Receiver nomenclature Serial No. Tuned frequency MHz Date Measured LO frequency (1) MHz (2) MHz (3) MHzInjection multiple (1) (2) (3) IF frequency (1) MHz (2) MHz (3) MHz
Mixer identificationSpuriousfrequency output SG-Rcvr input
(MHz) (dBm) (dB) (dBm)
Sig. gen. Atten. PowerResponseFirst Second Third
P Q Sign P Q Sign P Q Sign
FIGURE 32. Sample receiver spurious response data form B.
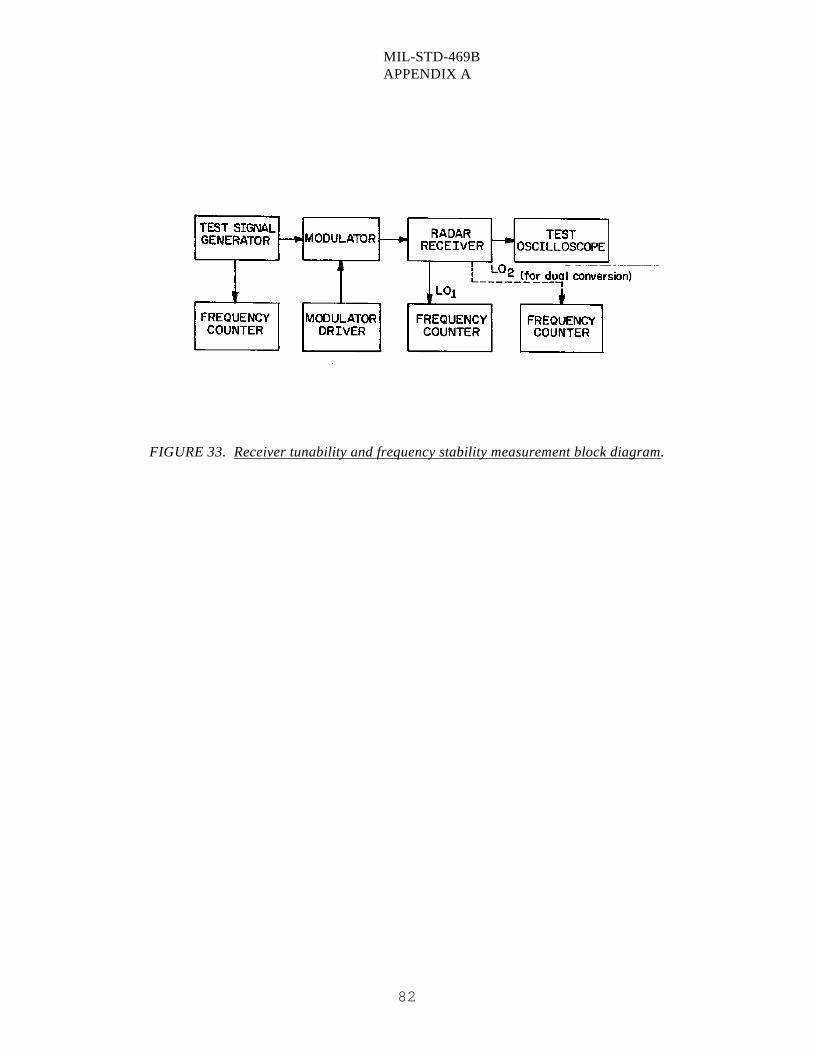
MIL-STD-469B APPENDIX A
82
FIGURE 33. Receiver tunability and frequency stability measurement block diagram.
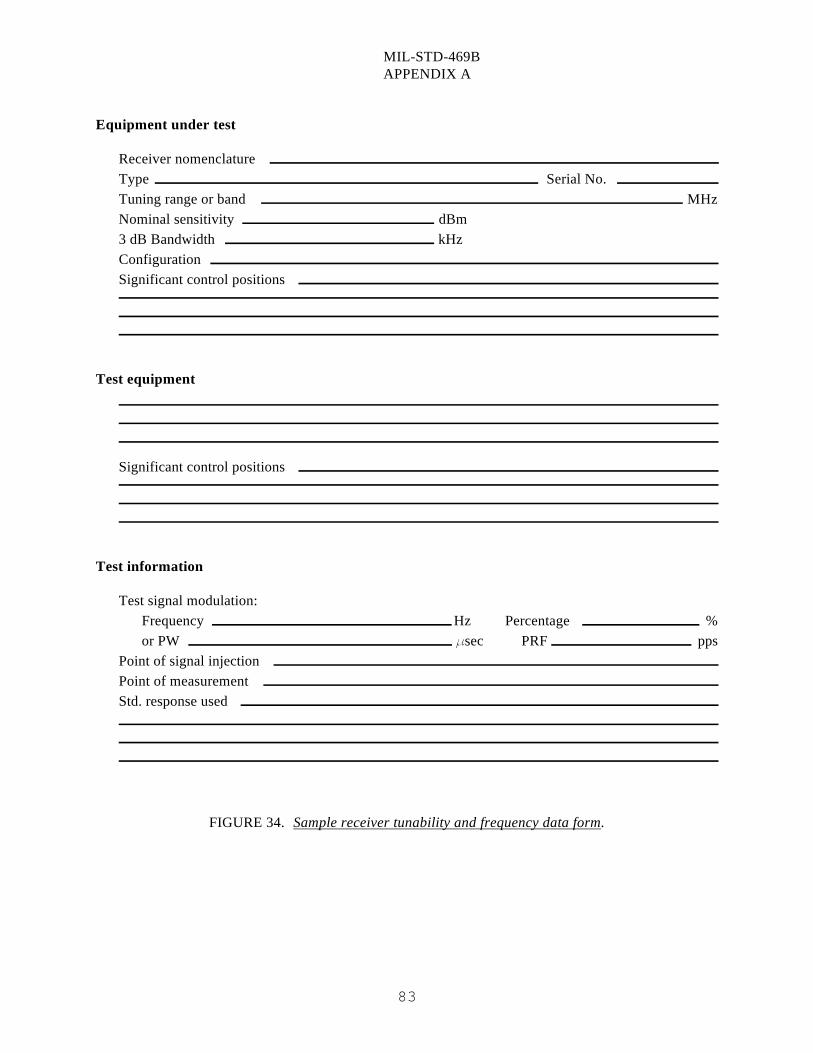
MIL-STD-469B APPENDIX A
83
Equipment under test
Receiver nomenclature Type Serial No.Tuning range or band MHzNominal sensitivity dBm3 dB Bandwidth kHzConfiguration Significant control positions
Test equipment
Significant control positions
Test information
Test signal modulation:Frequency Hz Percentage %or PW sec PRF pps
Point of signal injection Point of measurement Std. response used
FIGURE 34. Sample receiver tunability and frequency data form.
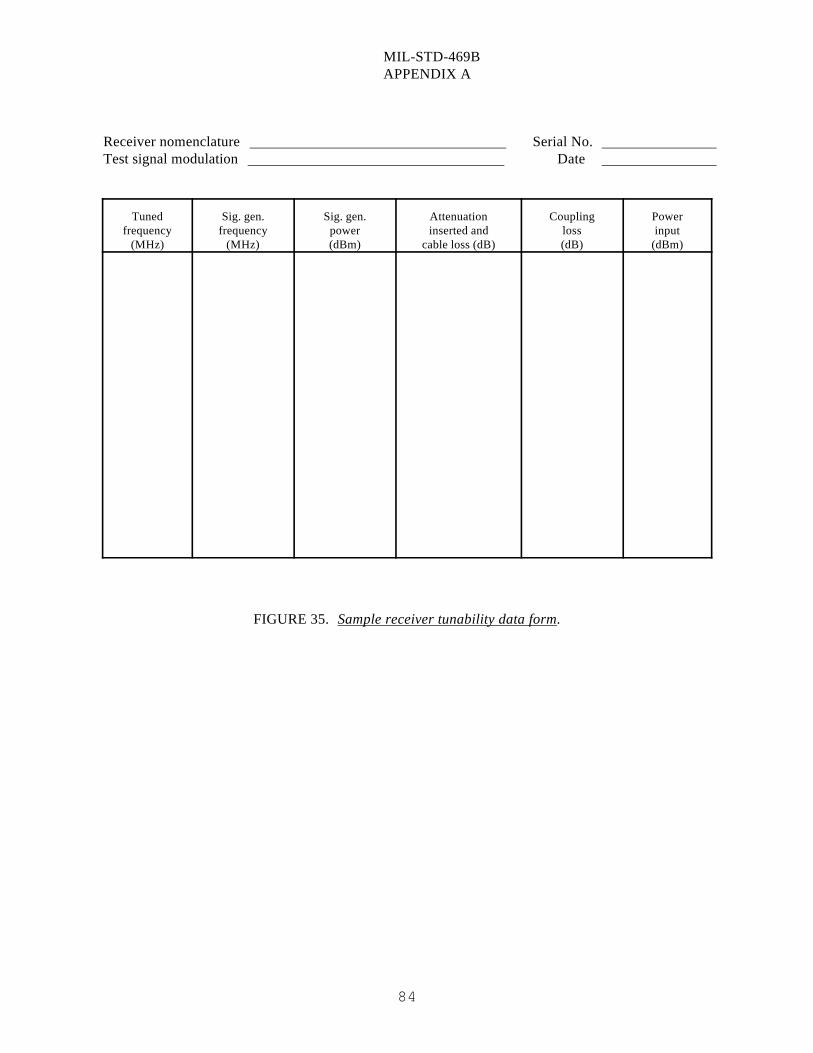
MIL-STD-469B APPENDIX A
84
Receiver nomenclature Serial No. Test signal modulation Date
Tuned Sig. gen. Sig. gen. Attenuation Coupling Powerfrequency frequency power inserted and loss input
(MHz) (MHz) (dBm) cable loss (dB) (dB) (dBm)
FIGURE 35. Sample receiver tunability data form.
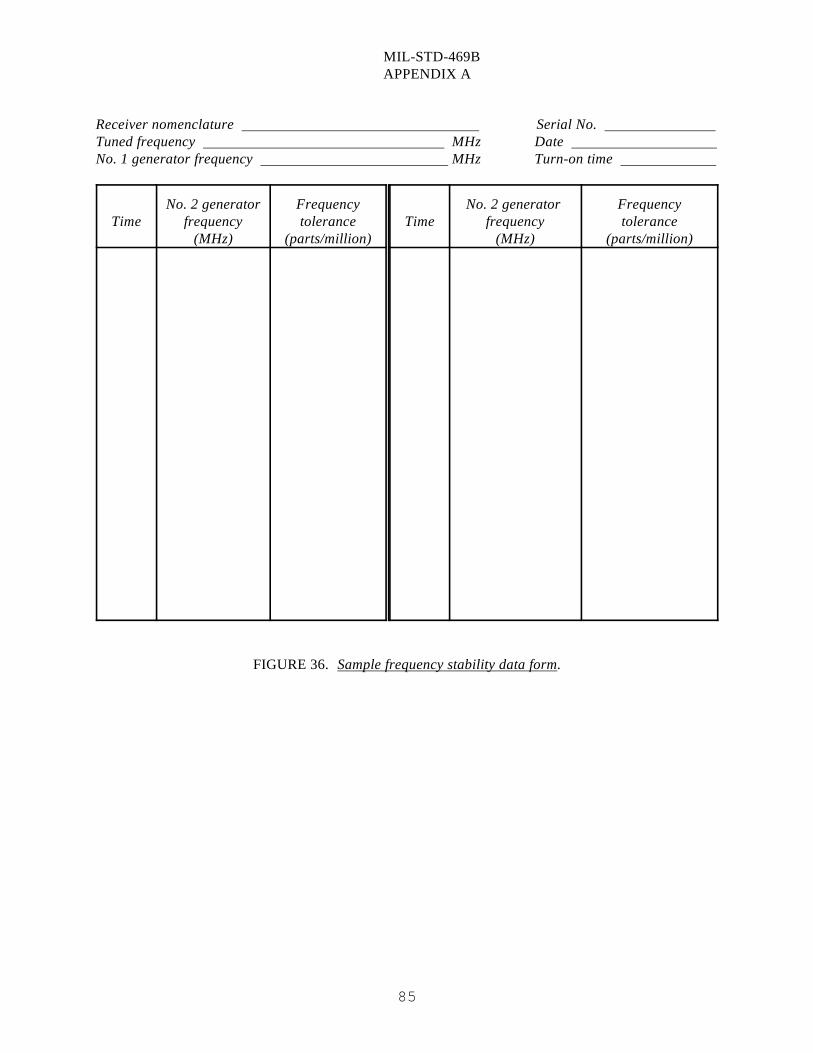
MIL-STD-469B APPENDIX A
85
Receiver nomenclature Serial No. Tuned frequency MHz Date No. 1 generator frequency MHz Turn-on time
Time frequency tolerance Time frequency toleranceNo. 2 generator Frequency No. 2 generator Frequency
(MHz) (parts/million) (MHz) (parts/million)
FIGURE 36. Sample frequency stability data form.
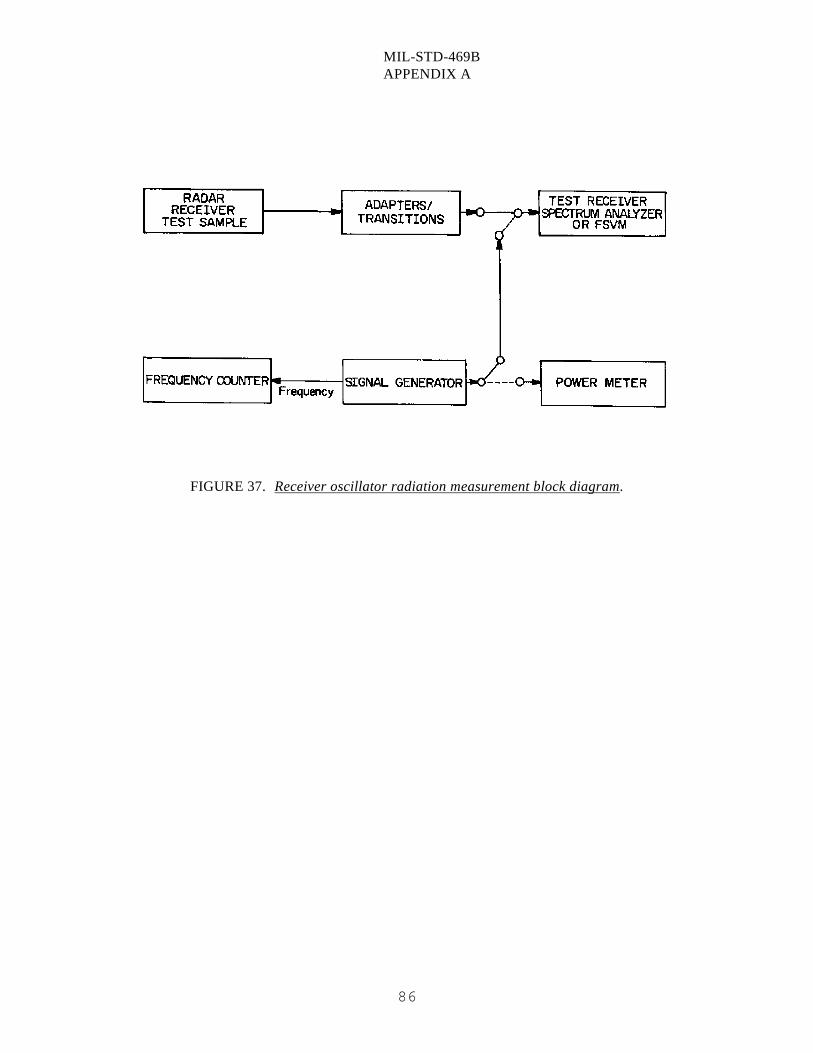
MIL-STD-469B APPENDIX A
86
FIGURE 37. Receiver oscillator radiation measurement block diagram.
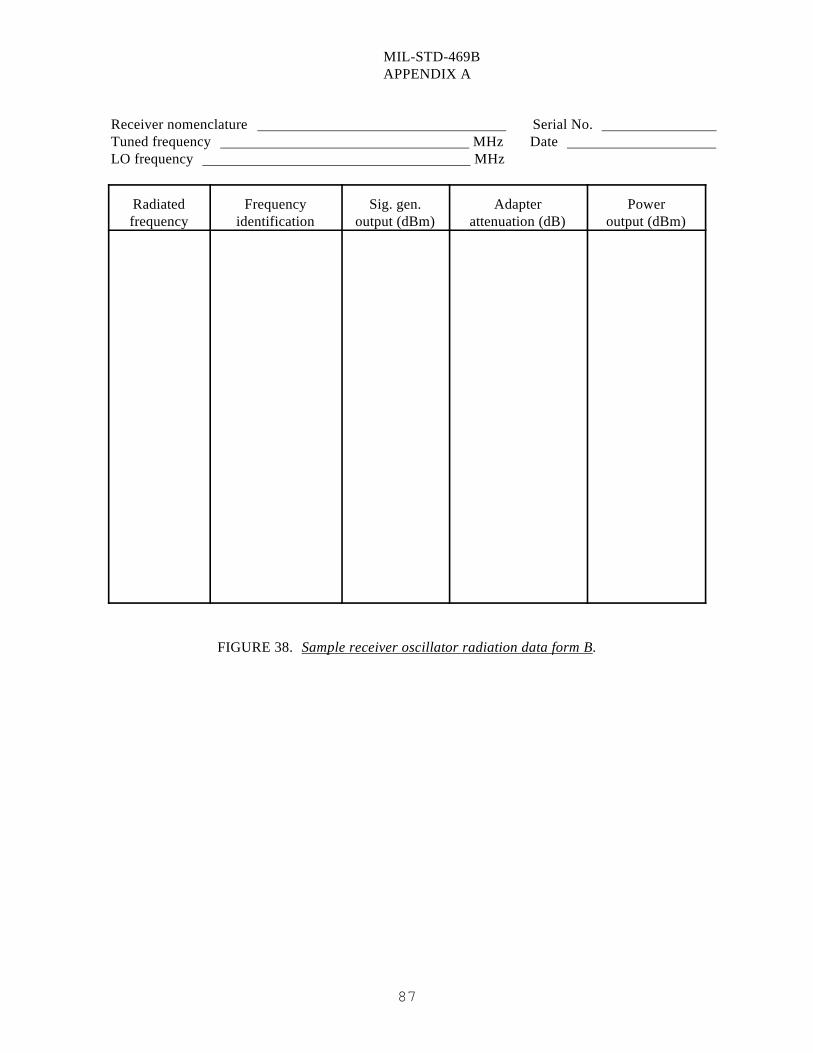
MIL-STD-469B APPENDIX A
87
Receiver nomenclature Serial No. Tuned frequency MHz Date LO frequency MHz
Radiated Frequency Sig. gen. Adapter Powerfrequency identification output (dBm) attenuation (dB) output (dBm)
FIGURE 38. Sample receiver oscillator radiation data form B.
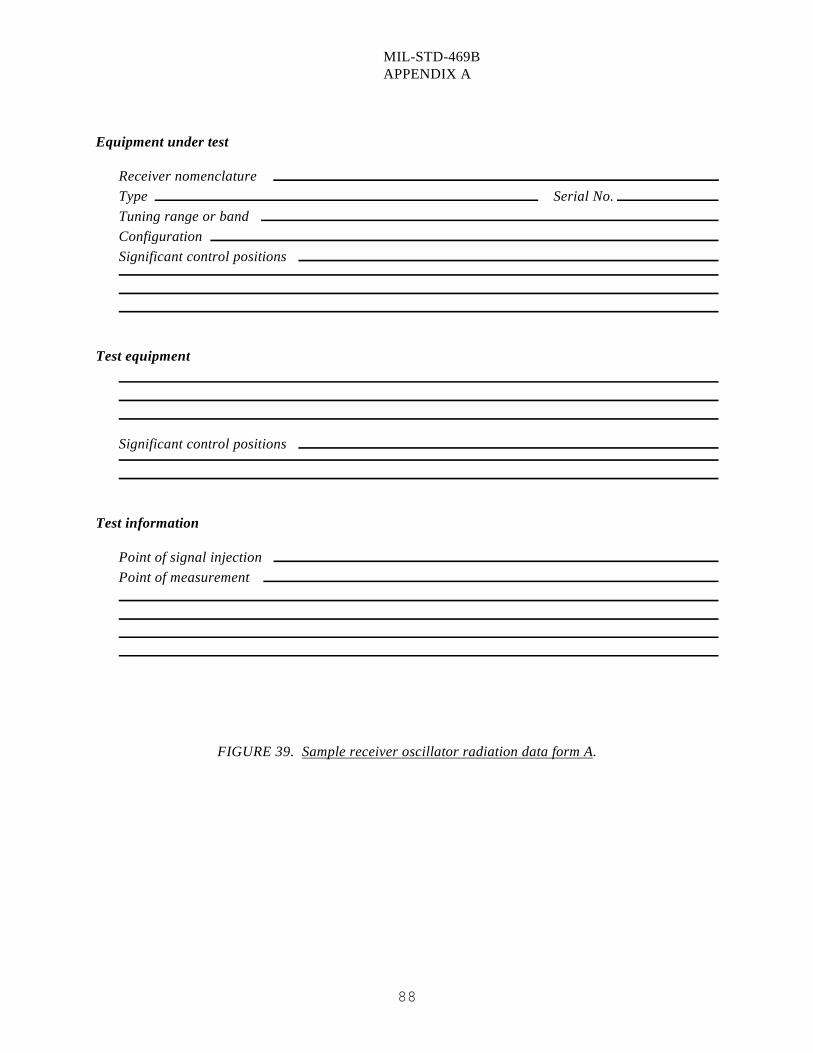
MIL-STD-469B APPENDIX A
88
Equipment under test
Receiver nomenclature Type Serial No.Tuning range or band Configuration Significant control positions
Test equipment
Significant control positions
Test information
Point of signal injection Point of measurement
FIGURE 39. Sample receiver oscillator radiation data form A.
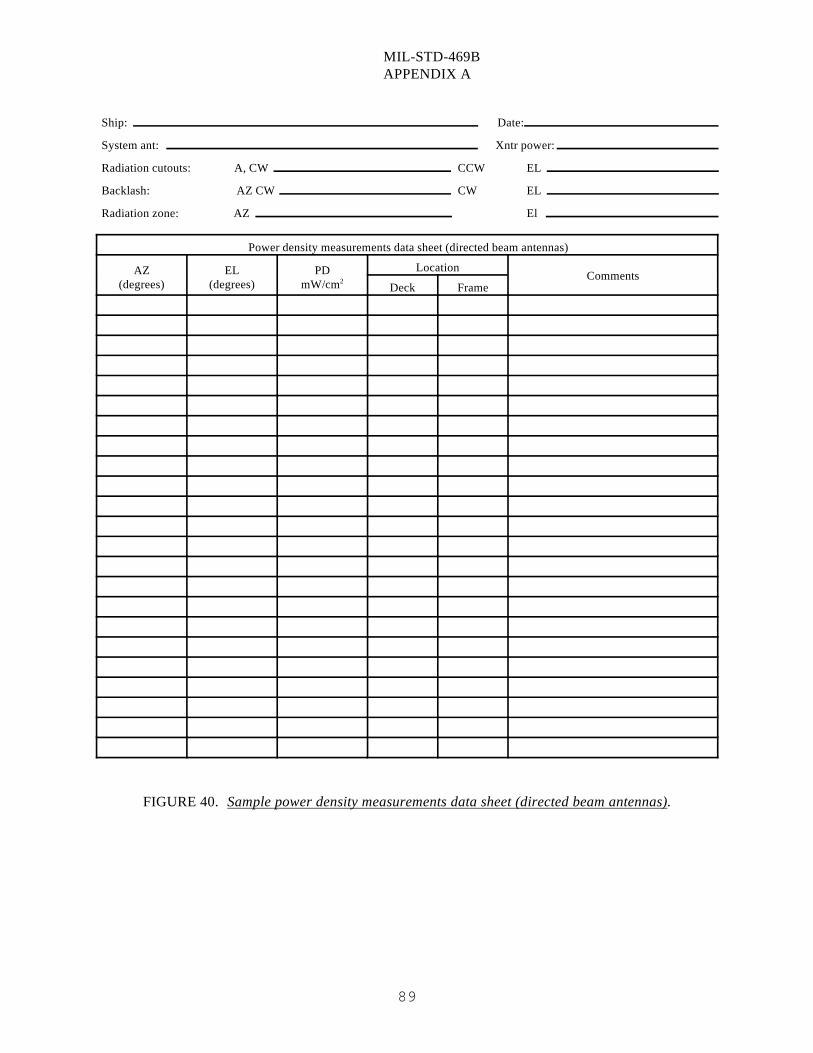
MIL-STD-469B APPENDIX A
89
Ship: Date:
System ant: Xntr power:
Radiation cutouts: A, CW CCW EL
Backlash: AZ CW CW EL
Radiation zone: AZ El
Power density measurements data sheet (directed beam antennas)
LocationAZ(degrees) (degrees) mW/cm
EL PD2 Comments
Deck Frame
FIGURE 40. Sample power density measurements data sheet (directed beam antennas).
STANDARDIZATION DOCUMENT IMPROVEMENT PROPOSALINSTRUCTIONS
1. The preparing activity must complete blocks 1, 2, 3, and 8. In block 1, both the document number and revision letter should begiven.
2. The submitter of this form must complete blocks 4, 5, 6, and 7.
3. The preparing activity must provide a reply within 30 days from receipt of the form.
NOTE: This form may not be used to request copies of documents, nor to request waivers, or clarification of requirements on currentcontracts. Comments submitted on this form do not constitute or imply authorization to waive any portion of the referenceddocument(s) or to amend contractual requirements.
I RECOMMEND A CHANGE: 1. DOCUMENT NUMBERMIL-STD-469B
2. DOCUMENT DATE (YYMMDD)960624
3. DOCUMENT TITLE RADAR ENGINEERING INTERFACE REQUIREMENTS, ELECTROMAGNETIC COMPATIBILITY
4. NATURE OF CHANGE (Identify paragraph number and include proposed rewrite, if possible. Attach extra sheets as needed.)
5. REASON FOR RECOMMENDATION
6. SUBMITTERa. NAME (Last, First, Middle Initial) b. ORGANIZATION
c. ADDRESS (Include Zip Code) d. TELEPHONE (Include Area Code)(1) Commercial
(2) AUTOVON(if applicable)
7.DATE SUBMITTED(YYMMDD)
8. PREPARING ACTIVITY
NAME Technical Point of Contact (TPOC)MR. JOSEPH JURAS SEA 03K2B
b. TELEPHONE Include Area Code)(1) Commercial (2) AUTOVON
703-602-9370 EXT 219 332-9370
c. ADDRESS (Include Zip Code)COMMANDER, NAVAL SEA SYSTEMS COMMAND
ATTN: SEA 03R42 2531 JEFFERSON DAVIS HIGHWAY, ARLINGTON, VA 22242-5160
IF YOU DO NOT RECEIVE A REPLY WITHIN 45 DAYS, CONTACT:DEFENSE QUALITY AND STANDARDIZATION OFFICE5203 Leesburg Pike, Suite 1403, Falls Church, VA 22401-3466Telephone (703) 756-2340 AUTOVON 289-2340
DD Form 1426, OCT 89 Previous editions are obsolete. 198/290


![D STD ]STD W T STD WXŒP ST DDDDD ...d ˙˛~q˚std˙˛ tw•p˛]std˙˛w_t˜ std˙˛wxŒp st ddddd (¤ dfid˙˛ƒtw]std˙!ƒstdddddddddddd dddddddddddddddddddddhµµµµµµµ! xstd⁄n"]std#wt˜x](https://img.pdfslide.us/doc/110x75/5f0a52c07e708231d42b1742/d-std-std-w-t-std-wxp-st-ddddd-d-qstd-twapstdwtoe-stdwxp.jpg)