Embed Size (px)
Citation preview

Department of Civil and Environmental Engineering
Stanford University
THEORY AND APPLICATION OF EXPERIMENTAL MODEL ANALYSIS IN EARTHQUAKE ENGINEERING
by
Piotr D. Moncarz
and
Helmut Krawinkler
Report No. 50 June 1981

The John A. Blume Earthquake Engineering Center was established to promote research and education in earthquake engineering. Through its activities our understanding of earthquakes and their effects on mankind’s facilities and structures is improving. The Center conducts research, provides instruction, publishes reports and articles, conducts seminar and conferences, and provides financial support for students. The Center is named for Dr. John A. Blume, a well-known consulting engineer and Stanford alumnus. Address: The John A. Blume Earthquake Engineering Center Department of Civil and Environmental Engineering Stanford University Stanford CA 94305-4020 (650) 723-4150 (650) 725-9755 (fax) earthquake @ce. stanford.edu http://blume.stanford.edu
©1981 The John A. Blume Earthquake Engineering Center

THEORY AND APPLICATION OF EXPERIMENTAL
MODEL ANALYSIS IN EARTHQUAKE ENGINEERING
by
PiOtr D. Moncarz
and
Helmut Krawinkler
The John A. Blume Earthquake Engineering Center
Department of Civil Engineering
Stanford University
Stanford ~ California 94305
A Report on a Research Proj ect Sponsored by the
NATIONAL SCIENCE FOUNDATION
Grants ENV75-20036 and ENV77-14444
June 1981

Abstract
ABSTRACT
This report summarizes part of a four year study on the feasibility
and lim! tations of small-scale model studies in earthquake engineering
research and practice. The emphasis is placed on dynamic modeling theo-
ry, a study of the mechanical properties of model materials, the develop-
ment of suitable model construction techniques and an evaluation of the
accuracy of prototype response prediction through model case studies on
components and simple structures. Steel and reinforced concrete struc-
tures are considered in this study.
The basics of similitude theory and its application to the modeling
of dynamically excited structures are reviewed and similitude laws for
various types of models are developed. These models include true replica
models in which all physical quantities are properly simulated, and va-
rious kinds of adequate models in which the violation of specific simili-
tude laws does not affect appreciably the response prediction.
Adequat~ simulation of material properties was found to be the most
important aspect or model research, particularly under dynamic excita-
tlons. Materials for modeling of steel structures (structural steel and
copper alloy 510) and reinforced concrete structures (wire-reinforced mi-
croconcrete) are investigated under low and high strain rates and with
due regard to cyclic load effects. A comprehensive set of material data
inis assembled for direct use model studies, and systematic material
procedurestesting developed for the investigation of alternativeare
model mterials.
Problems encountered in the construction of models are identified
and are made for the fabrication and joining of modelrecommendations

Abstract
elements for steel well as for microconcrete mix designstructures as
practices, fabrication of model reinforcement and fabrication and curing
of reinforced m1croconcrete elements.
The adequacy of the simulation of prototype response is evaluated on
hand of a series of tests on models for which prototype test data are a-
The correlation between model and prototype response is judged~ailable.
Whenevergood excellent, depending on the type of structure.toas
discrepancies in the response are observed, the causes are identified and
earthquakeevaluated to the limitations of model research inassess
used for this purpose are cantileverengineering. The test specimens
beams made of steel, phosphor bronze and microconcrete, and simple single
degree of freedom structures made of steel and phosphor bronze which are
tested on a shake table.
The research has demonstrated that model analysis be used incan
many cases to obtain quantitiative information on the seismic behavior of
cannot be analyzed confidently by conventionalcomplex structures which
techniques. Methodologies for model testing and response evaluation are
developed in the project and applications of model analysis in seismic
response studies on various types of civil engineering structures (buil-
dings, bridges, dams, etc.) are evaluated.

ACKNOWLEDGEMENTS
The research reported herein is part of the project "Scale Modeling
and Testing of Structures for Reproducing Response to Earthquake
Excitation" conducted under the sponsorship of the National Science
Foundation. The authors are grateful for the financial support of
NSF which made this project possible. The continued encouragement of
Dr. S. C. Liu of NSF is especially acknowledged.
The authors gratefully acknowledge the continuous participation
of the principal investigator of this project, Professor James M. Gere,
as well as the advice provided by Professor Holt Ashley on modeling
theory and by Professor Cedric W. Richards on materials research.
The skillful help of the graduate students Maher A. Bader, Nathaniel
G. Cofie, Bahman Lashkari-Irvani, Russell S. Mills and Mahmud Zohrei
in various phases of the experimental research is much appreciated.
The use of experimental and computer facilities was provided
by the John A. Blume Earthquake Engineering Center, Professors James
M. Gere and Haresh C. Shah, Directors. The technical staff of the
Center is acknowledged for an excellent job done in the fabrication
of test specimens and instrumentation.
iii
-:) " I ,.1 'c I ,

TABLE OF CONTENTS
ACKNOWLEDGEMENTS. . . . . . . . . . . . . . . . . . . . . . . . . . . . . . . . . . . . . . . . . . . . . . . . . .. iii
TABLE OF CONTENTS iv
CHAPTER
1 INTRODUCTION. . . . . . . . . . . . . . . . . . . . . . . . .. . . . . . . . . . . . . . . . .. . . . . . . 1
2 OBJECTIVES AND SCOPE 7
3 LITERA TURE REVIEW 9
4 DYNAMIC MODELING THEORY 18
4. 1 Definitions. . . . . . . . . . . . . . . . . . . . . . . . . . . . . . . . . . . . . . . . . . . . 184.2 General Discussion 194.3 Dimensional Analysis 264.4 Similitude Relationships and Types of Models 344.5 Physical Models For Shake Table Studies 38
4.5. 1 True Replica Models 384.5.2 Adequate Models 464.5.3 Distorted Models 554.5.4 Summary. . . . . . . . . . . . . . . . . . . . . . . . . . . . . . . . . . . . . . . . . 58
5 EV ALUATION OF MODEL MATERIALS 60
5.1 Introduction. . . . . . . . . . . . . . . . . . . . . . . . . . . . . . . . . . . . . . . . . . . 605.2 Mechanical Properties of Interest 625.3 Material Tests - Experimental Facilities 67
5.3. 1 Testing Equipment 68
5.3.1.1 Uniaxial Load Test Facilities 685.3.1.2 Component Test Facilities 725.3.1.3 Load History Control 74
5.3.2 Instrumentation 755.3.3 Data Acquisition and Reduction System 78
5.4 Testing Program 80
6 MATERIALS FOR MODELS OF STEEL STRUCTURES 84
6.1 Introduction. . . . . . . . . . . . . . . . . . . . . . . . . . . . . . . . . . . . . . . . . . . 846.2 Stress-Strain Characteristics of Structural Steel 856.3 Suitable Model Materials 88
6.3. 1 Introduction. . . . . . . . . . . . . . . . . . . . . . . . . . . . . . . . . . . . 886.3.2 Structural Steel as a Model Material 92
iv
1" : I I I

CHAPTER
6.3.2.1 Strain Rate Effects 936.3.2.2 Size Effects 97
6.3.3 Copper Alloys 98
6.3.3. 1 Introduction. . . . . . . . . . . . . . . . . . . . . . . . . . . 98
6.3.3.2 Preliminary Study on Cartridge Brass .. 101
6.3.4 Phosphor Bronze (CA 510) 104
6.3.4.1 Stress-Strain Characteristics 1046.3.4.2 Annealing Results 1066.3.4.3 Strain Rate Effects 1066.3.4.4 Cyclic Behavior 110
6.3.5 Lead and its Alloys 114
7 MATERIALS FOR MODELS OF REINFORCED CONCRETE STRUCTURES 117
7.1 Simulation of Concrete 117
7.1 . 1 Introduction. . . . . . . . . . . . . . . . . . . . . . . . . . . . . . . . . . . 117
7.1.2 Design of Microconcrete Mixes 119
7.1.2.1 Basic Requirements Imposed onMicroconcrete as Model Material 119
7.1.2.2 Levels in the Simulation of ConcreteProperties 121
7.1.2.3 Control of Properties through MixProportioning and Use of Additives 124
7.1.3 Scale Effects in Microconcrete 133
7.1.3.1 Size Effects 1337.1.3.2 Strain Rate Effects 137
7.2 Simulation of Reinforcement 145
7.2.1 Introduction. . . . . . . . . . . . . . . . . . . . . . . . . . . . . . . . . . . 145
7.2.2 Fabrication of Model Reinforcement 1477.2.3 Size and Strain Rate Effects in Model
Reinforcement 152
7.3 Bond Simulation 154
8 MODEL COMPONENT TESTING 159
8.1 Introduction. . . . . . . . . . . . . . . . . . . . . . . . . . . . . . . . . . . . . . . . . . 159
8.2 Models of Reinforced Concrete Cantilever Beams 160
8.2.1 Introduction. . . . . . . . . . . . . . . . . . . . . . . . . . . . . . . . . . . 160iI
v
.[~ , I I.[.. , I I I

CHAPTER
8.2.2 Specimens 161
8.2.2.1 Specimen Fabrication 1668.2.2.2 Test Setup and Instrumentation 171
8.2.3 Simulation of Prototype Response (1/d=3.1).. 1758.2.4 Simulation of Shear Failure Mode (1/d=2.0).. 1828.2.5 Simulation of Flexural Failure Mode (1/d=6.9).. 1848.2.6 Effects of Cycling Frequency 1868.2.7 Conclusions. . . . . . . . . . . . . . . . . . . . . . . . . . . . . . . . . . . . 190
8.3 Models of Steel Cantilever Beams 192
8.3.1 Steel vs. Phosphor Bronze Cantilevers 1948.3.2 Effect of Cycling Frequency 196
9 TRUE REPLICA MODEL STUDY OF A STEEL STRUCTURE 200
9.1 Model Description, Instrumentation and Testing Program 2009.2 Results and Conclusions 203
9.2.1 Elastic Tests 2039.2.2 Inelastic Tests 207
10 FEASIBILITY AND LIMITATIONS OF MODEL TESTING IN EARTHQUAKEENG INEERING . . . . . . . . . . . . . . . . . . . . . . . . . . . . . . . . . . . . . . . . . . . . . . . . 212
11 SUMMARY AND CONCLUSIONS 220
REFERENCES. . . . . . . . . . . . . . . .. . . . . . . .. . . . . . . . . . . . .. . . . . . . . . . . . . . . . . . . 227
APPENDIX
A Control of Microconcrete Strength Properties 245
B Hysteresis Loops of Reinforced Microconcrete Beams 250
vi
I ! I I I

Chapter 1 Introduction
CHAPTER 1
INTRODUCTION
Experimental techniques have always been vital part of advanceda
engineering design. Whenever the current theoretical knowledge reaches
its limit, an experiment provides an alternative in the evaluation of the
adequacy of the proposed design. The final design of innumerable ad-
vanced structures is based on the results of experimental analysis. At
present, mathematical methods are capable of predicting the response of a
structure to environmental effect, providing the complete functions of
material characteristics, geometric delineation and boundary conditions
available. The time and temperature dependance of such functionsare
often results in a complexity surpassing the feasibilities of mathema-
tical approach. Consequently, the experiment remains the only alterna-
tive. The interrelation between the complexity of the analyzed struc-
value of the structure (re-ture, the ratio of the cost of design to the
lative cost) and the applicable analysis techniques is presented schema-
tically in Fig. Ref. 1)..1 (after Hossdorf, With the improvements in
numerical techniques and theoretical knowledge, the line of analytical
capability moves to the right, thus including a larger number of struc-
tures in the left portion of the figure. This progress does not indicate
a decrease in the number of structures located to the right of that line,
as the demands posed on the design are increasing with the technological
progress.
Considering the high cost of experimentation as compared to conven-
tional computer analysis, the scope of experimental work is usuallyor
limited to fundamental research and the study of complex input and res-
ponse phenomena which cannot be modeled mathematically with confidence.
.1

Chapter 1 Introduction
1
Limit of analytical capability -I~ 1
~ I~ ,~ " Conventional analysis I
Q . """' I
cc ,~ " I
w~ " Problem frequency ~ Computer analysis~ " 1
QI , I>.,oj'
I~ .
co,I.-1 .
: '. I
'. I
'. I
"-
I
"-i- Model analysis
I
1
I
I
""" 1
' I ° °-
I ' °-
I
Degree of difficulty
Conventional Computer Model
Figure 1.1 Application of Various Methods of Structural Analysis (Ref. 1)
2
I, I I

Chapter 1 Introduction
In most cases, experimentation is carried out to fulfill one of the
lowing three basic objectives:
(1) models of force-deformation charac-Develop or verify analytical
teristics of materials, individual elements and structural subas-
semblies.
(2) for complex environmentalEstablish realistic loading criteria
effects such as wind or earthquakes.
(3) specific structuresStudy the behavior of structural systems or
under simulated loading conditions. The purpose of such experi-
mentation may be the verification of analytical studies, the de-
of the integrity and safety or structural systemsmonstration
levels of environmental disturbances, or a generalunder various
response characteristics of structural systems withstudy of the
controlled variation of input and response parameters.
on either unscaled prototypesExperimental work can be carried out
or scale models of elements, subassemblies and complete structures.
places in the results of experimental studiesconfidence the profession
Very few doubtsappears to be proportional to the selected scale factor.
are raised regarding the reliability of experimental results of prototype
tests or one-half scale On the other hand,to one-third model tests.
(in order of 1:5 and smaller) are oftensmall scale model tests the
viewed with considerable skepticism. This skepticism is often unwar-
in the materials and the load application areranted when scale effects
properly accounted for and the instrumentation system is adapted to the
it is desirable to keep thesize of the test specimen. Nevertheless,
scale factor close to one whenever feasible.
In earthquake engineering, where post-elastic response characte-
3

Chapter 1 Introduction
against failure are of primary interest, the analysisristlcs and safety
of many structures requires the application of experimental methods. Ex-
per imen tat ion may be performed in the field or in a controlled laboratory
test versatility and control precisionlimitations,environment. Cost
Inmake laboratory testing most applicable to experimental analysis.
earthquake engineering, laboratory experimentation on complete structures
cases, limited to testing of scale models, often at ratheris, in most
small scales.
analysis in earthquakeA powerful tool was provided to experimental
engineering through the development of closed-loop shake tables and high
are available a smallspeed data acquisition systems. In the U.S. there
number of medium size tables (larger than 10 ft. x 10 ft.). With few ex-
andcept1ons, such component equipment testing and testing of veryas
small prototype structures, experimentation on such tables is limited to
models. There are obvious advantages to theone-half or smaller scale
one-third scale).use of large scale models (one-half to For instance,
structures, andsmall rolled sections can be used for models of steel
concrete)prototype material (reinforcing bars and be used forcan
Nevertheless, such structures are models andreinforced concrete models.
unless modeldo not fully simulate the behavior of an actual structure
motion, material, and force simulation aretor groundsimil1 tude laws
taken into consideration.
be clas-The majority of shake tables available in the U.S. have to
sified as small tables 10 ft. x 10 ft. and smaller}. of these ta-Host
bles are used primarily for demonstration pruposes, qualitative studies,
or component testing. It that they are not fully utilized forappears
forreplica modeling of actual structures at small scales. The reason
4

Chapter 1 Introduction
this limited utilization 1s that modeling problems increase with a
decrease in scale and that insufficient information is available in the
literature on the possibilities and limitations of small scale replica
modeling.
To fully utilize available laboratory facilities tor mitigation ot
hazards of eqrthquakes, it 1s necessary to develop a general capability
for constructing, at different scales, replicas of actual buildings, bri-
dges, dams, etc., and for reproducing adequately the manner in which they
respond, absorb and dissipate energy, and ultimately fail under pres-
cribed earthquake excitation. If such a capability can be developed it
should be possible to use small shake tables in a cost efficient manner
viable and reliable research tool in the field of earthquake engi-as a
neering. Among the many topics on which model tests on shake tables
should provide useful information are the following:
1. High-quality. small-scale models can be used as complement for
and/or an alternative to analytical investigations. This need is
especially urgent in connection with complex structures, where
mathematical models are difficult to construct and to verify
2. Models are especially useful for comparative studies or cont-
rolled parameter variations, since it is relatively easy to alter
their configurations systematically.
3. Replica models enable the investigation of earthquake-related
phenomena which cannot be studied on actual prototype structures.
Such phenomena include rate of loading effects, dynamic response
characteristics under realistic seismic excitation ranging from
low amplitude vibrations to excitations inelasticproducing
orresponse and failure, failure mechanisms, effects andmass
5

Chapter 1 Introduction
stiffness irregularities, torsional effects, overturning effects,
dynamic instability and idealized soil-structure interaction
effects.
4. The demonstration or integrity and sarety under various levels or
earthquake inputs--if it is ever to be accomplished prior to the
erection of an actual structure--could be achieved with a
replica model.
advancement in knowledge of all aspects ofAt this time or rapid
earthquake engineering it is necessary to examine carefully the place dy-
namic model testing could occupy in the field oC earthquake engineering
dynamicresearch. It can be said that experimental research with
application is in its infancy compared to quasi-static experimentation
and analytical studies, and there 1s little doubt that it will playa
more significant role in the years to come.
A study of the feasibility and limitations of small-scale model tes-
tins in earhtquake engineering was the subject of a four-year NSF spon-
sored study which in part is summarized in this report. In the first re-
port 00 this study, Mills et. ale (Ref. 58) present a comprehensive dis-
cussion of shake table performances and or modern data acquisition sys-
A model study of a three-story steel frame structures is also des-tern.
cribed in Ref. 58.
This report emphasizes general aspects of dynamic modeling theory,
model material behavior and the accuracy of prototype response prediction
through small-scale model tests. In conjunction with Ref. 58 this report
1s intended to provide a state-of-the-art assessment to researchers and
practicing engineers who want to utilize small-scale model tests in
earthquake engineering research and practice.
6

Chapter 2 Objeot1Yes and Scope
CHAPTER 2
OBJECTIVES AND SCOPE
The main objective of this work is to asses the feasibility of model
and detailedtesting in earthquake engineering and to provide systematic
and modusinformation on procedures involved in the design, execution,
This goal is approached by pla-dynamic model experiments.operandi ot
the emphasis on dynamic modeling theory, model material studies, mo-
case studies performed on components andfabrication techniques, and
research concentrates on models of steel and re-Thesimple structures.
inforced concrete structures.
The scope of the work presented in this report is summarized in the
following paragraphs.
The emphasis 1s placed on the synthesis1. Dynamic Modeling Theory.
and extension of modeling theory into the domain of time-dependent, non-
Various types of models arelinear response of structures and materials.
within the constraints of material,explored which be constructedcan
but still permit an adequate predictionsimula tionmass, and earthquake
of prototype behavior.
1s placed on the 1dent1t1-2. ~el Material Stu~es. The emphasis
cation of material properties affecting the reliability of prototype res-
A systematic approachponse prediction based on small scale model tests.
Various types of material tests and ofto material studies is developed.
steel,equipment are explored. Material studies ontestingnecessary
phosphor bronze, microconcrete and model carried outreinforcement are
including studies of the uniaxial stress-strain behavior of the materials
under various strain rates and of the cyclic behavior of steel and phos-
phol' bronze.
7

Chapter 2 Object! yes and Scope
Small-scale mo-
dels of structural elements and simple structures are fabricated and tes-
ted to develop suitable model construction techniques and to study the
accuracy of prototype response prediction. Cyclic loading tests are car-
made of steel, phosphor bronze and mi-ried out on cantilever specimens
The simulation of prototype response is evaluated with duecroconcrete.
the speed of loading (cycling frequency). Forregard to the effect or
the microconcrete specimens, tests are performed with cycling frequencies
from 0.0025 Hz to 10 Hz and, with beams of different span-to-depth ratios
to investigate the simualtion of different failure modes from flexure to
pure shear. The results of a shake table study on a simple steel struc-
ture and its phosphor bronze model are evaluated by comparing displace-
ments, accelerations and story shears in the prototype domain.
One of the major concerns of this work is to present the information
in as complete a form as possible, incorporating throughout the text re-
suIts of studies reported by other researchers. In addition, an exten-
sive list of U.S. and foreigh literature is compiled.
8

Chapter 3 L1terarure Review
CHAPTER 3
LITERATURE REVIEW
purpose of this chapter is to acquaint the reader and prospec-The
art in model analysis and withtive model builder with the state of the
the background informationmaterial that containsreferencerelevant
necessary for successful modeling of structures in seismic el'tVironments.
been used in civil engineeringSince for many years replica models have
and alternative to design and analysis, it is recognizedas a complement
review is incomplete and limited to those publica-that this literature
or thistions which were found particularly helpful in the development
past studies onidentifyingEmphasis 18 placedresearch project. on
either areespecially those whichbuilding structures and materials,
dynamic modeling or contain information which can be uti-concerned with
lized for dynamic model studies.
written on the subject orbooks
model analysis, that by Hossdorf (Ref. 1) provides an excellent introduc-
go deeply into anyone aspect of modelIt does nottion to the subject.
healthy perspective of theanalysis but touches many aspects and gives a
The book by Mulleranalysis in structural engineering.place of model
treats the topics of model materials and instrumentation in a(Ref. 2)
that by Fumagal11 (Ref. 3) contains a lar~e numberthorough manner, and
buil-interesting model case studies, particularly those concerningof
dings and dams.
One of the first comprehensive series of papers on structural models
Referencesa RILEM symposium in 1959 in Madrid, Spain.was presented at
papers of this symposium relevant to this4 and 5 contain of thesome
9

Chapter 3 Literarure Review
research project. References 6 to 11 are summary papers on general prob-
lems of modeling of structures in the elastic and inelastic range.
Many studies are reported in the literature on modeling or rein-
forced concrete structures. Much of the progress on this subject is pre-
sented in papers compiled in Refs. 12 to 14 and is summarized in Ref. 15.
Specific topics in static modeling of reinforced concrete structures and
structural elements are discussed in Refs. 16 to 29.
Scale modeling of structures made of materials other than reinforced
or plain concrete has received surprisingly little attention in the past.
Reference 30 presents the results of researcha project on modeling of
concrete masonry blocks and structural elements. Detailed information on
fabrication and testing (under static loading conditions) of small scale
models of steel structures and their components, using steel as a model
material, is presented in Ref. 31.
Dynamic Model Studies: The references mentioned so far are not spe-
cirically concerned with dynamic modeling problems but contain oomprehen-
sive background information on the subject of model analyeis in structu-
ral engineering. The literature search disclosed that quite a few model
experiments on structures under simulated dynamic loads and earthquake
motions have been carried out in the past (Ref's. 32 61).to However,
much or this work was concerned with elastic behavior only. The case
studies reported in the literature on modeling of structures to failure
generally lack a thorough discussion of the ofconsequences inadequate
material simulation and orten do not take full advantage of the potential
of dimensional analysis in deriving appropriate modeling laws.
Physical models for elastic earthquake response prediction were used
10

Chapter 3 Literarure Review
fifty Ruge (Ref. 32) presented a comprehensivemuch years ago.as as
dynamic modeling theory in 1934, and in Ref'. 33 heelasticpaper on
described a detailed model study on the earthquake resistance of elevated
water-tanks which included a feasibility study of various model materials
and brass to simulate steel and a discussion(mercury to simulate water
Even earlier, dynamic studies on modelsof feasible model distortions.
cylindrical tanks, and multistory buildings had beenor wood panels,
table at Stanford University (Refs. 34, 35). Theoarried out on a shake
masses in the building models were lumped at story levels and represented
by vertical ball-supports, while the buildin8by steel plates kept apart
frame and wall rigidities or the prototype were represented by horizontal
coiled springs.
study on dynamic modeling or steel andA thorough and comprehensive
reinforced concrete structures was carried out in the early sixties at
HIT (Refs. 36 to 39). The purpose of this study was primarily the inves-
As such, the source oftigation of structural response to blast loading.
excitation and or the relevant response characteristics are quitemany
different from earthquake loading, but much of the modeling theory
material studies and fabrication techniques presented in these research
directly utilized for model studies in earthquakereports becan
orengineering. Other useful information from model studies structures
subjected to blast loading can be found in Refs. 40 to 43.
scale models forIn the United States, the use of large and small
seismic response investi~tions in the inelastic mate~ial domain became
earlyacceptable alternative to analytical studies only in thean
towardsseventies. In most studies directedcases these were
for specific structural systems (e.g.,verification of analytical models
11

Chapter 3 Literature Review
earthquake response phenomena (e.g.,reinforced concrete shear walls) or
overturning and uplift problems). such cases, distortions of seismicIn
configurations (to suit available shake tablestructuralinput ofor
the use of established material and modelcapabilities permitor
accepted since the physical modeltechniques) often bestruct1on can
results are compared to analytical results and not to prototype behavior.
in the research laboratories at the University oftablesThe shake
have been used ex-Illinois and the University of California at Berkeley
The University or Illinois facilitystudies.tensively for such model
studies of reinforced con-has been used primarily for small scale model
Much of this research work is summarizedcrete building structures.
found in Refs. 45paper by Sozen (Ref. 44); more detailed results can be
to 49.
small soale model studies per-Reference 50 provides an example or
behavior or reinforced concretetheformed at Cornell University on
structures under seismic excitation.
6x6 m (2Ox20 t't)The U.C. Berkeley facility which is built around a
shake table is used primarily for testing of structures which may be con-
large-scale pseudo-models. The structural elements aresidered to be
usually made of prototype structural material (s_ll hot rolled steel se-
small reinforcing bars) and floor mas-ction or concrete reinforced with
ses are simulated with a sufficient number of concrete blocks to simulate
roughly oneIn size, the structures begravity-induced stresses. may
motion usually is notThe seismic inputhalf that of actual structures.
scaled according to model similitude laws, and intentionally so since the
not meant to be replica models of actual structurestest structures are
12

Chapter 3 Literarure Rev1e1
but physical representations or mathematical models. The drawback or
this kind of experimentation is that a one-to-one correspondence with a
prototype structure cannot be established; the advantage is that
structural detailing be simulated much difficultycan without and
material behavior is well known which increases the confidence in test
results and permits reliable analytical correlation. References 51 to 56
discuss specific studies or this type carried out at the U.C. Berkeley
shake table.
Actual replica models are also tested at the U.C. Berkeley facility.
An excellent example is the 1:30 scale model of' reinforced concretea
high curved (Ref. 57).overcrossing This model built of mioro-was
concrete and closely follows dynamic similitude laws. Great care was ta-
ken in precise simulation or all details at expansion joints which were
known a priori to be subjected to damage caused by multiplesevere
impaotin~ in both torsional and translational modes. To maintain body
forces similitude, the mass of the model was increased to 30 times the
self-weight by adding lead blocks.
More recently, a shake table study on a 1:12 scale steel model of a
three story, one bay steel frame structure completed by Mills et.was
a1., (Ref. 58) on the Stanford University shake table. The 1:6 scale mo-
del ot a 1:2 scale pseudo-prototype tested at Berkeley (Ret. 51) wae used
to directlycompare the results obtained from the tests of the pseudo-
-prototype and its model. Reference 58 includes a comprehensive descrip-
t1on or the evaluation of the shake table performance, of the instrumen-
tation, and of data acquisjtion and reduction systems. The report discu-
sses in detail the modeling techniques for steel structures and presents
guidelines for a rational comparison of experimental data from model and
13

Chapter 3 Li terarure Review
prototype tests.
It should be noted that much valuable information on dynamic mode-
ling can be drawn from publications in fields other than structural engi-
neering. References 59 to 61 are examples of oolleotions of informative
Although much of the theory and dimensional analysis developedpapers.
herein will useful, it has to be recognized that the referencesprove
tend to focus on response within the elastic range of material behavior.
The use of physical models in earthquake engineering has been much
more extensive in Europe than in the United States and Canada. For ins-
tance, the Istituto Sperimentale Modelli e Strutture in ItalyBergamo,
the Laboratorio Nacional de Engenharia Civil in Lisbon, Portugal, and the
Institute for Research and Testing in Materials and Structures in Ljub-
elaborate and well-equipped model laboratoriesljana, Yugoslavia, have
which Referencesare used for research work in earthquake engineering.
62 to 84 desoribe some of the dynamio model studies oarried out at these
and other laboratories and contain information on modeling ot' buildings,
bridges, dams, nuclear reactor components and containment vessels.
Several model studies on seismic behavior of building structures and
containment vessels were also oarried out in industrial and university
laboratories in Japan. Some of these models were pseudo-models (as des-
cribed previously) and References 85 towere actual scale models.some
88 are examples or this work.
Dynamic Modeling Theory: Applications of dynamic modeling theory are
discussed in many of the aforementioned references. The basis for the
development of model similitude lawa can be found in many books concerned
with the theory of similitude and dimensional analysis, of which Refs. 89
11..

Chapter 3 Literarure Review
Dimensional analysis as an analyticalto 98 are a representative sample.
tool for the derivation of model similitude laws is largely attributed to
and Rayleigh (Ref. 100). Specific(Ref. 99)of Buckinghamthe work
aspects of modeling theory as applied to civil engineering problems
A comprehensive discussion of the physi-105.discussed in Refs. 101 to
dimensionaltheirentering a structural problem and ofquantitiesasl
dependence is present in Ref. 38.
The interrelated subjects ofModel Materials and Model Fabrication:
--
and modelscaling effects in material simulation,material selection,
fabrication have been the subject of many studies and are widely reported
a large number orremainsNevertheless, thereupon in the literature.
unanswered questions some or which are the subject or this study.
associatedGood summaries on available model materials and problems
material simulation and model fabrication can be found in Refs. 106with
made orwith elastic and ultimate strength models",, concernedto
plastics, cementitious and metallic materials.
information on the use of miorooonorete andSpecific and detailed
gypsum mortar and the simulation of reinforcement in models of reinforced
14,25,29, 36, 39 and 106conrete structures are presented in Refs. 12,
119 provide guidelines on the43 and 1111References 14, 39, toto 123.
mechanicalstrength andvariousmixes forof' mlcroconcretedesign
mix proportions, mixing andgrading,Appropriate aggregateproperties.
(Ref. 118) points outMaiseldiscussed.curing techniques are
or microconcretemechanical propertiesor changing thepossibility
(E-modul1 ,
additives,
15

Chapter 3 Literarure Review
References 18,smooth silicone resin. 39, 117, and 122 discuss the
effects of speed of testing on the compressive strength or microconcrete.
effects in modelReference 123 provides state-of-the-art report on size
References 18, orconcretes. 21, 39, 117, 118 and 124 present results
individual case studies concerned with size effects. References 125 to
144 provide information on mix design, testing, mechanical properties,
References 18, 43, 117, 118,and load rate effect on prototype concrete.
140 and 145 techniques used in model reinforcement fabrication.present
Ref. 146 presents results of a study on strain rate effect on the tensile
behavior of model reinforcement. Ref. 147 discusses the problem of crack
and deformation similitude in reinforced concrete which was investigated
by means of bending tests of similar beams at different scales. Referen-
concrete behavior (pro-ces 147 to 150 provide information on reinforced
totype and model) under dynamic loading conditions.
Much less information than on reinforced concrete 18 available on
the feasibility of using steel or other metallic materials to simulate
prototype structural steel. The study summarized in Ref. 31 and the re-
cent study by Mills et. al., (Ref. 58) treat in detail the problems of
element fabrication and member joining encountered when steel is used as
a model material for steel structures. Strain rate effects in low carbon
steel are discussed in Refs. 151 to 153. Size effects on tensile and
flexural behavior of structural steel investigated by Richards inare
Refs. 154 and 155. The properties of phosphor bronze and its feasibility
model material for steel structures under dynamic loads areas a
discussed 1n Ref. 38. Ref'. 157 1s excellent text on basic materialan
behavior.
~~ Instrumentation ~ Dyn!mic ~ Facilities: It 1s evident
16

Chapter 3 Literarure Review
that the instrumentation system for measurement of pertinent response pa-
rameters must be adapted to the size of models be tested. Re-the to
on the instrumentation system and feasible measuring devicesquirements
are discussed in Refs. 58, 158, 159. use or minicomputers inand The
summarized inmeasurement, analysis and control of experimentation is
Refs. 58, 160, 161 and specific problems associated with recordingand
and interpretation of dynamic test results are discussed in Ref. 162.
The problem of simulating an earthquake environment in the field and
sponsored workshop in Sanin the laboratory was the subject of NSFan
(Ref. 163) contain valuableFrancisco. The proceedings of this workshop
1n earthquake enginee-information on the role of experimental research
experimental facilities.ring, on experimental needs, and on existing
Several other publications that discuss earthquake simulation systems and
speoifio simulation problems are listed in Refs. 16~ to 169.
17.

Chapter 4 Dynaaic Modeling Theory
CHAPTER 4
DYNAMIC MODELING THEORY
4.1 DEFINITIONS-
in an experiment can be divi-The phvsioal quantities or isportanoe
variables and parameters, these being either dependent or~-ded into
pendent.
phys1-The independent Quanti.ties are automatically assigned by the
cal characteristics or the problem.
The dependent quantities are those measured during the experiment.
A variable is a quantity which spans a continuous range of values in
a single problem (e.g., time in a dynamic problem).
is what Bridgman (Ref. 89) calls a d1men-An independent parameter
sional constant.
in nature, thatA dependent par..ter 1s a result, usually global
typically represents a single experimental measurement.
MllpleA physical quantity can be measured by comparing with aa
This known reference amount is calledknown amount or the same quantity.
a~. For the complete specification of any physical quantity, both the
unit used and the number of units contained in the sample must be given.
The unit or any physical quantity can be expressed as a combination
such basic quantities as force andbe expressed in or units ofterms
length).
powers or basic Quantities (described inQLmensions are products of
basic units), and as such relate the units of measurement of any physical
18

Chapter - Dynamic Modeling Theory
quantity to the selected basic units.
which does notA dimensionally homoy,eneous equation is an equation
equationdepend on the fundamental units of measurement. Such con-an
eachthe sum of products ot powers of physical quantities andslsts of
term in the sum has the same dimension.
of powers of physical quanti-~-Factors are dimensionless products
products describes a physicaldimensionlesscC8Plete !.!l orties. A
such renders it independent onphenomenon in a dimensionless form and as
selected units.
A dimensional aatrix is an arrangement or numbers conta1n1n~ d1men-
sional exponents of physical quantities expressed in terms of basic quan-
It comprises as many columns as physical quantities in the funo-titles.
quantities.basictional relationship or a problem and as many rows as
displacement of anFor instance, if the functional description tor the
dimensional Mtrixproblem is given by u = u(x,y,z;l,v,P), theelastic
has the followlnB fora:
independentparameters
!dependentIvariable
independentvariables
pEu x y z \J
0 0 0 0 1 0 1Force F
01 , 1 t -c 0Length R.
4.2 GENERAL DISCUSSION
model analysis in earthquake enRlneering Is the pre-The ~rpose of
structures from laboratorydiction or the dynamic response or prototype
include all pertinenttests 00 physical models. This prediction may
parameters or it may be limited to selected parameters such 8.5response
19

Chapter ~ Dynamic Modeling Theory
natural frequencies and mode shapes. The desired range or prediction may
be limited to the linear elastic response or it may comprise the complete
response history to failure including material and geometric nonline-
arities. In the or single parametercases and elastic response
prediction several model design requirements can often be relaxed which
makes model analysis a simpler but also less powerful tool.
In this chapter modeling theory is discussed in generala sense
which makes it suitable tor all types of model studies and is then ap-
plied to specific cases which are most useful in seismic investigation.
Modeling theory establishes the rules according to which the geometry,
mateial properties, initial conditions, boundary conditions and environ-
mental effects (loading) of the model and the prototype have to be rela-
ted so that the behavior of one can be expressed as a function of the be-
havior of the other. The theory which leads to the development of a com-
plete set of correlation functions (sometimes referred to scalinga8
laws) defining the model-p~ototype correspondence is that of similitude.
The Oxford English Dictionary defines similitude as: "the quality
or state of being like resemblance, similarity, likeness. Now somewhat
rare." Among the ideas associated with similitude analogies,are:
dimensional invariance, homoge-analysis, dimensionless numbers, group
netty, inspectional analysis, local similarity, looal solutions, ~-,!.!!!.&, scaling~, self-similarity, separation of variables, similarity
rules, symmetry, transformations.
which modelThe theory of similitude, upon desi~ and analysis is
based, may be developed by dimensional analysis. Dimensional analysis as
a powerful analytical tool is developed from a consideration of the di-
20

Chapter 4 Dynamic Modeling Theory
mensions in which each of the pertinent quantities involved in a physical
phenomenon is expressed. The principles of dimensional analysis are well
established in the literature and are summarized in Section 4.3 as far as
needed for the development of a general modeling theory. For de-more
as Refs. 1tailed information the reader is referred to the books listed
and 89 to 98 and the technical publications listed as Refs. 38 and 99 to
105.
To develop the necessary mathematical relationships between the cha-
from the premiseraoteristios of a prototype and its model, let us start
that physical phenomenon be expressed by dimensionallyevery can a
homogeneous equation of the type
Q1 = F(Q2,Q3, Qn) (4-1)
where 1s the total number of physical quantities involved 1n then
phenomenon. In thi8 expre88ion q, i8 a dependent quantity and to qnq2
are the variables and parameters which q, depends.on According to
Buckingham's Pi theorem (Seotion 4.3), every dimensionally homogeneous
equation can be written in the form
1Tl = f(1T2,1T3, 1Tn-N) (4-2)
dimensionless or powers of the physicalproductswhere ~1 to ~n-N are
The number N isquantities q, to qn. the rank of the dimensional matrix
which 1s usually equal to the number of basic units needed to describe
the physical quantities.
Since Eq. (4-2) is identical to Eq. (4-1), it describes the same
physical phenomenon and, because or its dimensionless form, must be
equally valid for prototype and model if similitude is to be achieved. A
sufficient condition for complete similitude is therefore
21
I

Chapter - D,n8mic Modeling Theory
(4-3)
and
(1T2)p..O)n-N p
- (1f2).
(4-4)
('IT - (1Tn-N)m
equation and!qua tion (~- 3) is often referred to as the prediction
Eq'S. (4-4) constitute the design conditions for the model. Methods tor
deriving the dimensionless products are summarized in Section 4.3
to taoe.There are two major dittioul ties the model analyst has
to exercise extreme ~re in specifying the right nuaber orFirst he has
physical quantities which enter Eq. (4-1). wh1ch have 1n81-Quantities
gnitioant etteot on the response parameters of interest will impose unne-
model, while ne~lectins a significant quantitycessary restraints on the
Secondly, the experimenter i8 often facedcan yield incorrect results.
reproduce at modelwith almost unsurmountable problems when he tries to
Eq'S. (4-4). In particular, thescales the design conditions posed by
conditions besimulation or material properties and loading may an
theextremely difficult or impossible task. The latter orten leads to
more or the design conditionsdesign or distorted models in which one or
it theNevertheless, such models may still be adequateare violated.
the violations in the desi~torprediction can be corrected to account
conditions.
The speoificatlon of all important quantities on the right hand side
underor Eq. (4-1) does require some insight into the physical problem
that is known about the behavior or theIn general, thestudy. more
22

Chapter 4 Dynamic Modeling Theory
prototype and of the laws which describe it, the easier it is to design
the model, but the less necessary the model is. Considering the level ot
confidence in model results and the effort invested in desl~, testing
and data analysis, models are most useful when the general features of
the prototype behavior are known but specifics such &S complex geometry
or material nonlinearities render it difficult to obtain quantitative
information by analytical means.
The physical quantities which may enter a structural problem are
difficult to enumerate in their entirety but are for most cases contained
in on~ or the following four groups (Refs. 38, 90).
Geometric Properties: Geometry includes all the space relationships
which may influence the results. All distances or lengths and all angles
that are pertinent must be represented. For geometrically similar models
a location vector is sufficient to describe any point 1n the structure
In dynamic problems the vector will depend not only on the space ooor-
dinates but also on the time t. Alternatively, the location vector may
be specified at a time to and the geometry at time t may be defined by
+ +the location vector r and a time dependent displacement vector u(t).0
Material Properties: In general, these properties may vary from
point to point in space and with time and temperature. A I18terial has
thermal, mechanical, electrical and magnetic properties, although the la-
tter two usually be neglected in structural problems. Thermalcan
properties or interest be specific heat, coefficients of thermalmay
conductivity and linear expansion, and emissivity. The mechanical pro-
perties are the specific mass, and the material properties defining the
state of stress and strain in the material. These properties may be time
23

Chapter 4 Dynamic Modeling Theory
and temperature dependent (e.g., creep and relaxation), vary from point
to point (inhomogeneity), and be direction dependent (anisotropy). They
also describe the interaction between different directions (Poisson's
ratio) and the interaction between neighboring points (e.g., strain
gradient effects). A complete discussion of these properties is beyond
the scope of this report, but to show the complexities involved in a
thorough material state description, the uniaxial stress-strain relation
proposed by Harris et al. (Ref. 38) is reproduced below:
( -to T de:) (-to T de: I ) \0' r,t, 'at = 0'0 r,to' o"at 0 + 1
~ (e:-e:)n { n I ~ (t-t)j n+j.L.. £- ~ t ,T ,k + L . loa 0' . + (4-5)n=l n. ae:n (0 0 at 0) j=l J. ae:natJ t=t \
0
~ 9.. ~ (ae: de:I ) k } I~ ~- 2~~~ I +:2: -at" - 4 0 __1':'--[~ ] -9..=1 9... ae:naT9.. - k=l k. (k\ k ae:n 0'-0'0
T-To a at;
where t and T are the time and temperature variables, respectively, and
the subscript 0 denotes a reference value. It should be noted that
material damping, which is of importance in seismic studies, is included
in this state equation, although for low level excitations it is often
isolated and specified separately as a coefficient of damping.
It is evident from Eq. (4-5) that compromises in material simulation
must be accepted in model studies since no two materials are alike in the
time and temperature domain. Even the use of prototype material is a
compromise because of size scaling and the dependence of material
properties on time rate effects. Material simulation is discussed in
24
t , IT

Q\apter - Dynaalc Modeling n.ory
more detail in Chapter 5.
by initialInitial Conditions: - These conditions can be described
stress iO and Tot at time to.and temperature functions, c In many cases,
the specification and siaulation of 0: and T0 0 will be an extremely dlt't'l-
cult task due to their dependence on fabrication and construction proce-
dures and previous loading histories. In the design or models this will
necessitate a faithful reproduction of fabrication and construction pro-
cedures those have a significant effect on the initial condi-whenever
tl~8. In conditions beinitialreinforced concrete structures may
strongly affected by and shrinkage while 1n steeleffects,creep
structures residual stresses due to welding and erection stresses have to
be considered. For steel as a prototype material it may be necessary to
trace the history back to meMber fabrication which is usually the source
of significant residual stresses.
Such influences may be
orprescribed displacements wich may be time dependent as 1n the case
seismic ground motions, prescribed temperature variations, surface forces
the boundaries or the structure, and body forces caused by theon
gravitational tield ot the earth or generated by artiticial mean8 8uch a8
magnetic fields.
For most structural problems the pertinent physical quantities can
be selected from these four groups. Based on a physical understanding of
the problem, it is the task of modelthe analyst to choose those
quantities which will significantly atteot the response quantities to be
measured during the model experiment. The experimenter may be interested
in tracing the complete history which be described byresponse may
25

Chapter 4 Dynamic Modeling Theory
stress, strain or displacement functions, or only in specific quantities
such as the failure load which may be characterized by material failure
or buckling phenomena.
To aid the model analyst in selecting model design and response
quantities, an extensive but certainly incomplete list of physical
quantities and their dimensional description is presented in Table 4.1.
Before we can utilize Eq's. (4-1) and (4-2) to derive appropriate
similitude realtionships for dynamic model studies, it is necessary to
briefly summarize the fundamentals of dimensional analysis which is done
in the next section.
Before entering this discussion, a different approach to modeling
theory than that of dimensional analysis should be mentioned, namely, mo-
del analysis based on system response equations. In several cases the
differential equation representing the response of a stucture is known,
although the solution of it cannot be obtained analytically. By trans-
forming the variables of such an equation and also of its boundary and
initial conditions into a dimensionless form one obtains a set of dimen-
sionless parameters defining the relation between the model and the pro-
totype. Although some authors call this method a forcing of the model to
be an analog computer for solution of the equation, a careful use of it
can help in elimination of certain otherwise very rigid requirements
obtained from the dimensional studies.
4.3 .DIMENSIONAL ANALYSIS
Dimensional analysis is an analytical method by which a dimensio-
nally homogeneous equation, containing physical quantities and describing
26
i '\

~apter 4 Dynamic Modeling Theory
equationphysical phenomenon, is converted into equivalenta an
containing only dimensionless products (~-factors) of powers or the phy-
sical quantities. Since these dimensionless products describe the same
physical phenomenon and are independent of the units of measurement, they
is bemust be equal in prototype and model if complete similitude to
achieved.
Dimensional analysis is based on the Buckingham!! Theorem (Ref. 99)
a dimensionally homogeneous equation can be reduced towhich states that
a complete set or independent dimen-a functional relationship between
sionless products (n-faotors). number of independent dimensionlessThe
total or physical Quantities involvedproducts is equal to the number
theminus number of fundamental quantities needed to desoribethe
dimension8 of all physical quantitie8.
The simple rule tor the determination or the number or independent
dimensionless products has been shown to tail occasionally (Ref. 89) and
in more formal mathematical terms (Ref's. 91, 94)has been reformulated
is equal toas: the number of dimensionless products in a complete set
the total number of physical quantities involved minus the rank of their
(The rank of a matrix is order of the largestdimensional matrix. the
submatrix whose determinant is nonzero).
determine complete set of dimensionless products itIn order to a
should be noted that the units of any physical quantity can be expressed
as a combination or units or basic or fundamental quantities. The choice
of basic quantities is largely an arbitrary one but 1s governed by prac-
tical considerations of physical phenomena and simplicity of measurement
Different fields or science may choose different basic quantities. In
27

Chapter 4 . Dynamic Modeling Theory
or basic quantities are those of massengineering, the most common sets
M, length L, time T and temperature 9 (called the HLTO system) or force
FLTQ system). Several authors (Refs. 38, 105)F, L, T and 9 (called the
for convenience heat basio quantity, disregarding itsuse as a
Rocha (Ref. 103) and Beaujoint (Ref. 105) discussequivalence to energy.
the usefullness or strain as a basic quantity and assign it a basic unit
This idea 1s discussed in Section 4.5.3.
Table 4.1 presents a set of commonly used physical quantities in en-
gineering mechanics and their dimensional description in the ML TQ and
FLTQ systems. It should be noted that several quantities in this table
dimensionally such as pressure, stress and modulus orequivalent,are
Also, it is often necessary to distinguish between certainelasticity.
quantities through their physical meaning although they bemay
As an example wedimensionally and quantitatively equivalent. can use
each of them, kinetic, potential, damping,terms whereenergy one
hysteretic Or' recoverable strain energy may have a distinctly different
Thus, commonly used physical derivations ofmeaning to the investigator.
quantities are included in the table where feasible.
The basic quantities can be used building blocks since theas
dimensions or all other physical quantities can be expressed as products
of or basic quantities. When the dimensions or physicalpowers
quantities are properly arranged in a dimensional matrix it is reasonably
simple to extract dimensionless products by comparing individual
quantities as to their dimensional dependence. Although systematic
tormethods generating a complete set or productsdimensionless are
presented books, it equally well be achieved byin most text can
inspection if the following rules and guidelines are considered:
28

Chapter 4 Dynamic Modeling Theory
TABLE 4.1
PHYSICAL QUANTITIES AND THEIR DIMENSIONS
29

Chapter - Dynamic Modeling Theory
TABU 4.1 (continued)
D1.-ns1ons inT e S 15 tIIS
M e
'O1MnS10ns in.. FL Te Syst8S
- -Description
in terms of otherphysical quantities
Sym-bolPhysical Quantity
F L~ T e
1I
1-2 -2 0Specific weight 1 -3~ 0 0l'
1 -4~ 2 0 1 -3 0
0
0
0
Mass density p
11 2 0 0Mass .Mass ~t of
Inertia all.2 1 0 0I.:v
-- 1. 0 2
I [£/2(1 + v)pJ~
1[(l-v)£/(l-v-2v
0 1 00 -1 0
itVs
Vp
.' 0 ~-1 0'() 04-1 0 0
Velocity
s-Wave Velocity
P-Wave Velocity
Angular Velocity
Acc.leration a0 1 -2 00 -2 0
Acceleration ofGravity 9
. 0 0 0 -2 00 01-2Angular Acceleration
Coefficient ofViscous ~ing 1 0 -1
-1
01 0c Fo'vT/(dv/dy) 1 -z~ 1 0
0
1 -1 0'J1
0 2 -1 0:
Dynamic Viscosity
Kin_tic Viscosity WP
2..,
0v
Kinetic Energy
Potential Energy
KE:
F4
Cy2t
a£.13
PE
DE
HE2 -2 00 0 1
DallPing Energy
Hysteretic Energy
Recoverable Strair;Energy ad3. K82RSE
HHeat c.. kiTe1 1 0M 1 o. 1 0~nt.. my
Fv ,-1 0 1 2 -3 0
1
Power p
0 0 0 0 0T~eratu" e
0 0, 0 I .16/18
H/T18
0 0 .}Coefficient of
Thermal Expansion ~
-1Thermal Conductivity k
-2 0 2 ~ -2 ~ -1c H/~ 0Specific Hut
Coefficient ofHeat Transfer H/T,,2e 11 -~ .~ o. -3'h
30

Chapter 4 Dyna!Dic Modeling Theory
1. The dimensionless products are composed of products of powers of
the physical quantities and should involve not more than N-1 quantities
in anyone product, where N is the number of basic quantities.
2. The dimensionless products must be independent, i.e., none of
the products can be obtained as a product of powers of other products.
3. Independence is easy to verify if the dimensionless products are
generated such that each product involves a quantity which does not
appear in any other product.
4. The dimensional matrix should be arranged such that the response
quantity of interest (dependent variable) is listed first, followed by
independent variables and then parameters.
5. Dimensionless products should be generated such that quantities
are eliminated from left to right in the dimensional matrix.
Guidelines 4 and 5 are important for the design and control of the
experiment. Since complete sets of dimensionless parameters are not
unique, one will be more useful than others in model analysis.
Buckingham has pointed out that we obtain maximum amount of experimental
control over the dimensionless products if the original physical
quantities that can be regulated in the experiment each occur in only one
dimensionless product (Ref. 91). Thus, a warning must be issued against
a superficial use of dimensional analysis. It is a powerful tool but its
usefulness for specific model analysis problems is entirely in the hand
of the user. Here, it may not be out of place to cite two of the
"fathers" of dimensional analysis:
Dimensional analysis yields an amount of information dependenton the skill and experience of the analyst.
-Po W. BuckinghamEncyclopedia Britannica1964 ed.
31
irt{'i1~iI1; t'i)_'!\I~~t!!!¥f;:{,i1/~

Chapter 4 Dynamic Modeling Theory
Dimensional analysis proves to be an exceedingly powerful weapon,althou~h I should add the warning, based on bitter experience ofmy own as well as a critical study of other people's work, thatit is also a blind, indiscriminating weapon and that it isfatally easy to prove too much and to get mo~e out of a problemthan '8S put into it.
-G. K. BatchelorQuart. J. Roy. Meteor. Soc.,
1959
dimensionlessThe ~neratlon or complete set or independenta
inspectional analysis 18 illustrated in the followingparameters by
Let us consider the problem of bending orsimple example. elastic a
rectangular cantilever beam which is affected by the following physical
qantities:
geometric properties: b, h, t
material properties: E, v
papplied load:
The response quantity ot interest 18 the deflection <5 under the load,
(b,h, 1, I,v, P). All quantities can be expressed in terms or1...,15.leads to the following dimensionalthe basic quantities F and L which
llatrix:
matrix is 2, hence we have 1 - 2 = 5 independent dimen-'nle rank of the
sionless products. It is convenient to form one product that contains
the response qusntity to the first power and relate it to what seems to
be the most relevant independent quantities. Additional products that
can be written down immediately those which p;iven by dimen-are are
32

Chapter 4 Dynamic Modeling Theory
sionless quantities, in this case v, and those which are formed by ratios
of quantiities having like dimensions. The remaining products becan
formed by trial and following the aforementioned guidelines. For the
beam this procedure gives
(4-6)<5 b h PI = f v, t' I' 2
ER.
to see that these factors are independent since each one con-It is easy
tains a quantity which is not involved in any other factor.
reveal that the solution isInsight into the physical problem may
independent on certain parameters that would at first sight appear signi-
be dropped).fioant (i.e., for slender beam the dependence oouldon "certainThe knowledge the problem 18 linear with respect tothat
For example,simplify the functional relation.furtherparameters can
the deflection isusing linear theory or elasticity one can state that
directly proportional to the load applied and inversely proportional to
the breadth of the beam, hence the corresponding factors be takencan
outside the function:
(11-7)6 p ( h
)"1 ~ m £1 "I~ v
is'ntis linear dependence upon certain dimensionless parameters very
helpful when model distortions have to be considered (see Section 4.4).
In some cases the complete set of dimensionless products obtained by
experimenter's desire torinspeotional analysis not satisfy themay
In such cases a different set of productsoptimum experimental control.
simple transformation techniques. Thesecan he generated by means of
dimensional analysis andtechniques are presented in most textbooks on
need not be repeated here.
33

Chapter 4 Dynamic Modeling Theory
Several dimensionless products have gained traditional status in en-
gineering and are commonly used in defining physical problems. Table 4.2
presents a set of such "popular" dimensionless products.
4.4 SIMILITUDE RELATIONSHIPS AND TYPES OF MODELS--The necessary conditions for complete similitude between model and
prototype can be derived through the following procedure:
1. Write down all physical quantities on which the solution of the
phenomenon under study depends significantly.
2. Develop a suitable and complete set of independent dimensionless
products from these physical quantities (Eq. 4-2).
3. Establish equality between prototype and model for each of the
independent dimensionless products (Eq's. 4-2 and 4-4).
The third step defines the design conditions for the model and the
prediction equation (or equations) for the dependent response quantity
(or quantities) which relates the measured model response to the proto-
type behavior. As such, this step establishes the scaling laws for all
physical quantities or products of physical quantities. Usually, these
scaling laws are expressed as ratios of the numbers of units needed to
describe identical quantities in model versus prototype. In this report
these ratios are designated with a subscript r added to the description
of the physical quantity, i.e., t = t ~t = 0.1 means that one unit ofr m p
length measurement (e.g., in.) in the model corresponds to ten equal
units of length measurement in the prototype.
One important observation can be made from the fact that all physi-
cal quantities can be expressed in terms of basic or fundamental quanti-
34
l, I , I

Chapter 4 Dynamic Hodeling Theory
TABLE 4.2
DlMENS I <If LESS pR(XMJCTS
{a} Named Dimensionless Products
y - surface tension [Fl-l]Bfot Number
Bond NlDnber
Cauchy N~r
Einstein NllAber
Euler r~wnber
Fanning Number
Fourier Nwnber
Froude Number
Grashof Nunmer
Mach NlDnber
Newton N..mer
hL/k
pg,,2/y
pv2/E
v/c
TW - shear at the wall
v - kinematic viscosity
c - speed of sound
R - aerodyn. reacti onexperienced by a body
~P/py2
TJ(l8)y2)
kt/pC12
y2/19
"'*\I
Y/c
R/pR,2y2
ht/k
Cu/k
p/pv2
v2/1f
Nusselt's NU1Ii)er
Prandtl's NUllmer
Pressure Coefficient
f - force per uni t mass
2j)V 1/y
Reech Number
Reynolds Number
y - surface tensionStrouhal NlDber
Weber ~Iuni>er
(b) Dimensionless Products CommonlyEncountered in Structural Engin-eeri ng Problems
35
tv/" ortvp/~
lAIR./v

Chapter 4 Dynarnic Modeling Theory
ties (e.g., FLTQ or MLTQ). Since these basic quantities are independent
on each other, it is evident that as many scales can be selected
arbitrarily (within physical constraints) as there are basic quantities
needed to describe the problem. For instance, in a static problem which
has F and L as basic quantities, two scales can be selected arbitrarily.
In a dynamic problem which may be described by M, Land T, three scales
can be selected arbitrarily. However, in this case it is usually
necessary to select gr = , (g is the acceleration of gravitv) which
reduces the choice of arbitrary scales to two. The scales of all other
physical quantities are then expressed in terms of the arbitrarily
selected ones and can be obtained from the dimensionless products.
It should be noted that the choice of arbitrary scales is not
limited to basic quantities; any set of independent quantities may be
selected for this purpose. The number of independent quantities is
always equal to the number of basic ones, and their independence can be
checked through the formation of the Jacobian whose determinant must be
nonzero (Ref. 38), i.e.,
d(Ql,Q2,ooooqr) of a (4-8)d (kl,k2'o 0_0 okr)
where r is the number of independent quantities, q, to qr are the
selected quantities whose independence is to be checked, and k, to kr are
the basic quantities.
To illustrate the determination of scaling laws, let us take the
beam example of Section 4.3 whose dimensionless products were written as
0 ( bh P)"]i = f V, "]i'"I' ~ (4-6)
E.Q, repeated
If we freely select a length scale ~ and a scale for the modulus ofr
36
,,£ I i 1

Chapter 4 Dynamic Modeling Theory
elasticity Er' complete similitude requires that
similarity)evident from geometric and p = Er r
dimensionless Quantity be equal for model and prototype. Themust
In many practical situations the fulfillment of all design conditons
will be an impossible task. Under those circumstances it is a matter of
features which may be alteredjudgement and experience to isolate those
such that model construction becomes feasible but the response prediction
is not encumbered with an excessive amount or error.
(Ref. 90)In these kinds of models, Murphy distinguishes between
Adequate models are those where the pre-
by thediction equation is not affected (except for the error introduced
disregard or violation or a design condition) and design conditions may
problem reveals that thebe violated when insight into the physical
results will not depend signiti~antlY on the violated design oondition.
For instance, in the above example, cross-sectional similarity may not be
signitioantly thecritical if shear deformations do not contribute to
deflection 0 . In this case, the moment of inertia 1s adequate to
describe the cross section and band h can be distorted accordingly. As
another example, in certain dynamic problems the effects of gravitational
forces may be small compared to those of inertia forces and consequently
certain design conditions may be disregarded (see Section q.5.2).
models the distortion inActual distorted those whereare one
dimensionless either leads to a distortion of the predictionproduct
equation or is accounted for by introducing compensating distortions in
37

Chapter 4 Dynamic Modeling Theory
other dimensionless products. In the first case the prediction equation
needs to be modified by a prediction factor 0 defined as
(7TI)0 = p (4-9)
(7TI)m
where 7T1 is the dimensionless product defining the prediction equation.
The prediction factor can be determined through physical insight into the
problem or by means of a series of auxiliary experiments. For instance,
in the example problem defined by Eq. (4-6) it is evident that 0 is
inversely proportional to b thus if b is distorted by a factor a , the
prediction factor is given by 0 = 1/a.
For more information on the determination of 0 and compensating
distortions the reader is referred to the book by Murphy (Ref. 90). An
alternative method for the evaluation of compensating distortions is
presented in Section 4.5.3. There, the distorted physical quantity is
introduced as an artificial basic quantity.
4.5 PHYSICAL MODELS rQ.!! ~ ~ SrUDIES
4.5.1 ~ !eplica Models
Suppose the task is to reproduce, at model scale, the time history
-rof stress components aij(r,t) in a replica model subjected to a time his-
tory of vector imposed acceleration a (t). Recognizing that the distri-
butions of stress and of material in the prototype and model must be
identical, dimensional analysis can be applied by calling a a typical
stress, p a typical density, and E some representative stiffness
property. Then the stress distribution may be written as
38
1. I' I . .II I I I II ,

Chapter 4 Dynamic Modeling Theory
-+-cr.. = crS..(r,t) i,j = 1,2,3
J.] J.]
where Sij is dimensionless.
With the greatest degree of simplification, the typical stress can
be expressed through a functional relationship of the form
-+- -+-cr = F(r,t;p,E,a,g,t,cro,ro) (4-10)
-+-
where cr and r refer to initial conditons. Evidently, the omission of0 0
all material properties with the exception of E implies that similarity
of material properties is tacitly assumed.
Utilizing dimensional analysis, a complete set of dimensionless
products can be generated from the dimensional matrix of the quantities
in Eq. (4-10). The products presented in Table 4-2 should be usef1:11 for
this task. The resulting dimensionless relationship could be of the
following form
-+-
c-+- ~ cr r~ = f.!:..!. ! '. ~ ~ ~ ~E (t' t p' g' E' E' t ) (4-11)
If gravitational contributions to stress histories must be accounted
for, the two terms containing the gravitational acceleration g ver~, much
so restrict the model analyst's freedom in selecting model materials and
scale factors. Since there is almost no practical way that g can be
changed between model and prototye, the value of gr usually must be taken
equal to one. Consequntly, from the dimensionless product a/g (Froude'~
Nu!!!b~!:, usually written as v2/tg) it follows that
a = g = 1 (4-12)r r
If this relationship is substituted into the design condition
39
!~ I I I

Chapter 4 Dynamic Modeling Theory
(g~p/E)r = 1, it follows that
(~)r = ~r (4-13)
This scaling law places a severe limitation on the choice of suitable
model materials.
Equation (4-13) is sometimes expressed in terms of one-dimensional
wave propagation velocities, as follows:
vr = 'i{flr = 1[i-; (4-14)
and is then referred to as the Couchy condition (based on Couchy's Number
pv2/E).
There are alternatives to the use of dimensional analysis as a way
of arriving at the Froude and Cauchy criteria. For instance, one can
examine the internal and external forces to which a structure of a given
geometry is exposed. The most important of these are inertia, gravita-
tional, and restoring forces (FI' Fa' and FR' respectively). Their rela-
tionships to material density, stiffness, length, and applied
acceleration may be expressed as
Fr 'V p~3a
F '\i ~3G P g
2 2FR 'V cr~ = E:E~
In these expressions cr and E: are representative measures of stress and
strain.
Independent of scale, FI and Fa must bear instantaneously a fixed
40
it Ii'

Chapter 4 Dynamic Modeling Theory
field, the following parame-ratio, as also must FI and FR- In a one-g
ters result from this requirement:
Froude's Number
.P.!:.!.E
2.e!-
E
3F I .e!...!. '"'" 2
e:ER.Cauchy's Number-
FR
numbers produces a parameterCauchy'sFroude's andbetweenThe ratio
replica model reproduce the full-scaleIt it is required that81 9.pg. a
EqS. (4-12) and (4-13) can be de-values of those numbers, for fixed g,
Thus, Eq. (~-13) is a necessary condition tor simultaneous repli-rived.
cation of restoring forces, inertia forces and gravitational forces.
otherfrom theobtaineddesign conditionsAdditional are
theFor instance, it follows fromor Eq. (4-11).dimensionless terms
second term on the right-hand side that
t(4-15)
bethey must
From thisequal in the prototype and model structures.instantaneously
typical structural displacements are relatedobservation it follows that
bya - R.r r
that geometric nonlinearity in structural behaviorThis relation ensures
is property simulated.
41

Chapter 4 Dynamic Modeling Theory
Table 4.3 shows in column (1) the scaling laws for several physical
quantities for a true replica model. In this the independentcase
quantities are chosen to be ~, E and g, and gr 1s taken equal to one.
Only one--but almost unsurmountable--difficulty exists in this true
suitable model materialreplica modeling, namely, the selection or a
Exact material simulation far beyond simulation of modulus ofgoes
elasticity, Poisson's ratio and strain; theoretically it should include
all pertinent material properties discussed in Section 4.2, such as those
defined by Eq. (~-5). Since two materials 1n nature are exactlyno
alike, material simulation will always introduce errors in the prediction
The importance of these errors, or in many cases their insigni-values.
ficance, the subject or material study which is discussed inare a
Chapter 5.
In the simplest case, similarity 1s tor the uniaxialnecessary
stress- strain curve for the range of strains of interest. Since tJ"ue
replica modeling requires that E : 1 (since e; is dimensionless), ther
stress-strain curves of model and prototype materials should be identical
except for constant stretching by the ratio E IE in the £-directionp ma
(see Fig. 4.1).
Materials difficult to find,with shape-similar (]- e: diagrams are
1n the E-direct1on (E.particularly if no distortion = 1) is permitted.r
Under certain conditions, strain distortion (Er~ 1) provide anmay
interesting alternative to true replica modeling, idea which 1san
discussed in Section 4.5.3.
True replica models are extremely difficult to realize because of
problems in material simulation. Nevertheless, for certain length scale
42

M
..W-l
.!
~~~--'zVi
!. I~ ~.BIs-eA.
~C
~~eoX
.u-'Q.!QI
2--
litlit
is-'Z..--~i'"---II)......-:
~$¥
";GI
Z
1ftGI~0
>->
~,~
s-...s-o
...~
-Q
C
"';s....'A
;~ -;; 1-
c.
~
I;,-
---
-In-
:5cocOi
~
.. I .P s.. of s.. .PI.... ~ .., -1
...-t
.Z' .P.... - ~... Q,.P ~
...1 '"Q: ~ '"Q: u.. - GI
loa - loa -- . - ~
.,~ ~ ~
... ... ...- - -I s.. s.. s..
I.s..~~~-~~~
i~
..~I ..~ -..,. -
of ... .p... _I8\ et
50 50 50 50 50.. ~ > ~
4_~
.888- ->. v >"'~ ~~ ... ~s.. s..41 - "41 GI= v .~~ ~0" 0 >GI aJ41 ~ IOU vs.. 41 s..v V~ "'. ..
~u~
";.
~
~"'Q:
'"-
7~'"
-
... ... ... ... ~. Q. .., 0 w
~I.. -I -
~-litCQI
~ c
-
lit oalit s..
I ~
et'-""\.-'"
~I-
-,
litlit
flit
'" "'I'" '"
'"'
I.. 1..1'" '"
C'I.- ~ ~I - W W
~ I ~ I I ~C'I'"8t ~W~ ~W ~~
~W ~w w '-8t 8tW w '-8t '- '-
~ .. w WM
I- l-I W
...~>.
i0'" '"- u'"
"'u ~4IU~- ~ c ..1 '" u a-
.. 4I~ III... a ~~ """~
&.- &.Q. &. &.-
'01602!!O', ~
«~
...- N,.,Co - ... 81 81'" 81 ... ..-
...~
o.pter -
N tOtI- l-
I- of .... I- I-
-., ~
...
N '- '-'- w Wt '- '-
.., ~
N M50 50 50
~ ~ ..
~0
o,n..lc &deling Theory
fI~c~
~0Ia~-'"II>C-
. II'" .c- -8 >.i .a
cU II
- '"0
'" .c.. U
-GI GI
'-
'- ....GI -0C GI
- C- -
'- ~0 II
-0C'iN~'" .",~"'O
.!,.:~c'-
"'0>.- II. U ~
~GlUIa~'"
CGlCJ..GI.c
U~~« ~

Chapter ~ Dynamic Modeling Theory
(1factors = Er/Pr>' suitable materials for the modeling of metallicrtestingstructures can be found (see Chapter 5) and a pilot program on
simple models of this type is discussed in Chapter 9.
Stress-Strain S18ilitude Require8entsFigure 4.1
In many cases it is possible to find acceptable alte~natives to true
replica modeling which are based on compromises that minimize the errors
Several or alternatives are discussed inin response prediction. these
the problemsSections ~.5.2 and ~.5.3; or them will solve allnone
but all are believed to be suitable torencountered in dynamic modeling
model studies concerned with particular paramet~rs andofcertain types
structural configurations.
To overcome the difficulty of simul-~ Testing ~ !. Centrifuge:
p;ravitationaltaneously reproducing restoring forces, inertia forces and
forces, one could try to increase the effective value of g in the modelm
by mounting a shake table inIt might be possible to achieve thistest.
a suitable orientation on the cab of a large centrifuge. Also, it would
have to be possible to bring leads from the cab so that required data can
Let it further be hypothesizedbe recorded and processed on the outside.
44

Chapter 4 Dynamic Modelins Theory
created over the entirethat a uniform, parallel acceleration field is
model and, during centrifUge operation, that there would be no difficulty
Thus,in applying the required earthquake Aooeleration A to the model.II
given "controllable gravity". it follows from (gtp/E)r = 1 thAt
(*)g R, -r r r
choose the same materials tor model and proto-couldAs an example, one
type; thus:
1r.r
g er
last requirement might prove impractical. Itsmall models, thisFor
would 0811 tor both very high rates or rotation in the centrifuge and for
very high imposed acceleration levels am since ar = gr . 1/tr8
In order to put this results in perspeotive, let us look at the NASA
the "Ames ResearehAmes Research Center twentY-R centri ruge described in
Facilities Summary, 1914". This facility can provide lon~-time exposure
No smaller thanot up to 20g tor a payload ot up to 1200 (earth) pounds.
a twentieth-scale model of the same material could therefore be accomoda-
weight or this lIOde 1, theWith 8 roughly 1000 1bs. limit theted. on
that could be modeled is limited toweight or prototype structurea
1000 x (20)3 Ibs., or about 8,000 kips.
it is possible that a centrifuge might be employedAlternatively,
Thus, one might choose phosphor bronze, whichwith reduced E/p models.
On the 20-R facility, one could thenhas roughly haIr the £1 p or steel.
model, at 1/40 scale, structures or steel that weiRht up to 64,000 kips.
45

Chapter - Dynamic Modeling Theory
4.5.2 Adequate Models
All physical models which violate any of the design conditions dis-
cussed in the previous section could be called distorted models. How-
ever, if the effect of a distortion in one dimensionless product is such
that it does not require an adjustment of other dimensionless products or
of the prediction equation, then it appears appropriate to separate such
models from truly distorted models. In this report such models are
called adequate models.
The need for such models is based on the desire to theuse same
materials as in prototypes. However, the types or models discussed in
this section not limited materials; 1nare to the use of prototype
certain cases the use of different materials make such models evenmay
more powerful tools.
There are two distinot "distortions" leading to two types of models
which should very useful ror model studies or certain olasses orprove
structures on shake tables.
1.
Equation (4-13) for true replica modeling requires that model mate-
rials have a small modulus or large mass density or both. Since such Ina-
terials dlt't'loult to find,are it appears attractive to augment the
density or the structurally effective material with additional material
which is structurally not effective. This easily be achieved incan
lumped mass systems but may also be feasible for distributed mass systems
as is discussed below.
(!.) Lumped ~ Systems: For oftypes typical buildingmany
46

Chapter 4 Dynamic Modeling Theory
seismically effective massstructures it is acceptable to represent the
the floor levels (lumped masses).by a series of masses concentrated at
be decoupled from theIn this case the seismically effective mass can
relaxes theof' structurally effective material whichdensity the
dimensional requirement that (Kip) must be equal to I. .rrCauchy's requirement for proper simulation or inertial forces and
restoring forces can then be written as
(~ (~'\9.2E ,I
(4-16).m p
which tor g = 1 becomesrM,.
In this equation, H represents the lumped masses at the floor levels.
to be added to the seemingly trivial termA word or caution has
"lumped mass." Such masses are those which are seismically ~ ~ struc-
mass which is attached to structuralturallyeffective. In reality, any
Masses at floor levels.will affect the structural response.components
will certainly affect the stress distri-such as a concrete slab system,
structural elements and in many cases will be part of thebutton in the
must be taken in positioning such "lumpedGreat carestructural system.
gravitationalmasses" in models to simulate realistically the effects of
simulationand inertia forces. In the distributed massmay cases
discussed in (b) is preferable.
the structurally effective mass is small andNevertheless, when a
representation of the seismically effective mass by lumped masses is fea-
r r
47

Chapter 4 Dynamic Modeling Theory
model tests this often requires excessive weights which may render such
tests impractical. The weight requirements may be reduced when model ma-
terials with small stiffness properties (E) are used (see EQ. 4-16).
(~) ~istributed ~ Systems: For many types of structures a correct
simulation of the mass distribution in space is essential and a simpli-
fied lumped mass system cannot be accepted. A simple way of testing
adequate models of such structures would be to decouple the mass density
Po of the structurally effective material from an additive P1' which is
to be built into the model but has no counterpart in the prototype. Thus
the full-scale density and stiffness would be represented by (po)p and
Ep' whereas those for the model would be (po)m + P1 and Em' respectively.
This modification would alter Cauchy's requirement as follows:
19m= [~]pWith one-g testing this relation leads to
PI Er(po) + (p> = rr 0 P r
or
PI = [ f- - (po) ] (po) (4-17)r r p
For instance, for a 1/20 scale model using prototype material
(Er = (po)r = 1) the density will have to be increased by a factor of 19.
In a small-scale model, it takes considerable imagination to see how the
material that increases the density by P1 might be incorporated.
Much work needs to be done on this sub,1ect, since it is very
48
I :1

Chapter 4 Dynamic Modeling Theory
difficult to effectively separate the seismically effective mass from the
structurally effective material. There are, however, instances whE~re it
seems quite practical. For instance, in structures consisting of s:lender
load-carrying members, the scheme for addin~ mass could be to atta(~h to
each member suitable amounts of lead or other soft high density matE~rial,
arranged in such a way that it contributes negligibly to the strength and
stiffness but augments the weight and inertia. The spacing of these
added masses should be maximized, so as to facilitate the manufacture
while still adequately approximating a distributed inertia.
The modeling law for such distributed masses can be obtained by
replacing the mass per unit volume Po with some representative ma~JS per
unit length Vo' When lead or other material with running mass ~1 is
attached to the model members, Cauchy's requirement then is altered to
[~~]m= [~Jp
With one-g testing this leads to
1.11(V) + ( ) = E R,
or V rr0 p
or
~ = [ E R, - (~) ] (V) (4..18)1 rr or op
Using the same material in model and prototype would make Er = 1 and
( 2 2~o) = R, (from p = V It). This leads to the requirementr roo
VI = (t r - R, 2)(V ) (4-19)r 0 p
This law mayor may not be practicable, because it calls for adding a!21
of mass. For instance, for linear elements of a 1/20 scale model of
identical structurally-effective material, (~o)m is 1/400 of (~o)p
49
I 1

Chapter 4 ~namic Modeling Theory
whereas ~1 is 1/21 of (~o)p hence 19-times as massive per unit len~ths as
the basic model structure.
It appears that the practical realization of this scheme for small
scale models in many cases will call for using reduced E/P model mate-o
rials. The use of such materials (wh.ich need not obey the requirement
(E/p)r = ~r) will require a lesser amount of added ~1 which might enable
the model designer to reach much more desirable compromises in the choice
of materials and added weights.
As an example, the combination of lumped masses and model materials
other than those of the prototype could prove to be useful in case of
truss type structures such as transmission towers, drilling towers, radar
stations, etc. For instance, in the case of a radar station it would be
improper to neglect the weight of the members and account only for the
radar screen weight; on the other hand lumping of the masses at the
joints or at the best at a few points along each member seems to be
sufficiently precise. Use of a model material of lower E/p than that of
the prototype material will help to keep those masses down to manageable
sizes. Construction of this kind of model seems to be relatively simple
provided the joint area is not of critical importance.
The modeling laws summarized in column (1) of Table 4.3 apply to the
cases discussed in (a) and (b) with the exception of the requirement
(E/p)r = ~r' For the case of identical prototype and model material
(E = 1) the modelin g laws are shown in column (2) of the table.r
Models with "artifical" mass simulation have been used extensively
in the past for static and dynamic model studies. References 45 to 58
are examples of the application of st.!ch models in the field of earthquake
50
I

Chapter 4 Dynamic Modeling Theory
engineering. Particularly, multistory buildings and bridge structures
appear to be well suited for these types of studies. Such model studies
are expected to result in a good prediction of prototype behavior
provided that mass distribution is properly simulated, the ground motion
is reproduced according to the laws of similitude, model design and
construction is done according to prototype procedures, and last but
perhaps most important, a thorough material study has proven the ad,equacy
of material simulation. It is expected that model tests with
"artificial" mass simulation will remain ~ very important sour,ce of
information on structures whose stress and displacement histories h:ave to
be simulated in the elastic and inelastic range and whose materials are
difficult or impossible to simulate by other than prototype-like
materials, such as in the case of reinforced concrete structures.
.?:. ~ Tests Without Si!!!ulation .C;?!: Gravity Forces
Considering at this time only building structures, it appears that
for certain types of structural configurations the stresses indul~ed by
gravity loads are small and maybe negligible compared to stress his1t.ories
generated by seismic motions. In this case (a/g)r need not be equal to
one, which allows considerably more freedom in selecting model materials
and scaling parameters.
The scaling laws can be derived from the remaining dimensionless
products of Eq. (4-11), with g in g~p/E replaced by a. If ~ and E as
well as p of a specific model material are selected as the independent
quantities, the scale factors shown in column (3) of Table 4.3 can be
derived. If prototype material is used (i.e., Er = Pr = 1), all scale
factors can be expressed in terms of ir' see column (4) in Table 4.:3.
It is important to note that the scale factors for many physical
51
I; I I

Chapter 4 Dynamic Modeling Theory
quantities are different from those for true replica models which will
affect the shake table input, the model design and the response predic-
tion. For instance, when prototype material is used (column (4) in Table
4.3), with t = ~ and a = ~-1, a reproduction of actual seismic motionsr r r r
on commercially available shake tables may cause problems. This again
invites the use of other than prototype materials with (E/p) smallerr
than one. For instance, if brass is used for the simulation of steel,
(E/p) r is approximatelv 0.5 which results in t = 1.41~ ' v = 0.71 , and" r r r
ar = 0.5~;1. With these values, seismic motions become more easily
reproducible on shake tables.
A building system which may be suitable for this type of model
testing is a K = 0.80 buildin~, i.e., a structural system where the
lateral load resisting system consists primarily of shear walls which
carry little vertical loads except through boundary elements. In slender
shear walls the level of stress due to vertical loads in the boundary
elements will usually be small and will not affect the response of a
shear wall to a significant degree. Clearly, even a K = 0.80 building
will not be replicated "precisely" through a model of this type since the
stress level in the moment resisting space frame surroundin~ the shear
walls is not properly simulated. However, considering the low stiffness
of this frame compared to the shear wall, from such model tests one can
expect reliable information on shear walls far into the inelastic range.
Considering steel structures, let us look at a multistory braced
frame without moment resisting connections. In most types of bracing
systems the stresses in the bracing members due to vertical loads will be
negligible compared to those induced by lateral loads. Thus, the
response of bracing members will be replicated through model tests of the
type discussed herein. However, a simulation of the load-deformational
52
ii! 'I

Chapter 4 Dynamic Modeling Theory
response of the structure will require proper modeling of, at least, the
vertical elements of braced bays.
4.2.Let us investigate a braced frame of the type shown in Fig.
Figure 1& . 2 Braced Frame
Assuming uniform distribution of dead load WD(psf)
triangular lateral load distribution.
and live load
WL(psf> and approximatea an
analysis shows that the ratio or axial column loads due to seismic and
gravity forces above leveli is given asn
1: j{j-i)
j-i+l-Ii~ j
j-l
( ~Pc i
where ct is a seismic coefficient defined by base shear V = a WD8
For the ground floor (i = 0) this equation reduoes to
n
r j2- ~ ~~ 1h j-!
nr j
j-l
I'~
PG -aW;;+~b0
53

Chapter JI Dynamic Modeling Theory
For braced frames with b = 2h and wL = 0 (a rational assumption for model
tests) one obtains the force ratios given in Table 4.4
Table -.-
n5 10 20 30
1-0 5.5a la.Sa 2a.Sa 3D.Sa
5 7.1a
13.4a 24.4a10
14.4a20
Assuming the seismic coefficient ~ to be of the order of 0.1 to 0.3,
significantit can be seen that the effect of gravity loads becomes less
one to believe that awith an increasing number of stories. This leads
replication of gravity loads may sometimes not be necessary for this type
or frame.
or the kind described here appear attractive since theyHodel tests
containmentreactormterial. Nuclearpermit the use of prototype
quiteanother type of structure where such tests appearvessels are
loads are small compared to theor gravityfeasible since the effects
It usuallyeffects of internal pressurization and s.evere ground motions.
or not thewhetherjudgement decideis up to the model designer's to
introduced by neglecting gravity effects are acceptable. It theerrors
lar~e, true model distortion is evident and either thetooerrors are
products have to be modifieddimensionlessprediction equation or other
geometric nonlinear1tiesWhen materialto compensate for the error. or
are involved in the problem, this will be an extremely difficult task.
with linear elasticHowever, when the model test is only concerned
seismic effects andbehavior, gravitatinal effects can be decoupled from
54

Chapter 4 Dynamic Modeling Theory
can always be neglected in the derivation of similitude law. Thus, the
scaling laws in columns (3) and (4) of Table 4.3 can always be used for
linear elastic problems, regardless of the importance of gravity effects.
This makes model design for linear elastic tests very simple sin,ce the
only material contraints are that of a linear elastic range characterized
by E and, where needed, similitude of Poisson's ratio v and ma'terial
damping properties.
4.5.3 Distorted Models
The use of truly distorted models for seismic studies of nonlinear
problems is rather limited since it rarely will be possible to find
adequate corrections to the prediction equation or other ph~'fsical
quantities, to account properly for the violation of an important design
condition.
One could attempt, for instance, to design a model where g]~avitv
effects are only partially simulated through the addition of "artif:lcial"
masses to reduce the error introduced when all gravity effect:~ are
neglected. Such a "mixed" model would be governed by similitude laws
which are a compromise of those listed in columns (2) and (3) of Table
4.3. Thus, the scale factors for the quantities governing the seismic
input to the model (t, v ' a) will need to be re-evaluated throu~hr r r ~
physical insight or an auxiliary testing program.
Alternatively, one could try to properly simulate spatial geometry
of the structure but distort the geometry of the cross section such that
gravitational and inertial forces produce the correct level of stress in
each member as well as correct dis p lacement similtitude (cr = ~). Usin~r r ~
prototype material for the model one arrives, from E E ~ 2 = p ~ 3, at
rrr rr
55
.oT~ I

Chapter 4 Dynamic Modeling Theory
the following similitude laws:
A =.R,3 As =.R,3r r' r r
I = .R,5, J =.R,5r r r r
This shows that simultaneous replication of axial load, shear,
bending and torsional effects will not be possible. However, the
possibility exists to change the shape of the cross section such that
close similarity between A, As, I and J may be achievable.
Both of these alternatives will have limited applicability and are
not pursued further in this project. However, another type of
distortion, namely strain distortion, shows certain promise for small
scale model studies provided that no geometrical nonlinearities are
expected.
The requirement of identical strains in model and prototype
(£r = 1, see Fig. 4.1) is often difficult to fulfill from the standpoint
of availability of suitable model materials. It is much easier to find
shape-similar materials if a stretching by £ ~ 1 in the £ -direction isr
permitted as is illustrated in Fig. 4.3.
To account for strain distortion in cases where small displacement
theory holds true throughout the experiment (i.e., no secondary effects
are involved), Rocha (Ref. 103) proposed the introduction of an artifi-
cial fundamental quantity D for strain measurement. When this term is
included in the dimensional matrix in the addition to M, Land T, and a
dimensional exponent of 1 is assigned to the quantities dependent on £,
the following dimensionless functional relationship can be obtained:
56
, '\

Chapter 4 Dynaa1c Modeling Theory
+(] r
a.&.!e. 0 0i' IE' iE"' '1£
+ ifl' t EIi' I p; (4-20)...Q:..-'l
EE
= 1, the following similitude laws can then be derived:
1
For 8r = gr
(~)r
-~e:r r
(4-21)
_A~.Y~r-r
t r
and
4, .1&r-rThese and other similitude laws derived from Eq. (4-20) are shown in
column (5) or Table 4.3.
Em£pF1&Ure -.3 Streu-StraiD Diacraa - Strain Distortion
As the development of these similitude laws is based on the somewhat
fundamental strain quantity and assumes linearorphilosophical idea a
on this fundamental quantitydependence of selected physical quantities
fordistortionfurther study is needed to prove the feasibility of this
Assuming that the similitude laws of column (5)inelastic model studies.
prove toof Table 4.3 adequately account for strain distortions, it may
of problems where Reometrlc nonllnearltiesmodelingbe very useful for
57

Chapter 4 Dynamic Modeling Theory
are known to be insignificant. The restrictive requirement {E/p)r = ir
for materials for true replica models can then be relaxed to
(E/ p) = i /~ which Permits considerabl y more freedom in the choice ofr r r '
suitable model materials. For instance, it may be possible to fabricate
small scale models of steel structures made of certain copper alloys
(Er~0.5, Pr=1) without artificial mass simulation, presuming that it is
possible to anneal the alloys such that they have a yield strength of
(cr) = (if ) E ~ = (cr ) E t /(E/P) -=:-L for P -::: 1. However, this alsoym yprr yprr r r r
implies that ~ -=:- 2~ (for E ~ 0.5) and 8 ~ 2~ 2 which will requirer r r . r r
very sensitive instrumentation.
Other types of inadvertently caused model distortions often have to
be considered, primarily those caused by inadequate material simulation
such as distortions in Poisson's ratio, hysteretic energy dissipation,
strain rate effects, etc. Such unintentional distortions are sources of
errors and can rarely be accounted for through modifications 1n the
dimensionless functional relationship of the problem. These errors are
discussed in more detail in Chapter 5.
4.5.4 Summary
Dimensional analysis has been used to derive modeling laws for
various types of model tests of structures subjected to seismic motion.
At the outset it has to be realized that an exact replication of all
parameters affecting the response of structures under dynamic actions can
rarely ever be achieved. The emphasis in this study is directed towards
identification of important parameters and possible types of model tests
which allow, as exact as possible, replication of these important
parameters.
58
" I

Chapter - Dynamic Modeling Theory
generallyof the modelin~ laws presented herein areAlthough most
studies of prototypesapplicable, emphasis was placed primarily on model
The model test resultsas steel.of homogeneous isotropic material such
and lead one to believe that manyobtained in this study are encouraging
Asteel structures can be modeled with sufficient accuracy.of'types
whichfinal answer can only be obtained through a series of model tests,
needs to be pointedItcan directly be compared with prototype studies.
this study, only primary structural elements have beeninout that,
nonstructuralstructural andinteraction betweenoonsider-ed and no
elements is included.
the right type of model for the intended purpose andorThe choice
the degree or approximation that must be accepted are of primary concern
complex thr-ee-general ormost ato the model analyst. In the case
are equallyinertia effeotsgravity anddimensional structure, where
the ideal choice provided that areplica model~istrueimportant, a
adequateIt this is not possible,suitable model material can be found.
often be achieved by means of ~ t!!tsmodel testsaccuracy in can
showsIn cases where prior knowledge
seismicgravitational effects are sufficiently small compared tothat
feasibleeffects, ~ test~ without simul~~ion ~ gr!yity forces are
believed to be theThese three types of model studies arealternatives.
phenomena bymost suitable ones for the replication of seismic response
means or small shake tables.
59

Chapter 5 Evaluation of Hodel Materials
CHAPTER 5
EVALUATION OF MODEL MATERIALS
5.1 INTRODUCTION
Providing the right model material whose properties wellare
documented in the literature and which properly simulates the behavior of
the prototype material has always been a major obstacle to the acceptance
of model tests as verification of prototype response, and has raiseda
continuous suspicion as to the reliability of model results. Thistest
holds particularly true for dynamic tests to failure which are of primary
interest in experimental work in earthquake engineering.
The demands placed on a model material can easily be defined but the
search for a suitable material and a verifioation of its suitability are
formidable task. similaritya Ideally, a model material should provide
of all material properties disoussed in Seotion ~.2, i.e., the listed
thermal and mechanical properties should be identical to those of the
prototype material after the application of scaling laws. In the simple
case of a unixial stress-strain relationship (see Eq. 4-5) this requires
similarity of the derivatives of stress with respect to strain, time, and
temperature, and of' strain with respect to time. Fortunately, in
practical modeling problems, similarity 1s only required tor those
material properties which affect significantly the response quantities of
interest in the study. An a priori knowledge of these relevant material
properties, derived from physical understanding or the problem, is
important for every model study since it may simplify the search tor a
suitable model material.
Even then, satisfactory model material will be difficult to find
particularly for dynamic studies in the inelastic domainresponse
60

Chapter 5 EYaluation or Hodel Materials
model material must be readily available, reasonably inexpen-Firstly, a
be easily adaptable to structural shapes andsive and, above all, must
fabrication of member connectionsmust allow a simulation of prototype
that no two materials are alike and compro-realizemustSecondly, one
Even a prototype materialmises in material simulation must be accepted.
time and lengthwill not simulate mechanical properties properly in the
It is imperative, therefore,domain due to strain rate and size effects.
to isolate the material properties which must be simu-in a mde 1 study,
Also, errors encounteredlated and those which can be compromised. the
due to improper simulation of material properties must be evaluated as to
their importance in response prediction.
Sinoe this study is oonoerned primarily with dynamio models of steel
emphasis in material modeling isand reinforced concrete structures,
placed on the simulation of structural steel, concrete and steel reintor-
cement.
SuccessfUl studies on ultimate strength models of steel prototype
structures have been reported by several researchers who used either pro-
totype material (i.e., Refs. 31, 58, 85, 86) or non-ferrous metals (i.e.,
Ref. 38). Results of material tests on structural steel and on copper
alloys performed in this study are reported in Chapter 6.
For modeling of' subjected to inelasticconcrete structures
deformations it is hardly ever possible to use anything but concrete-like
Thematerials such as microconcrete, cement mortar or gypsum mortar.
static properties of model concrete and model reinforcement wellare
documented in the literature (Refs. 18, 36, 117, 120, 145,39, 115 to
147), while much less is known about the properties under dynamic test
146, 149).conditions (Refs. 39, 122, A significant portion or this
study is devoted to modeling of reinforced concrete. Techniques adopted
61

Chapter 5 Evaluation of Model Materials
in the fabbrication and testing of microconcrete and reinforcing wire are
discussed in Chapter 7 together with the results of static and dynamic
tests of these materials. Chapter 8 provides a discussion on the fabri-
cation, testing and test results of reinforced microconcrete beams. Both
static and dynamic behavior are considered.
In this chapter, the properties which are expected to affect the
dynamic response in the elastic and inelastic range are identified and
their simulation requirements are briefly summarized. A material testing
program is discussed which should provide the information necessary for
the evaluation of the pertinent material characteristics. The chapter
includes also a section on laboratory equipment and instrumentation nee-
ded for the implementation of such a program.
5.2 MECHANICAL PROPERTIES OF INTEREST-When it is necessary to simulate the complete load-deformation res-
ponse of a structure from zero load to failure, ideally the following ma-
terial properties should be simulated:
1. Stre~s-Strain Diagram ~ Unixial ~ Tests: If no strain dis-
tortion is allowed this will require point by point equality of the ratio
alE, in prototype and model material, where E is the modulus of elasti-
city or some other representative stiffness property, and a is any elas-
tic or post-elastic stress value on the a-£ diagram. In other words, the
stress-strain curves of model and prototype materials should be identical
exce pt for a stretchin g by the ratio E IE in the 0 - direction (seep m
Fig. 4.1). This requirement is often difficult to fulfill as will be
shown in the case of individual materials. However, exact simulation of
the monotonic stress-strain behavior may not be of the utmost importance
62
. I ,," ,

Chapter 5 Evaluation of Model Materials
in cases where the material (whether single or composite) is known to be
subjected to inelastic stress reversals. In seismic response studies the
requirement that the amount of energy dissipated bV the material be
properly simulated is of primary importance. Ideal simulation would mean
that at all strain amplitudes the shape and area of hysteresis loops
should follow the modeling law. Again, this may be difficult to achieve
entirely, but prototype and model materials should have similar strain
hardening or softening tendencies and shape similar hysteresis loops in
the strain range of interest.
It should be observed that a simple tension test or a cyclic load
test of the prototype and model material is a model study bV itself, and
hence should fulfill similitude laws such as strain rate scaling and
scaling of the geometry of the specimens. The importance of this obser-
vation will become apparent in the next few points.
2. Poisson'~ Ratio: In the discussion of modeling theory it was
stressed that all dimensionless quantities should be equal for model and
prototype. This applies also to Poisson's ratio unless the error intro-
duced by a distortion of v is negligible or can be accounted for through
modification of other physical Quantities. Approaching the modeling
theory through the equation of state defining the response of the pro-
totype enables the investigator to approximate the error involved in the
misscaling of v. For instance, Hossdorf (Ref. 1) shows that for a bar
subjected to a considerable amount of torsion, the ~ Quantity v could be
replaced by a different dimensionless product of the form:
EI I~ = ~ = (1 + V)J;
Thus, the prediction error for torsional response will not be propor-
63
:1 I I I 1

Chapter 5 Evaluation or Hodel Materials
tional to the respective v values, but will be proportional to the 1 + v
tions of related physical quantities can be illustrated in the example or
plate (Ref. 96).the vibration of simply supported The governinga
equation for small transverse bending vibration of a thin plate is
a4w
-;;;.-+
11 2 2a w p 3(1 - v ) a w+2:---
ayll ax2ay2 E h2 at2
a4w
2For true dynamic replica modeling it must hold that (RIP) = 1 and t =r r r2 2 2lr' thus, dimensional homogeneity will require that «1 - v )/h )r = 1/lr
This condition permits the derivation or a separate scale for the half
thickness h of the plate as h = 1 .f( 1 - v 2) I.r r V\ I - v J r
Hence, in many practical cases it is possible to evaluate the in flu-
ence of Poissons's ratio on the load-deformation response of the struo-
ture. When found to be of a minor importance (probably in a majority or
building structures), a compromise in the modeling of v is acceptable.
3. Material Damping: The importance of parameter in materialthis
simulation depends on the definition given to this term. Damping in
structures subjected to severe earthquakes will be caused, amongst other
factors, by anelastic material damping the energy dissipated by a ma-
terial within a hysteresis loop without permanent strain offset), actual
hysteretic offset),damping (associated with permanent strain anda
interfaces between structural materials (e.g.,friction type damping at
at bolted connections) and between structural and nonstructural elements.
The anelastic material damping depends greatly upon the stress or
strain amplitude (Refs. 170, 171) and although its value can be of signi-
64

Chapter 5 Evaluation of Model Materials
ficance in the elastic cycles, once the linear range of material behavior
is exceeded, it is small compared to other damping contributions and is
not investigated further in this study. Hysteretic damping at strain
amplitudes beyond the yield level is a matter of shape and size of the
hysteresis loops which can be compared directly between prototype and the
model material. As such, this covers material damping in steel but not
necessarily material damping in materials and composites which exhibit a
nonlinear range between the proportional limit and the designated yield
strength. This range may be a source of si~nificant difference in
damping between the prototype and model materials. It will be necessary,
therefore, to evaluate this damping in model materials, at various stress
levels, by means of the damping tests discussed in the next section.
Simulation of friction-type dampin~ is a problem which may greatly
affect the response of structures but is not included in this material
study. Actual model tests are necessary to evaluate structural damping
as a whole and to provide answers regarding the adequacy of the
simulation of this type of damping.
4. Strai~ ~ Effects: It is well known that high strain rates
will affect the cr-E diagram. For structural steel they will cause a
distinct increase in the yield strength, a negligible increase in the
tensile strength, and a decrease in the ductility of the material. For
concrete, they will cause a significant increase in compressive strength
(f'), a noteworthy increase in initial stiffness (E), and a decrease inc
the strain at f'.c
The understanding of such phenomena is of importance for two main
reasons: first, to estimate the dynamic properties of the prototype
material based on the values obtained in static tests, and second, to
account for different strain rates in the prototype and in the model. To
65
, I I 1

Chapter 5 Evaluation of Model Materials
illustrate the second problem, the empirical formula derived by Nagaraja
(Ref. 151) for mild steel is presented:
(a )d / (a) =, + 0.762 £°.26y y s
. . -1where E represents the strain rate ln sec.
Since the strain rate in the model test will be scaled by the factor
1/t , the increase in yield strength due to strain rate effects for anr
ideal model material should follow the rule
. o 26(a )d / (a) =, + 0.762 (t E) .Y Y s r
This expression shows that the use of prototype material is not ideal for
model tests; it will exhibit too large a yield strength, although only by
a small amount except for very high strain rates.
5. ~-~ Effects: In theory, simulation of initial conditions
will require the tracing of all time-history events affecting the proto-
type from the time of construction to the time at which the dynamic event
takes place. These events will include, amongst others, time-dependent
material effects such as creep, shrinkage and increase of compressive
strength of concrete. A study of these phenomena was not part of the
reported research and only a short discussion follows in subsequent
sections.
6. ~ Effects: The increase in strength with decreasing size of
specimens has been studied by various researchers for both steel and
concrete materials. Nevertheless, only fragmentary data can be found in
the literature on size effects of mild steel and even less precise infor-
mation is available on these effects for concrete. In part, the size
effects can be accounted for by carrying out the material studies on spe-
cimens comparable in size to the smallest dimension of model structural
elements. Specific size effects, such as strain gradient effects and
effects related to fabrication (e.g., weldments), can hardly ever be a-
66
!
I I 'I~ I I

Chapter 5 Evaluation of Hodel Haterials
voided and deserve attention in the evaluation of model test results. In
particular, a simulation of crack initiation and propagation at weldments
cannot be achieved at reduced scales and should not be attempted in model
tests.
that high1. Ductility: Sufficient evidence is available to prove
Size effects willstrain rates will decrease the ductility of materials.
characteristics. Within structural elementsalso change the ductility
the changes in ductility characteristics of metal model materials should
characteristics atthebe of negligible consequence; however, fracture
connections (in particular at welds) are size dependent (see previous pa-
deformation capacity ofragraph) which in turn may affect the inelastic
In model elements of reinforced concrete structures themodel elements.
element ductility will depend not only on the ductility of the component
materials but also on the bond characteristics and fabrication details as
is discussed in Chapter 8.
8. of' models or steelElements
model material by means of machining,structures may be fabricated from
casting, extruding, rolling, welding, soldering, glueing. Possibleor
processes mustchanges in material characteristics through any of these
Suitable fabrication techniques are discussed inbe closely controlled.
detail in Ref. 58.
5.3 MATERIAL TESTS - EXPERIMENTAL FACILITIES
In order to perform a successful model material study, a specialized
testing system must be developed which consists of suitable testing faci-
The following pa-lities, instrumentation and a data acquisition system.
ragraphs summarize the experience gained and the observations made during
67

Chapter 5 !Yaluation or Hodel Material.
or suitable testingthis study with regard to the three components a
system.
5.3.1 Testing Equipment
Under this heading such elements as testing machines, support frames
The main objectives in the design orgripping devices are included.and
application capacitytesting equipment are to provide the necessary load
and simple gripping orand control over the applied force and reliable
will dependThe desired characteristics of the systemthe specimen.
greatly on the type or tests to be performed and also on the geometry and
strength of the specimens.
5.3.1.1 Uniaxial Load Test Facilities
This group includes facilities for monotonic tensile, 8Onotonic com-
The tests can be performed either at staticpressive and cyclic tests.
or at dynamic rates.
the relativeof tests 1sOne of the major problems in this type
of the speci-stiffnessstiffness of the testing system compared to the
the ability ot the system to respond fast enoughmen, and simultaneously
strokeinformation provided by the control device (strain, orto the
is or particular importance when a rapiddevice). Thisforce control
change in specimen stiffness is expected (upper yield in mild steel, com-
pressive strength in concrete) and specimen behavior beyond that point is
High rate loading plaoes partioularly high demands on theor interest.
To ove~oome the problemresolution capacities of the testing facilities.
stiff concrete specimens with a rapid strength losscaused by relatively
stirrenin~ or the testing system have beenartificialat r', methods orc
68
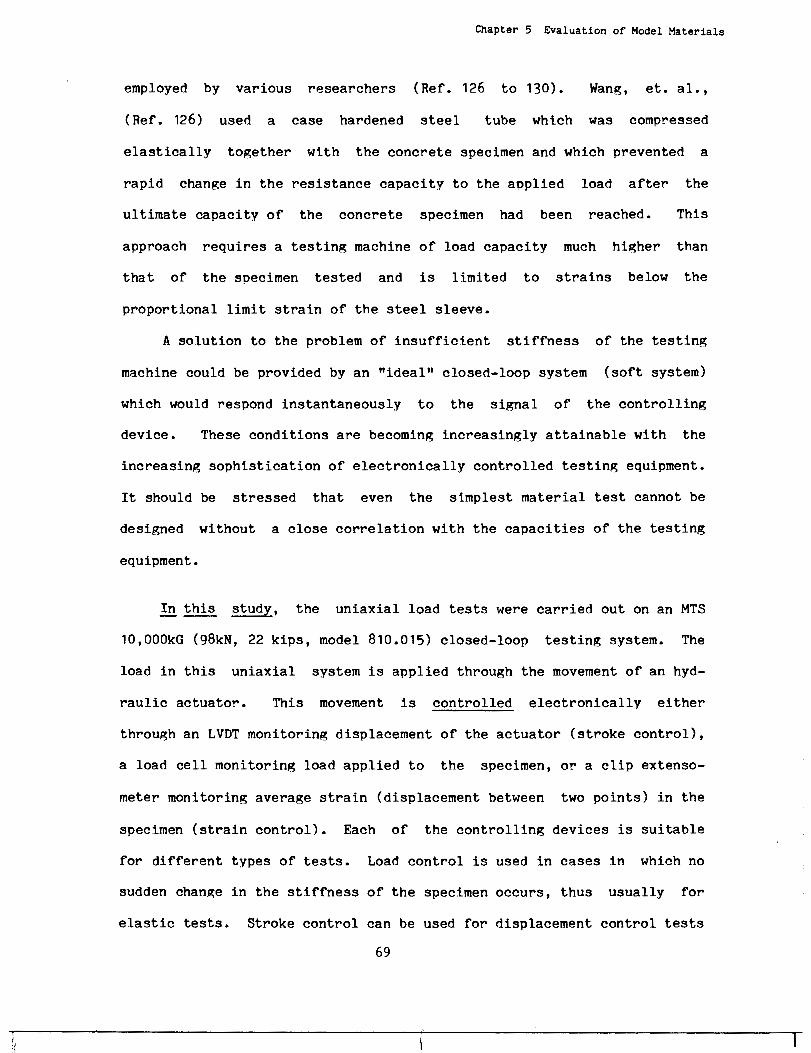
Chapter 5 Evaluation of Model Materials
employed by various researchers (Ref. 126 to 130). Wang, et. al.,
(Ref. 126) used a case hardened steel tube which was compressed
elastically together with the concrete specimen and which prevented a
rapid change in the resistance capacity to the applied load after the
ultimate capacity of the concrete specimen had been reached. This
approach requires a testing machine of load capacity much higher than
that of the specimen tested and is limited to strains below the
proportional limit strain of the steel sleeve.
A solution to the problem of insufficient stiffness of the testing
machine could be provided by an "ideal" closed-loop system (soft system)
which would respond instantaneously to the signal of the controlling
device. These conditions are becoming increasingly attainable with the
increasing sophistication of electronically controlled testing equipment.
It should be stressed that even the simplest material test cannot be
designed without a close correlation with the capacities of the testing
equipment.
~ ~ ~, the uniaxial load tests were carried out on an MTS
10,000kG (98kN, 22 kips, model 810.015) closed-loop testing system. The
load in this uniaxial system is applied through the movement of an hyd-
raulic actuator. This movement is controlled electronically either
through an LVDT monitoring displacement of the actuator (stroke control),
a load cell monitoring load applied to the specimen, or a clip extenso-
meter monitoring average strain (displacement between two points) in the
specimen (strain control). Each of the controlling devices is suitable
for different types of tests. Load control is used in cases in which no
sudden change in the stiffness of the specimen occurs, thus usually for
elastic tests. Stroke control can be used for displacement control tests
69
II \ 1

Chapter 5 Evaluation of Model Materials
on relatively soft specimens. This control is unsuitable for relatively
stiff specimens, as the monitored displacements include the deformations
within the testing system (machine frame and actuator displacement, load
cell and gripping device deformation). In those cases and in cases in
which strain control is desired, an extensometer can be used for the
control of the test.
All the tests on metal specimens were strain controlled, and compre-
ssion tests on microconcrete cylinders were controlled by the extenso-
meter monitoring the change in distance between the plattens.
For simple tension tests of steel specimens, standard MTS hydraulic
tension-compression grips were used for gripping the test specimens since
small preloads and misalignment inherent in the use of this grip proved
to be of no significant influence. However, the problem of testing mate-
rials of lower strength than that of steel, the use of small specimens
necessitated by scaling of length, and the need for cyclic testing with
excursions into the compressive range required better alignment than
could be achieved with the standard MTS grips. This problem was solved
through the fabrication of a special "self aligning" Woods metal grip
similar to that developed by Morrow (129). A sketch of this grip is
presented in Fig. 5.1 and a test specimen embedded in the grip and
mounted on the MTS system is shown in Fig. 5.2.
The gripping procedure was as follows:
1. Thread and lock the specimen into the load cell attached to the MTS
crosshead and into the inner part of the grip.
2. Heat the fusible alloy in the grip by running saturated steam through
the heating-cooling spiral in the outer sleave of the grip. (Fusible
alloys = easily meltable alloys whose eutectic temperatures are below
70
I .III ! I I


Chapter 5 Evaluation of Model Materials
the melting temperatures of the alloying constituents; Woods metal
used is the product of alloying 50% of bismuth, 25% of lead, 12.5% of
tin and 12.5% of cadmium with the resulting melting temperature of
about 10oC, and with positive volume change in the cooling process).
3. Lower the crosshead till contact develops between the parts of the
grip.
4. Activate the MTS actuator under load control to produce a minimal
compressive load.
5. Cool the alloy by running cold water through the spiral.
6. Switch the control to the extensometer attached to the specimen.
5.3.1.2 Component Test Facilities
As will be discussed later, component tests are often necessary to
permit a reliable correlation between prototype and model response, and
to aid in an evaluation of the feasibility of specific model materials.
~ ~ st~d!, the pseudo-static and dynamic behavior of components
was studied by means of subassembly tests of the type shown in Fig. 5.3.
These tests were carried out on the MTS testing machine utilizing a
specially designed erector-type rigid test frame which is shown in
Figs. 5.3 and 5.4. The frame was constructed in such a way as to permit
its translation and rotation respect to the MTS machine and to allow the
testing of specimens of different confi~urations. For the specimen shown
in Fig. 5.3, ball bearing hinges were fabricated to provide low friction
support for the column of the subassembly. Monotonic or cyclic loads can
be applied to the tip of the cantilever beam by means of the MTS
actuator. Lateral support of the beam is provided by pairs of teflon
padded vertical rails attached to the test frame at specified locations. I
72
11 1

Chapter 5 Evaluation or Hodel Materiala
Figure 5.3 View or CoGponent Test Setup
Figure 5.4 Test Fra88 for Co8ponent Testi~
73

Chapter 5 Evaluation of Model Materials
A different type of subassembly which was tested in this support frame is
shown later in Fig. 8.2.
5.3.1.3 Load History Control
The capability for the reproduction of various load histories is of
basic importance in material test studies. Mills, et. al., (Ref. 58)
discuss wave forms which may be used to control material tests. The
subsequent paragraphs present a summary of the major points of that dis-
cussion.
Three basic functions are commonly used for the test history con-
trol, namely ramp function, triangular wave and sinusoidal wave. Each of
these waves can be used with shifted origin thus resulting in cycles with
positive or negative mean load, displacement or strain. Numerical, com-
puter-generated random histories can be converted to analog form «,onti-
nuous voltage output) and used for test control.
As rate of loading is of considerable importance in material testing
for dynamically loaded models, it is necessary to evaluate this parameter
for consistent correlation between the tests. Ramp loading and triangu-
lar wave forms provide constant testing rate throughout the entire time
history. Sinusoidal waves result in a rate varying from a maximum near
the axis of symmetry to zero at the peak of the wave, and thus only a
mean rate can be estimated. Despite this disadvantage, a sinusoidal wave
form proved to be very suitable for cyclic studies. It provides a smooth
change of the direction of the loading and also resembles more closely
the loading history which the specimen undergoes within the structure
during a dynamic motion.
!n this s~~dy, ramp functions were used for the control of monotonic
74
f I

Chapter 5 Evaluation or Hodel Materials
testss and sinusoidal functions used tor thewere control of cyclic
material and component tests.
5.3.2 Instrumentation
Standard instrumentation for experimental model analysis is
discussed by MilIa, et. al., (Ref. 58). In this section, only a brief
review of the instrumentation used in this study is given with the empha-
sis on the instrumentation developed for special measurements in material
and component tests.
In addition to the previously mentioned instrumentation belonging to
the standard equipment of the MTS testin~ machine, e.g., linear variable
differential transducers (LVDT) for displacement control, load cells ot
various sensitivity depending upon the load applied, and clip extensome-
ters for the ormeasurement small length changes which permit an
assessment of average strain, the following instruments were used in this
study:
0 LVDTs used to measure deflections in component tests
0 strain gages used to calibrate the instrumentation and to measure
localized strains in flexural metal elements
0 mercury gage extensometers used for the measurement of average
strain in compressed concrete cylinders
0 mercury gage extensometers for the measurement of average curva-
ture in component study of reinforced microconcrete cantilever
beams.
dent in material studies. In the studies on model materials and compo-
75

Chapter 5 Evaluation of Hodel Materials
nents an additional demand is imposed, namely that the instrumentation be
(Ref. 58),Mllls, et. a1., usedor minimal size. mercury gap;esa
panel distortion in the tests of small(Fig. 5.5) for the measurement or
lowsubassemblages. The exhibitscale beam-to-column verygages .balan-(0.3 ohm) and therefore have to be used either with aresistance
opposite arm of the bridge or with precisioncin~ mercury in thegage
For standard signal conditioners, the resistance of the gagesresistors.
of a four arm bridge is recommendedtherefore the1s too low and use
with the remaining two arms supplied by higher resistance (e.g., 120 ohm)
pretenslonedprecision resistors. The should be used in agages
Each gage must betheir linear behavior.condi tion in order to ensure
Forprovide the calibration constant.calibrated individually to
instance, for 20 mm (0.75 in) long mercury gages and the signal condltlo-
ner set at 1 mVIV, the oalibration constant was 1.2 to 1.5 V/mm. The 08-
libration was done using an HTS testing machine with an extenaometer used
tor the control ot the displacement.
The measurement of strains in compressed concrete cylinders presents
Glued-on strain gages provide only localized intor-a major difficulty.
meaningless if a crack develops under the gage.mation which may become
large num-In addition, this method is inefficient in studies in which a
of specimens is to be tested, due to the high cost and large amountbel'
preparatory work involved. usedof In this study, tour clip gages were
the average strain over a gage length of 50 mm (2 in.) at 900to measure
The ~~s (Fig. 5.6) developed inintervals around the specimen. were
the laboratory, with mercury ~ages used to monitor the change in the gage
lenp;th.
The mercury gages proved also to be very useful for the measurement
16

Chapter 5 Evaluation of Hodel Materials
MERCURY IN SILASTIC TUBING0.040 In. dl..eter0.015 iD. vall thickness
PLUGSHRINK-TUBING
r~UNTI NG BLOCK
~ I,
L-_!---./~ '.-
PtJUNTING PIN 1 "-~F:~{T).e ~ SOLDERED LEADWIRE
58)Figure 5.5 Silaatlc Mercury Ga~ (Ref.
Fisure 5.6 View of Setup for Microconcrete Compression Test
77

Chapter 5 Evaluation or Model Materials
or relative displacements between two points in a structural element.
For instance, in the study of reinforced concrete components the measure-
ment of the rotation of a specific cross-section or the beam with respect
to the column face was necessary. This was done by measuring the change
in distance between the column face and a frame attached to the beam at
the cross-section in question (Fig. 8.5). The measurements donewere
using mercury gages.
5.3.3
All the aforementioned instrumentation is or electronic nature and
the measurements are obtained i~ terms of voltage, thus allowing a conti-
nuous record of' the data. Although graphical recording i8 of importance
primarily for an immediate test evaluation, digital registration of the
data is needed for final data reduction. A properly designed data acqui-
sittion system permits a rapid and continuous recording or data from a
large number of channels (instruments) simultaneously. Once the data 1s
recorded, its reduction in terms of numerical analysis can be performed.
The data acquisition system used in this study allows a recording or data
from 32to channels at the rate of 42000 dataup points/second. An
extensive data reduction package is available in the computer library of
the laboratory. Figs. 5.7 and 5.8 present schematically the experimental
facilities and data reduction package available at Stanford. A detailed
description of the data acquisition and reduction system 1s presented 1n
Ref. 58.
78

Chapter 5 Evaluation or Hodel Haterials
'isure 5.7 Testing Facilities at Stanford Structural Laboratory
Fisure 5.8 Baaio Data Reduction Package (Ref ~ 58)
79

Chapter 5 Evaluation of Model Materials
5.4 Testing Program
The testing program carried out in this study included the following
tests for prototype and model materials:
1. ~ Strain ~ Monotonic~: Standard ASTM tension tests
were carried out on steel prototype material and on reduced size speci-
mens (geometrically scaled in proportion to the model length scale lr) of
model materials. In most cases the tests were carried to failure to in-
vestigate similitude at all ranges of deformations. Various sources sug-
gest different strain rates as being representative for a static loading
test. Since a perfectly isothermal test (Ref. 173) is not within the
range of engineering investigations, a low yet feasible strain rate of
2x10⁻⁴/sec. has been selected as a static strain rate. Compression
tests on steel specimens were also performed to provide a comparison for
the compressive branch of the skeleton curve obtained from cyclic load
tests.
In the material study of model concretes, compression tests were
carried out on 50x100 mm (2x4 in.) microconcrete cylinders to investigate
the strength of microconcretes obtained from various mix proportions and
cured for various lengths of time.
2. ~ S~r~!n ~ Monotonic~: This series of tests with va-
rious strain rates was carried out to supplement the data on strain rate
effects available in the literature for steel and microconcrete and to
investigate strain rate effects in phosphor bronze and its adequacy in
satisfying Eq. (5-1). The tests were carried out with constant avera~e
strain rates over the mid-section of the metal specimens (extensometer
attached to the specimen), and over the entire height of the
microconcrete cylinders (extensometer controlling the distance between
80
f I

Chapter 5 Evaluation of Model Materials
the plattens). Ramp functions were used for the control signal of the
extensometer.
3. Cyclic ~~: Low strain rate cyclic load tests were
carried out on metal specimens with a gage length equal to twice the
section diameter. These stocky specimens were required to prevent
buckling in the strain range of interest. The selected load histories
consisted of symmetric cycles with increasing strain amplitude a as
shown in Fig. 5.9. The three selected loading histories permit an
evaluation of strain hardening or strain softening tendencies, a
comparison of shape-similarity and area of hysteresis loops and an
assessment of the stability of hysteresis loops of equal strain
amplitudes (see loading history #3). The tests were carried out under
strain control with sinusoidal input wave. Cyclic loading test~1 with
random loading histories and high strain rates would be desirable but
were not within the scope of this study.
~cQ ~ eq"i; £y "f7
12. /2 12-
9 1 9
6 6 6
3 3 3
'*' oJI. -#
3 :3
, , 6'
9
1 I 12-
(t) (2) (3)
Figure 5.9 Cyclic Load Histories Used in Metal Specimen Tests
4. Material Dampins: The anelastic material damping can be evalua-
ted at various stress levels from free vibration tests in torsion or ben-
ding by means of standard laboratory equipment. This was done for the
81
~ I

Chapter 5 Evaluation o~ Hodel Materials
metal materials studied. metal ma-The actual hysteresis damping in the
terlals be deduced from cyclic load tests for loops with variouscan
strain amplitudes. An equivalent viscous damping can be calculated from
the expression proposed by Jacobsen (Ref. 174), i.e.,
~w-w
Beq
1:-
21T
where 6eq = equivalent viscous damping coefficient
A W = dissipated work per cycle
W = work capacity per cycle
There alternative ways to measure material damping (Refs. 170,are
175) which are not pursued further in this project since the knowledge of
damping or the integrated structural system is of more importance that
that of an isolated material segment. Thus, the emphasis in this study
measurement of the damping in complete models through free andwas ~
forced vibration tests on the shake table, with dampingthe charac-
teristics fromextracted the decay of free vibration or from spectral
analysis of forced vibration records (Rer. 176).
5. ~~onent Te~: It must be emphasized that material tests alone
are not suffioient to permit a reliable correlation between prototype and
model response and an evaluation of the feasibility of specific model
materials. Such important phenomena size effects, strain gradientas
effects, and simulations of local instabilities and stress concentrations
at bolted or welded connections can only be studied through component
test with known quasi-static load application. Also, simple component
tests have shown that apparent dissimilarities in material behavior may
often have little effect on the response of structural elements. Conseq-
uently, certain dissimilarities such as the absence of an upper yield
point and of a yield plateau in model materials for steel structures may
82

Chapter 5 Evaluation of Hodel Materials
sometimes be acceptable.
The tests described in this chapter are time consuming but, once a
inbe carried out mostmethodology has been developed, they can
integral ofwell-equipped structural laboratories. They form partan
purpose of providing theevery successful dynamic model study, for the
necessary to select a suitable model material and to assessinformation
the reliability of the prototype response predicted from model tests.
8~

Chapter 6 Materials for Models of Steel Structures
CHAPTER 6
MATERIALS FOR MODELS OF STEEL STRUCTURES
6.1 INTRODUCTION
Despite the extensive use of steel in structural design the number
of model studies performed on steel structures 1s remarkably small oom-
pared to the number of model studies performed reinforced concreteon
structures. The reason for the scarcity of model studies on steel struc-
mathematical techniquestures may be that larger confidence is placed in
Structural analysis methods based onapplied to this type of structures.
the theory or elasticity are widely accepted 1n steel design. Local
nonlinearities (connections, local instabilities) oan be accounted for by
applying experience gained in innumerous laboratory tests performed on
full scale structural components and subassemblages. This is not so in
the case or reinforced concrete structures. Early nonlinearities appe-
.ring in the behavior or this composite material always imposed serious
questions reliability of standard structural analysis methods.theon
The complex nature of force transfer within the material and between the
members required extensive study, not only of the components but also or
entire structural modelsystems, and hence perpetuated studies on
concrete structures.
Under earthquake excitations and other dynamic loading events (blast
loading, extreme wind, impact loading, etc.), energy dissipation through
In these oases,inelastic deformation may become of primary importance.
inadequate and experl-available mathematical modeling techniques may be
mental model analysis may provide much additional information. Harris,
et. a1., (Rer. 38), have performed an experimental study on model mate-
84

Chapter 6 Haterials ror Models or Steel Structures
In Refs. 31, 85,rials for dynamic models of steel prototype structures.
86 and 143, case studies on models of steel prototypes are reported.
6.2
one-to-one simulation of the scaled stress-strain diagram is de-A
maDded by similitude laws (Section 4.5.1) for monotonic as well as cyclic
Therefore, a brief review or the uniaxial stress-load application.
-strain characteristics of structural steel is presented in the following
paragraphs.
schematic diagram of an engineering stress vs.Fig. 6.1 presents a
strain curve for structural steel (low carbon steel subjected to monoto-
The yielding ~henomenon is associated with thenic tension till failure.
yield),initial yielding of metal at a stress concentration point (upper
bands)the propagation or plastioally derormed metal bands (Luder'sand
development or thealong the lover yield plateau. The initiation and
amount or interstitial atoms preventin8 theyield bands depends upon the
dislocations (impurity pinning) tree propagation. Carbon atomsfrom a
present in the structural steel crystalline exemplify interstitial atoms.
Under normal testing conditions, the drop in strength from upper to lover
yield is of the order of 10 to 20' for An explanationstructural steel.
necking andof the physical phenomena associated with strain hardening,
rupture is presented, tor instance, in Ret. 157.
cyclicstress-strain diagram for structural steel underA typical
load application is shown in Fig. 6.2. Compared to the monotonic stress-
-strain diagram, a description of the cyclic characteristics is complica-
the occurence ot cyclic work hardening, Bauschingerted considerably by
Manyempiriosleffects, mean stress relaxation and other memory effects.
85

Chapter 6 Materials for Models of Steel Structures
bCI)CI)uJIt:
~
O'"yu
O'"yl
F1iUr8 6.1 Stress-Strain Diagram fro. Tension Test of Structural Steel
S'."I.
Figure 6.2 Cyclic Stress-Strain Disgram for Structural Steel
86

Chapter 6 Materials for Models of Steel Structures
models have been proposed in the literature for a mathematical evaluation
with great success toappliedbeenof these phenomena, but havenone
Under load histories with symmetric strainfully random load histories.
amplitudes it can be observed that the peak stresses and hysteresis loops
The lineequal strain amplitude.cycles orstabilize after fewa
at various strain amplitudes isconnecting the peaks of stabilized loops
This curve and theas the cyclic stress-strain curve.often referred to
this study toused insymmetric hysteresis loopsshape of the are
characterize the cyclic stress-strain behavior.
structural steel,of'An experimental study on the cyclic behavior
Laboratory at Stan-Structureswhich has been recently completed at the
cyclicford (Ref. 156), provides valuable data for a comparison with the
symmetricThe th,-ee basicbehavior or other than steel model materials.
Ref. 156 are listedstrain histories with zero mean strain adopted from
'~was added in this study tohistoryin Table 6.1. The test with load
amplitude provide information on thee8tablish whether three cycles per
final (stable) hysteresis loops.
Tabl,6.1
Cyclic Load Histories
AmplitudeCyclic LoadHistory No.
Cycles perAmplitudeFirst Incremental
steel-1
3.3
12
2242
1131
1234
81

Chapter 6 Materials for Models of Steel Structures
6.3 SUITABLE ~ MATERIALS
6.3.1 ~roduction
One of the major difficulties in the modeling of steel structures is
the choice of a satisfactory model material. Ideally (~replica ~-
~), the material should satisfy the similitude requirement stating
that the specific stiffness scale ratio should be equal to the geomet-
rical scale, i.e, (E/p) = 1 (see Section 4.5.1). This rule eliminatesr rthe use of prototype material for true replica models. Due to the
specific nature of the stress-strain diagram of structural steel, it is
very difficult to find non-ferrous materials with behavior similar to
that of steel.
A preliminary search for a suitable model material may be based on
the monotonic stress-strain characteristics but must then be supplemented
with information on the cyclic stress-strain behavior. Table 6.2, which
is taken from the Material Selector Issue of Material Engine~ring, pro-
vides a convenient tabulation of specific stiffnesses of a wide variety
of materials. Besides the required E/p ratio, the material must satisfy
the condition that the yield strength to modulus ratio, cry/E, be the same
as that of the prototype material (uniqueness of strain scaling, see
Section 4.5.1). For A36 structural steel, cr IE is approximately equal toy
0.0012. This requirement poses severe problems for thermoplastics
because of their inherently low elastic moduli. Most thermoplastics
studied were found to have much higher yield strengths compared to their
E values than steel (for example, for polypropylene cry/E = 0.02). Con-
sequently, to make use of these plastics ways would have to be found of
drastically reducing their yield strengths while not affecting the
88
, , I

Chapter 6 Materials for Models of Steel Structures
Table 6.2
Specific Stiffnesses Elf
E/~. 10fin
Material. Ratio Material. Ratio
8erylllum 657 BerylliumCopper 64SillconCarbide 607 ZirconiumandltsAlloys 598oronCarbide 483 Yellow8rasses(cast) 58~~,yllia. 413 NickeISilvers 57AlumlnaCeramics 420 Phenolics. Shock Resistant 56MIca,Natural 337 Silicon8ronzes 56Mica,Synthetic 281 Red8rass.85% 54Titanium Carbide Cennet. ... ' ".' 248 Commercial 8ronze. 90%.. ~ 54PolycrystaUineGlass 219 Leaded Brasses 53TunlSlen.Titanium Carbide Cermet 192 GildinR, 95% 53Zircon 188 PhosphorBronzes 53TunISIen CarbideCermet 185 Copper.. "..."..." ,., ,.,..." 53BoronNitride 163 TinandAluminumBrasses 53StandardElectricaICeramics 143 CartndgeBrass.70% 52Glass. Alumino-Silicate 140 LowBrass,80% 51Ruthenium 136 Leaded Tin Brorues(cast) 51Glass.FusedSilica 129 TeliuriumCopper 50Mica,Glass.Bonded 129 MuntzMetal., 50MolybdenumandltsAlloys 127 Yellow Brass 49Glass.96%Silica 124 Columbium 48Glass. Borosilicate... 123 Leaded Red Brass (cast)..., 47Sleatite... . . .. . ... ... 120 Tantalum. . . . . . . . .. 45Cobalt.BaseSuperalloys 120 Uranium 43Nickel.BaseSuperalloys 112 Hafnium 43TitaniumandltsAlloys III Metamines 42Glass, Soda Lime... ... '" III Carbon.. ... .' '.."..'." '...' '." 41HighTemperatureSteels III Palladium 39UltraHighStrenithSteels 107 Ureas 34Ingot Irons 106 Polystyrenes.Glass.Filled 33CarbonSteels(cast) 106 ReinforcedPlastics.Polyester 33Wroughtlron 106 Graphite 31PearjiticMalieablelrons 106 Pewter 29Carbon Steels. . . . .. . ...,.".,.."., ,.. . . . 106 Silver. . . . . . . . . . . . . . . . . .. . .. ... ".,..,.. ."...,...". 29AIIoySleejs 106 PhenyleneOxide.30%Glass-Filled 29NitridingSleeIs 106 Tln.Lead.AntimanyAlloys 29StainlessSteels(ca5t) 106 Platinum 27AluminumandltsAlloys 105 DiallyIPhthalate 25Age HardenableSlainlessSteels 104 GradeATin 25HeaIResistantAlloys(cast) 104 Thorium 24FerriticStainlessSleels 104 Phenolics,GP , 23MartensiticStainlessSteels 104 Polyvinyl Formal 19Iron.8aseSuperalloys(Cr.Ni.Co) 103 ModitiedPolystyrenes 18Free.CuttingSteels 102 Gold 17Iron.BaseSuperaJloys(Cr.Ni) 102 Polyesters(cast) 16MagnesiumAlloys 102 Polystyrenes.GP 16AusteniticStainlessSteels 100 Acrylics,GP 14Nodularlrons(cast) : 100 Phenolics(cast) 12Osmium 98 PolyvinyIButyral 12Reinforced Plastics. Phenolic 96 Nylon66 12Malleablelrons(cast) 96 EthyICeliulose,GP 10RhodIum 94 ~lon6 10Cobalt 94 enylene Oxide, 5E.100 9.5NickelandltsAlloys 93 Acrylics,Hightmpact 9Cordiente. .. . . ... . ... .. . . . 93 Acetal. . ... . ... .. . ... . . . . .. . ... ..,."..,. ... . . 9Iridium 91 ABSResins 9Vanadium 87 Ethyl Cellulose, High Impact 9NickelandltsAlloys(cast) 86 Polycarbonate 9Phenolics. Electncal... . . . . .. . . ." . . . 85 Nylon 610. . . . ... . . .. .. . . ... . . . 8Tungsten 84 Polypropylene 6Glass.LeadSilicate 82 Nylon1! 6Monel 82 CeliuloseNitrate 5LowExpansionNickeIAlloys 81 LeadandllsAlloys 5Gray Irons (cast)... . . . . .. . ... .. . . 77 CFE Fluorocarbons. . . . . . . . . .. . .. .. . . 5ColumbiumAlloys 74 Polyethylenes. LowDensity 1Cupro.Nickels """"""'.'.".".'."'" 68 TFEFluorocarbons. 1AlumlnumBronzes(cast) 66 PolyvlnylChloride,Nonrigid "".'."""."""'..' 0.07. .. SpeelDC .tiffIlCM. or .tlffn_weigbt rati.-. were obtained by dividing ruo<Julua or eluticity ia teoaion (pai) by denaity (Jb/cu in.). SpecIDcalJy,th.
bigb., vallI. uf a rang. or typiCal valua wu divIded by thA, material'. deaoity.
89
I I

Chapter 6 Materials for Models of Steel Structures
elastic properties. Fig. 6.3 (after Ref. 38) presents the stress-:strain
curve for ethyl cellulose (ethyl ether of cellulose), and Fig. 6.4 shows
the comparison of the idealized stress - strain curve to that of
structural steel. The specific stiffness ratio is equal to about 1/63,
the modulus of elasticity ratio is equal to about 1/160 and the ratio of
yield stresses is equal to about 11.!.Q. The two last ratios indicate!, that
in order to satisfy the true replica model requirements, the yield
strength of this material would have to be lowered by the factor of 16,
which is impractical. Another possible difficulty with the thermoplas-
tics is their high Poisson's ratios compared to steel and other metals.
Metallic materials with E/p ratios higher than that of structural s~teel,
such as lead alloys and copper alloys, on the other hand, cain be
heat-treated to develop appropriate a IE ratios.y
In view of the above considerations in the preliminary study, the
effort was concentrated initially on both lead and copper alloys and on
one specific copper alloy, namely phosphor bronze (CA 510) in the final
study.
For adeq~ate mod~ls (see Section 4.5.2) the requirement that
(E/p)r = lr need not be fulfilled. Thus any material that fulfills the
material similitude requirements can be used for such model studies. The
obvious choice is clearly the prototype material, i.e., structural steel.
Suitable copper alloys are often desirable alternatives due to their
smaller stiffness which reduces the weight requirements for artificial
mass simulation.
Whatever the choice of a model. material, it must be emphasized that
certain material characteristics cannot be simulated at model scales.
.1:8
90
j I

Chapter 6 Materials for Models of Steel Structures
~
41504000
... 3000Q.-
(/)U)..,a:'<i) 2000
000
~ 2 4 5 6 '1 8 9 10STR.A:IN, -'0
If "2 '3 14 15 1116
Figure 6.3 Stress-Strain Diagram from Tension Test of Ethyl Cellulose (Ref. 38)
,...:;Q)(.)
t~
f
STRAIN %
F~re 6.- Comparison or Tensile Stress-Strain Diagraas or StruQural Steel and Ethyl Cellulose
91

Chapter 6 Materials for Models of Steel Structures
This holds true particularly for fatigue and fracture properties, whether
the model material is nonferrous or structural steel as in the prototype.
Even in the latter case the size and distribution of initial flaws and
the fracture properties as well as crack propagation rates cannot be
simulated due to size effects.
6.3.2 Structural Steel ~ ~ ~ ~aterial
\;ithin certain limitations, structural steel is the best suited ma-
terial for models of steel structures with artificial mass simulation or
without simulation of gravity forces. The identical shapes of the
stress-strain diagrams of the model and prototype materials, and the
ability to closely simulate prototype connections (bolted or welded) are
the major advantages. Nevertheless, the question remains as to the sig-
nificance of the increase in the strength of the model material caused by
the higher strain rates (tr) as compared to prototype material. Thus,
much emphasis is placed in this study on a thorough evaluation of strain
rate effects in structural steel. The importance of size effects is dis-
cussed in a subsequent section. When strain rate and size effects are
quantitatively known for the selected length and time scale, it is reaso-
nably simple to account for specific aspects of these effects by either
modifying the gravity loads and seismic input or, perhaps more appropria-
tely, by suitable heat treatment reducing the yield strength to the
desired value. In this study, A36 structural steel was used for all the
experiments. The modulus of elasticity of the material used in the tests
is E = 212.3x10³ MPa (30.5x10⁶ psi) and the specific gravity is 7.6930.
92
! ,

Chapter 6 Materials for Models of Steel Structures
6.3.2.1 Strain Rate Effects
Considerable research has been devoted to the influence of the speed
of testing on the yield stress and the ultimate strength of mild steel.
Manjoine (Ref. 152, 1944) reports a study in which mild steel was
tested in tension at strain rates from 10-8/sec. to 103/sec. The
reported increase in yield stress for this range is 83% and for the range
from 10-5/sec. to 10-1/sec. the increase is 31%. These high values might
have an inherent error due to the inadequate strain rate control.
Manjoine also observed that the yield stress increases with the increase
in strain rate until the limit when the ultimate stress (which is inde-
pendent of strain rate) is reached without yielding.
Garner (Ref. 153) presents a compilation of data from 9 sources for
-4yield strength obtained at strain rates varying from 10 /sec. to
103/sec.
More recently (1966) Nagaraja (Ref. 151) performed a study on strain
rate effects on the yield strength of structural steel. The empirical
formula derived in this study for rates till 1.4x10⁻³/sec. is
(crY)d/(cr) =1 + 0.762 EO.26, y s
or, using the yield stress obtained at a strain rate of E = 2x10-~/sec.
as the normalizing value:
cry/(cry)2x10-4 = 0.923 + 0.703 eO.26 (6-1)
Pirotin and East (Ref. 189) presented the following relationship for
strain rate effect on the yield strength of stainless steel (after norma-
lization for t = 2x10⁻⁴/sec.) :
cry/(cry)2x10-4 = 0.920 + 0.44 to.2 (6-2)
~ ~~, tensile tests were performed on structural steel at
strain rates from 10-5/sec. to 10-1/sec. A set of 24 specimens was ma-
93
i I

Chapter 6 Materials for Models of Steel Structures
chined out of A36 steel square bar stock and stress relieved at 600oC for
one hour after machining. The central section or the specimens was 45 mm
(1.15 in.) long with a diameter of 9.52 mm (O.375 in.) and with smooth
transition from the ends. The specimenssquare mounted in thewere
testing machine with the help or hydraulic grips.
The tests were performed under constant strain rate controlled by a
25 mID 1 in.) gage length MTS extensometer attached to the central por-
tion of the specimen. Ramp function (constant strain rate) was used as
the controlling signal. The tension tests were terminated when the ave-
raged strain reached 3 percent. The measurements made during the test
(load, average strain) were recorded continuously by the computer data
acquisition system (Section 5.3.3).Fig. 6.5 displays two typical stress-strain diagrams obtained for
low and high strain rates. The high strain rate exhibits twocurve
anomalies. First, the lack of sharp transition from lowertoupper
yield, and second, the strong stress fluctuation along the lower yield
plateau. Both the phenomena are believed to be independent of real ma-
terial behavior and to be caused by the inability of the testing system
to control such rapid load changes (0.09 sec. till yielding).
All the lower yield stress values were normalized with respect to
the average value obtained for the strain rate of 2x10⁻⁴/sec. (300 MPa,
43.5 ksi). The results of the testing program summarized in Tableare
6.3 and the normalized data points with a fitted curve are displayed in
Fig. 6.6. The mathematical representation or this curve is or the
following form:
(6-3)
94

Chapter 6 Materials tor Models of Steel Structures
~Zi CE~2~10/5e . ksiMPa
-" ,-c41. C£#2~1U .,se
300 40(/)
~Q::~
C.I)
200
0
100
3.2.%
f.o.STRAIN
Figure 6.5 Tensile Stre..-Strain Diagrama for Structural Steel Tested at Low and
High Strain Rate
Table 6.3
Sum8ary of Result. for Strain Rate Ittect
on the Lover Yield Stress or Structural Steel
NO!'malizedYield Stress
Strain hte No. ofSpecs.
Coefficientof Variation
Average LowerYield Stress
J1/sec. MPa ksi--0.9810.987, .
300.6302.7306.5
43.1I 43.~
44.,1
0.5
0.4
313
,
1x10-::>1x10-42x10-4
2x10-41x10-35x10-32x10-21x10-1
II3323
297.9310.8322.5333.0350.3
113-
115.
116
118.
50
1.21.51.10.11.1
1.1.0431.0821.1181.17c
95
,011 :16
,21,08.77,30,81

Chapter 6 Haterials for Models of Steel Structures
b-
~IIGI..
rt)
~..~='..()='~..rt)
'"'0
IIII..~~"...II>-~!
.3..c..c0..0
~'"'J81
41..
~
c..
~
..
rt)
~\0
t~I&.
~I~
~
<JQJ
~~'-
':'>C- lJJ
h"C{Q::
~~~V)"0-
It)
'c-
C\J~ q~
-: 0')c
~.o Jxc).. av ).. ,9
~ D ,.of)
96

Chapter 6 Materials for Models of Steel Structures
This curve and curves obtained by other researchers are plotted in
Fig. 6.7. These curves show that in model studies, in which steel is
used as model material, differences in the yield strength between the
prototype and model can reach 3% of the value for 1:15 models with simu-
lated gravity forces (t = 1 -1/2), and up to about 6% for models inr r
which gravity forces are neglected (tr = lr). Whether those relatively
small differences in the initial yielding value are acceptable without
adjustments has to be decided separately for each individual case.
t
- - - - - - - - Manjaine
Nagaraja'ro 1.1 Garner
:.: ~t:J >- C\J this study
~>-
\D
f.
--~,-
0.9I
STRAIN RATE (f/sec.JFigure 6.7 Results from Various Sources on the Strain Rate Effect on the
Lower Yield Stress of Structural Steel
6.3.2.2 Size Effects
Conflicting opinions are expressed in the literature on size effects
of mild steel and other materials. However, there is considerable expe-
rimental evidence of size effects on the yielding of mild steel
(Refs. 154, 155). The effects are explained by the difference in stress
gradients of large and small specimens. Richards recorded and evaluated
statistically size effects in round steel bars subjected to axial tension
97
, i I

Chapter 6 Materials ror Models or Steel Structures
bendingsubjected to(Ref. 154) rectangular steel beams pureand
concluded that the yield stress can be related to the(Ref. 155). He
volume of the test specimens and can be expressed by the equation
ifif =-~Y y1/m
y1 is the yield stress for awhere V is the volume of the test specimen, 0
for specificspecimen of unit volume, and m is a material constant the
For the steel used in his investigation (a commercial qua-type of test.
carbon content or 0.18 percent)lity killed structural mild steel with a
Richards found m to be equal to 58 for and equal tothe tension tests
that the size effect inThus, it is evident11.7 for the bending tests.
bending is much more pronounced than in axial tension and may be si~iti-
cant for small scale models.
be partially accounted for by the use or eater!alSize effects can
in size to the smallest dimension of model struo-comparablespecimens
tural ele88nt.
6.3.3 Copper Alloys
6.3.3.1 Introduction
which render themalloys have mechanical propertiesMany copper
In addition, theseof steel structures.quite useful for model studies
eas1lyare readily available in bar and plate stock, can bealloys ma-
of individual elementschined into structural shapes, and permit joining
a manner very similar to steel. However, it must be pointed out thatin
heat effects from welding affect different alloys in different ways which
single most important criterion in the search for amake weldab111ty the
suitable copper alloy for modeling of welded struotures.
98

Chapter 6 Materials for Models of Steel Structures
The E/p for most copper alloys is of the order of one half or that
for steel, hence these alloys can be used for 1:2 scale true replica mo-
dels. Probably more important is their application for models with arti-
ricial mass simulation since their elastic stiffness is approximately
only haIr that or steel. Small scale steel models will often require ex-
cesssive amounts of additional mass which may either cause model fabrica-
tion problems or place excessive demands on the weight and dynamicmay
force requirements for small shake tables. When copper alloys are used
as a model material, the weight requirements are cut in half and the dy-
namic force requirements are also reduced.
Although general information mechanical properties of copperon
alloys can be found 1n many material handbooks (134 to 136), detailed
data on stress-strain behavior and other relevant properties discussed in
Section 5.2 were not available, which necessitated a testing program on
several promising alloys. The alloys investigated in the course of this
material study (copper alloys No. 260, 510,614, and 655, see Table 6.->
exhibited quite different properties. However, all tested alloys or1~i-
nally had strength properties which were much too high to satisfy the s1-
militude condition (ay/E>r
cess had to be carried out
= 1. Thus, trial and error annealing pro-a
to reduce the nominal yield strength to the
desired value.
The results of high strain rate (3x10⁻²/sec.) tension fortests
three or these alloys in the non-annealed condition and for cartridge
4080Cbrass annealed at are presented in Fig. 6.8. It is evident that
AHPCO 8 and Everdue 1010 show undesirable stress-strain characteristics
tor a simulation of steel while cartrld~e brass and CA 510 appear to be
well suited tor this purpose.
99

Chapter 6 Materials for Models ot Steel Structures
Table 6.4
Copper Alloys Investigated Prel1minarly in this Study
Standard
DesignationColIDDercial Name Chemical Composition Form a t De 1 i very
CA 260Cartridge Brass 70J Cu, 30J Zn 6 mm ('/~ in.)
half-hard plate
Ampco Grade 8 CA 614 91% Cu, 7% AI,2% Fe
6 mm (1 JI in.)
half-hard plate
Everdur 1010 CA 655 97% Cu, 3% Sn 12 mID (1/2 in.
half-hard rod
!Phosphor Bronze CA 510 9~.8J Cu, 5J Sn,O.2J p
12 mm (1/2 in.)half-hard rod
1 - Cartridge Brass Annealed at 408 C, 2 - AHPCO 83 - Copper Alloy 510, 4 - EVERDUR 1010Strain Rate 3*10-2/sec.
I(J)
MPakai
50
300
40
!oj
~ 30E-o
C/)
200
20
100
10
0,000.002 0.03 0.040.01 0.02
ST&AjN
Figure 6.8 Stress-Strain Dia~ams for Copper Alloys Tested at High
Strain Rate (t: 2.4x10⁻²/sec.>
100

Chapter 6 Materials for Models of Steel Structures
6.3.3.2 Preliminary Study on Cartridge Brass
This alloy attracted special attention because of its availability,
reliable chemical composition (70% copper and 30% zinc with possible
impurities of less than 0.1% lead and iron), and promising mechanical
properties. The material was purchased in the form of half-hard, 1/4 in.
thick plate. The properties of the delivered material were:
E = 1.12x10⁵ MPa (16,300 ksi), a = 386 MPa (56 ksi), and p = 84 kN/m3y
(0.31 lb/in~). Since this alloy was used to model structural steel with
a measured yield strength of (ay)p = 293 MPa (42.5 ksi), it had to be
annealed to (a) = E (a ) = 159 MPa (23 ksi). Guidelines forym r yp
appropriate annealing temperatures were obtained from graphs presented in
Ref. 177 and 178 which are reproduced for this alloy and fo~ CA 510 in
Fi~. 6.9. Also shown in this figure are the yield strengths obtained in
this study from a series of tension tests on cartridge brass specimens
annealed for one hour at different temperatures. An annealing tempe-
rature of 408oC was found suitable to reduce the yield strength to the
desired value. The test results obtained from low and high strain rate
. ( 0-4 -2 )tens1on tests 2x1 /sec. and 3x10 /sec. of cartridge brass annealed
at 408°C are shown in Fig. 6.10. The following observations can be made
from this figure:
(1) The material exhibits a large linear elastic range, but shows a
gradual decrease of stiffness beyond the proportional limit until it
stabilizes at a strain hardening stiffness of about 2.5 percent of
the elastic stiffness. This transition range between proportional
limit and "yield strength" was observed, to a lesser or larger de-
~ree, in all copper alloys investi~ated.
101
I I

102
ssa.lJS
Chapter 6 Materials for
=
~~
'0..."
~"0
~
I.
...0
s:...."u"l~~fuCt)"
~
!
0...
.\D
f
".....
....Ici~-e,.;!
'E.
~...
i...
.!
la of' Steel Struct
.,
.,
~.w~,.oj...
~
~
'g.
.
~
~
...0.ca..,0
f
"
~
.,
t
B
~
~
i
0-.\D
f
~

Chapter 6 Materials for Models of Steel Structures
(2) The strain hardening stiffness decreased very slowly below 2.5 per-
cent in the strain range of interest. When compared to structural
steel, this strain hardening causes a relatively higher strength
beyond yielding under monotonic loading, promising even higher har-
dening under cyclic loading due to the highly annealed condition of
the material.
(3) From the high strain rate test (curve B) it is evident that the
strain rate effects are comparable to that of steel (see Fig. 6.5).
Thus, is can be concluded that annealed cartridge brass is a material
that reproduces reasonably well the strength and stiffness properties of
structural steel, at least under monotonic loading. However,
unacceptable material properties developed in the heat-affected zones at
welded connections. As can be seen from Fig. 6.9, continuous decrease in
yield strength (grain growth) is associated with high temperature
treatment. Even though the heat exposure due to welding is of short
duration, over-annealing in a small region of the base material could not
be prevented. Hence, cartridge brass should not be used for models of
welded structures where yielding in the base material at welds is
expected. Brazing may be an alternative in some cases, however, it would
have to be done at temperatures below the desired annealing temperature
which may not permit the attainment of sufficient strength, particularly
at connections where high inelastic deformations have to be tolerated.
The problems associated with welding necessitated the investigation
of copper alloy other than cartridge brass, and phosphor bronze was
chosen for this purpose.
103

6 Materials for Models or Steel Structures
6.3.4 ~osphor Bronze (f! 2!Q.)
This alloy selectedwas mainly because of its specified excellent
weldability (Ref. 179). CA 510 is promising since its yieldvery
strength in the fully annealed condition is about 140 MPa (20 ksi
(see Fig. 6.9) which is in the range of the desired yield strength and
therefore, over-annealing due to welding should not prooblempose a
provided 8 too long exposure to the high welding heat can be avoided and
thus large crystal growth can be prevented.
6.3.4.1 Stress-Strain Characteristics
Due to the content of interstitial atoms of phosphor in the crystal-
line structure, the general stress-strain behavior of phosphor bronze re-
semb1es that of structural steel where cool atoms fulfill a 8imila~ ~ole.
Not only does phosphor bronze exhibit a straight line behavior 1n its
pre-yielding range but, as has been observed in several tests, also upper
Fig. 6.11and lower yield can be identified in the tensile test diagram.
displays results of' tensile test of CA 510, annealed for 1 hr.a at
5200C, and Fig. 6.12 provides comparison between the stress-straina
lines for structur8l steel and annealed phosphor bronze and cartridge
brass. The similarity between the stress-strain diagrams for structural
steel and CA 510 is noteworthy.
The modulus the annealed phosphor bronze 18
E = 126.2x10³ MPa The measured specific gravity 1s
8.8744. Thus, for the phosphor bronze and structural steel used in this
study, the ratio ot' specific stiffnesses is (E/p)~ : 1:1.92, and the
ratio of elastic stiffnesses is Er = 1:1.61.
All the material tests phosphor bronze performedon were on
104

Chapter 6 Materials for Models of Steel Structures
Poksi
20
U)~lJj fOO
~U)
fO
0 O.Of 002 0.0.3
STRAINFigure 6.11 Tensile Stress-Strain Diagram for Half-Hard Phosphor Bronze (CA510) Annealed at
520oC/1 hr. and Tested at Low Strain Rate (t = 2.4x10⁻⁴/sec.)
15
--- ------ ~
':"c f.O """"", ".",..,."...,...'
It;
-~\!) - Structural Steel~ '."" Phosphor Bronze (CA5/0J0.50 - - - Cartridge Brass
000 O.Of 0.02 0.03STRAIN
Figure 6.12 Tensile Stress-Strain Diagrams for Structural Steel, Annealed Phosphor Bronze
and Annealed Cartridge Brass Normalized with Respect to their Individual Yield
Stress 105
!i ,III ' I \

Chapter 6 Materials for Models of Steel Structures
specimens scaled by 1 = 1:2 which approximately matches the E/p ratio orr1 : 1 . 92.
6.3.4.2 Annealing Results
Once the moduli of elasticity of the prototype and model materials
scale ratio for the yield stress can be derived fromare established the
temperatures from 500°C to 675°C (930°, to 1250°'), and tested in tension
HTS Results or this shown inthe closed-loop system. studyon are
5200C (968oF) wasFig. 6.9. An annealing temperature or chosen as
appropriate tor this study.
6.3.4.3 Strain Rate Er~ects
A study of the strain rate effect on the yield strength of phosphor
correlation orbronze was performed to provide information allowing the
static and dynamic test results, and to compare the magnitude or the
effect in prototype and model materials.
A series of 15 annealed tension specimens wae tested at strain rates
varying from 1.4x10⁻⁵/eec. to 1.4x10⁻¹/sec. The strain rates chosen fo~
this study were based on applyin~ a time scale factor t or 1 :o.J2"1to ther
study (see Table 6.3).rates used in the steel This factor was based on
the true replica scaling law correlating steel prototype and CA 510 model
materials. The E/p ratio for these two materials is of the order of 1:2,
= 1/f2'.hence t r
106

Chapter 6 Materials for Hodel$ of Steel Structures
Table 6.5. Fig. 6.13The results of this study are summarized 1n
displays individual data points
value at strain rate 2.8x10⁻⁴/sec.
normalized with respect to the average
Theand a curve fitted between them.
equation or this curve is
(6-4)
the material, and exhibit only a minor decreasethe initial stiffness or
510 behaves in a manner veryin the strain hardening stiffness, thus CA
similar to structural steel.
provide a comparison between the curves for structuralIn order to
tor CA 510 both the curves are shown in Fig. 6.14. The lowersteel and
strain rate effect exhibited by phosphor bronze will be partially accoun-
Th18 181ftted for by the higher strain rates occurr1n8 in the model.
particular true in the gravity neglected models for which t = lr and notr
model studies or~ as tor true replica models. Only tor large-scale
high strain rate phenomena (impact) the difference in yield strength may
be significant since the time scale ratio 18 small to provide atoo
sufficient "shift" of the phosphor bronze curve to the left on the strain
rate axis.
T.ble 6.5
SUmmary of Results for Strain Rate Effect
on theY1eld Stress of Phosphor Bronze
Strain Rate No. ofSpecs.
Average YieldStress at 0.002
Coefficientof Variation
NormalizedYield Stress
1/eec. MPa Jkai
1.4x10-52.8x10-46.9x10-31.4x10-1
4533
158.9161.9166.2178.2
23.0423.4824.1025.85
0.9821
1.0261.101
3.31.61.52.1
107
The obtained stress-strain results do not exhibit a noticeable change in

Chapter 6 Materials for Models of Steel Structures
'"
~In.to)tI~f~to0
s:g,f)0
f'-0
G
~
f...~
'0rot.
...tI
s:..
c0
...0
~'-~
II...
IIc
f...
~
,r,~
.
\0
EQ..
.(..,)QJ;
~~'--
~'q::'Q:r;c:~
~~;tI)
C\J~ ~~ 0)
c:>
-.-8'cp.DJx AQ/..(9
~D?/
108

Chapter 6 Materials for Models of Steel Structures
t)to!~.0~
III
~0.ca-ft0
f
-g.!VJ
.~..0
f..VJ
...0
ft~
t..VJ
'0.>-..c..
8..0
~...II!
.~
:
~..04
f~VJ
...0
~0ft
..04
~
i
8
#.-0.0
f
jJ&.
0-
~10-
~(,.)QJ
~~'-
I~- ~'q::Ct~~~<I')
~0-
It)
'a1-
C\J~
-...: c.~ 0)c
109

Chapter 6 Materials for Models of Steel Structures
6.3.4.4 Cyclic Behavior
A series of cyclic tests was performed to provide comparison data
for the simulation of cyclic behavior of structural steel.
The three loading histories used in cyclic tests of structural steel
(see Table 6.1) were implemented using the same strain increments
(E t 1). It was found that, unlike the case for structural steel,y,s ee
three loops per amplitude did not lead to a stabilization of the
hysteresis loops. Therefore, two additional load histories were carried
out, namely load histories No. (2) and No. (3), but with twelve cycles
per amplitude rather than with three. Even with this relatively large
number of cycles the material, strongly softened by the annealing
process, did not reach totally stable hysteresis loops although the peak
stress difference between the last loops was very small. The first and
last loops at various load amplitudes for three different load histories
are presented in Fig. 6.15.
Fig. 6.16 shows cyclic stress-strain diagrams for structural steel
and phosphor bronze for loading history No.1 (Table 6.1). Both the
diagrams are normalized with respect to the yield stress of the materials
and with E t 1 , which was used to control the strain increments.y,s eeComparing the two dia~rams in Fi~. 6.16 it is evident that the
annealed phosphor bronze work-hardens considerably more than the structu-
ral steel. For strain amplitudes less than or equal to 7Ey,steel' the
stress-strain hysteresis loops are similar in shape and enclosed area,
but for larger strain amplitudes the similitude becomes rather unsatis-
factory. The lar~e and history dependent work-hardening of annealed
phosphor bronze is more evident from Fig. 6.11 which shows skeleton
curves for various deformation histories. For structural steel the
110
(1 1

Chapter 6 Materials for Models or Steel Structures
II)
~~II)
001 002-(1.02 -ODI 0STRAIN
I/)
~l-I/)
-OD2 -001 0
STRAIN
00f 002
Fisure 6.15 First and Last Loops at various Strain A8plitude rro. Cyclic Tests or Phosphor
Bronze
ill

m
Chapter 6 Materials for Models of Steel Struct
-~'-"
'GfQ)'"CI)
tU~
.au:3~'"CI)
-A-
QJN
~0""
~
""0
.g,Q)0
~
'0QJ
.-4tV
8<
tItI~rn
.~:s~0:s~~rn
~0
.,C-O0..I
n~n~~"..n>.
=
c~.~~rn
In.,tI~
~
~0
581~;a-s
\0....\0
f'iI~
I)H~0~
IQ
~
.8Q.~0
.c,.,
~~

.113
Chapter 6 Materials for Models of Steel
'(I~
.30...-4
~U
~0
..r..
~r..
~.,8r..
~
~.cg.~0
.c~
-g.
.-4
::...C/)
.-4.r..~
...0
~...C/)
~0
81"
t~
u
c0
~.,
"
~
t-o-.
\0"r..
~..ra.
..tI
004~0
.....
004:c
tures

Chapter 6 Materials for Models of Steel Structures
or cyclescurves are similar regardless of' the number perskeleton
largeramplitude, while annealed phosphor bronze exhibits significantly
work-hardening for twelve cycles per amplitude than for one cyole.
Figs. 6.16 6.17 point out theandpresented indiagrams
phosphor bronze for simulation of thelimitations of the use of annealed
number ofProvided that theot structural steel.cyclic behavior
inelastic deformation cycles is small, satisfactory simulation appears to
response history demands a large number of largepossible. It thebe
phosphor bronze as model material may givedeformation cycles, annealed
of' structuralmisleading information on the energy dissipation capacity
This'simulationsuperior work-hardening properties.steel due to its
Section 8.1 Chapter 9 whichinin andproblem is discussed further
and shakepseudo-static component testspresent experimental data on
table tests.
6.3.5
steelit is desired to test a small scale replica model ot aWhen
simulation is not feasible, the choice orstructure, and artificial mass
materials is very limited because of the requirement thatsuitable model
Table 6.2)(see only(E/p)r = Ire In a review of available materials
These materials can easily beits alloys showed some promise.lead and
extruding but havestructural shapes through casting orformed into
such as high creep and damping, whichcertain material characteristics,
pose difficulties in material simulation.
ratio less than one-twentieth(99.9~ Ph) has an E/pChemical ~nonlinear at lowthat of steel. However, its stress-strain curve is very
114

Chapter 6 Materials ror Models or Steel Structures
stresses, and the material i8 subjected to large creep deformations and
high damping losses. Consequently, it has not been considered further in
this studies.
steel. For the measured modulus, the desired yield strength to simulate
A36 steel would be 24.8 MPa (3.6 kat). The tension test on this material
(see Fig. 6.18) showed too low a yield strength, but a suitable hardening
or chemical treatments could be used to increase its yield strength to
the desired level. Hore research on this material is needed to asses its
feasibility as a model material.
!I2! ~ (82.4~ Ph, 5.9~ Sn, 11. 7~ Sb) readily availableis a
of that of steel. Thematerial with an E/p of approximately one-tenth
E-modulus is 2.8x10¹⁰ Pa C-.Ox106 )measured psi which would require a
yield strength or 34.5 MPa (5.0 kai) to simulate A36 steel. The stress-
-strain diagram for this material (see Fig. 6.18) shows that the measured
however annealing at 200oC didyield strength 18 somewhat too high,
reduce the yield strength to approximately the desired value. However,
the shape or the stress-strain diagram differs significantly from that or
steel, and it will be extremely difficult to reconcile these differences
to a satisfactory level through chemical mechanical har-treatment or
dening.
Material damping 1s another problem which must be considered in the
of type metal a model material. This a~pect was investigateduse as
through damping tests on a torsion pendulum apparatus. These tests have
shown that damping in type metal is highly dependent on frequency, tempe-
rature and stress level. At 20oC it varied from O.5J for high frequency
115

Chapter 6 Materials tor Models or Steel Structures
and low stress (cast material to more than 2' for low frequency and hiSh
stress levels approaching yielding (rolled material). It was observed
that the damping in rolled type metal consistently higher than inwas
cast material by an amount of 40 to 901 at different stress levels.
Due to the time dependent behavior of lead alloys and the early non-
concluded that leadlinearity in their stress-strain behavior, it was
materials. Their wouldalloys cannot be modelrecommended as use
which rendersnecessitate complicated chemical or mechanical treatment
them unfeasible for most practical applications.
F1Iu~ 6.18 Stress-Strain Diagrams tor Lead Alloys -- Low and High Strain Rates
116

Chapter 7 Materials for Models of R/C Structures
CHAPTER 7
MATERIALS FOR MODELS OF REINFORCED
CONCRETE STRUCTURES
7.1 SIMULATION OF CONCRETE
1..1.1 In~~oQ!J:ction
Scale models of plain and reinforced concrete structures have gained
as has been shown 1n manyacceptance as a tool of structural analysis,
publications and symposia devoted to this topic, e.g., Refs. 12, 13, 14.
As with other types of structural models, of concrete struc-those
tures can be divided into two fundamental groups: elastic models and ul-
timate strength models.
overall structuralconstructed study theElastic Models toare
The mate-behaviour and force distribution in the linear elastic regime.
rials used for elastic model tests must fulfill the basic requirements of
the theory of elasticity, namely linear stress - strain relationship, in-
Because of their high workabi-variant Poisson's ratio, and homogenity.
both thermosetttlnglity, the most commonly used materials are plastics,
polyesters) and thermoplastic (acrylics, polivynyl chloride(epoxies,
(Ref. 14)PiC). provides a review of this type of models andMirza a
comprehensive list of specific references.
Strength ~dels are constructed to provide not only infor-Ultimate
mat ion on the structure in its virgin stage, but also its behaviouron
The necessity of 81-throughout the entire loading history till failure.
prototype material in its entireUlUlation of the behaviour of the11.7

Chapter 7 Materials for Models or R/C Structures
potential modelnumber orsignificantly limits thestrength range
materials which will satisfactorily reproduce concrete behaviour. Gypsum
limitedand concrete made with aggregate ofmortars,cementplasters,
orvariousbeen used with degreessize known as microconcrete have
(e.g., Refs. 62 to 64 and 71) as well asMany reports of ISMESsuccess.
use of cement and pumice(Ref. 3) thediscussFumagB 111 in his book
17)(Ref. givesBurggrabepractical DK>del analysis. amortars in
the model andschematic presentation of the relation between the size of
the choice of the model material {Table7.1b
Table 7.1
Size or Models and Suitable Hodel Materials
The minimum dimension of the model is by no means the only criterion
material, and such factors as the characterin the decision on the model
mixtures), creep foror railure of the material (more brittle in mortar
tests with sustained loadings, etc., can be of decisive importance
Although gypsum has been used successfully for elastic model analy-
ratio and straightPoisson'ssis because of its high workability, low
strengthapplicability to ultimatestress - strain relationship, its
strainThe reason is that the nonlinear stress -limited.studies 18
region exists in wet gypsum only, and the strength of wet gypsum is lower
that demanded for concrete modeling. Gypsum also possesses exces-than
ofstrength and low bond to the reinforcement in the casesive tensile
16,18,107).reinforced gypsum models (Refs.
118

Chapter 7 Materials for Models or R/C Structures
bybeen reportedstudies on gypsum-sand mixtures haveSuccessful
White and Sabnis (Refs. 120,121), and by Zelmn et. al. (Ref. 111).
Pumice mortars provide the often welcome low E modulus (Ref. 17) but
to the reinforcement causes considerable problemsbondinsufficient
in small scale models (Ref. 107).
Microconcrete, made mainly of the same materials and with the same
gained the widestconcrete, hasdesign philosophy as in the prototype
acceptance of all the aforementioned model materials.
attention will be focused mainly on thisIn the subsequent sections
material.
~esign of Microconcr~~e Mixes7.1.2
mixes have beenmicroconcreteSeveral approaches to the design or
developed, and their applicability depends cn similitude requirements for
other modelthe particular study, the model construction technique and
of theunderstandingWith the increase in thedesign considerations.
develop-of microconcrete and of their control, and with theproperties
and evaluation of properties, theof new methods of quality control
satisfactory fUlfillment of similitude requirements,final goal, namely
can be attempted more successfully than ever.
Basic Requirements Imposed on Microconcrete as Model Material7.1.2.1
Modeling of plain, reinforced and prestressed concrete structures is
presented in Chap-subjected to the general laws of similitude which are
In Refs. 15,36, and 117 these laws are presented with particular4.
119

Chapter 7 Materials for Hodels of R/C Structures
stress on ~odeling of concrete.
requirefor uniaxial stress - strain relationshipSimilitude laws
respect to strain, and ofof stress withaffinity of the derivatives
to time (Chapt. 4). These criteria are subjected tostrain with respect
to the significance of a given material propertyaccordingmodification
to the studied problem
goal in the most basic mix design is to achieve a pres-The first
Fullstrength (f') at a given age of the concrete.ccribed compressive
affinity of the stress - strain relationship for compressive tests is re-
demand thatlaws for model materialsBasic similitudequired next.
same as in the prototype. It has beenmodel be thestrains in the
relaxedSection 4.5.3) this requirement could be(see thatsuggested
(t ~ 1) using appropriate modification factors.rof concrete is of basic importance in theWhenever tensile strength
the ratio or compressiveul timate behaviour of the structure, over
tensile strength should be equal in model and prototype.
strongly influenced by the1sThe initial stiffness of a structure
proper simulation of(E),elastic modulus of the material demanding a
This would be achieved with full r - e line simulation.this property. c
Studies concerned with shear transfer in the post-cracking stage de-
interlock mechanism which at thismand a closer look at the aggregate
fully even in the prototype domain. Since thisunderstoodtime is not
mechanism depends on surface roughness and crack width, significant simu-
lation problems have to be expected.
for which long-time events are of significant impor-For structures
This isrequirements are to be taken into account.additionaltance,
true in oarticular when the prototype initial conditions need to be simu-

Chapter 7 Materials for Models of R/C Structures
lated. In theory, simulation of initial conditions will require the tra-
cing of all time history events affecting the prototype, from the time of
construction to the time at which the dynamic event takes place. These
events w111 include, amongst others, construction sequence, curing me-
thods, time dependent material effects (creep, shrinkage, increase in
compressive strength of concrete), as well as damage accumulation due to
previous events
Modeling of combined creep and shrinkage effects is a virtually im-
possible task because of incompatibilities in time scaling. Simulation
of creep requires equal time in model and prototype (t = 1) while simula-r
tion of shrinkage requires large time scaling. Creep and shrinkage de-
pend strongly also on the size and grading of the aggregates which are
not reproduced at model scales. Considering these problems it is usually
a futile exercise to attempt modeling or creep and shrinkage phenomena,
particularly since they often have reasonably small influence on thea
ultimate strength behavior under oyolio loading. It appears to be more
appropriate to control the initial conditions in the model experiment by
minimizing shrinkage and creep of'through sealing the model structure
(for instance, by applying of shellac)coats and avoiding long-time
pre loading prior to the dynamic test
It is to be expected that, with the increasing understanding of con-
stitutive relations for multi-axial strength of prototype concrete, an
increasing effort will be made to accomodate this knowledge in microcon-
crete design and testing whenever justified.
7.1.2.2 Levels in the Simulation of Concrete Properties
Simulation of the properties of a heterogenous material such as con-
121

Chapter 7 Materials ror Models or R/C Structures
crete presents a particular difficulty due to the complexity of the in-
of such a material can be performed at diffe-Studiesfluence factors.
levels:
a) atomic and molecular
b) inter-structural
c) macroscopic or phenomenological
It is seldom given to the designer to influence the atomar structure
of microconcrete, except for the use of a specific cement type, aggregate
and chemical additives, all of which influence the chemical reactions
and the gel-aggregate force developmentoccurring in the gel formation
Considering the complexity or hydration and hardening processes, it is
expected that intervention by the mix designer at the atomicto be
and molecular level will be feasible.
of concrete properties at the inter-structural level wouldScaling
require not only the appropriate scaling or the aggregate size but also
scaling of the pore sizes in the gel, and void sizes in the aggregate
the last requirement might be partly satisfied by the nature ofAlthough
only slightly influenced bysmall aggregates, the gel pore size becan
the use of finer cements (i.e. Type III)
Gradeline design for the model aggregate based on length scale re-
quirements is feasible only as far as the large aggregate size is con-
cerned (Refs. 18, 39). Shifting of the entire sieve line according to
the length scale of the model requires adjustments, as the lower limit of
aggregate size usually has to be increased from that dictated by
(Refs. 13, 114) limit the orsimilitude. It is customary to amount
aggregate passing U.S. No.100 sieve (0.15 mm) to than 10%.less Due to
(A/Wthe high specific area of finer aggregate, the amount or water
ratio) achieve desired workability increases rapidly withtonecessary
122

Chapter 7 Materials for Models of R/C Stru~tures
the decrease of the average aggregate size, thus increasing the amount of
cement (CIA) necessary to achieve the required compressive strength which
in turn results in a too high tensile strength of the concrete.
The above speculations show that a phenomenological approach to the
mix design, supported by the knowledge of the effects or inter-structural
changes, might be the most appropriate, it not the only realistic one.
In the design of prototype concrete one of the objectives is to find a
grading which would result, for available aggregates, in the best worka-
bility at the lowest water content. This can be achieved, within limits,
by minimizing the specific surface area. It has been found that, provi-
ded the specific surface area of the aggregate (coarse + fine) 1s kept
constant, a wide difference in grading will not affect the workability
appreciably, and this provides or designing gradinga means a gap
(Ref. 1lf3). Abram's law (Ref. 144) suggests that, provided the concrete
is fully compacted, the compressive strength is not affected considerably
by the aggregate shape, surface texture and the aggregate grading. The
above information does not imply that concrete properties are totally
insensitive to aggregate grading, but that an extensive effort in the
simulation of the grading curve of prototype mix might not be justified.
On the other hand, for simulation of the concrete - reinforcement stress
transformation inter-structuralzone, similarity at this iszone
important. This is shown by the schematic stress transfer diagram of
Fig. 7.1 (from Ref. 119).
Line I - I represents the tensile crack, line II - II represents the
shear crack, and line III - III either bond or compression failure. The
development or crack line II-II and in particular crack line III - III
depends strongly upon the structure of the aggregate matrix. Ferthermore
123

Chapter 7 ..ter1als I'or Models 01' R/C Structures
ratio of the size ofthe bond failure III-III depends strongly upon the
reinforcement ribs to the size of the surrounding aggregate
...6
'4+6" .
. , ,tI" 11
. ..';'
. Q (1.oC).;-~ ,. ("'" r
-Ill-
...Q- 111"'. ~\"'\St . r,..T _.~
"')f:3r$:," l.!-II
"'" '-"i .c.i::;:: . :
O ~.
. . .'. . .-- .. -I I
F1&Ure 1.1 Stress Transfer 1n Re1nforced Concrete (Ref. 119)
Control of Properties through Mix Proportioning7.1.2.3and Use or Additives
Several attempts have been made to present definite guidelines for a
i.e. Rets. 14, 114). It hasmix with desired final strength properties
the properties or the cementto be expected that, due to differences in
in the compactionabsorption or the aggregate,uaed . in the water
or the finalother mix design details, the propertiestechniques and
product may be quite different from the one predicted from the guidelines
Nevertheless, these general guidelines can be very useful in(Ref. 43).
Figure 7.2 presents sieve lines used bythe initial mix proportioning.
and theTable 1.2 lists mix proportionsinvestigators, andvarious
compressive strength of the concrete resulting from their application.
range ofof or wide~ ~ ~ the strength m1croconcrete a
124

Chapter 7 Materials for Models of R/C Structures
ASTM Alternative Sieve Designation10 20 50 fOO4
" " .,
\\t)\
os.(I)(I)'
&
~50~~(.),~
\\2 -~-
&\\
3 ~ e-~.
4
,,. 5 _.*.~
6 e05. f. 0.5 0./
Sieve Apertures (mm)
Figure 7.2 Sieve Lines Used by Various Researchers
Table 7.2
Hicroconcrete Mixes Used in Various Studies
t'c
Age r'c
AgeC : A : W Reference c A : W Reference
days I Mfa ksi MPa ksidays
1 :4.0 :'1:3.75:1 :3.25:1:2.75:1:2.50:1 :2.25:
1121283114148
2.53.0-.05.06.07.0
Mirza(Ref. 2)
1:5.0 :0.80 2.83.54.2
4.6.5.2
5.25.96.8
11-28
11'-
11428
I 19! 2-29
,32 ;
36 I,136
41: -7
White(Ref. 43)
-~ 1:3.5 :0.60
1:3.0 :0.60383911351
14 5.55.76.17.4
Gran,Bruce(Ref. 23)
15202836
2.22.94..15.2
Fuss(Ref. 22)
1:11.- :0.81:3.6 :0.11:3.6 :0.51 :2.11 :0.5
63236363
39455561
5.76.58.08.9
Harris,et. a1.,
(Ref. 30)
125
1. White (Geneva Filter Sand)
2. Burssrabe (Light Agsregate)
3. Gran. Bruce (Silicone Sand)4. Mirza (Cruahed Silicone Sand),
~ 5. Hai..l (Silicone Sand)~, 6. KarTis. et. al. (Ithsc:a Sand)
.83
.72
.60
.55
.50
.40
1:3.75:0.721:3.25:0.60
1:2.75:0.551:2.50:0.50
1:5.-0:1.201:11.32:1.001:3.110:0.831:2.68:0.70

Chapter 7 Materials for Models of R/C Structures
aggregate to cement to water (A:C:W) ratios was investigated. This was
done for two reasons. First, to evaluate the properties of microconcrete
of different mix proportions, and second, to supplement the existing data
on strain rate effects on the compressive strength of microconcrete
All the material studies on microconcrete properties were performed
on 50 x 100 mm (2 x 4 in.) cylinders, using Type 3 (High Early Strength)
cement
ASTHThe maximum aggregate size (MAS) was established to be passing
sieve #8 (2.4 mm), and the grading line for the aggregate to matchwas
closely the grading line recommended by White in Ref. 25 (Fig. 7.3).
ASTM Alternative Sieve Designation'0 20 50 '004
'V A~ All. u.#d0.4 L.L.2 0.5 LL3Q.3 LL.JO0-
.5;.
~~" ;0-
~"u...
~
. ~-::..~ 6,1Id.L'"
~'I I ~II~IOJ
Si~ APel"IIIes (mm)
Ca> .,Individual Sands (b) Final Grading Line
Figure 7.3 Sieve Line of Aggregate Used in This Study
Locally available (Lone Star, Monterey, California) sea sand (Lapis
Lustre) used as aggregate.was The thoroughly washed sand is sold in
Lapis Lustre #3 (MAS below 2.4 mm), 12sacks in narrow gradation ranges.
(HAS below 1.7 mm), and #30 (HAS below 0.811 mm) with individual grade
lines as shown in Fig. 7.3a were mixed in proportions 0.4:03:03 to obtain
a grade line as shown in Fig. 7.3b.
126
50
i
I

The mixing of the microconcrete was done manually by first combining
the weighed aggregate and cement and then gradually adding of water. The
was placed in the oiled steel cylinder molds in two layers, each or
them compacted by 20 strokes of 12 mm (0.5 in.) rod. After smoothing of
surface of the concreteupper the molds were covered to prevent
moisture loss and left undisturbed for 24 hours. Subsequently, the molds
the fog room (95J RHwere stripped and the specimens were transfered to
at about 200C).
At the age of approximately two weeks, the specimens were capped and
then returned to the fog room. The capping was done using a melted sul-
phur capping compound and a precision jig (Fig. 7.4).
One day before testing, the specimens were submerged in lime-satu-
rated water, and kept in this solution until about 45 minutes before the
beginning of the actual test. This time span was needed for mounting of
the specimen in the testing machine and attaching of the instrumentation.
The testing performed on a closed-loop MTS testing machine,was
utilizing control of displacement rate. Because of the importance of the
strain built-up in the testing system, displacement rates were controlled
through an extensometer monitoring the distance between the plattens,
rather then using conventional stroke control.
Average strains were obtained from displacement measurements at the
central 50 mm (2 in.) of the specimen. The measurements were done with
four clip extensometers attached 90 degreeat angles to the specimen
(Fig. 7.5). averaged and theThe four obtained strain-time records were
combined with theaverage was stress-time record resulting in one
stress - average strain plot. The results obtained in this study are
summarized in Table 7.3, Figs. 7.6 and 7.7.
127

Chapter 7 Materials ror Hodels or R/C Structures
F!sure 7.11 Capping Ji&
Figure 7.5 Co8presaion Speci-.n with Attached Extensoaeters
128

~~:3~e
~~
'ie
~
e...
t0
~0i
.e-81
...
.D
~
c0
...ftft
f
,~
-LIII ~ ~
~...~
I;
-..,&,
-M .
~O"w:
:a
c
t')
..~
'" .0 m
v. 4)~.s-
-0a,
. I-~.~~8~U 0
. ~"'."'>
8'0'" .0 ~
0
j!
IV- I " I_~"_I;" I
Mii
..
-~-3
If~
c~
~
...,
~ .~0.'"..
.oU'##--NN
"'4"'~~
o..ot-c
~2;;t
"'O\~Nt-0\~0'0
. . . .~N,"cr
_OC,"-. . . .
.r--oc,"
129
-~.
&-:.0.00
00. .
It\It\.. ..
.--
Cbaoter 7 Materials ror Models or R/C Structures
~.Q'on..,
011\011\et-t-\D
. . . .0000.. .. .. ..
0000. . . .---~
.. .. .. .....~~~
~N~NN
.., ""~, 'r
-~O-. . . .
-N\OON~"IM
t--t--OCW\t-... . . .CW\CW\tW\:'t"
N-In\o. . . .
-,""-~
1'"
~11'".
to;"'"
.-
'"f"\
....
~,")G\
11\011\1-1-.0
000.. .. ..II\II\In
. . .MMM.. .. ..
-.,-.-
t-t-t----
""r'"I~
0-11\. . .
I-O~"'~~
-t-1l\o m
. . .I""~#
GO\N. . .~"'O
..,.
m...,
0.Q:
~
0-
0:"~
0-
~ .~It\~cY\..
....
c.N
M
....oD~
P\
~In
~
I';"'
~'"
~
In
~'"

Chapter 7 Materials for Models of R/C Structures
ksi
t~:~~5~~~::5~'~ "'"30.4.0
3.0~ 20.1G.J ~
.Q:J-:CJ)
20individual ex1ensomefe,.s
fQaverage---
1.0
0.00.002ao 0.001
STRAINFigure 7.6 Four Stress-Strain CurYes r~om Compression Test with Four Extensometers
Figure 7.7 Average Stress-Strain CurYes for Three Specimens Tested at the Same Speed
130

Chapter 7 Materials tor Models ot R/C Structures
Figure 7.6 shows four individual stress-strain records which,
averaged, give the stress-average strain relationship for one test speci-
men (shown in dashed line in the figure). Figure 7.7 shows three stress-
stress-average strain curves for four individual specimens, the average
-strain line derived from those curves (dashed line), and a stress-strain
line based on the theoretical equation presented by Popovics in Ref. 188.
The equation was developed for prototype concrete, and the stress-strain
line is based on the compressive strength f' of the concrete.c
All the Figs. 7.6tests summarized in Table 7.3, 7.7 wereand
6 -5
performed with an average strain rate of .3x10 /sec.
Fulfillment of the requirement of simultaneous similitude of f~
ft presents a much higher degree of difficulty (Refs. 14,18,39,114,118)
As discussed previously, the finer the aggregate used (SEllerwas
maximum aggregate size), the lower 1s the A/W ratio necessary to provide
the desired workability. Low A/W ratios result in low A/C ratios
retain the W/C ratio needed for desired f~), thus producing a mix with a
sometimes much higher tensile/compressive strength ratio than in proto-
type concrete. Thus, it often may be necessary to reduce the tensile
strength of microconcrete.
The schematic presentation of stress transfer in the composite mate-
rial shown in Fig. 7.1 suggests that by decreasing the adhesion between
the aggregate and the cement gel, the strength along the tensile crack
line I - I will be influenced to a much higher degree than the compres-
siTe or direct shear strength. Maisel (Ref. 118) proved this observation
by testing mixes with different aggregate types, namely relatively rough
and porous light aggregate (inflated schist), relatively smooth sands or
various origin, and aggregate coated with water-repellent, hard
13~


Chapter 7 Materials tor Models or R/C Structures
previously, this type of a table may be used as amentionedAs ws
the agreement between the results will depend theandguideline, upon
the materials and the technique used in the study onsimilarity between
which the table is based and those used in the current study.
0.7f~~
~LEGEND
~ MICROCONCRETE
. THIS STUDY. JOHNSON& MIRZA. HARRIS, et 01
PROTOTYPE CONCRETE/1 EFSEN,GLAR80a ARKAZANAx ZELGER+ GRIEB, WERNER0 BROOMS
l
2 3 4 5 6 7COMPRESSIVE STRENGTH (ksi)
8
Figure 7.8 Split Ten.ile StrenRth Ys. Co8pr..sive Strength rrom Various Studi.. (Rer. 29)
1.1.3 ~ Effects ~ Microconcrete
7.1.3.1 Size Effects
In general, size effect may be defined as a change in a characteris-
tic material property of a specimen due to the change of its size
Although there are a number of recognized sources of size effects in
concrete, there is no general theory which includes them all. The theory
or the failure of brittle materials through propagation or cracksa
flaws size effects by assigning a constant flawinitiated at explains
133

Chapter 7 Materials for Models of R/C Structures
to differential curing effect. The influence of the specific area of the
aggregate on the magnitude of size effects was also studied by using mi-
xes with different aggregate size. There was no noticeable difference in
size effects observed between the finer and the coarser aggregate mixes.
Figure 7.9 Influence of Specimen Size on the Figure 7. 10 Unconfined Compressive Strength vs,
Compress1Te Strength (Ref. 118) Specimens Volume (Ref. 39)
In Ref. 18, Harris, Sabnis and White present a comparison between
the size effect in prototype concrete and in microconcrete (FiS. 7.11)
Although the trend of strength decrease with the increase of specimen
size is evident for both the materials, it is much stronger for microcon-
crete as can be seen from curve A (prototype concrete) and the shifted
curve M (microconcrete).
In a previously mentioned study (Ref. 39), third-point loaded beams
of span to depth to width ratio of 12:2:1 were tested to study the size
effects on the tensile strength in flexure. The results of these tests,
summarized in Fig. 7.12 indicate that the flexural tensile strength is
rather sensitive to specimen size, and is most sensitive to the change in
the volume of the specimen.
In Ref. 21, Mirza presents results of a series or split cylinder
tests using specimens of different dimensions but of otherwise identical

Chapter 7 Materials ror Models or R/C Structures
density per unit volume (volume effect). It cannot account for the
influence of the specimen curing and testing conditions on the extent of
the size effects. Other commonly quoted of size effects insources
microconcrete are differential drying throughout the volume of a specimen
as a function of the distance from the surface, faster curing of smaller
specimens (both effects often are referred to as the differential curing
effects), increase of quality control with decreasing specimen size
changes in strain gradient in flexural tests
Sabnis and Mirza present in Ref. 123 a review or the state-of-the-
-art on the question of size effects in microconcrete. The paper
includes an extensive list or literature concerned with this problem.
Selected results or important research in this area are discussed
below.
In 1963 Harris et. al. (Ref. 39) presented the results of an exten-
siye study on size effects in microconcrete. Compression cylinders of
height to diameter ratio of 1:2 were used to study the influence of spe-
cimen size and curing age on the unconfined compressive strength ft.c All
the specimens were compacted manually by rodding and cured in a moist
room (95J RH) until tested. Figure 7.9 shows the results obtained for
two mixes with different aggregate sizes and for varying specimen sizes.
For both mixes the smaller samples had a higher compressive strength and
reached almost full strength in a shorter time than the larger ones (see
individual points for the 1x2 in. specimens for W:C:A mix of 0.1:1:3.6
and along the 1/4x1/2 in. curve for 0.725:1:3.6 mix). The observed flat-
tening of f~ VB. volume of stressed concrete curves (Fig. 7.10), tor
the concrete ages, indicates that part of the observed size effect is due
135

Chapter 7 Materials for Models of R/C Structures
.-
,U'C.
~III.>
......~
~
Figure 7.11 Size Effects on Compressive Strength of Prototype Concrete
and Hicroconcrete (Ref. 18)
Figure 7.12 Variation of Flexural Tensile Strength with the Size of Specimen (Ref. 21)
1.36


Chapter 7 Materials ror Models or R/C Structures
Figure 7.13 Effect or Loading Rate on Co8Pressive Behavior or Prototype Concrete (Ref. "2)
Fisure 1.1- Strain Rate Effect on the Unconfined Compressive Strength of Conc~t. and
Microconcrete (Ref. 39)
139


Once f~ was exceeded, the strain energy release in thestrains up to £'.c
relatively soft themachine could not be controlled throughtesting
extensometer feedback and a sudden increase in strain rate was evident.
the recorded stress-strain curves couldThus, the decreasing branches of
not be relied upon and are omitted in Fig. 7.15 which shows stress-strain
obtained for various strain rates and for two mixes of differentcurves
The plots were obtained in the way described in Sec-strength.ultimate
clearly shows the expected increase in thetion 7.1.2.3. This figure
ultimate strength (f') and in the initial stiffness (E), and the decreasec
maximum stress (E.~ with the increase in thethein the strain value at
strain rates
The results of the study are summarized in Table 7.4.
displayed inf' - £ data points for individual specimens arec
The
the points theFigs. 7.16 a and b.
strength values at £ These values were
at each testing strain rate torstrengthused to normalize the average
four test series (Fig. 7.17). The close correlation of these pointsall
A secondof different strength is noteworthy.obtained for concretes
data points shown in this figure, derived from aorder curve through the
regression analysis based on least square method, has the following form:
+ 0.0145 (log ~)2, .
f' / f' 4 = 1.4776 + 0.1815 log £C c2x10-
(1-1)
the more than one hundred strain rate tests carried out inBased on
this study, this empirical equation, which is independent of f', is bestc
with a change insuited to describe the change in compressive strength
strain rate
.1'1
iaiac, c'" I

Chapter 1 Materials ror Models or R/C Structures
MPo
640
4~~~(I)
20
2
00.000
00.00/
STRAINaOO2
MPa
6 4012
3
54
~l4j~(I)
20(1) £ - 2*10-2 I sec.
(2) £ - 1*10-2 I sec.
(3) £ - 5*10-3 I sec.2
(4) £ . 6*10-4 I sec.
(5) E: . 6*10-5 I sec.
00 I I I ,~0.000 0.001 Q002
5TR AIN
FigUre 7.15 Stress-Strain Curves tor Two Different Strength Hicroconcretes Compressed Onder
Various Strain Rates
142

Chapter 7 Haterials ror Models or R/C Structures
Table 7.4
Results Summary for Strain Rate Effect
on Compressive Strength of Hicroconcrete
Figure 7.16 Results or the Study or Strain Rate Erfect on Compressive Strength or Four
Dirrerent Strength M1croconcretes
143

Chapter 7 Materials for Models of R/C Structures
"b
'bGI
...
~~
...~~
...rn
I)~
"...
f0c000~0
;j"-0
.c
...~
5i'-
...rn
"~
I)
:~
J
iN...
..~Z
t-.
t-
f
.;Ik.
~C)
~~
b
b
b~aN)
.~
C)~
.~
aC\J
.~a0)a
aQ
144
~
<.JQ;
~~'-
~~Q::hU)
X~:J j,

Chapter 7 Mat.rials for Models of R/C Structures
studies onFigure 7.18 provides a summary of the results of several
strain rates on the compressive strength of microconcreteofthe effect
(Harris, et. a1., Ref. 39; this study), and prototype concrete (Jones and
comparison of theRichart, Ref. 141; Hatano and Tsutsumi, Ref. 142). A
in this study pro-obtainedresults obtained by Harris and the results
regression line expressed with Eq.thevides additional confidence that
andoriginstor microconcretes or various(7-1) representativeis
effect on the compressive strength of proto-The strain ratestrength.
Quantitativetype concrete is of similar magnitude as for microconcrete.
be made due to the fact that data on truly strain ratestatements cannot
controlled tests of prototype concrete was not found.
SIMULATION OF REINFORCEMENT1.2
1.2.1 Introduction
The modeling of concrete reinforcement has attracted a considerable
amount of attention, and' techniques allowing the manipulation of reinfor-
ductility have been presented by many researchersstrength andcement
accepted methods of fabricationThis section summarizes the most widely
reinforcement and discusses theor modelcontrol or propertiesand
reinforcement used in this study.
microconcrete as modeling material, havingofThe wide acceptance
properties close to those of the prototype concrete, limits thestrength
reinforcement to those matePlal with strength similar tochoice of model
In theprototype reinforcement, thus to steel. casesstrength orthe
subjected to scaling, materials otherwhere the strength of concrete 1s
Copper alloys provide wire or lowerconsidered.than steel becan
145

Chapter 7 Materials for Models of R/C Structures
"-b~
f)>
oMf)f)f)
ke0
u
c0
81..0~
"-"-rat
~...
~
coM.~..r/J
C0
f)~()~='
r8
~0~:
8s;.
'""
f).....~f)~
~
'""0
>-~
.Ir/J
0>-
.t-~~
~c..
b
'PC)
~:~:
GI...GIs-(}~0(}0s-(}...2:
'Q~e
GI...tIs-(}~0
u
0
.c
..~~tIs-
..ff)
... ~~~
hU)
~:)II)II)~
~~\...(.Jc::0(.J
h"-~
b~aN)
.~
a~
.~
aC\J
.~
a0)a
C)C).~
/'
146
~(jQJ
,v)~,'-:

Chapter 7 Materials tor Models ot R/C Structures
E-modulus if so desired. However, caution should be exercised in the use
ot these materials as the adhesive forces between andconcrete copper
alloys are negligible (Ref. 117).
The subsequent discussion will be devoted to steel wires, due to the
predominant use of this material as model reinforcement.
7.2.2
bond simulation imposes special re-The concrete - reinforcement
quirements on the surface characteristic of the wire used.
Bond stress development may be assured either through adhesive for-
or through wire surface deformation achieved either through chemical
treatment or, more commonly and with higher reliability, through mecha-
nica1 deformation of the wire.
Burggrabe (Ref. 117) presents results obtained with zinc-galvanized
wire. He found that the use of zinc plating in the case of chrome rich
(O.1Jcement Cr) results in a strong chemical bond between the wire and
cement. In the case of cement with much lower content of chrome, a
thin film of zincoxide can develop, providing a viscous layer between the
steel and the concrete.
A simple and reliable method of providing and controlling bond
strength 18 deform soft Theto steel wire through cold-rolling.
deformation may be applied by pulling the wire through a set of knurling
wheels (Fig. 7.19). A detailed description of a knurling apparatus can
be found in Refs. 18 and 40. Types of deformations and their effect on
bond simulation are discussed in Section 7.3
147

s,t
o~ 1.1~9~wm pell0~ PI00 9q~ JO q~BU9~~S 9q~ uodn spuadap enl~A pa~1sap ~
eq. ~e~ot o. A~8S£aOeU 'e~n.e~adwe.~U11eeuue ptetA91D1':1. ~uw~suoo~.
'&Ul1~~U11eeuue ~ue~suoo ~e e~n~e~edW9~ ~U11e9UUe 9~ BuJ1&9UUe .JO
-0 pUS Q s OG-L .sS1a JO SeA~nO eq1 q11~ UKOqS ss Su11seuue 1Uen
eti~ JO edstis eti~ -basqns 4~no~4~ pattO~~UO~ aq u~~ wv~~~JP uJ~~~s-ssa~~s
I.l~UeOtJ '&&.l~&Po~ 'pue q~Bue~~s PletA e~.l~ttt~onp pssvs~oap awos
-.ui.s u. PUg ~u1od-PLa.A pauIJap LLa~ ~ ~noq~.~ q~Sua~~s PLa.A pas~a~oul
iU1Uap.leqsesneo BUtTT~ PToO e~ U1 iu1..1nseol lee..s eq..10>{.JOM
-(£n -J9H) S9Jn~~AJnO 9~euJmJt9
o~ 1ttnjssaoons pasn u9aq ssq OStS S9ASatS ~q~1~U"J:a.ll"paW.lOjap9q~
JO ~9~9meIP 9q~ s9ml~ ~L ~9~9We1P JO ~uam~ea.l~ ~eaH"e.l1'" pem.l°Jepeq1,
eq~ q~~~ ssaoons poo~ s~JodaJ (9~~"J9H) 19S1~ esn.snIP JO steeqJ'. JO
ai~et Al~ua1o1JJns Jo StaeqM ju1t~nU~ iu1sn AQ paonpa~ 9QUe;)W91Q -e.1
-o.Jd S14J..emos~eqmno eiso iUlo~oJule~ eq1 Jo eis1Qmesss eq1 se~sw ~e1s1
sesse~~s tenp1se~ dn ~t1nq ~ enp '8U1PuaqiUt~tnS9.J IS001mO.IJ qOJqp.
awnsse 01 spua1 a~1~ 941 ss9~0~d Bu1ttO~-PtO~ a41 ~a1JV e.ln~eA.lnO e
~8tUeqOaw SUtt~n~ 6L. L ~nSTA
C:~~~~illnElli~
sa~n~on~~s J/H Jo staPOW ~oJ StaT~~-W L ~a~d.QJ

Chapter 7 Materials for Models 01' R/C Structures
0.062 in. diam.
0.072 in. diaDI.
0.08 in. diam.
1 1/2Time in Hours
1 21/21/2 1
(a) Relative Yield Strength VB. AnnealingTi.
at 538°c (1000oF) (Ret'. 18)
Yield Strength va. Annealing Temperature (t = 1 hr. Change in Stress-Strain Curve Through(b) (0)
for Cold Drawn 1020 Steel Wire (Ref. 113) Heat Treatment (Ref. 43)
Figure 7.20 Effects of Heat Treatment on the Strensth of s.&ll Scale Reinforcement
149

Chapter 7 Materials ror Models or R/C Structures
specimen and on the diameter of theamount of cold work applied theto
Thus, a trial annealing by varying temperature or time has tospecimen.
43) used quenching followed by tempe-Gran and Bruce (Ref.be performed.
wire at various temperatures (quenching: heat beyond A3 tem-ring of the
brittle hard marten-obtainperature equal about 9100C, cool rapidly to
site structure; tempering: heat the specimen to temperature in the range
of 2O0oC to 360oc and cool slowly to obtain ferrite-cementite composition
They report that thehigh ductility).andof relatively high strength
between 410 MPa (59 kat)yield strength manipulated in this way ranges
and 620 MPa (90 ksi) depending upon the tempering temperature.
~ ~ study soft steel wire of diameter 2.0 mm (0.08 in; Gauge 14)
reinforcement consisting of No.9 rebarswas used to simulate the main
annealed form 1n c011s orblack(28.6 mm). The wire was purchased in a
about 2000 m (6000 ft) length.
(37 kat),255 MFaThe yield strength of the wire as delivered was
414 MPa (60 ksl, Grade 60abovewhereas the desired yield strength was
in strength to 440 MPa (63.7 ksi, Fig.reinforcement). The increase
was achieved through cold rolling of the wire with a set of knurls,7.21
The ultimate strain of1ndentatlon~.ofproducing two orthogonal sets
The resulting effective0.08 0.12.andthe deformed wire was between
an indentation1.98 rom (0.018 in.) withdiameter of the wire "d" was
of'"w" of about 0.13 rom (0.005 in.), and indentation spacing "s"depth
e/d = 0.37 satisfy theThe ratios wId = 0.06 and0.74 mm (0.029 in.).byspecifiedprotrusion height and maximum protrusion spacingminimum
A microscope enlargement of theASTM Standards, Section A615 (Ref. 187).
Heat treatment of the deformed wiredeformed wire is shown in Fig. 7.22.
Indesiredclose to thethe strength one.omitted wassincewas
150

Chapter 7 Materials ror Hodels or R/C Structures
~e~..
."0 ""010 10 J()Sf_AlII Ii"
Figure 7.21 Effect of Defor..tion on Stress-Strain Behavior of Reinforcing Wire Used
in this Study
Figure 7.22 Detor8ed Wire Gage ,. (d . 288; 0.078 in.) ( SEM 44X )
151

Chapter 7 Materials for Models of R/C Structures
retrospect, it must be said that quenching and tempering would have been
desirable to improve the strain hardening characteristics of the deformed
wire.
To simulate the shear reinforcement, which consisted of stirrups or
4 bars (12.7 rom), black annealed Gauge 20 wire (0.88 rom = 0.035 in.),
available in small coils in hardware stores under t~e commercial name of
Bandi-Wire, was used. The wire, as purchased, has a shiny smooth black
scale on its surface, thus promising a very low bond to the concrete.
Due to the small diameter of the wire, chemical surface rougheningvery
chosen rather than mechanical deformation. The following treatment
procedure was employed:
for 2immerse the wire minutes0 in 10 J HCL solution to remove the
smooth scale present on its surface,
0 subsequently immerse the wire for 45 seconds in 30~ H2SO4 solution to
roughen the surface of the wire, and
0 wash the wire thoroughly under a stream of tap water.
The procedure resulted in lowering of the strength of the wire by 6~ thus
indicating a change in the Test of foureffective area by that amount.
treated wires resulted in a coefficient of variation of the ultimate
strength of 0.015, hence the process results in a uniform area decrease
No noticeable change was observed either in the wire ductility or
its stress-strain characteristics due to the above treatment.
Fig. 7.23 presents microscope ot the wire surfaceenlargements
before and after the treatment.
1.2.3 ~ ~ Strain Rate Effects in Model Reinforcement
Despite extensive studies the yield and ultimate strength Oron
152

Chapter 7 Ma~er1als for MOdels of R/C Structures
....0..'tI
.cu
~II
...~
<
'0C.
II
~
~.!
.
c...
In,...
q
0"
JCO
.
0
"'0..
0N
1/~.
0
t)
~...
=-
Q.:I~~
or-!~11)
~0
t)0
~~:I
11)
,...~t-t)~:I~
...fa.
'0Q)
~.c~~~
.-I
.-IIII()
m.cu
~ucu
~r-IQIQI~CI)
aN
QIbO~cu
t-' ><00C\I
~V)
..c
!..~
'0QJ~cdQJ~~
g
153
Q)~
~
~Q)
~cdQ)
~
,..>-
ccC'
~tJ:'-

Chapter 7 Materials for Models of R/C Structures
wires subjected to various treatments, little attention has been paid in
the literature theto effect or the wire diameter on its properties.
This is justified as the strength of the wire used in each individual
study is manipulated separately to obtain the desired values
Very limited information is available on the elastic stiffness of
small wires. Maisel (Ref. 118) observed a modulus of elasticity of about
20% lower for 2mm wire than could be expected from the base material
properties. A survey of data presented by Harris et. a1. (Ref. 18), and
Starrier and Sozen (Ref. 146) shows also a decrease in the stiffness
value. Maisel suggests that a major portion or this decrease should be
attributed to the initial bends formed along the wire which act as
springs.
Strain rate effects in model reinforcement were extensively studied
by Staffier and Sozen (Ref. 146). Results for two sizes Of laboratory
deformed and heat treated wires summarized in Fig. 7.24.are
increase in yield stress at higher strain rates is similar to thatvery
reported in Section 6.2.1 for structural steel. Comparing Fig. 7.24 with
Fig. 7.17, it can be seen that the strain rate effects are lower for
model reinforcement than for microconcrete.
7.3 BOND SIMULATION
Proper simulation of the force transfer between concrete and the re-
inforcement poses a major problem at model scales. The force transfer
will affect not only the resistance against pull-out but also the spacing
between direct tension cracks and the occurence of secondary failure me-
chanisms such as longitudinal splitting along bars close to the surface
In this section, only those aspects of force transfer will be discussed
154

Chapter 7 Materials ror Hodels or H/C Struetures
Figure 7.2' Strain Rate Effect on the Lower Yield St~th of Model. Reinforce..nt (Ref. "6)
~2000wire diameter d - 1.6uepull-out length 1 - lSd
I~~~l~:::::~:
~1500 -
"fir,""
-z-~~
~ 1000
~
E-t
9~5- 500~
00 0.2 0.4 0.6
SLIP AT UNLOADED END
0.8(~)
1.0
Figure 7.25 Effect of Surface Preparation on the Bond Characteristics of Reinforcement Wire
(let. 118)
lSS

Chapter 7 Materials tor Models ot H/C Structures
which are concerned with resistance against pull-out as determined from
simple pull-out tests.
The surface preparation of the reinforcement, together with the
embedment length, will determine the bond characteristics of the wire.
This is illustrated in Fig. 7.25, in which results of pull-out tests of
smooth, galvanized, and deformed wire are displayed (from Ref. 118).
Smooth wire can provide only a small amount of bond based mainly on
adhesion between the steel and the wire
Zinc-galvanized wire permits the development of relatively high bond
stresses, however, once a maximum bond-stress is reached, a deterioration
of the composite action occurs.
Deformed wire presents the most realistic and reliable solution to
the bond problem. Even then, certain compromises are necessary since a
perfect affinity between the prototype and model bond layer becannot
achieved in practice.
c*} short indentations -- gel shear action(b) long indentations -- compressive arch action
tf1tFigure 7.26 Inf"luence of" Shape and Spacing of Wire Defot"llations on Bond Mechanism (Ref
The shape and spacing of the surface deformation significantly In-
fluences the bond behavior (Fig. 7.26). Burggrabe (Ref. 117) found that,

Chapter 7 Materials for Models of R/C Structures
using 3 mm diameter wire, the bond strength was 2.8 times higher for
1 mm apart than for a threaded rod with the same depthwide ribs spaced
rather than 1of thread, and 1.5 times higher for ribs spaced 3 mm apart
(Ref. 18) stressed the major differences between theHarris et. a1.mm.
or prototypesurface character of most laboratory deformed wires and
surface with indentedreinforcement, the first or which usually has a
The im-internal valleys, whereas the second has external protrusions.
by a properbe diminished, however,portance of these differences can
spacing and shape of the knurls. Nevertheless, it can be expected that a
or the force transfer betweenbetter simulation or all characteristics
be achieved through protrusions on thereinforcement and willconcrete
Actual cold-rolling of wires which pro-wire rather than indentations.
duced protrusions of the type shown in Fig. 7.19 was used sucsessfully at
the University or Stuttgart (Ref. 118).
bond characteristics of the model reinfor-A limited study theon
used in this study was performed by Bader (Ref. 29). The resultscement
are shown inof pull-out tests on wires with different embedment length
corresponding bond shown inFig. 7.27. The ultimate stresses are
Fig. 7.28 the results obtained by other researcherstogether with
satisfactorymodel and prototype reinforcement. The showscomparison
bond strength of the reinforcement used.
157

Chapter 7 Haterials for Models of H/C Structures
LEGEND'.00
:-VI~ ~ooo
DE'ORMED 8ARS
+ QQS IN. JAR «F. 1M$ STUD!'
. .,as . , lOr. CAST
. .'85 ; . TOP ,6 .," ; # lOT.
. ...5 , , TOP ". _7 ., ~ "
. .7 ., TOP "0 0.', IN. ; PLA'N CORHELL
. O~. ., M , T
. 00062. . «F. CORNELL
. 0004" . PLA'N I
. 0.0.'. ,. DE~. #
I (
a,'
;" / ./1
\11I ..
i
\~,400 \
IIIIII~-...WI
Q~Q-
~...~!...
5
~~-~~
PLAIN eARS\708010 .sO
EM8EDOEO LEN"TH"0
/ DIAMETER'0'°
RATIO
Fi~re 7.26 Bond Strength for Reinforcement Used in This and Other Studies (Refs. 29 and 39)
0.00'.J..
GAGE No. 14 WIRE T.0.08
INDENTA TIONSAVERAGE AlAXIIAVAI BOND STRESS
Lib
0.029.,...
,.,-,., 0' wire
\ L/O a 20"Vi'
I~STRESS PSO
L/o- 10900
10~011.9013~0780
4
6'
e
10
20
Iu~~Q...
#
D.O2.9~~0.029# -+-40.30' -+-00029#
liD . 10-~--8~,'-""-:-~~~"",:", ~\\ ~..p~~
0,20 0.2'0.10 0.15
SLIP A NO £LONGATION
0.0'
COIASINED (INCHES)
Fl~re 7.27 Results or Pull~t Test or Wire Used in This Study (Ref. 29)
158
,..
"
.
00
00
00

Chapter 8 Model Component Testing
CHAPTER 8
MODEL COMPONENT TESTING
8.1 INTRODUCTION
in Chapters 6 and 7 provide informa-The material studies described
tion on the material (metal or concrete) behavior under various load his-
of the behavior of a complete structure or struc-tortes. Understanding
tural model requires additional information on the behavior of structural
true forelements and structural subassemblies. This, in particular, is
beam-to-column connections incomplicated structural details such as
interaction in joints andsteel structures or concrete - reinforcement
structural compo-members of reinforced concrete structures. Testa or
nents also provide a direct calibration of structural component response
be detected neither at theload. Phenomena whichto the applied can
a complete dynamic test of the structurematerla~ test 1eft1 nor through
Detection or crack initiationcan be studied,through component tests.
the component, post-and study of the subsequent change in strength or
otand localized yield effects are examplesbehavior-yield component
such phenomena.
performed on reinforced microconcreteIn this study, tests were
steel and phosphor bronze cantilever beams.
159

Chapter 8 Hodel Component Testing
8.2
8.2.1 Introduction
To evaluate the adequacy of material simulation in the case of com-
posite materials, testing of structural elements is necessary. This, in
particular, is true for reinforced concrete models because of the compli-
cated nature of the concrete - reinforcement interaction. It is an un-
fortunate fact that even the tightest material control does not assure
similitude of all possible failure modes. These modes may be affected by
crack and bond similitude, cyclic loading effects, confinement and multi-
axial states of stresses in concrete, stress and strain gradient effects,
and otherfabrication accuracy considerations. Several of thesemany
aspects are not fully understood in prototype structures and to aeven
lesser degree in models.
~ ~~, the simulation of inelastic cyclic response characte-
r1st1cs and cycling rate effects for beam elements were investigated.
this purpose eighteen 1:14.4 scale models of a previously tested can-
tilever beam (Ref. The first test series (2 beams) was186) were tested.
concerned with the simulation of the prototype response using its proper-
ly scaled load history. The prototype failed in a combined flexure and
shear mde. The second series (12 beams) was tested to study the effects
of different cycling frequencies on the strength, stiffness and hystere-
sis behavior of beams subjected to high bending moments and small shears
third series (4 beams) was concerned with the simulation of failure
modes controlled primarily by shear rather then flexure.
The model beams for the three test series had identical material and
geometrical properties and differed only in the shear span to depth ratio
160

Chapter 8 Hodel Component Testing
lId indicated in Part 1 or Table 8.1.
8.2.2 Specimens
or model and prototype response, theTo permit a direct comparison
an element for which the materialchoice of a prototype was limited to
response characteristics were well documented.properties and the cyclic
study reported in Ref. 186 was chosen for this purpose.Beam No. 46 of a
is shown in Fig. 8.1, and a summary of its geometry andThe prototype
material properties is presented in the third column of Table 8.1
at Stanford (see Pragraph 7.7.2). Figs. 8.2previous studies performed
and 8.3 show the external dimensions of a model specimen, which consisted
of two beams joining into a column stub, and details of the reinforcement
respectively.layout, The fifth column of Table 8. 1 provides a summary
Figs. 8.4 and 8.5 show assembled cages and casting forms,of these data.
respectively.
made of three types of wire whoseThe model reinforcement cage was
properties are summarized in Table 8.1
1) main reinforcement - Gauge 14 black annealed wire, deformed in the la-
bora to ry by cold-knurling (see Paragraph 7.2)
Gauge 202) beam and column stirrups - black annealed and 18 wire was
used for beam and column stirrups, respectively (Bandi-Wire, available
in hardware stores). The wire was annealed and chemically roughened
after stirrup fabrication
161

Chapter 8 Hodel CO8ponent Te-sting
FORMWORK
~A-A
, AI ~ ~~':!:~5,4 [=:D(lxi-fIB) -=:::s. ~
~
C""""'" ~: - .
~-.
Figure 8.2 Hodel Geometry and Formwork
162

Chapter 8 MOdel Component Testing
table 8.1 Su88ary or Prototype and Model Properties
I«)DILPRoroTYPEPARAMETERS
Model ~111Prototype Do81n
t geo.try
- (111.)1
"'9 (11'.0)
1981 (18.0)
"39 (56.6)
1316 (51.8)
306.~
137.6
99.9
91.-
lId I
lId I:
lId I
lId.
1981 (18.0)
137 (29.0)
381 (15.0)
6" (25.25)
95 (3.15)
3811 (6.00)
131 (28.8)
366 (1...)
6U (25.28)
89 (3.52)
3835 (S.95)x
50.8 (2.00)
25.' (1.00)
".6 (1.16)
6.2 (0.2->
19 (O.029>x
- (iD.)
- (in.)
- (ia.)
- (ia.)
_2 (iD~)
b
b
d
d'
A . A'. .
Oeuse ,. knurledwire
2 _in re1ntor~t f9 bara
1.98 (0.018)
'13 (59.9)x
'39 (63.T)X
1.27 (0.29)
1.35 (0.30)
-(in.)
Mfa (ai)
Mfa (ai)
d (kips)
kl (kips)
28.6 (1.12)
'61.9 (61.0)
110.2 (103.2)
265.3 (59.6)
'aT.8 (102.')
28.5 (1.12)-
tl
tu
PI
Pu
263.8 (59.3)
280.. (63.0)
Ga.. 20 cb~ca1l7I roughened wire
3 stirrup ties ,- bars
0.88 (0.033)xx
3'5 (so.O)x
"3 (59.9)x
0.189 (0."2)
0.22' (0.050)
1.9 (0.31)
0.0" (0.275)
0.051 (0.323)
12.1 (0.5)
'13.1 (60.0)
661.9 (96.0)
52.' (11.18)
83.8 (18.85)
152 (6.00)
0.689 (3.927)
1.103 (6.283)
12.0 (0.5)4
ty
tu
Py
Pu
39.3
-6.-
11-
0.692
0.815
.
2Py/.
2P ,.v
-(in.)
HPa (k81)
HPa (kal)
kB (klps)
kB (klps)
- (In.)kK'- (klps/ln.)
kB'- (klps/ln.)
- 8ioroooncreteomorete
31.9 (5.50)
-.- (0.63)
11.6
27.5 (3.99)
3.1 (0.'5)
11.3
t' MPa (ka1)c
ti MPa (k81)
t'lt's 100t c
valuea baaed on approxiate d1a8eter ot the wire
diameter atter ohem1cal treatMnt
163
(12.08)
:5.-2)
:3.93)
[3.60)
6.9
3.1
2.2'2.0
(8.8)
(10.')
{'.S)
(3.952)
('.651)

~~ ~9~1e ~ 8s: e =~ ~ q)(.!) ""' -
1,u~<1~ ~ ~c ~ -e: tt-n~:oi tr---rr~ S2 ~! "--err ~ ~ tt---ttc ~ -- II II!,&: 0 II II~ K> <\! II II~ ~ ~ II II~ ~ - II IIi ~ -8? II II
II II~ ~ II II
~ -e-: ~ II II~ II (I.<.. II IIbiJ n rr~ Tf---if~ n:::tt-~ rr-:--rr~ II : II~ ... II : II
~~w~ .~~
<~~(:I)~w~
~~~-.;oJ..J~
~l~""
.1Q)!
"
r"=";-
,"1"H"t, " +.'TM, "'
..~
~~
0)",. I~'0'-"c;Il"
-t/))c
C\J
II
<J>'
- -J" ::.'.II IIII IIll:::tt ~+f--+t -
+t---HI[ II IIII IIII IIII II
"III~ V)II II ~ ~
11 III I -4-e:II I C\JII IIII IIII IItt--1fTr--1TIT-TT
:::::!
~
~~~.I~w:"".;;:~.~ (,I,J -"-'9~(/jl~
~
Q::)
d3
~~~Uj~:5~G
~I
~
~h~~V)~~~
164
I-
r
~
.
,-LV""Q"
I..J
-t- ... ...
-1..1Il_LI_.1~.i. 'i-,' -.-;-.-t
JtJ-Loiu
IFft
w
(O~Z )~
TcL'i ~-n ji 1 (£'9}'0) -- -'- .~L."
fr'--' I '. I I
-
t~
ftf
I
"p-
r' :L
Chapter 8 Model Component Testing
0)~
h
i
-I,
I
0
1(..)
r- -fII
-w~:..L
CD~tt)
...c:
I0
~~c:
.~
.'0
i
rr:«)
t~fa.
L+~""'1I I' I+ ...,'"" ,-... ' . . I
t-;-

Chapter 8 Hodel Component Testing
Figure 8.4 Assembled Reinforcement Cages
Figure 8.5 Casting Forms
165

Chapter 8 Model Comoonent Testing
8.2.2.1 Specimen Fabrication
Due to the cold-knurling process, the main reinforcement was assu-
radius of about 5 m, which required a special ar-ming a curvature of a
rangement for the assembly of the reinforcement cage. The wires were
precisely located holes, anchored at onethreaded through templets with
strength at the other endend, and tensioned to about 1/3 of their yield
turn buckles as shown in Fig. 8.6. The spacing of the wiresby means of
was also controlled by intermediate spacers (see Fig. 8.7). Details of
reinforcement cages, with all longitidunal and transverse reinforcement
in place, are shown in the photographs of Fig. 8.8.
The beam stirrups were fabricated in the following steps:
wire tightly on a machined steel bar of a cross section1) spooling the
equal to the internal stirrup dimensions,
(600°C 11120p) 2 hrs.)2} stress relieving ot residual torstresses
built up during the unwinding of the coil ot wire and during thethe
rewinding around the steel core,
into individual3) sliding the wire off the steel core and cutting it
stirrups while accounting for the hooks still to be formed, and
to remove the shiny and smooth scale4) chemically treating the stirrups
and to roughen the wire surface (see Paragraph 7.2).
was threaded through the closedThe min beam and column reinforcement
stirrups the joint area, where the column stirrups had to beexcept in
opened and reclosed after being positioned.
Since the strength or the stirrup wire was lower than that required
orthe scaling of the prototype properties (Table 8.1), the spacingby,
an equivalent amount of shear rein-the stirrups was altered to provide

Chapter 8 Model Component TestlnR
Figure 8.6 Setup for Reinforcement Cage Assemblage
Figure 8.7 Control of Wire Location in Reinforcement Cage
161

Chapter 8 HOdel Component Testing
Figure 8..8 Details of Reinforcement Cage
168
.c. I

Chapter 8 Model Component Testing
for cemen t per unit length:
sm
where s is the stirrup spacing, 1 the length scale ratio (1:14.4), andr
Py the yield force of the stirrup.
the calculated spacing for a beamThe stirrups were spaced at 8 m
length equal to twice the beam depth and at 28 thereafter to reduce them
control thefabrication effort. Machined plexiglass combs were used to
spacing.
were attached to the main reinforcement by tighteningThe stirrups
them together with Gauge 24 wire at every third crossing along the main
reinforcement (Figs. 8.7, 8.8). The tightening required some practice in
Finally, at each suchorder not to bend the relatively weak stirrups.
adhesive (GR-R-1P, Alpha Cyanocrylate adhe-node a very small amount or
slip-freesiye by GC Electronics) was applied, which resulted in a
nection between the stirrups and main reinforcement, thus providing the
for further handling after removalrigidity of the cage necessary
assembling table.
assemble oneIn average, it took less than three working days to
reinforcement cage.
The forms for casting of the specimens were made out of wood covered
with PiC foil to prevent wood warping and adhesion between the forms and
the concrete, and out of aluminum angles of depth equal to the width or
the beam (Figs. 8.2 and 8.5). The beams were cast horizontally as in the
case of the prototype. The positioned in the forms usingcages were
spacers and stiff horizontal stainless steel wires passing through the
aluminum angles.
.169

Chapter 8 Model Co8ponent Testing
C:A:W ratio otThe microconcrete used tor the specimens had a
1:3.5:0.12, with aggregate grading and cement type as reported in Section
7.1.2.3 for mixes used in this study.
orAll the specimens were cast together using a single batch conc-
A total or 35 accompanying 5Ox 1 00rete. (2x4 in.) cylinders were cast
at the same time.
The mixing was done using a two-speed 0.5 tt.3 (0.003 m3) mechanical
mixer. The procedure used (as recommended in Re~. 18) was as tollows:
1. Place the entire quantity of mix water in the bowl of the mixer.
2. Add cement, mix tor 30 seconds at slow speed, add aggregate, mix
30 seconds
3. Stop mixer for 50 seconds. Scrape any mortar stuck to the sides down
into the batch,
4. Mix ~or 60 seconds at slow speed.
The concrete was poured into the forms and vibrated into place by tou-
ching forms with a pneuatic hand vibrator. Once the concretethe
upper edge of the beam form, a plexiglass stopper (Fig.reached the
placed in position to prevent the flow ot the concrete duringwas
casting of the higher located portion of the column.
After the casting was completed the forms were covered with PVC foil
24 hours.to prevent moisture loss, and left undisturbed tor Then the
connected byforms were stripped (by dismantling the formwork which was
screws) and the specimens were placed in a fog room (20oC, 95~ RH)
To equal moisture content in all specimens at the time otassure
well prevent shrinkage cracking, all specimens weretotesting, as as
Ref. 18.sealed using clear shellac spray, as it was recommended in
coating 1s proof, transparent and highly brittle, thus providingwater
170

Chapter 8 Hodel Component Testing
the possibility of crack observation during the test. The sealing was
accompanying cylinderaccomplished by removing the test beams and
specimens from the fog room after 5 weaks, allowing their surface to dry
for about 40 minutes and then spraying the surface with the first coat or
The coatedshellac. Subsequently, two additional coats were applied.
specimens were then stored in a constant temperature room (20oC) till the
day of testing.
8.2.2.2 Test Setup and Instrumentation
HTS closed-loop testing machineThe tests were performed using the
with the adjustable testing frame shown in Fig. 5.4.
The test setup and part or the instrumentation shown inare
photos of Fig. 8.10. The cyclic loads were applied8.9 and in the
In order toto the column stub by means of the MTS hydraulic actuator.
avoid force redistribution between the two beams of a test specimen, the
column stub was rigidly connected to the hydraulic actuator.
The supports of the beams were provided by linkages consisting or
spherical rod-end bearings with a load cell mounted between themtwo
8.10) . two linkages allowed preciseA turn-buckle in each of the
adjustment of the length of the linkages.
braced against lateral out-of-plane mo-The ends of both beams were
The bracing was provided through teflon-lined, rigidly supportedvement.
in Fig. 8.9).plates (not shown A very small gap was left between the
teflon and beam faces. Closing of this gap was not observed in any test,
thus out-or-plane bending did not occur
The instrumentation of the test consisted of the following:
1. LVDT of the hydraulic actuator measuring the column displacement. In
171

Chapter 8 Hodel
I~
f.§
.
t Testing

Chapter 8 Model Component Testing
Figure 8.10 Views of Experimental setup and Instrumentation
173

Chapter 8 Model Component Testing
also used for test control.most of the cases the actuator stroke was
In this manner, both beams subjected to equal displacementwere
but were permitted to undergo different load histories whenhistories
unequal strength properties existed in the two beams.
force the end or each beam2. Two load cells measuring the at
One of the load cells was used for the test control inindependently.
sub-yielding cycles of the high shear tests.
Qt tor the measurement or3. Two three pairs mercury gaugesor
displacements at the top and bottom sides of rectangular rigid frames
in Figs. 8.9 and 8.10. Fromwhich were attached to the beam as shown
the rotations and average curvaturesthe displacement measurements
over a predetermined distance were deduced. The use of mercury gauges
measured betweenis discussed in Chapter 5. Average curvatures were
(0.41 in.10.5 mm andthe column face and two sections located at
30.5 mm (1.20 in.) from the column face.
Signals of all the instruments were recorded in digitized form by a
Several X-Y recorders registering the load-deflection andminicomputer.
load-average curvature measurements were also used in the low frequency
tests to allow visual control of the test. In the high frequency tests
load-displacement histories were registered on oscilloscope screens.
coated with shellac (see previous section) onAll beamsthe were
which a grid identifying the location of the main reinforcement and stir-
rups was drawn with a felt pen.
The cracks were observed with the help of a magnifying glass, marked
with a felt pen, and recorded photographically.
174

Chapter 8 Hodel Component Testing
Simulation g! Prototype Response (!/~ = 1.1)
In order to evaluate the adequacy of a small-scale model of a beam
element subjected bending and high shear, two beams (one specimen)to
subjected to the properly scaled prototype loading history
(Ref. 186). The loading history ot the prototype beam is shown sche_ti-
cally in Fig. 8.11.
The loading velocity was controlled through a ramp function with the
speed of loading based on the assumption that the time of first loading
to yielding is 100 seconds.
Load-displacement or the prototype fromresponse is reproduced
186 and presented in Figs. 8.12 , with the load points corresponding
to the ones marked in Fig. 8.11.
In order to compare these results on a one-to-one basis with the re-
sults obtained for the model beams, appropriate scale factors were ap-
plied to the measured model Comparisons of severalresponse values.
load-displacement hysteresis loops of the prototype and model response
are presented in Figs. 8.13 and 8.14. Table 8.2 provides a comparison of
tangent stiffnesses in different cycles in the prototype and model beams.
For the cycles below and slightly beyond yielding of' the main
reinforcement, the shapes or the hysteresis loops are similar in model
simulationand prototype and an accurate or the prototype response was
achieved with the smll-scale model. However, at the first large
(Point 26)amplitude reversal and thereafter, a significant strength
deterioration is evident in the model response which did not occur in the
prototype. 'ni1s phenomenon must be attributed largely to the lack of
strain hardening in the main of'reinforcement the model beam. It 18
175

Chapter 8 Hodel Comppnent Testing
~~z0I-UbJ-J""4JaQ.I- .
BEAM 46
Figure 8.11 Prototype Loading History
Table 8.2 Tangent Stiffness of Prototype and Hodel Bea8a
+ Prototype Domain
176

Chapter 8 Hodel Component Testing
,"
~ "+ ",o?" ~?
.I ~ ~~
.,
~~->.Q.
~0t.J
,
BEAM 46
-'"~...
- I I I I I I0.3 0.4 0.5 0.6 0.7 0.8 0.9
TIP DEFLECTI~ 8 (IN)
It I . 1-.0.9 .,0.8 41 -4t ..o,s .;Qc4 -o~ -02 ...
~'"
"'~//~~ ",J':"//~ ~~ -40
",'"
-
~'
I-E&80 ~p
tW)L.
Ca> Up to Yielding or Reinrorce..nt
FilUre 8.12 Prototype Load Displacement Response
177
120
80
40
r

Chapter 8 Hodel Component Testing
Figure 8.13 Comparison of Model and Prototype Load-Displacement Response for Cycles
up to Yielding of ReinforC888nt (Prototype Domain)
160r-..CI)
~ 120~"-
Q. 801
60024 3D
~~'-
Q..
~
400h~~=::~~:;=J . ~
200 II~ /,1
i'T 40
p 16/,
0 2.0<5 (IN)...
;'/,.
-200 ""
'"
~
..
~
"1/-400 ..0.-
f: i -- - l-- ---
26 prototypemodel32
-600-/60.1-
I I I II I 81 III I I
-60 -40 -20 0 20 40 606 (mm)
Figure 8.1- Comparison of Model and Prototype Load-Di.plaOeMDt Response for Cycle.
beyond Yielding of Reinforcement (Prototype Domain)
178
-40/y

Chapter 8 Model Component Testing
believed that, with reinforcement which is heat-treated to develop the
necessary strain hardening ability, also the larger amplitude loops could
be successfully reproduced
Figure 8.15 presents the load-average curvature (or moment-curvature
after multyplying of the vertical axis by a constant) response of the mo-
del over a length of 438 mm (17.3 in. (prototype domain). The curvature
record shows a symmetrical behavior corresponding to the symmetrical
displacement history. This indicates that the inelastic tip deflection
is caused primarily by a symmetric pattern of cracks concentrated in the
close vicinity of the column. Figure 8.16 shows the load-curvature
relationship length or 152 mm (6 in. for the prototype.over a
Superimposed are the peak values of the curvatures measured at the same
location in the model. It can be seen that the peak values differ consi-
derably between model and prototype. The unsymmetric peaks in the proto-
type are attributed to the strain hardening in the reinfor-prototype
cement which led to a redistribution of strains which had no counterpart
in the model due to lack of strain hardening.
In retrospect, the importance or simulating the strain hardening
characteristics in model reinforcement cannot be overemphasized. It is
well established that the post-yielding cyclic response characteristics
or f1exural elements are largely controlled by the mechanical properties
of the reinforcement. Strain hardening will permit an increase in the
bending resistance and will also cause a spreading of flexural (and also
shear) cracks into the beam proper
Figures 8.17 a and 8.17 b present the crack pattern in the prototype
and in the model, respectively. Here again the lack of strain hardening
179

Chapter 8 Model Component Testing
Figure 8.15 Model Mo8ent-Curvature Response
3D+
~J.-=rr
Figure 8.16 Co8par1son of Model and Prototype MomeDt-Curvature Response
180

Chapter 8 Model Component Testing
(a) Prototype
(b) ~el
Figure 8.17 Views of Prototype and Model Crack Patterns
181

Chapter 8 Hodel Component Testing
in the model reinforcement is or visiblea Although theinfluence.
cracks in the vicinity ot the column similar,are no cracking in the
model beam regions located further away from the column observedwas
Since there was no increase in the beam capacity with increasing displa-
cement amplitude (no strain hardening), the cracks did not propagate
beyond the initially cracked Difficulties inzone. detecting small
cracks in the microconcrete specimens may have contributed to the limited
extent of cracking indicated in Fig. 8.11 b.
8.2.4 Simulation of Shea~ Failure Mode (!/~ = ~.Q)
Four of the beams were tested with very small shear to depthspan
ratios to examine the feasibility of small-scale model tests of beams
failing in a mode controlled primarily by shear. Two of the cantilever
beams were loaded at a distance of 2.0d from the column face and two at a
distance of 2.24d
Figure 8.18 shows the load-displacement hysteresis loops for one of
the beams with lId = 2.0. The applied load history consisted of three
cycles at a displacement amplitude slightly beyond yielding of the rein-
for cement and three subsequent cycles of twice this amplitude. Prototype
test data are not available for a direct comparison of response behavior,
but the model test results exhibit all the characteristics expected from
a high shear test. The first load reversal led to a set of nearly ortho-
gonal diagonal cracks which in subsequent cycles caused the well-known
pinching of the hysteresis loops evident in Fig. 8.18.
At the large displacement amplitude, the second and third cycles led
to a rapid deterioration in strength and stiffness. This deterioration
was caused primarily by a decrease in the aggregate interlock along the
182

Chapter 8 Hodel Co8POnent Testing
-2 -1 0 , 2of ~fofype domain (in.) 1--- ~I ,~-
:-..S;tj
~"'Gq,
~~eQ..
~-r!2 p
Q';q:C)-J
00~~.~t)
§15-~0e:
-2 -tOO
-4 -' I - I I ~del d~mo;n ('!'m)- 04 -2 0 2 4
DISPLACEMENT
FigUre 8.18 Load-D1splac..ent Response fro. Test with lId. 2.0
Figure 8.19 View or Crack Pattern from H1gh Shear Test
183

Chapter 8 Hodel Component Testing
major diagonal cracks. Considerable crushing of the concrete occurred
be in Fig. 8.19 which shows the crackalong these cracks, as can seen
pattern at the end of the applied load history. This crack pattern ap-
pears to be representative or prototype cracking although the spacing or
the major shear cracks probably is larger than that of a prototype. The
spacing of shear cracks in prototype or the dimensions shown ina
Fig. 8.1, but with different lId and shear reinforcement (Ref. 186) than
that used in the model beams, is approximately equal to one-fifth of the
beam height whereas it is on the average one-quarter of the beam height
in the model beam.
8.2.5
In order to explore the feasibility of simulation of a predominantly
flexural roode of couple of cantilever beams was tested withfailure a
shear span to depth ratio equal to 6.9
The loading history to which the cantilevers were subjected consis-
ted of 3 cycles at a displacement amplitude slightly beyond yielding of
the reinforcement and subsequently 3 cycles at twice this amplitude.
Figure 8.20 shows load-displacement hysteresis loops obtained in
this test. There is no shear pinching effect, and the observed strength
deterioration can be attributed entirely to the lack of work hardening
exhibited by the main reinforcement. The crack pattern developed in the
beams (Fig. 8.21) entirely of flexural nature, although, as in thewas
previous tests, all the cracks of visible size were concentrated in the
region relatively close to the column stub.
184

Chapter 8 Hodel Co8ponent Test1n8
Displu..-a;-,wf cI ( in-)
-s 0 5. . T' , . , I . ',. . .~- 1_,- ' ,pr~~ d~
-as 0.0 0.5F. , . . ! I ~~ 1- I=::::'--I"8:-::;:::i J cf -
I F==!--I , JSO~
rl"~
- ~-::==2~ J~200 ~. -!p.
.~--'-
~
~0
I i~0
I o.o~-
c:~E0
1:)
"Ii~0E
~~~Q.'baa
,.J
~.,~lo.o 100
;,/W:/ .--="" "" \ - ;11"';
,-02-200 -1.0 r50
. t . )
. -In .
,-a,} Cycle of. - - - 2-.- D#s~-:
3-,. A~moM' dlNrlain .
I I I I J J-- - 10
prototype domo;,L . J . J'..' J . I-100 0 100
Displac~nt cf (mm)
Figure 8.20 Load-Displacement Response t~ Teat with lId. 6.9
Figure 8.21 '1- of Crack Patt8r'ft tI'O8 R1ih Flexure Test
185
'.0


Chapter 8 Model Component Testin~
Ca) Cycling Frequency 0.0025 HzDisplacement clrin.)
-5 0 5'tic' I , I I I I I . I I I
p'ototy~ domain-0.5 0.0 0.5
,~ "". I I -!-"_I ~ .' 'dOnIa.I l= :J!~cfi! rrouua In - ,
200 .~,.o ~.s F=~--.~ t- - .S I .~ 50e: I ~ P "' c" - -- ~ 0.2 e:I ~ .g ; 1 - ,#'" - - 117 .g .g
II '- ~,'I" " ' -.. 1e:: I~ -t q.
,~ 0 0 ~~ I e: e: I ~
i ~O.O ' -:- : o.o~
i~'-Q,.'b~~
.,.J
~~a.~~~
.,J
~.0u
"/ ....
.<).2-200 -'.0 ..,
- - f.a,} Cyc,..,O- - - .2'-114 Dispi«--'-- - - - - ;J-,.4 A,.p"'w.
mode'ldomoin. r~,""I' . I. I I I I j
.c-lO 0 10. prototyp~ domain
,1;,\;,:;. t . t. -, . I.' -100 0 100
Disp/oc~ment cJ (mm)
(b) Cycling Frequency 10 Hz
Displacement r!'in.)-5 0 5, 'r'" , I ' , , '-" ,
prototy~ domain-as 0.0 .
i-' '" " '-'- -'~. ~f.1i=::==~~3 Q.$-.S, ~-- .Jd moMI ,"
0 .e T.g:t0e
:-="".s-
0O.2e
.g..Q.~0e
O.O~
200;I
.s.C)s
.g
":tC)s
so!pi~'-Q..
"b2...,
~~Q."1:J00
..,J
~0 IC()
1-0.2-20u -1.0 -so'-.'} CYC,.M. - - - 2-.d Ois,,_--
-- - - -- .5-,d AM,,"'"mode/domain
".~" I I ~ I I I I 1'0 I
prototype domoint,- I - ,-, - ,-100 0 100
Displacement c1 (mm)
Figure 8.22 Comparison of Load-Displacement Responsefor Be8IU Tested at Different Frequeneies
187
.g
.! I
..9:0~o.o

Chapter 8 Model Component Testing
1.0~C\I~(lCI
~~t)0
.,..J
~4.1
.~-..t)
~0
~
-1.0
Figure 8.23 Load-D1splacement Response tor Tbree D1fferent Cyclin4 Frequencies
Figure 8.24 Influence of Cycling Frequency on the Peak Load at a D1aplace8ent &.pl1tude
188
o.0

Chapter 8 Model Component Testing
control at high frequencies did cause some differences
measurements performedAll the hysteresis loops obtained from the
the twelve beams are presented in Appendix B.during the oftests
normalizedload-displacement history, andeach beam a normalized a
Table B.1 summa-bending moment-average curvature history are presented.
rizes the measured maximum load values vs. displacement amplitude.
Figure 8.24 presents the quantification of the influence of cycling
the two displacement amplitudes.frequency on the average peak loads at
the average peakThe average load values are normalized with respect to
the change for the first cycle of the second
NP21 indicate the significant difference in the
fourth line (~1) reflects
Namplitude. Lines P11 and
frequency (0.0025 Hz) and atstrength of the beams tested at the static
Hz).dynamic frequencies (2 Hz and 10 The difference between the two
10s8 of strength, from the smaller to the larger amplitudelines shows a
of approximately 13~ for the lowest frequency, about 1~ t'or the second
for the highest frequency. There is nofrequency and some minimal gain
significant difference between the strength deterioration rate for cycles
of the same amplitude carried out at different frequency levels
described for the lowest frequencyThe crack patterns of the beams
Section 8.2.5 Itwere also studied for the higher frequencies.1n
crack pattern was basically independent ofalthough theobserved that,
the cycling frequency, there was a difference in crack sizes. In the
frequency test, pieces of concrete around the major crack at the column
189

Chapter 8 Hodel Component Testing
face spalled off whereas in the high frequency tests the crushed concrete
pieces did not fallout. This may explain the large difference between
the peak load values for the first cycle or the small and the large
amplitude in a low frequency test, and the relatively small difference in
Nthe high frequency tests. Line P" indicates that the effect of material
strain rate accounts for a 5~ strength increase by increasing the cycling
frequency from 0.0025 Hz to 10 Hz, and thus is small relatively to the
effect of cycling frequency on the post-cracking behavior ot concrete
particles located in the cracked area
8.2.7 Conclusions
Because of the lack of strain hardening in the model reinforcement,
only a limited assessment of the simulation or the various failure modes
(flexure, Also,flexure-shear, and shear) can be made from this study.
prototype test results available only tor the beam failing in aare
flexure-shear mode. For this case, the stiffnesses in the various cycles
closely ade-simulated at model scales and the strength values are
quately reproduced in the early post-yield range. The tests on specimens
small lId ratios show the characteristic pinching of hysteresis
loops while the tests specimens with large lId exhibit the expectedon
fat hysteresis loops controlled by the stress-strain characteristics of
the reinforcement. Considering the complex mechanisms that are involved
in shear transfer (aggregate interlock, dowel action, contribution of
shear reinforcement, etc.), the results of this limited test series are
not tully conclusive but are indicative that most or these complex
mechanisms be simulated with reasonable success at small modelcan
scales. In all cases, strength deterioration in the inelastic range
190

Chapter 8 Hodel Component Testing
occurred at a rate which exceeds that expected in the prototype. It 1s
likely, although it cannot be proven at this time, that much or all of
this discrepancy is caused by the lack of strain hardening in the model
reinforcement used in this study. Further research with more accurately
scaled stress-strain characteristics of the reinforcement is needed to
verify this conclusion.
The study of the cycyling frequency effect indicated that the ma-
terial strain rate effects, as discussed in Sections 7.1.3 and 7.2.3,
pear to have relatively little effect the strength of the specimens.on
or larger importance seems to be the effect of deformation rate on
post-cracking behavior of the concrete which restrains dislocation or
concrete particles in high frequency tests. This phenomenon causes
doubts in the accuracy of dymamic response prediction from psuedo-static
load tests
1~1

Chapter 8 Hodel Component Testing
8.3 MODELS OF STEEL CANTILEVER BEAMS
In this study, tests carried out on two metal cantilevers, anwere
1:1.92 model of it made of CA 510A36 structural steel cantilever and a
annealed phosphor bronze. The tests were performed to provide informa-
of two single-degree oftion an the load-deformation behavior of columns
This information was neededfreedom models tested the shake table.on
phosphor bronze model, in which temperature effectsparticularly for the
The studydue to the column welding process were of particular concern.
thewas also performed to investigate the effect of cycling frequency on
load-deformation behavior of the specimens.
selectedFor ease of fabrication, rectangular cross sections were
The dimensions of the cantilevers were based on thefor the specimens.
models studieddimensions or columns ot single-degree or freedom
subsequently on the shake table. The steel columns were fabricated from
13x19 mm (1/2x3/4 in.) hot rolled flat bar. The mill scale wasa
final dimensions of the cantilever were: hxbxl =machined off, and the
distance from the12.3x18.3x279 mm (O.484xO.719x11.0 in.), 1 being the
face of the column to the point of load application corresponding to one
half of the column height. The phosphor bronze columns were machined
from 13 mm 1/2 in. diameter half-hard rod. The scaling ratio from the
bronze columns is. based on true replicasteel columns the phosphorto
= (E/p)r.model rules demanding that 1 In this study, the ratio wasr
1:1.92. Thus, the dimensions of the phosphor bronze cantilever were:
hxbxl = 6.4x3.5x145 mm (O.252xO.374x5.7 in.).
The cantilever beams were welded to a rigid steel column. In the
case of the phosphor bronze, small alumnimum bronze plate was weldeda
face of the column, and then the cantilever was welded tofirst to the
192

Chapter 8 Model Component Testing
that plate. This procedure was chosen to minimize the heat input to the
cantilever, and thus to minimize the over-annealing of the material.
welding was done using tungsten innert gas (TIG) technique.
The cantilevers tested in the frametest described inwere
Section 5.3.1.2 and shown in Figs. 5.3 and 5.4. Figure 8.25 shows
schematically the test setup. The instrumentation consisted of a
cell measuring the tip force applied to the cantilever, a LVDT measuring
the vertical displacement at the force application point, and two pairs
01' strain gages measuring strains on the top and bottom surface ot a
cross section. The first pair was positioned at a minimal distance from
the welded joint, and the second at a position where no material yielding
was expected. The measurements from the latter pair were used to obtain
a reliable moment-strain calibration for the shake table study.
////// //-"I~~!ifJ / / J~~'J'!/ / // / / ////////_///~;"// /// //////~(/ /f/ // I I.-
"1fT
!l-t1' 0-'I ,
~LoodC~IIL.L.U
~~~
~A
!
~S Ing ram~
Actuator
Figure 8.25 Experimental Setup tor Cantilever Test
193


Chapter 8 Model Component Testing
for the steel, whereas the phos-resulted in very slim hysteresis loops
phor bronze loops exhibited a significant amount of plastic deformation.
discrepancies must be attributed to the effect of overheating nearThese
The welding process caused athe phosphor bronze specimen.the ~lds of
loss of strength in excess of the desired reduction in strength which was
controlled through subsequent annealing.
post yielding cycles, the peakfewWith the exception of the first
the different displacement amplitudes and also the hysteresisforces at
attri-loops for the two specimens matched rather closely. This can be
buted to the high work hardenings of the phosphor bronze which first
eliminated the effect of the lower yield strength.latersened and
vertheless, in dynamic response studies the lower yield strength and fat-
phosphor bronze will lead to dissimilarities inter hYsteresis loops of
These dissi-first few inelastic cycles.the response, at least for the
the premature yielding inDlilarities may not be large, however, since
partially counterbalanced by the greaterphosphor bronze 18 energy
dissipation capacity represented by the fatter hysteresis loops.
These simple cantilever tests as well as the material tests indicate
for models of welded steelthat phosphor bronze is not an ideal material
major problems are represented by the excessivestructures. The
of annealed phosphor bronze (see Section 6.3.4.4) and byhardening
Itstrength in the heat affected zones at weldments.excessive loss or
these two effects counteract each other to a degreeethatis fortunate
material. This 18which may make phosphor bronze an acceptable model
demonstrated by the shake table study of a simple steel structure and ita
phosphor bronze model discussed in Chapter 9.
195

Chapter 8 Model Component Test1nl
in
0.50.0.
zoo
100
Q..c0~
Po-
fo4
1b0kN 0.0
-100
.200
2010-0-
mm-10
TIPDEFLECTION . -~ .
F1iUre 8~26 Co8P8r1aoD of Load-D1aplaoement Response of Steel and Annealed Phosphor
Bronze Cantilevers (Steel Cantilever Do8a1D)
~rrect ~ QIcling ~requency8.3.2
itther, at whichThe questions which have
structures.in the case of dynamically loaded
frequencytesting
on the fatigue life of the component?
and fast
numericalofbaeietesting program, thus providing athecycles in
196

Chapter 8 Model Component Testing
hysteresis loopsFigure 8.27 showsresponses.comparison between theThecantilever.static and dynamic cycles of the phosphor bronze
from
the averagecorresponding tostatic cycles were conducted at 0.01
strain rate of 2.4x10⁻⁴/sec. The dynamic tests were conducted at 2.8 Hz
-2corresponding to the average strain rate of 7.5x10 /sec.
Hz
in.
o. s0-0.5.0.300.
zoo.
lO.
100. -Q
-<0~
PI~...
o.o.kN
- 1,0.
1- 40
- 300.1.0100
mm':10-20
TIP DEFLECTtON
Figure 8.21 Comparison or Hysteresis Loop. tor Static and Dyna8ic Cycl..
ot ADnealed Pboaphor Bronze Cantilevers
except ot the somewhat higher peak valueidenticalThe loops are near ly
can be accounted for almostThisexhibited by the high frequency loop.
The hysteresishardening ot the material.high workby theentirely
It should be noted, however, that theloops.in low and high frequency
197

Chapter 8 Model Component Testing
control. Thus, thetests were carried out with sinusoidal displacement
strain rates close to the peak force and displacement values are approa-
ching regardless of the cycling frequency. The lack of influencezero,
of the cycling frequency the or the cantilevers is in anon response
agreement with the findings by Almuti (Ref. 191)
The effect of cycling frequency on the fatigue-crack-growth rate has
been studied by others in conjunction with the material toughness and fa-
tigue behavior. In Fig. 8.28, Rolfe and Barsom (Ref. 201) present a sum-
mary of cyclic studies performed on A36 steel at frequencies from 0.1 to
100 Hz. The figure indicates that the cycling frequency does not
influence the fatigue behavior of the material (in environment)benign
Figure 8.29 (Ref. 201) indicates the independance of the fatigue behavior
or the shape of load function used to control the test.
the data presented in Figs. 8.28It should be noted, however, that
and 8.29 were obtained in the range of elastic nominal stress cycles and
it is not known whether the conclusion drawn from this set of data can be
extended to the regime of plastic fracture mechanics.
198

Chapter 8 Hodel Co.ponent Testing
F1pre 8.28 Etteot or Cycliq Freq8DOJ' ~ Crack
Growth Rate. (from Ref. 201)
,I'iI
ii
6
&
4
5
4
.U>-..i~.~Z'a...0'a
W~~X....0~~
~uc~u 3
210 20 30 40 50 60 80 100
STRESS -INTENSITY- FACTOR RANGE. b.K I. k.i .r;ii'C'h"""
Pigure 8.29 Effect ot the Shape ot Load Function on Crack Growth Rates (rro. R.t. 201)
199
3
2
10-5
8
6

Chapter 9 True Replica Hodel Study of a Steel Structure
CHAPTER 9
TRUE REPLICA MODEL STUDY OF A STEEL STRUCTURE
A study on a simple structure subjected to earthquake excitation was
Section 4.5.1necessary to evaluate experimentally the laws-presented in
for true replica models, and to subject the steel and phosphor bronze
studied at the material level (Chapter 6) and component level (Chapter 8)
to a true earthquake test.
9.1
freedom system was selected as aFor simplicity, a single degree of
The tested structures consistedtest structure. of four rectangular co-
lumns connected by welding to a rigid top plate and to base plates rigid-
ly attached to the shake table (Fig. 9.1). are stronger inThe columns
uniaxial motion and are braced at mid-the direction orthogonal to the
structures were testedheight to prevent motion in that direction. Two
on a shake table, one made of steel and one made of phosphor bronze
4s!!ak~ fable ~motion
Figure 9. 1 Longi tldunal and Transverse View ot The Model
The steel model is used a pseudo-prototype structure for theas
allowing numerical comparison of the resultsphosphor bronze model, thus
200

Chap~er 9 True Replica Model Study of a Steel Structure
both the models. The overall dimensions of theobtained from tests on
pseudo-prototype are based on the size of the shake table available at
Stanford, and on cost considerations. The steel model can be viewed as a
1:4 scale model (with artificial mass simulation) of an actual structure
the dimensions as specified in Table 9.1. This structure was
designed to resist the N-S component of the 1940 El Centro acceleration
record at level close the yield of the columns. The materialtoa
properties of the steel used in the pseudo-prototype and of the phosphor
(CA 510)bronze used in the true replica model summarized inare
Table 9.2. The dimensions of the phosphor bronze model derived byare
applying the scaling rules for true replica models (section 4.5.1) to the
pseudo-prototype dimensions. The following are the inverse values of the
in Fig. 9.2The instrumentation used in the experiment 18 shown
The shake table accelerometer and LVDT provide a record of the input
attached to the top plate of themotion, the accelerometers and LVDT's
The accelerometer orientedmodel provide a record of the model response.
in the direction transverse to the direction of shake table motion prov-
ides information as to whether any significant transverse movement takes
place. The two relative motion LVDT's permit an estimate of any rotatio-
nal DDtion. Strain gages attached to the columns within their elastic
calculation orrange provide a strain history record thus allowing the
shear forces experienced by the columns. This is done using the formula
v = (M. + M2} / h, in which h is the distance between the instrumented
201

Chapter 9 True Replica Model Study or a Steel Structure
Table 9.1
Dimensions of the Prototype,the Steel and Phosphor Bronze Models
Table 9.2
Properties or Model Materials
LVDT's
SIDE VIEW /"7~~!!~~-~-.n; ,- ~--~~f~ -"\.8-cf
2 st~tn.!~_('c0Ull1.s I COII8I\ :;
I "t
I "" : ,.' I
P LAN VIEW ">~~~-~~~
Figure 9.2 Schema tic View of the Instrumentation
20.2

Chapter 9 True Replica Hodel Study of a Steel Structure
cross section, and M1 and H2 are the moments recorded at the two cross
sections. The moments were recorded directly by using the moment-strain
calibrations obtained from the cantilever tests (Section 8.3).
testing program was designed to provide maximum information on
the correlation of the behavior of the pseudo-prototype and its model at
the 1940 Elvarious levels of dynamic excitation. The N-S component or
Centro earthquake chosen as a basic input motion. The record waswas
scaled for the pseudo-prototype using a length scale or1 = 1:4 and arand for the CA 510
= 1 :{i-:68' = 1: 2.77.
model using
For both the'r
structures, = 1.a The models were subjected to two time histories,r
consisting of 60% and 177% (shake table limitation) of the displacements
obtained from the 1940 El Centro record
To establish the dynamic elastic characteristics of the structure
free vibration tests Thewere performed prior to the shake table tests.
natural frequencies and damping values of the models are established from
the free vibration time record and from the mean spectral density func-
tion obtained from Fourier analysis of the record. The free vibration
tests repeated after the entire testing history to evaluate thewere
changes in the dynamic elastic characteristics of the structure
9.2
9.2.1 Elastic Tests -
free vibration tests for the pseudo-prototype and its model
yielded the following results (in the pseudo-prototype domain) :
203

9 True Replica HOdel Study or a Steel Structure
pseudo-prototype model
natural frequency 4.45 Hz. 4.60 Hz.
O.134J O.137~percent or critical damping
The slight discrepancy (3~) between the natural frequencies of the pseu-
do-prototype and the model is mainly attributed to the difference in
column stiffnesses due to the different height of the weld. A difference
of this order of magnitude may already some effect on the elastichave
response and makes directly overlaid time histories more difficult to
review.
Figure 9.3 shows the first 20 seconds of the shake table displace-
ment response to 60~ of the El Centro record scaled for the pseudo-proto-
type and the model and represented in the pseudo-prototype domain
Although the records are very close, some dissimilarities can be observed
at the peaks of the displacements, where the very small displacement
fluctuations are not reproduced at the model level. These dissimilari-
ties, which are caused by stiction problem at the shake table bearings
are a source of discrepancies in the response of the two test structures.
Figures 9.4 and 9.5 show a comparison of the story displacement and
acceleration response between the steel pseudo-prototype and the phosphor
bronze model. The plots represent the response to the 60J El Central
motion in the pseudo-prototype domain. {4For the time window shown
seconds in the pseudo-prototype domain, i.e., 8 seconds in the prototype
domain), the responses are rather similar except that the peak responses
are consistently larger, by a few percent, for the phosphor bronze model.
Considering that the two structur-es respond elastically and that the
measured damping is almost identical, this discrepancy must be attributed
primarily to problems in reproducing the input motion at the two model
204

Chapter 9 True Replica Model Study of a Steel Structure
~.00.0
\C.0 .0N.0
N.9
~
t!r
~.
9
.~ 00#'
.
9 .0N iQ)
"8
eQ)Nd0k
.0
k0
'8.m0
'8...III
a
ioS
g..i
f;..c
~
g-\D
~...
I~
~
I
!Co.
Q
.!.
.D.
104
j
.0-
f
!..
-~'08Qj~'-'
~~::~_.~~-~
-~
X
1-4
E-I
~ -~--
-=---
- -_:
,'IC=:
I I I I~~-~-I : .". II 0
s. . . . .0 0 0 0 0
S N.-4 .-4 NI I
J.N~W~:>V'ldSla
205
Q)~:t;-o0k~I0
-gQ)co~
Q)Q)co

Chapter 9 True Replica Model Study of a Steel Structure
in...~.'.'.'. ~
0.4w.
....M*MU-C..I.....~
A0.2:So
'" :.... . . . ..1\0. A' "(.~~~. '" 0.0o.
~-I
~
\.f i Yi -\:' . ,.'.. . .
. .
000.2~i~.
~"
"
.'
.'
0'f
>.'.'.'-.
~1
-0.4'"to. - - - - - pho8phor bronae model
8teel p8eudo -prototype
4.03.01.00.0 2.0(seconds)TIM E
Figure 9.4 Displacement Response or the Structures to 63J £1 Centro Motion
(Pseudo-Prototype Do~)
Figure 9.5 Acceleration Response or the Structures to 63~ El Centro Motion
(Pseudo-Prototype Do81n)
206

Chapter 9 True Replica Model Study or a Steel Structure
scales. This conclusion is substantiated further by larger discrepancies
in the respnoses in later stages of the motion (not shown in the figures)
which must have been caused by spurious signals in the shake table
motion.
9.2.2
Figure 9.6 presents the first 20 seconds of the shake table dlspla-
cement response to 177~ of' the El Centro record scaled for the steel
pseudo-prototype and phosphor bronze models. The discrepancies between
the two records are smaller than these observed in the lower amplitude
test (Fig. 9.3).
Figures 9.7 and 9.8 provide the comparison of the displacement and
acceleration responses of the pseudo-prototype and its model tor the
first four seconds in the pseudo-prototype domain. In the time domain,
the displacements compare well for the first three seconds while the ma-
ximum floor acceleration are in general lower for the inelastic cycles in
the phosphor bronze model. The differences in the response are more evi-
dent from Fig. 9.9 which shows the column shear vs. story displacement
response for the first four seconds. As was expected from the material
and component tests (Chapters 6 and 8) the yield strength of the phosphor
fatterbronze model is smaller and its hysteresis loops are than in the
steel structure. Nevertheless, the comparison of the column shear--story
displacement response is quite satisfactory as for the number of major
inelastic excursions and their force and displacement amplitudes
The low amplitude response after the first three seconds and the
subsequent inelastic response did, however, exhibit considerable discre-
207

Chapter 9 True Replica Model Study of a Steel Structure
Q.QN
C-.4
J.~..8
~
0.
an~
~
!g~s:
f..c:~
~MI:.-L~
i~..
0 .~
-G)'0~0C.JQIG)
'-'
~'x.H~
0
,.t.ofQ
~.D.!.oX
a
~0-
t
j..
0.In
0.0
.tN:iN:i~V'IclSla
208

Chapter 9 True Replica Hodel Study of . Steel Structure
0.0 1.0 3.0 4.0
TIKZ2.0
(..~da)
Figure 9.7 D1splao8Mnt Responae ot the Structures to 1771 11 Centro Motion
(Pseudo-Prototype DC8ift)
.
.A1.0 !!
A
:.~
.0..to-c-M 0.0.,MUU
v
~ ~v-1.0 f
v
0.0 1.0 3.0T I K I
Z.O
(Me-de)
Figure 9.8 Acceleration Response or the Structures to 177J £1 Centro Motion
(Pseudo-Prototype Do8iD)
209
~ - - - - pho.pbor bronse model
.teel p.eudo - prototype

Chapter 9 True Replica Hodel Study ot a Steel Structure
in.
0.0 ,0;0.50.5.1.0200
0.5 100
«
:5:con
z
~-'0u
lb0kM 0.0
-100
/;-0.5 .teel p.egdo - prototype
frIt, II
-20 -10 0 It 20-
MIl
- 'c DRIFTin.
-1.0 -0.5 0.0 0.5
-200
1.0
200
0.5100
~
~%VJ
ZX=--'0u
lb0kll 0.0
"/
-100-0.5
phosphor bronze model
-200-20 -10 0 10 20
l1l1I
Figgre 9.9 Shear-Displacement Response of One COlu.n to 177S El Centro Motion
(Approximately Firat Four Seconds or the Motion; Pseudo-Prototype Domain)
210

Chapter 9 True Replica Model Study of a Steel Structure
pancies. In part, these discrepancies must be attributed to the afore-
mentioned differences in the material behavior but, more likely, much of
the response difference is caused by difficulties in reproducing the
input IIK>tion at different model scales. This statement is supported by
the observation that similar response discrepancies did occur at similar
times in the elastic test.
In conclusion, this series of shake table tests demonstrated that
phosphor bronze is an adequate but not ideal material for models of steel
structures. Based on the results obtained within the first four seconds
of' the inelastic shake table test, it appears that good simulation ot
overall characteristics can be obtained from phosphor bronzeresponse
models. The major problem encountered in such models is the decrease in
yield strength in heat affected zones at weldments. A closer simulation
of the inelastic response can be expected when welding is not required or
when inelastic deformations occur in ~egions removed from weldments.
211

Chapter 10 Feasibility and Limitations or Hodel Studies in Earthquake Engineering
CHAPTER 10
FEASIBILITY AND LIMITATIONS OF HODEL TESTING
IN EARTHQUAKE ENGINEERING
The results of the study presented in this report and in the previ-
ous report by Hills et. al. (Ref. 58), together with research performed
by others permit an assessment of model analysis as a tool in earthquake
engineering
Tests carried out at Stanford and other places have demonstrated
that the dynamic response ot structural building systems (frames, shear
wall structures, etc. can be simulated quite accurately at model scales.
However, the quality of response prediction depends strongly on the accu-
racy of material simulation {particularly in reinforced concrete), sui-
table fabrication techniques that properly simulate initial and boundary
conditions, accuracy in simulating important details, reproducibility or
dynamic input (performance spectrum of earthquake simulator), resolution
or instrumentation system and speed of data acquisition system. It must
also be recognized that model tests not be feasible when damage ormay
failure is initiated by certain localized phenomena such as weld fracture
in steel structures or bond failure in reinforced concrete structures
Although no experience exists at this time, it appears quite feasi-
ble to incorporate realistic floor slab systems and nonstructural ele-
ments (partitions, walls, stair cases, elevator shafts, etc. in careful-
ly designed models. Hodel studies may also be utilized to study specific
problems in earthquake engineering, such as overturning and uplift, dyna-
mic instability and effects of stiffness and mass irregularities.
Experiments with true replica models (column 1 of Table 4.2) have
212

Chapter 10 Feasibility and Limitations of Hodel Testing in Earthquake Engineering
proven feasible for dynamic studies steel structures, using certainon
copper alloys which permit approximately a 1:2 scale ratio. Copper alloy
510 (a phosphor bronze) was found to be a suitable material which permits
satisfactory welding and, with appropriate heat treatment, reproduces wi-
thin certain limits the desired stress-strain properties. Experiments on
predict rathersimple welded models have shown that true replica models
accurately the maximum response. Welding in critical region poses a pro-
blem since the strength of phosphor bronze in the heat affected zone may
be reduced to a value less than that dictated by model similitude.
(EILead alloys which possess specific stiffnesses allowing soa-
ling in the order of 1:10 to 1:20 have been found in the initial study to
be of limited because or several undesirable material propertiesuse
(early nonlinearity, excessive damping, high creep).
Although the usefulness or a true replica copper alloy scale model
the scale limitation to a 1:2 ratio, the utilizationis debatable due to
a much smaller stiffness than steel, is ofof such an alloy, which has
much value when combined with artificial mass simulation since it permits
a significant reduction of the weights which have to be added to the mo-
2= E 1 ).r r(H This idea is particularly attractive for structures inr
Spacewhich the mass distribution along linear members is of importance.
trusses, transmission towers and antennas, long span and cable stayed
bridges can serve as an example of this type of structures.
Models with artificial mass simulation the obvious choice whenare
gravity effects cannot be neglected and prototype material is used in the
model. carried out at Stanford onA detailed shake table study has been
in. high 1:6 scale model (Ref. 58) of a steel frame prototype tested
previously at U.C. fromThe structural shapes were machinedBerkeley.
213

Chapter 10 Feasibility and Limitations of Hodel Testing in Earthquake Engineering
all primary frame connections were fully welded usingandA36 bar stock
Subsequent heat treatment of the finished modelthe TIG heliaro process.
performed to relieve initial stresses and to satisfy scaledframe was
The model structure was subjected toprototype construction tolerances.
the prototype input motions and the measured modelscaled versions of
the prototype domain forscaled back toresponse quantities were then
prototype response prediction.
between true prototypecomparison carried outA detailed was
This comparisonresponse and the response predicted from the model test.
done for strains, joint distortions, story displacements and accele-
rations and integrated energy terms (input energy vs. dissipated energy).
In all cases very good agreement was observed between model and prototype
differences between the results are attribu-test results. Some local
and an unavoid-table primarily to discrepancies in table input motions
able oversizing of welds in the model.
not only proved the possibility of reliable prediction ofThe study
prototype response with tests performed on small scale models, but also
effort involved in both thegave an insight into the relative cost and
major cost difference is in the size of the required tes-studies. The
very significant, a1-Also, the saving in material 1sting facilities.
the benefit or it is decreased by the rather high cost of custom-though
data acquisi-The cost of instrumentation and-made structural shapes.
prototype and model tests since the larger effort1s about equal1n
instrumentation for model tests is balancedin developing more sensitive
by its smaller size and the reduced cost of instrument support frames
models ofShake table experimentation on a variety of small scale
reinforced concrete structures, utilizing artificial mass simulation with
214

Chapter 10 Feasibility and Limitations of Model Testing in Earthquake Engineering
lumped masses of the floor levels, has been carried out for several years
(Refs. 46, 48).at the University of Illinois Although these model
structures did not simulate specific prototypes, they have resulted in a
wealth of detailed information the seismic of reinforcedon response
concrete structures. Much of the presented data in good agreementare
with mathematical models testsused for prototype structures. Other
(Ref. 23) have demonstrated that even localized crack patterns can be si-
mulated in small scale models. Strain rate effects in model concrete and
structural components were investigated in this study and are discussed
in Chapters 7 and 8
Discretely distributed additive masses, rather than lumped masses,
will be required in models of structures where mass distribution in space
1s of importance. This is the case in problems of frame-floor slab in-
teractlon, walls subjected to transverse excitations and in many towers
and antennas. Caution must be used in separating the added masses from
the structural material in such a way that they will not influence the
stiffness characteristics of the material.
Scale model investigations are of much interest for the verification
of the seismic safety and integrity of large man-made structures whose
failure would be of Components of nuclear reactorssevere consequences.
and containment vessels are appropriate examples. For the latter, the
gravity effects are often negligible compared to effects or internal
pressurization and severe ground motion. Thus, the modeling requirements
of column 3) of Table 4.3 may be utilized. In this case the major prob-
lem is in the reproduction of the scaled seismic input which requires an
earthquake simulator with high frequency reproducibility (since t = 1 )r r
and large dynamic force capacity (since ar = 1-1 )r . Piping systems can be
215

Chapter 10 Feasibilit"yand Limitations of Hodel Studies in Earthquake Engineering
through artificial mass simulation, by adding lumped tomodeled masses
reactor and discretely distributedot thethe structural components
masses to the piping system.
studies on bridge structures have been performed forDynamic model
more recently also on shake tables (Rer. 57). Because of thesome time,
effects, artificial mass simulation is usually re-importance of gravity
possible the use of model material of reducedquired. However, where
stiffness (E
the JOOdel.
simulated inin which strength properties were intentionally onlytest
anticipated while the design was simplified inregions where damage was
Clearly, this simplification must be done with due regardother regions.
to simulation of dynamic characteristics to transmit the effectsproper
condi-The simulation or boundaryto the regions of potential damage.
will often pose a significant problem and, when small scale modelstions
seismicthe pertinentbe difficult to reproduceused, it mayare
frequency range on conventional earthquake simulator.
the field of damThe need for model studies is well established in
Ideally, this requires the modeling of the dam (concrete orengineering.
embankment), the reservoir water and the geomechanical boundary condi-
Practical considerations make the use of water desirable as modeltions.
in turn requires model materials of very low stiffness andfluid which
for P = 1).r
for the dam (since E It is possible tostrength = 1= crr r rof concrete dams butdevelop suitable materials for small scale models
not for earth dams
table study ofNiwa and Clough (Ref. 192) have performed shakea
1:150 models of segments of arch and gravity dams.
216
They used mixturea


Chapter 10 Feasibility and Lim1 tations or Model Testing in Earthquake En~ineering
prediction.
One major problem requires consideration in all model studies
regardless of scale, namely the simulation of boundary conditions. In
dynamic model studies a proper simulation of boundary conditions may be
more essential than in staticeven model studies. Taking seismic
response studies on shake tables example, supporting the modelas an
structure rigidily on the table will not allow tor the rocking and
translational motion at the foundation-soil interface and for the energy
dissipation by hysteretic action and radiation ot waves in the supporting
medium. It is quite feasible to support model structures on a medium
that simulates these phenomena to various degrees (Ref.193). The largest
difficulty will be encountered in simulating wave radiation which depends
on the wave propagation and requires scaling otvelocity, v a
v for a true model. Since the stl~~ne8s o~ the sup-r
porting medium must be scaled in the same manner as the stiffness of
structural material (usually E = 1) this will necessitate very highardensity medium.
Within the limitations discussed in this chapter, it can be conclu-
ded that testing of small scale models of steel and reinforced concrete
structures can result in a reliable prediction or the overall response or
prototypes, provided that:
1) Similitude laws are satisfied in the design or the model, in the
choice ot the model material, and in the scaling of the input
motion.
2) Care is exercised in the fabrication of the model, in particular in
areas of special importance such as joints and weldments.
218

Chapter 10 Feasibility and Limitations of Hodel Testing 1n Earthquake En~1neer1ng
The testing facility is capable of precise reproduction of the pre-3)
is sensitive enough to monitorscribed motion, the instrumentation
acquisition system is capable orthe measured values, and the data
10-the output of the measuring devices withoutorregistration
troduotion or data distortions.
achieved inA simulation of localized failure modes becan
crack propagation of weldments).{e.g.,in othersoases but not
simulation of localized failure modes, theregarding thedoubts exist
be complemented with prototype component tests.model study should
response history of the component, as obtained from a shake table test of
history applied in theloadingthethe model structure, can serve as
prototype component test.
219

Chapter 11 Summary and Conclusions
CHAPTER 11
SUMMARY AND CONCLUSIONS
The major goal of this research project was to develop a methodology
for small scale modeling of structures in earthquake engineering studies,
and to evaluate the feasibility and limitations of model analysis in dy-
namic response studies.
Dimensional analysis can be utilized to derive similitude laws for
dynamic models. In studies involving material and/or geometric nonline-
arities, the simultaneous simulation of gravity and inertia effects poses
a major problem. If both effects have to be simulated fully, similitude
requires the use of model materials with specific stiffnesses (Elp which
proportion as the length.scale in the same An alternative, which per-
mits the use of prototype material for many practical cases, is provided
by adding lumped masses to the structure. beThese lumped masses must
structurally ineffective and should be distributed in a fashion that per-
mits adequate simulation of all important gravitational and~ :inertial ef-
fects. In linear elastic model studies and in other cases in which gra-
vity effects can be neglected, a different set of similitude laws can be
derived which permits the use of prototype materials without the addition
of lumped masses. The use o.t distorted models may provide acceptable
response predictions in some cases but necessitates either several model
studies at different scales considerable insight into-the physicalor
phenomena to permit an evaluation of the response distortion.
Adequate simulation of material properties was found to be the most
difficult and important aspect of small scale modeling. Similitude of
the monotonic stress-strain behavior alone is insufficient for dynamic
22()

Chapter 11 Summary and Conclusions
studies. Cyclicresponse response properties, strain andrate size
effects, damping characteristics and other time and temperature dependent
effects must be considered. Laboratory testing programs sui table for an
evaluation of these properties are proposed in this report and the test
facilities and instrumentation used in this study for a comprehensive ma-
terial testing program are discussed in detail.
Modeling of steel structures can be performed using either ferrous
or non-ferrous materials. Material tests on structural steel and copper
and lead alloys were performed as part or this study. Monotonic and cyc-
110 load tests were carried out as well as a series of strain rate tests.
The monotonic stress-strain curves o~ steel and annealed phosphor bronze
show a remarkable similarity. In the cyclic tests, phosphor bronze re-
veals a higher work hardening than structural steel. Considerably more
cycles are needed to obtain stable cycles in phosphor than inbronze
steel. Thus, the peak stress reached by phosphor bronze at a prescribed
strain amplitude depends strongly on the previous cyclic history, as
revealed by cyclic tests with various histories. This phenomenon occurs
also in structural steel, but to a much smaller degree. It is concluded
that in earthquake studies, where usually only a small number of cycles
extends into the inelastic range, this phenomenon should not have a major
effect on the model response unless the deformation history leads to a
very unsymmetric cyclic response
The strain rate tests revealed that an increase in strain rate leads
to an increase in the yield strength but has no noticeable effect on the
elastic and post-elastic stiffness properties of the monotonic stress-
-strain curve. Empirical curves and their analytical equations are deve-
loped which give the relationship between strain rate and yield strength
221

Chapter 11 Summary and Conclusions
Annealedfor A36 steel and annealed phosphor bronze. phosphor bronze
strain rate.considerably less sensitivity to the change in theshows
scale models made of phosphor bronze, this differenceHowever, in small
partly accounted tor by the increased strain rates duewill be at least
to the scaling of time.
For small-scale models of concrete structures, microconcrete offers
properties usingsimulation of concretepossibility of' olosethe a
or compressiveprototype-like material. It was found that a wide range
strengths and or tensile/compressive strength ratios can be achieved with
mix design praoti-appropriate mix proportioning. This report discusses
designs used inces and presents strength data for a large number of mix
this study and in model studies by other investigators.
close to 200 cylinder specimens wasinvolvingAn extensive study
to evaluate the stress-strain behavior ot various mixes ot mi-performed
croconcrete and the effect of strain rate on the compressive strength and
The tests were performed using a close cont-the stress-strain diagram.
thus allowing reduction of therol over the speed of platten movement,
having to account for the effect of relative stifrness8s ofda ta without
Average strain measurements werespecimen.the testing machine and the
Thetour clip extensometers developed tor this purpose.obtained from
strain rate study revealed that the relative magnitude or the strain rate
is essentially inde-effect on the compressive strength of microconcrete
It was found that the strainot the mterial.pendent of the strength
rate effect in microconcrete is of a similar magn1 tude as in prototype
A second order logarithmic equation for strain rate effect onconcrete.
the compressive strength of microconcrete is derived.
for model studies of reinforced concrete structuresReinforcement
222


Chapter 11 SUmlBry and Conclusions
amplitude show the importance or proper simulation or post-yield charac-
teristics of the reinforcement. The lack of strain hardening in the mo-
del reinforcement used in this study resulted in a faster strength de-
terioration in the model than in the prototype beam.
The tests with varying shear span to depth ratios have shown that
characteristicsresponse (load-dispacement hysteresis loops, crack
pattern) for various failure modes can be reproduced satisfactorily with
small scale models. The spacing of major cracks in flexure and in shear
1s somewhat larger in models than in prototypes, but the crack patterns
in critical regions of similar configurationare in both domains.
However, the lack or strain hardening in the model reinforcement has a
considerable effect on the size and on the distribution of cracks away
from the critical region.
Tests at various cycling frequencies were carried out to evaluate
the differences in the structural ot elementsresponse subjected to
pseudo-static and elements subjected to dynamic cycling histories. It
was found that the material strain rate effects have a relatively small
influence the component behavior.on However, the spalling out of the
crushed concrete is much smaller in high frequency tests, thus reducing
the strength deterioration as compared to pseudo-static tests. This
phenomenon affects the reliability of dynamic response prediction based
on the results of pseudo-static tests. The relatively small difference
The feasibility of simulation of the behavior of welded steel struc-
tural element with scale models made of' phosphor bronze studiedwas
through a series of tests of steel and annealed phosphor bronze canti-
224

Chapter 11 s.-ry and Conclua10D8
presents a majorThe large heat sensitivity of phosphorlevers. bronze
the yieldIn theseproblem in the welding heat affected zone. zones
reduced to a value less than thatstrength ot the base material bemay
However, this effect 1s counteracted byrequired by material similitude.
Thus, in the earlythe large work hardening of annealed phosphor bronze.
strengthinelastic cycles phosphor bronze cantilevers exhibited s_ller
Res-values but in the latter cycles rather similar loops were obtained.
ponse to cycling under different frequencies revealed a negligible dif~e-
steel andstatic and dynamic cycles for both structuralbetweenrence
Thus, the effects of material strain ratesannealed phosphor bronze. on
orthe structural response response or metal structures 1s shown to be
negligible importance in seismic response studies.
A shake table study of a s~ple steel pseudo-prototype structure and
was carried theannealed phosphor bronze model out to assess
phosphor to modelling of welded structures.applicability of' annealed
the simu-Within the limitations discussed in previous paragraph,the
lation or the inelastic response (story shear and displacement) was quite
It can be expected that results of similar quality will besatisfactory.
Thus, phosphor bronzeobtained with more complex model structures. mo-
dels can provide satisfactory simulation of overall response characteris-
tics but will result in distortions in the prediction or local stress-
-strain histories
sulllDarized as followsThe experience gained from this study can be
aspects of model research are a thorough knowledge ofThe mst important
and-.terlal much diligencemodeling theory, a comprehensive study,
patience in faithfully reproducing all pertinent details and oharaoteris-
or theof the prototype and, last but not least, the recognition

Chapter Summary and Conclusions
shortcomings and limitations of model research. It is an unfortunate
that very few inelastic dynamic response phenomena can be reproduced
"precisely" at model scales. True replica models require materials with
specific stiffnesses (E/p) which are much less than those of the proto-
type materials, but no two materials in nature are exactly alike. Arti-
ficial mass simulation permits the use of prototype material but introdu-
distortions in the force simulations. Thus, there 1s no ideal model
their- "dis-test but there are many adequate model tests, provided that
tortions" are recognized, evaluated and found to be acceptable. In order
to Bake this judgement, much experience in model research and a thorough
understanding of the physical phenomenon under study is needed. If a 1Do-
test is performed without due regard to its limitations, it may
easily lead to erroneous information and may discredit an otherwise quite
reliable experimental analysis technique.
226

References
REFERENCES
1.
2. Huller, R. K., Handbuch ~ Modellstatik, Springer Verlag, Berlin,Heidelberg, New York, 1971.
3.
4. "Models of Structures--RILEM Symposium," Bulletin RILEK, No. 12,1961.
5. Oberti, G., "Large Scale Hodel Testing of StructuresElastic Limit," ~l]._etin RILEH, No.7, July 1960.
Outside the
6. Rocha, M., "Structural Model Techniques--Some Recent Developments,"Chapter 16 in Stress Analysis, edited by O. C. Zienkiewicz and G.S. Holister, John Wiley and Sons Ltd., 1965.
7 Oberti, G. and Castoldi, A., "New Trends in Model Research on LargeStructures," ISHES Publication No. 53, Bergamo, Italy, 1977.
8. Oberti, G., "Model Contribution to the Design and Safety Control ofLarge Structures," ISMES Publication No. 89, Bergamo, Italy, 1977.
9. Litle, W. A. and Hansen, R. J., "Use of ModelsDesign," Journal ~ Boston Society Q.!: ~ Engrs.,2, April 1963.
in StructuralVol. 50, No.
10. Breen, J. E., "Fabrication and Tests o.fProceedings, ASCE, V. 94, ST 6, June 1968.
Structural Models,"
11.
12.
13. Proceedings of Symposium on "Models inCanadian Chapter of the ACI, Montreal, Oct.
Structural Engineering,"1972.
227

References
14. "Structural Concrete Models--A State-of-the-Art Report," compiledand edited by M. S. Mirza, Dept. of Civil Engineering, McGillUniversity, Montreal, Oct. 1972.
15. ACI Committee 444, "Models of Concrete Structures--State-of-the---Art," Report No. ACI 444R- 79, Concrete Intern~t_!.onal, Jan. 1979.
16. Brock, G., "Direct Models as an Aid to Reinforced Concrete Design,"~ineering 187, No. 4857, pp. 468,470, 1959.
11. Fumagalli, E., "The Use of Mbdels of Reinforced Concrete Struc-tures," Magazin of Concrete Resear_c- h, No. 12/35, 1960.
18. Harris, H. G., Sabnis, G. M. and White, R. H., "Small Scale DirectModels of Reinforced and Prestressed Concrete Structures," Dept.of Structural Engineering Report 326, Cornell University, Sept.1966.
Magura, D. D., "Structural Model Testing - Reinforced and Pres-tressed Mortar Beams," f£! Journal, Vol. 9, No.1, Jan. 1967.
Harris, H. G., Sabnis, G. M. and White, R. H.,mate-Strength Models for Concrete Structures,"SESA Annual Meeting, Oct. 1967.
"Small Scale Ulti-paper presented at
21. Mirza, M. S., "An Investigation of Combined Stresses in ReinforcedConcrete Beams," Thesis presented to McGill University in partialfUlfillment of the Ph.D. requirements, Montreal, Canada, 1967.
22. Sabnis, G. M. and White, R. N., "Behavior of Reinforced ConcreteFrames Under Cyclic Loads Using Small Scale Models," Journal 2r ~American ~o_n_crete Institute, Sept. 1969.
Chowdhury, A. H. and White, R. N., "Inelastic Behavior of SmallScale Reinforced Concrete Beam-Column Joints Under Severe ReversingLoads," Report No. 342, Department of Structural Engineering,Cornell University, Ithaca, New York, Oct. 1971.
White, R. N. and Chowdhury, A. H., "Behaviour of Multi-Storey Rein-forced Concrete Frames Subjected to Severe Reversing Loads,"Symposium on the Resistance and Ultimate Deformability ofStructures Acted on by Well Defined Repeated Loads, InternationalAssoc. for Bridge and Structural Engineering, Lisbon, 1973.
228

References
White, R. N., "Modeling Techniques for Reinforced Concrete Struc-tures," Department of Structural Engineering, Cornell University,Ithaca, New York, March 1976.
26. Chowdhury, A. H., White, R. N. and Scott, N. R.,Models for Reinforced Concrete Structures,"Vol. 20, No.1, Nov. 1976.
Harris, H. G. and Mushivitch, J. C., "StudySub-Assemblies - Validation of Small ScaleTechniques," Department of Civil Engineering,Oct. 1977.
of joints andDirect Modeling
Drexel University,
28. Godden, W. G., "Model Analysis and Design of Prestressed ConcreteNuclear Reactor Structures," Nuclear Engineering ~ Design,North-Holland Publishing Company, Amsterdam, 1969.
Bader, M. A., "Shear and Moment Transfer in Thick-Walled ReinforcedConcrete Cylinders," Ph.D. Dissertation, Stanford University,Stanford, California, Sept. 1980.
30. Becica, I. Y. and Harris, H. G., "Evaluation of Techniques in theModeling of Masonry Structures," Department of Ci vil Engineering,Structural Model Laboratory, Report No. M77-1, Drexel University,Philadelphia, June 1977.
Little, W. A., Foster, D. C., Oakes, D., Falcone, P. A., Reiner, R.B., "Structural Behavior of Small-Scale Models," Steel Research forConstruction, Bulletin No. 10, AISI, April 1968.
32. Ruge, A. C., "The Determination of Earthquake Stresses in ElasticStructures by Means of Models," Bulletin P.r Seismological SocietIQf America, Vol. 24, 1934.
Ruge, A. C., "Earthquake ResistanceTransaction ASCE, Vol. 103, 1938.
or Elevated Water-Tanks,"
34. "Vibration Research at Stanford University,"Seismological Society 2!: America, Vol. 19, No.1,
229

References
35. Jacobsen, L. S., "Dynamics ofProceedings, I Modelli NellaLincei, Rome, Italy, 1956.
Structural
Tecnica,Models
Academiain U.S.A.,"
Nazionale Dei
36. Antebi, J., Smith, H. D., Sharma, S. D., Harris, H. G., "Evaluationof Techniques for Constructing Model Structural Elements," ResearchReport R-62-15, Department of Civil Engineering, MassachusettsInstitute of Technology, May 1962.
31. Smith, H. D., Clark, R. P. and Mayor, R. P., "Evaluation of HodelTechniques for the Investigation of Structural Response to BlastLoads," Report No. R63-16, Massachusetts Institute of Technology,Feb. 1963.
38. Harris, H.G., Pahl, P. J. and Sharma, S. D., "Dynamic Studies ofStructures by Means of Models," Research Report R-63-23, Departmentof Civil Engineering, Massachusetts Institute of Technology, Sept.1962.
Harris, H. G., Schwindt, P.C., Taher, I., Werner, S. D., "Tech-niques and Materials in the Modeling of Reinforced Concrete Struc-tures Under Dynamic Loads," Research Report R63-24, Department ofCivil Engineering, Massachusetts Institute of Technology, Dec.1963.
Murphy, G. and Young, D. F., "A Study of the Use of Models toSimulate Dynamically Loaded Underground Structures," TDR 62-2, AirForce Special Weapon Center, 1962.
Young, D. F. and Murphy, G., "Dynamic Similitude ofStructures," Proceedings, ASCE, Vol. 90, EM3, June 1964.
Underground
Dobbs, N. and Cohen, E., "Model Techniques and Response Tests ofReinforced Concrete Structures Subjected to Blast Loads," ACI,~-~, Models for Concrete Structures, 1970. ---
43. Gran, J. K. and Bruce, J. R., "ScaleVertical Shelter Structures," ProjectMenlo Park, California, June 1979.
ModelingReport,
.Techniques for HISRI International,
44. Sozen, M. A., "Earthquake Simulation in the Laboratory," Preprintsof the NSF Workshop on Earthquake Resistant Reinforced ConcreteBuilding Construction, Berkeley, July 1977.
230

References
45. Otani, S. and Sozen, M. A., "Behavior of Multi-StoryConcrete Frames During Earthquakes," Civil EngineeringStructural Research Series No. 392, University ofUrbana, Nov. 1972.
ReinforcedStudies,
Illinois,
46. Otani, S. and Sozen, M. A., "Simulating Earthquake Tests of R/CFrames," Journal of the Structural Division, ASCE, Vol. 100, ST3,Proc. Paper 10435:- Mar. 1974.
47. Sozen, H. A., Aristozabal, J. D. and Lybas, Y. H., "Multi-StoryWalls Subjected to Simulated Earthquakes," Proceedings, 6th WorldConference on Earthquake Engineering, New Delhi, India, Jan. 1977.
4~. Aristozabal, J. D. and Sozen, M. A., "Behavior of Ten-StoryReinforced Concrete Walls Subjected to Earthquake Motions," CivilEngineering Studies, Structural Research Series No. 431,University of Illinois, Urbana, Oct. 1976.
49. Lybas, J. M., "Response of Reinforced Concrete Coupled-Wall Systemsto Earthquakes," Ph.D. Thesis submitted to the Graduate College,University of Illinois, Urbana, June 1977.
Chowdhury, A. H., and White, R. N., "Multi-Story Reinforced Con-crete Frames Under Simulated Seismic Loads", Vi~ratiQn of ConcreteStructures, ACI Special Publication SP-60, 1980.
51. Clough, R. W., Rea, D., Tang, D. and Watabe, M., "Earthquake Simu-lator Test for a Three Story Steel Frame Structure," Proceedings,5th World Conference on Earthquake Engineering, Vol. I, Rome,Italy, June 1973.
Clough, R. W. and Tang, D. T., "EarthquakeSteel Frame Structure, Vol. I: ExperimentalNo. 75-6, Berkeley, California, 1975.
Simulator Study of aResults, EERC Report
53. Clough, R. W. and Hidalgo, P., "Design of a Shaking Table Test fora Reinforced Concrete Frame Structure," Proceedings, 5th WorldConference on Earthquake Engineering, Vol. I, Rome, Italy, June,1973.
54. Hidalgo, P. and Clough, R. W.,Reinforced Concrete Frame,"California, 1974.
"Earthquake Simulator Study of aEERC Report No. 74-13, Berkeley,
231

References
Clough, R. W. and Huckelbridge, A. A., "Preliminary ExperimentalStudy of Seismic Uplift of a Steel Frame," EERC Report No. 77-22,Berkeley, California, 1977.
Clough, D. and Clough, R. W., "Earthquake Simulator Study of Cy-lindrical Liquid Storage Tanks," presented at the ASCE Annual Con-vention, San Francisco, October, 1977.
Williams, D. and Godden, W. G., "Experimental ModelSeismic Response of High Curved Overcrossings,"No. 76-18, Berkeley, California, 1976.
Studies onEERC Report
Hills, R. So, Krawinkler, H. and Gere, J. Mo, "Hodel Tests onEarthquake Simulators-Development and Implementation ofExperimental Procedures, Report ~.~, The John A. BlumeEarthquake Engineering Center, Department of Civil Engineering,Stanford University, Stanford, California, June, 1979.
Colloquium on "Use of Models and Scaling in Shock andASHE Winter Meeting, Philadelphia, Pennsylvania, Nov.
Vibration,"1963.
59.
the Symposium on Aeroelastic and Dynamic ModelingAir Force RTD-TDR-63-4197, Part I, 1964.
60. Proceedings ofTechnology, U.S.
Modeling1980.
61. Bannister, R. L. and Aneja, I. K., "Before-the-FactSolves Turbomachinery-Foundation Problems," Power, August,
Lauretta, E., "Dynamic Behavior of Large Structures Studied byMeans of Models," Prelim. Publication, 7th Congress, IABSE, Rio de
Janeiro, August, 1964.
63. Casto1di, A., "New Techniques of Model Investigation of the SeismicBehavior of Large Structures," presented at the ASCE NationalStructural Engineering Meeting, San Francisco, April 1973.
64. Oberti, G. and Lauretta, E., "Structural Models for the Study ofDam Earthquake Resistance," Transactions, 9th InternationalCongress on Large Dams, Vol. 4, 1967.
Oberti, G., "Development of Aseismic Design and Construction inItaly by Means of Research on Large Model Test," ~ PublicationNo.6, Bergamo, Italy, June 1957.
232

References
66. Oberti, G. and Lauretta, E., "Dynamic Tests on ModelsStructures," ~ Publication No. 19, Bergamo, Italy, June 1962
or
67. Lauretta, E., "Dynamic Features of a Recent Italian Arch Dam,"~ Publication No. 24, Bergamo, Italy, October 1964.
Lauretta, E., "Theoretical Considerations and Experimental Researchon the Behavior of Tall Buildings During Earthquakes," ~Publication No. 28, Bergamo, Italy, January 1965.
69. Oberti, G., "Results and Interpretation of Measurements Hade onLarge Dams of All Types, Including Earthquake Observations," ~Publication No. 29, Bergamo, Italy, Jan. 1965.
Oberti, G. and Lauretta, E.,Dam Earthquake Resistance,"Italy, ~ 1967.
"Structural ModelsISMES Publication
for theNo. 33,
Study ofBergamo,
Lauretta, E. and Castoldi, A.,Nuclear Reactor ContainmentItaly, 1968.
"DynamicBuilding,"
ModelsReport,
of PECBergamo ,
Tests onISHES
72. Castoldi, A., "New Techniques of Model Investigation of the SeismicBehavior of Large Structures," ISMES Publication No. 56, Bergamo,Italy, April 1973.
Castoldi, A. and Casirati, M., "Experimental TechniquesDynamic Analysis of Complex Structures," ~ PublicationBergamo, Italy, 1976.
for theNo. 74,
Baste11ani, A., Casto1di, A. and Ionita, H., "Numerical AnalysisCompared to Model Analysis for a Dam Subjected to Earthquakes,"ISMES Publication No. 83, Bergamo, Italy, Sept. 1976.
75. Baglietto, E., Casirati, M., Castoldi, A., Miranda, F. andSammartino, R., "Mathematical and Structural Models of Zarate-BrazoLargo Bridges," ISMES Publication No. 85, Bergamo, Italy, Sept.1976.
76. Borges, F. J. and Pereira, J., "Dynamic Model Studies for DesigningConcrete Structures,"!£!, ~-~, Models for Concrete Structures,1970.
233

References
Borges, J. F., "Dynamic StructuralReport, IABSE 7th Congress, 1964.
Studies Models," Finalon
18. Borges, F. J. and Ravara, A., "Structural Behavior of PanelStructures under Earthquake Actions," .Proceedings, RILEM Symposiumof the Effects of Repeated Loading of Materials and Structures,Mexico, 1966.
19. Bostjancic, J., "Model Materials Suitable for Dynamic Tests ofModels in the Plastic Range," Preprints, Vol. No.9, 6th WorldConference on Earthquake Engineering, New Dehl1, India, Jan. 1977.
80. Mihai, C., et a1., "On the Static and Seismic Behavior of a Struc-tural Mbde1 of an Industrial Storied Hall," Preprints, Vol. 9, 6thWorld Conference on Earthquake Engineering, New Deh1i, India, Jan.1977.
81. Barkov, Y. V. and Glina, Y. V., "Theoretical and ExperimentalInvestigations of Precast and Monolithic Frameless Buildings onLarge-Scale Reinforced Concrete Models," Proce~din5s, 5th WorldConference on Earthquake Engineering, Rome, Italy, June 1973.
82. Shaishmelashvili, V. N. and Edisherashvili, N. A., "ExperimentalStudies of Dynamic Characteristics of Multy-Story Steel FrameBuildings Large-Scale Models with Difference Vertical Bracings,"Preprints, 5th World Conference on Earthquake Engineering, Rome,Italy, June 1973.
83. Irwin, A. W., "Static and DynamicStructure," The Institution of CivilPaper No. 7486, April 1972.
Hodel Shear Wall
Proceedings, 51,Tests onEngineers,
a
Berriaud, C. and Tigeot, Y., "ParaseismicStructures," Closed~, 3, 6, 1973.
Testing or Model
Okada, H., Takeda, T., Yoshiaka, K., Omote, Y. and Nakagawa, K.,"Experiment and Research on the Response of Steel Model StructuresSubjected to Impact Horizontal Loading and to SimulatedEarthquakes, Proceeding~, 5th World Conference on EarthquakeEngineering, Rome, Italy, June 1973.
Kato, B. et. a1., "Dynamic Collapse Tests of Steel StructuralModels," Preprints, 5th World Conference on Earthquake Engineering,Rome, Italy, 1973.
234

References
Suzuki, T. et a1., "Experimental Study on PCRV-Support SructuresUnder Simulated Earthquake Motion," Preprints, 2nd InternationalConference on Structural Mechanics in Reactor Technology, Vol. 4.
88. Takeda, T. and Yamaguchi, T., "Dynamic Hodel Test and Analysis forPrestressed Concrete Containment Vessel," Report of the TechnicalResearch Institute, Ohbayashi-Gumi, Ltd., 6, Ohbayashi-Gumi, Ltd.,Tokyo, 1972.
89. Bridgman, P. W., Dimensional Analysis, Yale University Press, 1920,2nd Edition, 1931.
90. Murphy, G.,1950.
Similitude !a Engineering, Ronald Press, New York,
91. TheQ!:Y 2! Models, Wiley,
92. Huntley, H. E., Dimensional Analysis, McDonald, London,York, 1961.
Dover, New
Sedov, L. I.,TranslationYork, 1959.
94. Birkhoff, G., Hydrodynamics:! ~ ~ Logic,Similitude, Princeton University Press, 1950, 1960.
Fact and
95. Ipsen, D. C., Units, DimensionsMcGraw-Hill, NeWYOrk, 1960.
and
Hudson, D. E., "Scale-Model Principles,"V_~bration Handbook, McGraw-Hill, 1967.
27,Chapter Shock and-
Pankhurst, R. C., Dimensional Analysis ~~ Scale Factors, Reinhold,New York, 1964.
Skoglund, V. Y., Similitude, Theory ~ Applications, InternationalTextbook Company, 1967.
Buckingham, E.,1914.
"On Physically Similar Systems," ~. Review 4,
235

References
Rayleigh, Lord, "The Principles of Similitude," Nature 95,Preprint in Scientific Papers 6, Dover, New York, 1964.
1915,
Ashley, H., "General Considerations on Scaling," National Academy.2f Engineering Workshop.Q!! Simulation.2f Earthquake Effects .Q!!
Structures, Proceedings, San Francisco, Ca., Sept. 1973,
Goodier, J. N. and Thomson, W. T., "Application ofPrinciples to Structural Models," NACA, Technical NoteJuly 1944.
SimilarityNo. 933,
Rocha, H., "DimensionnementAnnales de 1'I.T.B.P., 1952.
Experimental des Constructions,"
Borges, J. F., "Statistical Theories of Structural Similitude,"RILEH international Colloquium on Models of Structures, Madrid,June 1959.
Beaujoint, N., "Similitude and Theory of Models," Bulletin RILEMNo.7, June 1960.
Fumaga11i, E., "Materials for Scale Models and Devices of Loading,"Bulletin RILEM No.8, Sept. 1960.
Roll, F., "Materials for StructuralVol 94, ST 6, June 1968.
Models," Proceedings, ASCE,
108. Mirza, M. S., White, R. N., Roll, F. and Batchelor,"Materials for Dircet and Indirect StructuralState-of-the-Art Report on Structural Concrete Models,M.S. Mirza, Department of Civil Engineering, McGillMontreal, October 1972.
B. de V.,
Models,"edited by
University,
Mirza, M.S., White, R. N., and Roll, F., "Materials forModels," Proceedings, ACI Symposium on Models ofStructures, Dallas, March 1972.
StructuralConcrete
110. Carpenter, J. E., Roll, F., and Zelman, M. I., "Techniques andMaterials for Structural Models," Models for Concrete Structure~,Special Publication No. 24, ACI, 1970.
Zelman, M. I., Heidebrecht, A. C., Tso, W. K. and Johnston, W. A.,"Practical Problems and Costs of Fabricating Multi-Story Models,"Models for Concr~te StructW'es, Special Publication No. 24, ACI,1970.
236

References
112. ModelingVol. 79,
Ferrito, J. M., "An Evaluation of the Accuracy of Material HodelRepresentation of Reinforced Concrete, " ~ ~ES~ Spring Meeting,Paper No. A-4, San Francisco, California, May 1973.
114. Fuss, D. S., "Mix Design for Small-Scale ModelsStructures," Technical Report ~, Naval CivilLaboratory, Port Hueneme, California, Feb. 1968.
of ConcreteEngineering
Johnson, R. P., "Strength Tests on Scaled-Down Concretes Suitablefor Mbdels, With a Note on Mix Design," ~gazine of Con~re_teResearch, Vol. 14, No. 40, March 1962.
Tsui, S. H. and ~rza, M. S., "ModelStructural Concrete Series, No. 23, McGillNovember 1969.
Hicroconcrete
Un1ver1sty,Mixes,"
Montreal,
Burgrabe, A. H., "Hikrobeton fuer Hode11statische Untersuchungen,"Berichte des Institutes fuer Hode11statik der UniversitaetStuttgart, Heft Mr. 1, 1972.
Maisel, E., "HikrobetonBerichte des institutesStuttgart, 1979.
fuerfuer
modelstatische Untersuchungen II,"Hodellstatik der Universitaet
Steffens, K., "Entwicklung eines Kunstharzmoertels zur Nachbildungdes Werkstoffes Beton bet Hodellversuchen fuer Stahlbeton-tragwerke," Lehrstuhl fuer Hassivbau, TU Hannover.
120. Sabnis, G. M. and White, R. N., "A Gypsum MortarMode1s,"!Q! Journal, Vol. 64, No. 11, Nove. 1976.
tor Small-Scale
Gypsum Mortars,"White, R. N. and Sabnis, G. H., "Size Effects inJournal of Materials, V. 3, No.1, March 1968.
122. Ferrito, J., "Dynamic Tests of Model Concrete."R-650, Naval Civil Engineering Laboratory,California, Nov. 1969.
TechnicalPort
ReportHueneme,
237

References
Sabnis, G. M., Mirza, S. M., "Size Effects in Model Concretes?,"ASCE Journ~l of the Structural Division, June 1979.
123.
Litle, W. A. and Paparoni, M., "Size Effects in Small-Scale Modelsof Reinforced Concrete Beams," ACI Journal, Vol. 63, No. 11,Nov. 1966. -~-
Wang, P. T., Shah, S. P. and Norman, A. E., "Stress-Strain Curvesof Normal and Lightweight Concrete in Compression," !£! Journal,Proceedings, Vol. 75, No. 11, Title No. 75-62, Nov. 1978,
pp.603-611.
125.
Brock, G., "Concrete: Complete Stress-Strain Curves," En~ineering(London), Vol. 133, No. 5011, May 1962, p. 602.
126.
Barnard, P. R., "Researches into the Complete Stress-Strain Curvefor Concrete," Magazine of 9~ncrete Research, (London), Vol. 16,No. 49, Dec. 1969, pp. 203-210.
Strain RateMo. 5557,
ConstantVol. 214,
"Stiff(London)t
Turner, P. W. and P. R. Barnard ,
Testing Machine," !h! EngineerJuly 1962, pp. 146-148.
"Strength and CompleteConcrete Tested in Uniaxial
Conditions," Materials and(Paris), Vol. 5, No. "3O,'
Sangha, C. H. and Dhir, R. K.,Stress-Strain" Relationships forCompression Onder Different TestStructure~/Research !!!£ TestingNov.-Dec. 1972, pp. 361-370.
Popovics, S. and Sandor, "A Review of Stress-Strain Relationshipfor Concrete," ACI Journal, Proceedings, Vol. 67, No.3, Mar. 1970,pp. 2113-2118. - -
130.
Kaar, P. H., Hanson, N. W. and Capell, H. T., "Stress-StrainCharacteristic or High Strength Concrete," Douglas McHenryInternational Symposium on Concrete and Concrete Structures, Sp-55,ACI, Detroit, 1978, pp. 161-185.
131.
Sinha, B. P., Gerstle, K. H. and Tulin, L. G., "Stress-Strain Rela-tions tor Concrete Under Cyclic Loading," ACI Journal, Vol. 61,No.2, Feb. 1964. -
132.
238

References
Ramsley, D. and McHenry, D., "Stress-Strain Curves forStrained Beyond the Ultimate Load," Laboratory ReportU.S. Interior Department, Bureau of Reclamation,March 1947.
ConcreteNo. SP-12,
Denver,
Hughes, B. P. and Chapman, G. P., "The complete Stress-Strain Curvefor Concrete in Direct Tension," Bulletin RILEH, No. 30,March 1966.
Rusch, H., "Physikalische Fragen der Betonpruefung,"-~, Vol. 12, No.1, 1959.
Zement - Kalk
Rusch, H.,StructuralJuly 1972.
"Research Toward a General Flexural Theory forConcrete,"!£! Journal, Proceedings, Vol. 32, No.1,
Raphael, J. M., "Big Tujunga DamConcrete in Dam," Structural ResearchCalifornia, Berkeley, June 1975.
Strength andLaboratory,
ElasticityUniversity
oror
Raphael, J. M., "The Nature of Mass ConcreteMcHenry International Symposium on ConcreteStructures, ill Publication ~-.22, Detroi t , 1978.
in Dams, It Douglasand Concrete
139. " Recomended Practice for Evaluation of Compression Test Results of
Concrete," !Q! Committee~, ACI, Detroit, 1965.
Mirza, S. A., Hatzinikolas, M. and MacGreor, J. G., "StatisticalDescription of Strength of Concrete," Journal 2r ~ Structural Di-vision~, June 1979.
141. Jones, P. G. and Richart, F. E., "The Effect of Testing Speed onStrength and Elastical Properties of Concrete," ProQeedings~,Vol. 36, Part II, 1936, pp. 380-391.
Hatano, T. and Tsutsumi, H., "Dynamic Compression and Failure ofConcrete Under Earthquake Load," Technical Report £-22Qi, TechnicalLaboratory of the Central Research Institute of the Electric PowerIndustry, Tokyo, Sept. 1959.
143. 1, 3rd Ed., AppliedOrchard, D. F., "Concrete Technology," Vol.Science Publishers Ltd., June 1979.
239

References
144.
Staffier, S. R. and Sozen, M. A., "Effect of Strain Rate on YieldStress of Model Reinforcement," University of Illinois, CivilEngineering Studies, Structural Research Series No. 415, Urbana,
February 1975.
Sabnis, G. M. and White, R. H., "Small Scale Models ot ConcreteStructures Subjected to Dynamic Loads," Preprints, 6th WorldConference on Earthquake Engineering, Vol. 9, Hew Delhi, India,
Jan. 1977.
Frames toNo. 108,
Hayerjak, R. J., "A Study of the Resistance of ModelDynamic Lateral Load," University of Illinois Publication
Aug. 1955.
150.
151.
Strain and Temperature on. !p;plie~ ~chanic~, Dec.152. 2!.
153.
Test of Mild Steel,"TensionRichards, c. W., "Size Effect in the
~oceedings, ASTM, 1954.154.
240
191tj:.
No.7, Paris, June 19bO.

References
Richards, C. W., "Effect or Size on theBeams," Proceedings, ASTH, 1958.
Yielding of Mild Steel
Zohrei, H., "Cyclic Stress-Strain Behavior of A36Engineering Thesis, Civil Engineering Department,University, Stanford, California, Dec. 1978.
Steel,"Stanford
Hayden, H. W., Moffatt, W. G. and Wulff, J., ~Properties .2f. Materials, Vol. III, "MechanicalWilley & Sons, Inc. New York, London, Sydney, 1965
158. Dove, R. C. and Adams, P. H.,Motion Measurement, CharlesOhio, 1964.
Sabnis, G. M., "Instrumentation in Structural Models,.State-=-of-the-Art Report on Structural Concrete Models, edited byM. S. Mirza, Department of Civil Engineering, McGill University,Montreal, Oct. 1972.
160. Mills, R. S. and Krawinkler, H., "The Use of Minicomputers for Con-trol and Data Handling in Dynamic Tests," Proceedings, Internatio-nal Instrument Society of America, Anaheim, California, May 1979.
Selander, C. E. and Carpenter, L. R., "Application or theMinicomputer in Measurement, Analysis and Control or StructuralTesting by BUREC," Preprint No. 295O, ASCE Convention, SanFrancisco, Oct. 1977 .
Ives, K. D., "Considerations tor Instrumentation ot Typical DynamicTests," Experimental Mechanics, 13, May 1973.
163. "Earthquake Environment Simulation," Final Report and Proceedingsof a Workshop on Simulation of Earthquake Effects on Structures, inSan Francisco, Sept. 1973, published by National Academy ofEngineering, 1974.
164. Penzien, J. Bouwkamp, J. G., Clough, R. W. and Rea, D.,"Feasibility Study of Large-Scale Earthquake Facility," EERC ReportNo. 67-1, Berkeley, California, 1967.
165. Stephen, R. H., Bouwkamp, J. G., Clough, R. W. and Penzien, J.,"Structural Dynamics Testing Facilities at the University ofCalifornia, Berkeley," EERC Report No. 69-8, Berkeley, California,1969.
241

References
Rea, D. and Penzien, J., "Dynamic Response or a 20 x 20-rt ShakingTable," Paper No. 180, Proceedings, 5th World Conrerence onEarthquake Engineering, Rome, Italy, June 1973.
Takahashi, Y., Rea, D. and Abedi-Hayati, S., "Effects ofSpecimen Reaction Loads of Shaking Tables," Preprints, 5thConference on Earthquake Engineering, Rome, Italy, June 1973.
TestWorld
Lauretta, E. and Castoldi, A., "Earthquake Simulation by a ShakeTable," 4th World Conference on Earthquake Engineering, Santiago,Chile, 1969.
Tsutsumi, H., "Vibration Research in CRISPI by Means ot ShakingTable, Some Recent Earthquake Engineering Research and Practice inJapan, Japanese National Committee, International Assn. tor
Earthquake Engineering, Tokyo, May 1973.
170. Particular
Damping,Lazan, B. J., "Energy Dissipation in Structures, withReference to Material Dumping," Colloquium on StructuralASHE, Atlantic City, N.Y., Dec. 1959.
111. Sherby, O. D., "Anelastic Properties of Solids," DepartmentMaterial Science, Stanford University, California, 1973.
or
Manual .Q!l ~ ,9%018 Fatigue Testing, ASTH STP 465, ASTM, 1969.
173. Richards, C. W., EngineeringBelmont, California,1961.~
Material Brooks/Cole,Science,
174. Jacobsen, L. S., "Damping in Composite Structures," Proceedings,2nd World Conference on Earthquake Engineering, Tokyo, Japal1,1-960.
175. Internal Friction, Damping, and Cyclic Plasticity, ""InternalFriction, Damping, and Cyclic Plasticity," ASTH Symposium, Chicago,June 1964, Special Technical Publication No. 378, ASTH, 1964.
176. Kircher, C. A., "Ambient and Forced Vibration Analysis or FullScale Structures," John A. Blume Earthquake Engineering CenterReport No. 27, Stanford University, No. 1977.
177. ~ Metals Handbook, Vol. 1, ASH, 1973.
242

References
!!!2r ~igest, Engineering Alloys Digest, Inc., Upper Montclair, New
Jersey.
"Standards Handbook, Wrought Copper and Copper Alloy Mill Products,Part 2--Alloy Data," Copper Development Association Inc., N.Y.,1973.
Institute ofMassachusettsCrandall, S., ed., Random Vibrations,Technology Press, 1958. --
~ SpectralNewland, D., ~Analysis, Longman,1975.
of ArtificialDiv., Vol. 90, ~1,
Housner, G. and P. Jennings, "GenerationEarthquakes," Proceedings, ASCE, Engr. Mech.
Feb. 1964.
Histories and ResponseDiY., Vol. 100, EM4,
Scanlan, R. and Sachs, K., "Earthquake TimeSpectra," Proceedings, ASCE, Engr. Mech.
Aug. 1974.
Matins for Design Purposes,"Div., Vol. 98, EH2, April 1972.
Tsai, H., "Spectrum--Compatible~oceedings, ASCE, Engr. Mech.
184.
Steel FrameNo. 75-36,
Tang. D. T., "Earthquake Simulator Study of aStructure," Vol. II: "Analytical Results," EERC ReportUniversity of California, Berkeley, California, 1975.
Popov, E. P., Bertero, V. V. and Krawinkler, H., "Cyclic Behaviorof Three R. C. Flexural Members with High Shear," Report~. EERQ1£-2, Earthquake Engineering Research Center, CollegeEngineering, University of California, Berkeley, California,
1972.
ofOct.
14, "Concrete and Mineral187.
Aggregates"
Popovics, S., "A Numerical ApproachCurve of Concrete", University of~search, Vol. 3, 1973.
188.
243

Rererences
Pirotin, S. D. and East, G. H. Jr., "Large Deflections, Elastic--Plastic Response of Piping: Experiment, Analysis andApplication", Transactions of the 4th International Conference onStructural Mechanics in Reactor Technology, vol. F, Paper F3/1, SanFrancisco, California, 1977.
!!!.
Almuti, A. M., "Post-Elastic Response or Mild Steel Beams to Staticand Dynamic Loading", University or Michigan, Civil EngineeringDepartment.
Niwa, A. and Clough, R. W., "Shaking Table Research on Concrete DamModels", EERC Report No. 80-05, University of California, Berkeley,California, Sept. 1980.
Kinoshita, K. and Kushida H., "Experimental Study on VibrationalCharacteristics of The Structures with Embeded Foundations",Proceedings, 5th World Conference on Earthquake Engineering, Rome,Italy, June 1973.
244

Append1x A
APPENDIX A
CONTROL OF MICROCONCRETE STRENGTH PROPERTIES
This appendix presents a summary of results of an experimental study
throughcontrolledwhose strength propertiesmicroconcretes wereon
additives, and through aggregatechemicaldifferent mix ingredients,
The studyresulting in smooth and moisture sealed aggregate.treatment
the results are reproduced was performed at the Institute torfrom which
118) .Model Mechanics at the University of Stuttgart, W. Germany (Ref.
The results are ordered withThe summary is presented in Table 1.2.
compressive stength f' for each specimen age. The compressivec
obtained from tests on erismatic specimens and the tensile
declining
strength 1e
The modulus of elasticity is1s obtained from flexural tests.strength
based on initial specimen stiffness.
Each specimen series is characterized by code designations providing
ingredients, andage, mix proportions,information the specimenon
The key to the code is given in Table A.1, and theaggregate treatment.
0~(/)(/)
~w0~zwu~~~
SIEVE APERTURES mm
Figure 1.1 Sie.e Lines ot aggrecates Used
245

Appendix A
Table A.1
Note:1) Aggregate/Cement Ratio is constant for all the specimens
and equals A/C = 22) The largest aggregate size is 2 mm unless specified differently3) Compression tests were performed on prismatic specimens of
width to height ratio of 1:44) Tensile strength was obtained from bending tests5) Aggregate sieve lines are given in Fig. A.1 and are identified
in code designation C6) The code key consists of code designations ABCDE
CodeDesignation
A
(days)Age of Tested Specimens
7142128424768
123456a6b
W/C RatioCode
DesignationB
0.550.600.650.700.750.500.610.67
123456a6b60
CodeDesignation
CAggrega te Type
2345
6a
6b
SandLight aggregate (inflated shist) not sievedLight aggregate; sieve lines 2 and 3aLight aggregate (fraction 1), sand (frs. 2,3,4)Light aggregate (fr. 1), sand (frs. 2,3),river sand (fr. 4)No frs. 1 and 2, sand or mixture of light aggregateand sand (fr. 3), sand or light aggregate (fr. 4)Light aggregate (fr. 1), light aggregate or
sand (fr. 2), sand (frs. 3,4)Light aggregate (frs. 1-4), sand (fr. 5; 2-3 mm)
60
246

Appendix
ContinuationTable A.
CodeDesignation
CAggregate Type
6d6e
6t
Sand (frs. 1,2), light aggregate (frs. 3,4)Light aggregate (fr.1), blast furnace clincker
(frs.2,3,4)Light aggregate (frs. 1,2), light aggregate or blastfurnace clincker (fr. 3), blast furnace clincker (fr. 4)
CodeDesignation
DAggregate Treatement
016a6b
+ 108.4 g/kg cementNon-treatedCoated with silicon resin solutionAs 1 but with 216.8 g/kg cementAs 1 but with 54.2 g/kg cement
CodeDesignation
ECement type, additives
0 Portland cement, no additivesHydro-cement, no additivesHydro-cement with air entrainment:2
2a2b202d2e2t
92 mm3/kg cement110 1!ID~/kg cement115 D113/kg cement
130 1IID3/kg cement
55 mm3/kg cement
30 mm /kg cement
with a minimal amount of oil coatingon aggregate fractions 2,3,4 :
55 mm3/kg cement80 mm3/kg cement
2g2h3IIlIalibIIclid5
Hydro-cement with retarderHydro-cement with workability i~prOVing additives
50 mm liguefier Ikg cement70 mm~ liquefier Ikg cement90 mm liquefier Ikg cement
110 mm3 liquefier Ikg cement
With oil coated aggregate
+ resin used for impregnation of concrete formework;in W. Germany known under the commercial name of Pluvoil
247


Appendix A
249

Appendix B
APPENDIX B
HYSTERESIS LOOPS OF REINFORCED MICROCONCRETE BEAMS
This appendix presents load-displacement and moment-average curva-
ture response curves of beams tested in the study of the cycling frequen-
oy effeots (Section 8.2.6).
Table B.1 summarizes the results ot this study in terms or relative
The load valuepeak load at each cycle tor each ot the specimens tested.
used for normalizing of the results was taken as the average peak load of
ot the beams tested at a frequency of 2 Hzthe first excurssion
and curvatures are the averagenormalizing values tor the displaoements
of the peak values for all the beams at the first amplitude. The speci-
identified in the table and in the tigures by a set ot threemens are
digits, the first of which denotes the testing frequency (0.0025 Hz,
10 Hz),and the second denotes the specimen number at a frequency,
the third the beam number in the specimen.
250

-.~~.-4
~
~
.
.
~~
i.I.
-=..
'iN
......~Ii;'0
i
~w
~
gw
i'"..
J0t1
g
':.J.;
I'"~
~
~
~..
p;
...
~004~5
I
~ .~i~t.) .~O~ZrI)
. .
ef
I=~,
B£
=a.,
.;Po~Q
~~
~'"
;;'"
~...
""
..
;:.
~
~..
I
;:...
t..
~
;:,
~
fr.
D;o
.-.-
~ ~ 2:0 G\ ~
. . .- ~
.0 I'-I'- It\~ C:
-N..~
.. \0t- .. ~t- ~ ~. . ,
~ ;: 'II :.to: co. ~ ~
~
-eto:
ca-
t-;
~0
~~
00
c;0
-.-
~-
~.(\I
N.-.
U\-~
MO-O-In ~ ~ ~ ~
, , .
.. V\ -t- 00 mt- t- t-
~ §
...\Q'D;
000
~0
.N.
&t\ 0\- ~0\ e
, .
0 .0m 00- 0-. .
~~
~'"'
000.0
C0'
~
~~
~~.,..
"' I "'\G '" ~'"
0: ~O;
~a>.
f":N
e.
~oGt- .
It\0
~
Go~
to::
- - N - 1 fW\O fW\ N oc fW\ OCIt\
0: e ~ ~ eo
w::.
~:o:>w
QzC .~t;
#.
g~
\0N'-0\0
..,e-':1~
~Il\0..t-O
NIO1--=0. ,
".0
~~
II\~
~8;
~8. ....
NN
~S;
~~0
lSl
V\c0:
;.~
.-.N
R;0.
0-0.-
0-.0-0-II' C"\ \Q II'O-O-~~. . ,
~~
0'.-0
t- ~ t-... 0 t-0\ 0\ ~- .
r- 0# .r- c
~ ~ 20\ 0\ 0;. .
\D\Dco.
,1; ~~ ~
-.C\4
..0:
..~~,
#' ~ 0,.., 0 0\0\ 0\ ~. .
N....
0\ In0 ~0 0\
. .~
0- V\V\ 0-0- ~. -
~
0- \Q- to.
~ ~
to. 0In In~ ~
N
.~N
~~
\D-~
'"to-
~
C\I.'"
~
M-.~
\Da-m
N
~
~I~~
-to-o:
In
~
~
.-&
In..~
19\.0to;
"' I ~O ;' ::~
Oln.In0\0, .
-=-fO'\~-0\0. .
00-
o:~
t- In "' I . ~-t-lne0\ e e e
. . '"
NV\O\N~O, .
~:I~ .-<>>k3
~~-< .~~
11\0\ 1 '" o. ~
0\0 ~
NOO.~O
0\0\000\0
~~
..~
~~
~-.
-.
,.,
\1\
~
InN~
-~ N~ ~
M t-o- ...~ 0'.
, .
-~
=e,
-~
0-N~
0\ .c 0N C"1 .-0 0 0
. . .- ~
0\ ~ 00 0 ..0\ 0\ 0
. . ...
...00\
..0~
~
~N
~...
to. ...., N
~ ~- ~
-It\0:
~ t-o ~0\ ~, .
f'" 11\ ..= - == ~ =, , ,
\Q\Q
cc,
-D-D
~
~~
t- ~ t-- m -~ ~ ~
ff'\
.-0:
.~f".
N
~~
.....Q\.
-e~
oD 0\Il' ~0\ ~. -
.., .., I N" 0 .. "'..,
0\ ~ ~O. , ..
~0:
~...,
-0.~
~~
0-\D0-
...I¥\
~
1- 1 0.00 - 0.-~ ID.~
~0:
-f"\~
~-0.
'"'~
V\-~
~~>>M
&1ZC .M'"~,!11
N-~~.-
OV\#N0\0
~
I;~0\0. .
\01\:~N~C
om0\0
~.g;~
~-~~
...~
~8. .
ON
~~
1-.0
~o.
'"
!e>-~c
..-N
--
~0
Z
.Z
Q.
zoX
~~
Z'0
IM0
an
~z~ot)c-ot)..,
.
#
.~f
'"I0';c-'"N
0.Z..
AJ)pend1x B

Appendix B
~C\I~Q..°
~~tJ0
-J
"t)q"
.~~
~0
~
1.0 -...:x:;~«\10
~
--
~E:~~~"-'"'t)E:~
~
0.0\
'-
"'\, .'1
~
\..11- ;:I'~~
-f:--""'"
f-.'} CYCN .,.- - - Z"H DiJploc.w
~r~ ~-/.0
I I II I ~ It I t I
5 0 5
Normalized Average Curvature
Figure B.1 Moralized Load-Displace_nt aoo MoMnt Curvature Response or Beam Tested
ul.der Freq...enay 0.0025 Hz (Spec18n 1. 1. 1 )
252
-2.0 - ".0 0.0 1.0 2.0

Appendix B
I===~s~! ~ d1.0
p~C\I~Q..a
~~t)()
..,J
"t)'"
.~-t)
~()
~
I-s' } Cycle at 0 - - - ""ad Disploc--'
.- - - - -.J-rd A,.",'N*/.0
2.0-2.0 - ".0 0.0 f.ONormalize.d Displacement cJ/ cJ:v.
i~~ ~3rpf.O
~--=== ~~
:x:~(\10
~/'
,~
0.0
1.0- I-at } c,c,..,. - - - 2-84 Dis,,---
. - - - - - .t-rd A8pi1"fwft
..1 ~INormalized Average Curvature "fV ~Qv.
Figure B.2 Nor8B11zed Load-Displacement and Moment Curvature Response of Beam Tested
under Frequency 0.0025 Hz (Specimen 1.1.2)
253
o.0
-c:Q)E
~~Q).-~0
E.

Appendix B
~:=~~~~ t ~ d/.0
p
--I;-
~C\I~QO
~;
~~
~t:J0
-J
~Q./.~-t:J
~0
~
-1.0- - '-a'} CY~1e at.- - - 2"M Ojs,,--'
",",I A.j~
L L- I I I - ~ - I ~ I,.. 1_-;I;; J
-2.0 -".0 0.0 1.0 2.0Normalized Displacement d/ cr:v.
~ " "cJ
' I
4)..QUP1.0...:r:.>,<\10
~
~
-c:;QJE
~
~"-~0E.,
~
0.0
I-sf- - - 2-.d.t-rd-1.0
C1CM ., 0
OisplOc.-tA.,,'Iwde
l~ilt~t I I~5 0 5
...t .b.. I~ 'f.1av;
FigUre B.3 Normalized Load-Displacement and Moment Curvature Response or Beam Tested
under Frequency 0.0025 Hz (SpeciBen 1.2.1)
254
/;;'
o.0

Appendix B
jcf,i:=:~s3itL-
.--~
"
""I
,(,...~ 4
If ".I~ ,~I/'.
L,.,...
- /.0 '-at }c,c,. 8f.. - - - D;s,'.~Jo..- ~
I I I I I : I I I IJ-2.0 - ".0 0.0 1.0 2.0
Normalized Displac,ement cr/ cf:v.
1.0...:t:;~C\I~
~
"
~
!1J1
0.0
Normalized Average Curvature
Figure B.4 Normalized Load-Displace88nt and Ho8ent Curvature Response of Be.. Tested
under Frequency 0.0025 Hz (Spec188n 1.2.2)
255
,--.I- - - - -It'

Appendix B
I===~s~ ! ~ cf ~
::; "
,--- v:
«,',.
p
~
-,,,
'1/1/
,.I
...
-,"
--
~
----~ - -'-.' } CI~"". - - - ~.I DI",-,--,
-,",I A~
l-1 I 1 I ~ - I .1- I ~I ;:~
-2.0 - f.O 0.0 1.0 2.0Normalized Displacement cJ/ cJ:v.
1.0 --~C\I~
~
~
i- - - - -'-
::1-~E:
~"'t>
~"---0
e
~
0.0
ff ,,' /,./,
~
- 1.0
-
5 0 5
Normalized Average Curvarure
Flsure 8.5 Mormalized Load-DlsplaC888nt and Ho88nt CurYature Response ot 98.. Tested
under Frequency 2 HZ (gp.c18eD 2.1.1)
256
, 11
-J;7/

Appendix B
~:~~~3 t ~ cfI"~C-':=-=Z
/]1.0
p
~
~C\I~~
~
-1,1-...
~tJQ
...J
"t)QJ
.~-tJ
~Q
~
//
'"'t /'~,"/t=: - .- -e,
- '-st
---2-"
~rd- /.0Cyc" 0' 0Oi$"OC--'A,.,'i~
L-__L I 1 I _&- I ~I" I-;;~ J-2.0 -foO 0.0 f.O 2.0
Normalized Displacement d/ d:v.
/M
t.O-4j.qzt. p
~...~>'C\lC)
~
--"/'--,
~QJE
~
~
~'---t)
E~
0.0
Cycl~ at GOisplGC--'A,.plifu.
'-at- - - Z-.d,J-,d1.0
~ T
Normalized Average Curvature
Figure B.6 lor8alized Load-Displacement and Moment CUrvature Response of Beam Tested
under Frequency 2 Hz (Specimen 2.1.2)
251
o.0

Appendix B
1.0...:x:~<\10
~
~~~"'tJ
~'--..;;0E
~~
0.0
- /.0
Normalized Average Curvature
Figure B.7 Mo1'811zed Load-Displace_nt and MoMnt Curvature Reaponse or Be- Tested
under Frequency 2 Hz (Speo1-.n 2.2.1)
258
-2.0 -".0 0.0 1.0 2.0

Appendix B
1==:~~s3 ! ~ cJ1.0 ~ ~ry-- -- - - .
- .
-; .p~
C\I~Qt»
~
~
-~t)0
-J"tJQJ
.~~
~0
~
"'1'/
./-.".
4---=~- /.0
Normalized Displacement d/ d~v.
/~
1.0-~- -il
'., ""1, I,
",II/
',/--
4~ pN
:C;>,C\lc
~
~
~
-~
~
~q,E
~"t:J
~.-"0E,
~
0.0
',1 - -
.il --1'- - -- #.0 '-.st}Cyele of.
.- - - Z-.d Oi - - - - - - ~rd A8PiJlwde
5 () 5
Normalized Average CurvatureFigure B.8 Moralized Load-Dlsplaoe_nt and Ho_nt Curvature Response of Beall Tested
under Freqdency 2 Hz (Specimen 2.2.2)
259
0.,0
""/
I-st }C,eM ., 0- - - 2-.d Olsploc--'. - - - - - .5-rd Aap/,-w.
L- 1 I 1 I. I .1- I _1_--1
-2..0 -f.O 0.0 1.0 2.0

Appendix B
~
J:=:~~~:3 ! ~ cf1.0
p~C\I~Q.,°
~" ,..f ... c ~
~
;//4'/
"g()
.,.J
"2.~~
~()~
,,?...
'/I"'/-~--
-1.0
1.0 0--~---fit
:t-;):(\j~
~-~E~"'t)
~"-0E~
:<::
-,,-I0.0
,,
,,'/,/
/1
--- -- II:.c.=~::...;:::;;.tf~~ '-.'} CICIe.,. - - - 2"" Dj~".c-.r
.J-rd A.~1.0
L. ~. -, I J I ~ I II I I
5 0 5
Normalized Average Curvature
Figure B.9 Moralized Load-Displac.-nt and I1oMnt Curvature Response of Be.. Tested
under Frequency 10 Hz (Spec18en 3.1.1)
260
o.0
I-a'} CycM".J - --2-" Di.~
-- - - - - .,.,.d A_".,.de
I I I I I ~ I I I _1_1-2.0 - 4.0 0.0 1.0 2.0

Appendix B
i;:=~~3! ~ cJ1.0 ..d~'~::.:~~.:] . .-
p~t\I~QO
~
-#
/"':... ;r
...,.
.,I~~"g()-J~"
.~""i5
~()
~
-1.0- - '-5t } C1~,.ota - - - 2-" DI~"a~--
,,",.d AI8p/I~
L---1- I I I -. - I~I- I-;;J~.. ~-2.0 -f.O 0.0 1.0 2.0
Normalized Displacement d/ d:v.
~~~ ~..-~~=:=..:::Ii-II-iZLP
~~--=- - -=-= ~1.0
...
:t:>,C\lo
~
/....../'
,...
..."1/,'
I.', ,}J-c:~E
~
~N"-~0
E
~:<::.
0.0
'-sf} C1C~ ata- - - 2-ad Displac_'.- - - - - .J-rd A,.plitv«-1.0
~
Normalized Average Curvature
Figure 8.10 Mor8alized Load-Displacement and Moment Curvature Response of Beam Tested
under Frequency 10 Hz (Specl_n 3.1.2)
261
o.0
If

Appendix B
i:'L~ Jfij;=:=3 r
p1.0 ~..;.- - -'
..,
...:t)O"'0
~
/" ,,"/
I /,.."'~,
'1
]e~~QJ,..."-
~E,
~
(/0.0
ff-st } C,~" .,.
- - - 2-84 DI.,/oc--'~r4 AIY""'-*
-1.0
IIII .;. I I J I5 0 5
..1 ~1Normalized Average Curvature CfV ~av.
Figure B.11 Moralized Load-D1spla~nt and Mc.-nt CurTature Response or Be- Tested
under Frequency 10 Hz (Speci88n 3.2.1)
262
~ -2.0 - ".0 0.0 1.0 2.0
bJ_;-l

Appendix B
1=:=~~~3 t ~ cf
P1.0 -- -
~t\I~~
~
:,
'/~ ,, -...
///
'I'/
~t)()..oJ"t)4.1.~~
~(:)
~
,,' ", ,I" ;" ,/ ( ' "'/
,,' ,/(' " :/ "'/ /
I I '/I' ;!f "" " , "-, /, ' ~ -,'--=-:- -=-=-:J~.~ :~~~~~ ~..
L-' -~~ _I-1.0
1.0 ..:-=- - ~ ~'""'
j
J
~
=z;;~C\la
~
-If,
~e:~~'-0..0;
0
e:~
~
,0.0
,,,,
l ;;:, /I
,-.,} Cy~~.,. - - - 2-8d 01.,,---
-- - - - -.J-rd A.,""N*-1.0)
I I I t I; f I I I I5 0 5
Normalized Average Curvature ct\I$:w.Figure B.12 Nor8l1zed Load-Displace8nt anG Ho8nt Curvature Response or Beam Tested
under Frequency 10 Hz (Speo18en 3.2.2)
263
o.0
-2-0 - 4.0 0.0 1.0 2.0
- - '..'} C,e,..,. - - - ~N 01",---
~,.. ~
t I I I I : I I I I I


![ADGR81201 Marketing Analytics, Credits: 3 Boston College ... · Business School, Stanford University, to present the fundamentals in Marketing Analytics. [See case-list herein]. Lectures](https://img.pdfslide.us/doc/110x75/5fad19ca1448d8749a098bf6/adgr81201-marketing-analytics-credits-3-boston-college-business-school-stanford.jpg)