Embed Size (px)
Citation preview

The Deformation of Cellular Entities
by
Kuo-Kang Liu
Thesis submitted for the degree of
Doctor of Philosophy
University of London
Department of Chemical Engineering,
Imperial College of Science,Technology and Medicine
London
June 20, 1995
(

"If anyone thinks that he knows anything, he has not yet
come to know as he ought to know."
1 Corinthians (The Bible): Chapter 8; Verse 2
Preface
This dissertation is a description of the work carried out in the Department
of Chemical Engineering and Chemical Technology, Imperial College, London
between June 1993 and June 1995. Except where acknowleged, the material
presented is the original work of the author and includes nothing which is the
outcome of work done in collaboration, and no part of it has been submitted for
a degree at any other University.
I am deeply grateful to Professor B. J. Briscoe for his excellent supervision
during the course of my research. His help and guidance have been invaluable.
The author is also greatly indebted to both Professor D. Tabor, F.R.S., and Pro-
fessor K. L. Johnson, F.R.S., for their many invaluable suggestions concerning
the deformation of elastomeric spheres. It has also been a pleasure to receive help
from Dr. D. R. Williams in the setup and maintenance of the equipment which
was originally designed by him. I would also like to thank Dr. P. F. Luckham for
his kind assistance during discussions. The experimental assistance from Mr. G.
Corfield for the preparation of elastomeric spheres is acknowledged. The provi-
sion of microcapsules by Mr. D. J. Brown (Zeneca) of tomato cells by Professor
P. Lillford and Dr. T. Foster (Unilever) is also gratefully acknowledged.
I would also like to acknowledge the DTI Link Colloid Research Programme
for supporting this project. I would also like to especially thank Taiwanese
government for the provision of a Life Science Scholarship.
Kuo-Kang Liu
June, 1995
1

Abstract
This thesis describes both an experimental and a theoretical investigation into
the interfacial energy and intrinsic mechanical properties of various single micro-
cellular entities (ca 65-.500 im diameter) , through the investigation of their
compressive deformability. A novel experimental technique, which involves the
upsetting (compression of single micro-cellular entities between two parallel
plates), has been developed to directly measure the imposed forces and the corre-
sponding compressive displacements simultaneously. This apparatus has a force
and displacement resolution of 10 jN and 0.25 jim, respectively. The apparatus
also allows the optical measurement of the major features of the deformation
geometry, such as the central lateral extension, which is necessary to properly
identify the deformation behaviour of these systems. The theoretical studies un-
dertaken include, both analytical and numerical analyses, which are developed
for interpreting the experimental data. Specifically, theoretical analyses will be
presented for both linear and non-linear elastic compressive deformation of ho-
mogeneous solid spheres, as well as liquid-filled spherical membrane systems, at
both small and large imposed strains.
In general, the experimental data and the theoretical predictions are shown
to be in good accord for both the homogenous elastomeric spheres and the liquid-
filled microcapsules with an elastomeric membrane. However, for the biological
cells the constitutive equations (strain-stress relationships) for the cell walls are
2

3
not satisfactorily resolved. The autoadhesive force is shown to be a significant
factor for the description of the deformation of the homogeneous elastomeric
micro-spheres at small deformations. An implementation of an established the-
oretical analysis (JKR theory) for small deformations provides an estimate of
the interfacial free energy between the single elastomeric micro-sphere and the
compressive platens. The application of large deformation theories, either the
Tatara model for the homogeneous elastomeric spheres or the membrane model
for the microcapsules, allows the elasticity of a single particle to be accurately
determined. The Tatara based analysis, combined with experimental data at
40 % deformation, allows the explicit estimation of the Poisson ratio for the
elastomeric spheres.

Contents
List of Figures 8
List of Tables 15
Nomenclature............................... 16
1 General Introduction 21
1.1 Introduction .............................21
1.2 The aim of this study ........................24
1.2.1 The Methodology ......................26
1.3 The structure of the Thesis ....................29
2 Experimental methods 30
2.1 Review of the previous methods ..................30
2.1.1 Nano-/Micro-indentation ..................30
2.1.2 Micropipette aspiration method ..............32
2.1.3 Compression method ....................34
2.2 Micro-upsetting method ......................36
2.2.1 Equipmental setup .....................36
2.2.2 The major merits of the current method .........44
2.3 Instron Universal Testing Machine .................46
I

CONTENTS
5
3 Theoretical models 47
3.1 Review of the theories .......................47
3.2 The identification of applicable theories ..............50
4 The deformation of homogeneous micro-elastomeric spheres 54
4.1 Introduction ............................. 55
4.2 The theories of deformation .................... 58
4.2.1 The theories without autoadhesion effects
58
4.2.1.1 Hertz theory ................... 58
4.2.1.2 Tatara theory .................. 59
4.2.2 The theories with autoadhesion effects .......... 64
4.3 Experimental ............................ 70
4.3.1 Material preparation .................... 70
4.3.2 Experimental procedure .................. 70
4.4 Results and discussions ....................... 72
4.4.1 Autoadhesion effects .................... 72
4.4.2 Mechanical responses .................... 80
4.4.2.1 Compressive compliance ............. 80
4.4.2.2 Scaling effects ................... 84
4.4.2.3 Geometric features of deformations ....... 84
4.5 Summary ..............................91
5 The deformation of liquid-filled micro-cellular entities 93
5.1 Introduction ............................. 94
5.2 Experimental ............................ 96
5.2.1 Material ........................... 96
5.2.2 Experimental procedure .................. 96
5.3 The theoretical analysis ...................... 98

CONTENTS
6
5.4 Results and Discussions ......................104
5.4.1 Elastic modulus of the membrane .............104
5.4.2 Internal pressure ......................109
5.4.3 Membrane tension .....................112
5.4.4 Geometric features of the deformation ..........114
5.5 Summary ..............................119
6 The deformation of biological cells 121
6.1 Introduction .............................121
6.2 Experimental ............................124
6.2.1 Material ...........................124
6.2.2 Stress-relaxation experiment ................126
6.3 Theoretical analysis .........................126
6.3.1 Constitutive equations ...................126
6.3.1.1 General constitutive equations for cell membrane 126
6.3.1.2 Specific constitutive equations for plant cell 128
6.3.2 Governing equations for compressive compliance .....129
6.3.3 Stress Relaxation analyses .................130
6.4 Results and discussions .......................132
6.4.1 Stress relaxation ......................132
6.4.2 Compressive compliance and bursting phenomena . . 134
7 Conclusions 139
7.1 The governing effects responsible for the observed deformation 140
7.2 The experimental method .....................142
7.3 The theoretical interpretation ...................143
7.3.1 For the homogeneous elastomeric spheres .........143
7.3.2 For the liquid-filled membrane ...............143

CONTENTS 7
Appendix 145
A The jump phenomenon 145
A.1 Long range forces: Lifshitz theory .................145
A.2 The experimental configuration and the origin of the "jump" 146
A.3 The Johnson method ........................147
B Computer programs 150
References 162

List of Figures
1.1 A flow chart outlining the methodology of the current work and
thepotential applications ......................27
2.1 The two methods of indentation hardness measurement: (a) the
imaging method, when the diameter or diagonal, d, is measured
after indentation; and (b) the compliance method, where the re-
action force, F, and the depth of penetration, h, are measured
continuously during the indentation. Adopted from Sebastian
(1994), with permission.......................33
2.2 Micropipette aspiration method: is the pressure difference
between the pipette interior and the outside medium, and L is
the length of the aspirated projection of the membrane......35
2.3 The compression method: F is the force on each plate where the
plates are separated by each other a distance Z..........37
2.4 The schematic view of the micro-upsetting instrument (not to
scale).................................39
2.5 The schematic view of the computer-controlled systems of the
micro-upsetting instrument (not to scale). The items outside the
boxed region marked as "Host computer" were mounted upon a
vibration isolation table.......................40
8

LIST OF FIGURES
9
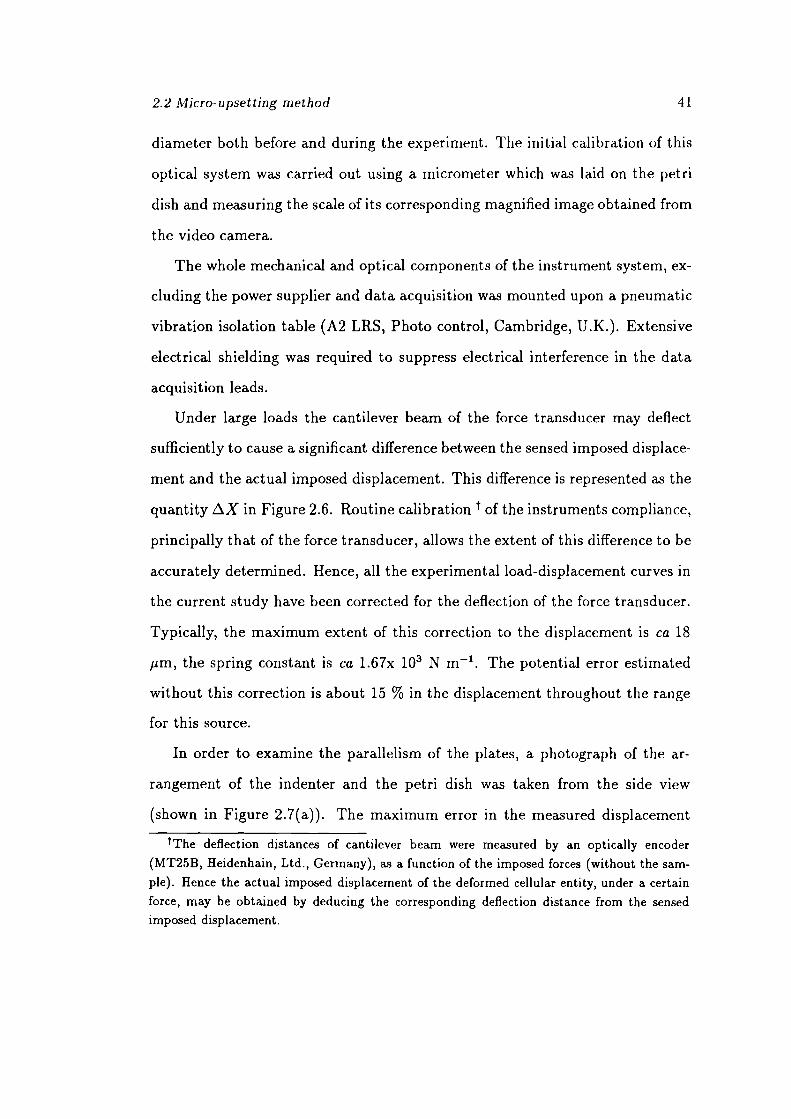
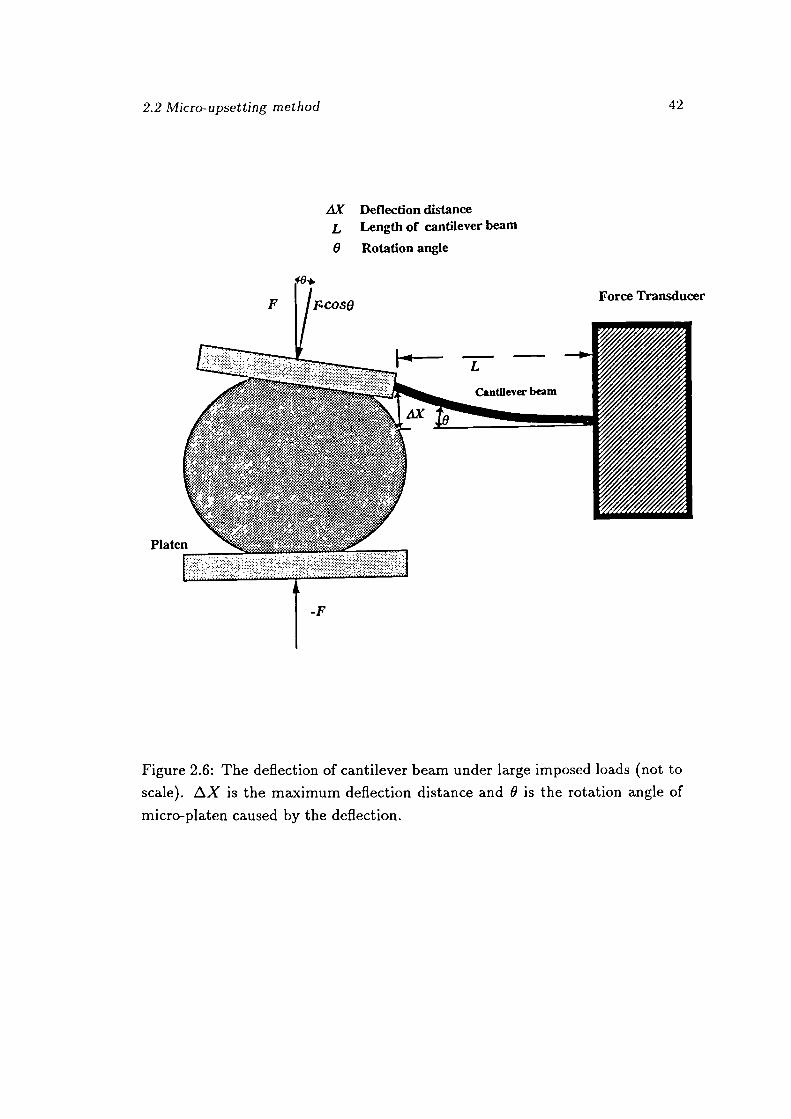
2.6 The deflection of the cantilever beam under large imposed loads
(not to scale). zX is the maximum deflection distance and 0 is
the rotation angle of micro-platen caused by the deflection. . . 42
2.7 (a) A photograph of the arrangement of two parallel platens: the
indenter (micro-platen) and the petri dish (see the following dia-
gram for details). (b) An idealised schematic view of the platens
of the micro-upsetting instrument (not to scale). LY is the maxi-
mum error in the measured displacement caused by the imperfect
parallelism of these two platens, and dy is the real error arising
from this source. L is the diameter of the indenter and D is the
diameter of the contact area between the deformed cellular entity
andthe platens............................ 43
3.1 The general features of the loading! unloading curves for three
different types of structures: (a) homogeneous elastomeric sphere;
fracture stress is assumed to be extremely difficult to achieve; that
is the sphere does not fracture under the maximum loading force.
(b) liquid-filled spherical elastomeric membrane; (c) liquid-filled
spherical elastomeric shell when wall rupture occurs.......51
3.2 The various theories available for the descriptions of the sequen-
tial stages, appearing in the loading and unloading, for the elas-
tomericmicro-spheres ........................53

LIST OF FIGURES
10
4.1 Schematic of the symmetrical shape of a soft elastic sphere corn-
pressed, at large stains, between two flat rigid surfaces, and the
movement of a point C(z, r) on the surface before deformation to
C'(z',r') after deformation, where U(z,r) and U(R) indicate the
lateral extensions at the contact surface and the central diameter,
respectively. The c is the approach; a' is the computed radius
of the contact surface at the vertical position (z); a is the radius
before deformation. (adapted from Tatara's original paper (1991)) 63
4.2 The flow chart for the enhanced version of the algorithm for solv-
ing the set of the equations of the Tatara theory used in the
currentstudy.............................65
4.3 (a) Deformable (elastic) spheres on a rigid surface in the absence
(Hertz) and presence (JKR) of adhesion. (b) elastic adhering
sphere about to separate spontaneously from an adhesive contact.
Adapted from Israelachvili (1991), by permission.........68
4.4 Typical loading/unloading curve for the small deformation ex-
periment. Starting (S); contacting (A); loading (AB); unloading
(BC); pull off (CD); ending (E). The members "jump" (see Ap-
pendix A) into contact at A. At A' the applied load is zero. The
pull-off force corresponds to the difference between the magnitude
of the forces at points C and D...................74
4.5 The comparison of the theoretical (predicted by Hertz and JKR
theories) and experimental unloading curve for small dimension-
less approaches (c*). Case A; translated experimental data (by
shifting a displacement of 0.6 pm) for the pull-off speed 1 pm
sec 1 , Case B; experimental data for the pull-off speed 5 pm sec 1 . 79

LIST OF FIGURES
11
4.6 The comparison of experimental and theoretical load versus di-
mensionless approach, a, curves for a 270 m poly(urethane)
sphere. The experimental data and various predictions are shown.
The Young's moduli are respectively 2.25 MPa for the Hertz pre-
dictions and 2.06 MPa for the Tatara analysis. The Poisson's
ratiois taken as 0.48.........................82
4.7 Comparison of the theoretical and the experimental dimensionless
applied load, P/K, versus dimensionless approach (cf) curves for
300 im and 38.3 mm poly(urethane) spheres...........85
4.8 Comparison of the theoretical and the experimental dimensionless
central lateral extension, U*(R) , versus dimensionless approach,
curves for 240 im and 38.3 mm poly(urethane) spheres. . . 87
4.9 Photographs of the deformed elastomeric sphere (ca 240 tim) from
a bottom view for various dimensionless approaches (a); (a) a=0
% (b) a 9.5 % (c) a= 28.3 % (d) a= 55.8%...........88
4.10 Simulated dimensionless central lateral extension, U*(R), as a
function of dimensionless approach, a, for various Poisson ratios
(ii) computed by the modified Tatara analysis...........90
5.1 Schematic representation of the microcapsules...........97
5.2 Geometry for the contact problem for the half of a thin wall spher-
ical membrane between two large rigid plates...........103
5.3 The flow chart for the enhanced version of the algorithm for solv-
ing the set of the equations of the membrane model used in the
currentstudy.............................105

LIST OF FIGURES
12
5.4 The experimental loading and unloading (after bursting) curves
of a 65 ,am microcapsule. The bursting point is near 58 % dimen-
sionless approach, (1 - i/ro))................... 107
5.5 Photographs of the bottom view of a deformed microcapsule for
various dimensionless approaches (y); (a) y=O % (b) y= 20 % (c)
y= 40 % (d) y= 58 %........................108
5.6 The dimensionless experimental loading/unloading curve (defor-
mation up to 40 %) and theoretical predictions produced by the
membrane model with a Mooney- Rivlin material law. The param-
eter y = (F/Ci hr0)) is the dimensionless force and the quantity
(1 - /r0 ) 3 ) is the dimensionless approach. is 1.0 and C1 is
16.08 MPa..............................110
5.7 The dimensionless experimental loading/unloading curve (defor-
mation up to 40 %) and theoretical predictions produced by the
membrane model with Neo-Hookean material law. The parame-
ter y = ( F/Ci hr0)) is the dimensionless force and the quantity
(1 - i1/r0 X,) is the dimensionless approach. is 1.0 and C1 is
16.14 MPa..............................111
5.8 Internal pressure versus deformation curve for the compression of
a compressive microcapsule. The Young's moduli of the mem-
brane are respectively 2.69 MPa for a Neo-Hookean material and
2.68 MPa for a Mooney-Rivlin response..............113

LIST OF FIGURES
13
5.9 Variation of the wall tension, the extensional force per unit wall
thickness, with angular position, b, for a 58 % deformation. The
Young's moduli of membrane are respectively 2.69 MPa for a Neo-
Hookean material and 2.68 MPa for a Mooney-Rivlin system. T1
and T2 are the stress resultants in the meridional and circumfer-
ential directions, respectively....................115
5.10 The simulated deformed shapes of a microcapsule () = 1, fi =
0.1) for 20 %, 40 % and 60 % deformation as used in the current
study.................................116
5.11 A comparison of the computed geometric features of the deforma-
tion of a homogeneous elastomeric sphere with a Poisson ratio of
0.5 and a liquid-filled spherical entity with an elastomeric mem-
brane; (a) the dimensionless central lateral extension versus the
dimensionless approach (b) the dimensionless contact radius ver-
sus the dimensionless approach ..................118
6.1 Schematic representations of typical structures of cells: (a) plant
cell(b) animal cell..........................123
6.2 Photographs of the single isolated tomato cells: (a) green cell (ca
250 iim diameter) (b) red cell (ca 250 m diameter).......125
6.3 Three mechanical models for a viscoelastic material. (a) a Maxwell
body, (b) a Voigt body, and (c) a Kelvin body (a standard linear
solid). Adopted from Fung (1993) with permission........131
6.4 Relaxation behaviours of (a) a Maxwell, (b) a Voigt, and (c) a
standardlinear solid.........................133
6.5 The experimental results and theoretical correlation of the stress
relaxation for two types of tomato cells (a) green cell (b) red cell. 135

LIST OF FIGURES
14
6.6 Typical experimental curves of the compressive compliance for
two types of tomato cells; (a) green cell (b) red cell........136
6.7 The theoretical predictions for the compressive compliance for the
spherical cells, obtained by using the membrane model combined
with the selected constitutive equations for the cell membrane. . 137
A.1 (a) The compressive load (P)-deflection (u) produced by the JKR
theory for the interplation of the jump phenomenon (Johnson
1995; private communication). (b) The actions of the sphere and
platen at (i) the point Q and (ii) the point D ..........148

List of Tables
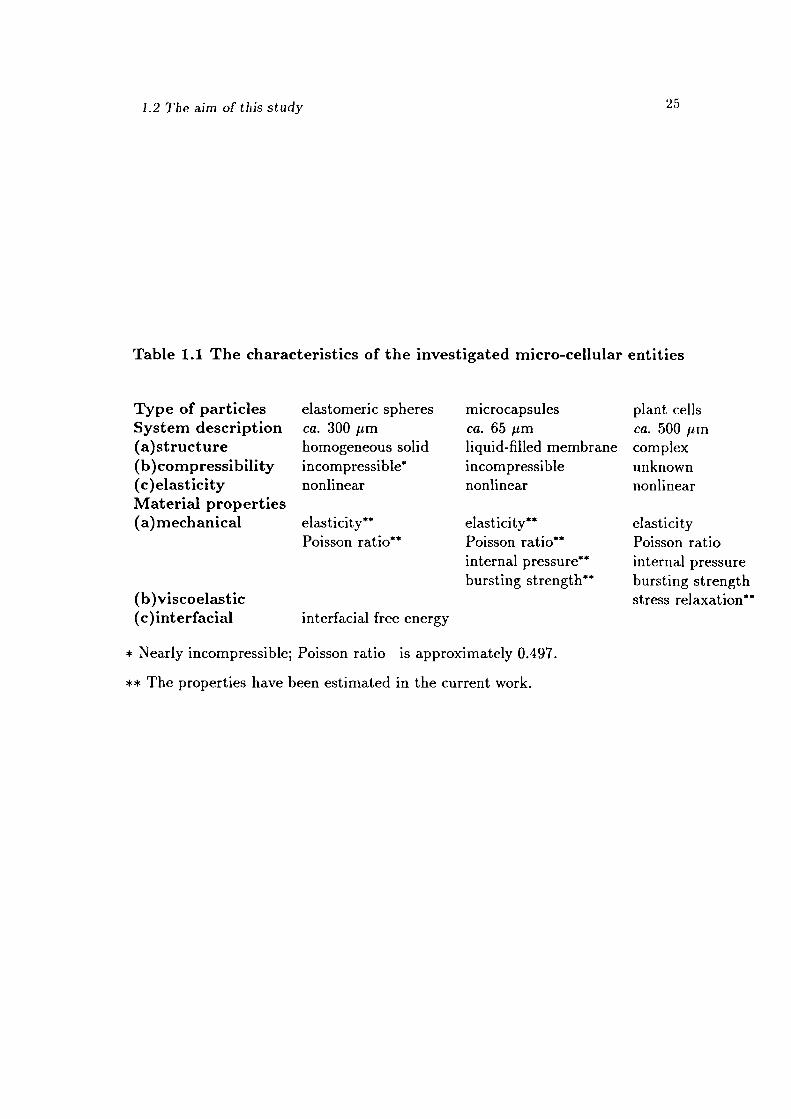
1.1 The characteristics of the investigated micro-cellular entities . . 25
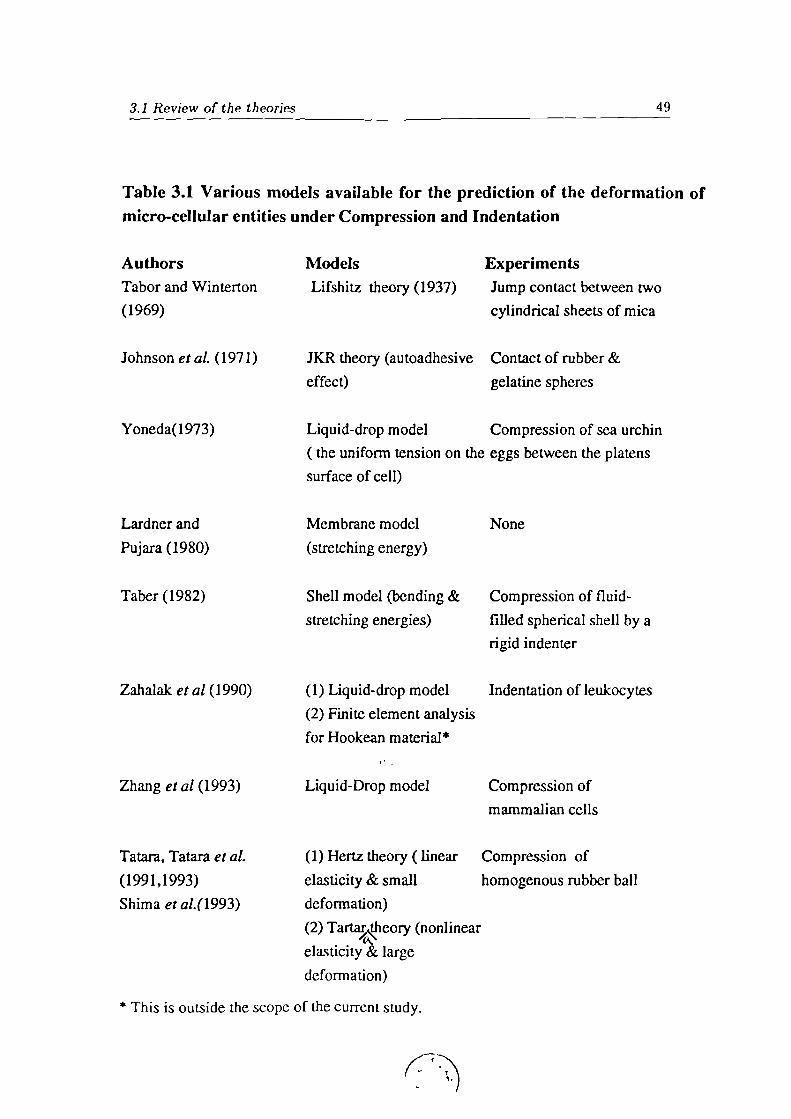
3.1 Various models available for the prediction of the deformations of
micro-cellular entities under compression and indentation . . . . 49
4.1 Effects of strain (dimensionless approach) and strain-rate (pull-
off speed) on the adhesion of microscopic poly(urethane) spheres
(300 jim) in contact with two glass plates .............75
5.1 The comparison between the experimental and theoretical dimen-
sionless central lateral extension versus dimensionless approach
relationships.............................117
15

Nomenclature
Chapter 2
D Diameter of contact area between deformed cellular entity and platen
d Diameter or diagonal of the indentation image
F Applied force (compression method)
h Depth of penetration (indentation method)
L Diameter of the indenter (micro-platen)
L Length of the aspirated projection of the membrane
P Reaction force of identation (indentation method)
by the cantilever deflection
Z Distance between two parallel platens (compression method)
greek symbols:
AP Applied pressure difference (micropipette method)
LX Maximum deflection distance of cantilever beam
Maximum error in the measured displacement
0 Rotation angle of micro-platen
Chapter 4
A Hamaker non-retarded force constant
a Radius of contact area
a' Computed radius of the contact surface by Tatara theory
16

Nornenclat ure 17
E
E0
H0
K'
P
Pa
PC
P1
P
R
u(z, r)
U(z,a)
U(R)
U*(R)
w(z, r)
z
Young's modulus
Initial Young's modulus (Tatara theory)
"Jump" distance
[_4ER2- [3(1_2)
Contact normal load
Effective force of adhesion
Pulling force or the force of attraction
Apparent Hertz load by including the auto adhesive force
P3Ririy
Radius of the sphere
Radial displacement of half-space elastic body
Lateral extension predicted by Tatara theory
Lateral extension at the central diameter
Dimensionless central lateral extension ( U(R)/R)
Vertical compressive displacement of half-space elastic body
Vertical position
greek symbols:
a Approach
Dimensionless approach (the ratio of a to R)
Asperity radius
Strain
F
Measured work of adhesion
71 Surface free energy of body 1
72 Surface free energy of body 2
712 Interfacial energy of interface 12
w
Thermodynamic work of adhesion

a*
c1&c2
D
E
F
h
h
I
P
r
T
U(R)
Nomenclature
0 "Adhesion prameter" (proposed by Tabor)
Dimensionless parameter for distinguishing the regimes
of applicability of DMT & JKR theories
11
Poisson's ratio
0• Distribution of the asperity bight
o(x)
The stress distribution within the contact area
Subscripts
jkr Variables predicted by JKR theory
t Variables predicted by Tatara theory
z Variables predicted by Hertz theory
H Higher values of variables in the two points & circulation method
M Median values of variables in the two points & circulation method
L Lower values of variables in the two points & circulation method
Chapter 5
Dimensionless radius of contact area
Two material contants (for the strain energy function)
Bending rigidity of shell
Young's modulus
Reaction force of deformed spherical membrane
Initial wall thickness of shell
Thickness of plate and shell
Strain invariant (for the strain energy function)
Internal pressure of microcapsules
Radius of the sphere
Stress resultant
Dimensionless central lateral extension ( U(R)/R)

Nomenclature 19
W =6'
W* Strain energy function for Mooney-Rivlin law
greek symbols:
Ratio of C2/C1
S
=A2sinW
11 Distance between rigid plate and equator of spherical membrane
A principal stretch ratio
F
Angle of contact area (membrane model)
"
Possion's ratio
0. Principal stress
Central expanded radius of spherical membrane
4,
Angular position (membrane model)
Superscripts
Variables differentiated with respect to J1
Subscripts
o Values of variables before deformation
Initial values of variables
1 Variables in the meridional direction
2 Variables in the circumferential directions
Chapter 6
B&C
Two material contants (for the strain energy function)
D
Bending rigidity of shell
E
Young's modulus
F
Reaction force of deformed spherical membrane

Nom en ci at ure 20
h
Initial wall thickness of shell
I
Strain invariant (for the strain energy function)
P
Internal pressure of microcapsules
r
Radius of the sphere
T
Stress resultant
wc*
Strain energy function developed by Chaplain.
w;
Strain energy function developed by Skalak et al.
greek symbols:
S
=\2sin4'
17 Distance between rigid plate and equator of spherical membrane
principal stretch ratio
F
Angle of contact area (membrane model)
71
Possion's ratio
/7 Shear modulus
0• Principal stress
T
Ratio of B/C
Central expanded radius of spherical membrane
4'
Angular position (membrane model)
Superscripts
Variables differentiated with respect to 4'
Subscripts
o Values of vraiable before deformation
s Initial values of variables
1 Variables in the meridional direction
2 Variables in the circumferential direction

Chapter 1
General Introduction
The main purpose of this Chapter is directed to defining the problem which
has been investigated and thus explaining the objectives of the current work.
A preliminary survey of the potential applications which may be derived from
this study is also recorded. In addition, the main theme of this Thesis, a novel
methodology, which includes both theoretical and experimental approaches is
described briefly. The Chapter finally concludes by giving a review of the con-
tents of each chapter subsequently presented in this Thesis.
1.1 Introduction
It is now recognised that the deformation behaviour of single micro-cellular en-
tities is potentially important not only for characterising the bulk mechanical
responses of the aggregation of these cellular entities, such as particulate ag-
glomerates and biological tissues, but also for improving our understanding of
the rheology of concentrated dispersions. For example, the rheological properties
of concentrated cellular suspensions have now been recognised to be directly re-
lated to the deformability of the single cellular entities (Evans & Lips 1990) and
the interfacial interactions of these entities and their external surface (Briscoe
1994). Hence, data for the deformation of single micro-cellular entities can form
21

1.1 Introduction 22
the bases for discrete particle-particles interaction laws used in the construction
of rheological models. In addition, characterising a single biological cell provides
an essential insight into the mechanical deformation response of biological tis-
sues. However, various studies (Bliem 1989; Zhang et al. 1992) have pointed
out that the systematic experimental investigation of the deformability of sin-
gle micro-cellular biological entities and the interpretation of these experimental
data have both proved to be extremely difficult to achieve.
The origins of the forces between micro-cellular entities and surfaces, which
are well described in the literature, may be distinguished between the surface
forces and the bulk mechanical forces. The former are mainly contributed by
the van der Waals forces as well as electrostatic forces, and vary significantly
with the surface topography, the bulk viscoela.stic properties as well as the con-
ductivity of the materials. The latter forces are mainly governed by the bulk
mechanical properties such as the elasticity and Poisson ratios of the materials.
At small deformations, the autoadhesive forces may play a significant role in
the deformation of micro-cellular entities (especially for the homogeneous elas-
tomeric sphere in a dry contact), whilst at large deformations the mechanical
forces will be prevailing. The autoadhesive forces have been shown to be an
important effect for low loads such as those which occur in particle-particle
interactions in colloidal suspensions (Israelachvili 1991; Johnson 1993). How-
ever, the mechanical forces have been shown to be important in many aspects
of the processing and handling of particulate systems, such as the processes of
compaction and extrusion.
Because biological cells, due to their complex structures and their material prop-
erties, which are intrinsically difficult to describe, it is rational and sensible to
study the deformation behaviours of the well-defined artificial systems, such as
the homogeneous elastomeric spheres and the liquid-filled microcapsules, as a
1.1 Introduction 23
first step. Furthermore, these two model cellular systems, in view of the avail-
able theoretical analyses, may both be considered as the limiting cases of shell
models. These are described in the classic structural mechanics literature, which
considers that the deformations are mainly governed by both the bending forces
and stretching forces in the shell. The homogeneous elastomeric sphere may be
described as a shell which has the ratio of wall to radius of 1.0 ( thick
shell); whilst the microcapsule may be considered as a thin-shell (or membrane)
system in which the bending moment contributions may be neglected. Some
studies (Petersen et al. 1981; Evans & Skalak 1979) have pointed out that all of
these simplified models fail to accurately predicate the deformation behaviour
of biological cells. Currently, there is no suitable model available that allows
the accurate description of the deformation behaviour of biological cells in de-
tail. Both the membrane model and the homogeneous elastic sphere models
are widely used for describing biological cells in many studies (Hochmuth 1987;
Zahalak et al. 1990; Zhang et al. 1994). It is intuitively obvious that for the
compressive deformation of these three types of structures the applied loading
and unloading forces will vary in different ways. The general features of these
deformations are discussed in detail, from an universal point of view, in the
Chapter 3.
Since most micro-cellular entities, such as elastomeric particles, microcap-
sules as well as biological cells, have intrinsically low moduli (values of 0.1 MPa
to 10 MPa are common), large deformations are easy to achieve under small
external loads. Furthermore, for these materials the interrelationships between
strain and stress (constitutive equations) are usually non-linear. Hence, there is
a great need for appropriate theoretical models which include the large deforma-
tion formulation, with a non-linear elasticity. Taking into account these factors,
some advanced models, either for the homogeneous elastomeric spheres or for

1.2 The aim of this study 24
the liquid-filled membrane systems, are presented in the current study. These
higher-order models are more accurate than most of the previously reported
studies which have only applied first-order analyses.
It is obvious that the deformability of single micro-cellular entities is normally
governed by the interfacial, the mechanical and the viscoelastic properties, of
the entity. Hence, all of these properties may, in principle, be deduced from
the characterisation of the deformability of single micro-cellular entities. In the
current study the experimental method combined with appropriate theoretical
analyses, both analytical and numerical, has facilitated the determination of
some of these material properties which are shown in Table 1.1
1.2 The aim of this study
The main theme to be described in this Thesis is the development of a rigorous
methodology which combines both experimental and theoretical approaches in
order to facilitate the measurement of interfacial energy and intrinsic mechanical
properties of soft micro-particles (ca 65 500 gm), through the investigation
of their deformabilities (see Figure 1.1). To achieve this goal, in the experi-
mental aspect, a novel technique which involves the upsetting (compression of
single micro-cellular entities between two parallel plates) has been developed
and constructed to directly measure the imposed forces and the corresponding
compressive displacement simultaneously. An incorporated visualisation system,
which allows for the investigation of the corresponding major geometric defor-
mational parameters such as lateral extension as well as the failure phenomena,
has been developed and used in the current study. With respect to theoretical
aspects, both analytical and numerical analyses have been used to quantitatively
interpret the interrelationships between the force and the displacement as well as
1.2 The aim of this study 25
Table 1.1 The characteristics of the investigated micro-cellular entities
Type of particlesSystem description(a)structure(b) compressibility(c)elasticityMaterial properties(a)mechanical
(b)viscoelastic(c) interfacial
elastomeric spheresCa. 300 pmhomogeneous solidincompressible*nonlinear
elasticity**Poisson ratio**
interfacial free energy
microcapsulesCa. 65 pmliquid-filled membraneincompressiblenonlinear
elasticity**
Poisson ratio**internal pressure**bursting strength**
plant cellsca. 500 pmcomplexunknownnonlinear
elasticityPoisson ratiointernal pressurebursting strengthstress relaxation**
* Nearly incompressible; Poisson ratio is approximately 0.497.
** The properties have been estimated in the current work.

1.2 The aim of this study 26
the major geometric deformational parameters. This type of analysis provides,
in principle, a method for obtaining the critical physical information regarding
the mechanical and interfacial characteristics of the materials.
1.2.1 The Methodology
A rigorous methodology has been developed and is described by the author based
upon the conventional approaches to material characterisation (Fung 1993).
This methodology is applied to characterise the deformation behaviour of cel-
lular entities composed of various materials and structures, in order to explore
both their mechanical! viscoelastic and interfacial properties. Specifically, the
Thesis addresses the follow parts and some topics in a more detail than others.
1. The study of both the original and the deformed geometric configurations of
the particles.
2. The determination of the mechanical properties of single soft particles that
are involved in the problem. In particle characterisation, this step is often
very difficult, either because the size of investigated micro-cellular entities
is too small to be handled, or because the appropriate mathematical model
which includes reasonable boundary conditions and the formulation of in-
trinsic material properties is extremely difficult to develop. Furthermore,
as mentioned in the previous section, soft particles are often subjected to
large deformation, and stress-strain relationships (constitutive equations)
are usually nonlinearly and also history dependent. The nonlinearity and
time-dependence makes the determination of constitutive equations a chal-
lenging task. Usually however, one can determine the mathematical form
of the constitutive equations of the material quite readily, with certain
numerical parameters left to be determined by the experiments to be sub-

1.2 The aim of this study 27
Single micro-cellular entitysystems
.
Experimentalinvestigation
The MethodologyOf Current Work
Theoreticalmodelling
Load-displacemen
Deformedcurve shape
Constitutiveequations
Characterising the
Computermechanical and simulation
interfacial properties
Multiple micro- \cellular entitysystemsS.
Correlating the deformationof a single cell to the bulkdeformation of tissue
Potential Applications
Exploring the particle-particle interaction lawsused in the construction ofrheological models
Figure 1.1 A flow chart outlining thc methodology of the Current workand the potential applications

1.2 The aim of this study 28
sequently mentioned in items (6) and (7); see below.
3. In contact adhesion for small homogeneous elastomeric spheres, at small
deformations, the interfacial properties may play an important role on the
response of the particles to deformation. A well-known autoadhesive the-
ory, Johnson-Kendall-Roberts (JKR) theory (Johnson et al. 1971) , has
been applied to the current study. Based upon the experimental data for
the "pull-off" and the "jump contact" experiments, some important inter-
facial properties may be determined. In turn, the possible autoadhesive
mechanisms, such as van der Waals and electrostatic forces, have been
examined.
4. An examinationjhe external environment in which the possible mechanisms
may be involved, in order to obtain meaningful boundary conditions; for
example, the roughness on the contact surface between the particle and
plates.
5. The solution of the mathematical formulation (governing equations with ap-
propriate boundary conditions) by analytical method or numerical,
6. The implementation of experiments that test the solutions of the problems
mentioned above. Then as necessary, reformulation and resolution of the
mathematical problem to ensure that the results of theory and experi-
ment do correspond to each other, i. e., that they are testing the same
hypotheses.
7. A comparison of the experimental results with the corresponding theoretical
ones. By means of the comparison, the determination that the hypotheses
made in the theory are justified, and, if they are, the numerical values of

1.3 The structure of the Thesis 29
the undetermined coefficients in the constitutive equations are determined.
Hence, some of the material properties of the investigated entities may be
estimated.
8. And finally and in general, once a theory is so validated, it may be applied
to predict the outcome of other problems associated with the same basic
equations. Then one may use the method to explore practical applications
of the theory and experiments.
1.3 The structure of the Thesis
The rest of the Thesis consists of six chapters. In Chapter 2, both the previous
experimental techniques and the current method, are reported in detail. Chapter
3 briefly describes the various theories which are adopted in the current study.
Both the experimental data , associated with appropriate theoretical analysis,
on the deformation behaviours of the homogeneous elastomeric spheres are pre-
sented in Chapter 4. Apart from the mechanical response, the autoadhesive
force, which is shown to be a significant factor for the elastomeric spheres at
small deformations, is also discussed in this Chapter. The results for the defor-
mation of artificial micro-cellular entities, the liquid-filled microcapsules with an
elastomeric membrane, are presented in Chapter 5. In this Chapter the charac-
terisation of the elasticity and the bursting strength of the membrane, as well as
the tension forces on the membrane, are reported. Chapter 6 describes some pre-
liminary results on the deformation of biological cells; two types of tomato cells.
The viscoelastic behaviours of these tomato cells are also addressed. Finally,
some of the more important conclusions are given in Chapter 7.

Chapter 2
Experimental methods
This Chapter is composed of two major parts: The first part discusses some
of previous experimental methods which have been used to measure the de-
formabilities of single micro-cellular entities. This includes the nano-/ micro-
indentation methods, the micropipette aspiration technique and the compres-
sion method. The second part describes the current experimental technique;
the micro-upsetting method. Finally, a conventional Instron Machine used to
compress macroscopic materials, in order to study the scaling effect for the de-
formation, is also introduced.
2.1 Review of the previous methods
There are various experimental techniques which allow the characterisation of
the deformabilities of single micro-cellular entities. The fundamental principles
of these different techniques are briefly described, and the relative merits and
demerits of each method are also discussed in detail in the following sub-sections.
2.1.1 Nano-/Micro-indentation
The indentation hardness test, where a conical or pyramidal indenter creates a
localised deformation in solid material, is a relatively simple and virtually non-
30

2.1 Review of the previous methods 31
destructive approach for characterising several mechanical properties of solids.
By adopting appropriate analyses, the method can provide useful information
about the spatial variations of these properties in nonhomogeneous samples.
These features make the indentation test a feasible method to estimate material
properties. There are two different types of methods which are conventionally
used to measure indentation hardness; the imaging method and the compliance
method (see Figure 2.1). In the imaging method, on the test surface an indent
is created by an indenter which is imposed by a specified load and withdrawn
after a certain dwell time. The hardness is then calculated from the values of
the applied load and the computed area of contact, which is estimated from the
diameter or diagonal dimension of the indentation image. It is especially well
suited to metals for example which deform plastically. However, this method
has been shown to be limited for organic polymers which creep and relax after
unloading. The compliance method measures the reaction force on the indenter
as a function of the depth of penetration, resulting in a set of loading and
unloading curves for each indentation. The compliance curve with appropriate
analysis provides information on mechanical properties for all classes of materials
(Sebastian 1994).
Recently Daily et al. (1984) and Zahalak et al. (1990) have developed a
so-called "cell-poking" method which involves indenting animal cells (ca 10 pm)
with a micro-radius tip (ca 2 pm) to measure the loading and unloading response.
This method may be considered as an extension of the compliance method.
However, for a number of important reasons the present work has preferred to
use micro-platens (see section 2.2) to compress or upset micro-cellular entities
rather than to use micro-indentation method. Firstly, micro-indentation can
provide useful localised mechanical properties only if the indenter tip size is
small (by a factor of ten) compared with the size of the single cellular entities.

2.1 Review of the previous methods 32
This requirement seems not be fulfilled in the group experiments described by
Daily et al. (1984) and Zahalak et al. (1990). Furthermore, most of the previous
works on polymer films using indentation have shown that when the depth of
indentation exceeds that of 10 % of the film thickness, the material properties of
film substrate may also contribute to the response of the indentation. This
intractable problem may also occur when such small particles are deformed.
More seriously, the observed deformation characteristics will be a very strong,
and also unknown, function of the precise geometry and size of the indenter.
These factors make the previous analysis of the data extremely difficult and the
value of the results uncertain.
2.1.2 Micropipette aspiration method
This method has been widely used to study the mechanical properties of single
liquid-filled membrane systems including both microcapsules and biological cells
(see Figure 2.2). However, up to now the method has not yet been applied to
homogenous elastomeric spheres. In this technique, a portion of the membrane
of the cellular entities is drawn into a pipette by applying a pressure difference
between the pipette interior and the ambient media. The measurement of the
interrelationship between the length of the aspirated projection of the membrane,
L, and the applied pressure difference, zP, combined with an appropriate
analyses, provides the useful information about the mechanical/ viscoelastic
properties of the membrane. However, there are some serious disadvantages
existing in the application of this method. First, this method is only suitable
for membranes undergoing small deformations. At large deformations of the
membrane the adhesive or frictional force between the inside of micropipette and
the membrane of cellular entities will be a significant, but of unknown extent.
A more serious problem is that the nearly infinite curvature located in the tip

P N>7
P
2.1 Review of the previous methods
33
(a) Imaging method
L____________________
(b) Compliance method
Figure 2.1: The two methods of indentation hardness measurement: (a) the
imaging method, when the diameter or diagonal, d, is measured after indenta-
tion; and (b) the compliance method, where the reaction force, P, and the depth
of penetration, h, are measured continuously during the indentation. Adopted
from Sebastian (1994), with permission.

2.1 Review of the previous methods 34
of aspirated projection easily causes the cell to be damaged. In addition, fortè-
biological cells the contributions of some of the intracellular organellest to the
observed mechanical properties of the whole cell has been shown to be significant
when using the micropipette method. Essentially, the potential intractability of
quantifying these above effects makes the micropipette method such that it is
difficult to obtain unequivocal mechanical and viscoelastic properties.
2.1.3 Compression method
The compression method, which involves the squeezing of individual micro-
cellular entities between two parallel platens, allows for the mechanical and
viscoelastic properties to be determined in a relatively unequivocal manner (see
Figure 2.3). This method has been widely applied for various materials. Cole
(1932) compressed sea-urchin egg cells (ca 120 jim) with known forces and from
measurements on the deformed geometry calculated the tension in the mem-
brane. Recently Zhang et al. (1992), using the compression method, have de-
veloped a micromanipulation technique to squeeze single cells (ca 15 tim) , and
to measure simultaneously the force being imposed on a cell and its deformation.
They applied this technique, to both mammalian cells and microcapsules, and
combined with appropriate analyses, the tension modulus and bursting strength
can be determined (Zhang et a!. 1994). Shipway and Hutchings (1993) have
presented a theoretical and experimental study of the fracture of single brit-
tle spheres (ca 750 jim) by uniaxial compression between opposed platens and
by free impact against targets. However, the central problem with the previ-
ous applications of the compression method is that the requirement of a high
position resolution of the platen movement has been proven to be difficult to
The internal volume of the cell, exclusive of the nucleus, is occupied by membrane-bounded
compartments called organelles.

L\P
I
2.1 Review of the previous methods 35
Figure 2.2: Micropipette aspiration method: LP is the pressure difference be-
tween the pipette interior and the outside medium, and L is the length of the
aspirated projection of the membrane.

2.2 Micro-upsetting method 36
achieve. Furthermore, there have been no experimental techniques which permit
the measurement of a continuous force-displacement curve for both the loading
and unloading processes.
2.2 Micro-upsetting method
Based upon the compression method, the microupsetting method which allows
the compression of single cellular entities between two parallel micro-platens has
been developed during the current study. Unlike the conventional compression
method, this method, which is essentially an extension of the compliance method
adopted for nano-/ micro-indentation, can continuously measure the loading/
unloading cycles. In order to precisely measure the load-displacement curve, the
micro-platen is driven by a micro-stepper motor so as to move at various speeds
with a sufficiently high degree of accuracy (about 100 nm). Furthermore, an
incorporated visualisation component allows for the investigation of the corre-
sponding major geometric deformational parameters. Thus, the instrument has
essentially the same elements as the imaging method for indentation.
2.2.1 Equipmental setup
The primary functions of the instrument were to provide a capability to simulta-
neously measure both the approach and the resultant forces, whilst compressing
a small single sphere between parallel glass platens in either a dry or fully solvent
swollen state. Optical viewing of the deforming particle in a vertical plane pro-
vided a reasonable estimate of the central lateral extension of the particle and a
much less accurate measurement of the contact area. The instrument system is
schematically shown in Figure 2.4 and is based around an inverted optical micro-
scope (Wilovert S, Wetzlar Ltd., Germany). Attached to the microscope stage
(Z plane) was a microstepper motor controlled motion stage (PTS1000, Photon

IiF
2.2 Micro-upsetting method
37
Apply displacement
Measure Load
Visualise event in two planes
F
X7
Figure 2.3: The compression method: F is the force on each plate where the
plates are separated by each other a distance Z.

2.2 Micro-upsetting method 38
Control Ltd., England) capable of discrete micro-steps of less than 100 nm. At-
tached to this vertically (Z axis) orientated motion stage was a small horizontal
arm on which was mounted a very sensitive force transducer (BG-10, Kulite
Ltd., USA) with a force resolution better than iO N and a maximum force
capability of 10_i N. The instrument developed had a force and a displacement
resolution of 10 jiN and 0.1 jim, respectively.
On the lower face of this transducer arm was attached a small flat glass
platen (0.7 mm diameter; ca 100 im in thickness) for deforming the sample. The
force transducer signal was amplified and filtered using a strain gauge amplifier
(369TA, Fyde Ltd., U.K.). The absolute position of the platen was monitored
with an optically encoded displacement transducer (MT25B, Heidenhain Ltd.,
Germany) which resolved a vertical displacement of 100 nm over a 25 mm range.
The entire instrument system was computer controlled by using a purpose
written software. Output from the strain gauge amplifier was converted from an
analogue to a digital signal using a 12 bit analogue to digital card (PC LPM 16,
National Instrument, USA) installed within an IBM compatible 486 computer
(see Figure 2.5). The software developed allowed the complete control and
monitoring of the measured force, as well as the displacement, the velocity and
the acceleration of the stage and thus the platen. Two main modes of instrument
operation were used. The first mode was simply the micro-cellular entities being
loading followed by an unloading for a predetermined total strain or displacement
at a nominally constant velocity. The second mode of operation allows the
force to be measured as a function of time for a constant initially imposed
displacement and then following the reaction stress of the sample; essentially a
stress relaxation experiment.
During all the experiments a high resolution video camera (TM 620, Pulnix
Ltd., USA) was connected with the microscope in order to measure the sphere's

2.2 Micro-upsetting method 39
A ParticleB Petri DishC Indentor (attached a
small glass platen)D Force Transducer I GEArmF Translational StageG Position SensorH Visualisation PositionI Microscope StageJ Cantilever Beam E
VFigure 2.4: The schematic view of the micro-upsetting instrument (not to scale).

Strain GaugeAmplifier
InterpolationElectronics
MicrostepDrive Unit
A-D AcquisitionCard HOST
COMPUTER
Stepper MotorController
2.2 Micro-u psetting method
40
Force Transducer Optical EncoderPosition Sensor
Motion Stage andStepper Motor
ISO BUS RS-232 ISO BUS
Figure 2.5: The schematic view of the computer-controlled systems of the micro-
upsetting instrument (not to scale). The items outside the boxed region marked
as "Host computer" were mounted upon a vibration isolation table.
2.2 Micro-upsetting method 41
diameter both before and during the experiment. The initial calibration of this
optical system was carried out using a micrometer which was laid on the petri
dish and measuring the scale of its corresponding magnified image obtained from
the video camera.
The whole mechanical and optical components of the instrument system, ex-
cluding the power supplier and data acquisition was mounted upon a pneumatic
vibration isolation table (A2 LRS, Photo control, Cambridge, U.K.). Extensive
electrical shielding was required to suppress electrical interference in the data
acquisition leads.
Under large loads the cantilever beam of the force transducer may deflect
sufficiently to cause a significant difference between the sensed imposed displace-
ment and the actual imposed displacement. This difference is represented as the
quantity LIX in Figure 2.6. Routine calibration t of the instruments compliance,
principally that of the force transducer, allows the extent of this difference to be
accurately determined. Hence, all the experimental load-displacement curves in
the current study have been corrected for the deflection of the force transducer.
Typically, the maximum extent of this correction to the displacement is ca 18
tim, the spring constant is ca 1.67x iO N m 1 . The potential error estimated
without this correction is about 15 % in the displacement throughout the range
for this source.
In order to examine the parallelism of the plates, a photograph of the ar-
rangement of the indenter and the petri dish was taken from the side view
(shown in Figure 2.7(a)). The maximum error in the measured displacement
tThe deflection distances of cantilever beam were measured by an optically encoder
(MT25B, Heidenhain, Ltd., Germany), as a function of the imposed forces (without the sam-
ple). Hence the actual imposed displacement of the deformed cellular entity, under a certain
force, may be obtained by deducing the corresponding deflection distance from the sensedimposed displacement.
Platei
er
2.2 Micro-upsetting method
42
AX Deflection distance
L Length of cantilever beam
0 Rotation angle
Figure 2.6: The deflection of cantilever beam under large imposed loads (not to
scale). X is the maximum deflection distance and 0 is the rotation angle of
micro-platen caused by the deflection.

2.2 Micro-upsetting method
43
-.,:9
(a)
L
(b)
Figure 2.7: (a) A photograph of the arrangement of two parallel platens: the
indenter (micro-platen) and the petri dish (see the following diagram for details).(b) An idealised schematic view of the platens of the micro-upsetting instrument
(not to scale). LY is the maximum error in the measured displacement caused
by the imperfect parallelism of these two platens, and dy is the real error arising
from this source. L is the diameter of the indenter and D is the diameter of the
contact area between the deformed cellular entity and the platens.

2.2 Micro-upsetting method 44
which was caused by the initial imperfect parallelism of these plates is described
as the parameter LxY in Figure 2.7(b). This error was measured to be approx-
imately 20 tim. However, the real error arising from this source may expressed
as the quantity dy in Figure 2.7(b). if the surface of the platen is assumed to
be perfectly flat, a linear relationship between LY and dy may be simply given
by;LYD
dy= L
where L is the diameter of the micro-platen (about 0.7 mm in the current case)
and D is the diameter of the contact area between the deformed cellular entity
and the plates. In the current study, for a ca 300 /Lm elastomeric sphere, at
40 % deformation, the radius of the contact area is approximately 110 1um.
Then the real error dy is calculated as about 3 um which is equivalent to ca
1 % deformation. At large imposed loads, due to the corresponding cantilever
deflections, the initial parallelism of the platens was distorted; see Figure 2.6.
This distortion may be idealised as a rotation in the micro-platen by an angle, 0.
Hence, the measured forces sensed by the force transducer, which is less than the
reaction forces of the deformed entities, F, may be equivalent to Fcos0 (again,
see Figure 2.6). The maximum consequent error in the force measurement is
estimated as about 1 % in the current case. Under no circumstances did any
detectable translation of the particles occur.
2.2.2 The major merits of the current method
There are some major advantages of the current method, compared with others,
which are listed below;
1. The experimental data which are obtained by using micro-platen compres-
sion (micro-upsetting) method are much more amenable to analysis as the
extent and geometry of deformation is more exactly defined.
(2.1)

2.2 Micro-upsetting method 45
2. It seems that the micro-platen upsetting technique will avoid the possible
damage of the cellular systems upto quite large deformations.
3. It allows the measurement of elastic and viscoelastic time-dependent defor-
mations; for example, it allows a stress-relaxation experiment to be per-
formed.
4. The method gives a continuous force-displacement curve for both the loading
and unloading.
5. The method may be universally applied to both the homogenous elastomeric
spheres and the liquid-filled membrane systems.
6. The method can estimate the bursting strength of the liquid-filled membrane
systems.
Finally, apart from the above advantages, a striking feature of the current
experimental approach is that it allows the assessment of the autoadhesive ef -
fects between the elastomeric spheres and the micro-platens by measuring the
"pull-off" force (see Chapter 4). The magnitude of the interfacial free energy can
be estimated by adopting an appropriate analysis. In fact, a similar apparatus
has been used by Ducker et al. (1991) to study the interaction force between a
single silica sphere (ca 3.5 m) and a silicon surface. Essentially their apparatus
was a atomic force microscope (AFM) on which a V-shaped tip was mounted, as
a cantilever. A particle was attached at the end of tip and the tip approached a
planar surface. The interaction force between the particle and the surface causes
the deflection of the cantilever. Then, a signal, proportional to the deflection as
function of the distance between the particle and the surface, may be produced.
Hence, by converting the data on the deflection into displacement (if the spring

2.3 Instron Universal Testing Machine 46
constant of the cantilever is known), the force-displacement curve can be ob-
tained. Their apparatus as described had a force and displacement resolution of
0.2 nN and 0.3 urn, respectively. However, it is obvious that, although the force
and the displacement resolutions between the current instrument and Ducker's
are different, the general principle may be considered to be the same.
2.3 Instron Universal Testing Machine
In order to explore the effects of size scales on the mechanical response of elas-
torneric materials, macroscopic elastomeric spheres were studied, in addition to
the microscopic particles, using an Instron Machine. The Instron Model "6022"
has been employed in the current study to compress poly(urethane) spheres (ca
38.3 mm) under a constant applied strain rate (or loading speed). The basic
instrument consists of a loading frame and a series 600 digital control console.
The constant strain rate control was achieved with an IBM compatible personal
computer fitted with an IEEE interface card (CIL Group). The applied strain
rate was monitored and corrected by the computer-controlled system at 0.5 sec-
onds intervals. The values of the load, the compressive displacement and the
applied strain rate were collected through a "data acquisition" system (PC LPM
16, National Instrument, USA) and recorded in the computer.
The compression load range was between 0 to 10 kN, the applied strain rate
was adjusted between 0.05 to 1000 mm/mm.

Chapter 3
Theoretical models
This Chapter reviews some of the theories available for the description of the
deformation of both homogenous solid spheres and liquid-filled membrane sys-
tems. For the compression of the homogenous solid spheres, the theories with-
out the inclusion of the autoadhesive effect, both the Hertz (Hertz 1882) and
Tatara theories (Tatara 1991), as well as a theory with the autoadhesive effect,
the Johnson-Kendall-Roberts (JKR) theory (Johnson et al. 1971), are described
briefly. For the liquid-filled membrane systems, the first-order theory, the liquid-
drop theory, and the high-order theories such as, the membrane model (Feng &
Yang 1973) as well as the shell model (Taber 1982), are reviewed. Finally, in this
Chapter a systematic approach to identify the choice of appropriate theories for
the various structures and the different stages which may occur in the loading
and the unloading processes is also introduced.
3.1 Review of the theories
There are a number of classic theories which have been proposed, or applied, by
various authors for both the linear and non-linear compressive deformation of
homogeneous solid spheres, as well as liquid-filled spherical membrane systems,
at both small and large imposed strains (see Table 3.1). The corresponding
47

3.1 Review of the theories 48
experimental examination of these theories is also summarised briefly into the
same Table.
The Hertz theory, a well-known theory in contact mechanics, describes the
small strain deformation of spheres in an elastic range in the case of a nor-
mal, nonconformal, and frictionless contact of two solid bodies with a similar
Young's modulus and Poisson's Ratio. The JKR theory modifies the Hertz the-
ory by including an autoadhesive effect which plays an important role in the
very small deformation range. The Tatara theory invokes non-linear elasticity
and a large deformation formulation for predicting the compressive behaviour of
elastomeric spheres at large deformations. For the liquid-filled membrane sys-
tems, the liquid-drop model considers that the membrane behaves essentially as
a soap film with the surface tension forces acting uniformly in the two principal
directions on the surface and not changing with the extent of the compression.
However, it is obvious that this model is not appropriate for the elastic mem-
brane systems, such as the liquid-filled microcapsule with a polymeric membrane
which is used in the present study. The elastic membrane model treats these
systems as a thin-walled non-linear elastic membrane in which the enclosed vol-
ume remains constant under compression and that the membrane stretching,
but not the bending, forces govern the deformation. However, the shell model
describes the system as a thick-walled member in which both the stretching force
and the bending moments govern the deformation. For simplicity, the details of
these theories, which includes their basic assumptions, final equations, as well
as relative merits and demerits are presented elsewhere in this Thesis. The
JKR, Hertz and Tatara theories, are discussed in detail in Chapter 4, whilst the
membrane model and the shell model, are reviewed in Chapter 5. In addition,
the Lifshitz theory (Lifshitz 1956) which is potentially applicable to describe the
"jump contact" phenomenon (Tabor & Winterton 1969) between the spheres and
3.1 Review of the theories 49
Table 3.1 Various models available for the prediction of the deformation of
micro-cellular entities under Compression and Indentation
Authors
Tabor and Win terton
(1969)
Johnson eta!. (1971)
Models
Lifshitz theory (1937)
Experiments
Jump contact between two
cylindrical sheets of mica
JKR theory (autoadhesive Contact of rubber &
effect) gelatine spheres
Yoneda(1973) Liquid-drop model Compression of sea urchin
(the uniform tension on the eggs between the platens
surface of cell)
Lardner and
Pujara (1980)
Taber (1982)
Zahalak et a! (1990)
Zhang et al (1993)
Membrane model
(stretching energy)
Shell model (bending &
stretching energies)
(1) Liquid-drop model
(2) Finite element analysis
for Hookean material*
Liquid-Drop model
None
Compression of fluid-
filled spherical shell by a
rigid indenter
Indentation of leukocytes
Compression of
mammalian cells
Tatara, Tatara et a!.
(1991,1993)
Shima et al.(1993)
(1) Hertz theory (linear
elasticity & small
deformation)
(2) Tartar theory (nonlinear4elasticity & large
deformation)
Compression of
homogenous rubber ball
* This is outside the scope of the current study.

3.2 The identification of applicable theories 50
the platen, attached on a cantilever beam, is described in Appendix A along with
an outline of a new interpretation of the "jump phenomenon" provided by Prof.
K. L. Johnson.
3.2 The identification of applicable theories
It is obvious that most of these theories described above, corresponding to differ-
ent mechanisms, were originally developed for application to specific systems.
Henc, an interesting question may come out as this: "Can these systems be
distinguished according to the differences in their mechanical deformation be-
haviours?". To answer this question, it may be useful first to examine the load-
ing/ unloading curves for the different systems. The Figure 3.1 shows the general
features of the loading! unloading curves for three different types of structures;
homogeneous elastomeric spheres, liquid-filled spherical elastomeric membranes
and spherical shells. For a homogeneous elastomeric sphere, the loading and
unloading curves are nearly identical. The yield stress of elastomer is assumed
to be extremely difficult to achieve; that is the sphere does not fracture under
the maximum loading force. However, for the liquid-filled membrane system, the
reaction forces for unloading sharply drop to the zero after membrane bursts.
For the liquid-filled elastic shell, the reflex force, which is contributed by the
bending moment, clearly shows in the loading curve after shell ruptures.
Regarding the deformation for homogeneous elastomeric spheres, there are
four major theories. These are the Lifshitz, JKR, Hertz and Tatara theories,
which are available for the predictions of the different stages which may occur
sequentially in the loading! unloading operations (see Figure 3.2). Of course, all
of these four theories should be considered as the descriptions of diverse mecha-
nisms which govern the deformation responses. The Lifshitz theory is applicable

4.)U
0
3.2 The identification of appiicable theories
51
Displacement
Figure 3.1: The general features of the loading! unloading curves for three
different types of structures: (a) homogeneous elastomeric sphere; fracture stress
is assumed to be extremely difficult to achieve; that is the sphere does not
fracture under the maximum loading force. (b) liquid-filled spherical elastomeric
membrane; (c) liquid-filled spherical elastomeric shell when wall rupture occurs.

3.2 The identification of applicable theories 52
for the description of the "jump contact" which is mainly caused by the balance
between the potential autoadhesive force and the bending force of the cantilever
beam. After the sphere contacts with the platen, then the JKR theory may
be applicable to interpret both the loading and unloading responses which are
mainly governed by the autoadhesion and contact elastic stresses, at small de-
formations. During the unloading process, the "pull-off" phenomenon, which
is a negative (tensile) force created by the autoadhesion force when the platen
separates from the spheres may be uniquely predicted by the JKR theory. When
the deformation (dimensionless approach*) is approximately upto 5 %, the Hertz
or JKR theory, depending upon the extent of the contribution from the autoad-
hesion, may be applied to describe the loading and unloading responses. Once
the deformation is larger than about 10 %, the Tatara theory may be consid-
ered as the most suitable model for the interpretation of the force-displacement
curve. Therefore, we may conclude that, in principle, through the characteri-
sation of the compliance curves, for both the loading and unloading processes,
the appropriate theories for the systems may be identified. Thus, in summary,
a careful examination of the features of the loading and unloading curves may
provide an indication of the most appropriate analyses or theories. However,
these judgements are more securely confirmed by a corresponding examination
of the geometry of the deformation.
Dimension1ess approach is defined as the compressive displacement normalised by theinitial particle diameter.

4.,U0
I, •S lI
3.2 The identification of applicable theories 53
ci)
I,, t
/ S I I /1,
(a) Lifshitz theory (b) JKR theory (c) Hertz theory (d) Tatara theory
Figure 3.2: The various theories available for the descriptions of the sequential
stages, appearing in the loading and unloading, for the elastomeric micro-spheres
Chapter 4
The deformation of
homogeneous micro-elastomeric
spheres
This Chapter reports upon a theoretical and experimental study of the com-
pressive behaviour of microscopic (ca 300 jim) elastomer spheres over a wide
range of imposed deformations. The experimental results presented for these
micro-elastomeric spheres confirm the theoretical predictions of various limiting
case models for the dependence of the reaction force on the compressive de-
formation of an homogeneous sphere. At values of the dimensionless approach
(compressive displacement /initial particle diameter) up to 10%, the classical
Hertz theory was found to be in good agreement with experimental results and
confirms that the load is a function of the approach to the 3/2 power. At
larger deformations (dimensionless approaches from 10% to 37%), a numerical
implementation of Tatara's large deformation model for the compression of an
elastomeric sphere (Tatara 1991) gives good agreement with the experimental
results. The Tatara analysis provides a numerical solution in which the load de-
pends upon the approach to the cubic power for large deformations, and follows
the fifth power of the approach for even larger deformations. However, these two
54

4.1 Introduction 55
theories, the Hertz and Tatara theories, both neglect the autoadhesion effects
which are important in the small deformation region for certain cases. At zero,
or very small, deformations (dimensionless approach < 1.0%), an established
autoadhesion theory, the JKR theory (Johnson et al. 1971), accurately predicts
a pull-off force which is independent of the dimensionless approach. This predic-
tion has been confirmed experimentally. The analysis also accurately predicts
the form of the compliance curve.
4.1 Introduction
For a non-adhesive elastic sphere compressed between two parallel flat platens,
the force resisting deformation depends upon the approach to the 3/2-power for
small deformations. The theoretical nature of this relationship was described
in detail by Hertz (1882) and allows the deformation of the sphere in the re-
gion of the contacting platens to be fully described subject to a number of
important assumptions. The principal assumptions are that a normally loaded
non-conforming contact exists between the bodies; the material behaves as a
linear elastic body; the radius of contact area is small compared witliadius ofthe
the sphere; and that there is a frictionless contact between the surfaces result-
ing in the transfer of only normal stresses between the contacting surfaces. The
success of this model has been established, for large contacts, by a number of au-
thors, as have the limitations inherent in this theory. Some important extensions
proposed for Hertz's theory, especially for the pressure (normal stress) distribu-
tion in the contact area, have been given by Johnson (1985). Also the modified
stress (including normal and tangential stresses) distributions for rolling con-
tacts have been determined by using numerical methods (Bentall & Johnson
1967). For large deformations, Yoffe (1984) proposed a modified Hertz theory

4.1 Introduction 56
which involved a first-order correction for the errors which are introduced when
relatively large contact areas are present. Apart from purely elastic deformation,
Johnson (1968) has included a modified pressure distribution to allow for the
presence of plastic deformation within the contact region. This refinement is not
however relevant to the description of the ela.stomeric materials which are the
subject of the current study. The influence of interface friction was considered
by Johnson et al. (1973).
In a detailed consideration of the compressive mechanics of microscopic single
spherical particles, a number of specific phenomena need to be considered which
are not generally incorporated in the original Hertz theory. Specifically, these
are the influence of the adhesive surface forces and the effects of large strains. In
the case of the former, the mechanical behaviour of microscopic particles at low
loads is dominated by the action of surface forces, especially for softer materials.
Whilst for these same soft organic materials, the low strain limitation of Hertz
may easily be exceeded in many applications.
For the other loading estimate, in the case of a non-adhesive elastic sphere
undergoing a large deformation, recent experimental and theoretical work by
(Tatara 1991; Tatara et al. 1991) has shown that the elastic force is propor-
tional to the approach raised to the third power at large deformations (20 %
dimensionless approach). At very large deformations, the load dependency fol-
lows the fifth power of approach. Tatara's theory invokes non-linear elasticity
and a large deformation formulation for investigating the compressive behaviour
of elastomeric spheres upto a value of 60 % of the dimensionless approach. The
influence of autoadhesion is not considered nor are the effects of interfacial fric-
tion.
Work by Johnson, Kendall and Roberts; "JKR theory" (1971), has demon-
strated the importance of including the van der Waals' adhesive forces (or indeed

4.1 Introduction 57
any adhesive force) in describing the contact mechanical behaviour of smooth
spherical low modulus elastomeric bodies at very low loads, including zero ap-
plied load, and have detailed the modifications of the Hertz theory necessary
in order to consider these additional surface forces. In their work the adhesion
force between two solid bodies was assumed to operate over an infinitely short
distance. Contrary to the Hertz theory which assumes only compressive stress in
the contact area, the JKR theory allows for the contributions of tensile stresses as
well. In fact, JKR theory adopts an infinite tensile stress at the edge of the con-
tact circle where the surfaces are expected to deform infinitely sharply through
an angle of 900. However, Derjaguin, Muller and Toporov; "DMT theory" (Der-
jaguin et al. 1975) later developed an alternate theory which was essentially
based on the argument that the adhesion force between the solids must operate
over a finite distance and thus operates in the region just outside the contact
zone where the surfaces are a small distance apart. Hence, unlike the JKR ap-
proximation, the DMT theory assumes that the influence of attractive forces on
the stress distribution inside the contact zone are negligible. Furthermore, the
original DMT theory assumes that the deformed axial plane profile shape of the
surfaces is not affected by the surface forces and is thus Hertzian in its behaviour
whereas JKR theory assumes the resultant profile to be non-Hertzian. Although
different assumptions are inherent in both of these two theories, they both recog-
nise that the autoadhesion effect plays an important role in the deformation of
adhesive soft elastomers at very low loads.
For distinguishing the transition from the DMT to the JKR theory (both
may be regarded as approximations) Tabor (1977) was the first to introduce
a single dimensionless parameter, q, comprising the radius of particle, its elas-
tic constants, and the characteristics of the potential of interaction with the
substrate (see section 4.2.2). Subsequently, other authors have proposed other

4.2 The theories of deformation 58
single parameters, such as either i by Muller et al. (1980; 1983) or .A by Maugis
(1992), which are proportional to the parameter suggested by Tabor (again see
Section 4.2.2). These authors have agreed that for << 1 (hard solids of small
radii and low surface energy) the DMT analysis provides a better description,
whilst for i >> 1 (low elastic modulus material with large surface energy and
radius) the JKR theory is a more accurate description.
Although experiment work on macroscopic bodies has separately verified the
general validity of the two preceding theories, the autoadhesion theories and the
Tatara analysis, the unified verification of these phenomena, on a microscopic
scale, has not been demonstrated prior to the present work. The current study
provides a direct experimental verification of the relevance of these theories
with respect to microscopic particles and utilises these analyses as the basis for
a first order mechanical and interfacial characterisation of soft elastic spherical
microscopic particles which include non-Hookean behaviour, surface adhesion
interactions and large strain deformations.
4.2 The theories of deformation
4.2.1 The theories without autoadhesion effects
4.2.1.1 Hertz theory
Hertz's theory has been experimentally shown to be valid at small deforma-
tions by compressing a non-adhesive elastic sphere between two rigid planar
substrates. When the elastic spherical body is subjected to an applied contact
normal load (P), contact will occur between the sphere and the rigid planar
substrates in a circular region of radius(a), given by the following equation
13(1 —z2)RPa
= L 4E
]1/3(4.1)

4.2 The theories of deformation
59
where R is the radius of the sphere, E is the Young's modulus and ii is
the Poisson Ratio. Moreover, the approach of a Hertzian contact (as ) can be
represented as:
3(1_u2) 2/3c2
= [ 4E/ Jp213 (4.2)
4.2.1.2 Tatara theory
Recently, Tatara (1991) has developed a general theory for the compressive
deformation of a homogeneous nonadhesive elastomeric sphere under large de-
formations; say greater than 15 % nominal transverse strain. Tatara's theory
may be considered as an extension of Hertz's theory which removes two of the
main assumptions inherent in this classic model; that is the limitation of small
imposed deformations and the requirement of a linear elasticity. In order to un-
derstand the Tatara's theory, a concise description of the modifications adopted
in his formula for the case of large deformation is given ijgl1owing paragraph.the
As described in the classic contact mechanics literature (Timoshenko &
Goodier 1970; Johnson 1985), the vertical compression displacement, w(z, r),
and radial displacement, u(z, r), of half-space elastic body 1 created by a con-
centrated force (F) acting along the z axis at the pole on the surface (see Figure
4.1) in the cylindrical coordinates (z,r) are given by
w(z,r) - P 1 (1+u)z 2 2(1 —u 2 ) 1 (4.3)- 2irE [(r2 + z2)3/2 + 2 + z2)1/2](r
= (1+u)P[ r2z I zu(z, r)
2ER L(r2 + z2)312 - ( 1 - 2u) \ (r 2 + z2)h/2)] (4.4)
The half of the compressive displacement at the pole of the deformed sphere.The half-space elastic body which is defined as a semi-infinite elastic solid bounded by
a plane surface. This idealisation, in which bodies of arbitrary surface profile are regardedas semi-infinite in extent and having a plane surface, is made almost universally in elastic
contact stress theory. It simplifies the boundary conditions and makes available the largebody of elasticity theory which has been developed for the elastic half-space (Johnson 1985).

4.2 The theories of deformation 60
where w(0,r) = (1 - v2 )P/2irEr corresponding to the Hertz's approach, c,
although Hertz (Hertz 1882) derived it from the electrostatic analogy. It is worth
remembering that the equations (4.3) and (4.4) were derived by Boussinesq
(Boussinesq 1885) under the following two conditions (apart from the condition
of linear elasticity):
(i) The displacements, u, v, w in each direction of x, y, z at a point are small
as noted by = ôu/öx (here is the strain in the x direction).
(ii) The lateral strains are noted by = —vc.
In addition, in most of the conventional analyses the following critical condition
is often assumed
(iii) The radius, a, of the contact area is small in comparison with the radius,
R, of the sphere (Timoshenko & Goodier 1970; Johnson 1985).
These three conditions which may be summarised as small strain, (i) & (ii), and
small displacement, (i) & (iii), are called the assumption of "small deformation".
In general, elastic bodies like ela.stomeric sphere may undergo large strains
while the derivative of strain at each point remains small; a strain () at a point
may be expressed by the strain () at the neighbouring point as the first order;
noting (Tatara 1991)
= + öf/DXdX (4.5)
where and are large while a&/ax is small. Hence, the condition (i) may
be valid in large strains and equations (4.3) and (4.4) can be extended to the
case of large deformations, with the following modifications. According to the
theory of rubber elasticity (Treloar 1970; Green &Adkins 1970), the lateral
extension ratios X,,=) =i/./X at constant volume of \X,AZ = 1 (where )
is the extension ratio of elastomeric sample), is different to the condition (ii):

4.2 The theories of deformation 61
= —v. In addition, the symmetry of the displacements and the strains of
elastic medium in the sphere due to the reaction at the opposite contact surface
at z=2R is considered. As a result, the vertical displacement W(u,r) and the
radial displacement U(z, r) at the point (z, r) in the sphere due to a concentrated
force, F, and the reaction, —F, may be represented by
W(z, r) = w(z, r) - w(2R - z, r) (4.6)
U(z, r) = u(z, r) + u(2R - z, r) (4.7)
where w(z, r) and u(u, r) are given according to equations (4.3) and (4.4). With
these above modifications, Tatara extended the half-space elastic body model to
the case of large deformation.
Furthermore, the Tatara model includes for the case of large deformations a
strain-dependent Young's modulus model (the Poisson's ratios is assumed to be
invariant) for the behaviour of the non-linear elastic material which is based on
the Mooney-Rivlin law for elastomer deformation. Therefore, Tatara modelled
the strain-dependent Young's modulus as a nonlinear function of the strain, f,
which can be expressed as below;
(1—f) (4.8)
where the strain is positive in compression, and E0 is the Young's modulus at
f0.
A significant advantage of this theory is that it allows for the full calculation
of the deformed shape of the sphere for large strains which cannot be calculated
by the Hertz Theory; the Hertz Theory does not address this problem only the
contact deformation. The details of the derivation of the necessary equations are
given elsewhere (Tatara 1991; Tatara et a!. 1991). The primary disadvantage
of the model (apart from the lack of a consideration of autoadhesion) is the

4.2 The theories of deformation 62
need for a numerical solution to the governing equations. The final equations
developed for this analysis are shown below:
(4.9)a = a + U (a,z)
z = R - /k2 - a2
PR - v'7— a2 = A (__3
(i - 2) (i -
+ Bf(a)a2)
8E0 a 2R2 2irE0R2
3 PA I' Ba2 " f(a')PA 1' Ba2'cr = (i - 2) (1 +
- irE0 (1 +
U(z, a) - A(1 + v)P i'
Ba2
- 2irE0+)
( (.4/i+V2R_z) (1_2u)(2\./_fi_\/2R_z))
2JR3/2 - J2Rz (2R - z)
(Ba2) (_(1_2u)(1_))
irRE0 1+:
(4.10)
(4.11)
(4.12)
(4.13)
(4.14)
= [Lf(H) - at Hf( L )]/[f( t H ) - f(atL)J f(H)f(L) <0 (4.15)
where()2
1- 3B='-e+c
1—v 2(2+2v)R2f(a) = _______ +
..1a2+4R2 (a2+4R2)31"2
(4.16)
(4.17)
(4.18)
(4.19)

4.2 The theories of deformation
63
z
Figure 4.1: Schematic of the symmetrical shape of a soft elastic sphere com-
pressed, at large stains, between two flat rigid surfaces, and the movement of apoint C(z, r) on the surface before deformation to C'(z', i") after deformation,where U(z, i-) and U(R) indicate the lateral extensions at the contact surface
and the central diameter, respectively. The is the approach; a' is the com-
puted radius of the contact surface at the vertical position (z); a is the radius
before deformation. (adapted from Tatara's original paper (1991))

4.2 The theories of deformation 64
where c is the compressive approach distance (which was expressed as -y in
Tatara's original paper); a' is the computed radius of the contact surface at the
vertical position (z) with a lateral extension U(z, a); a is the radius without the
lateral extension; U(R) is the lateral extension at the central diameter; E0 is
the initial Young's modulus (the Young's modulus at small deformations). A
schematic diagram which concisely describes the geometric interrelationships of
the above variables is shown in the Figure 4.1. Equation (4.15) is the basis of
the "two points and circulation method" which was used by Tatara et al. (1991)
for determining the solution of crtM, the medium point of , by the two points,
L and ag", the high point and low point of .
The algorithm developed in the present work and adopted here is an enhanced
version of the original algorithm as proposed by Tatara et al. (1991). This new
version is significantly more efficient in computing the required solution set.
The flow chart for this algorithm is shown in the Figure 4.2. The improvement
in efficiency, in terms of computation time is circa a factor of 5. A computer
program developed based upon this algorithm is reported in Appendix B.
4.2.2 The theories with autoadhesion effects
Two models have been widely adopted to correct for the behaviour of Hertzian
contacts in the presence of surface forces; the JKR and DMT theories mentioned
previously in Section 4.1. An experimental investigation of the contact area
between optically smooth rubber and gelatin spheres for very low loads found
that the areas of contact measured were significantly larger than expected based
on the predictions of the Hertz theory. The JKR theory was directly developed to
explain these observed differences. This theory takes into account the additional
deformation near the contact periphery resulting from the interaction of surface
forces operative at the interface. Essentially, these authors modified the Hertz

END
YESYES
Sub F 367(y)
a=O to SR
fL=S ub F45C1,aL)
aH=a+O.1R
1LH>0
eq. (9) for afM=Sub F45(y,aM)
( STARJ
9)
fL=Sub F367(y)
YHY°f=Sub F367('y141
L1H>0
eq. (9) for YfM=Sub F367()
IYH- Yu<105
YES
NOLM >0 -
t. M
4.2 The theories of deformation
65
YESi aH - aU <
eq. (6)eq. (3)
eq.(7)t'L M >0
LM I H=M ]aL = a ,4 an—a
IM I
______ (TURN
(Sub F45(iaJ
eq. (4)eq.(5)
RE1U9
Figure 4.2: The flow chart for the enhanced version of the algorithm for solving
the set of the equations of the Tatara theory used in the current study.

4.2 The theories of deformation 66
theory for two adhering, smooth, elastic spheres to include the thermodynamic
work of adhesion, (L-y). By using an excess surface free energy relationship
similar to the Dupré equation (Wu 1982) the thermodynamic work of adhesion
introduced by these authors may be expressed as below;
= 'Xi + 'X2 - 'Y12 (4.20)
where 'y is the excess surface or interface free energies; the subscripts denote
the surface 1 and 2 and the interface 12. The analysis predicts that a finite
pull-off force is required to separate the solids, and that this force depends only
upon the mutual radii of curvature and their surface energies of the solids, but
not upon their elastic moduli. Rather remarkably the force does not dependent
on the original area of contact (Greenwood & Johnson 1981). Johnson et al.
considered a balance between the surface work, the stored elastic strain and the
potential energy. The final relationship for the autoadhesion (pull-off) force is:
PC = —3/2irRzy (4.21)
where P is the pull-off force or the force of attraction, R, is the mutual radius
of curvature. Generally, the mutual radius of curvature is:
1 1 1(4.22)
where R1 and R2 are the Radii of bodies. In the present case (flat plates in
contact with a sphere; 112 tends to infinity) R is equal to the radius of the
sphere.
Since the JKR theory takes into account the adhesion force of the solids,
by including the surface energy, the apparent Hertz load P1 acting between two
elastic bodies is greater than the applied load P. The relationship between P1
and P has been given by these authors as below:
Pi = P + 3Li'yirR + \I61rL'XRP + (3irz-yR) 2 (4.23)

4.2 The theories of deformation 67
Hence, equation (4.1) of the Hertz theory may be modified by including surface
forces which allows the radius of contact area (a3 kr) to be represented as below:
13R(1 -a3kr = 4E j
(4.24)
When Li-y is zero, the equation (4.24) is reverted to the equation (4.1) as pro-
posed by the Hertz theory. Furthermore, the approach can be expressed as
below:1jkr - [2yajkr (1 -
v2)Jh/2
(4.25)R E
where is the approach distance which is created by the compressive force
combined with the autoadhesion force.
In addition, another useful equation gives the pressure, or stress, distribution
within the contact circle as
_________________ _________________ 2 -1/2___________ 2.h/2 ( __2ELy 1/2
(1_x)- (12)) (1_x) (4.26)
8E7r
where x = r/a, k (see Figure 4.3). This equation indicates that a infinite tensile
stress occurs at the edge of the contact circle (at x=1), equivalent to a crack at
this region.
Detailed descriptions of the DMT theory are given elsewhere (Derjaguin et al.
1975). The theory may be concisely summarised by one principal equation, the
final relationship for the autoadhesion force, and is expressed as:
P = — 2irRL%'y (4.27)
The differences between the two approaches and their relative merits have
been discussed in detail by Tabor (1980), Derjaguin et al. (1980) and Maugis
(1992). They are both limiting solutions and there is a transition from the
DMT limit to the JKR limit which has been described by the increase in the
singk dimensionless system characteristic parameters which were suggested by

4.2 The theories of deformation 68
Equilibrium
(a)
Pull-off
(b)
Figure 4.3: (a) Deformable (elastic) spheres on a rigid surface in the absence
(Hertz) and presence (JKR) of adhesion. (b) elastic adhering sphere about to
separate spontaneously from an adhesive contact. Adapted from Israelachvili
(1991), by permission.

4.2 The theories of deformation 69
Tabor (1977), Muller et al. (1980) and Maugis (1992). Since all of these various
parameters suggested by different groups are proportional to each other, the
current study has simply adopted the form introduced by Muller et al. and it
may be expressed as below:
32 12Ry2 (1 - u2 2 1/3
=L irE2e3 }
(4.28)
where e is the equilibrium separation distance between the atoms at the interface.
The choice of the value of € is somewhat arbitrary; conventionally the value is
taken as the order of an interatomic distance. The transition region is in the
range of the values of of the order of unity. Values of u greater than unity are
consistent with systems which best approximate to JKR limit and vice versa.
For the current cases described later (R 150 m, iy 82 mJ m 2 , ii
0.48, E 2.06 MPa and e 5 A°), the i value may be calculated as the order of
1000. Hence, on this basis, the JKR theory is the most suitable approximation
for the current systems and it is adopted in the subsequent analyses described
in this Chapter.
The influence of surface topography and bulk viscoelastic contributions on
the response of these contacts has also been studied; for example, Fuller & Tabor
(1975), Johnson (1975) and Briggs & Briscoe (1977) have studied the reduction
of adhesion due to roughness. Various authors have noted the increase in ad-
hesive force due to viscoelastic contributions to the peeling work; Greenwood &
Johnson (1981), Andrews et al. (1982), Maugis (1985), Kendall (1987), Briscoe
& Panesar (1991) and Kendall (1994).

4.3 Experimental
70
4.3 Experimental
4.3.1 Material preparation
Poly(urethane) spheres were prepared from a commercial two part resin system
and were polymerised using the manufacturer specified cure cycle (Kemina Poly-
mers, UK, Diprame 54 series). Firstly, the two part resin system was mixed and
degassed under low vacuum. A single aramid ("Kevlar"49, Dupont de Nemours,
USA) monofilament, 11 micron in diameter and 25 mm long, was firmly attached
and stretched across the top of a fibre holder made from a U section of glass
rod. By carefully pulling the fibre holder through the surface of the resin system,
small droplets of resin would naturally form along the fibre length due to the
action of wetting forces. These large resin droplets, between 50 micron and 500
micron in diameter, were attached to the fibre in the glass holder and were then
placed in an oven at 60°C for 12 hours to allow the polymer to cure. The cured
microspheres were then carefully removed from the fibres . Optical examination
confirmed the spherical nature of the elastomer particles produced.
4.3.2 Experimental procedure
A particular micro-elastomeric sphere (ca 300 pm) was placed on a glass plate
situated underneath the microscope lens. Then, the original (undeformed) di-
ameter of the sphere was measured through the image of its bottom view shown
on the television linked with the microscope; see section 2.1.3. The microplaten
was moved down to the position of approximately 10 pm above the selected
sphere and then driven at a constant speed, typically 1.0 or 5.0 pm sec 1 , to
A hole was created by the removal of the fibre in the examined poly(urethane) sphere.
The volume of this hole is only a small fraction of the total volume of the sphere (about 0.24%). Hence, it may be reasonable to assume that the influence of this hole on the deformation
of the sphere was negligible.

4.3 Experimental 71
compress the sphere. The imposed force and the compressive displacement of
the deformed sphere during the loading and unloading (including the regions
of the "jump contact" and the "pull-off" stages) were automatically recorded
through the data acquisition system linked with the personal computer. The
diametrical extension of the deformed shape of the sphere was also continuously
measured and recorded by the microscope-linked video.
In order to explore the scaling effect on the mechanical response of these
materials, the deformation of a macroscopic elastomeric sphere (ca 38.3 mm)
was examined by compressing it between two parallel platens. The sphere was
manufactured in a simple model using the preparation method described for the
microspheres. One of these two platens, which is firmly attached on the "load
cell" of the Instron testing machine, is able to vertically move at a constant
speed and to continuously sense the reaction force of the compressed sphere.
The speed of the moving plate (or applied stain rate) was about 0.1 mm per sec-
ond, during both the loading and the unloading processes. The imposed forces
and the compressive displacements of the squeezed sphere were automatically
recorded by the data acquisition system associated with the personal computer.
However, the measurement of the diametrical extension of the deformed sphere
was carried out by another independent experiment. In that experiment, the
imposed deformation was gradually increased by a constant amount of displace-
ment (about 3.83 mm; equivalent to 10 % deformation). Following each increase
of the imposed deformation, the extended diameter of the compressed sphere was
routinely measured by using a pair of callipers.
The above experiments were conducted in the temperature range from 20 to
23 °C in ambient conditions; relative humidity ca 40%.

4.4 Results and discussions 72
4.4 Results and discussions
The experimental results, associated analyses and preliminary discussion are
provided in two main parts; Section 4.4.1 and 4.4.2. Section 4.4.1 discusses the
low strain (small dimensionless approach) data where the influence of autoad-
hesion predominates. Section 4.4.2, which is composed of three sub-sections,
considers the case of larger deformations where the influence of autoadhesion
may be neglected and the bulk mechanical responses will be the prevailing in-
fluence.
4.4.1 Autoadhesion effects
At zero and very low imposed loads (the dimensionless approach <1.0%) the
importance of surface adhesive forces is clearly evident in the experimental data
shown in Figure 4.4. This curve is a record of the imposed displacement and
the sensed (uncorrected) force provided by the load transducer for a 300 um
poly(urethane) sphere during a loading and unloading cycle. Between the points
S and A indicated in Figure 4.4 the upper platen (attached to the force beam)
approaches the sphere. At A the beam "jumps" into contact and a tensile force is
detected. Between A and B the sphere is compressively loaded; at A' the applied
load is zero. Unloading commences at point B and the following curve between
the points B and C is the unloading portion. The force difference between the
points C and D represents the pull-off force due to adhesion forces between the
elastomer particle and the glass platens. The effects of applied strains (or the
dimensionless approaches), f, and strain rates have also been examined and the
measured pull-off forces are shown in Table 4.1. By using the equation (4.21)
from the JKR theory, the work of adhesion, can be specifically calculated to be
82 + 14 mJ m 2 when the rate of pull-off is 1 jtm sec 1 . Thus the surface free

4.4 Results and discussions 73
energy of the poly(urethane) elastomer may be estimated as ca 40 mJ m 2 , this
is a value which is consistent with those reported in the literature (Wu 1982).
The measured work of contact adhesion, or autoadhesion, between polymers and
smooth glasses has been reported in a number of other studies. Most of these
values are about 100 mJ m 2 (Tabor 1987) and are consistent with the current
experimental results reported in the Table 4.1. The results obtained also show
the work of adhesion is independent of the levels of the applied strains. However,
there is a detectable influence of the rate of separation (again see Table 4.1).
Many studies (Greenwood & Johnson 1981; Andrews et al. 1982; Maugis
1985; Kendall 1988; Briscoe & Panesar 1991; Kendall 1994) have shown that if
there is a significant viscoelastic contribution to the deformation of elastomers,
then the magnitude of the autoadhesion will be affected by the rate at which the
interfaces are separated. In this case, the measured work of adhesion, F, may be
more than the thermodynamic work of adhesion,Ly, often by several orders of
magnitude. Hence, the data shown in Table 1 represent not the thermodynamic
work of adhesion, but rather the measured work of adhesion. In this study, when
the rate of pull-off was increased 5 times (5 j.im sec 1 ) then the measured work of
adhesion increased about 17 %. This result shows the viscoelastic contribution
to autoadhesion. The effect is apparently small for the present system.
The "jump" into contact noted at point A is reminiscent of the phenomena
t utilised by Tabor and Winterton (1969) to measure long range Van der Waals
surface forces between micas. The jump distance (H0 ) may be simply calculated
by the equation (shown as below) proposed by Israelachvili and Tabor (1972);
nA
H0 = [6K/R](4.29)
where A is the Hamaker non-retarded force constant; n is the power law of the
tThe details of "jump contact" phenomenon are reported in Appendix A.

4.4 Results and discussions
73A
The measured force in the loading curves between the points A' and B appears
not to smoothly increase with the imposed displacement (see Figure 4.4). This
behaviour may be attributed to the roughness at the interfaces between the sphere and
the two parallel glass surfaces. When the imposed displacement increases by a small
increment, the contact area is initially restrained by the asperity of the roughness from
moving freely to the curvature matching between the sphere and the glass. Sudden
expansion in the contact area may then occur following to a further increase in the
displacement, thereby the force increasing does not behave monotonically. The same
phenomenon may happen in the unloading process. The non-smooth decreasing of the
measured forces shown in the unloading curve between the points B and C, may also
be attributed to this mechanism.

600
z.
4000
4.4 Results and discussions 74
1000
800
200
0
-200
uispiacemenr wm,
Figure 4.4: Typical loading/unloading curve for the small deformation experi-
ment. Starting (5); contacting (A); loading (AB); unloading (BC); pull off (CD);
ending (E). The members "jump" (see Appendix A) into contact at A. At A'
the applied load is zero. The pull-off force corresponds to the difference between
the magnitude of the forces at points C and D.

4.4 Results and discussions 75
Table 4.1 Effects of strain (dimensionless approach) and strain-rate (pull-off speed) on adhesions of microscopic Poly-
(urethane) spheres (300 pm) in contact with two glass plates
Dimensionless approach Strain rate Pull-off force The work of adhesion(%) (pm sec_i) (pN) (mJ m_2)
4.1 + 0.1 1.0 58 + 9.8 82 + 146.8 ± 0.1 1.0 58 ± 9.8 82 + 144.1 ± 0.1 5.0 68 ± 9.8 96 + 14

4.4 Results and discussions 76
law of the force (usually n=2.0+0.1 for the non-retarded cases); K is the stiffness
of cantilever beam. In current instrument the stiffness of the cantilever beam was
about 1.67x10³ N m 1 , and the Hamaker non-retarded force constant is assumed
as 1.35x10' 9 J. Then, the jump distance, H0 , can be calculated as about 1.7 nm.
This result is much smaller than the experimental jump distance deduced from
Figure 4.4 which is of the order of 700 nm. Hence the negative force exhibited
around point A cannot be simply attributed to the action of a long range Van
der Waals surface force. It is notable that the noise shown in figure 2 for the
force beam, which is a manifestation of the vibration of the beam, is significantly
less than the observed jump distance. However, it is likely that additional higher
amplitude "spike" vibration noise is present which is beyond the sensitivity of
the detection system. Thus, we consider that the jump may be partly promoted
by a random high amplitude movement of the force transducer. Apart from this
vibration effect, the electrostatic attraction which occurs with some systems as
a result of charge separation across the interface may also play a role in this
"jump" contact phenomena (Derjaguin et al. 1978). These electrostatic forces
may be significantly greater in magnitude than the non-retarded Van der Waals
forces computed using equation (4.29). It may be noted here that no attempt
was made in this study to dissipate the electrostatic charging of the substrates
which were both good electrical insulators. At present the origin of this large
"jump" force, real or apparent, is unresolved '.
The interrelationships between the loads and the dimensionless approaches
'Professor K. L. Johnson (private communication) has recently analysed the "jump" phe-nomenon by considering the details of the force displacement characteristics of this particular
system; essentially by an examination of the form of Figure 4.5. His analysis, which appears to
be both correct and attractive in principle, correctly predicts the observed "jump" distances.
Essentially he includes effects due to the relaxation of the lower contact and also the trans-
ducer beam and concludes that the observed 'jumps" distance is of the order of one half ofthe distance OA. This analysis is considered further in Appendix A.

4.4 Results and discussions 77
under very small deformations ( dimensionless approaches from -1.0% to 1.0%)
have been investigated in detail by both theoretical and experimental studies.
The Figure 4.5 shows the theoretical predictions for both the JKR and Hertz's
theories as well as the current experimental data obtained at different pull-off
speeds (1 and 5 im sec'). Due to the experimental uncertainty in detecting
the initial contact point between the glass platen and the poly(urethane) sphere
(see earlier) an offset correction to the experimental data is required. The data
(Case A) is the experimental data translated from the original measured data
by shifting a displacement of 0.6 1um which represents this arbitrary zero point
correction; the magnitude of the correction is of the order of the "jump" distance
mentioned previously. The results shown in Figure 4.5 clearly demonstrate that
there is a good agreement between the JKR theory (see the equations (4.24) and
(4.25)) and experimental data, especially for the behaviour under the negative
loads (tensile forces) which cannot be predicted by the Hertz theory. The points
P and Q shown in the Figure are the instability points which represent the
minimum dimensionless approach and minimum force, respectively and may be
expressed as below (Maugis 1992): Point P;
I27ir 2 y 2 (1 - y2 2 1/3
== - { 64E ]
(4.30)
Pp = —5/6irzyR
(4.31)
and Point Q;
* 137r2Ii'2(1-2 1/3
= - [_64E2](4.32)
P = P = —3/2iryR (4.33)
According the predictions of the JKR theory, the application of a tensile (pull-
off) load to the platen causes the radius of the contact area to shrink further,
and then the situation becomes unstable and the surface separate at point Q. If,

4.4 Results and discussions 78
instead of controlling the load, we control the approach of c between the solids
the adhesive contact is stable down to point P (Johnson 1985; Maugis 1992)
Hence, the experimental data which closely follow the theoretical curve up to
the instability points are consistent with the predictions of the JKR theory.
Some studies (Fuller & Tabor 1975; Johnson 1975; Briggs & Briscoe 1977)
have shown that the presence of surface roughness, contrary to the viscoelastic
effect, may reduce the adhesion. According to these experimental observations,
the adhesion force between a very smooth rubber sphere and a hard counterface
prepared with various degrees of surface roughness, depends upon the counter-
face roughness and the modulus of the elastomer but not the contact geometry.
Actually, these analyses assume an infinite array of contacting asperties; see
later.
Fuller and Tabor (1975) introduced an 'adhesion parameter' 0 which is the
ratio of the adhesion force of a sphere (actually an asperity radius, /3) and the
elastic force needed to push the sphere to depth, o, into the solid, where o was
taken as the distribution of the asperity heights. An explicit expression has been
given as below:Ecr312/3"2
0 = z-y3
(4.34)
A value of 0 > 10 corresponds to the case of very small adhesion. The adhesion
force between the smooth poly(urethane) sphere and a rough brass platen was
also measured in the present study. The adhesion force in this case is less than
the force resolution of the instrument (10 tiN). If the Young's modulus and
z.-y values are assumed to be about 2.25 MPa (which is the value described
in Section 4.4.2.1) and 100 mJ m 2 , respectively, then the above relationship
may be tested. The asperity radius (/3), measured optically via the calibrated
camera system, is about 4 sum. Then, the surface roughness, o, may be estimated
to be greater than 0.9 tim. This result is consistent with an optical estimate

coo coA OQO
-0.005:)A
o
o:o0.005 0.01
0 cD..-ö0.015
zECDC)
0U-
-0.01
4.4 Results and discussions 79
0.2
Hertz theory00
JKR theory- A
0 CaseA -, £0.AOO
A CaseB
0.1
0
-0.1
cx*
Figure 4.5: The comparison of the theoretical (predicted by Hertz and JKR
theories) and experimental unloading curve for small dimensionless approaches(c*) . Case A; translated experimental data (by shifting a displacement of 0.6
m) for the pull-off speed 1 jim sec 1 , Case B; experimental data for the pull-off
speed 5 jim sec1.

4.4 Results and discussions 80
of the roughness of the brass platen (which is about 2 tm). With regard to
the reduction of measured adhesive force, an alternative explanation has been
suggested by Briscoe (1987). Since the radius of particle, R, is comparable with
the asperity radius (3), the number of the asperities contacting with the particle
may not be treated as many, as assumed in the Johnson and Tabor model,
but few. Then the reduction fraction of the measured adhesive force may be
expressed as /3/R; simply by adopting R as the mutual radius of curvature in
equation (4.22). Hence, in the current case the measured adhesive force may be
reduced to 3 % of the original adhesive force (assuming an asperity radius of 4
m for a point contact), which is beyond the sensitivity of the detection system.
4.4.2 Mechanical responses
4.4.2.1 Compressive compliance
The predicted theoretical curves of the loading force versus the dimensionless
approach for both the Tatara and the Hertz theories, for a 270 m diameter
poly(urethane) sphere, are shown in Figure 4.6; neither analyses considers the
contribution of provided by autoadhesive forces. Also shown in this Figure
are the experimental results obtained for a single elastomer particle 270 m
in diameter. The Poisson ratio of the poly(urethane) spheres examined in the
current study was experimentally found to be 0.48 (see Section 4.4.2.3) and this
value has been used in these theoretical calculations. The particle radii were
measured optically via the calibrated video camera system.
Figure 4.6 shows that the predictions of the conventional Hertz theory leads
to significant errors when the dimensionless approach exceeds about 10 % in
comparison with both the experimental data as well as the predictions of the
Tatara theory. Since c is equal to a2 /R2 (a is the radius of the contact area) , the
above result implies that in the current case the Hertz theory is accurate for a/R

Adhesion Force -Hertz load -
4.4 Results and discussions 81
values up to 0.33. Johnson (1985) has shown that for experiments on "Araldite"
(a commercial epoxy resin, Ciba Geigy, UK) spheres the Hertz approximation
was adequate upto values of a/R 0.3. For larger approaches, the experimental
data and the predictions of the Tatara analysis are in reasonable agreement.
By using the Hertz theory, a Young's modulus of 2.25 MPa has been cal-
culated based on a linear least square fit of the imposed loads as a function
the 3/2-power of the approach using the experimental data in the range 5% up
to 10% deformation (dimensionless approaches). However, by using Tatara's
theory with a minimum least-squares (MLS) fitting for a much wider range of
experimental data (upto 37 % deformation) the corresponding initial Young's
modulus, E0 , was found to be 2.06 MPa; a difference of circa 10%. This slight
difference is primarily due to the over estimation of the strain dependency of the
Young's modulus introduced by the Tatara theory, at large deformations. Thus,
the Tatara theory with a MLS fitting, may be regarded as a successful method
for the characterising of the Young's modulus of these micro-elastomeric spheres
for a large range of deformations.
Since the Hertz theory and the Tatara analysis both neglect the adhesion
force between the elastic bodies, it is appropriate to estimate the influence of
this force upon the evaluation of the magnitude of the compressive compliance
for the large deformations introduced into the present system. An explicit re-
lationship, derived from the JKR theory by Johnson (Johnson 1993), suggests
that the ratio of adhesion force to the Hertz load is as follows;
PaPaP1—P1(2h/2 - (6RLy'\"'2 -
2\¼P1 ) P1 1 - (4.35)
where Pa ( =/67rAyRP1 ) is the effective force of adhesion. The three dime-

4.4 Results and discussions 82
0.05
0.04
0.03
0.020
0.01
0.00
—0.010.0
Hertz theory
- Tatara theory
Tatara theory with MLS fitting
o Experimental data
0.1 0.2 0.3 0.4*
a
Figure 4.6: The comparison of experimental and theoretical load versus di-mensionless approach, &, curves for a 270 urn poly(urethane) sphere. The
experimental data and various predictions are shown. The Young's moduli are
respectively 2.25 MPa for the Hertz predictions and 2.06 MPa for the Tatara
analysis. The Poisson's ratio is taken as 0.48.

4.4 Results and discussions 83
nionless variables, F, a and P1 , are defined as below;
P = (37rLR)
(4.36)
aa = (4.37)
(9YR21_u2))h/34E
= a (4.38)
From Figure 4.5, the value of P is about 50 N. Hence, the equation (4.35)
gives an estimate that the ratio of the adhesion force to the Hertz load as about
10%, when P1 is approximately 0.02 N where the corresponding dimensionless
approach (about 25%) is far beyond the satisfactory fit of the Hertz region in
Figure 4.6. Hence, in the Hertz region when neglecting the autoadhesive forces,
we introduce significant (at least more than 10%) errors in the evaluation of
the compliance. However, at the larger deformations (30%), the value of the
compressive force is about 24 mN as calculated by Tatara theory and the value
of the adhesion force is about 2.3 mN computed by using the equation (4.23).
Since the contact area for these large deformations may be over estimated by the
JKR theory, the true adhesion should be much less than 2.3 mN. It thus seems
that the neglect of the adhesion force contribution in the Tatara theory may
cause the appreciable errors to some, but an unknown, extent, in the evaluation
of the elastomer microsphere compliance.
It is physically intuitive that, at very low applied loads (P << 3/2iryR),
the magnitude of the adhesion force, as compared with that of the mechani-
cal force proposed by Hertz, has a greater contribution to the deformation of
microspheres than large spheres; the compressive force is proportional to the
square of the radius at a constant dimensionless approach (see equation (4.39)
and (4.40)), while the adhesion force is directly proportional to the radius, (see
equation (4.23)). Equation 4.35 express this effect in a quantitative manner.

4.4 Results and discussions 84
4.4.2.2 Scaling effects
The scaling effects for the Herzian contact have also been investigated by com-
paring the theoretical and experimental dimensionless applied load versus dimen-
sionless approach curves for a 38.3 mm poly(urethane) sphere and the micro-
poly(urethane) spheres (300 jim) (Figure 4.7); a variation in the radius of a
factor of approximately one hundred. The theoretical curve is predicted from
the Hertz theory which shows that the reaction force is proportional to the
3/2-power of the dimensionless approach. Hence, the interrelationship between
the dimensionless approach and the dimensionless applied force, P/K', may be
expressed as;
*3/2
where K'is,4ER2
3(1 - u2)
(4.39)
(4.40)
However, the dimensionless applied forces of these two spheres are both under
estimated by the Hertz theory for the larger dimensionless approaches. The
above results show that this description of the scaling effects may be reasonably
valid in the medium range of the deformation regime for the Hertzian contact
region. However, since the formulation of the Tatara theory is intrinsically
complex, there is no explicit solution available to describe the interrelationship
between the dimensionless applied load and the dimensionless approach for the
larger deformations.
4.4.2.3 Geometric features of deformations
The dimensionless central lateral extension (the ratio of U(R) to R), U*(R),
versus the dimensionless approach curves shown in Figure 4.8 were obtained

4.4 Results and discussions 85
0.08
0.06
0.04
0.02
0.00
v Micro PoIy(urethane) Sphere (300 /tm) v• Large Poly(urethane) Sphere (38.3 mm)
VTheoretical Prediction (by Hertz Theory) vv
VV.VV
VV VSV
VVVV •
VVV
V •
VV\1i7••
- •
I I I I I I
—0.01 0.00 0.01 0.02 0.03 0.04 0.05 0.06 0.07
* 3/2a
Figure 4.7: Comparison of the theoretical and the experimental dimensionless
applied load, P/K, versus dimensionless approach (at) curves for 300 jm and
38.3 mm poly(urethane) spheres.

4.4 Results and discussions 86
both experimentally and also computed using the Tatara theory. The dimen-
sionless central lateral extensions of the 240 im and the 38.3 mm poly(urethane)
spheres are both under-predicted in the small deformation regime by the Tatara
theory. Some of the original photographs of the deformed micro-sphere which
were visualised from the bottom view are shown in the Figure 4.9. This dif -
ference may arise from the constant volume assumption adopted by the Tatara
theory; essentially the Tatara analysis assumes a constant Poisson ratio. For
large deformations good agreement was observed.
Using Tatara's theory, a family of lines for the computed dimensionless ap-
proach versus dimensionless central lateral extension for different chosen Poisson
ratios values are shown in Figure 4.10. Apparently, the equations (4.12) and
(4.14) for the calculation of c and U(R) are both associated with the Young's
modulus and Poisson's ratios. However, combining equations (4.12) and (4.14)
gives an alternative relationship which only includes the Poisson's ratios and
may be expressed as below;
3Rlr(1_112)
(1 + Ba2 f(a')R (i Ba2
___ - ____ 4a' (4.41)i Ba2U (R) - U (R) = (1 + ii) (1 i- -) ( - (1 - 2v) (1 -
From these predictions, and by the use of the equation (4.41), the Poisson ratios
of a single elastomeric spheres may be simply characterised by measuring the
two major experimental deformation parameters; the dimensionless approach
and the dimensionless central lateral extension variation. An explicit numerical
correlation between the Poisson ratio, ii, and the dimensionless central lateral
extension, U5 (R), for the deformation at 40% dimensionless approach are pro-
vided in the following equations
Li (US (R)) = 81.163 (U* (R)) 3 - 38.535 (U* (R)) 2 + 6.989 (U* (R)) + 0.04242
-
(0.0485 U5 (R)) (4.42)

4.4 Results and discussions 87
0.4
• Micro PoIy(urethane) Sphere (240 i.Lm)
V Large Poly(urethane) Sphere (38.3 mm)- Theoretical Prediction (by Tatara Theory)
0.3
0.2
0.1
0.0'0.0 0.1 0.2
0.3 0.4 0.5 0.6*
a
Figure 4.8: Comparison of the theoretical and the experimental dimensionlesscentral lateral extension, U*(R), versus dimensionless approach, &, curves for240 ,um and 38.3 mm poly(urethane) spheres.

(a)
(c)
(b)
(d)
4.4 Results and discussions 88
Figure 4.9: Photographs of the deformed elastomeric sphere (ca 240 j.im) from
a bottom view for various dimensionless approaches (a); (a) a=0 % (b) a 9.5
% (c) a= 28.3 % (d) a= 55.8%.

4.4 Results and discussions 89
v (U* (R)) = —126270 (U (R)) 4 + 12173 (U (R)) 3 - 473.2 (U* (R))2
+ 16.94 (U* (R)) - 0.0984; (U*(R) < 0.0485) (4.43)
Thus, for the poly(urethane) materials which have been used in the current
study, the value of Poisson's ratio was computed as about 0.48 + 0.007 based
upon the experimental data shown in the Figure 4.8. Then, another important
mechanical property, the bulk modulus K5 ( = E/3(1-2v) ), may be calculated as
about 20 MPa. This value seems to be too small for these elastomeric materials
based upon accepted norms. The bulk modulus of most elastomeric materials is
usually about 1 CPa; to achieve such a high value, the value of Poisson's ratio
should be at least higher than 0.4997. However, it should be pointed out that the
uncertainty in Poisson's ratio value determined by the current method (shown
above as 0.007) is a nominal uncertainty which does not include the potential
error sources contributed by the limited resolution of the optical system, the
numerical truncation errors and the quasi-spherical shape of the elastomeric
spheres examined. The latter effect is a significant factor, but is not a source
of error which is readily quantified. Thus we may conclude that although the
Poisson's Ratio may be computed by these means the potential uncertainty is
high for these incompressible materials.
The contact area measurement has been the key experimental variable used
in the evaluation of both the Hertz's and the autoadhesion theories; the initial
motivation for the development of the JKR theory arose from a desire to explain
contact area data. Though the measurement of the area of contact has been
proven to be viable in large scale macroscopic experiments, it has proven to
be far more difficult at the microscopic scale. Due to the diffraction limit,
the resolution of conventional optical systems is, at best, 0.25 ,um. However,
practically it can often be difficult to resolve dimensions of less than 1 jim and

4.4 Results and discussions 89A
The error in the estimation of the Poisson ratio for the sphere may be raised from
the inappropriate boundary condition adopted by the Tatara theory, such as the
frictionless interface between the sphere and the plates. The influence of the friction
force, as mentioned in detail in section 4.4.1, which restrains the contact area from being
freely conformed to the plates, may cause variation in the central lateral extension
measurements. In order to examine quantitatively this effect, a further study may be
suggested to be carried out by compressing the sphere with well-lubricated platens, such
that the effect of asperities may be eliminated.

4.4 Results and discussions 90
1.2 I I Iv=0.5
1.0 -
0 . 8 -
0.6 -
0.4 -
0 . 2 -
0.0 -
—0.2 I I I0.0 0.2 0.4 0.6
*a:
Figure 4.10: Simulated dimensionless central lateral extension, U*(R), as a func-
tion of dimensionless approach, c4, for various Poisson ratios (v) computed by
the modified Tatara analysis.
3
=0.1
v=-0.3v=-0.5
v=-0.8
0.8 1.0 1.2

4.5 Summary 91
other workers have also noted that the precise measurement of the contact area
for microscopic systems has proven to be intractable (Evans & Skalak 1979). For
a 100 zm sphere the contact diameter is calculated as ca 4 um for zero applied
load. Hence, the resolution of optical system would result in an error of possibly
as large as about 25 %. We may thus conclude that contact area measurements
are generally not viable as a means for accurately characterising these systems.
4.5 Summary
For the present micro elastomeric spheres, at small deformations, the influence
of autoadhesion, as modelled here by the JKR theory, predominates the contact
compliance. Theory and experiment are in good accord. Whilst in the case of
large deformations for non-linear elastic materials the lateral extension of the
compressed sphere, as modelled by Tatara theory, plays an important role in
governing the gross deformation. Again, theory provides a good description of
the experimental data. The lack of a consideration of autoadhesion in both the
Hertz theory and the Tatara theory may cause significant errors in the eval-
uation of the compliance in the small imposed deformation region. The JKR
based analyses, combined with the experimental data of the measurements of
the pull-off forces, allows the apparent interfacial free energy to be accurately
determined. Furthermore, the results have also shown that the presence of sur-
face roughness may reduce the apparent adhesion; these viscoelastic materials
exhibit an increased apparent interfacial free energy with the rate of separa-
tion. The Tatara based analysis, combined with experimental data, at a 40%
dimensionless approach, allows the explicit estimation of the Poisson Ratio for
these elastomeric particles. The potential errors are however significant. The
application of the Hertz or Tatara analyses, depending upon the dimensionless
4.5 Summary 92
approach regime experimentally investigated, also allows the Young's modulus
for a single particle to be accurately determined.
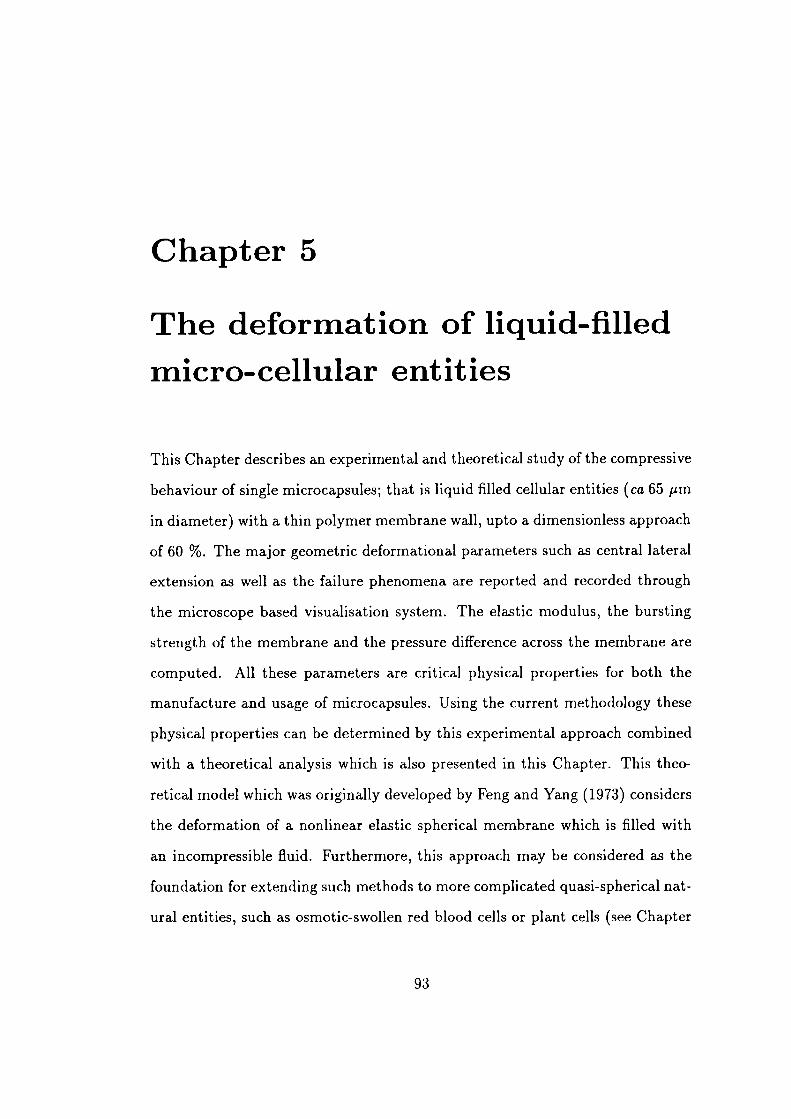
Chapter 5
The deformation of liquid-filledmicro-cellular entities
This Chapter describes an experimental and theoretical study of the compressive
behaviour of single microcapsules; that is liquid filled cellular entities (ca 65 ,um
in diameter) with a thin polymer membrane wall, upto a dimensionless approach
of 60 %. The major geometric deformational parameters such as central lateral
extension as well as the failure phenomena are reported and recorded through
the microscope based visualisation system. The elastic modulus, the bursting
strength of the membrane and the pressure difference across the membrane are
computed. All these parameters are critical physical properties for both the
manufacture and usage of microcapsules. Using the current methodology these
physical properties can be determined by this experimental approach combined
with a theoretical analysis which is also presented in this Chapter. This theo-
retical model which was originally developed by Feng and Yang (1973) considers
the deformation of a nonlinear elastic spherical membrane which is filled with
an incompressible fluid. Furthermore, this approach may be considered as the
foundation for extending such methods to more complicated quasi-spherical nat-
ural entities, such as osmotic-swollen red blood cells or plant cells (see Chapter
93

5.1 Introduction 94
6.).
5.1 Introduction
Microcapsules, that is liquid filled cells with thin membrane walls, are beginning
to be used in the pharmaceutical, agriculture, food industries, as well as in
biomedical technology industries for a wide range of applications from drug
delivery to the construction of synthetic cells for artificial organs and artificial
blood. The mechanical properties of these synthetic microcapsules have been
recognised to be important not only for determining the kinetics of the release of
encapsulated chemicals but also for controlling the durability of the products in
processing and use. The process of compacting microcapsules via compression
is considered as a convenient method for assembling microcapsule particles into
a dosage form. However, the individual particles must exhibit sufficient physical
integrity in order to withstand processing whilst maintaining the required drug
release profile in their final dosage form (Loftsson & Kristmundsóttir 1993).
Moreover, some studies (Jalsenjak ct al. 1976; Prapaitrakul & Whitworth 1990)
have shown the pressure difference across the wall membrane may be one of
critical factors which effects the rate of drug release from tableted microcapsules.
Of course, liquid-filled microcapsules exist ubiquitously in biological systems in
many and various forms. Some authors (Halpern & Secomb 1992) consider
the mammalian red blood cell motion in the microcirculation environment to
be analogous to the squeezing of liquid-filled membrane systems between two
parallel plates.
There are several experimental methods which have been reported for char-
acterising the deformation behaviour of microcapsules. Jay and Edwards (Jay &
Edwards, 1968) have measured the elastic properties of the membrane of micro-

5.1 Introduction 95
capsules by using the micropippette aspiration technique. (Chang & Olbricht
1993) have studied the elastic properties of the membrane by observing the mo-
tion and deformation of a synthetic, liquid-filled capsule (diameter about 2 to 4
mm) that was freely suspended in a hyperbolic extensional flow. However, this
method has not been applied to microcapsules. Recently, (Zhang et al. 1994)
have measured the bursting strength of microcapsules by using a micromanip-
ulation technique which squeezes a single microcapsule between two platens.
Since the position of the moving platen, in their work, cannot be accurately
determined, a detailed study of the deformation behaviour of the microcapsules
is currently difficult using this method.
Up to now, there have been no suitable experimental techniques and associ-
ated theoretical models which permit the simultaneous study of the elasticity, the
tension distribution and bursting strength of the microcapsule membrane and
the pressure difference across the membrane. However, to achieve these goals,
the micro-upsetting method may be considered as a powerful tool to accurately
measure the force-displacement curve and the major geometric deformational
parameters. Through the quantitative analysis of the interrelationships between
the force and the displacement, as well as the prediction of the geometric defor-
mational parameters the above critical physical information may be estimated.
Several investigators have theoretically modelled the contact mechanics of
spherical nonlinear membranes. Feng and Yang (1973) were first to consider
the problem of the deformations and the stresses in an inflated nonlinear elastic
spherical membrane compressed between two frictionless rigid plates. Then,
Larden and Pujara (1980) extended the analysis to a membrane filled with an
incompressible fluid and were able to accurately predict the deformation of the
sea-urchin egg, compared with the experimental results which were previously
reported by Yoneda (1973). Later, Taber (Taber 1982) carried out experimental

5.2 Experimental 96
work and proposed a similar theoretical model which included the wall bending
moment in the governing mechanisms of the compression of fluid-filled spherical
shells by rigid indenters.
5.2 Experimental
5.2.1 Material
The microcapsules which have been used in this current study were a water/oil
multiple emulsion drop contained within a thin polymeric membrane (see Figure
5.1). The membrane wall is, in this case, made of a poly(urethane) elastomert.
The diameter of the particles varied between 50 and 100 ,am and the wall thick-
ness, estimated by scanning electron microscopy following freeze fracture, ranged
between 1 and 2 jim. These materials were provided by Zeneca Ltd, UK.
5.2.2 Experimental procedure
A petri dish was placed underneath the microscope lens. A liquid film, isotonic
to the liquid contained within the microcapsules, was then placed in the dish.
Microcapsules were randomly drawn into a micropipette and then carefully dis-
charged into the petri dish. A particular microcapsule was chosen at random
for the test. In order to confirm that only one particle was in contact with the
microplaten, the contact region was firstly examined using a low magnification
lens on the microscope. The microplaten was then slowly driven up and down to
find the initial contact point between microplaten and the selected microcapsule.
When the microplaten and the microcapsule initially touched, the microcapsule
was slightly shaken and this effect was monitored in the video image of mi-
crocapsule shown on the video monitor. The microplaten was then driven at
tThe preparation method for these microcapsules is reported in detail by Brown (1993).

5.2 Experimental
97
Polymer encapsulant
\ \ Water (W)
OIIOQQ )
Figure 5.1: Schematic representation of the microcapsules.

5.3 The theoretical analysis 98
a constant speed, about 2 im per second, during the microcapsule compres-
sion. The imposed force and the displacement of squeezed microcapsule during
loading and unloading were automatically recorded through the data acquisition
system linked with the personal computer. Also, a video image of the deformed
shape of the microcapsule was video recorded so that the lateral extension could
be determined after the experiment. The maximum imposed displacement was
gradually increased until bursting of the microcapsule was observed.
5.3 The theoretical analysis
It is well known, in the elastic deformation theory of plates and shells, that the
bending rigidity (D), or the flexural rigidity, of a thin isotropic plate or a thin
shell is proportional to the cubic power of the wall thickness. Thus, the bending
rigidity may be expressed as:
DEh3
- (1_v2)
where E is Young's modulus, h, is the wall thickness, and ii is Poisson's ratio.
In contrast, the extensional rigidity is Eh, and proportional to the first power of
the wall thickness. When the wall thickness, h, is very small, the contribution
to the sensed rigidity from the bending rigidity is much smaller than the contri-
bution from the extensional rigidity (Fung 1993). Furthermore, Taber's (1982)
experiments and calculations for a thick shell (the ratio of radius of thickness
is 6.0) demonstrated that when a point load was applied the bending stress
governs the behaviour at small deformation (the dimensionless approach is less
than 20 %), but that the membrane extensional stresses dominate at larger de-
formations. Since the microcapsules which were used in this study have a high
ratio of radius to thickness (about 16); i.e. thin wall systems, the response forces
(5.1)

(5.3)
(5.4)
aw* IA12C1 A 1 A 2 -
9A 1 =aw*
2C1A1A2 (;- -ôA 2 =
i(i +
1 2/i\
AA) (1+ )
=
U2 =
(5.5)
(5.6)
5.3 The theoretical analysis 99
contributed from the bending moment may be reasonably neglected in the first
instance. This assumption will be further discussed in section 5.4.1.
The constitutive equations (relationships between stress and strain) used in
this study to represent the behaviour of the microcapsules membranes are those
for Mooney-Rivlin and Neo-Hookean materials which have rubberlike non-linear
elasticity (Mooney 1940; Rivlin 1948).
In the Mooney-Rivlin model the strain-energy function*, W, of an isotropic
incompressible material, is
W = C1(11-3)+C2(12-3)
= C1[(11-3)+3(I2-3)]
(5.2)
where C1 and C2 are the material constants with the dimensions of stress, fi =
C2/Ci ; for a homogeneous and isotropic, incompressible elastic material, C1 is
equal to 6E. I and 12 are strain invariants which may be expressed in terms of
the principal stretch ratios, ) and X 2 , and are shown as below:
1'1 =
)1 1
j -2 - 1 2++
Then the principal stresses in the meridional and circumferential directions, a1
and a2 (see below; Figure 5.2), respectively, may be expressed as
For a finite deformation, the relationship between the stress and the strain of a rubberlike
material is non-linear and a more appropriate formulation of the constitutive equation is
to consider the strain energy function, W* , of the material. The strain energy function is
identified with the internal energy per unit volume in an isoentropic process, or the freeenergy per unit volume in an isothermal process.

5.3 The theoretical analysis 100
For the configuration of this spherical membrane system, the relationship
between the stress resultants, per unit length, in the meridional and circum-
ferential directions of the deformed surface, T1 and T2 , respectively, and the
principal stresses o, a2 , may be expressed as below (Feng 1973):
hcr1 1 "T1 = = 2hC1
-( i + (5.7)
A 1 )'2
ha2 "A2 1 "T2 = = 2hC1
A 1 A 2 - AA) (i + 1i3A) (5.8)
where h is the initial thickness of the membrane.
A Neo-Hookean material description may be seen as a simplification of the
Mooney-Rivlin formula by assuming 3 is zero (Rivlin 1948). For a Mooney-
Rivlin material the value of /3 has been taken as 0.1, as suggested by Green and
Adkins (1970), in the current study.
Lardner and Pujara (1980) derived two groups of governing equations for
two separate deformation regions: the plate-membrane contact region and the
non-contact deformation region. The details of the derivation of these equations
are given elsewhere (Feng & Yang 1973; Lardner & Pujara 1980). The final
results are summarised below:
'The equation (20) in Feng and Yang (1973) contains an error and may be corrected asbelow:
1 A1 A 2 cost,b A 1 3A 1 =
(+)(1+A ( inb[(j (1+aA)
A 1 1 1 A1 1(A 2A1 \ 1 1 1—2A2 -- 3)J + A 2 sirn,b R.- -) (.AA2 A1A)J)
(5.9)(A2 1 2/
The equation (2.2) in Lardner and Pujara (1980) should be corrected to be the same as thatin Equation 5.12 of this Chapter. Also the equation (2.10) should be corrected to read as
A 1 1 \
(A2 1 2/= 2hC1 - - -----) ( 1 + 1'A)
A 21 \
(A, 1 2/
T2 = 2hC1 - - ) ( 1 + tA) (5.10)
The definitions of and t reported in their cited papers are the same as that for the parameter3 in the current study.

5.3 The theoretical analysis
101
Contact region
A 1 1f3'\ fA1—A2cos\ 1'f2\A2sin ]) - sinb ) -)
(5.11)
A1 - A2cosA2 =
(5.12)sinb
and, Non-contact region
(5cos - Wsin\ ff2) (W\A1
= Sifl2,L) ) - '-) ()(5.13)
8 I =W
(5.14)
1/2 D
WI = AW + (A 1 - W2) /T2 \ A 1 (A - W2 ) r0
(5.15)A 1 ()- T1
where,
- ôT1 - 2hC1 (i + x) (- +
)(5.16)-
=- 2hC1 [(3,\4 - 2) (1 + + 2i9A2 A1
3 ].i'
IA 1 A2/1 1= T1 - = 2hC1- — 3
- AA)](5.18)
and where P is the pressure inside the membrane after initial contact; the primes
indicate differentiation with respect to , the angular position reference in the
undeformed sphere. A schematic diagram of the half spherical membrane, be-
fore and after contact is shown in the Figure 5.2. The Figure also shows the
spherical coordinates (r,e,) used for the spherical membrane before contact
and cylindrical coordinates (p,e,i7) which are used for the description of the
deformed membrane after contact. The variables S and W are defined as:

102
(5.19)
(5.20)
(5.21)
(5.22)
(5.23)
(5.24)
(5.25)
5.3 The theoretical analysis
8 = A2sin
W=6'
The boundary conditions for this problem are;
=
= F; = F (i)noncontact(6
= F; (A2)contactF SjflF)
=
=
where F is the contact angle; figure 5.2.
Since the original boundary-value problem has been transformed into an mi-
tial value problem, the governing equations (equation (5.11) to (5.15)), with
their boundary conditions, can be solved by a standard numerical scheme; the
Runge-Kutta method (Ferziger 1981). Extending the works of Feng & Yang
(1973) and Lardner & Pujara (1980), an independent computer algorithm was
developed as described below (Figure 5.3). The calculation procedures of Feng
& Young and Lardner & Pujara, both predescribed the angle of the contact
area (F) and then calculated the other parameters which include the distance
between the rigid plate and the equator of the spherical membrane after contact,
ij. However, the angle of contact area has been proven to be difficult to mea-
sure by experimental observation in these microscopic systems (Yoneda 1973).
Hence, it is appropriate to modify their procedures so as to prescribe ij and then
to calculate the other parameters. The assumption, suggested by Lardner & Pu-
jara, that is the volume of encapsulated solution is constant has been adopted

p View
Sphere after deformation Q(ro,O, 1/,)
Q '(p,E,ij)
p
ound
5.3 The theoretical analysis 103
I I Side ViewSphere before deformation ,_ i
Figure 5.2: Geometry for the contact problem for the half of a thin wall spherical
membrane between two large rigid plates.

5.4 Results and Discussions 104
in the current analysis. The flow chart of the enhanced algorithm, applied in
the current study, is presented in Figure 5.3.
5.4 Results and Discussions
The above theoretical analysis, combined with the corresponding experimental
data, has provided a route for determining the elastic modulus of the membrane
(section 5.4.1), the internal pressure (section 5.4.2), the tension distribution on
the membrane (section 5.4.3), and the geometric features of the deformation
(section 5.4.4). By a comparison with the experimental observations, the basic
assumptions adopted in the theory, outlined above, may be tested.
5.4.1 Elastic modulus of the membrane
The loading/unloading curve for a 65 m microcapsule up to a 60 % deformation
(dimensionless approach) has been investigated and is shown in Figure 5.4. The
dimensionless approach parameter, y, comprises the distance between the rigid
plate and the equator of the spherical membrane after contact, i, the stretch
ratio of the initial inflation, ), and the radius of the undeformed microcapsule,
r0 and is of the form: (1 - i7/roA 3 ). Since in our case the liquid in the petri dish
is isotonic with the liquid contained in the microcapsules, it seems reasonable to
assume that the initial inflation is zero; i. e. that \, = 1 although this condition
is unproven. Based upon optical observations during the loading process, the
microcapsule started to burst when the deformation reached about a value of 58
% deformation (see Figure 5.5(d)). The unloading curve, after the burst, shows
that the reaction force is now very small compared with the correspond loading
value, especially at large deformations. This observation implies that the reflex
force contributed by the bending moment, after rupture, is insignificant during
the post rupture deformations and this is consistent with the earlier assump-

5.4 Results and Discussions 105
Start
Prescribe j
Assume contactangie r
Assume X1)
Solve the governingequations of contact regionby the Runge-Kutta method
Assume P
Solve the governing equationsof non-contact region by theRunge-Kutta method
-check 3=O at V7/
Check constantvolume
YES
Stop
Figure 5.3: The flow chart for the enhanced version of the algorithm for solving
the set of the equations of the membrane model used in the current study.

5.4 Results and Discussions 106
tion of a mainly tensile membrane response; that is the bending contribution is
negligible.
Experimental loading/unloading transverse compliance curves are shown in
Figures 5.6 and 5.7. In these Figures the force, F, has been non-dimensionlised
to be in the dimensionless form: y = F/C1 hro). The theoretical predications
based upon the membrane model with Neo-Hookean and Mooney-Rivlin consti-
tutive equations, combined with the minimum least-squares (MLS) fitting to the
experimental data, are also shown in the Figures 5.6 and 5.7. The extensional
rigidity of the membrane, Eh, may be calculated to be 538 N m 1 for a Neo-
Hookean material and 536 N m 1 for a Mooney-Rivlin material, respectively,
from the MLS fitting between the theoretical predictions and experimental data.
The difference is small. Hence, if the thickness of the elastomeric membrane wall
is assumed to be 2 ,um, then the elastic modulus of membrane can be calculated
to be 2.69 MPa for a Neo-Hookean material and 2.68 MPa for a Mooney-Rivlin
material, respectively. This result, which shows no significant difference be-
tween the estimated Young's modulus obtained by the Mooney-Rivlin and the
Neo-Hookean laws, suggests that the second term in the Mooney-Rivlin law,
/3(12 - 3), may not important for the description of the deformation of these
elastomeric membranes. We may also noted that a value of the elastic modulus
2.69 MPa is a sensible one for this type of polymeric membrane.
Compared with the experimental data, the theoretical calculation of the
loading/unloading curves obtained from the membrane model with either Neo-
Hookean material law or Mooney-Rivlin model are slightly under-predicted when
the deformation is below 15 %. This difference may arise from the fact that the
bending moment still has influence, to some extent, when the deformation is
small (Taber 1982). For the intact microcapsules the force difference between
loading and unloading (shown in Figure 5.6 and 5.7), which is very small, is con-

0.6
z
q)0
0
5.4 Results and Discussions 107
1.0
0.8
0.2
0.0
—0.2—0.1 0.0 0.1 0.2 0.3 0.4 0.5 0.6 0.7
(1 —/r0X)
Figure 5.4: The experimental loading and unloading (after bursting) curves of a
65 im microcapsule. The bursting point is near 58 % dimensionless approach,(1—/ro)t).
108
(c)
5.4 Results and Discussions
1
(a)
(b) (d)
Figure 5.5: Photographs of the bottom view of a deformed microcapsule for
various dimensionless approaches (y); (a) y=O % (b) y= 20 % (c) y= 40 % (d)
y=58%.

5.4 Results and Discussions 109
sistent with the assumption that the transport of encapsulated solution across
the membrane seems to be insignificant during the chosen time scale of the
loading/unloading process. Furthermore, it appears that the viscoelastic effects
associated with the deformation of the membrane, again within the chosen time
scale, are also negligible. The agreement between theory and experiment , as well
as the reasonable prediction of the membrane elasticity, would suggest that the
analyses based on both Mooney-Rivlin and Neo-llookean constitutive equations
can be generally applied to the compressive deformation of the polymer-bounded
microcapsules. Moreover, the close agreement between the theoretical predic-
tions and the experimental loading! unloading curves, as well as the reasonable
estimation of the membrane elasticity, would suggest that the analysis based on
the membrane model , associated with either the Mooney-Rivlin law or the Neo-
Hookean constitutive equations, can be applied to the compressive deformation
of polymeric membranes.
5.4.2 Internal pressure
The computed internal pressure versus deformation curve, which is shown in
Figure 5.8, indicates a weakly nonlinear increase of the internal pressure with
the imposed deformation. This predicted result is important not only for the
preservation of the capsule integrity but also for the chemical release behaviour
of microcapsules. The computed bursting pressure (the pressure at 58 % di-
mensionless approach) is about 26 KPa. This infers a rupture at a nominal
membrane strain of ca 10 % in the radial direction. This rupture strain is rather
small for an elastomeric material; a value one order of magnitude greater may
have been anticipated. The nature of the preparation of these membranes, a
chemical reaction at a liquid! liquid interface, will naturally produce many de-
fects in thickness and composition. Thus whilst it seems that the membrane is

5.4 Results and Discussions 110
3.0
2.5
2.0
1 .5
1 .0
0.5
0.0
—0.5—0.1
• Experimental data- Theoretical prediction
S
(Mooney—Rivlin) •
S
- .•.
•
• •S•• S •S
S...
0.0 0.1 0.2 0.3 0.4 0.5
(1 —/r0X)
Figure 5.6: The dimensionless experimental loading/unloading curve (deforma-
tion up to 40 %) and theoretical predictions produced by the membrane modelwith a Mooney-Rivlin material law. The parameter y = (F/Ci hr0A) is thedimensionless force and the quantity (1 - /r0 )) is the dimensionless approach.A is 1.0 and C1 is 16.08 MPa.

'V../.
.,fr/.
•
./ ••/.
..:
••
0.0 0.1 0.2 0.3 0.4 0.5
(1 —/r0X5)
5.4 Results and Discussions 111
3.0
2.5
2.0
1 .5
1 .0
0.5
0.0
—0.5—0.1
• Experimental data
Theoretical prediction •
(Neo—Hookean) .
•
Figure 5.7: The dimensionless experimental loading/unloading curve (deforma-
tion up to 40 %) and theoretical predictions produced by the membrane model
with Neo-Hookean material law. The parameter y = (F/Ci hr0 ) is the dimen-sionless force and the quantity (1 - f/r0 ),) is the dimensionless approach. A 3 is1.0 and C1 is 16.14 MPa.

5.4 Results and Discussions 112
not porous it may have many thin regions or effective notches which reduce its
toughness.
For the modelling of the release rate of encapsulated solutions across the
membrane under the deformation, the Darcy's law (Darcy, 1856) which was de-
rived from the assumption of laminar flow through a cylindrical channel may
be applied to the current case. Basically, this law supposes that the flux of
the liquid across a membrane is directly proportional to the pressure difference
across the wall; if the membrane is assumed to be a porous media and that
the permeability of the membrane is a constant. Hence, the release rate of the
solution for the compressive microcapsules will nonlinearly increase with the de-
formation due to nonlinear increase of the internal pressure. The microcapsules
used in some applications, such as the time-release drug delivery and for the
immobilisation of enzymes, are often required to maintain constant release rates
of the encapsulated solutions. Therefore, the above result are interesting and of
crucial value in the control of the performance of such deformed microcapsules.
5.4.3 Membrane tension
The membrane tension (the extensional force per unit wall thickness) on the
membrane can be predicted by the theoretical model. If the elastic modulus
oL,membrane is 2.69 MPa, the calculated tension profile for the case of a 58 %'thdeformation (at rupture) is shown in the Figure 5.9; also see Figure 5.2. The
result shows that the tension in the membranes is not uniform but increases
with the angular position parameter (i5). On this basis, the bursting point will
be always located on the equator; the stresses are imposed at the poles. This
predicted feature is consistent with the experimental observations noted through
the image system (see Figure 5.5(d)). This prediction also shows that, for the
present case, the resultant stress in the deformed circumferential direction, T2,

5.4 Results and Discussions
113
30
• Neo—Hookean
25 V Mooney—Rivlin
20
a.
QL0.0
0.1 0.2 0.3 0.4 0.5 0.6 0.7
(1 —/rA)
Figure 5.8: Internal pressure versus deformation curve for the compression of a
compressive microcapsule. The Young's moduli of membrane are respectively
2.69 MPa for a Neo-Hookean material and 2.68 MPa for a Mooney-Rivlin re-
sponse.

5.4 Results and Discussions 114
is always larger than the stress resultant in the deformed meridional, T1 . The
bursting strength, the tension on the equator for 58 % deformation, for the
microcapsule is computed as about 1.04 N cm 1 which is the stress resultant in
the deformed circumferential direction at rupture.
5.4.4 Geometric features of the deformation
The simulated deformed external shapes of the microcapsule are show in Figure
5.10. These results show that, for large imposed deformations, the noncontact
region must be significantly stretched in order to maintain a constant enclosed
volume; this condition is assumed to occur in the present case. The predicted
behaviour has been identified by measuring the dimensionless central extension
(central lateral extension/ initial radius) of the free surface from the microscope
images (shown in Figure 5.5). The comparison between the values obtained from
the experimental measurements and the theoretical predictions are shown in
Table 5.1. The results show that the theoretical predictions and the experimental
measurement are in good accord.
An interesting comparison of the computed geometric features of the defor-
mation between the homogeneous elastomeric sphere with a Poisson ratio of 0.5
(fully incompressible) and the liquid-filled spherical entities with an elastomeric
membrane, is shown in the Figure 5.11. For the dimensionless central lateral
extension, there is no significant distinction (less than 0.5 %) between these
two entities upto a 50 % dimensionless approach (see Figure 5.11(a)). However,
when dimensionless approach achieves 60 %, there is a 8 % difference between
these two entities. For a 100 um spherical cellular entity, the difference in the
central lateral extension between these two cases is calculated as 8 ,im, which
may be resolved by the current instrument. However, practically such a large
deformation may cause the liquid-filled spherical entities to fracture.

90060°
5.4 Results and Discussions 115
0.12
0.10
0.08
• 0.06(1,
ci,F-
0.04
0.02
0.0000
- Neo—Hookean
Mooney—Rivlin
300
Figure 5.9: Variation of the wall tension, the extensional force per unit wall
thickness, with angular position, , for a 58 % deformation. The Young's moduli
of membrane are respectively 2.69 MPa for a Neo-Hookean material and 2.68
MPa for a Mooney-Rivlin system. T1 and T2 are the stress resultants in the
meridional and circumferential directions, respectively.

5.4 Results and Discussions 116
1 .4
1 .2
1 .0
0.80
0.6
0.4
0.2
0.00.0 0.2 0.4 0.6 0.8
1.0 1.2 1.4
p /r
Figure 5.10: The simulated deformed shapes of a microcapsule , = 1, 3 = 0.1)
for 20 %, 40 % and 60 % deformation as used in the current study.

5.4 Results and Discussions 117
Table 5.1 The comparison of the experimental and theoretical dimensionlesscentral laternal extension versus dimensionless approaches
Dimensionless approach Dimensionless central laternal extension(%) Theoretical predictions / Experimental measurements
20 1.045 / 1.056 + 0.00840 1.150 / 1.152 + 0.010

AA
AA
A •A
AA
A •
A.
0.4 0.5 0.6
5.4 Results and Discussions 118
0.45
0.4
0.35
0.3
0.25
::: 0.2
0.15
0.1
0.05
0
0
A Homogeneous sphere(Tatara theory)
• Liquid-filled sphericalmembrane (Membranemodel)
•A
A
0.1 0.2
0.3
(a)
A
A
A
A
A
A
A
A
A.
A
0.4 0.5 0.6
A.
1.4A Homogeneous sphere
(Tatara theory)1.2
• Liquid-filled spherical
1 membrane (Membranemodel)
0.8*
0.6 A.
A
0.4 .A
0.2
00 0.1 0.2 0.3
(b)
A.
Figure 5.11: A comparison of the computed geometric features of the defor-
mation of a homogeneous elastomeric sphere with a Poisson ratio of 0.5 and a
liquid-filled spherical entity with an elastomeric membrane; (a) the dimensionless
central lateral extension versus the dimensionless approach (b) the dimensionless
contact radius versus the dimensionless approach

5.5 Summary 119
Concerning the distinction in the contact area between these two entities with
different intrinsic structures, as mentioned in the above paragraph. The Figure
5.11(b) shows that a distinguishable variance of the predicted dimensionless
contact radius (the radius of contact area normalised by the particle radius),
a* , starts from a value of the dimensionless approach of 50 %. However, like
in the homogeneous elastomeric sphere, the measurement of the contact area
for the microcapsules has also been shown to be extremely difficult due to the
diffraction limit of the optical system (about 1 urn). In the current case, for
a 65 urn microcapsule, at 20 % deformation, the radius of the contact area
is about 16 im according to the theoretical prediction (Figure 5.10). Hence,
the resolution of optical system would result in an error of possible as large as
about 6 %. Yoneda (1973) has attempted to directly measure the contact area
of compressed sea urchin eggs (ca 120 tim) between two plates by the use of
photomicrographs taken from the side view. He pointed out that it would be
nearly impossible to detect a very narrow gap between the egg and the plate,
using optical methods, and this would cause a major over-estimation of the area
of contact. Of course, these measurements may be accurately resolved by a new
method; for example, X ray imaging is a possibility.
5.5 Summary
A model for a liquid-filled spherical membrane model with either a Mooney-
Rivlin law or a Neo-Hookean constitutive equation has been verified to be valid
for the compressive deformation behaviour of a single microcapsule. This model
allows correlations to be made using the experimental micro-compression data
for the determination of the elasticity and the tension distribution and bursting
strength of the membrane as well as the pressure difference across the mem-
5.5 Summary 120
brane. The feature where the internal pressure nonlinearly increases with the
compressive deformation may be an extremely important result for the usage
of microcapsules as drug, or active species, delivery systems. The characteri-
sation of the major geometric deformational parameters has been proven to be
important, but difficult, for the exploration of the physical properties and the
confirmation of the theoretical model.

Chapter 6
The deformation of biologicalcells
6.1 Introduction
The deformation of biological cells which is mainly governed by their mechan-
ical/ viscoelastic properties , as well as the bursting strength, may play an
important role in many cellular processes. It may be, in some circumstances,
that mass transfer effects may be of significance. For example, in context of physi-
ological processes, the mechanical and viscoelastic properties of plant cell walls
regulate the expansion in response to the Turgor pressures , allowing the plant
cell to enlarge by an order of magnitude or more. Without this mechanism,
the growth and morphogenesis of the plant would be impossible (Niklas 1992).
Regarding the bursting strength, in many cellular engineering processes, the
rheology is changed significantly due to the formation of broken cells. For ex-
t Some experiments (Fry e al. 1992) have shown that the potential mechanisms for regu-
lating the cell wall expansion is via specific enzyme action. However, in the current study we
only focus on the purely mechanical! viscoelastic aspects.tWhen matrix potentials are neglected, the Turgor pressure is defined as the difference
between the water chemical potential and the solute chemical potential of a cell or tissue.
The Turgor pressure is biomechanically important because it profoundly influences the tensilestresses generated within cell walls and hence the mechanical stiffness of thin-wall cells and
tissues.
121
6.1 Introduction 122
ample, in commercial food pastes, the cell ghosts or fragments no longer behave
as deformable particles showing Hertzian behaviour . In order to understand
the biological cell deformation, a concise description of the constitution of both
plant and animal cells is appropriate and this is given in the following paragraph.
Eukarytotic cells have at least four major structural domains: A plasma
membrane to define the boundaries of the cell and retain its contents; a nucleus
to house its DNA, membrane-bounded, organelles; and the cytoplasm with its
cytoskeleton of tubules and filaments. In addition, plant cells almost always have
a rigid cell wall, and animal cells frequently have a cell coating of glycoproteins
(Becker 1986). Most of biologists agree that the cell wall for plant cells and the
plasma membrane for animal cells are important to maintain the cell integrity.
However, from the physical point of view, a membrane is not simply a lipid
bilayer studded with protein as many would biologists suggest. A better defi-
nition is: "a material with a very small thickness, in comparison with its radii
of curvature, which separates two adjacent liquid-like domains and supports the
stress created by the embedding medium" (Fisher 1993). From this point of
view, a single plant cell may be modelled as a liquid-filled spherical membrane
structure. Two typical types cells are shown in Figure 6.1.
There are some models, based upon elasticity theories, that have been pro-
posed in order to describe the interrelationship between stress and strain of
naturally occurring cell membrane systems. Skalak et al. (1973) were the
first to propose the general constitutive equations, based on the strain-energy
function approach, for describing the large scale deformation of biological cells.
Then, Hettiaratchi & O'Callaghan (1974; 1978) modelled the cell wall as a flex-
ible, long-chain polymeric material whose stress-deformation behaviour could
This phenomenon has been noted by Professor P. J. Liliford e al. (Unilever, Colworth)
in their unpublished experimental data.

6.1 Introduction 123
CNamow -
IrI.'t •''/ J•
PT. ------4V .c' zr
C-
(a) GoIg,coClcoaw,
meane/ N snieop.
NiOk NucJe.s
/
A7L
s :. :1GO
Fi.s -'roomes
Figure 6.1: Schematic representations of typical structures of cells: (a) plant cell(b) animal cell.
6.2 Experimental 124
be characterised by a Mooney-Rivlin or a neo-Hookean substance. However,
the Mooney-Rivlin material law and also the neo-Hookean law both have been
proven to be only to be suitable for rubber-like material which may be consid-
ered as homogeneous hyperelastic materials. The cell wall is mainly composed
of many cellulose microfibrile embedded within a matrix. The contributions
of the microfibrils in maintaining cell wall integrity, that is restraining cell ex-
pansion, and regulating the direction of the expansion have been highlighted in
several studies (Wu et al. 1988; Chaplain 1992). In these studies the deforma-
tion of the cell wall has been assumed to be mainly regulated by two phases:
the relaxed-wall phase and the stressed-wall phase. The latter, moreover, has
been further subdivided into two phases known as the matrix-regulated phase
and the microfibril-regulated phase, respectively. Each phase is a mechanically
distinct component and is separated by tension points which serve as useful ref-
erence points for the construction of mathematical models. Essentially, the wall
is considered to be a complex composite material.
6.2 Experimental
6.2.1 Material
Tomato cells were isolated by soaking pieces of pericarp tissue in O.05M CDTA
(calcium chelator), Murashige and Skoog salt buffer solution, under mild ag-
itation. A very high percentage of cells were shown to retain their viability.
The shape of these cells was observed to be quasi-spherical (see Figure 6.2).
The diameter of the particles varied between 300 to 500 pm. These materials
were partly provided by Unilever Colworth and partly prepared by the author
according the rec ipe supplied by the Company.

6.2 Experimental
125
93-10-22 FRI2:9' :S4\
""?
I
(a)
I 0 - 2254I9
:II
fl ____
fl
FII
(b)
Figure 6.2: Photographs of the single isolated tomato cells: (a) green cell (ca
250 im diameter) (b) red cell (ca 250 um diameter).

6.3 Theoretical analysis 126
6.2.2 Stress-relaxation experiment
After the initial contact point between the cell and a microplaten was found, the
cell was rapidly compressed by the microplaten driven at a constant speed, typ-
ically 100 zm/sec, to a predetermined deformation (or dimensionless approach).
Then the decay in the reaction force, at the fixed imposed deformation, was mea-
sured over time of upto 60 sec. The applied deformations used in the current
study were varied from 80 % to 95 %.
6.3 Theoretical analysis
6.3.1 Constitutive equations
6.3.1.1 General constitutive equations for cell membrane
Essentially, the constitutive equations, proposed by Skalak et al. (1973), have
included the unique feature, as observed in red blood cells (RBC) by numerous
experimental tests, that the cell membrane can sustain a large shear deformation
but only a small area change (the maximum change is about 7 % in the RBC).
Hence, contrary to the Mooney-Rivlin law in which the stresses of uniaxial ten-
sion and isotropict tension are assumed to be the same order of magnitude, in
this (Skalak et al.) strain energy function these two stresses are three orders of
magnitude different. The simple form of the strain energy, w;, described by the
Skalak model is;
w*- -(I+I1_I2) +I22(6.1)- 4h
where B and C are membrane material properties, assumed to be constants
in this study; h is the initial thickness of the wall material, I and '2 are the
tlsotropjc is used here to denote a state of the stress resultants in which T1 =T2 . The
definition of T1 and T2 are presented in a following paragraph of this section.

(6.2)
(6.3)
(6.4)
(6.5)
CA1 I - i) + AI2]
CA2 1A2 - i) + AI2]2
U1h
= A1A2(6.6)
(6.7)
6.3 Theoretical analysis 127
stretch-ratio invariants which may be expressed in terms of the principal stretch
ratios in the meridional and circumferential direction, A and )'2, respectively,
and are shown as below:
Il = A + A —2
j - —12 - A1A2
Thus, only two elastic constants (B and C) are required in order to charac-
tense the platen induced, elastic deformation of the membrane. Then, the re-
lationships between the principal stresses in the meridional and circumferential
directions of the deformed surface can be expressed as below;
ÔW* - 62 (r (A - i) + AI2 )cT1A1
ôA 1 - 2h 1
2 (r (A - i) + AI2)U2 = A2 8A2 = 2h 2
where r = B/C. Thus, the stress resultants per unit length, T1 , T2 , can be
expressed as the simple functions of the principal stretch ratios, A 1 and A 2 (see
Figure 5.2), by;
The shear modulus (the constant B divided by the membrane thickness) has
been shown to be about three order smaller than the area modulus (the con-
stant C divided by the membrane thickness) in some experimental investigations
(Evans & Skalak 1979; Hochmuth 1987) . Thus r may be reasonably assumed
to be 0.001 in the current study.
Although the tomato cells that have been examined in the current study
may be slightly different from red blood cells, for which the model was originally
developed, the general deformation behaviours of the tomato cells and the RBC
have been proven to be quite similar.

6.3 Theoretical analysis 128
6.3.1.2 Specific constitutive equations for plant cell
Recently, a set of constitutive equations has been developed by Chaplain (1992),
specifically for modelling the deformation of plant cells. This model is essentially
based on a general class of strain energy function which was originally proposed
by Ogden (1972) in relation to experimental work on rubber-like materials. This
strain energy function has been successfully applied for modelling the cell wall
of acetabularia (Chaplain & Sleemanl99O). The relationship between the strain
energy function, W, and the principal stretch-ratios has been formulated as;
n
w: = /irq(cr) (6.8)r1
where
q(c) = (.' + + ) - 3)/& (6.9)
and ,. and cr,. are real constants with the condition that; /i T cx > 0 for each r
(no summation).
It can be shown that the following relationship holds between the elastic
shear modulus, jt, and the parameters j and ct,.
n
= >/1rclr (6.10)1=1
A nonlinear relationship between the Turgor pressure and volume expansion
of plant cells has been reported by Gardner and Ehlig (1965) through exper-
imental investigation. In order to describe this phenomenon, a "two term"

6.3 Theoretical analysis 129
strain energy function has been introduced by Chaplain (Chaplain 1992). The
function, W, is composed of two distinct components. One describes the char-
acteristics of the matrix-regulated phase and the other expresses the behaviour
of microfibril-regulated phase. It may be written as;
T147 = l'Vrnriz + VVTrnicrojibrils (6.11)
Hence, the deformation of the cell wall may be characterised by the "two term"
strain energy function along with the parameters p 1 ,c, /2, cr 2 . It is obvious that
this strain energy function provides more physical insight than the previous one
proposed by Skalak et a!., especially for the deformation of plant cells. However,
the extra constants which are involved in this type of strain energy function
are difficult to determine. Hence, the application of this function is impractical.
For this reason, only the constitutive equations proposed by Skalak et al., are
adopted in the subsequent analyses described in the present work.
6.3.2 Governing equations for compressive compliance
Many studies (Fung 1966; Fung & Tong 1968; Skalak et al. 1973) have modelled
the quasi-spherical cell as an spherical elastic membrane which is filled with an
incompressible viscous fluid. Hence, the membrane model, as mentioned in the
Chapter 5, may be applied for describing the deformation of the tomato cell. In
this case the governing equations for the deformation of the cells are the same
as the equations (5.11) to (5.15). However, due to the nature of the constitutive
equations for biological membrane which are adopted, the variables, f, f2 and
f are included in the equations and are reformulated as below;
ôT1 = -- 2rA 1 + +11 = ;5i;-

6.3 Theoretical analysis 130
± 1 - i) + A 2 (A 2 A 2 - i)] (6.12)2 124A 2 I8T1 - A1 I2A2A3 + 2A2 (A2A2 - 1)] -f2
—L12 12
A1A - i) + A 2 fA2A2 - i)} (6.13)
4A2L \ 21 2
C A3 )3\
1 213 = Tl_T2=(__-_) (6.14)
6.3.3 Stress Relaxation analyses
Mechanical models are widely applied to describe the viscoelastic behaviour of
materials. In Figure 6.3 are shown three mechanical models which are widely
used for describing the viscoelastic deformation of materials, namely, the Maxwell
model, the Voigt model and the Kelvin model (or Standard Linear Solid). Essen -
tially, all of these models are composed of combinations of linear springs with a
spring constant, i, and dashpots with coefficient of viscosity, A linear spring
is supposed to produce instantaneously, a deformation which is proportional to
the load. A dashpot is supposed to produce a velocity proportional to the load
at any instant. Thus, if F is force acting in a spring and u is its extension, then
F = u. If the force acts on a dashpot, it will produce a velocity of deflection
ü, and F =
It is intuitively clear that for the Maxwell solid, a sudden application of
a deformation to the model material produces an immediate reaction by the
spring, and then a stress relaxation follows. The relaxation is provided by the
response to the deformation of the dashpot in which the displacement increases
linearly with time. Eventually, the reaction force will exponentially decay to
zero due to the complete relaxation of the dashpot (see Figure 6.3). For the
Voigt case, a sudden application of a deformation will instantaneously produce,
in theory, a infinite reaction force, due to the resistance contributed by the
dashpot. Then, the applied force will be shared by the spring and maintained

6.3 Theoretical analysis 131
(a) A Maxwell body
1'l
I i
iaiij/2Si
Fli p ______ ____S MW •4 S ii
II
Ii iii
I P 5 P 5
U 1 w U'1_'I
(b) A Voigt body
_____ F1
F 'F____ F
(c) A Kelvin body (a standard linear solid)
/21 F1
fF sW1v I
FUI I'll U'i ill
Po F0
U_pri
Figure 6.3: Three mechanical models for a viscoelastic material. (a) A Maxwell
body, (b) a Voigt body, and (c) a Kelvin body (a standard linear solid). Adopted
from Fung (1993) with permission.

6.4 Results and discussions 132
constant as time lapses (again, see Figure 6.3). The characteristics of the stress
relaxation for these two models are obviously different from those observed in
the present experimental results shown in Figure 6.5.
For modelling the experimental data, shown in Figure 6.5, a Standard Linear
Solid model (or Kelvin model) has been employed to interpret the experimen-
tal stress-relaxation curves for both the green and the red tomato cells. The
characteristics of the stress relaxation for the Kelvin material (Figure 6.5) may
be simply described by the following mathematical formulation (the detailed
derivation of this equation is given by (Fung 1993));
= [i - (i - I\ e 1 (6.15)r) J
where the constant r represents the factor, ij/p, which is the relaxation time for
a constant strain; r is the relaxation time for a constant stress. The parameter
r is the characteristic time of the relaxation of the load under the condition of
a constant deflection, whereas the quantity r, is the characteristic time of the
relaxation of the quantity deflection under the condition of a constant load. F
is the reaction force which is a function of time, t, and F0 is the initial reaction
force at t=O.
6.4 Results and discussions
6.4.1 Stress relaxation
Typical experimental results for the stress relaxation process for both the green
and the red tomato cells are shown in Figure 6.5. The theoretical correlation
for the experimental data, using the equation 6.15, is also shown in the Figure
6.5. The relaxation time for a constant strain (ca 85 %) can be calculated to
be 1.36 s for the green cell and 1.90 s for the red cell. The relaxation for a

Time
(0) (b)
a)0I-0U-
00)a
a)00
0a)a
0)00
E00)a
6.4 Results and discussions 133
Time
(c)
Figure 6.4: Relaxation behaviours of (a) a Maxwell, (b) a Voigt, and (c) a
standard linear solid.

6.4 Results and discussions 134
constant stress can is calculated to be 1.94 s for the green cell and 7.38 s for
the red cell. These small values of the relaxation constants are consistent with
the rapid decay of the stress (or strain) under a constant imposed strain (or
stress), as observed in the experimental data (see Figure 6.5). These results also
imply that the deformation behaviour of the tomato cells appears to be more
viscous-like as opposed to elastic-like in their nature. This peculiar feature may
be due to the rupture of the plasma membrane which often occurs at very small
imposed strains. Once the plasma membrane is broken, the cell wall which is
now a highly porous material, allows the contained fluids to be readily transport
out of the cell. Hence, it may be concluded that this relaxation phenomenon
seen in the tomato cells is partly contributed by the transport of the contained
fluids.
6.4.2 Compressive compliance and bursting phenomena
The typical experimental curves, describing the force change against the dis-
placement, for both red and green tomato cells are shown in Figure 6.6. The
tomato cell, unlike the liquid-filled microcapsules (Chapter 4), can initially re-
sist large deformations without a significant reaction force increase. When the
deformation reaches certain point, the force starts to increase rapidly until the
cell bursts. The bursting behaviours of the two cells are different. The green
cells have very clear bursting points, whilst, the red cells do not show such clear
rupture points (again, see Figure 6.6). This phenomena may imply that the cell
walls of the green cells are rather brittle whereas those of the red cells are more
ductile.
The theoretical predictions of compressive compliance, based upon an ex-
tension of the Skalak model, are shown in Figure 6.7. It is clear that the char-
acteristics of the theoretical predictions are inconsistent with the experimental

1
0.9 -
0.8
0.7 -
0.6
0.5
0.4
0.3
0.2
0.1
0
Experimental data
- Kelvin model
6.4 Results and discussions 135
0 10 20 30 40 50 60 a
Time (sec)
(a)
1.
0.9 -- Experimental data
0.8-t Kelvin model0.7 -
0.600.5
0.2 ---
0.1
0
0 10 20 30 40 50 60
Time (sec)
(b)
Figure 6.5: The experimental results and theoretical correlation of the stress
relaxation for two types of tomato cells (a) green cell (b) red cell.

2.2
2
1.8
1.6
t
6.4 Results and discussions 136
1.7
1.6
1.5
1.4
1.3
1.2
1.1
lii0.9
2 0.8
0.7
06
0.5
0.4
0.3
0.2
0.1
00 40 80 120 160 200 240
DISTANCE(M ICRONS)
(a)
0 200 400 500
DISTANCE(MICRONS>
(b)
Figure 6.6: Typical experimental curves of the compressive compliance for two
types of tomato cells; (a) green cell (b) red cell.

(5.4 R'suIts a 11(1 (Ii.SUIISSIOIIS 137
40 I I I
30 - -
20 - -
10 - -
0 -
—10 I I I I
—0.2 0.0 0.2 0.4 0.6 0.8
1— (/r0X)
Figure 6.7: rFhe theoretical predictions for the compressive compliance for the
spherical cells, obtained by using the membrane model combined with the se
lected constitutive equations for the cell membrane.

6.4 Results and discussions 138
results shown in Figure 6.6. This inconsistency may arise from various possible
error sources. Firstly, as mentioned in the section 6.4.1, the plasma membrane
may rupture at small imposed strain. Then, the enclosed volume provided by
the cell walls may not remain constant, due to the lost of the contained fluid.
Furthermore, up to now there is no study that has examined quantitatively the
resistance to deformation contributed by the cytoskeleton (Petersen et al. 1981;
Evans & Skalak 1979). However, this part of the cells may play a significant
role in the generation of the reaction force at the large deformation. Finally,
the constitutive equations proposed by Skalak et al. (Skalak et al. 1973), which
have some deficiencies in the consideration of the specific deformation mecha-
nism of the cell walls may cause the theoretical model fail to accurately predict
the compliance curve.

Chapter 7
Conclusions
The experimental techniques, combined with the appropriate analyses, described
in the Thesis have investigated the deformabilities of single micro-cellular enti-
ties. This has included both the measurement of the load-displacement response
curve and the deformed shapes. Using the available theories, some of the impor-
tant mechanical and interfacial properties have been estimated. These param-
eters, as reported in the previous Chapters, include the Young's modulus, the
Poisson ratios and the interfacial free energy for the homogeneous elastomeric
spheres. For the liquid-filled elastomeric membrane systems, the elasticity of the
membrane, the tension forces on the membrane, the bursting strength and the
internal pressure have been calculated. For the biological cells (tomato cells),
due to the complex intrinsic structure and the peculiar material properties, the
mechanical and interfacial properties have proven difficult to determine. The
main specific conclusions of this study may be summarised in the following ma-
jor parts; (1) the governing effects responsible for the observed deformation,
(2) the experimental method and (3) the theoretical interpretations. They are
summarised in the following sections.
139

7.1 The governing effects responsible for the observed deformation 140
7.1 The governing effects responsible for theobserved deformation
There are some important effects which govern the deformation of micro-cellular
entities. These effects have been examined in the current study and reported in
the previous Chapters. Although these effects, which are mentioned below, may
be specified as unique mechanisms, most of them are often interrelated to each
other in the practical cases.
1. The Autoadhesion: The effect has been shown to be extremely important
in the small deformation range and even in the medium deformation re-
gion (dimensionless approach upto 25 %) for the homogeneous elastomeric
sphere in dry contacts. The influence of this effect has been quantitatively
described by the JKR theory (Johnson ci al. 1971). Since, for the liquid-
filled membrane system and the biological cells, these investigated entities
must be surrounded in the liquid medium for practical reasons, the au-
toadhesion is negligible. However, for the case of the dry contact in these
systems, the influence still awaits a detailed examination. This autoad-
hesion effect is also influenced by the platen roughness, the viscoelastic
effects and the scaling effect (see the following paragraphs).
2. Large deformations: For the case of homogeneous elastomeric spheres,
the large deformation effect t has been shown to be important when the
ratio of the radius of the contact area to the radius, a/R, achieves a value
of approximately 0.3. For the liquid-filled membrane systems, since large
contact areas are easier to achieve than for the homogeneous elastomeric
spheres, the effect becomes relatively more important. However, this effect
usually is linked with the non-linear elasticity of the system.
tThe definition of "large deformation" has been reported in Section 4.2.1.2.

7.1 The governing effects responsible for the observed deformation 141
3. Non-linear elasticity: This effect has been shown to be important for
elastomeric materials at larger deformations. Based upon the Mooney-
Rivlin law, the formulations of non-linear elasticity have been given by
Tatara, for the homogeneous elastomeric sphere, and by Feng and Yang,
for the liquid-filled membrane system. These formulation, in principle,
quantitatively introduce the effect of the elasticity increasing with the
strain. Furthermore, for biological cells, this effect has also been shown
to be extremely significant through experimental investigations. However,
the details of the formulation of non-linear elasticity, based on the strain-
energy function model, for the wall of the plant cell still awaits resolution.
4. The roughness: The influence of the roughness, both of the platens and
the particle surfaces, on the investigated micro-cellular entities may be im-
portant in two main respects; the reduction of autoadhesive force and the
modification of the friction force. The former aspect has been examined,
based upon the work of Fuller and Tabor (1975), both experimentally and
theoretically in the current study. The autoadhesive force has been sig-
nificantly reduced by the roughness of the platens for the homogeneous
elastomeric spheres.
5. Viscoelastic effects: This effect plays an important role on both the au-
toadhesion and the bulk mechanical responses. In the current work, the
measured adhesive force between the elastomeric micro-sphere and the
platens has been found to slightly increase with the increase in the rate
separation and this phenomenon may be contributed to the viscoelastic
properties of the elastomer (Greenwood & Johnson 1981). Concerning the
bulk mechanical responses, the influence of the viscoelastic effect has been
shown to be very important for the biological cells, but to be rather neg-
7.2 The experimental method
142
ligible for both the homogeneous elastomeric spheres and the liquid-filled
membrane systems within the time scales examined.
6. The scaling effect: In general, when the size of the micro-cellular entities
decreases, the influence of the autoadhesive force becomes more important.
At very low applied loads the magnitude of the adhesion force, compared
with that of the mechanical force proposed by Hertz, has a greater contri-
bution to the deformation of elastomeric micro-spheres; the compressive
force is approximately equal to the square of the radius at a constant
imposed strain, while the adhesion force is directly proportional to the
radius.
7.2 The experimental method
1. The principle of instrument: Based upon the conventional compression
method, the current method (micro-upsetting) includes some of the main
elements from both the conventional imaging method and the compliance
technique adopted in nano-/ micro-indentation studies. It has been shown
to provide, in principle, the required information about the deformation of
the micro-cellular entities. Furthermore, the current method offers more
measurable parameters than most of the previous methods which is crucial
for the verification of the theoretical modelling.
2. Initial contact point: This technical problem has been recognised to be
intractable in the many previous studies on the nano-/ micro-indentation.
For the current study, an uncertainty of approximate 0.6 im has been
generally found within the various experiments. For very small micro-
cellular entities, this uncertainty may cause serious error in the prescription
of the load-displacement curve. However, this uncertainty seems to be

7.3 The theoretical interpretation 143
tolerable for the investigated micro-cellular entities adopted in the current
work (which are larger than 65 gm).
7.3 The theoretical interpretation
7.3.1 For the homogeneous elastomeric spheres
1. The theories without autoadhesion effects: The Hertz theory has been
shown to be inadequate in order to describe the deformation at both very
small and large deformations due to the lack of the consideration of the
effects of the autoadhesion as well as large deformation. The Tatara the-
ory which includes both the effects of the non-linear elasticity and the
large deformation has been shown to be appropriate for the cases of the
dimensionless approach upto about 40 %. However, the neglect of the au-
toadhesion in the theory may cause the errors to some, but an unknown,
extent in the prediction of the deformation.
2. The JKR theory: The theory has been shown to be both correct and
efficient for the description of the deformations which involve the autoad-
hesive force at small compressive deformations. Furthermore, the theory
also provides an useful means to estimate the interfacial properties through
the investigation of pull-off force.
7.3.2 For the liquid-filled membrane
1. Membrane model: The adopted model, associated with either the Mooney-
Rivlin law or the Neo-Hookean constitutive equations, gives the good pre-
dictions of the loading! unloading curve as well as the corresponding ma-
jor geometric deformational parameters for the liquid-filled microcapsules.
7.3 The theoretical interpretation
144
However, the model fails to predict the deformation of the plant cell pos-
sibly due to the selection of inappropriate constitutive equations.

Appendix A
The jump phenomenon
A.1 Long range forces: Lifshitz theory
Tabor & Winterton (1969) were first to apply the Lifshitz theory (1956) to study
the characteristics of jump contact between the two orthogonal cylindrical sheets
of mica. The force, F, between a sphere with a radius, R, and a infinite flat
plane at a separation, H, can be expressed as;
for non-retardation forces;AR
F 6H2
for retarded forces;- 2irBR
F 3H3
(A.1)
(A.2)
where A is the non-retarded Hamaker constant and B the retarded Hamaker
constant (Bradley 1932; de Boer 1936; Hamaker 1937).
Israelachvili & Tabor (1972) showed that the essential equations (A.1) &
(A.2) could be derived using much simpler theoretical approaches than originally
adopted by Lifshitz (Tabor & Winterton 1969; Israelachvili & Tabor 1972).
The detail derivations of the equations of Lifshitz theory are omitted in this
appendix. However, the final equations of Lifshitz theory for the calculations of
the Hamaker constant and the retarded van der Waals constant may be expressed
145

A.2 The experimental configuration and the origin of the "jump" 146
as follows;
A= f'de (A.3)4irJo
where2 Wf (w) dw
(A.4)R0 C.i)
and12
B = - ) c5 (Eo) (A.5)
+ 1
where h is Planck's constant; is the electrostatic dielectric constant; is the
dielectric constant (or permittivity); E" is the imaginary part of the dielectric
constant of the material of the plates and is a function of angular frequency, w;
c is the speed of light in vacuum. Values of (e 0 ) have been given by Lifshitz.
For o less than about 3, (to) is 0.35.
A.2 The experimental configuration and theorigin of the "jump"
Tabor & Winterton (Tabor & Winterton 1969) used a flexible cantilever to
support one surface; the other was attached to a piezoelectric microtranslation
stage. The configuration has been widely used by Israelachvili, Luckham and
others. (for reviews see Israelachvili (1991); Luckham & Costello (1993)). A
similar configuration is applied in the current work.
As the surfaces approach the increasing van der Waals attractive force pulls
the surfaces together to a new equilibrium position where the spring deflection
is x. The spring stiffness of the cantilever beam is a constant, K. Hence,
the van der Waals attraction force, for the case of the non-retarded forces, is
balanced by the restoring force of the spring of the cantilever beam, Kx, so that
at equilibrium we have

A.3 The Johnson method 147
F=Kx— (A.6)
where F is net force. The jump occurs when the gradients of the van der Waals
and spring forces are balanced, that is when
dF = Kdx + 2--dH =0 (A.7)6H3
Since dx = —dH this implies that the surfaces will jump into contact when
A/3H = K/R (A.8)
where H0 is the jump distance. A similar analysis can be applied for the case
of the retarded forces but the necessary calculation is within the non-retarded
range.
The computed jump distance based upon a non-retarded force is recorded in
Section 4.4.1.
A.3 The Johnson method
The author is grateful to Prof. K. L. Johnson (Cambridge) for privately com-
municating the following analysis. It should be noted first that the value of, H0,
obtained by Winterton was directly measured using fringes of equal chromatic
order (FECO) optics. In the present experiments it has to be inferred from the
displacement as sensed by the force transducer after the jump O-E in figure
A.1(a). The following analysis provided by Professor Johnson deals with this
problem.
The figure A.1(a) shows the JKR compressive load (P)-defiection (ce) curve.
The point P, as shown in Figure A.1(a), corresponds to the pull-off point with
an infinite stiff dynamometer spring. The point Q is the pull-off point with a

At point Q
(i) At point D
(ii)
A.3 The Johnson method
Tension(a)
148
(b)
Figure A.1: (a) The compressive load (P)-deflection (&) produced by the JKR
theory for the interplation of the jump phenomenon (Johnson 1995; private
communication). (b) The actions of the sphere and platen at (i) the point Q
and (ii) the point D

A.3 The Johnson method 149
dead load (zero stiffness spring). The point R is the pull-off point for a typical
finite stiffness spring. Starting with the sphere in contact with the lower platen.
The initial condition is shown in figure A1.b(i). Neglecting the weight of
the sphere (P=O) the lower contact condition is given by the point A on the
P-cr curve. The platens approach slowly and steadily with the gap at the upper
contact point is within the range of surface forces. This is the jump distance H0
in equation (A.8). It can be neglected so that the upper contact is effectively
made at point 0 in the Figure A.1(a).
The initial "jump" at this point of contact is from point 0 to E and takes
place at the Rayleigh wave speed for the material of the sphere. The sphere is
now not at equilibrium under the action of PE at the upper point of contact and
zero at the lower. It moves to make the (tensile) forces equal at point D, along
ED, in the Figures A.1(a) & (b).
During this movement the centre of the sphere displaces upwards by AB=BC.
The extension of the dynamometer spring by load PD is the quantity OC. The
movement of this platen in this interval of time is negligible. The perceived
jump distance deduced from the equilibrium displacement of the spring is thus
the value of OB which from Figure 4.5 is about 500 nm.

Appendix B
Computer programs
150

Computer programs 151
C***********************************************************************cC THIS PROGRAM IS DEVELPED FOR THE MODELING OF THE LARGE DEFORMATION CC OF RUBBER ELASTIC SPHERE 21/06/93 KKL CC***********************************************************************C
program rubberreal*8 P,GAMAL,GAMAJI,GAMAH,FL,FM,FH,A,AL,AH,AM,gama,UrREAL*8 APLUM,E0 ,ETA,POI ,Z,R,pi ,gamahz ,ahzREAL*8 F40,F31,UZA,ACOF,BCOF,FUNA,FUNAPLUcommon
1/var/P ,GAMAL,GAMAM,GAMAH, FL, FM, FH ,AL,AH,AM,2 APLUM,E0,ETA,POI,Z,R,pi,3 F40, F31 ,UZA,ACOF,BCOF,FUNA,FUNAPLUOPEN (5,FILE='TAtar.dat')open (6,file='rubber.out')poi=0 .50E0=5. 0e9R=205E-4write (6,400)
400 format(/,' Poisson Y-modulus radius')write (6,500) poi,E0,R
500 format (3(flO.3))write (6,200)
200 format(/,' P GAMA a* a z U(z,a) U ( R)1 ratio')write (6,300)
300 format(' (N) (cm) (cm) (cm) (cm) (cm)
(cm)')ncont=2 2n=0itermax=100iter=0pi=3 .141592654
40 READ(5,*) pn=n+1DO 1 J=1,199gama=O .0a=0 .0f40=0.0iter=iter+1GAMAL=102 . 5e-6*(J-1)CALL F43s(GAMAL)FL=F40GAMAH=GAMAL-t-102. 5e-6CALL F43s(GAMAH)FH=F40IF ((FL*FH).Ge.0.0) GO TO 10
20 GAMAN=(GAMAL*FH_GAMAH*FL)/(FH.-FL)CALL F43s(GAMAM)fm=f 40if (iter.gt.itermax) go to 30IF (abs(GAMAh-GAMAL).LT.0.1E-6) GO TO 30IF ((FM*FL).gT.0.0) THENFL=FMGAMAL=GAMANELSEFH=FMGAMAH=GAMAMENDIFGO TO 20
10 continuecontinue

Computer programs 152
H
30 Ur=ACOF*(1.0+POI)*P/(pi*E0)*(1.0+BCOF*Am**2/(5.0*R**2.0))*(1.0/(2.0**1.5)_(1.0_2*POi)*(1.0_1.O/(2.O**O.5)))
write (6,100) p, gamam, aplum, ,z , uza, urahz=((3.0*(1_poi**2)*R*p)/(4.0*E0))**0.333333gamahz=3 . 0*(1_poi**2)*p/(4*E0*ahz)ratio= (aplum/ahz ) **2 .0
100 format(/,2x,e7.1,2(e7.4) ,3(e7.3) ,e7.4,e7.4)if (n.eq.ncont) go to 1000go to 40
1000 stopENDSUBROUTINE F43s(GAHA)real*8 fha,fla,fmareal*8 P,GAJ4AL,GA14AI4,GANAH,FL,FM,FH,A,AL,AH,AN,gamaREAL*8 APLUM,E0,ETA,POI,Z,R,piREAL*8 F40,F31,UZA,ACOF,BCOF,FUNA,FUNAPLUcommon
1/var/P,GANAL,GAMAN,GAMAH,FL,FM,FH,AL,AH,AN,2 APLUM,E0,ETA,POI,Z,R,pi,3 F40,F31,UZA,ACOF,BCOF,FUNA,FUNAPLUitermax=100iter=0DO 1 1=1,19f31=0 .0iter=iter+1AL=(I_1)*1O . 25e-4+5. le-4CALL F31s(GAI4A,AL)FLa=F3 1AH=AL+10. 25e-4CALL F31s(GANA,AH)FHa=F3 1IF((FLa*FHa).GT.0.0) GO TO 10
20 AM=(AL*FHa-AH*FLa) /( FHa-FLa)cALL F31s(GAMA,AM)fma=f31if (iter.gt.itermax) go to 3if (abs(f31).le.1.Oe-13) go to 3IF (abs(Ah-AL).GE.1.OE-5) THEN
IF ((FMa*FLa).GT.0.0) THENFLa=FMaAL=AM
ELSEFHa=FMaAH=AM
ENDIFgo to 20
ELSEGO TO 3ENDIF
10 continueCONTINUEgo to 4
3 UZA=ACOF*(1.0+POI)*P/(2*Pi*E0)*(1.0+BC0F*Aifl**2/(5.0*1 R**2.0))*((Z**0.5+(2*R_Z)**0.5)/((2*R)**1.5)_2 (1.0_2.0*POI)/(2*R*Z*(2*R_Z))**0.5*(2*(2*R)**0.5_Z**0.54 _(2*R_Z)**0.5))
APLUm=am+UZAFUNAPLU=2*(1.0+pOI)*R**2/(APLUm**2+4.0*R**2)**1.5+(l.O_POT**2)/
1 (APLUm**2+4.0*r**2)**0.5F40_GAMA_3.0*(1.0_POI**2)*ACOf/(4*E0)*(1.0+BCOF*Am**2/(8*R**2

Computer programs 153
III
1 ))*p/APLUm+FUNAPLU*ACOF/(pj*EO)*(1.O+BCOF2 *Ait**2/(5.O*R**2))*P
4 RETURNendSUBROUTINE F31s(GANA,A)real*8 P,GAMAL,GANAM,GAMAH,FL,FM,FI-1,A,AL,AH,AN,gamaREAL*8 APLUM,EO,ETA,POI,Z,R,piREAL*8 F40,F31,UZA,ACOF,BCOF,FUNA,FUNAPLUCOMMON
, GAMAL , GAMAM , G,FL, FM, FH, AL,AH ,AM,2 APLUN,EO,ETA,POI,Z,R,pi,3 F40,F31,UZA,ACOF,BCOF,FUNA,FUNAPLUETA=GANA/RACOF= (1 . O-ETA)**2 . O/(1. O-ETA+ETA**2/3)BCOF= (1 . O-ETA/3 O)/(1 . O-ETA-f-ETA**2/3)FUNA=2*(1.O+POI)*R**2/(A**2+4.O*R**2)**1.5+(1.O_POI**2)/
1 (A**2+4.O*r**2)**O.5F31=R_(R**2.O_A**2.0)**O.5_ACOF*(3*(1.O_POI**2)/(8*EO*A)*(1.O-BCOF1 *A**2/(2*R**2.0))+BCOF*FURA*A**2/(2*pj*EO*R**2))*pz=r-(r**2-a**2) **O.5RETURNend

154Computer programs
* ****** * ** * ******* * * *
C This program is developed to caculate the contact problem of an inflated Cc spherical nonlinear membrane by KKL 01/11/94 Cc****************************** ********************************************* C
program Mainreal y(4),yp(4)REAL P0.THICK.R0,BE'rA.YPS.YPO,Y1CON.Y2CON.VO,VSTJMCOMMON1/VAR/ ALFA.BETA.ANGLE.YPS.YPO.Y1CON,Y2CON,V0,VSUM,R0,p,y3f, tf,y3i,2 INDF.Y1N(500),Y2N(500),y3N(500),ylC(500).y2C(500),y3C(500)3 TN(SOO).TC(500),PI,indc,indcf,yata(5oO),yataO,yatafy4fl(5o)4 ,tenl(SOO),ten2(500),tencl(500),tenc2(500),tl,t2open (5,file='tamat60.dat')P1=3 .1415962ALFA=0 .001'rHICK=O .02R0=1 .0yps=1 .0V0=4.0*PI/3 .0*R0**3BETA=THICK/R0pO=betayata0=0 .4do 50 n=1,500angle=0.2^(1.4-0.2) /500*nDO 10 1=1.400YPO=YPS+i*0 .0003 *ypwrite(6,*)(yp0 angle')write(6, *)ypo,angleCALL CONTAC1write(6,*) ('ylcon y2con')write(6, )ylcon,y2conDO 20 J=1,500P=(05+1O.0*j/500)*pO
c do 22 1=1,40C y3i=1.0-0.2/40n
CALL NONCAN1IF ( abs(y3f)At.O.04 .and. abs(yataf).lt.O.04
1 GO TO 1if (y3f.lt.-0.1 .or. yataf.lt.-0.1) go to 10write (6,*) ('yataf y3f')write(6,*) yataf,y3f
c 22 continue20 CONTINUE10 CONTINUE
go to 50write(6,*) ('boundary condition sati')write (6,*) ('yataf y3f')write(6,*) yataf,y3f
11 call inter(yatao,y2n,y4n,indf,vsum)30 CONTINUE
write (6,) ('voirat')write(6,*) vsum/vO
IF (abs(V0/Vsum-1.0) .1T.2.000E-2) thenGOTo 2else
go to 20end if
50 continuewrite(5,*) ('no solution')go to 99
2 WRITE(5,*)y VO VSUM angle')WRITE(5, *)vo.vs. anglewrite(5,*)(p ypO')write(5, )pypOwrite(5,8)(tc(i),ylc(i),y2c(i),tencl(i),tenc2(j)j1,jndcf)write(S,9)(tn(1),yln(i),y2n(j),y3n(i),y4n(j)tenl(j),ten2(j),

Compu ter programs 155
II
1 i=1,indf)8 format (3f8.5,16x,2f85)9 format (7f8.5)99 ER])
SUBROUTINE CONTACT CT,?, YP)REAL T,Y(4),YP(4),R,ALFACOMMONl/VARI ALFA, BETA,ANGL,E, YPS, YPO, Y1CON, Y2CON,V0.VSIJM, R0,p,y3f, tf,y3i,2 INDF,Y1N(500),Y2N(500),Y3N(500),Y1C(500),Y2C(500),Y3C(500),3 TN(500),TC(500),PI,indc,indcf,yaya(500),yata0,yataf.y4n(500),4 tenl(500),ten2(500),tencl(500).tenc2(500),tl,t2if (t.eg.0.0) thenyp (1) =0.0yp C 2) =0.0elseyt2=y(2)Tl=0.25*Y(1)*(alfa*(_1.+Y(l)**2)+Yt2**2*(_1.+Y(1)**2*Yt22))/Yt2F2=0.25*Yt2*(alfa*(_1.+Yt2**2)+Y(l)**2*(_1.+Y(1)**2*Yt2**2))/Y(l)f10.25*Y(1) * (2*alfa*Y(1)+2*Y(1) *Yt2**4) /Yt2 +1 0.25*(alfa*(_1.+ Y(1)**2) + Yt2**2*(_1.+Y(1)**2*Yt2**2))/Yt2f2=0.25*Y(l)*(2*Y(1)**2*Yt2**3^2*Yt2*(_1.+Y(1)**2*Yt2**2))/Yt2_
1 0.25*Y(1)*(alfa*(_l.+Y(1)**2)+Yt2**2*(_1.+Y(1)**2*Yt2**2))/Yt2**2f3=T1-T2f3=T1-T2
C fl=(1.0+alfa*yt2**2.0)*(1.0/yt2+3.0/y(l)**4.0/yt2**3.0)c f2=((_y(1)/yt2**2.0+3.0/y(l)3.0/yt2**4.0)*(1.0+alfa*yt2**2.0)+c 1 (y(1)/yt2_1.0/y(1)**3.0/yt2**3.0)*2.0*alfa*yt2)c tl=(y(1)/yt2_1.0/y(1)**3.0/yt2**3.0)*(1.0+alfa*yt2**2.0)c t2=(yt2fy(1)_1.0/y(1)**3.0/yt2**3.0)*(l.0+alfa*y(1)**2.0)C YP(1)=(1.0/((1.0/y(2)+3.0/(y(l)**4*y(2)**3))*(1.0+alfa*y(2)**2)c 1 )*((y(1)_y(2)*cos(t))/sin(t)*((y(1)/y(2)**2_3.0/(y(1)C 2 •*3*y(2)**4))*(10+alfa*y(2)**2)_2.0*alfa*y(2))+y(1)/c 3 y(2)/sin(t)*((y(2)/y(1)_y(1)/y(2))+alfa*(1.0/y(1)**3c 4 Iy(2)_1.0/y(1)/y(2)**3))))C YP(2)=( (y(l)-y(2) cos(t) ) /sin(t)c f3=tl-t2
yp(1)=_y(1)/yt2/sin(t)*(f3/fl)_(y(1)_yt2*cos(t))/sin(t)*(f2/fl)yp(2)=(y(1)-yt2cos(t))/sin(t)
end ifRRNER])
SUBROUTINE CONTAC1EXTERNAL CONTACTREAL T,Y(4),yp(4),TOUT,RELERR,ABSERRREAL TFINAL,TPRINT, ECC,ALFA,WORX(27)COMMON1/VAR/ ALFA,BETA,ANGLE,YPS,YPO,Y1CON,Y2CON,V0.VSUM,R0,p.y3f,tf,y3i,2 INDF,Y1N(500),Y2N(500),Y3N(500),Y1C(500).Y2C(500).Y3C(500),3 TN(500),TC(500),PI,indc,indcf,yata(500),yata0.yataf.y4n(500)4 •tenl(500).ten2(500),tencl(500),tenc2(500),tl,t2
INTEGER IWORI( (5) • IFLAG. NEQNNEQN=2T=0 .0Y (1) =yp0Y(2)=ypORELERR=1 . OE-7ABSERR=0 .0TFINAL=ANGLETPRINT=PI/100IFLAG=1TOUT=Tindc=0
10 CALL RKF4 5 (CONTACT. NEQN, Y. T, TOUT. RELERR. ABSERR, IFLAG. WORK. IWORK)ylcon=y (1)y2con y(2)

Computer programs 156
III
indc=indc+1tc(indc)=tylc(indc)y(1)y2c(indc)y(2)y3c(indc)y(3)tend (mdc) =tltenc2 (mdc) =t2indcf=indcGO TO (80,20,30.40,50,60,70.80), IFLAG
20 TOUT=T+TPRINTIF (Tout.LT.TFINAL) GO TO 10go to 222
30 WRITE(6,31) RELERR,AESERRGO TO 10
40 WRITE(6,41)GO TO 10
50 ABSERR=1.OE-8WRITE(6, 31) RELERR,ABSERRGO TO 10
60 RELERR=10 0*RELERRWRITE (6,31) RELERR, ABSERRIFLAG=2GO TO 10
70 WRITE(6.71)IFLAG=2GO TO 10
80 WRITE(6,81)11 FORNAT(F5.3.2F15.9)31 FORMAT(17H TOLERANCES RESET, 2E123)41 FORMAT(11H MANY STEPS)71 FORMAT(12H MUCH OUTPUT)81 FORMAT(14H IMPROPER CALL)
222 RETURN
SUBROUTINE NONCAN (I, Y, VP)REAL T.Y(4),YP(4).R,ALFACOMMON1/VAR! ALFA,BETA,ANGLE,YPS,YPO,Y1CON.Y2CON,V0,VSUM.R0,P,Y3f,tf,Y31.
2 INDF,Y1N(500),Y2N(500),Y3N(500),Y1C(500),Y2C(500),Y3C(500),
3 TN(500).TC(500),PI.indc,indcf,yata(500).yata0,yataf,y4fl(500)
4 ,tenl(500),ten2(500),tencl(500),tenc2(500),tl,t2yt2=y(2) /sin(t)T1=0.25*Y(1)*(alfa*(_1.+Y(1)**2)+Yt2**2*(_1.+Y(1)**2*Yt2*2))/Yt2T2=0.25*Yt2*(alfa*(_1.+Yt2**2)+Y(1)**2*(_1.+Y(1)**2*Yt2**2))/Y(1)fl=025*Y(1)*(2*alfa*Y(1)+2*Y(1)*Yt2**4)/Yt2 +
1 0.25*(alfa*(_1.+Y(1)**2)+Yt2*2*(_1.+Y(1)**2*Yt2**2))/Yt2f2=0.25*Y(1)*(2*Y(1)**2*Yt2**3+2*Yt2*(_1.+Y(1)**2*Yt2**2))/Yt2_
1 0.25Y(1) * (alfa* (-1.+Y(1) **2)+Yt2**2* (-1.+Y(1) **2*Yt2**2) ) /Yt2**2f3=T1-T2
c fl=(1.0+alfa*yt2**2.0)*(1.0/yt2+3.0/y(1)**4.O/yt2**3.0)cC 1 (y(1)!yt2_1.0/y(1)**3.0!yt2**3.0)*2.0*alfa*yt2)c tl=(y(1)/yt2_1.0/y(1)**3.0!yt2**3.0)*(1.0+alfa*yt2**2.0)c t2=(yt2/y(1)_101y(1)**3.0/yt2**3.0)*(1.0falfa*y(1)**2.0)c f3=tl-t2
yp(1)=(y(2)*cos(t)_y(3)*sin(t))/sin(t)**2.0*(f2/fl)_(y(3)!Y(2))
1 *(f3/fl)
yp (2) =y (3)yp(3)=yp(1)*y(3)Iy(1)+(y(1)**2.O_y(3)**2.0)/Y(2)*(t2/tl)_Y(l)/tl*
1 (y(1)**2.0_y(3)**2.0)**0.5*p/2.0/betaif (t.eg.angle) thenyp(4)=_rO*y3i*y(1)elseyp(4)=_r0*(y(1)2.0_yp(2)**2.0)**O.5end ifRETURN

Coinpu ter programs 157
Iv
SUBROUTINE NONCAN1EXTERNAL NONCANREAL T, Y (4) • TOUT, RELERR, ABSERRREAL TFINAL,TPRINT, ECC.ALPA,WORK(27)INTEGER IWORK (5) IFLAG, NEQNCOMMON1/VAR/ ALFA,BEI'A,ANGLE,YPS,YPO,Y1CON,Y2CON,V0,VSUM,R0,p,y3f, tf,y3i,2 INDF,Y1N(500),Y2H(500),Y3N(500),Y1C(500),Y2C(500),Y3C(500),3 TN(500),'FC(500),PI,indc,indcf,yata(500),yata0,yataf,y4rj(500)4 ,tenl(500),ten2(500),tencl(500),tenc2(500),tl,t2NEQN=4T=ANGLEY(1)=Y1CONY(2)=SIN (ANGLE) Y2CONY(3)=Y1CON* 0.99y(4)=yata0RELERR=1 0E-7ABSERR=0 .0TFINAL=PI/2 .0TPRINT=PI/200IFLAG=].TOUT=TIND=0
10 CALL RKF4S (NONCAn, NEQN, Y, T, TOUT, RELERR, ABSERR, IFLAG, WORK, IWORK)y3i=y3fy3f-y(3)tf=tyatat=y(4)IND= 1+ INDY1N(IND)=Y(1)Y2N(IND)=Y(2)Y3N(IND)Y(3)y4n(ind)=y(4)teni (md) =tlten2(ind)=t2tn(ind)=tINDF INDGO TO (80,20,30,40,50,60,70,80), IFLAG
20 TOUT=T+TPRINTTOLD=TIF (Tout.LT.TFINAL) GO TO 10go to 111
30 WRITE(6,31) RELERR,ABSERRGO TO 10
40 WRITE(6,41)GO TO 10
50 ABSERR=1.OE-8WRITE (6,31) RELERR, ABSERRGO TO 10
60 RELERR=10. ORELERRWRITE(6, 31) RELERR,ABSERRIFLAG=2GO TO 10
70 WRITE(6,71)IFLAG=2GO TO 10
80 WRITE(6,81)11 FORNAT(F5.3,3F15.9)31 FOR1IAT ( 17H TOLERANCES RESET, 2E12.3)41 FORNAT(11R MANY STEPS)71 FORMAT(12H MUCH OUTPUT)81 FORNAT(14H IMPROPER CALL)
222 continue111 RETURN

Computer programs 158
V
ENDSUBROU'rINE RKF4S (F, NEQN, Y. T, TOUT, RELERR. ABSERR. IFLAG. WORK, IWORK)INTEGER NEQN. IFLAG, IWORK(5)REAL Y(NEQN) ,T,TOUT,RELERR,ABSERR,WORX(27)EXTERNAL FINTEGER K1,K2,K3,K4,K5,K6,K1MK1M=NEQN+ 1K1=K1M+ 1K2=K1+NEQNK3 =K2 +NEQNK4=K3+NEQNK5=K4+NEQNK6=K5+NEQNCALL RKFS(F,NEQN,Y,T,TOUT,RELERR,ABSERR, IFLAG,WORK(1) ,WORK(K1M).
WORK(K1),WORX(K2),WORK(K3),WORK(K4),WORK(K5),WORX(K6).2 WORK(K6+1),IWORK(1),IWORK(2),IWORX(3),IWORK(4).IWORX(5))RFURNENDSUBROUTINE RKFS(F,NEQN,Y, T,TOU'I', RELERR.ABSERR. IFLAG,YP,H,F1, F2,F3,
F4, F5, SAVRE. SAVAE,NFE. KOP. INIT,JFLAG,KFLAG)LOGICAL HPAILD. OUTPUTINTEGER NEQN, IFLAG, NFE, KOP • INIT • JFLAG. KFLAGREAL Y(NEQN) ,T,POUT,RELERR,ABSERR,H,YP(NEQN),F1(NEQN),F2(NEQN),F3(NEQN).F4(NEQN).F5(NEQN),SAVRE,
2 SAV.EEXTERNAL FREAL A.AE.DT,EE.EEOET,ESTTOL, ET,HMIN,REMIN,RER,S.
SCALE.TOL.,TOLN,U26,EPSP1,EPS,YPKINTEGER K, MAXNPE, MFLAGREAL AMAX1,AMIN1DATA REMIN/1.E-12/DATA MAXNFE/3000/IF(NEQN.LT.1) GO TO 10IF((RELERRLTO.0) .OR. (ABSERR.LTO.0)) GO TO 10MFLAG=IABS(IFLAG)IF((MFLAG.EQ.0) 0R. (MFLAG.GT.8)) GO TO 10IF (MFLAG NE.1) GO TO 20EPS=1.0
5 EPS=EPS/2.0EPS1=EPS+1 0IF (EPSP1.GT.10) GO TO 5U26=26 OEPSGO TO 50
10 IFLAG=8RNTURN
20 IF ((T.EQTOUT).AND.(KFLAG.NE.3)) GO TO 10IF (MFLkG.NE.2) GO TO 25IF ((KFLAG.EQ.3).OR.(INITEQO)) GOPO 45IF (KFLAG.EQ.4) GO TO 40IF ((KFLAG.EQ.5) AND. (ABSERR.EQ.O.0)) GO TO 30IF ((KFLAG.EQ.6) AND. (RELERR.LE.SAVRE) AND.
(ABSERR LE SAVAE)) GO TO 30GO TO 50
25 IF (IFLAG.EQ.3) GO TO 45IF (IFLAG.EQ.4) GO TO 40IF ((IFLAG.EQ.5).AND.(ABSERILGT.0.0)) GO TO 45
30 STOP40 NFE=0
IF (MFLAG.EQ.2) GO TO 5045 IFLAG=JFLAG
IF (KFLAG .EQ. 3) MFLAG=IABS (IFLAG)50 JFLAG=IFLAG
KFLAG-OSAVRE-RELERRSAVAE-PBSERRRER 2.OEPS+REMIN

Computer programs 159
VI
IF (RELERR .GE. ERR) GO TO 55RELERR=RERIFLAG=3KFLAG=3REJRN
55 DT=TOUT-TIF (MFLAG.EQ. 1) GO TO 60IF (INIT.EQ.0) GO TO 65GO TO 80
60 INIT=0KOP=OATCALL F(A.Y.YP)NFE=1IF (T . NE. TOUT) GO TO 65IFLAG=2RETURN
65 INIT=1H=ABS (DT)TOLN=0DO 70 K=1,NEQN
TOL=RELERR* ABS (Y (K) ) +ABSERRIF (TOL.LE.0.) GO TO 70TOLN=TOL.YPK=ABS (YP (K))IF (YPK*H**5 .GT. TOL) H=(TOL/YPK)**0.2
70 CONTINUEIF (TOLN.LE.0.0) 14=0.0N=ANAX1(H,U26*AI4AX1(ABS(T) ABS(DT)))JFLG=ISIGN(2 • IFLAG)
80 H=SIGN(H,DT)IF (ABS(h).GE. 2.OABS(DT)) KOP=KOP^1IF(KOP.NE.100) GO TO 85KOP= 0IFLAG=7RETURN
85 IF (ABS(DT).GT. U26AB5(T)) GO TO 95DO 90 K=1,NEQN
90 Y(K)=y(K)^Dr*YP(K)A=TOUTCALL F(A.YYP)NFE=NFE+ 1GO TO 300
95 OUTPUT=.FALSE.SCALE=2 . 0/RELERRAE=SCALE*ABSEP.R
100 HFAILD=.FALSE.HNIN=U26*ARS (T)DT=TOUT-TIF (ABS(IYr).GE. 2.OABS(H)) GO TO 200IF (ABS(DT).GT. ABS(h)) GO TO 150OUTPUT= . TRUE.H=DTGO TO 200
150 H=0.5*DT200 IF (NFE.LE.MAXNFE) GO TO 220
IFLAG=4KFLAG=4RETURN
220 CALL FEL(F.NEQN.Y,T,H.YPF1,F2F3, F4.F5.F1)NFE=NFE+5EEOET=0.0DO 250 K=1,NEQN
ET-ABS(Y(K) )+ABS(F1(K))+AEIF (E'T.GT0.0) GO TO 240IFLAG=5

Computer programs 160
VII
RJRN
240 EE=ABS((_2090.0*YP(K)+(21970.0*F3(K)_15048.0*F4(K)))+
1 (22528.0*F2(K)_27360.0*F5(K)))250 EEOET=AMAX1 (EEOET, EE/ET)
ES'rTOL=ABS(H) *Q*SCALE/7524000IF (ESDTOL .LE. 1.0) GO TO 260HFAILD= .TRUE.OUTPtJT= . FALSE.S=0.1IF (ESTTOL.LT.59049.0) S=0.9/ESTrOL**0.2H=SHIF (ABS(H) .GT. HMIN) GO TO 200IFLAG=6KFLAG6RFURN
260 T=T+hDO 270 K=1,NEQN
270 Y(K)=F1(K)A=TCALL F(A,Y,YP)NFE=NFE+1S=5.0IF (ESTTOL .GT. 1.889568E-4) S=0.9/ESTrOL**0.2IF (HFAILD) S=ANIN1(S,1.0)H=SIGN(AMAX1(S*ABS(H) ,RMIN) ,H)IF (OUTPUT) GO TO 300IF (IFLAG.GT.0) GO TO 100IFLAG=-2
FURN300 T=TOUT
IFLAG-2RFURN
SUBROUTINE FEHL(F,NEQN,Y,T,H.YP,F1,F2,F3,F4,F5,S)INTEGER NEONREAL Y(NEQN).T,H,YP(NEQN),F1(NEQN).F2(NEQN),
1 F3 (NEON), F4 (NEQN) F5(NEQN) , S(NEQN)REAL CHINTEGER KCH=H/4.0DO 221 K=1,NEQN
221 F5(K)=Y(K)+CHYP(K)CALL F(T+CH,F5,F1)CH=3 .0*H/32 .0DO 222 K=1,NEQN
222 F5(K)=Y(K)+CH*(YP(K)+3.0*F1(K))CALL F(T+3.0h/8.0.F5,F2)CH=H/2197 .0DO 223 K=1,NEQN
223 F5(K)=Y(K)+CH*(1932.0*YP(K)+(7296.0*F2(K)_7200.0*F1(K)))CALL F(T+12.0*h/13.0,F5,F3)CH=H/4104 .0DO 224 K=1,NEQN
224 F5(K)=Y(K)+CH*((8341.0*YP(K)_845.0*F3(K))+
1 (29440.0*F2(K)_32832*F1(K)))CALL F(T+H,F5,F4)CH=H/20520.0DO 225 K=1,NEQN
225 F1(K)=Y(K)+CH*((_6080.O*YP(K)+(92950*F3(K)_
1 5643.0*F4(K)))+(41040.0*F1(K)_28352.0*F2(K)))CALL F(T+H/2.0,F1,F5)CH=H/7618050 .0000DO 230 K=1,NEQN
230 S(K)=Y(K)+CH*((902880.0*YP(K)+(3855735.0*F3(K)_
1 1371249.0*F4(K)))+(3953664.0*F2(K)+
2 277020.OF5(K)))
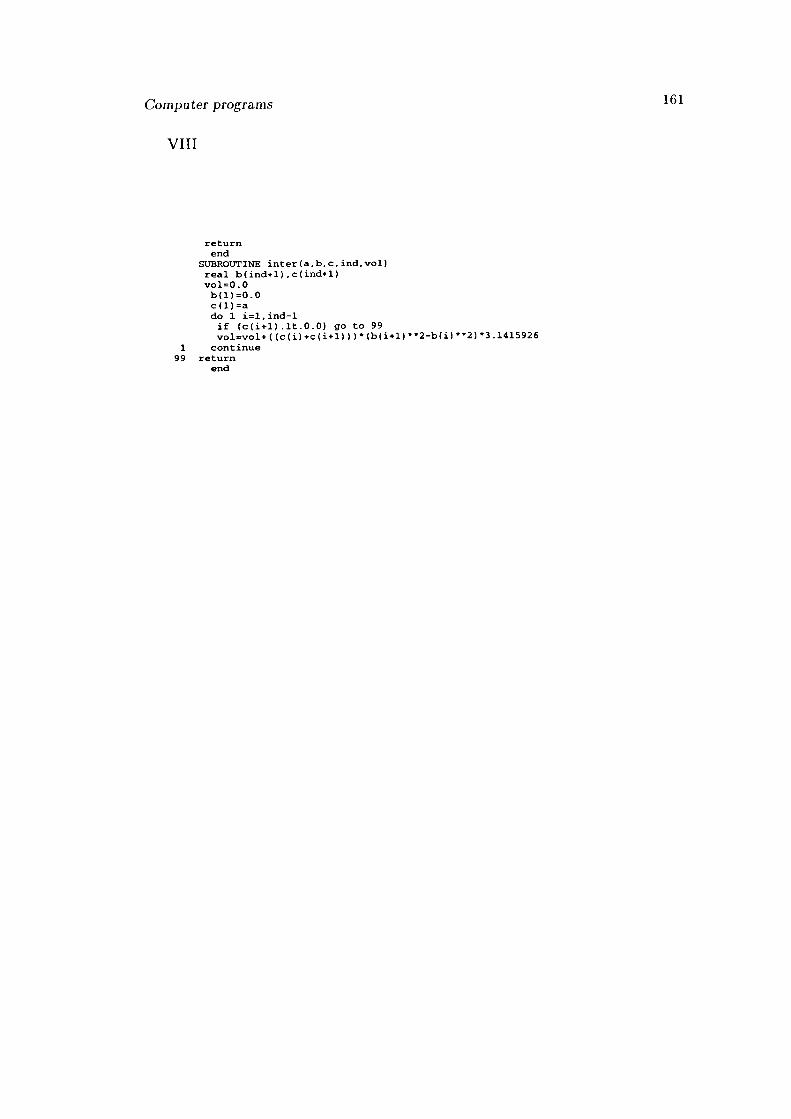
Computer programs 161
VIII
returnend
SUBROUTINE inter(a,b,c, ind,vol)real b(ind+l).c(ind+1)vol=0 .0b(1)=0.0c(1)=ado 1 i=1,ind-1if (c(i+l).lt.0.0) go to 99vol=vol+((c(i)+c(i+1)))*(b(i+l)**2_b(i)**2)*3.1415926continue
99 returnend
References
Andrews, E. H., Pingsheng, H. & Viachos, C. 1982 Adhesion of epoxy-resin to
glass. Proc. R. Soc. Lond., A381, 345-360.
Becker, W. M. 1986 The world of the cell. Benjamin/Cummings Publishing
Company Press.
Bentall, R. H. & Johnson, K. L. 1967. Slip in the rolling contact of two dissimilar
elastic rollers. mt. J. Mech. Sci., 9, 389 404.
Bliem, R. 1989 A need for systematic investigations into the material properties
of cultured animal cells. Trend in biotechnology, 7, 197-200.
Boussinesq, J. 1885 Application des Potentiels a I'Etude I'Equilibre et du Mou-
vement des Solides Elastiques. Gathier-Villars, Paris.
Bradley, R. S. 1932 The cohesive force between solid surfaces and the surface
energy of solids. Phil. Mag. , 13, 853-862.
Briggs, G. A. D. & Briscoe B. J. 1977 The effect of surface topography on the
adhesion of elastic solids. J. Phys. D. Appl. Phys., 10, 2453 2466.
Briscoe, B. J. 1987 Discrete particle-wall interactions in powder flow. Chem.
Eng. Sci., 42, 713 723.
Briscoe, B. J. & Panesar, S. 5. 1991 The application of the blister test to an
elastomeric adhesive. Proc. R. Soc. Lond., A433, 23 43.
162

REFERENCES 163
Briscoe, B. J. 1994 Interactions laws and the rheology of assemblies. AIChE 1st
mt Particle Technology Forum, Dever, USA.
Brown, D. J. 1993 Encapsulated W/O/W emulsions of ionic species; a study
to enable the preparation and examination of their release mechanisms.
MPhii/PhD Transfer Report, Imperial College, Univ. London.
Chang, K. S. & Olbricht, W. L. 1993 Experimental studies of the deformation of
a synthetic capsule in extensional flow. J. Fluid Mechanics, 250, 587 608.
Chaplain, M. J. S. 1990 & Sleeman, B. D. An application of membrane theory
to tip morphogenesis in Axetabularia. J. theor. Biol., 146, 177-200.
Chaplain, M. J. S. 1992 The strain energy function of an ideal plant cell wall.
J. theor. Biol., 163, 77 97.
Cole, K. S. 1932 Surface forces of the arbacia egg. J. Cell Comp. Physiol., 1,
1 9.
Darcy, H. 1856 Les Fontaines Publiques de la Viii de Dijon. Victor Dalmont,
Paris, 1856.
Daily B., E. L. Elson & C. I. Zahalak 1984 Cell poking: determination of the
elastic area compressiblity modulus of the erythrocyte membrane. Biophy.
J., 45, 671-682.
de Boer, J. II. 1936 The influence of van der Waals' forces and primary bonds
on binding energy, strengh and orientation with special reference to some
artificial resins. Trans Faraday Soc., 32, 10-38.
Derjaguin, B. V., Muller, V. M. & Toporov, Y. P. 1975 Effect of contact defor-
mations on the adhesion of particles. J. Coil. mt. Sci., 53, 314 326.

REFERENCES
164
Derjaguin, B. V., Krotova, N. A & Smilga, V. P. 1978 Adhesion of solids.
Consultants Bureau Press, New York.
Derjaguin, B. V., Muller, V. M. & Toporov, Y. P. 1980 On different approaches
to the contact mechanics. J. Coil. mt. Sci., 73, 293.
Ducker, W. A., Sender, T. J., & Pashley, R. M. 1991 Direct measurement of
colloidal forces using an atomic force microscope. Nature, 353, 239 241.
Evans I. D. & Lips A. 1990 Concentration dependence of the linear elastic
behaviour of model microgel dispersions. J. Cliem. Soc. Faraday Trans.,
86(20), 3413 3417.
Evans, E. A. & Skalak, R. 1979 Mechanics and Thermodynamics of Biomem-
branes. CRC Critical Reviews in Bioengineering. Vol 3, CRC Press, Boca
Raton.
Elson, E. L. 1988 Cellular mechanics as an indicator of cytoskeletal structure
and function. Annu. rev, of Biophy. and Biophysical Chem. , 17, 397 430
Feng, W. W., & Yang, W. H. 1973 On the contact problem of an inflated
spherical nonlinear membrane. J. Appi. Mech., ASME, 40, 209 214.
Feng, W. W. 1992 Viscoelastic behaviour of elastomeric membrane. J. Appi.
Mech., ASME, 59, 29 34.
Ferziger, J. H. 1981 Numerical methods for engineering application. Wiley, New
York.
Fisher, L. R. 1993 Forces between biological surface. Faraday Trans., J. Chem.
Soc., 89, 2567 2582.

REFERENCES
165
Fuller, K. N. C. & Tabor, D. 1975 The effect of surface roughness on the adhesion
of elastic solids. Proc. R. Soc. Lond., A345, 327-342.
Fung, Y. C. 1966 . Theoretical considerations of the elasticity of red cells and
small blood vessels. Fed. Proc. Symp, Microcirc., 25, 1761 1772.
Fung, Y. C. & Tong, P. 1968 Theory of the sphering of red blood cells. J.
Biophys., 8, 175-198.
Fung, Y. C. 1993 Biomechanics, 2nd. Springer-Verlag.
Fry, S. C., Smith, R. C., Renwick, K. F., Martin, D. J., Hodge, S. K. & Matthews
K. J. 1992 Xyloglucan endotransglycosylase, a new well-loosening enzyme
activity from plants. J. Biochem., 282, 821 828.
Gardner, W. R. & Ehlig, C. F. 1965 Physical aspects of the internal water
relations of plant leaves. Plant Phyiol., 40, 705 710.
Green, A. E., & Adkins, J. E. 1970 Large elastic deformation, 2nd. pp.168
Oxford University Press.
Greenwood, J. A. & Johnson, K. L. 1981 The mechanics of adhesion of vis-
coela.stic solids. Phil Mag., A43, 697 711.
Halpern, D., & Secomb, T. W. 1992 The squeezing of red blood cells through
parallel-sided channels with near-minimal widths. J. Fluid Mech., 244,
307 322.
Hamaker, H. C. 1937 The London-Van der Waals' attraction between spherical
particles. Physica, 4, 1058-1072.
Hertz, H. 1882 Uber die Berührung fester elatischer Körper. Zeitschrift für
Reine und Angewandte Mathematik., 92, 156 171.

REFERENCES
166
Hettiaratchi, D. R. P. & O'Callaghan J. R. 1974 A membrane model to plant
cell extension. J. theor. Biol., 45, 459-465.
Hettiaratchi, D. R. P. & O'Callaghan J. R. 1978 Structural mechanics of plant
cell. J. theor. Biol., 74, 235-257.
Johnson, R. M. 1987. Properties of red blood cells. In Handbook of Bioengineer-
ing. (ed. R. Skalak &' S. Chien), Chapter 12, Mcgraw-Hill, New York.
Israelachvili, J. N. & Tabor, D. 1972 The measurement of van der Waals dis-
persion forces in the range 1.5 to 130 nm. Proc. R. Soc. Lond., A331,
19 38.
Israelachvili, J. N. 1991 Intermolecular and surface forces, 2nd edition,. Aca-
demic Press INC.
Jalsenjak, I., Nicolaidou, C. T., & Nixon, J. R. 1976 The in vitro dissolution
of phenobarbitone sodium from ethyl cellulose microcapsules. J. Pharm.
Pharmac., 28, 912 914.
Jay, A. W. L., & Edwards, M. A. 1968 Can. J. Physiol. and Pharmacol., 46,
731-737.
Johnson, K. L. 1968. An experimental determination of the contact stresses be-
tween plastically deformed cylinders and spheres. In Engineering Plasticity.
(ed. J. Heyman & F. A. Leckie), pp. 179 183. Cambrige University Press.
Johnson, K. L., Kendall, K. & Roberts, A. D. 1971 Surface energy and the
contact of elastic solids. Proc. R. Soc. Lond., A324, 301 313.
Johnson, K. L., O'Connor, J. J. & Woodward, A. C. 1973 The effect of the
indenter elasticity on the Hertzian fracture of brittle materials. Proc. R.
Soc. Lond., A334, 95 117.

REFERENCES
167
Johnson, K. L. 1975. Non-Hertzian contact of elastic spheres. In The mechanics
of the contact between deformable bodies. (ed. A. D. de Pater & J. J. Kalker),
pp. 26-40. Deift University Press.
Johnson, K. L. 1985 Contact mechanics. Cambrj, e University Press.
Johnson, K. L. 1993 The mechanics of adhesion, deformation and contamination
in friction. Proc. 20th. Leeds-Lyon Symp. on Tribology, Lyon, 1993..
Kendall, K. 1988 Theoretical aspects of solid solid adhesion. Science
Progress, 72, 155-171.
Kendall, K. 1994 Cracks at adhesive interfaces. J. Adhesion Sci. Tech., 8,
1271 1284.
Lardner, T. J., & Pujara, P 1980 Compression of spherical cells. In Mechanics
Today, vol. 5. (ed. S. Nemat-Nasser), pp. 161-176. Pergamon.
Lardner, T. J., & Pujara, P. 1978 On the contact problem of a highly inflated
spherical nonlinear membrane. J. Appi. Mech., ASME, 45, 202 203.
Lifshitz, E. M. 1956 The theory of molecular attractive -c ' W between solids.
Soviet Phys. JETP (Engi. Transi.), 2, 73-83.
Loftsson, T., & Kristmundsóttir, T. 1993 Microcapsules containing water-soluble
cyclodextrin inclusion complexes of water-insoluble drugs. In Polymeric
delivery systems - properties and applications, (ed. M. A. El-Nokaly, D. M.
Piatt and B. A. Charpentier), pp. 168-189. ACS symposium series 520.
Luckham, P. F., & Costello B. A. Recent developments in the measurement of
interparticle forces. Adv. Colloid Jut. Sci., 44, 183-240.

REFERENCES
168
Maugis, D. 1985 Subcritical crack-growth, surface energy, fracture toughness,
stick-slip and embrittlement. J. Mater. Sci., 20, 3041-3073.
Maugis, D. 1992. Adhesion of spheres- the JKR-DMT transition using a Dugdale
model. J. Coil. mt. Sci., 150, 243 269.
Mooney, M. 1940 A theory of large elastic deformation. J. Appi. Phys., 11,
582 590.
Muller, V. M., Yushchenko, V. S. & Derjaguin, B. V. 1980 On the influence of
molecular force on the deformation of an elastic sphere and its sticking to
a rigid plane. J. Coil. mt. Sci., 77, 91 101.
Muller, V. M., Yushchenko, V. S. & Derjaguin, B. V. 1983 General theoretical
consideration of the influence of surface forces on contact deformations and
the reciprocal adhesion of elastic spherical particles. J. Coil. mt. Sci., 92,
92 101.
Nikias, K. J. 1992 Plant biomechanics. The University of Chicago Press.
Ogden, R. W. 1972 Large deformation isotropic elasticity - on the correlation of
theory and experiment for incompressible rubber-like solids. Proc. R. Soc.
Lond., A326, 565 584.
Petersen N. 0., W. B. McConnaughey & E. L. Elson 1981 Investigations of
structural determinants of cell shape. Comments Mol. Cell. Biophys., 1,
135 147.
Prapaitrakul, W., & Whitworth, C. W. 1990 Effect of excipients and pressure
on physical properties. Drug Dev. md. Pharm., 16, 1427-1434.
Rivlin, R. S. 1948 Large elastic deformation of isotropic materials IV. Further
developments of the general theory. Phil. Trans. Roy. Soc., A241, 379 397.

REFERENCES
169
Sebastian K. S. 1994 Indentation hardness of polymers. PhD thesis, Univ.
London.
Skalak R., Tozeren A., Zarda R. P. & Chien S. 1973 Strain energy function of
red blood cell membranes. Biophs. J., 13, 245 264.
Shipway P. H. & I. M. Hutchings 1993 Attrition of brittle spheres by fracture
under compression and impact load. Powder Tech., 76, 23-30.
Taber, L. A. 1982 Large deflection of a fluid-filled spherical shell under a point
load. J. Appi. Mech., ASME, 49, 121-128.
Tabor, D. & Winterton R. H. S. 1969 The direct measurement of normal and
retarded van der Waals forces. Proc. R. Soc. Lond., A312, 435 450.
Tabor, D. 1977 Surface force and surface interactions. J. Coil. mt. Sci., 58,
2 13.
Tabor, D. 1980 Role of molecular forces in the contact deformations. J. Coil.
mt. Sci., 73, 294.
Tabor, D. 1987 Adhesion of solids. In Tribology in particulate technology. (ed.
B. J. Briscoe & M. J. Adams), pp. 206-219. lOP Publishing Ltd press.
Tatara, Y. 1989 Extensive theory of force-approach relations of elastic spheres in
compression and in compact. J. Eng. Mater. Tech., ASME, 111, 163-168.
Tatara, Y. 1991 On compression of rubber elastic sphere over a large range
displacements-partl:theoretical study. J. Eng. Mater. Tech., ASME, 113,
285-291.

REFERENCES
170
Tatara, Y., Shima, S. & Lucero, J. C. 1991 On compression of rubber elastic
sphere over a large range displacements-part2:comparison of theory and
experiment. J. Eng. Mater. Tech., ASME, 113, 292-295.
Timoshenko, S. P. Coodier, J. N 1970 Theory of elasticity. 3rd Ed., McGraw-
Hill Ltd., pp. 398-422.
Treloar, L. R. G 1970 The physics of rubber elasticity. 3rd Ed., Oxford Univ.
Press, pp. 64-98.
Williams, D. R., Liu, K. K. &? Briscoe, B. J. 1995. A novel experimental method
for characterising the mechanical properties of single microscopic particles.
To be published in Rev. Sci. Instrum..
Wu, H., Spence, R. D. & Sharpe, P. J. H. 1988 Plant cell wall elasticity II.
Polymer elastic properties of the microfibrils. J. theor. Biol., 133, 239 253.
Wu, S. 1982. Polymer interface and adhesion. Marcel Dekker Inc press.
Yoffe, E. H. 1984. Modified Hertz theory for spherical indentation. Phil Mag.,
A50, 815-828.
Yoneda, M. 1973 Tension at the surface of sea urchin eggs on the basis of
liquid-drop concept. Advanc. in Biophy., 4, 153 190.
Zahalak G. I., W. B. McConnaughey & E. L. Elson 1990 Determination of cellu-
lar mechanical properties by cell poking, with an application to leukocytes.
J. Biomech. Eng., ASME, 112, 283-294.
Zhang, Z., Saunders, R., & Thomas, C. R. 1994 Micromanipulation measure-
ments of the bursting strength of single microcapsules. IChem Even., 2,
722-724.

REFERENCES
171
Zhang Z., M. A. Ferenczi & C. R. Thomas 1992 A micromanipulation technique with
a theoretical cell model for determining mechanical properties of single mammalian
cells. Chem. Eng. Scie., 47, 1347-1354.
Additional References
Kendall K. & T. P. Weihs 1992 Adhesion of nanoparticles within spray-dried
agglomerates. .1. Phys. D. App!. Phys., 25, A3-A8.
Krishnan S., A. A. Busnaina, D. S. Rimai and L. P. DeMejo 1994 The adhesion-
induced deformation and the removal of submicrometer particles. J. Adhes. Sci. &
Tech., 8, 1357-1370.
Rimai D. S., L. P. Demejo and R. C. Bowen 1994 Mechanics of particle adhesion. .1.
Adhes. Sci. & Tech., 8, 1333-1355.
Shipway P. H. and I. M. Hutchings 1993 Fracture of brittle spheres under compression
and impact loading: I -Elastic stress distributions, Phil. Mag. A 67, 1389-1404.
Shipway P. H. and I. M. Hutchings 1993 Fracture of brittle spheres under compression
and impact loading: II -Results for lead-glass and sapphire spheres, Phi!. Mag. A 67,
1405-1421.
)

![Chemical Engineering Course Curriculum for the New ...Chemical Engineering courses CL152: Introduction to Chemical Engineering, [2 1 0 6] Historical overview of Chemical Engineering:](https://img.pdfslide.us/doc/110x75/5e962b5aae543b3a820d5617/chemical-engineering-course-curriculum-for-the-new-chemical-engineering-courses.jpg)