Embed Size (px)
Citation preview

NATIONAL INSTITUTE OF TECHNOLOGY,
ROURKELA
Department of Chemical Engineering
B.Tech Thesis on
Thermal Pyrolysis of Groundnut De-Oiled Cake and
Characterization of Bio-Oil Produced
Supervisor Submitted By
Prof. R. K. Singh Ankit Agrawalla
Dept. of Chemical Engineering 107CH015
NIT Rourkela
i
CERTIFICATE
This is to certify that the work in this thesis entitled “Thermal pyrolysis of
groundnut de-oiled cake and characterization of the bio-oil produced”
submitted by Ankit Agrawalla (107CH015) in partial fulfillment of the
requirements of the prescribed curriculum for Bachelor of Technology in Chemical
Engineering Session 2007-2011 in the department of Chemical Engineering,
National Institute of Technology Rourkela, Rourkela is an authentic work carried
out by him under my supervision and guidance. To the best of my knowledge the
matter embodied in the thesis is his bona fide work.
Date: Prof. R. K. Singh
Department of Chemical Engineering
National Institute of Technology
Rourkela - 769008

ii
ACKNOWLEDGEMENT
I wish to thank Prof. R.K. Singh, my supervisor, for his constant support and guidance
throughout the course of the project.
I also wish to thank Prof. R. K. Singh & Prof. H. M. Jena for providing me an opportunity to
carry out the work and express my indebtedness towards the Department of Chemical
Engineering, NIT Rourkela, for supporting me in successfully completing the project.
I wish to express my gratitude to Dr. S.K. Biswal, Institute of Minerals and Materials
Technology, Bhubaneswar for his help during the course of the project.
In addition I also wish to thank Sachin Kumar (PhD Student), Vikranth Volli (M.Tech Student)
and Debalaxmi Pradhan (M.Tech Student) for their support and guidance during the project.
Ankit Agrawalla
107CH015

iii
Contents
CERTIFICATE……………………………………………………………………………………i
ABSTRACT………………………………………………………………………………………ii
ACKNOWLEDGEMENT………………………………………………………………………..iii
LIST OF TABLES ......................................................................................................................... vi
LIST OF FIGURES ...................................................................................................................... vii
NOMENCLATURE .................................................................................................................... viii
1. Introduction ................................................................................................................................. 2
1.1.Trends in Energy Resources .................................................................................................. 3
1.2. Potential for Clean Energy ................................................................................................... 7
1.3. Biomass ................................................................................................................................ 9
1.4. Pyrolysis ............................................................................................................................. 11
1.5. Pyrolysis of De-Oiled Seed Cakes ..................................................................................... 11
1.6. Pyrolysis of Groundnut De-Oiled Cake ............................................................................. 13
2. Materials and Methods .............................................................................................................. 15
2.1. Raw Material ...................................................................................................................... 15
2.2. Thermo-Gravimetric Analysis............................................................................................ 15
2.3. Experimental Procedure ..................................................................................................... 15
2.4. Sample Pyrolysis Runs ....................................................................................................... 16
2.5. Characterization of Raw Material and Char ....................................................................... 17
2.5.1 Proximate Analysis ....................................................................................................... 17
2.5.2. Ultimate Analysis ........................................................................................................ 17
2.5.3. Calorific Value ............................................................................................................ 17
2.5.4. Oil Content .................................................................................................................. 17
2.5.5. Surface Area of Char ................................................................................................... 17
2.6. Physical Characterization of Bio-Oil ................................................................................. 18
2.7. Chemical Characterization of Bio-Oil................................................................................ 18
2.7.1. FTIR............................................................................................................................. 18
2.7.2. GC-MS......................................................................................................................... 18
3. Results & Discussion ................................................................................................................ 20
3.1. Thermo-Gravimetric Analysis............................................................................................ 20

iv
3.2. Sample Pyrolysis Runs ....................................................................................................... 21
3.3. Characterization of Groundnut De-Oiled Cake and Char .................................................. 22
3.3.1. SEM Images ................................................................................................................ 23
3.4. Physical Properties of Bio-Oil............................................................................................ 24
3.5. Chemical Composition of Bio-Oil ..................................................................................... 26
3.5.1. FTIR Analysis.............................................................................................................. 26
3.5.2. Gas Chromatography-Mass Spectrometry ................................................................... 27
4. Kinetic Study of Reaction ......................................................................................................... 31
5. Industrial Scale-Up and Economic Assessment ....................................................................... 35
5.1. Aim ..................................................................................................................................... 35
5.2. Raw Material ...................................................................................................................... 35
5.3. Products .............................................................................................................................. 35
5.4. Process ................................................................................................................................ 35
5.5. Material Balance (1Kg Basis) ............................................................................................ 36
5.6. Energy Balance .................................................................................................................. 36
5.6.1. Energy Balance for Reactor ......................................................................................... 36
5.6.2. Energy Balance for Condenser .................................................................................... 37
5.7. Equipment Size .................................................................................................................. 40
5.7.1. Reactor ......................................................................................................................... 40
5.7.2. Crusher......................................................................................................................... 40
5.7.3. Condenser .................................................................................................................... 40
5.7.4. Decanter ....................................................................................................................... 42
5.8. Cost Analysis...................................................................................................................... 42
5.8.1. Factorial Method to Determine Total Investment: ...................................................... 42
5.8.2. Operating Cost ............................................................................................................. 45
6. Conclusion ................................................................................................................................ 49
References ..................................................................................................................................... 51
Publications……………………………………………………………………………………………………………………………………………55
v
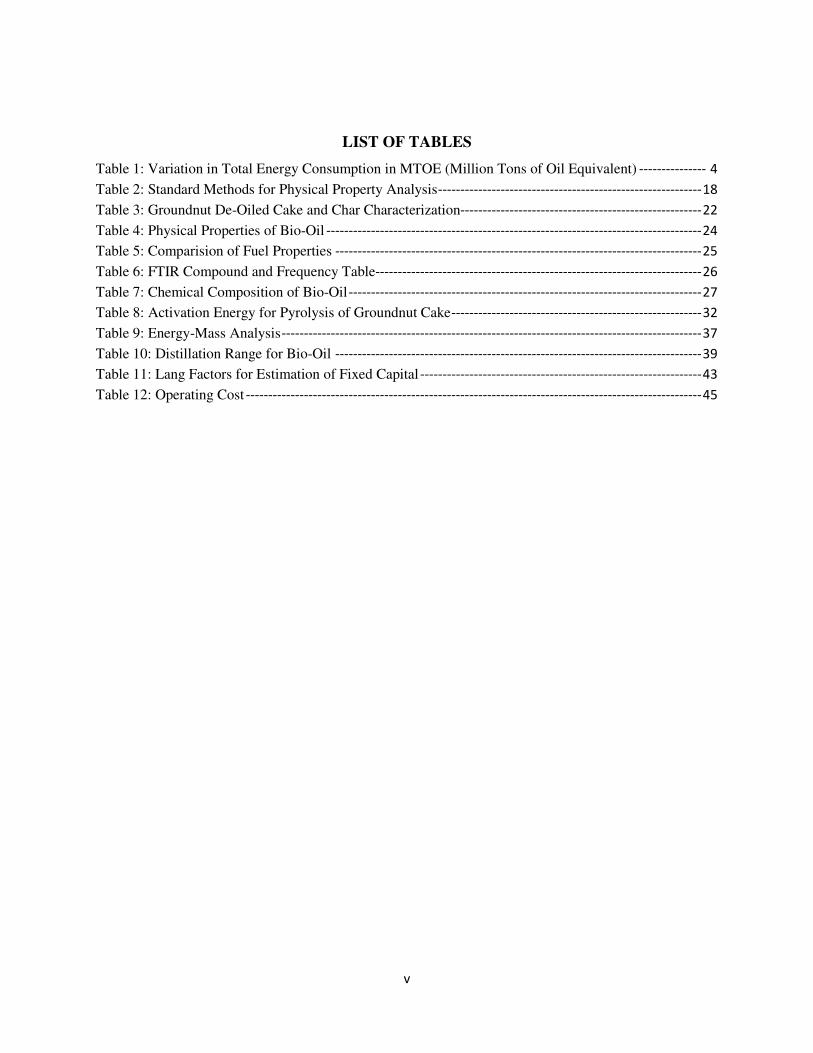
LIST OF TABLES
Table 1: Variation in Total Energy Consumption in MTOE (Million Tons of Oil Equivalent) --------------- 4
Table 2: Standard Methods for Physical Property Analysis ----------------------------------------------------------- 18
Table 3: Groundnut De-Oiled Cake and Char Characterization------------------------------------------------------ 22
Table 4: Physical Properties of Bio-Oil ------------------------------------------------------------------------------------ 24
Table 5: Comparision of Fuel Properties ---------------------------------------------------------------------------------- 25
Table 6: FTIR Compound and Frequency Table ------------------------------------------------------------------------- 26
Table 7: Chemical Composition of Bio-Oil ------------------------------------------------------------------------------- 27
Table 8: Activation Energy for Pyrolysis of Groundnut Cake -------------------------------------------------------- 32
Table 9: Energy-Mass Analysis ---------------------------------------------------------------------------------------------- 37
Table 10: Distillation Range for Bio-Oil ---------------------------------------------------------------------------------- 39
Table 11: Lang Factors for Estimation of Fixed Capital --------------------------------------------------------------- 43
Table 12: Operating Cost ------------------------------------------------------------------------------------------------------ 45

vi
LIST OF FIGURES
Figure 1: Fuel Wise energy Consumption under various scenarios -------------------------------------------------- 6
Figure 2: Biomass Life Cycle ------------------------------------------------------------------------------------------------- 9
Figure 3: Principal Methods of Biomass Conversion ------------------------------------------------------------------- 10
Figure 4: Experimental Set-Up ----------------------------------------------------------------------------------------------- 16
Figure 5: TGA Curve for Groundnut De-Oiled Cake ------------------------------------------------------------------- 20
Figure 6: Yield vs. Temperature --------------------------------------------------------------------------------------------- 21
Figure 7: Reaction Time vs. Temperature --------------------------------------------------------------------------------- 21
Figure 8: SEM Images of Char Surface: 500 magnifications (left) and 2000 magnifications (right) ------- 23
Figure 9: SEM Image of Char Surface at 8,500 magnifications ----------------------------------------------------- 23
Figure 10: FTIR Graph --------------------------------------------------------------------------------------------------------- 26
Figure 11: Kinetic Analysis Plot for Determination of Activation Energy ---------------------------------------- 32
Figure 12: Process Flow Diagram for Pyrolysis Unit ------------------------------------------------------------------- 35
Figure 13: Mass-Energy Consumption Plot ------------------------------------------------------------------------------- 37
vii
NOMENCLATURE
MTOE Million tons of oil equivalents
TERI The Energy and Resources Institute
GoI Government of India
GDP Gross Domestic Product
MNRE Ministry of New and Renewable Energy
TGA Thermo-gravimetric Analysis
PID Proportional-integral-derivative
ASTM American Society for Testing and Materials
SEM Scanning Electron Microscope
FTIR Fourier Transform Infrared Spectroscopy
GCV Gross Calorific Value

viii
ABSTRACT
Energy crisis have led to a vast research on various alternative sources of energy in order
to cope up with the growth in standard of living of all human beings across the world. Biomass is
found to be one of the most promising sources of energy which can ease out the energy crisis.
Hence, various technologies and processes are evolved to utilize the biomass resource efficiently.
Pyrolysis is one of the latest technologies which have the potential to provide valuable liquid and
gaseous fuels from these biomass sources. In this paper, thermal pyrolysis of groundnut de-oiled
cake was performed in a semi batch reactor at a temperature of 450°C for the production of
groundnut pyrolytic oil or the bio-oil. The physical properties analysis of bio-oil was compared
with physical properties of commercial transportation fuels and other pyrolytic oils. GC-MS was
performed to determine its chemical composition. Kinetic study of the pyrolysis reaction was
also done.
Keywords: Pyrolysis, Groundnut De-oiled Cake, Pyrolytic Oil, Kinetic Study

1
INTRODUCTION

2
1. Introduction
Nowadays, Energy has become a stature symbol for economic growth and human
development. It has been observed that energy consumption shows a two way relationship with
economic development, one is economy growth which relies on availability of cost effective and
environmental friendly energy sources whereas on the other hand, level of economic
development which is observed to be reliant on energy demand.
In a growing economy like India, energy is an essential building block of its
development. In the past decades, India’s energy consumption has been increasing at one of the
fastest rates in the world due to rapid population growth and economic development, with its
primary commercial energy demand increasing by 6% from 1981 to 2001 as reported by
Planning Commission, Government of India[1]. India accounted for 3.5% of the world
commercial energy demand in the year 2003 making it fifth highest consumer in the world in
terms of primary energy consumption[2]. However, per capita energy consumption in India is still
very low compared to other developing/developed countries irrespective of its overall increase in
energy demand.
Indian energy sector has witnessed rapid growth and revolutionary developments in areas
like resource exploration and exploitation, energy sector reforms and capacity additions in order
to meet its demands on its course to become a developed country. Still, India is lagging behind to
meet the increasing energy demands because of rapid urbanization, multiplying population and
progressing economy even after the efforts made in energy supply growth and resource
augmentation. These energy shortages are affecting tremendously to Indian economy as it has to
rely heavily on imports.

3
1.1.Trends in Energy Resources
India has been gifted well enough with both exhaustible and renewable energy resources.
Coal, Oil, and Natural Gas are the three primary commercial energy sources on which India has
relied upon from decades. Till the end of 1980s, India’s energy policy was mainly based on
availability of native resources which made coal the largest source of energy. India lacks in oil
assets and therefore has to depend on crude imports to meet a major share, around 70% of its
needs in 2009 [3]. However, India’s primary energy mix has changed a lot over the decades
butcoal has remained the most significant & ample fossil fuel in India till now and is expected to
be the dominant source for energy till 2030 with a contribution of around 51% of India's energy
need[4]. Currently, coal contributes around 52% (283 MTOE) of commercial energy requirements
whereas petroleum products accounts for 30-35%, nearly 9 per cent by natural gas and 2% by
nuclear and 2% hydro energy [4].
Indian economy relies heavily on commercial fuels but a sizeable quantum of energy
requirements, especially in the rural household sector, is met by non-commercial and traditional
energy sources such as fuelwood, crop residue, biomass and animal waste,human and draught
animal power. The usage of such sources of energy is estimated at around 155 MTOE/annum [5].
However, higher quality and more efficient commercial energy sourceshave started to replace the
traditional energy resources.
In Planning Commission 2002, it was desired by Government of India to achieve 10%
GDP (Gross Domestic Product) growth rate during Eleventh Five Year Plan and to maintain an
average growth rate of about 8% for the next 15 years. It confirmed that country’s requirements
for energy and supporting infrastructure is going to increase rapidly and in order to facilitate the
policy makes to make prompt decisions, estimation of the total energy requirements as well as

4
look at the economic, environmental, and geopolitical implications of India’s alternative energy
pathways for the next few decades is very crucial. Demographic profile, change in lifestyle, and
consumer preferences determined the level of useful energy demands, whereas the availability,
prices of resources and technologies influenced the levels and patterns of final energy
requirements in the future[6].
In order to estimate the total energy requirements in future, The Energy and Resources
Institute (TERI, Office of the Principle Scientific Adviser, GoI) modeled a system to determine
the total commercial energy requirements over the period of 2001-2031 under different scenarios
such as BAU (business as usual), REN (aggressive renewable energy), NUC (high nuclear
capacity), EFF (high efficiency), HYB (hybrid), LG (low growth), HG (high growth) and HHYB
(high hybrid) which almost dictated the routes toward future and increase in energy consumption
as the cost for the route. The findings are shown below:
Table 1: Variation in Total Energy Consumption in MTOE (Million Tons of Oil Equivalent)[6]
Scenario 2001/02 2006/07 2011/12 2016/17 2021/22 2026/27 2031/32
BAU 285 391 527 749 1046 1497 2123
REN 285 391 524 740 1033 1479 2097
NUC 285 391 527 749 1030 1455 2061
EFF 285 379 479 623 838 1131 1542
HYB 285 379 478 619 823 1101 1503
LG 285 361 456 605 816 1134 1579
HG 285 435 638 962 1438 2186 3351
HHYB 285 405 544 760 1087 1576 2320
As reported by TERI, the total commercial energy consumption in BAU scenario, is
estimated to increase up to 2123 MTOEs, i.e. by 7.5 times, till 2031. A comparative study
between effect of different economic growth scenario such as LG (economy grows at 6.7% with

5
a GDP of 5.9%) and HG (economy grows at 10% with GDP 8.6%) on energy requirements
showed that commercial energy requirement will increase to only about 1579 MTOE by 2031 in
LG scenario, whereas the energy requirements can be as high as 3351 MTOE in the HG scenario.
The REN and NUC scenario analysis also cleared it that the plans of enhancing the exploitation
of hydro energy, nuclear energy and renewable energy sources will not help much when
compared to total commercial energy requirements by 2031. It was estimated that the
contribution of hydro, nuclear, and renewable energy forms together will increase by about 6
times over the period 2001–31, but they can contribute only 4.5% of the total commercial energy
requirements. Thus, the dependence on the three conventional energy forms: coal, oil, and gas
will continue to remain high for the next few decades. Increase in efficiency in power, industrial
and transport sectors, on both demand and supply side, showed a significant scope of reducing
overall energy consumption. In the HYB scenario, energy requirements by the year 2031 would
be of the order of those in the LG scenario, while those in the HHYB scenario will be in the
range of requirements in the BAU scenario.
A fuel wise commercial energy consumption analysis was also made to check the
dependence on various fuels. It was seen that, Natural Gas will be a preferred option for power
generation and fertilizer production but coal and oil will remain dominant fuels till next few
decades. However, the HYB scenario indicates some potential to reduce coal and oil
requirements as compared to the BAU scenario only with adequate, timely policy and
technological intervention.

6
Figure 1: Fuel Wise energy Consumption under various scenarios [6]
The report have clearly shown that in order to reduce dependence on imports of
conventional energy fuels and to withstand energy security viewpoint, the country have to
undertake every possible options on the demand and supply side simultaneously so as not only to
reduce its total energy requirements but also diversify its fuel resource mix. An integrated energy
planning exercise with the following key elements were suggested:
• More thrust to exploration and production of coal, involvement of private sector.
• Energy security in hydrocarbons, engage private sector to produce hydrocarbons.
• Reduce coal requirements and consumption of petroleum products, Natural gas to be the
preferred fuel.
• Renewable energy resources to be made competitive, and targeted to spread it in remote
areas and for decentralized power generation.
• Enhanced efforts to tap alternative indigenous energy sources.
• Reduce transmission and distribution loss.

7
1.2. Potential for Clean Energy
In current scenario, where the consumption of fossil fuels, in both rural and urban sectors,
have increased exponentially over the past decades and is expected to increases in the same
manner for next couple of decades will lead to increase in not only its market price but also in
the greenhouse gas emissions. Thus, a dire need to put a control over its consumption has been
felt by environmentalists and economists as well. In regard to this, a lot of research works are
going on around the globe on various alternative sources of energy such as solar energy, wind
energy, geothermal energy, hydrogen, nuclear energy, biofuel or biomass, etc.
Renewables have continuously shown enormous potential to meet the growing energy
requirements of the increasing population of the developing world along with sustainable
solutions to the global threats of climate change. In a country like India, renewable sources have
special significance owing to its geographic diversity and size of country and its rural economy.
As reported by MNRE in its annual report 2010-11[7], India has a potential of generating 87,200
MW (close to current energy generated by thermal power) of energy from renewable sources like
wind power (48,500 MW), small hydropower (15,000 MW) and bio power (23,700 MW -
including biomass power, bagasse cogeneration, urban and industrial waste to energy). In respect
to solar energy, India can generate 20-30MW per Sq.Km. Now, India has an area of 3.287
million Sq.km., out of which 87.5% is covered by agricultural, forests and fallow lands, 6.7% by
housing and industry and rest 5.8% is either barren or snow bound or generally inhabitable, thus
making 12.5% of land available for solar installation. If 10% of this land is utilized for solar
installations then it can generate 0.82-1.23 million MW of energy.
In India, focus on renewable energy came a bit late in around 1980s, when a commission on
Additional Sources of Energy was implemented in 1981 along with a Department of Non-

8
Conventional Energy Sources in 1982. Renewable energy programmes were also initiated in the
country with focus on research and development, demonstration and extension based on grants
and subsidies. Various state nodal agencies were also established in order to co-ordinate,
implement, and facilitate renewable energy programmes. IREDA (Indian Renewable Energy
Development Agency) established in 1987 was a unique institutional innovation which has to
take care to finance renewable energy projects. To provide further motivation to renewable
energy development and its utilisation; a full-fledged Ministry, the Ministry of Non-
Conventional Energy Sources was formed in 1992.During 1990s, the emphasis of renewable
energy programmes was shifted on commercialisation and market orientation to encourage
greater involvement of the private sector. These programmes are supported by state-level
policies for power generation from renewables, including wheeling, banking, and power
purchase which led to the creation of a sizable indigenous manufacturing base and an
institutional framework and delivery mechanism to support research, development,
demonstration, deployment, and extension. As a result of this, till date India has many
achievements in several areas in the renewable energy field.
According to MNRE, 18,842 MW of grid connected renewable power was in place till
January 31st, 2011 and is expecting to add more 3646 MW by the end 11th Five Year Plan (2007-
12). Around 70% of the installed capacity, i.e. 13,184 MW, is supplied by wind power only
whereas other contributors are small hydropower (2,953 MW), bio power (2,673 MW) and 32
MW supplied by solar power [7].

9
1.3. Biomass
Material originated biologically, other than those which got embedded in geological
formations and converted to fossils, are referred as biomass. Plants absorb CO2 from its
surrounding and convert it into biomass by photosynthesis. The energy stored in biomass is
derived from the solar energy absorbed by plants during photosynthesis. Biomass sources can be
generally classified as different kinds of woody and herbaceous plants, fruits, seeds, energy crops
and animal or horticulture or industrial by-products. Biomass life cycle indicates a high potential
of being a clean energy source as it doesn’t add any extra CO2 to the atmosphere.
Figure 2: Biomass Life Cycle [8]
Before 19th century, biomass was the primary energy source till the discovery of a liquid
fuel, known as crude oil, which industrialised the whole world and improved the standard of
living of the people. Eventually, the society became dependent on this crude oil and led to
massive exploitation of all crude oil resources and negligence in development of other energy
sources for almost two centuries. Such an attitude has resulted into energy crisis situation after
the extinction of crude oil resources. Owing to this, all countries have changed their focus back
to renewable energy in order to achieve a sustainable world energy matrix. Among the renewable

10
energy sources, biomass has been stressed more as it is available in abundance, is easy to culture
and has a comparatively lower market value. Moreover, the technologies required for its
conversion are very basic and well established. They just need to be nurtured in order to increase
their efficiency and credibility of biomass. It has also been observed that if biomass is utilized
properly then it can supplement 10-14% of world’s total energy. In ancient period, energy from
biomass was extracted by direct combustion which was very inefficient and polluting due to its
high moisture content and low density. Nowadays, a lot of modifications and pre-treatment of
biomass have resulted into various efficient technologies. The advanced technologies are more
focused on converting biomass into secondary energy forms such as electricity, gaseous and
liquid fuels, hydrogen, etc. There are basically three principal methods of conversion of biomass:
(a) Thermo-Chemical Conversion, (b) Physical-Chemical Conversion and, (c) Bio-Chemical
Conversion.
Figure 3: Principal Methods of Biomass Conversion [9]

11
As it can be observed, these conversion processes yield biofuels in all the three physical
forms of matter:
i. Solids: charcoal, pellets, etc.
ii. Liquids: vegetable oil, biodiesel, pyrolytic oil or bio-oil, bioethanol, etc.
iii. Gaseous: synthesis gas, mixtures of hydrocarbons gases with CH4 and CO, etc.
1.4. Pyrolysis
Pyrolysis is a thermo-chemical process for conversion of biomass by heating the biomass
feedstock at high temperature in absence of air which produces gaseous products which is then
condensed to give liquid fuels consisting of pyrolytic oil or bio-oil and oily water (mixture of
water and certain hydrocarbons). Almost 70-80% of gaseous products are converted in liquid
fuels providing a good quantity of liquid fuel which then can be enhanced according to its use.
The reason for popularity of this process is that it derives a good quantity of liquid fuel, from
biomass, which has properties very close to commercial transportation fuels and hence can be
upgraded or modified to replace transportation fuel. Moreover, it also provides some amount of
gaseous and solid products which have higher market value as they can also be used as a source
of energy.
1.5. Pyrolysis of De-Oiled Seed Cakes
In the quest for a liquid fuel which can have the potential to replace transportation fuel, a
lot of researches are being carried out in ever corner of the world. Apart from biodiesel and bio-
ethanol which are obtained from esterification or fermentation, pyrolytic oils obtained by
pyrolysis of biomass have provided good results to diverge some attention towards it. Although
origin of the raw material for producing biodiesel, bioethanol and pyrolytic oil is same, but they
cater different uses and market value. Biodiesel or bioethanol are prepared using oils extracted

12
from energy crops or edible seeds along with certain chemicals, which indicates that they are
using raw materials having other meaningful utilities and higher market value. In a country like
India, where lot of people are struggling for minimal diet, utilizing edible oils extracted from
oilseeds for production of bio-diesel is not justified to mankind. Thus raw material resources
available for bio-diesel production limits to specifically cultivated non-edible energy crops.
Now, pyrolytic oil can be obtained from any of the agricultural and industrial residues and
wastes such as de-oiled cakes, plastics, bagasse, rice husk, etc. which are treated as scrap.
Therefore, the raw material used is not only cheap but also doesn’t have any better use than this.
So, abundantly available cheap raw material which are being mostly treated as scrap
when pyrolysed produces a liquid fuel which shows a quite admissible properties for being a
commercial fuel; a certain thing which every country is looking forward to. Thus, a lot of
researches have been carried out on pyrolysis of de-oiled cakes with different raw materials such
as rapeseed[15], [18] ,[19], [20], cottonseed[23], safflower[11], [12], [14], [22], sunflower[21], olive oil residual
cake[13], cherry seeds[17], rice husk[16], bagasse[25] and even on fruit pulps[24] and energy crops[10].
In most of the researches, people have obtained pyrolytic oil and characterized its
physical properties such as density, viscosity, flash point, pour point, calorific value, distillation
boiling range to check its feasibility as transportation fuel. They have also analyzed all the
chemical compounds present in the oil via chromatograms, spectroscopy, etc. to gain an insight
on its stability, volatility and corrosive nature.
After physical and chemical characterization, some of researchers have studied the
kinetics of the reactions taking place and have modeled the rate equation and determined
activation energy of the reaction.

13
1.6. Pyrolysis of Groundnut De-Oiled Cake
According to World Market and Trade Analysis, Groundnut is the fourth largest oilseed
produced in the world after Soybean, Rapeseed/Mustard and Cottonseed accounting for around
34.71 million metric tons produced in the fiscal year April 2010/11. Indian Oilseeds and
Produce Exports Promotion Council [26] have analyzed that around 5.12 million tons of
groundnut was produced during the year 2009-10 making it third largest produced oilseed of
India after Soyabean and Rapeseed/Mustard. Thus, its abundance in quantity can make it a vital
source for biomass in a developing country like India. Irrespective of groundnut being available
in plenty of quantity, very little work has been carried out on it.
Therefore, in this paper, pyrolytic oil is obtained by pyrolysis of groundnut de-oiled
cakes and has been characterized for its chemical and physical properties. Its properties were
compared with those of commercial transportation fuels and other pyrolytic oils. Activation
energy for the process is also determined using thermo-gravimetric analysis of the sample.

14
MATERIALS
&
METHODS

15
2. Materials and Methods
2.1. Raw Material
The groundnut de-oiled cake used in the experiment was bought from a fodder shop from
a local market of Rourkela, Orissa, India. The cake was in the form of flakes and was powdered,
using a household grinder, before use so as to minimize voids inside the reactor as well as to fill
maximum amount of cake into the reactor.
2.2. Thermo-Gravimetric Analysis
Pyrolysis is heating of a substance in absence of air at a particular temperature.
Therefore, the temperature for effective pyrolysis of the groundnut cake has to be determined.
For this purpose, thermo-gravimetric analysis (TGA) of the sample cake was done using a
DTG60 instrument. Around 20-30 milligrams of sample cake was taken and heated up to a final
temperature of 800°C and a residence time of 1 minute at 800°C was allowed. TGA was
performed both in air and nitrogen atmospheres at a heating rate of 25°C/Min and one
observation was taken at a heating rate of 20°C/Min in air medium. Thermo-gravimetric weight
loss curve was plotted against temperature. It provides a range of temperature in which
maximum thermal degradation of groundnut de-oiled cake takes place.
2.3. Experimental Procedure
It consisted of a reactor-furnace system in which the furnace temperature was maintained
constant using a PID controller. At the outlet of reactor, a condenser was attached to condense
the vapors coming out of it. The condensed liquid was collected in a collecting jar at the end of
condenser. The de-oiled cake is filled in a reactor of 300 ml and the reactor is kept in the furnace
for heating at constant temperature, temperature at which maximum yield of liquid product is
obtained. When the reaction starts, vapors coming out of reactor through the provided outlet are

16
condensed in a condenser as shown in figure 4. Water is circulated as cooling medium in the
condenser via a pump. The condensed vapors are collected in a container as the liquid product
whereas there is some amount of non-condensable gases which are simply left out. The liquid
product collected contains oily water and bio-oil. Oily water is basically water with some
dissolved hydrocarbons. Oily-water and bio-oil is further separated by difference in their density.
Figure 4: Experimental Set-Up
2.4. Sample Pyrolysis Runs
Once the temperature range was found out then sample pyrolysis runs were done with
30gms of cake in that range at intervals of 50°C to determine the temperature at which maximum
yield of liquid product is obtained. During sample runs various data like reaction time, yield of
char, and yield of liquid product were noted down. Variation in yield of char, liquid product and
gas (volatiles) with respect to temperature is plotted. Variation in reaction time with temperature
was also plotted.

17
2.5. Characterization of Raw Material and Char
The groundnut cake and char were analyzed in order to observe the change in the
properties of the solid material as a result of pyrolysis.
2.5.1 Proximate Analysis
It provides information on moisture content, ash content, volatile matter content and fixed
carbon content of the material. It was carried out using ASTM D3172 - 07a [27] method.
2.5.2. Ultimate Analysis
Ultimate analysis is performed to determine the elemental composition of the material. It
was carried out using a CHNSO elemental analyzer (Variael CUBE Germany) which provides
carbon, hydrogen, nitrogen, sulphur percentage composition. And when sum of theses
compositions is subtracted from 100, it gives oxygen percentage composition.
2.5.3. Calorific Value
Calorific value of a material is the amount of heat liberated when 1Kg of that material is
burnt. It was determined for both cake and char using a bomb calorimeter (Model: AC-350,
LECO Corporation, USA).
2.5.4. Oil Content
Oil content of the raw material was found out using Soxhlet apparatus.
2.5.5. Surface Area of Char
2.5.5.1. BET
The surface area of the char obtained was determined, to investigate it utility as an
adsorbent, using a Surface Area Analyzer (Model: Smartsorb 92/93), Smart Instruments,
Mumbai.

18
2.5.5.2. SEM
The surface of the char obtained was viewed under a Scanning Electron Microscope
(Model: JEOL-JSM-6480LV SEM) at different magnification values to have a clear view on
pore density and size.
2.6. Physical Characterization of Bio-Oil
Physical properties such as density, specific gravity, viscosity, conradson carbon, flash
point, fire point, pour point, cloud point, calorific value, sulphur content, distillation boiling
range and cetane index of the bio-oil was determined using the following standard methods:
Table 2: Standard Methods for Physical Property Analysis
Physical Property Method Density ASTM D1298 - 99
Kinematic Viscosity ASTM D445 - 11 Conradson Carbon ASTM D189 - 06(2010)e1
Flash Point ASTM D6450 - 05(2010) Fire Point ASTM D1310 - 01(2007) Pour Point ASTM D5853 - 09
Calorific Value ASTM D5468 - 02(2007) Distillation Boiling Range ASTM D2887 - 08
Cetane Index ASTM D4737 - 10
2.7. Chemical Characterization of Bio-Oil
2.7.1. FTIR
In order to determine the functional groups present in the pyrolytic oil, Fourier Transform
Infrared spectroscopy of the oil was analyzed in a Perkin-Elmer infrared spectrometer.
2.7.2. GC-MS
Gas Chromatography – Mass Spectrometry of the pyrolytic oil was performed using a
GC-MS-OP 2010[SHIMADZU] analyzer in Sargam Laboratory, Chennai to determine the
chemical compounds present in the oil.

19
RESULTS
&
DISCUSSION

3. Results & Discussion
3.1. Thermo-Gravimetric Analysis
The TGA curve showed that the
the temperature range of 200-500°C
temperature range of 500-650°C is observed for thermal degradation of the cake but
obtained during this phase are generally higher hydrocarbons and ar
temperature range of 500-650°C was neglected as it will not increase the yield of liquid product
which is the main concern out here.
Figure 5: TGA Curve for Groundnut De
0
20
40
60
80
100
0 100 200
% M
ass
Red
uced
20
Gravimetric Analysis
The TGA curve showed that the maximum thermal degradation of the cake took place
500°C in all the three observations. In nitrogen medium, a second
650°C is observed for thermal degradation of the cake but
obtained during this phase are generally higher hydrocarbons and are non-condensable. Thus
650°C was neglected as it will not increase the yield of liquid product
which is the main concern out here.
: TGA Curve for Groundnut De-Oiled Cake
200 300 400 500 600 700 800
Temperature
Air-25CPM
Air-20CPM
Nitrogen-25CPM
maximum thermal degradation of the cake took place in
In nitrogen medium, a second
650°C is observed for thermal degradation of the cake but the vapors
condensable. Thus
650°C was neglected as it will not increase the yield of liquid product
800
25CPM

21
3.2. Sample Pyrolysis Runs
The plot between yield of liquid, solid and gaseous products vs. temperature clearly
shows that the yield of liquid product increases with increases in temperature in the range of 200-
500°C up to 450°C and then it starts decreasing. Thus maximum yield of liquid product is
obtained at 450°C which indicates it as effective pyrolysis temperature for groundnut de-oiled
cakes. Reaction time decreases with increase in temperature.
Figure 6: Yield vs. Temperature
Figure 7: Reaction Time vs. Temperature

22
3.3. Characterization of Groundnut De-Oiled Cake and Char
Proximate analysis is the quickest and simplest way of investigating the fuel quality of
solid materials. High moisture content effects the conversion efficiency and heating value of
biomass and have a potential to loose energy during storage as a result of decomposition. Higher
value of ash content also affects heating value. High volatile content indicates that the material is
more volatile than solid fuels whereas loss in fixed carbon content during pyrolysis should be
less. The de-oiled cake has a very high volatile matter content of 83% which reduces
drastically to 35.3% after pyrolysis which indicates higher conversion of biomass to liquid fuels.
As a result of decrease in volatile matter content, fixed carbon of material increased significantly
which means there is less liberation of fixed carbon.
Ultimate analysis showed significant variation in carbon and oxygen content whereas
there were slight variations in hydrogen, nitrogen and sulphur content.
Table 3: Groundnut De-Oiled Cake and Char Characterization
Groundnut Cake Groundnut Char
Moisture Content 5.6 4.08
Volatile Content 83 35.3
Ash Content 4.8 15.6
Fixed Carbon 6.6 45.02
C 46.37 63.78
H 7.015 3.94
N 6.89 7.58
S 0.287 0.167
O 39.438 24.533
C/H Molar Ratio 0.55 1.35
C/N Molar Ratio 7.851717465 9.816622691
% Oil Content 4.18 -
Empirical Formula C7.85H14.25O5.01NS0.02 C9.82H7.28NO2.83S0.01
Gross Calorific
Value(MJ/Kg) 15 25.16
Surface Area(m2/gm) - 0.59

23
3.3.1. SEM Images
The images of the char surface obtained from scanning electron microscope (SEM) at
magnification levels of 500, 2000 and 8,500 clearly shows reasonable amount of pores present
on the surface.
Figure 8: SEM Images of Char Surface: 500 magnifications (left) and 2000 magnifications (right)
Figure 9: SEM Image of Char Surface at 8,500 magnifications

24
3.4. Physical Properties of Bio-Oil
Table 4 shows the physical properties such as density, specific gravity, kinematic
viscosity, carbon residue, sulphur content, flash point, fire point, pour point, cloud point, gross
calorific value, distillation boiling range and cetane index which helps in assessing and
determining feasibility of bio-oil as commercial liquid fuels.
Table 4: Physical Properties of Bio-Oil
Products Groundnut Pyrolytic Oil
Properties
Density @ 15oC in gm/cc 1.0219
Specific Gravity @ 15oC/15OC 1.0228
Kinematic Viscosity @ 40oC in CSt 44.9 Conradson carbon residue (%) 4.09
Flash Point (oC) 50
Fire Point (oC) 62
Cloud Point (oC) 3
Pour Point (oC) -2
Gross Calorific Value in Kcals/kg 6917 Sulphur Content (%) 0.5
Distillation:
Initial boiling Point (oC) 90
10% Recovery (oC) 98
30% Recovery (oC) 250
50% Recovery (oC) 312
70% Recovery (oC) 342
90% Recovery (oC) 358
Final Boiling Point (oC) 362 Calculated Cetane Index (CCI) 22
From comparison of physical properties of bio-oil with transportation fuels [Table 5] it
can be observed that groundnut bio-oil is more dense and highly viscous which may affect
pumping and injection of fuel in the engine at lower temperatures. Density and viscosity of bio-
oil can be modified by blending it with different transportation fuels. Flash point of bio-oil is in

25
comparable range and hence will ensure safe storage but pour point is minus 2°C which will not
cause any trouble in most of the regions but in colder regions with sub zero climate it may have
freezing problems. Calorific value is around 70% of that of gasoline and diesel which is actually
good enough for an agricultural waste although we will have somewhat less performance of
engine. The distillation range showed that the bio-oil starts boiling at 90°C and the distillation
stops at around 360°C. It means the bio-oil contains substantial amount of volatiles as it initial
boiling point is below 100°C. Only 2-3% of the bio-oil is found as residue at the end of
distillation. As it can be observed from Table 4, the properties of bio-oil were in similar range to
that of other pyrolytic oils.
Table 5: Comparison of Fuel Properties
Properties Specific Gravity
15oC/15°C
Kinematic Viscosity @40oC (cSt)
Flash Point
Pour Point
GCV (MJ/Kg)
IBP FBP Chemical Formula
Fuels
Groundnut Pyrolytic Oil
1.0228 44.9 50 -2 28.9 90 362 C4-C28
Gasoline[29] 0.72-0.78 - -43 -40 42-46 27 225 C4-C12
Diesel[28] 0.82-0.85 2-5.5 53-80 -40 to -1 42-45 172 350 C8-C25
Bio-Diesel[28] 0.88 4-6 100-170 -3 to 19 37-40 315 350 C12-C22
Heavy Fuel Oil[25] 0.94-0.98 >200 90-180 - 40 - - -
Rapeseed[18-20]
Pyrolytic Oil 0.993 >40 62 6 36-37 - - CH1.78N0.04O0.15
Safflower[11, 12, 14] Pyrolytic Oil
1.02-1.079 50-250 58-76 -16 38-41 92 315 CH1.88O0.15N0.02
Grape Bagasse[25] 0.992 >23 61 - 32.95 - - CH1.45O0.17N0.03
Olive Bagasse[13] 1.07 >50 77 - 31.6 - - -

26
3.5. Chemical Composition of Bio-Oil
3.5.1. FTIR Analysis
FTIR analysis suggests that the functional groups like alcohols, ketones, carboxylic acids,
esters, alkanes, alkenes, alkynes, amide, nitriles, nitro compounds, ethers, aromatic rings may be
present in the bio-oil. It has to be confirmed with gas chromatography results.
Figure 10: FTIR Graph
Table 6: FTIR Compound and Frequency Table
Compound Type Frequency
Alkanes 2850-2960 Alkenes 1640-1680 Alkynes 2100-2260
Aldehydes, Ketones, Carboxylic Acids, Esters 1670-1760 Amines 1580-1650 Nitriles 2220-2260
Nitro Compounds 1500-1660 Aromatic Rings 1500-1600

27
3.5.2. Gas Chromatography-Mass Spectrometry
The chemical composition of the bio-oil was determined using GC-mass spectrometry.
The compounds present in the bio-oil were identified by comparing the chromatogram obtained
with standard chromatogram data available. It was found that bio-oil consisted of around 70
compounds as shown below [Table 7].
Table 7: Chemical Composition of Bio-Oil
Compound Area % Formula
o-Cresol 1.14 C7H8O
p-Cresol 4.75 C7H8O
o-Guaiacol 1.6 C7H8O2
Undecane 0.52 C11H24
Butanamide, 3-methyl- 0.46 C5H11NO
3-pyridinol 2.93 C5H5NO
Hexanamide 1.24 C6H13NO
2-methyl-3-hydroxypyridine 0.63 C6H7NO
2-ethylphenol 0.86 C8H10O
Succinimide 0.27 C4H5NO2
Benzyl nitrile 0.48 C8H7N
2,4-dimethylphenol 1.03 C8H10O
Glutarimide 1.32 C5H7NO2
4-ethylphenol 2.41 C8H10O
1-acetylpyrrolidine 0.41 C6H11NO
3,3-Dimethylpyrrolidine-2,5-dione 0.28 C6H9NO2
(3z)-3-tetradecene 0.28 C14H28
Dodecane 1.38 C12H26
2,3-dihydro-benzofuran 0.44 C8H8O
3-phenylpropionitrile 0.98 C9H9N
p-Ethylguaiacol 0.94 C9H12O2
α-Tridecene 0.62 C13H26
n-Tridecane 0.91 C13H28
Indole 3.16 C8H7N
5,5-dimethylhydantoin 1.01 C5H8N2O2
(3z)-3-hexadecene 0.42 C16H32
n-Tetradecane 0.91 C14H30
β-Methylindole 1.06 C9H9N
5-ethyl-5-methylhydantoin 0.51 C6H10N2O2

28
Compound Area % Formula
(Z)-2-decenal 0.24 C10H18O
5-Isopropyl-2,4-imidazolidinedione 1.17 C6H10N2O2
Pentadecane 1.6 C15H32
1-heptadecene 0.79 C17H34
Heptadecane 1.4 C17H36
(8e)-8-heptadecene 0.69 C17H34
9-octadecene, (e)- 0.77 C18H36
Nonadecane 1.43 C19H40
n-Octadecane 1.03 C18H38
Tricosane 0.69 C23H48
Hexadecanenitrile 2.92 C16H31N
Methyl palmitate 0.8 C17H34O2
3-Isobutylhexahydropyrrolo[1,2-a]pyrazine-1,4-dione 0.89 C11H18N2O2
Octadecane 0.6 C18H38
(Z)6,(Z)9-Pentadecadien-1-ol 0.66 C15H28O
Oleanitrile 9.24 C18H33N
Methyl elaidate 2.83 C19H36O2
Cetyl cyanide, N-HEPTADECANONITRILE 2.48 C17H33N
Methyl stearate 0.17 C19H38O2
Bicyclo[4.1.0]hept-3-ene, 7,7-dimethyl-3-vinyl- 0.27 C11H16
Palmitamide 4.7 C16H33NO
n-Octadecane 0.33 C18H38
n-Methyldodecanamide 1.38 C13H27NO
Cyclopentane, 1,1'-[4-(3-cyclopentylpropyl)-1,7-heptanediyl]bis- 0.2 C25H46
n,n-Dimethyldodecanamide 0.16 C14H29NO
(Z)-9-tetradecenal 0.31 C14H26O
n-Pentadecane 0.4 C15H32
Nonadecanenitrile 0.54 C19H37N
Oleic acid amide 14.9 C18H35NO
Stearic acid amide 1.86 C18H37NO
n-Methyloctadecanamide 3.21 C19H39NO
Nonadecanenitrile 1.14 C19H37N
Erucylamide 0.19 C22H43NO
Lauramide 0.43 C12H25NO
Eicosanenitrile 0.99 C20H39N
1-[(9E)-9-Octadecenoyl]pyrrolidine 0.6 C22H41NO
Myristamide 0.74 C14H29NO
4.alpha.,5-cyclo-a-homo-5.alpha.-cholestan-6-one 0.52 C28H46O
Stigmast-5-en-3-ol, oleat 0.79 C47H82O2

29
In chemical composition analysis, it has been observed that although the bio-oil contains
around 70 compounds, it mainly consisted of 14.9% Oleic acid amide, 9.24% Oleanitrile, 4.75%
p-Cresol, 4.7% Palmitamide, 3.21% N-Methyloctadecanamide and 3.16% Indole accounting for
around 40% of total mass. As it can be observed the bio-oil contains compounds with carbon
chain length in the range of C4-C28 which is similar to most of fuels used.

30
KINETIC STUDY
31
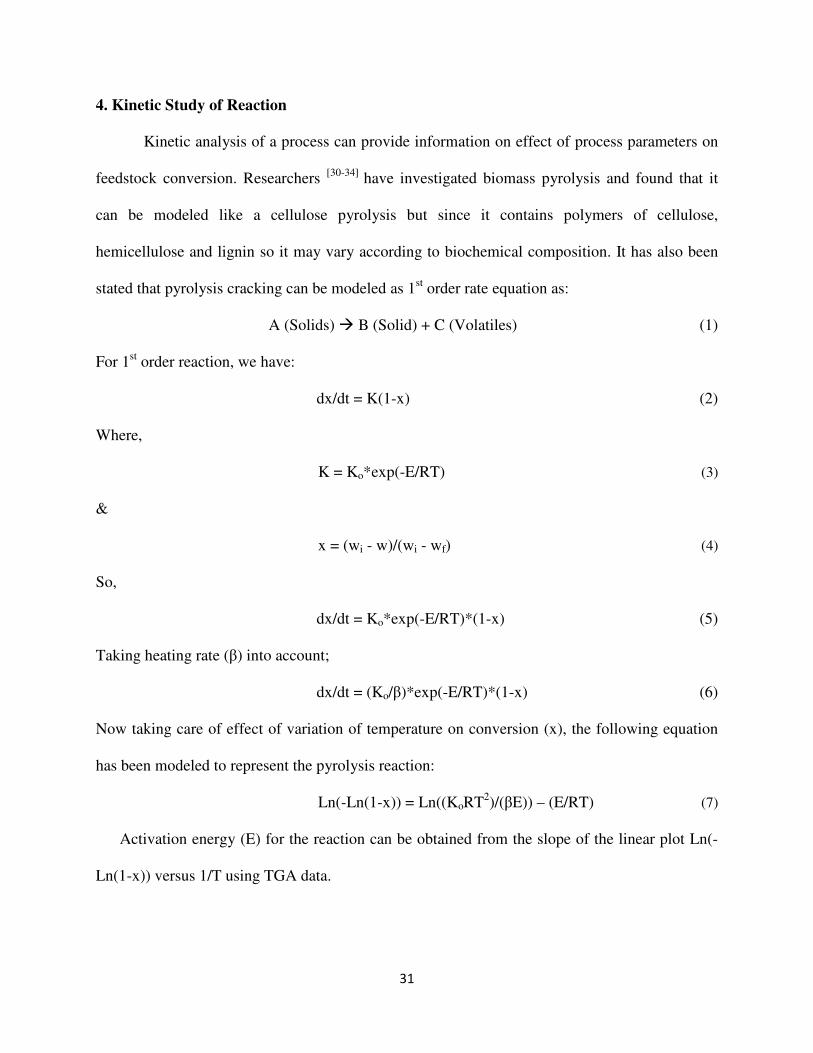
4. Kinetic Study of Reaction
Kinetic analysis of a process can provide information on effect of process parameters on
feedstock conversion. Researchers [30-34] have investigated biomass pyrolysis and found that it
can be modeled like a cellulose pyrolysis but since it contains polymers of cellulose,
hemicellulose and lignin so it may vary according to biochemical composition. It has also been
stated that pyrolysis cracking can be modeled as 1st order rate equation as:
A (Solids) � B (Solid) + C (Volatiles) (1)
For 1st order reaction, we have:
dx/dt = K(1-x) (2)
Where,
K = Ko*exp(-E/RT) (3)
&
x = (wi - w)/(wi - wf) (4)
So,
dx/dt = Ko*exp(-E/RT)*(1-x) (5)
Taking heating rate (β) into account;
dx/dt = (Ko/β)*exp(-E/RT)*(1-x) (6)
Now taking care of effect of variation of temperature on conversion (x), the following equation
has been modeled to represent the pyrolysis reaction:
Ln(-Ln(1-x)) = Ln((KoRT2)/(βE)) – (E/RT) (7)
Activation energy (E) for the reaction can be obtained from the slope of the linear plot Ln(-
Ln(1-x)) versus 1/T using TGA data.

32
Figure 11: Kinetic Analysis Plot for Determination of Activation Energy
Table 8: Activation Energy for Pyrolysis of Groundnut Cake
Sample
Activation Energy (KJ/Mol)
1st Phase 2nd Phase 3rd Phase
N2 25oC/min 45.12 4.55 11.58
Air25oC /min 16.67 3.01 8.36 Air20oC /min 15.01 2.73 7.83
The reason behind kinetic study of pyrolysis reaction is to determine activation energy
for the reaction which implicates the ease of occurrence of reaction. Reactions having less
activation energy take place much easily than reaction with high activation energy. A research[32]
has shown that pyrolysis of HDPE (High Density Polyethylene) have high activation energy as
compared to that of pyrolysis of Jatropha (JC) and Karanja (KP). And when a mixture of HDPE
and Jatropha is pyrolysed in 1:1 ratio, the activation energy for such reaction has decreased a lot.
It means HDPE can be easily pyrolysed with 1:1 blend of Jatropha. Similar observation has been
experienced for pyrolysis of HDPE and Karanja mixture in 1:1 ratio. Thus, biomass feed stocks
1/T
Ln
(-L
n(1
-x))

33
having less activation energy for its pyrolysis reaction can be used as a blend to pyrolysis
biomass feed stocks with higher activation energy. Activation energy for groundnut pyrolysis is
comparably low and hence can be used as a blend.

34
INDUSTRIAL
SCALE-UP
&
ECONOMIC
ASSESSMENT

35
5. Industrial Scale-Up and Economic Assessment
5.1. Aim
Designa unit producing Groundnut Pyrolytic Oil by thermal pyrolysis of Groundnut De-
Oiled Cake.
5.2. Raw Material
Groundnut De-Oiled Cake
5.3. Products
1. Groundnut Pyrolytic Oil � Used as Bio-Fuel
2. Fuel Gas � Non-Condensable Vapours having high calorific value.
3. Char � Source of Activated Carbon. Also used as Fuel.
4. Oily Water � Contains various hydrocarbons which can be extracted and sold.
5.4. Process
Figure 12: Process Flow Diagram for Pyrolysis Unit

36
5.5. Material Balance (1Kg Basis)
1 Kg Groundnut De-Oiled Cake � 0.3216 Kg Char
� 0.1686 Kg Non-Condensable Vapors (Fuel Gas)
� 0.2209 Kg Bio-Fuel
� 0.2889 Kg Oily Water
Let us design the unit to process 12 tons of groundnut de-oiled cake in a single run.
So, 12 tons Groundnut De-oiled Cake �3859.2 Kg Char
�2023.2 Kg Fuel Gas
�2650.8 Kg Bio-Fuel
�3466.8 Kg Oily Water
5.6. Energy Balance
5.6.1. Energy Balance for Reactor
Pyrolysis of biomass is a very complex process as a lot of reaction takes place
simultaneously making it very difficult to optimize energy in a detailed manner. Thus, for the
sake of convenience, overall energy required for pyrolysis of different amount of groundnut de-
oiled cake was obtained by connecting an energy meter across the furnace. A linear relation was
found out from the plot of Mass vs. Energy Consumed.

37
y = 3.6x + 2376
2500
2540
2580
2620
2660
2700
0 20 40 60 80 100
En
erg
y C
on
sum
ed
(K
J)
Mass (gms)
Q (KJ)
Table 9: Energy-Mass Analysis
mass (gms) Q (KJ)
40 2520
50 2556
60 2592
70 2628
80 2664
90 2700
Now using the linear relation, a rough estimation of energy required for pyrolysis of 12
tons of de-oiled cake was found out to be 43,000MJ. This energy is the amount of overall energy
consumed by the process, i.e. energy to raise temperature of de-oiled cake from 60°C to 450°C
along with energy consumed for pyrolysis reaction, whereas in industry the case will be
different. Although the process is a semi-batch process but the furnace won’t be allowed to cool
down to room temperature after every run as it will cost a lot of energy loss. So, energy
consumed is expected to be less than 43,000MJ. Since it is a rough estimation, so calculation are
done with 43,000MJ only.
5.6.2. Energy Balance for Condenser
The vapors coming out of reactor is expected to be at around 400°C as the operating
temperature is 450°C.
Now,
������� �� ��� ���� � ����� ���� � ��������� � ����� ������ (8)
So, input for condenser = 8140.8 Kg Vapors
Figure 13: Mass-Energy Consumption Plot

38
In this, there are 2023.2 Kg of Non-condensable Vapors (termed as Fuel Gas) and 6117.6 Kg
condensable liquid product in which 2650.8 Kg Bio-Fuel and 3466.8 Kg Oily Water. Here also a
very rough estimation has to be done in order to determine energy recovered while condensing.
Here, the process is condensation of mixture of hydrocarbon vapors. In order to evaluate the
energy recovered during condensation and design the condenser mole fraction of each
component of hydrocarbon vapor mixture is required with their specific heat capacity, thermal
conductivity, viscosity, heat of vaporization, etc. which are not available. So, in this estimation,
the hydrocarbon vapor mixture is considered as a single component hydrocarbon vapor with
specific heat of vapor as 0.5 KJ/Kg K since it varies in the range of 0.5-3 KJ/Kg K for
hydrocarbon vapors at constant pressure. Properties of oily water is also unknown and thus taken
same as water, i.e. specific heat = 4.186 KJ/Kg K; latent heat of vaporization = 2300KJ/Kg at
100°C.
Specific heat of liquids can be obtained using Kopp’s rule from its chemical composition,
i.e. C, H, N, S and O composition. As the data is not furnished due to unavailability of
equipment so average values for C, H, N, S and O composition is taken from the literature as the
properties of our bio-fuel lies considerably in the range of other similar products.
Thus,
C = 68; H = 8.7; N = 2.3; S = 0.085; O = 20.915
From Kopp’s Rule, Specific Heat = 2.61 KJ/Kg K.

39
Now, distillation range for bio-fuel is,
Table 10: Distillation Range for Bio-Oil
Initial boiling Point (oC) 90
10% Recovery (oC) 98
30% Recovery (oC) 250
50% Recovery (oC) 312
70% Recovery (oC) 342
90% Recovery (oC) 358
Final Boiling Point (oC) 362
Now,
������ ������ �� ����� � � ������� !� ���� ���� � ������� !� ���� ������ � ������� !� ������� (9)
Energy by fuel gas = 2023.2*0.5*(400-40) = 3,65,796 KJ = 365.796 MJ
Energy by Oily water = 3466.8*0.5*(400-100) + 3466.8*2300 + 3466.8*4.186*(100-40)
= 5,20,020 + 79,73,640 + 8,70,721.5 = 93,64,381.5 KJ = 9364.38 MJ
Energy by Bio-Fuel = (2650.8*0.5*(400-358)) + (265.08*2.61*(358-342)) + (2385.72*0.5*(358-
342)) + (795.24*2.61*(342-312)) + (1855.56*0.5*(342-312)) + (1325.4*2.61*(312-250)) +
(1325.4*0.5*(312-250)) + (1855.56*2.61*(250-98)) + (795.24*0.5*(250-98))
+(2385.72*2.61*(98-90)) + (265.08*0.5*(98-90)) + (2650.8*2.61*(90-40))
= 55666.8 + 11069.75 + 19085.76 + 62267.3 + 27833.4 + 214476.23 +
41087.4 + 736137.76 + 60438.24 + 49813.83 + 1060.32 + 345929.4
= 19,94,653.2 KJ = 1994 MJ
Total Energy Recovered = (365.8 + 9364.38 + 1994) MJ = 11724.18 MJ
Amount of cooling water@30°C required = 11724180/(4.186*40) = 70020 Kg = 70 tons

40
5.7. Equipment Size
5.7.1. Reactor
Cylindrical shape reactor made of carbon steel operating at 14.7 psi.
The reactor is assumed to work in a similar way to coke ovens used for coking of coal with a
capacity of 12 tons processed at single run with a residence time of 20 hours.
Total Energy required for one run = 43,000 MJ = 40.76 M Btu
Time between two consecutive runs for discharging and loading = 1 hour
Total time for one run = 21 hours
Total no of runs per year = (365*24)/21 = 417 runs
Energy required per hour, Q = (40.76)/20 = 2.038 M Btu/hr
5.7.2. Crusher
Total raw material to be crushed per year = 417*12 = 5004 tons
Required crusher capacity = 5004/(365*24) = 0.571 tons/hr.
A crusher of capacity 1 ton/hr is used and operated at 0.571 tons/hr.
5.7.3. Condenser
1-4 Shell and tube exchanger with 21.25 inch shell inner diameter with a baffle spacing
of 5 inch and 158 no of 16 inch long 13 BWG tubes with an outer diameter of 1 inch and a
square pitch of 1.25 inch. Combineddirt factor of 0.003 should be provided.
Flow rate of vapors = (8140.8)/21 = 387.66 Kg/hr
Flow rate of cooling water = 70000/21 = 3333.33 Kg/hr
Inlet temperature of vapors = 400°C
Outlet temperature of vapors = 80°C
Inlet temperature of cooling water = 30°C

41
Outlet temperature of cooling water = 70°C
LMTD = 148.38°C R = 320/40 = 8 S = 40/(400-30) = 0.108 FT = 0.88
∆t = 0.88*148.38 = 130.57°C
Shell Side (Cooling water):
Flow area = (21.25*0.25*5)/(144*1.25) = 0.1475 ft2 = 137.03 cm2 = 0.014 m2
Mass Velocity =(3333.33)/(0.014) =2,38,095Kg/hrm2 =66.1375Kg/m2s = 5650080lb/hrft2
Equivalent diameter = 0.99/12 = 0.0825 ft = 0.025 m
Viscosity of water = 0.547*10-3 N s/m2
Thermal conductivity of water = 0.6 W/m K
Reynolds number = (0.025*66.1375)/(0.547*10-3) = 3022.74
jH = 29
ho = 29*(0.6/0.025)*((4186*0.547*10-3)/0.6)(1/3) = 1087.65 W/m2 K
Tube Side (Hot fluid):
Flow area = (158*0.515)/(144*4) = 0.141 ft2 = 0.0131 m2
Mass velocity = 387.66/(0.0131) = 29592.37 Kg/hr m2 = 8.22 Kg/m2 s = 702237.6lb/hrft2
Viscosity of hydrocarbon vapor @240°C = 1.9*10-5 Kg/m s
Thermal conductivity of hydrocarbon vapor = 0.1385 W/m K
Reynolds number = (0.021*8.22)/(1.9*10-5) = 9085.26
L/D = 16/0.0675 = 237
jH = 35
hi = 35*(0.1385/0.021)*((500*1.9*10-5)/(0.1385))(1/3) = 94.5 W/m2 K
hio = 94.5*0.81 = 76.545 W/m2 K
Clean overall coefficient, UC = (76.545*1087.65)/(76.545+1087.65) = 71.53 W/m2 K
42
Overall design coefficient:
Total Surface Area = 158*16*0.2618 = 662 ft2 = 61.5 m2
UD = ((11724.18*106)/(21*3600))/(61.5*130.57) = 55.02 W/m2 K
Dirt Factor = (UC - UD)/(UC*UD) = (71.53-55.02)/(71.53*55.02) = 0.0042 m2 K/W
5.7.4. Decanter
Input flow rate = 291.31 Kg/hr
Residence time = 18 Hrs
Volume of tank = 18*291.31 =5243.58Kg liquid product = (2272.04/1021.9) + (2971.54/1050)
= 2.223 + 2.83 = 5.053 m3 = 1334.86 gal
Volume of tank taken = 1300 gallons
5.8. Cost Analysis
Cost analysis provides a rough estimate of the total investment required to setup a plant
of particular capacity, operating cost of the plant and production cost of the product. Cost
analysis data will enable us to determine whether setting up such a plant is economically feasible
and beneficial to society or not.
Total investment consists of two parts:
• Fixed Capital: - Total cost of plant ready for start-up.
• Working Capital: - Additional investment needed, over and above the fixed capital, to
start the plant and operate it to the point when income is earned.
5.8.1. Factorial Method to Determine Total Investment:
"# � $ % "& (11)
Where,
Cf = Fixed Capital Cost
fl = Lang Factor depending on type of process
Ce = Total delivered cost of all major equipment.
43
Basic Procedure:
• Prepare material & energy balance, preliminary flow sheets, size major equipment and
select material of construction.
• Estimate purchase cost of major equipment using literatures.
• Calculate Fixed Capital using Table 10.
• Working Capital = 10-20% of Fixed Capital.
• Total Investment = Fixed Capital + Working Capital.
Table 11: Lang Factors for Estimation of Fixed Capital[35]
Sl. No. Item
Process Type
Fluids Fluids-Solids Solids
1 Major Equipment Purchase Cost (PCE) 1 1 1
f1 Equipment Erection 0.4 0.45 0.5
f2 Piping 0.7 0.45 0.2
f3 Instrumentation 0.2 0.15 0.1
f4 Electrical 0.1 0.1 0.1
f5 Buildings, Process 0.15 0.1 0.05
f6 Utilities 0.5 0.45 0.25
f7 Storage 0.15 0.2 0.25
f8 Site Development 0.05 0.05 0.05
f9 Ancillary Buildings 0.15 0.2 0.3
Total Physical Plant Cost (PPC) = PCE* 3.4 3.15 2.8
Total Physical Plant Cost (PPC) 1 1 1
f10 Design & Engineering 0.3 0.25 0.2
f11 Contractor's Fee 0.05 0.05 0.05
f12 Contingency 0.1 0.1 0.1
Fixed Capital = PPC* 1.45 1.4 1.35
44
5.8.1.1. Major Equipment Costs
Reactor
Cost of cylindrical reactor made of carbon steel operating at 14.7 psi with an energy intake
capacity of 2.038 MBtu/hr = 45,718$ (1985 basis, PCI = 325).
Cost of reactor @2010 (PCI = 586) = (586/325)*45718 = 82,433$
Crusher
Cost of Crusher of capacity 1tons/hr @1985 = 22,600$; Cost of crusher @2010 = 40,748$
Condenser
A 1-4 fixed head shell and tube heat exchanger made of stainless steel with heating
surface area of 662 sqft and operating at pressure range of 1000 psi is required.
Cost of exchanger @1985 = 43,515$; Cost of exchanger @2010 = 78,461$
Storage Tanks
Cost of Storage Tank 1 (acting as Decanter) of volume 1300 gallons @1985 = 29,431$
Cost of Storage Tank 1 @2010 = 53,066$
Cost of Storage Tank 2 of capacity 10,000 gallons for storing bio-fuel @1985 = 58,160$
Cost of Storage Tank 2 @2010 = 1,04,867$
Cost of Storage Tank 3 of capacity 15,000 gallons for storing bio-fuel @1985 = 62,522$
Cost of Storage Tank 3 @2010 = 1,12,732$
Thus major equipment purchase cost = reactor + crusher + condenser + 3 storage tanks
= 4,72,307$ = Rs. 2,11,43,856
5.8.1.2.Total Investment
Major Equipment Purchase Cost (PCE) = Rs 2,11,43,856
Total Physical Plant Cost (PPC) = 1.95*PCE= Rs 4,12,30,519
45
Fixed Cost = 1.35*PPC = Rs 5,56,61,201
Working Capital = 0.10*Fixed Cost = Rs 55,66,120
Total Investment = Fixed Capital + Working Capital = Rs 6,12,27,321
5.8.2. Operating Cost
It is the cost of producing the product and is needed to judge viability of project and to
choose between alternate processes.
Annual Production Cost = A + B + C (From Table 7) (12)
Production Cost �per Kg� �67789$ :;<=8>?@<7 A<B?
67789$ :;<=8>?@<7 C9?& (13)
Table 12: Operating Cost[35]
Sl. No. Item Typical Values
Variable Costs
1 Raw Materials From Material Balance 2 Miscellaneous Materials 10% of item (5)
3 Utilities From Flow Sheet 4 Shipping & Packaging Usually Negligible
Sub Total A = 1+2+3+4
Fixed Costs
5 Maintenance 5-10% of Fixed Capital 6 Operating Labors From Manning Estimates 7 Laboratory Costs 20-23% of item (6)
8 Supervision 20% of item (6) 9 Plant Overheads 50% of item (6) 10 Capital Charges 10% of Fixed Capital 11 Insurance 1% of Fixed Capital
12 Local Taxes 2% of Fixed Capital 13 Royalties 1% of Fixed Capital
Sub Total B = 5+6+7+8+9+10+11+12+13 Direct Production Costs = A+B
14 Sales Expense
C = 20-30% of Direct Production Cost
15 General Overheads 16 R & D

46
Raw Materials
Cost of Raw Materials = 417*12*14000 = Rs 7,00,56,000
Miscellaneous Materials
Cost of Miscellaneous Materials = 0.10*0.05*5,56,61,201= Rs 2,78,306
Utilities
Chilled Water @30°C = ((417*70*1)/100)*(586/444) = 3082$ = Rs 17,247
Electricity = {1.5*1.32*{(417*43000000) + (14400*24*365) – (11724180*417)}}/100
= (1.5*1.32*13168161)/100 = 260730$ = Rs 1,16,72,149
Cost of Utilities = Rs 1,16,89,396
Maintainance
Cost of Maintanance = 0.05*5,56,61,201= Rs 27,83,060
Operating Labours
Cost of Operating Labour = 20*5*500*365 = Rs 1,82,50,000
Laboratory Costs
Laboratory Costs = 0.2*1,82,50,000= Rs 36,50,000
Supervision
Supervision Cost = 0.2*1,82,50,000= Rs 36,50,000
Plant Overheads
Plant Overheads = 0.5*1,82,50,000= Rs 91,25,000
Capital Charges
Capital Charges = 0.1*5,56,61,201= Rs 55,66,120
Insurance
Insurance = 0.01*5,56,61,201= Rs 5,56,612
47
Local Taxes
Local Taxes = 0.02*5,56,61,201= Rs 11,13,224
Royalties
Royalties = 0.01*5,56,61,201= Rs 5,56,612
Direct Production Costs = Rs 12,72,74,330
Sales Expense + General Overheads + R & D = 0.2*12,72,74,330= Rs 2,54,54,866
Annual Production Cost = 12,72,74,330+ 2,54,54,866= Rs 15,27,29,196
Income from sales of Bio-Fuel = 417*2594*50 = Rs 5,40,84,900
Income from sales of Oily Water = 417*3302*40 = Rs 5,50,77,360
Income from sales of Fuel Gas = 417*2023.2*4.4767*1.32 = Rs 49,85,478
Income from sales of Charcoal = 417*3859.2*3*1.623 = Rs 78,35,616
Total Income from Sales = Rs 12,19,83,354
Net Loss = Rs 3,07,45,842

48
CONCLUSION
49
6. Conclusion
• Groundnut de-oiled cakes are available in plenty and can be a good source of biomass.
• Maximum yield of bio-oil is obtained by pyrolysis of groundnut de-oiled cake at 450°C.
• Groundnut de-oiled cake has high volatile matter content which is converted and collected as
bio-oil.
• The bio-oil obtained shows comparable fuel properties and can be treated as moderate grade
commercial fuels.
• In order to utilize it as commercial transportation fuel certain enhancement in properties like
density, viscosity, corrosiveness and volatility have to be taken care off.
• The bio-oil contains nearly 70 chemical compounds of varying carbon chain length from C4-
C27 and functional groups such as alkanes, alkenes, alkynes, alcohols, ketones, aldehydes,
aromatics rings, amides, nitriles and nitro compounds.
• Charcoal obtained has a good calorific value, thus can be used as fuel but it can’t be used as
adsorbent as its surface area was quite low.
• Activation energy of the pyrolysis of groundnut de-oiled cake was found out to be in lower
range thus enabling it to be used as a blend for easy pyrolysis of materials with higher
activation energy.
• Industrial scale-up and economic assessment was performed for the process but a lot of
assumptions had to be taken to simplify the calculations and to take care of the insufficient
data. The result of the economic assessment was not satisfactory as it incurred a loss of 30
Million INR annually.
• In order to have proper economic assessment the following things are required to be taken
care off: (a) compositional analysis of mixture of hydrocarbon vapors coming out of reactor

50
before getting condensed; (b) properties like specific heat, thermal conductivity, kinematic
viscosity, latent heat of vaporization, etc. of every of component present in the hydrocarbon
mixture are to be determined; (c) compositional analysis and physical property determination
of oily water is also needed; (d) specific heat of bio-oil is also required.
51
References
1. Tenth Five Year Plan (2002-07). Planning Commission, Government of India, New Delhi,
2002.
2. From ideas to action: clean energy solutions for Asia to address climate change (India
Country Report). International Resources Group (IRG) prepared this report for United State
Agency for International Development (USAID) under the ECO-Asia Clean Development
and Climate Program, June 2007.
3. India Energy Data, Statistics and Analysis – Oil, Gas, Electricity, Coal.Last Updated on
August 2010 available at www.eia.doe.gov
4. 2011 India Energy Handbook. PSI Media Inc. August 2010.
5. KPMG(2006). IndiaEnergyOutlook. London:KPMG.
6. National Energy Map for India: Technology Vision 2030. TERI Press. The Energy and
Resources Institute, Office of the Principal Scientific Adviser, Government of India, New
Delhi.
7. Annual Report 2010-11, Ministry of New and Renewable Energy, Government of India.
8. Huber, G.W., Iborra, S., Corma, A. Synthesis of Transportation Fuels from Biomass:
Chemistry, Catalysts, and Engineering. Chem. Rev., 106, (2006), 4044-4098.
9. Zinoviev, S., Arumugam, S., Miertus, S., Müller-Langer, F., Kaltschmitt, M., Vogel, A.,
Thraen, D., Fornasiero, P. Background Paper on Biofuel Production Technologies. The
International Centre of Science and High Technology of the United Nations Industrial
Development Organization (ICS-UNIDO), November 2007.
10. Adler, P.R.; Boateng, A.A.; Jung, H.G. Pyrolysis of energy crops including alfalfa stems,
reed canarygrass, and eastern gamagrass. Fuel, 85, (2006), 2450–2457.

52
11. Angın, D.; Şensöz, S. Pyrolysis of safflower (Charthamus tinctorius L.) seed press cake in a
fixed-bed reactor: Part 1. The effects of pyrolysis parameters on the product yields.
Bioresource Technology, 99, (2008), 5492–5497.
12. Angın, D.; Şensöz, S. Pyrolysis of safflower (Charthamus tinctorius L.) seed press cake in a
fixed-bed reactor: Part 2. Structural characterization of pyrolysis bio-oils. Bioresource
Technology, 99, (2008), 5498–5504.
13. Apaydin, E.; Pütün, A.E.; Pütün, E.; Uzun, B.B. Bio-oil from olive oil industry wastes:
Pyrolysis of olive residue under different conditions. Fuel Processing Technology, 87,
(2005), 25–32.
14. Beis, S.H.; Koçkar, Ö.M.; Onay, Ö. Fixed-bed pyrolysis of safflower seed: influence of
pyrolysis parameters on product yields and Compositions. Renewable Energy, 26, (2002),
21–32.
15. Boateng, A.A.; Goldberg, N.M.; Mullen, C.A. Producing Stable Pyrolysis Liquids from the
Oil-Seed Presscakes of Mustard Family Plants: Pennycress (Thlaspi arvense L.) and
Camelina (Camelina sativa). Energy Fuels, 24, (2010), 6624–6632.
16. Chang, Y.M.; Lee, M.K.; Tsai, W.T. Fast pyrolysis of rice husk: Product yields and
compositions. Bioresource Technology, 98, (2007), 22–28.
17. Duman, G.; Okutucu, C.; Stahl, R.; Ucar, S.; Yanik, J. The slow and fast pyrolysis of cherry
seed. Bioresource Technology, 102, (2011), 1869–1878.
18. Karaosmanoğlu, F.; Özçimen, D. Production and characterization of bio-oil and biochar
from rapeseed cake. Renewable Energy, 29, (2004), 779–787.
19. Koçkar, Ö.M.; Onay, Ö. Fixed-bed pyrolysis of rapeseed (Brassica napus L.). Biomass and
Bioenergy, 26, (2004), 289–299.

53
20. Koçkar, Ö.M.; Onay, Ö. Slow, fast and flash pyrolysis of rapeseed. Renewable Energy, 28,
(2003), 2417–2433.
21. Koçkar, Ö.M.; Şensöz, S.; Yorgun, S. Characterization of the pyrolysis oil produced in the
slow pyrolysis of sunflower-extracted bagasse. Biomass and Bioenergy, 20, (2001), 141-148.
22. Onay, O. Influence of pyrolysis temperature and heating rate on the production of bio-oil
and char from safflower seed by pyrolysis, using a well-swept fixed-bed reactor. Fuel
Processing Technology, 88, (2007), 523–531.
23. Özbay, N.; Pütün, A.E.; Pütün, E.; Uzun, B.B. Biocrude from biomass: pyrolysis of
cottonseed cake. Renewable Energy, 24, (2001), 615-625.
24. Özbay, N.; Pütün, A.E.; Uzun, B.B.; Varol, E.A. Characterization of bio-oil obtained from
fruit pulp pyrolysis. Energy, 33, (2008), 1233–1240.
25. Ayan, E.A., Demiral, I. Pyrolysis of grape bagasse: Effect of pyrolysis conditions on the
product yields and characterization of the liquid product. Bioresource Technology, 102,
(2011), 3946-3951.
26. www.iopepc.org last assessed on May 02, 2011.
27. ASTM D3172 - 07a - Standard Practice for Proximate Analysis of Coal and Coke.
28. Tuttle, J., Kuegelgen, T.V. Biodiesel Handling and Use Guidelines. Third Edition, National
Renewable Energy Laboratory, 2004.
29. Petroleum Product Surveys, Motor Gasoline, Summer 1986, Winter 1986/1987, National
Institute for Petroleum and Energy Research.
30. Ahmaruzzaman, M., Sharma, D. K. Co-processing of petroleum vacuum residue with
plastics, coal and biomass and its synergistic effect. Energy & Fuels, 21, 2007, 891–897.

54
31. Hirata, T. Changes in degree of polymerization and weight of cellulose untreated and treated
with inorganic salts during pyrolysis.Bulletin of the Forestry and Forest Products Research
Institute, 304, 1979, 77-124.
32. Parekh, D.B.; Parikh, P.A.; Rotliwala, Y.C. Synergetic pyrolysis of high density polyethylene
and Jatropha and Karanj cakes: A thermogravimetric study. Journal of Renewable and
Sustainable Energy, 1, 033107, (2009).
33. Parikh, P.A.; Rotliwala, Y.C. Thermal degradation of rice-bran with high density
polyethylene: A kinetic study. Korean Journal of Chemical Engineering, (2010).
34. Ramiah, M.V. Thermogravimetric and differential thermal analysis of cellulose,
hemicellulose, and lignin.Journal of Applied Polymer Science, 14, (1970), 1323.
35. Sinnott, R.K.,Chemical Engineering Design. Coulson & Richardson’s Chemical Engineering,
Volume 6, Fourth edition, 2005, Elsevier, Massachusetts.
36. Kanury,A.M., Blackshear,P.L. Some Considerations Pertaining to the Problem of Wood-
Burning. Combustion Sci Technol, 1, (1970),339.

55
Paper Published:
1. Ankit Agrawalla, Sachin Kumar and R. K. Singh, “Pyrolysis of groundnut de-oiled cake
and characterization of the liquid product” communicated to Bioresource Technology,
Elsevier Publication.