Embed Size (px)
Citation preview
DEPARTMENT OF DEFENSE FISCAL YEAR 2002 ANNUAL ENERGY MANAGEMENT REPORT
Executive Summary of Energy Efficiency Progress
The Department of Defense (DoD) is on track to meet the goals of the Energy Policy Act and Executive Order (EO) 13123, as demonstrated by our achievement of a 25.4 percent decrease in standard building and facility energy consumption on a British Thermal Units (Btu) per gross square foot (GSF) basis compared to the FY 1985 baseline. In Fiscal Year (FY) 2002, DoD consumed 206.3 trillion Btu (TBtu) in its buildings and facilities. This is a 3.1 percent reduction in consumption per gross square foot from the previous year.
In FY 2002, DoD’s industrial and laboratory facilities consumed 28.5 TBtu. These
energy intensive facilities have reduced consumption per gross square foot by 21.7 percent since the FY 1990 baseline year. This is a 1.7 percent reduction in consumption per gross square foot from FY 2001. DoD has already reached the FY 2005 goal of EO 13123 and is well on track for meeting the FY 2010 goal of a 25 percent reduction.
The DoD Energy Program initiatives include facility equipment retrofits (particularly
using private capital), energy awareness efforts, energy manager training, audit programs, procuring energy efficient products and the use of sustainable design in new construction. Other contributing factors include integrated energy planning, source energy considerations when fuel switching, taking maximum advantage of electrical market transformation, enhanced use of renewable energy and demonstration of innovative technologies.
DoD leads the Federal Government with approximately 2.2 billion square feet of
facilities. The annual energy bill for military installations exceeds $2.6 billion. Additionally, DoD purchased $4.4 billion worth of mobility fuels in FY 2002 —mostly diesel and jet fuel. Although significant progress has been made in reducing overall energy consumption, electricity use continues to increase because of a growth in electronic equipment, air conditioning and automation requirements.
The Department has made significant progress in installing renewable energy
technologies and purchasing electricity generated from renewable sources (solar, wind, geothermal, and biomass) when life-cycle cost-effective. The total renewable energy usage, both in generation and purchases, was 4 trillion Btus in FY 2002, almost doubling the FY 2001 application. The Department continues to emphasize the use of passive solar designs, such as building orientation and window placement and sizing in a variety of building types and new facility construction
Page 1
I Management and Administration
Energy management at DoD installations is focused on improving efficiency, reducing demand, eliminating waste, and enhancing the quality of life while meeting mission requirements. Accomplishing these objectives will reduce costs and ensure that the program goals are achieved.
The facilities energy program is decentralized, with Defense Component headquarters providing guidance and funding, and installations managing site-specific energy and water conservation programs. Energy project funding comes from a combination of government and alternative financing initiatives. Military installations are responsible for maintaining awareness, developing and implementing projects, and ensuring that new construction meets sustainable design criteria.
A. Energy Management Infrastructure
1. Senior Agency Official
The Principal Deputy Under Secretary of Defense (Acquisition, Technology and Logistics) is the DoD Senior Agency Official responsible for meeting the goals of EO 13123.
2. Agency Energy Team
The existing DoD Installations Policy Board, chaired by the Deputy Under Secretary of Defense (Installations & Environment) and chartered to address a broad spectrum of installation issues, has been designated as the DoD Agency Energy Team. The membership of the IPB contains the cross-section of DoD senior leadership necessary to make decisions needed to remove obstacles hindering compliance with the EO 13123.
B. Management Tools
1. Awards (Employee Incentive Programs)
Energy conservation awards are presented to individuals, organizations, and installations in recognition of their energy-savings efforts. In addition to recognition, these awards provide the motivation for continued energy-reduction achievements. In October 2002, the Department of the Navy (DoN) held its annual Secretary of the Navy awards ceremony in Washington, DC. The Under Secretary of the Navy presented eight awards to Navy and Marine Corps winners in the categories of facilities, ships, and air squadrons. Naval installations with an aggressive and successful program achieving a Platinum (highest) or Gold (second highest) level rating on their energy program were also recognized during the ceremony. In July 2002, Active Army, U.S. Army Reserve, and Army National Guard commands were presented with Secretary of the Army’s Energy and Water Management Awards for FY 2001 accomplishments in energy management. Air Force Major Commands have annual energy award programs that distribute funds to their base winners. The Services also participate in the Department of
Page 2
Energy (DoE) Federal Energy and Water Management Awards Program. For FY 2002, DoD received thirty-one of the fifty-four awards [Army (13), DoN (12), and Air Force (6)]. In addition to DoE and Service energy award programs, the White House recognized the Department with three of the five Presidential Awards for Leadership in Federal Energy Management. The Army National Cancer Institute/Garrison at Fort Detrick was presented the “Award for Results” for energy savings results exceeding $60 million under their Partnership for Energy Performance program. The results include annual savings of 19 million kilowatt-hours of electricity, more than 163 million pounds of steam, 17 million gallons of water, 6,000 gallons of No. 2 oil, 40 billion British thermal units of natural gas and 165,000 gallons of No. 6 oil. The award for “Outstanding Energy Management” was presented to the Navy Shipboard Energy Conservation Team for its efforts to deliver substantial cost and pollution avoidance, and more available fuel for increased steaming hours and ship endurance range. FY 2001 energy cost savings exceeded $41 million and provided an additional 38,000 steaming hours. The Pentagon Renovation Office (PenRen) received the “Outreach Award” for its projects that are Federal showcases for sustainable design, environmental protection, energy conservation, and transportation alternatives. PenRen worked closely with the U.S. Green Buildings Council (USGBC) to achieve “gold” ratings for Leadership in Energy and Environmental Design (LEED) for each of its new construction projects.
Additionally, the Defense Commissary Agency (DeCA), the National Imagery and Mapping Agency (NIMA), Washington Headquarters Service (WHS), and the National Security Agency (NSA) incorporate on-the-spot awards and incentive awards to recognize exceptional performance and participation in the energy management program.
2. Performance Evaluations
Energy and water management provisions are included in performance plans of the DoD Energy Chain of Command, including major command, base and site energy managers. To ensure the inclusion of management provisions, the Army conducts scheduled assistance visits to installations.
3. Training and Education
Awareness and training programs are a critical part of DoD’s efforts to achieve and sustain energy-efficient operations at the installation level. In FY 2002, a total of 2,175 personnel were trained through commercially available or in-house-generated technical courses, seminars, conferences, software, videos, and certifications. The U.S. Army Logistics Integration Agency (USALIA), Naval Civil Engineer Corps Officer School (CECOS), Air Force Institute of Technology (AFIT) Civil Engineering School, Air Force Civil Engineer Support Agency (AFCESA), and DeCA sponsored in-house courses, workshops and seminars. Certified Energy Managers (CEM) training was provided by Association Energy Engineers (AEE) instructors. The Services held installation energy management conferences and DoD personnel attended the Energy 2002 Workshop in Palm Springs, California. DoD was a co-sponsor of Energy 2002 Workshop, along with DOE and GSA, with WHS being an active participant on the planning committees for both Energy 2002 and Energy 2003 (content creation, speaker and vendor recruitment and presentation arrangements). The Components
Page 3
utilized CDs, Internet homepages, newsletters, emails of success stories, satellite downlinks and videos to enhance their energy awareness programs.
DoD has an active program to identify and procure energy-efficient products, specifically through the Defense Logistics Agency (DLA). DLA and GSA product catalogs are widely used, as well as the Construction Criteria Base (available on CD-ROM and the Internet).
4. Showcase Facilities
DoD continues to be a leader in DoE-designated showcase facilities demonstrating new and innovative energy saving technologies. Nine outstanding Federal facilities received the designation of Federal Energy Saver Showcases in 2002.
Arizona Army National Guard EcoBuilding, Phoenix, Arizona–A 5,200 square foot office facility making use of natural daylighting, passive solar design strategies, recycled materials, solar-powered evaporative cooling, rainwater harvesting and collection, and 12 kilowatts of photovoltaic power.
Building 110 at Watervliet Arsenal, Watervliet, New York– Natural gas engine driven air compressors serving the Arsenal’s industrial shop facilities were replaced with conventional electric motor driven units, saving an average of $60,000 per year. Demonstrating the success of this unique and straightforward project, it has been replicated at Picatinny Arsenal.
Cleland Multipurpose Sports Complex, Fort Bragg, North Carolina-The ESPC project completed at this ice rink and sports complex resulted in energy savings exceeding 40 percent each year. The use of high-efficiency metal halide lighting, a new desiccant dehumidification air handling unit, Variable Frequency Drive pumps, a reflective ceiling system, and a new energy management control system saves over one million kilowatt-hours each year.
Parking Complex NAS North Island, California- A 750 kW photovoltaic covered parking area at NAS North Island is the largest federal photovoltaic project to date. The project was made possible by the FY01 Supplemental funding, and a variety of state and local grants and rebates totaling $5.5M. The project generates enough electricity to supply 935 homes, displacing 2,488 barrels of crude oil annually which would have been needed to generate the equivalent amount of power.
Family Housing, MCAS Beaufort, South Carolina- 1,235 ground source heat pumps provide heating and cooling to family housing units. This $11.5M project replaced existing air-to-air heat pumps and water heaters, producing energy savings of 40% for these housing units.
Naval Medical Center, San Diego, California - Features a host of energy-efficient technologies including renewable energy, financed through a utility energy services contract. Energy-efficient lighting, new high-efficiency heating, ventilation, and air conditioning (HVAC) systems, direct digital controls, adjustable speed drives for fans and pumps, solar swimming pool heating, and low-flow plumbing fixtures result in significant annual energy and water savings.
Page 4
Hangars 450, 452, 454, and 456,Columbus AFB, Ohio- Implemented through an Energy Savings Performance Contract (ESPC) covering four aircraft hangars and over 74,000 square feet, energy efficient lighting retrofits and replacement of existing hot air furnaces with energy efficient infrared heaters improves occupant comfort while reducing energy use.
Administration Building, Hill AFB, Utah.- An administration facility incorporating energy efficient improvements to the computer operations facility that includes the replacement of several old, inefficient chillers with newer, high-efficiency units, variable frequency drive (VFD) pumps, and a new direct digital controls (DDC) system. Additionally, a new chemical feed system allows reuse of 50% of the cooling water.
Family Housing, Charleston AFB, South Carolina- 885 conventional air conditioners and gas furnaces in their family housing units were replaced with geothermal heat pumps. The alternatively financed project eliminates the need for natural gas for heating, resulting in demand reductions of 42% and overall energy savings totaling 30%.
Continuing showcase facilities include:
Pentagon Building, Washington D.C.- Designated as the “Energy Showcase Building” for DoD incorporating sustainable design principles and energy and water efficiency objectives. Naval Base Ventura County, California and the U.S. Naval Academy, Maryland continue as on-going DON showcase activities due to the large numbers of Civil Engineer Corps officers and Academy cadets who receive facilities and operations training there. A recent Public Broadcasting System documentary was made to publicize the sustainable development features of the public works showcase facility at Naval Base Ventura County. The facility also won an award from the American Institute of Architects and was featured at a recent Green Building Council symposium.
II. Energy Efficiency Performance
A. Energy Reduction Performance
1. Standard Buildings
The Department reduced energy consumption per gross square foot by 25.4% relative to the FY 1985 baseline of 136,476 Btu/GSF. In FY 2002, after applying renewable energy purchase credits of 1.2 trillion Btu, DoD’s standard building energy consumption was 101,776 Btu/GSF. This energy consumption is 3.1 percent below the 105,034 Btu/GSF in FY 2001, and continues to keeps DoD on track to meet the President’s goal of 35 percent reduction by FY 2010. The Department’s target goal for FY 2002 was a 25.5% reduction relative to the 1985 baseline
2. Industrial and Laboratory Facilities
The industrial, laboratory, research and energy intensive facilities consumption in FY 2002, after applying renewable energy purchase credits of 331 million Btu, was 167,138 Btu/GSF, a 21.7 percent reduction as compared to the 1990 baseline of 213,349 Btu/GSF. This is a 1.7 percent reduction as compared to the FY 2001 energy
Page 5
consumption of 169,945 Btu/GSF. DoD has already surpassed the FY 2005 20 percent reduction goal of EO 13123 and has achieved 87 percent of FY 2010 goal.
Because the relationship between energy consumption and production is generally non-linear, making it difficult to establish a consistent baseline with which to compare progress, DoD has decided to use energy usage per gross square foot as the performance measure for the industrial and laboratory facility category. Additionally, to simplify data collection, and the associated metering and reporting costs, DoD considers an entire base an industrial facility if 60 percent or more of the base-wide energy use is for industrial purposes. A list of industrial bases is provided in part IV, D.
3. Exempt Facilities
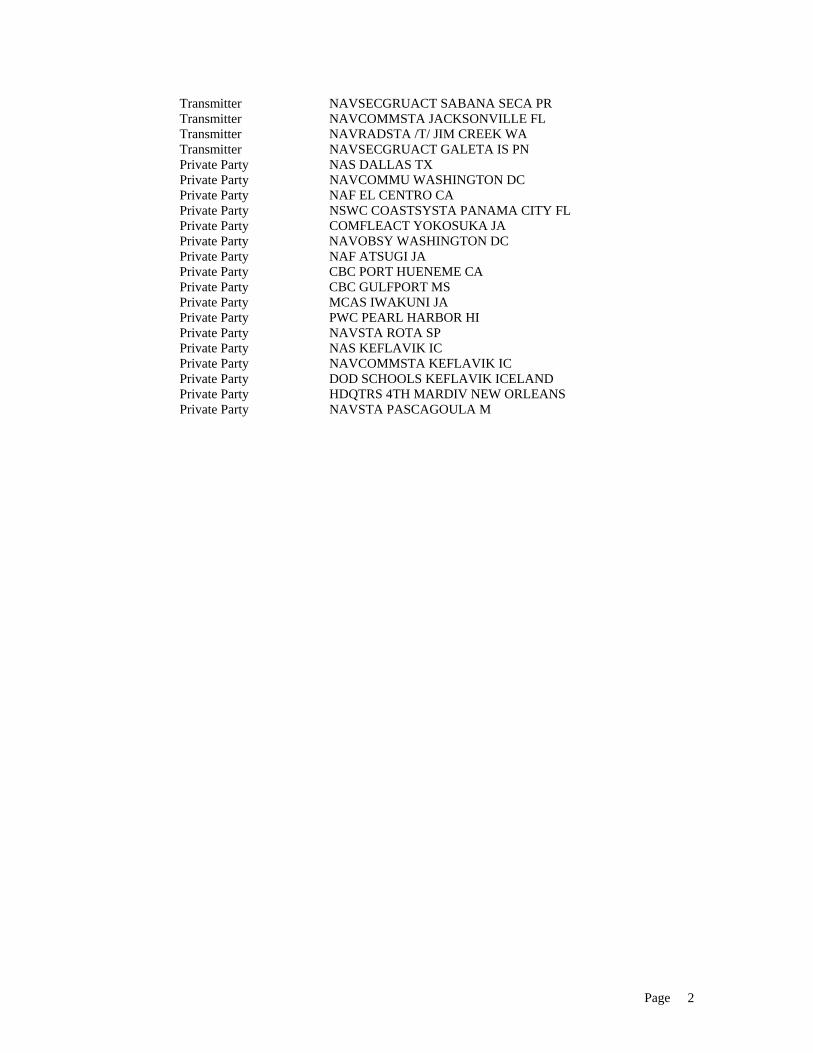
DoN is the only component in DoD to list facilities classified as exempt. DoN exempts mission critical, concentrated energy use transmitters, simulators, cold iron support to ships, and some private party facilities. These are non-production-oriented facilities with little or no square footage, making conventional performance measures meaningless. The mission criticality of these end users is such that energy efficiency measures are evaluated on a case-by-case basis. A complete list of exempt facilities is provided in part IV, E.
4. Tactical Vehicle and Equipment Fuel Use
Total tactical vehicle fuel usage was 581,728 billion Btu (BBtu) in FY 2002, increasing 9.8 percent from FY 2001. The increase usage is attributed to mission surges increasing jet fuel consumption (12.4 percent from FY 2001). New missions and surges in operations will continue to drive jet and motor vehicle fuel consumption. These factors are not considered in meeting the petroleum reduction goals of EO 13149 “Greening the Government Through Federal Fleet and Transportation Efficiency.” However, DoD continues to make steady progress toward meeting the requirements of EO 13149, despite obstacles such as the availability of suitable alternative fuel vehicles (AFV) models and the availability of adequate alternative fuel infrastructure.
The Services report the acquisition of 5,422 AFVs and 648 additional Energy Policy
Act (EPAct) credits for dedicated alternative fueled vehicles and biodiesel use. The acquisitions and the credits resulted in a DoD compliance rate of 67 percent—a 13 percent increase over 2001. Use of biofuels, especially biodiesel, will have a significant positive impact on the Department’s acquisition rate and petroleum consumption for FY 2003. The Defense Energy Support Center has reported that requests for biodiesel jumped from 1.4 million gallons during the last contracting period to 5.2 million gallons for the upcoming period. EPAct allows one alternative fuel vehicle credit for every 2,250 gallons of 20 percent biodiesel/80 percent diesel blend consumed.
The Navy and Marine Corps acquired 1637 AFVs. With additional credits for dedicated
alternative fueled vehicles and biodiesel use, the Navy had a 68 percent alternative fuel vehicle acquisition rate and the Marine Corps had a ‘government best’ rate of 182 percent.
Page 6
The Army has acquired 2,843 AFVs, which is 60 percent of the 4,777 vehicles that are subject to the Energy Policy Act and expects to meet the 75 percent goal in FY 2003 through the lease of over 3,000 vehicles with extensive additional biodiesel credits. To achieve compliance with the legislative mandates of EPAct and E.O. 13149, the Army will continue to lease from the General Services Administration (GSA) as many AFVs as possible, consistent with model availability from vehicle manufacturers and where alternative-fueling infrastructure is available for AFVs, and use alternative fuel in these vehicles a majority of the time by FY 2005. The Army will lease from GSA light duty vehicles with a higher fuel economy of one (1) mpg in FY 2002 and three (3) mpg in FY 2005, and further reduce petroleum consumption by using biodiesel fuel in as many of its diesel, non-tactical vehicles as possible, consistent with mission requirements. The Army has installed both biodiesel and E-85 fuel tanks at Fort Leonard Wood, MO and will continue to look for opportunities to develop alternative fuel refueling infrastructure.
The Air Force was also unable to meet the 75 percent AFV acquisition requirement for
1104 vehicles, but did acquire 60 percent, or 931 AFV credits, and established the groundwork for future success. Projections indicate that the 75 percent requirement will be exceeded in FY 2003 (81 percent) and FY 2004. A DoD AFV working group was created. Through this group, all DoD fleet agencies came together and developed a short and long-term strategy. Principal to this was the participation of the Defense Energy Support Agency, Army Air Force Exchange Service (AAFES) and Navy Exchange Service (NEX). The teaming effort of this working group has resulted in gaining industry support for building AFV infrastructure and other alternatives. Along with our nation’s inadequate refueling infrastructure, the Air Force’s inability to meet the EPAct mandates were also a direct reflection of limitations of the types and quantity of alternative fuel vehicles available for purchase and funding constraints. While Air Force units requested sufficient quantities of AFVs in their two-year programming and planning programs, automobile manufacturers did not produce sufficient types and quantities and GSA was unable to procure them at execution. Another major negative impact on the Air Force’s ability to meet the AFV goals in FY 2003 will be the new incremental cost as directed by GSA-Fleet to cover their costs, which they pass on via the lease. FY 2003 will be the first year federal agencies will be required to pay an incremental cost for E85 vehicles. This additional cost will drive the GSA incremental cost for the Air Force from $671 thousand in FY 2002 to just over $2.7 million in FY 2003. Since the budgets for FY 2003 and FY 2004 have already been processed, there is no avenue to budget for these increased costs. The resulting effect is that the Air Force may not be able to replace all of the leased EPACT covered vehicles with AFVs in FY 2003 and FY 2004.
Unfortunately, little progress is being made toward achievement of the 20 percent
vehicle petroleum reduction goal as mandated by E.O. 13149. Even with the AFV acquisitions increase, an increase in the use of B20 and E85, and increased MPG for fleet vehicles, the Air Force does not anticipate achieving the 20 percent reduction by FY 2005. Operations tempo has increased for the Air Force, adding miles traveled to its fleet, thus increasing the amount of petroleum fuel consumed. The Air Force does not project its operations tempo to decrease over the next few years. These factors are not considered in meeting E.O. 13149 petroleum reduction goals.
Page 7
B. Renewable Energy
DoD continues to install renewable energy technologies and purchase electricity generated from renewable sources when life-cycle cost-effective. The Department is committed to the Million Solar Roof initiative and continues to emphasize the use of solar and other renewable energy sources where it is cost-effective. Passive solar designs, such as building orientation and window placement and sizing, are already being implemented in a variety of building types and new facility construction. The Army has approximately 3,800 “solar roofs” in use at its installations, and has requested assistance from the Department of Energy’s Sandia National Laboratory to bring existing inoperable photovoltaic systems back to operational status. The Department anticipates more growth in the implementation of renewable energy and active solar technologies due to the recently implemented Sustainable Design and Development guidance. However, since DoD policy is to privatize utility systems whenever economical, power generation systems will generally be contractor-owned or located at remote, grid independent sites.
1. Self-Generated Renewable Energy
DoD has integrated photovoltaic power systems, solar water heating systems, and transpired solar collectors (solar walls) into its facilities. Self-generated power is often coupled with ground-source heat pumps, solar water heating systems and photovoltaic arrays to generate electricity at isolated locations, such as range targets, airfield landing strip lighting and remote water pumping stations. Active solar heating applications have included maintenance facility solar walls, swimming pool heating, and hot water heating. In FY 2002 the Department generated an estimated 68,493 MWH in self-generated electrical power, 420 BBtu in thermal energy, 2.1 MMBtu of energy from biomass and 1,829 BBtu in power generated from refuses derived fuel and wood.
The following self-generating renewable energy projects were installed and brought online during FY 2002: Schofield Barracks, HI has installed 650 solar heating units in Army Family Housing and at the Wheeler Fire Station. Fort Huachuca, AZ installed a new prototype Dish/Stirling solar thermal electric generator. Arizona National Guard has installed three 200 kW fuel cells and a 12 kW photovoltaic array in Northern Arizona. MAGTFTC 29 Palms, CA awarded a 1 MW photovoltaic system which will be the largest Federal photovoltaic system to date. Pentagon, VA awarded contracts for an additional 70-kW photovoltaic array; a solar-powered guard shack and inspection station supplied by approximately 400 square feet of solar thermal tile and a 75.6-kW solar thermal hot water installation using evacuated tube technology. Existing generation: Solar Domestic Hot Water Installation BBtu/yr MCB Camp Pendleton, CA 8.5 MCB Hawaii, HI 2.26 Moron AB, Spain 0.032
Page 8
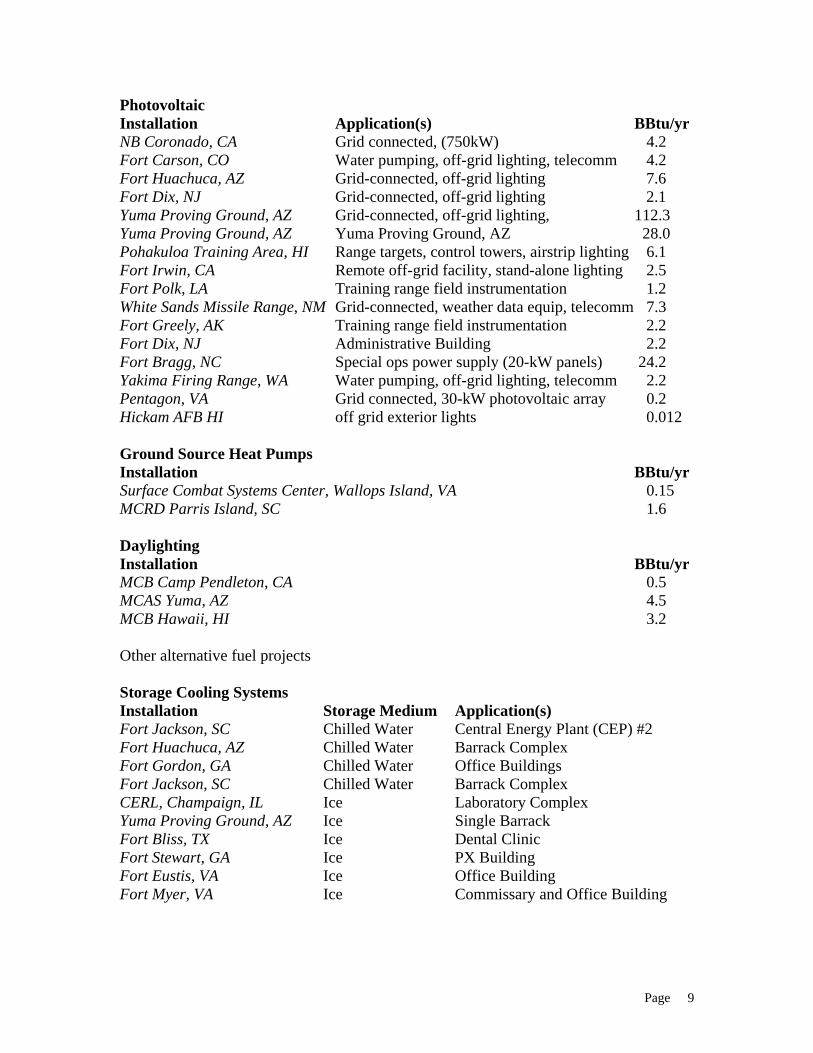
Photovoltaic Installation Application(s) BBtu/yr NB Coronado, CA Grid connected, (750kW) 4.2 Fort Carson, CO Water pumping, off-grid lighting, telecomm 4.2 Fort Huachuca, AZ Grid-connected, off-grid lighting 7.6 Fort Dix, NJ Grid-connected, off-grid lighting 2.1 Yuma Proving Ground, AZ Grid-connected, off-grid lighting, 112.3 Yuma Proving Ground, AZ Yuma Proving Ground, AZ 28.0 Pohakuloa Training Area, HI Range targets, control towers, airstrip lighting 6.1 Fort Irwin, CA Remote off-grid facility, stand-alone lighting 2.5 Fort Polk, LA Training range field instrumentation 1.2 White Sands Missile Range, NM Grid-connected, weather data equip, telecomm 7.3 Fort Greely, AK Training range field instrumentation 2.2 Fort Dix, NJ Administrative Building 2.2 Fort Bragg, NC Special ops power supply (20-kW panels) 24.2 Yakima Firing Range, WA Water pumping, off-grid lighting, telecomm 2.2 Pentagon, VA Grid connected, 30-kW photovoltaic array 0.2 Hickam AFB HI off grid exterior lights 0.012 Ground Source Heat Pumps Installation BBtu/yr Surface Combat Systems Center, Wallops Island, VA 0.15 MCRD Parris Island, SC 1.6 Daylighting Installation BBtu/yr MCB Camp Pendleton, CA 0.5 MCAS Yuma, AZ 4.5 MCB Hawaii, HI 3.2 Other alternative fuel projects Storage Cooling Systems Installation Storage Medium Application(s) Fort Jackson, SC Chilled Water Central Energy Plant (CEP) #2 Fort Huachuca, AZ Chilled Water Barrack Complex Fort Gordon, GA Chilled Water Office Buildings Fort Jackson, SC Chilled Water Barrack Complex CERL, Champaign, IL Ice Laboratory Complex Yuma Proving Ground, AZ Ice Single Barrack Fort Bliss, TX Ice Dental Clinic Fort Stewart, GA Ice PX Building Fort Eustis, VA Ice Office Building Fort Myer, VA Ice Commissary and Office Building
Page 9
In addition to these projects, Naval Air Weapons Center, China Lake, CA facilitates the production of 180 MW of electricity from its geothermal energy resources. This facility has fed over 18,000 gigawatt-hours of electricity into the western power grid since its inception. The amount of power generated for one year is equivalent to saving approximately 4,163,000 barrels of oil. Future expansion of this plant is being evaluated, as well as construction of a new geothermal power plant at NAS Fallon, NV through a public-private venture. The Army is developing portable photovoltaic technology to serve as the primary power source of a Battalion size Tactical Operations Center (TOC). The current units under field test will meet 80 percent of the TOC’s power requirements. The units are tactically quiet, reduce the logistic footprint, and prevent pollution. The USAF Academy, CO generated and captured 2,126,253 cubic feet of digester gas onsite that was used in lieu of natural gas to fire a process hot water boiler for the Waste Water Treatment Plant. At approximately 1000 Btu/CF, this on-site biomass energy application replaced 2,126 Million Btu’s of fossil derived fuel use while simultaneously reducing environmental emissions. Eielson AFB, AK recycled over 24K tons of paper products for use in the base’s central heat and power plant saving $117K in disposal costs and over $8K in coal costs. Lackland AFB, TX has one solar-thermal hot water domestic heating system in Building 10658. Altus AFB, OK has a Photovoltaic system for the runway windsock lighting and another small array for remote lighting at north aircraft refueling area. Peterson AFB, CO installed a solar-lighted jogging path and solar photovoltaic power for remote alarm system panels at RAF Mildenhall, UK.
2. Purchase of Renewable Energy
In FY 2002 the Department purchased 253,098 MWH (864 BBtu equivalent) of renewable electricity and 664 BBtu of renewable thermal energy. Of this amount, 1,197 BBtu was credited to Standard Buildings and 331 BBtu was credited to Industrial & Laboratory Facilities when determining the consumption per gross square rates reported on the scorecard at attachment IV.B. Since renewable sources of electricity generation generally have higher capital equipment costs, they usually do not compete well with the conventional utility supplier of electricity. Despite this barrier, the Armed Services have made significant progress in the purchase of renewable energy generated from solar, wind, geothermal, and biomass sources when cost-effective. For example, the Army has entered into a contract with Washington Gas Energy Services to purchase 5 million kWh of wind power and 14 million kWh of landfill gas annually through December 2004. The wind farm (located in West Virginia) will deliver 5 million kWh of renewable power annually to Walter Reed Army Medical Center, MD, Adelphi Labs, and Fort McNair, DC beginning in FY 2003. Lackland AFB TX purchased wind-generated renewable electricity from San Antonio City Public Service from a wind-farm in west Texas. The base received $54K for the first year of the renewable energy source project, part of a five-year, $500K program included in the Fiscal 2002 Defense Appropriation Bill. The base purchased approximately 1,800 MWH of wind-generated electricity in FY 2002.
It is important to note that within Germany, 7.9 percent of the total electric energy
supplied to the grid comes from renewable sources of wind, hydro, biomass, and photovoltaic as part of the utilities standard portfolio. Therefore, the 80,000 MWh of electricity generated from renewable sources purchased in Germany was not included in Exhibt A “Format for Reporting
Page 10
Green Energy Purchases to Receive Credit Toward Executive Order Goals” provided in part IV, F.
C. Petroleum
Petroleum-based fuel (fuel oil, LPG/propane) use in facilities has decreased 65.3 percent from the FY 1985 baseline. Facility consumption was 101.4 TBtu in FY 1985 (Buildings/Facilities and Excluded Buildings/Industrial/) and 35.1 TBtu in FY 2002 (Standard Buildings/Facilities, Industrial/Laboratory/Research/Other Energy-Intensive Facilities, and Exempt Facilities). Fuel oil use increased in FY 2001 from previous years as installations switched from sky-rocketing prices of natural gas, to less expensive fuel oil. Prices of gas have stabilized and installations switched back to natural gas in FY 2002. Further reductions were accomplished primarily through boiler plant de-centralization, boiler plant tune-ups and improved controls, and steam trap replacements. A significant factor in this reduction was Defense Energy Support Center’s (DESC) Natural Gas Competitive Procurement Program. The objective of this program is to obtain a cost-effective supply of natural gas for DoD installations while maintaining supply reliability, thereby assisting the Components to minimize their reliance on petroleum products. In FY 2002, DESC competitively procured 44.5 TBtu of natural gas for the 180 DoD installations that participated in the program (approximately 56% of the DoD total annual natural gas consumption) and achieved over $28.3 million in cost avoidance. Fuel oil use in facilities decreased 6.7 TBtu compared to FY 2001, while natural gas consumption increased 1.2 TBtu. The net decrease of 5.5 TBtu in the combined fuel oil and natural gas consumption was due to the mild winter and the high cost of oil.
D. Water Conservation
In FY 2002, DoD consumed 160,573 million gallons of potable water and spent $292 million on water related services. The FY 2000 water baseline of 203,773 million gallons was developed using actual and extrapolated consumption numbers for non-reporting activities and should be revised to 173,261 million gallons. The original extrapolated numbers were determined to be too high since many of the non-reporters were disestablished activities. The proposed new water baseline is based upon more accurate information.
The Services are striving to increase water conservation awareness and reduce water
use—particularly where tight water supplies may potentially impact mission accomplishment and personnel morale. Although DoD water usage has decreased 7.3 percent from the revised FY 2000 baseline, the costs associated with its use have not come down proportionately, due to a 20 percent increase in the average unit cost of water. Greater treatment and testing requirements imposed on water suppliers by the Safe Drinking Water Act and amendments have increased the cost of providing potable drinking water. Additionally, some installations that purchase their water are increasingly likely to be on rate schedules designed to encourage conservation, such as increasing block rates or summer peak-demand charges.
Water conservation measures not only reduce water use and cost, but also reduce energy
consumption (for pumping) and sewage treatment costs. Additionally, water conservation helps to reduce the quantities of wastewater treatment chemicals (most notably chlorine) being
Page 11
released into the environment, and reduces the risk of drawing down aquifers or saltwater intrusion into aquifers. Thus, water conservation efforts, in addition to being environmentally responsible, can help installations stretch dwindling Operation and Maintenance (O&M) dollars.
Defense Components concentrated on water conservation methods such as early leak
detection and repair, installation of low-flow water-efficient fixtures in housing and administration buildings, and public awareness programs. For instance, the Marine Corps continues to audit installations for water projects. Since 1997, these audits have identified over $15 million in projects and completed repairs saving over 487 million gallons in water leaks. The Navy implemented a range of projects from replacing a once through cooling system at the Naval Shipyard Portsmouth,NH with a recycling cooling tower to replacing all the inefficient plumbing fixtures at Naval Station Guantanamo Bay, Cuba with high efficiency fixtures. DoN is making water conservation a standard feature in most of our alternatively financed projects, bundling those savings with other infrastructure improvements to maximize the benefits. NSA continues to implement water-conservation techniques, and uses water saving fixtures in lavatories during renovation or repair projects. Reports of water leaks receive immediate attention, particularly for the underground steam distribution system. Over the last two years, WHS has been working with the various municipalities to improve the accuracy of the water metering in the Pentagon including meter calibration, certification and the installation of an automated meter reading (AMR) system. Water-efficient plumbing fixtures and infrared controllers are included in the Pentagon Renovation. III. Implementation Strategies
DoD’s philosophy is to give the Defense Components the flexibility to manage their own energy programs to meet the goals of Energy Policy Act (EPAct), EO 13123, and FY 2002 Defense Authorization Act. DoD’s primary objectives in implementing strategies are to improve energy efficiency, eliminate energy waste and reduce costs.
A. Life-Cycle Cost Analysis
DoD facilities utilize life-cycle cost analysis in making decisions about their investment in products, services, construction, and other projects to lower costs and to reduce energy and water consumption. DoD considers the life-cycle costs of combining projects, and encourages bundling of energy efficiency projects with renewable energy projects, where appropriate. Projects are generally prioritized for capital funding and execution is based upon the greatest life-cycle savings to investment ratio. The use of passive solar design and active solar technologies are recommended where cost-effective over the life of the project. Sustainable development projects use life-cycle costing methodology and follow the Whole Building Design Guide. For example, the Air Force used life-cycle analysis for a $1.22 million waste heat recovery project at Thule AFB, Greenland and a $19 million Military Family Housing replacement program (Phase I) at the USAF Academy, CO.
Page 12
B. Facility Energy Audits,
Comprehensive audits were conducted on 130,458 thousand square feet (ksf)
(10.1 percent of facility square footage) in FY 2002. Since 1992, comprehensive audits were completed on a total of 1,065,234 ksf (79 percent of facility square footage). Some audits were repeat audits, several years apart, or to investigate additional conservation measures not cost effective previously. Auditing 10 percent of facilities annually has typically been cost prohibitive and many Components have been unable to fully fund the audit program. To make up for part of this shortfall, components obtain audits as part of alternative-financed energy savings projects whenever feasible.
C. Financing Mechanisms
Utility Energy Service Contracts (UESC) and Energy Savings Performance Contracts
(ESPC) are crucial tools for financing energy efficiency measures that allow installations to improve their infrastructure and pay for the energy efficiency measures through the savings generated by the project over time (10-25 years). ESPCs are partnerships with the private sector companies, known as Energy Savings Companies (or ESCOs). UESCs are similar to ESPCs, with the most notable difference being that the projects are financed and implemented through utility companies. In FY 2002, Defense Components through a decentralized approach awarded 41 UESC and 32 ESPC task orders/contracts producing an estimated total life-cycle savings of $837 million and an annual energy savings of 2.1 TBtu. These contracts include many infrastructure upgrades and new equipment to help the installations reduce energy and water consumption. Examples include new thermal storage systems, chillers, boilers, lights, motors, peak shaving, Energy Monitoring and Control Systems (EMCS) and water reducing devices. Savings generated over time are returned to the contractor (86 percent of total savings) to pay for the improvement measures. Of the $837 million estimated total life-cycle savings, the contractors’ share will be $719 million (including interest charges which on average increase the project cost by a factor of 2.4 above the initial investment cost). Normally, cost savings are used to first pay the contractor, and then are used to offset other base operating support expenses. In most cases, installations decide to seek a shorter contract term and defer all Government cost savings until after contract completion. In these cases, the savings generated by UESCs and ESPCs help to reduce the energy consumption, but do not reduce the total costs of operation until the contracts expire. After contract expiration and the retrofits are paid for, DoD will be able to obtain full cost savings.
In FY 2002, Installations utilized ESPC contracting vehicles from DoE (3), Naval
Facilities Engineering Command (NAVFAC) (1), Huntsville Engineering and Support Center (8), Air Force Civil Engineer Support Activity (AFCESA) (12) and Defense Energy Support Center (DESC) (2). Six installations/ major commands awarded their own internally developed ESPC. ESPCs were awarded for the following installations: Fort Hamilton, NY; Wiesbaden, Germany; Giebelstadt, Germany; Corpus Christi AD, TX; Lanstuhl, Germany; Fort Lewis, WA, Rock Island Arsenal, IL; Picatinny Arsenal, NJ; Fort Bragg, NC; Carlisle Barracks, PA; CNRSW San Diego, CA; NSY Portsmouth, NH; NAS Atlanta, GA; NSA New Orleans, LA; NAVSTA GITMO, Cuba; MCB Quantico, VA; JRB Fort Worth, TX; CNRS Texas; MAGTFTC
Page 13
29 Palms, CA; Peterson AFB, CO; Eglin AFB, FL; Davis Monthan AFB, AZ (2); Kirtland AFB, NM; Fairchild AFB, WA; Dyess AFB, TX (2); Hickam AFB, HI; NAS JRB Air Force Fort Worth, TX; Westover AFB, MA; Kunsan AFB, Korea; Laughlin AFB, TX.
UESCs were awarded for the following installations: Fort Knox, KY; Fort Rucker, AL;
Fort Lewis, WA (2); U.S. Army Garrison, Hawaii (2); Aberdeen Proving Ground, MD (8); NTTC Corry Station, FL; AUTEC Andros Island; NWS Charleston, SC; NTC Great Lakes, IL (2); NAS Jacksonville, FL (3); NUWC Keyport, WA (2); NAF El Centro, CA; MCAS Yuma, AZ; COMNAVREGHI Pearl Harbor, HI; LANTFLT Norfolk, VA; NAS Brunswick, ME; NAVSTA Mayport, FL; NMRC San Diego, CA; NSY Puget Sound, WA; Fleet ASW San Diego, CA; MCB Camp Lejeune, NC (2); MCAS Cherry Point (Hsg), NC; Arnold AFB, TN; Vance AFB, OK; Cannon AFB, NM; Schriever AFB, CO; Hurlburt AFB, CO.
In recent years, Congress has shown an upward trend in appropriating funding for the
Department’s Energy Conservation Investment Program (ECIP). After zeroing out DoD’s request for $50 million for ECIP in FY 2000, Congress appropriated $15 million of the requested $33.5 million in FY 2001, $27 million of the requested $35 million in FY 2002, and $35.4 million of the requested $50 million in FY 2003. The FY 2002 program funded 22 projects with an average savings-to –investment ratio of 3.9 and a $6 million renewable energy assessment.
D. ENERGY STAR® and Other Energy-Efficient Products
When life-cycle cost-effective, the Defense Components select Energy Star® and other energy-efficient products when acquiring energy-consuming products. Guidance generated by DoE, GSA and DLA for energy–efficient products are being incorporated into the sustainable design and development of new and renovated facilities. The components are procuring energy-consuming products that are in the upper 25 percent of energy efficiency as designated by the Federal Energy and Management Program. Energy efficient technologies include high-efficiency lighting and ballasts, exit signs, energy efficient motors, low-voltage distribution transformers, and the use of packaged heating and cooling equipment with energy efficiency ratios that meet or exceed Federal criteria for retrofitting existing buildings. Information technology hardware, computers and copying equipment are acquired under the Energy Star® program using GSA Schedules and either Government-wide or Service contracts.
All Family Housing appliances, heating, ventilation and air conditioning (HVAC)
equipment, domestic hot water equipment, and building lighting fixtures comply with Energy Star product standards. Army procurement regulations were updated in FY 2000 and are in compliance with President Bush’s directive of May 3, 2001 to procure only energy-consuming products which are in the upper 25 percent of energy efficiency as designated by the Federal Energy and Management Program. Navy energy managers utilized the DLA lighting CDROM and Washington State Energy Office MotorMaster database to assist in purchasing energy efficient equipment. As an example of Energy Star® product purchasing, MCB Camp Butler purchased 310 high-efficiency washers for renovated family housing and 20 stack washer/dryers for the Bachelor Enlisted Quarters and Bachelor Officers Quarters to replace old top-loading washers. The use of high-efficiency washers and dryers will also reduce drying
Page 14
time due to high-spin speed extracting more water out of clothes. Another example is DeCA’s Contracting Business Unit which procures energy efficient products such as paper and plastic grocery bags made up of minimum 35 percent pre-consumer or post-consumer recycled products. New or replacement cardboard balers are purchased for DeCa’s commissaries in consideration of efficient disposal of cardboard products.
E. ENERGY STAR® Buildings
This program, developed by the U.S. Environmental Protection Agency (EPA) to promote energy efficiency in buildings, requires measured building data and a comparison with archetypes in various regions of the country. Energy Star® Building criteria are based on a five-stage implementation strategy consisting of lighting upgrades, building tune-up, load reductions, fan system upgrades, and heating and cooling system upgrades. Army, Navy, and Air Force signed out Unified Facilities Criteria 3-400-01, “Design: Energy Conservation”, dated July 5, 2002. It directs use of ASHRAE Standard 90.1 of 2001, Energy Standard for Buildings (Except Low-Rise Residential Buildings). In 2001, Navy and EPA signed a Memorandum of Understanding (MOU) certifying that Navy Family Housing construction criteria meets or exceeds Energy Star® Homes requirements. All homes built to the criteria will be certified Energy Star® Homes. In FY 2002, a MOU between the EPA and the Pentagon Renovation Office was signed agreeing to use the Portfolio Manager rating tool, adopt the Energy Star® strategy, educate staff and public, provide metering/sub-metering, and conform to current indoor environmental standards.
F. Sustainable Building Design
Sustainability initiatives require an integrated design approach to the life-cycle of buildings and infrastructure. The concepts of sustainable development as applied to DoD installations have been incorporated into the master planning process of each of the Services. Installations are encouraged to approach land use planning and urban design in a holistic manner and integrate it with energy planning. ASHRAE Standard 90.1 is the Tri-Service energy criteria for new construction and major renovation. On July 5, 2002, NAVFAC officially adopted the US Green Building Council's Leadership in Energy and Environmental Design (LEED) rating system as a tool to apply sustainable principles and as a metric to measure the sustainability achieved. This includes optimizing site selection potential, maximizing the use of renewable energy sources, using environmentally preferable products, reducing water and energy consumption, providing facilities with high quality indoor environments, and optimizing operations and maintenance practices. All DoN Military Construction projects will include a line item identifying the cost of sustainable development on 1391 Project Data Forms in an effort to retain these features through commissioning. Navy Family Housing criteria includes Sustainable Planning and Development standards and an interim Sustainable rating worksheet based on industry and local programs.
The Army has embraced the design, construction, operation and reuse/removal of the
built environment in an environmentally and energy efficient manner and has identified projects in FY 2002 and beyond as Army Sustainable Design and Development (SDD) Showcase Facilities. This program will facilitate awareness of how facility systems and materials affect
Page 15
initial project and life-cycle costs, operations and maintenance practices, and ultimate facility performance over the facilities lifetime. The Army’s policy requires all projects to be scored against its Sustainable Project Rating Tool, achieving at least a Bronze level but encourages striving for higher sustainable rating levels (Silver, Gold, and Platinum). Additionally, approximately 450 design engineers and installation personnel were trained in FY 2002 through the U.S. Army Corp of Engineers’ 3-day sustainable design workshop.
BEQ Naval Base Norfolk, VA achieved a LEED Gold rating at a premium cost of only
2.8 percent. Energy conserving features resulted in a 43 percent reduction as compared to a computer modeled base case and $278,000 savings per year in energy costs with a life cycle energy savings of $4.5 million. Sustainable features that proved to be cost effective include steam condensate heat recovery, exhaust air heat recovery, occupancy sensors for HVAC and lighting, gray-water recycling and Energy Star rated roofing. The USAF Academy, CO is constructing a $32 million athletic facility expansion that will include the most efficient and latest technology in HVAC controls, lighting, roofing and building envelope materials and window glazing. The USAF Academy, CO is also constructing a $19 million Military Family Housing replacement project (Phase I) that includes sustainable design for landscape (hardscape, recreation and xeriscape planting principles), architecture (site adaptation to provide weather and solar shading), envelope materials (low emission glass and thermal panes, additional insulation, and sustainable cladding), and Energy Star rated or equivalent appliances, HVAC and lighting.
G. Energy Efficiency in Lease Provisions
DoD emphasizes energy and water conservation in leased facilities and each Service has issued guidance directing that all leased spaces comply with the energy and water efficiency requirements of the Energy Policy Act of 1992. It is DoD’s intent to have the landlord make appropriate investments in energy efficiency which can be amortized in the lease, provided the new total cost (energy costs plus lease cost) does not exceed total costs without improvements. These leases should amortize the investments over the economic life of the improvements. Build-to-lease solicitations for DoD facilities will contain criteria encouraging sustainable design and development, energy efficiency, and verification of building performance. DoD relies upon GSA to ensure the above provisions are included in buildings that they lease for DoD. As an example, DeCA’s Eastern Region incorporated the requirement, through GSA, to use current commercial energy efficient design standards with set back thermostats and HVAC equipment with high SEER ratings as part of negotiations for the lease for additional office space for their headquarters. The leased space also includes new low flow plumbing fixtures. The energy and utility costs are currently included in the lease agreement.
H. Industrial Facility Efficiency Improvements
Several major initiatives for industrial facility efficiency improvements are under way including the decentralization of the central heat plant at Westover ARB MA, Fairchild AFB WA and Kirtland AFB NM with energy savings of 347 trillion Btu per year. The Army continues to utilized the Process Energy and Pollution Reduction software developed by and available from CERL to evaluate their energy reduction potential in industrial facilities. NSY Portsmouth, ME
Page 16
added 5.5MW capacity to their FY 1999 cogeneration plant project bringing the total plant capacity to 11MW. In addition to the cogeneration plant, this $42M project provides 2-70K lb/hr package boilers, 2-2.5 MW diesel back-up generators, eliminates a hot water distribution system, and includes contracted maintenance and repair of the plant. DeCA, with a large inventory of commissary stores, installs dual-path air conditioning to control humidity as an alternative to natural gas or propane fired desiccant dehumidification systems. Domestic hot water heat reclaim systems are standard in most large commissary store systems. Remote diagnostic monitoring of Refrigeration Monitoring and Control Systems is used at approximately 191 individual commissaries to assure that refrigeration and lighting systems are being operated and maintained at their design specification. Lighting controls were monitored and discrepancies were forwarded to DeCA’s maintenance contractors on a daily basis for correction. This surveillance continues to result in improved contractor maintenance and improved equipment operation and less energy consumed. Computers are turned off at night and on weekends. Automatic lighting systems are installed in most refrigerated cases to turn off lights after business hours. Plastic or metal swing air curtain doors are installed where feasible. Energy efficient lighting upgrades and occupancy sensors were installed at seven (7) commissaries: Norfolk NOB, VA; Albany MCLB, GA; Hunter AAF, GA; Fort Stewart, GA; Eglin AFB, FL; Minot AFB, ND; and McGuire AFB, NJ.
I. Highly Efficient Systems
DoD encourages the components to combine cooling, heating, and power systems in new construction and/or retrofit projects when cost effective. The Army is currently in the final year of a five-year, $300 million central boiler plant modernization program. The goals of this program are to update the aging central boiler plant infrastructures at select, large installations. Central heating systems at 14 major Army installations have been modernized under this initiative from FY 1998 to FY 2002. In addition to the centrally funded program, the installations also used their operation and maintenance funds to implement energy saving projects such as - upgrade boilers and distribution systems, improved high efficiency pumps and motors, and updated system controls. Naval Medical Center, San Diego upgraded its cogeneration plant. Three 850 kW gas turbines were replaced with one 4.6MW gas turbine and a 25,000 lb/hr heat recovery boiler. Two 2.5MW diesel generators will provide stand-by power. MAGTFTC 29 Palms, CA will add two 600 ton absorption chillers to the 7.5MW cogeneration plant to make further use of waste heat from the plant. The plant will be operational in May 2003. The resulting system will be a combined heating/cooling/power plant capable of handling increased loads envisioned in the base master plan. The plant will dramatically improve reliability of the cooling system, and reduce grid demand, avoiding costly peak charges. The USAF Academy, CO utilizes biomass energy generated in the digesters at its on-site Waste Water Treatment Plant to produce hot water required by the waste treatment process. DeCA’s new refrigeration systems utilize electronic controls, heat reclaim and “floating head” to reduce energy usage.
J. Off-Grid Generation
Page 17
DoD is pursuing off-grid generation where it is life-cycle cost-effective to provide peak shaving opportunities and energy security. Typical applications include micro-turbines, fuel cells, cogeneration plants, fly wheels and back-up generators.
Ft. McPherson, GA completed an ESPC project to use the primary back-up generators
on the post to control the peak load. This 4.4 MW system is capable of supporting the complete load of Marshall Hall, the U.S. Army Forces Command (FORSCOM) Headquarters building, in an emergency. The system can work in curtailment mode (based on the utility peak demand) or peak shaving mode (based on the installation peak). Ft. McPherson, GA also installed a flywheel system as part of the uninterruptible power supply (UPS) for Marshall Hall, the FORSCOM Headquarters building. The UPS serves as temporary bridge power for critical systems in the building until the building diesel generators come on line. The flywheel system replaced approximately 750 heavy-duty lead-acid batteries that took up 2,400 sq. ft. in the building basement. Ft. Bragg, NC awarded a cogeneration project that provides chilled water, hot water and steam for the 82nd Area at Fort Bragg and provide electricity to the post electric grid. This project consists of a 5 MW dual-fuel turbine-generator and integral heat recovery steam generator. The turbine will be fueled by natural gas and utilize #2 diesel oil for back up. The exhaust gases from the turbines will be used to feed a 1000-ton absorption chiller and a heat recovery steam generator sized to handle the entire heating load of the 82nd Heating Plant that includes the Faith Barracks Complex. This project, which replaces faulty equipment, will save energy costs and is one piece of Fort Bragg's overall energy security plan.
DON is validating the performance and cost of microturbines and PEM fuel cells.
Microturbines were installed and instrumented at NAB Coronado, CA. (2-60kW units) and SUBASE New London, CT (1-30 kW). Nine 5kW PEM fuel cells were purchased, and start-up is expected in November 2002. These fuel cells are combined heat and power, grid parallel, natural gas-fueled units. They are in the process of being installed at NAS North Island,CA (3 at the laundry and 2 at the fitness center), SUBASE Point Loma, CA (3 at the BOQ), and NAWS China Lake, CA (1 at the indoor swimming pool). The intent of all of these demonstrations is to assess the performance, and operations, maintenance, and repair requirements of the PEM fuel cells. The fuel cell systems will operate for one year under this program. Although PEM technology has made progress toward viable commercial products, there are still substantial durability, reliability, and availability issues that remain (e.g., a PEM fuel stack last about 6 months under continuous operation). DON is fostering development of heat recovery and use of liquid fuel sources. A preliminary report will be available by the end of FY 2003, with a follow-on report late in FY 2004.
Edwards AFB CA generated 1750 MWHs from installed fuel cells. If the installation
cannot provide dependable power to the DeCA’s commissary, the programming and design team reviews what other sources are available to supplement the power for the commissary building (typically backup generators are utilized).
K Electrical Load Reduction Measures.
DoD installations in the West responded to the President’s Memorandum of May 3, 2001 and reduced summer peak demand. The Services meet the conservation challenge by
Page 18
instituting an aggressive energy awareness campaign and monitoring program, installing vending machine misers, adjusting energy management control system set points, and hiring regional efficiency managers. California commissaries turned off 50 percent of sales area lighting during load reduction warning periods. Peak demand reduction investments for the program included installation of automating controls, demand meters, compact fluorescent lighting, solar reflective window film, and thermal energy storage systems. Additional investments included utilizing passive sky lighting in hangars and upgrading/repairing energy intensive equipment. Back-up generators were used for peak load shedding operations. The Services procured additional generators and invested in Distributed Energy Resources (DER) such as micro turbines, fuel cells, and solar PV systems. As a result the Services efforts, the Department reduced its summer 2001 and summer 2002 peak demand compared to the summer 2000 peak baseline by 9.2 percent and 5.3 percent, respectively.
Fort Lewis,WA installed over 100 Vending Misers - a new technology designated to efficiently manage energy use of refrigerated vending machines and adjusted their set points on the installation’s energy management control system to achieve maximum energy conservation. Fort Irwin, CA instituted an aggressive campaign to encourage soldier’s energy awareness, reduce peak demand usage of electricity and implemented a monitoring program to identify and shut off unoccupied building loads. In addition, Fort Irwin installed over 50,000 feet of solar reflective window film throughout the commercial buildings and barracks on the main post to reduce air conditioning loads. Dugway Proving Grounds,UT completed installation of a 6 MWH generator and has the capability of utilizing the generator to significantly reduce their peak load. The three cogeneration systems at NSY Portsmouth, ME, MAGTFTC 29 Palms, CA and Naval Medical Center, San Diego will add 22.6 MW generating capacity to the National grid. Navy Region Southwest, San Diego, CA installed a 750 kW photovoltaic system that will reduce grid demand beginning in November, 2002. MAGTFTC 29 Palms, CA is installing a 1 MW photovoltaic system due to come on line in late FY 2003. MCB Camp Pendleton, CA disconnected 20,285 lights base-wide and installed 1,745 motion detectors/photo cells, replaced several hundred electric clothes dryers with natural gas dryers, replaced 177 traffic lights with LED lights, replaced steam boilers with domestic hot water (DHW) boilers, and replaced more than 20,000 incandescent lights in Bachelor Enlisted Barracks with compact fluorescent lights. Navy Region Northwest installed 12,676 compact fluorescents at SUBASE Bangor, WA and NAVSTA Bremerton, WA. The USAF Academy, CO participated in Demand Side Management (DSM) efforts during “super peak” periods called by the local utility. The Academy’s automated DSM program duty-cycled noncritical fan and pump motor loads to achieve approximately 4% reduction in peak power demand during the scheduled periods. This resulted in approximately $16k in savings for reduced demand during the (91) hours of super-peak operation in FY 2002. NIMA’s St. Louis facility has an established electrical load shed plan consisting of using the EMCS to cycle or shed all non-essential loads. The Pentagon, VA has diesel-powered back-up generators for mission critical and life/safety systems and coordinates the monthly tests run with periods of peak demand when applicable.
The FY 2001 Supplemental Appropriations Act as well as the FY 2002 Defense
Appropriations Act provided funds for energy and sustainability audits for Installations connected to Western power grid and beyond. This initiative will survey 58 west coast
Page 19
Page 20
installations for potential energy projects and assist in project development that will reduce demand in FY 2004 and beyond. IV. Data Tables and Inventories.
A. FY 2002 Annual Energy Management Data Report. B. Energy Scorecard for FY 2002. (Submitted February 10, 2003 to OMB) C. Goals of Executive Order 13123 and NECPA/EPACT. D. Industrial and Laboratory Facility Inventory. E. Exempt Facilities Inventory. F. Exhibit A Reporting Green Energy Purchases.

IV.A. FY 2002 Annual Energy Management Data Report
Page 1

IV.B. Energy Scorecard for FY 2002 Previously submitted to OMB and DoE on February 10, 2003
Page 1
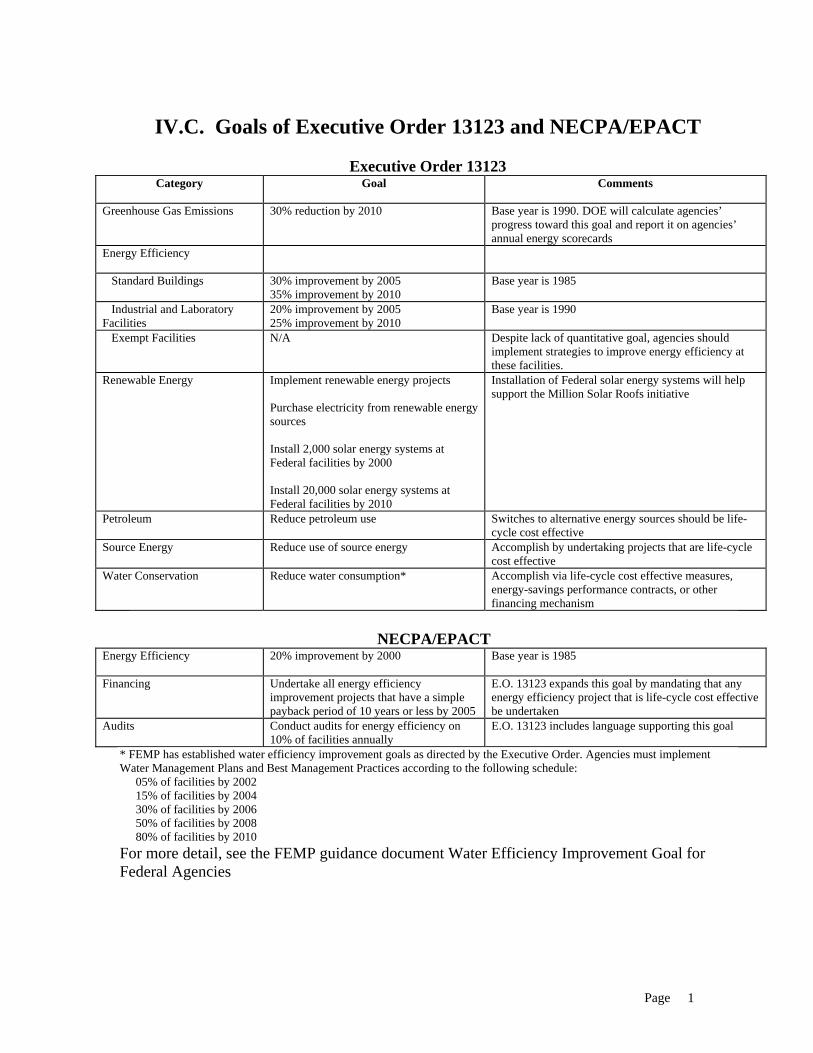
IV.C. Goals of Executive Order 13123 and NECPA/EPACT
Executive Order 13123
Category Goal Comments
Greenhouse Gas Emissions 30% reduction by 2010 Base year is 1990. DOE will calculate agencies’ progress toward this goal and report it on agencies’ annual energy scorecards
Energy Efficiency Standard Buildings 30% improvement by 2005
35% improvement by 2010 Base year is 1985
Industrial and Laboratory Facilities
20% improvement by 2005 25% improvement by 2010
Base year is 1990
Exempt Facilities N/A Despite lack of quantitative goal, agencies should implement strategies to improve energy efficiency at these facilities.
Renewable Energy Implement renewable energy projects Purchase electricity from renewable energy sources Install 2,000 solar energy systems at Federal facilities by 2000 Install 20,000 solar energy systems at Federal facilities by 2010
Installation of Federal solar energy systems will help support the Million Solar Roofs initiative
Petroleum Reduce petroleum use Switches to alternative energy sources should be life-cycle cost effective
Source Energy Reduce use of source energy Accomplish by undertaking projects that are life-cycle cost effective
Water Conservation Reduce water consumption* Accomplish via life-cycle cost effective measures, energy-savings performance contracts, or other financing mechanism
NECPA/EPACT
Energy Efficiency 20% improvement by 2000 Base year is 1985
Financing Undertake all energy efficiency improvement projects that have a simple payback period of 10 years or less by 2005
E.O. 13123 expands this goal by mandating that any energy efficiency project that is life-cycle cost effective be undertaken
Audits Conduct audits for energy efficiency on 10% of facilities annually
E.O. 13123 includes language supporting this goal
* FEMP has established water efficiency improvement goals as directed by the Executive Order. Agencies must implement Water Management Plans and Best Management Practices according to the following schedule: 05% of facilities by 2002 15% of facilities by 2004 30% of facilities by 2006 50% of facilities by 2008 80% of facilities by 2010 For more detail, see the FEMP guidance document Water Efficiency Improvement Goal for Federal Agencies
Page 1
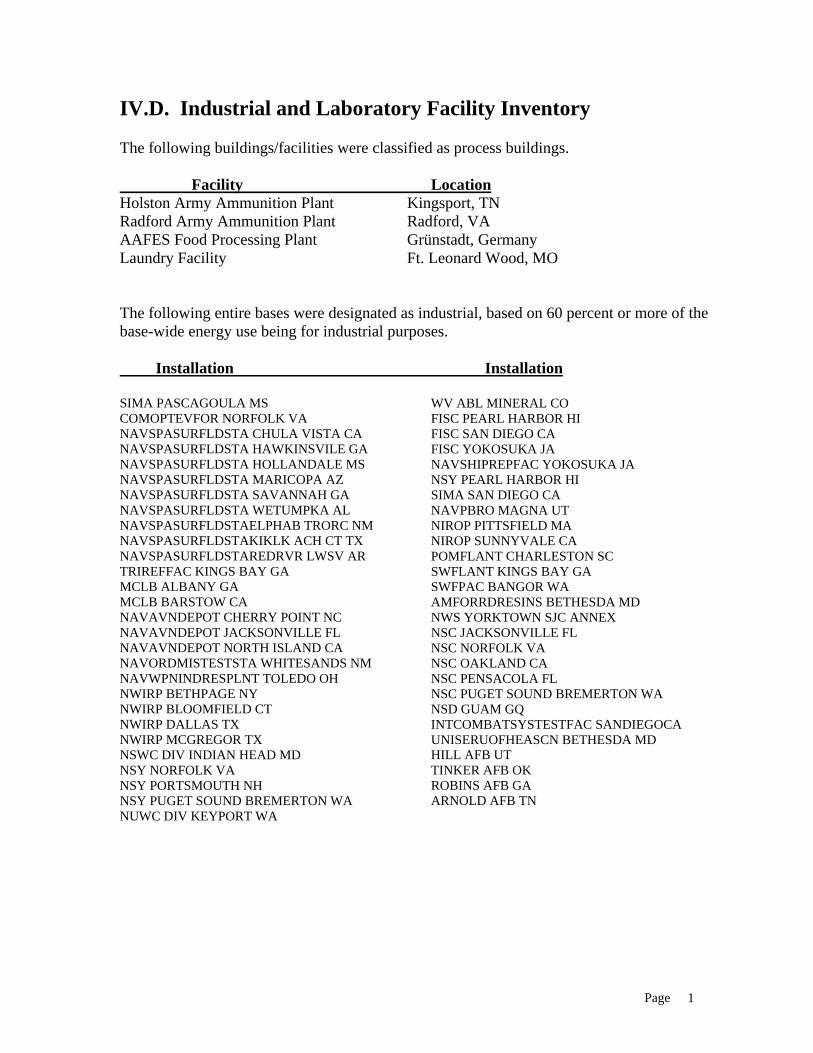
IV.D. Industrial and Laboratory Facility Inventory
The following buildings/facilities were classified as process buildings. Facility Location Holston Army Ammunition Plant Kingsport, TN Radford Army Ammunition Plant Radford, VA AAFES Food Processing Plant Grünstadt, Germany Laundry Facility Ft. Leonard Wood, MO The following entire bases were designated as industrial, based on 60 percent or more of the base-wide energy use being for industrial purposes. Installation Installation SIMA PASCAGOULA MS COMOPTEVFOR NORFOLK VA NAVSPASURFLDSTA CHULA VISTA CA NAVSPASURFLDSTA HAWKINSVILE GA NAVSPASURFLDSTA HOLLANDALE MS NAVSPASURFLDSTA MARICOPA AZ NAVSPASURFLDSTA SAVANNAH GA NAVSPASURFLDSTA WETUMPKA AL NAVSPASURFLDSTAELPHAB TRORC NM NAVSPASURFLDSTAKIKLK ACH CT TX NAVSPASURFLDSTAREDRVR LWSV AR TRIREFFAC KINGS BAY GA MCLB ALBANY GA MCLB BARSTOW CA NAVAVNDEPOT CHERRY POINT NC NAVAVNDEPOT JACKSONVILLE FL NAVAVNDEPOT NORTH ISLAND CA NAVORDMISTESTSTA WHITESANDS NM NAVWPNINDRESPLNT TOLEDO OH NWIRP BETHPAGE NY NWIRP BLOOMFIELD CT NWIRP DALLAS TX NWIRP MCGREGOR TX NSWC DIV INDIAN HEAD MD NSY NORFOLK VA NSY PORTSMOUTH NH NSY PUGET SOUND BREMERTON WA NUWC DIV KEYPORT WA
WV ABL MINERAL CO FISC PEARL HARBOR HI FISC SAN DIEGO CA FISC YOKOSUKA JA NAVSHIPREPFAC YOKOSUKA JA NSY PEARL HARBOR HI SIMA SAN DIEGO CA NAVPBRO MAGNA UT NIROP PITTSFIELD MA NIROP SUNNYVALE CA POMFLANT CHARLESTON SC SWFLANT KINGS BAY GA SWFPAC BANGOR WA AMFORRDRESINS BETHESDA MD NWS YORKTOWN SJC ANNEX NSC JACKSONVILLE FL NSC NORFOLK VA NSC OAKLAND CA NSC PENSACOLA FL NSC PUGET SOUND BREMERTON WA NSD GUAM GQ INTCOMBATSYSTESTFAC SANDIEGOCA UNISERUOFHEASCN BETHESDA MD HILL AFB UT TINKER AFB OK ROBINS AFB GA ARNOLD AFB TN
Page 1
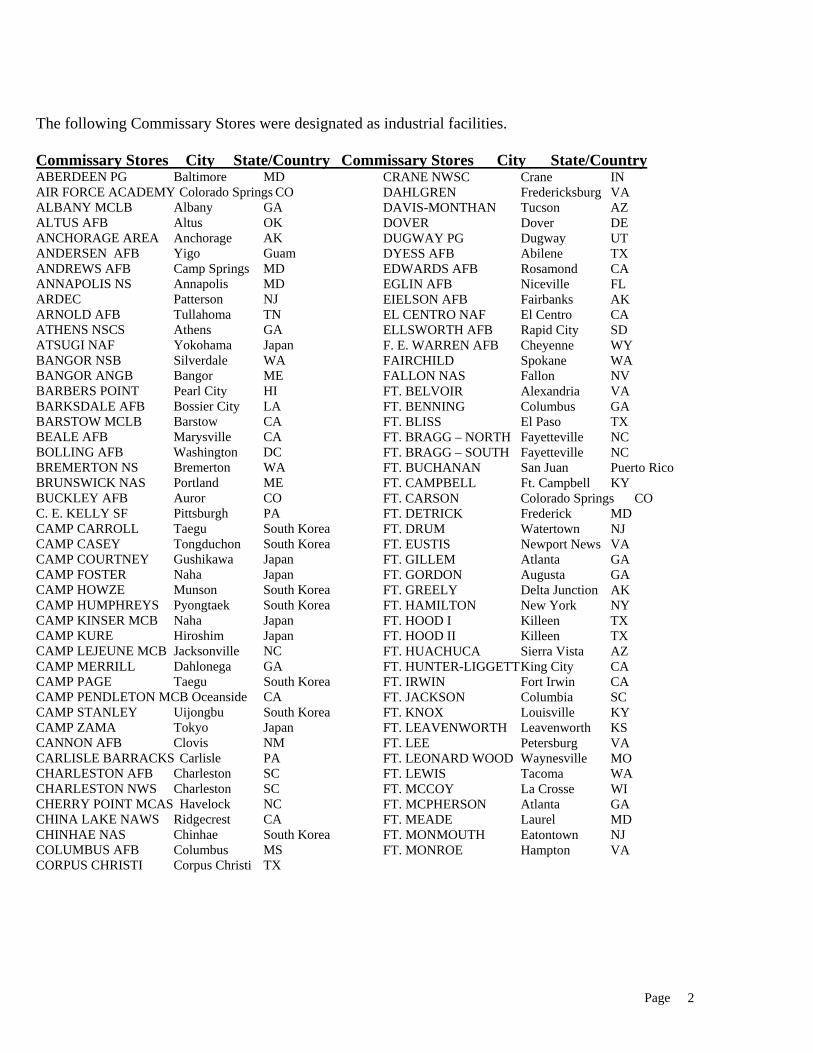
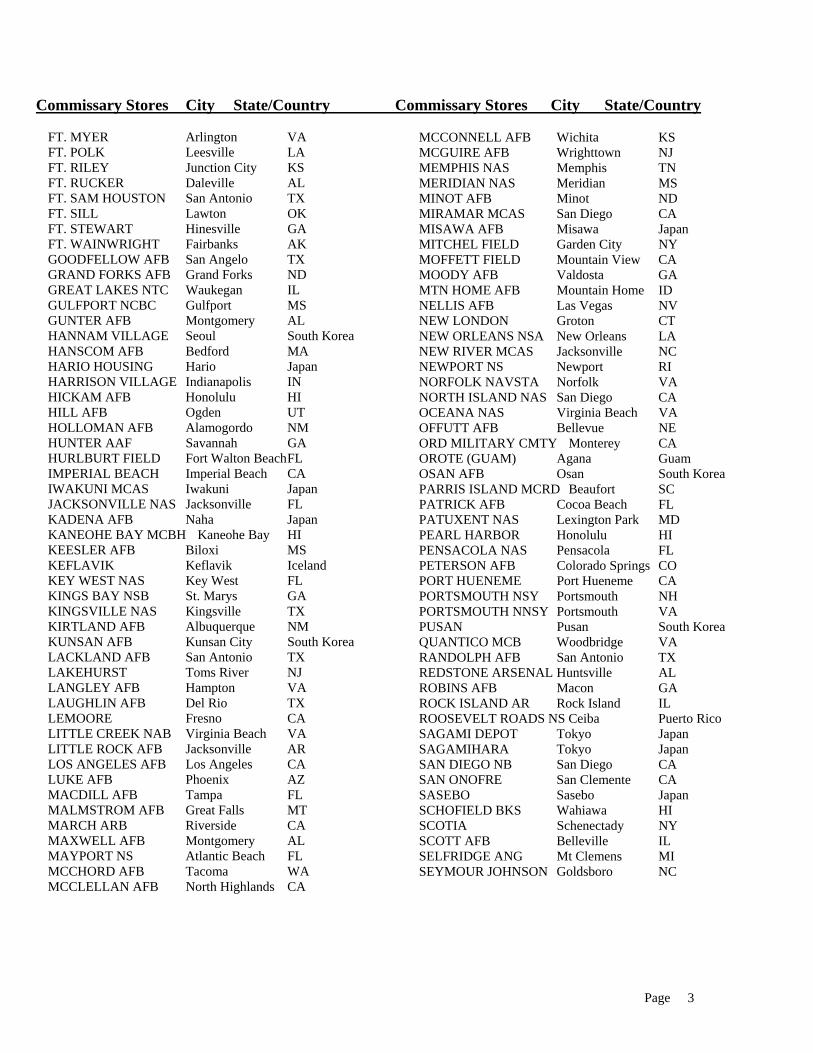
The following Commissary Stores were designated as industrial facilities. Commissary Stores City State/Country Commissary Stores City State/Country ABERDEEN PG Baltimore MD AIR FORCE ACADEMY Colorado Springs CO ALBANY MCLB Albany GA ALTUS AFB Altus OK ANCHORAGE AREA Anchorage AK ANDERSEN AFB Yigo Guam ANDREWS AFB Camp Springs MD ANNAPOLIS NS Annapolis MD ARDEC Patterson NJ ARNOLD AFB Tullahoma TN ATHENS NSCS Athens GA ATSUGI NAF Yokohama Japan BANGOR NSB Silverdale WA BANGOR ANGB Bangor ME BARBERS POINT Pearl City HI BARKSDALE AFB Bossier City LA BARSTOW MCLB Barstow CA BEALE AFB Marysville CA BOLLING AFB Washington DC BREMERTON NS Bremerton WA BRUNSWICK NAS Portland ME BUCKLEY AFB Auror CO C. E. KELLY SF Pittsburgh PA CAMP CARROLL Taegu South Korea CAMP CASEY Tongduchon South Korea CAMP COURTNEY Gushikawa Japan CAMP FOSTER Naha Japan CAMP HOWZE Munson South Korea CAMP HUMPHREYS Pyongtaek South Korea CAMP KINSER MCB Naha Japan CAMP KURE Hiroshim Japan CAMP LEJEUNE MCB Jacksonville NC CAMP MERRILL Dahlonega GA CAMP PAGE Taegu South Korea CAMP PENDLETON MCB Oceanside CA CAMP STANLEY Uijongbu South Korea CAMP ZAMA Tokyo Japan CANNON AFB Clovis NM CARLISLE BARRACKS Carlisle PA CHARLESTON AFB Charleston SC CHARLESTON NWS Charleston SC CHERRY POINT MCAS Havelock NC CHINA LAKE NAWS Ridgecrest CA CHINHAE NAS Chinhae South Korea COLUMBUS AFB Columbus MS CORPUS CHRISTI Corpus Christi TX
CRANE NWSC Crane IN DAHLGREN Fredericksburg VA DAVIS-MONTHAN Tucson AZ DOVER Dover DE DUGWAY PG Dugway UT DYESS AFB Abilene TX EDWARDS AFB Rosamond CA EGLIN AFB Niceville FL EIELSON AFB Fairbanks AK EL CENTRO NAF El Centro CA ELLSWORTH AFB Rapid City SD F. E. WARREN AFB Cheyenne WY FAIRCHILD Spokane WA FALLON NAS Fallon NV FT. BELVOIR Alexandria VA FT. BENNING Columbus GA FT. BLISS El Paso TX FT. BRAGG – NORTH Fayetteville NC FT. BRAGG – SOUTH Fayetteville NC FT. BUCHANAN San Juan Puerto Rico FT. CAMPBELL Ft. Campbell KY FT. CARSON Colorado Springs CO FT. DETRICK Frederick MD FT. DRUM Watertown NJ FT. EUSTIS Newport News VA FT. GILLEM Atlanta GA FT. GORDON Augusta GA FT. GREELY Delta Junction AK FT. HAMILTON New York NY FT. HOOD I Killeen TX FT. HOOD II Killeen TX FT. HUACHUCA Sierra Vista AZ FT. HUNTER-LIGGETT King City CA FT. IRWIN Fort Irwin CA FT. JACKSON Columbia SC FT. KNOX Louisville KY FT. LEAVENWORTH Leavenworth KS FT. LEE Petersburg VA FT. LEONARD WOOD Waynesville MO FT. LEWIS Tacoma WA FT. MCCOY La Crosse WI FT. MCPHERSON Atlanta GA FT. MEADE Laurel MD FT. MONMOUTH Eatontown NJ FT. MONROE Hampton VA
Page 2
Commissary Stores City State/Country Commissary Stores City State/Country
FT. MYER Arlington VA FT. POLK Leesville LA FT. RILEY Junction City KS FT. RUCKER Daleville AL FT. SAM HOUSTON San Antonio TX FT. SILL Lawton OK FT. STEWART Hinesville GA FT. WAINWRIGHT Fairbanks AK GOODFELLOW AFB San Angelo TX GRAND FORKS AFB Grand Forks ND GREAT LAKES NTC Waukegan IL GULFPORT NCBC Gulfport MS GUNTER AFB Montgomery AL HANNAM VILLAGE Seoul South Korea HANSCOM AFB Bedford MA HARIO HOUSING Hario Japan HARRISON VILLAGE Indianapolis IN HICKAM AFB Honolulu HI HILL AFB Ogden UT HOLLOMAN AFB Alamogordo NM HUNTER AAF Savannah GA HURLBURT FIELD Fort Walton Beach FL IMPERIAL BEACH Imperial Beach CA IWAKUNI MCAS Iwakuni Japan JACKSONVILLE NAS Jacksonville FL KADENA AFB Naha Japan KANEOHE BAY MCBH Kaneohe Bay HI KEESLER AFB Biloxi MS KEFLAVIK Keflavik Iceland KEY WEST NAS Key West FL KINGS BAY NSB St. Marys GA KINGSVILLE NAS Kingsville TX KIRTLAND AFB Albuquerque NM KUNSAN AFB Kunsan City South Korea LACKLAND AFB San Antonio TX LAKEHURST Toms River NJ LANGLEY AFB Hampton VA LAUGHLIN AFB Del Rio TX LEMOORE Fresno CA LITTLE CREEK NAB Virginia Beach VA LITTLE ROCK AFB Jacksonville AR LOS ANGELES AFB Los Angeles CA LUKE AFB Phoenix AZ MACDILL AFB Tampa FL MALMSTROM AFB Great Falls MT MARCH ARB Riverside CA MAXWELL AFB Montgomery AL MAYPORT NS Atlantic Beach FL MCCHORD AFB Tacoma WA MCCLELLAN AFB North Highlands CA
MCCONNELL AFB Wichita KS MCGUIRE AFB Wrighttown NJ MEMPHIS NAS Memphis TN MERIDIAN NAS Meridian MS MINOT AFB Minot ND MIRAMAR MCAS San Diego CA MISAWA AFB Misawa Japan MITCHEL FIELD Garden City NY MOFFETT FIELD Mountain View CA MOODY AFB Valdosta GA MTN HOME AFB Mountain Home ID NELLIS AFB Las Vegas NV NEW LONDON Groton CT NEW ORLEANS NSA New Orleans LA NEW RIVER MCAS Jacksonville NC NEWPORT NS Newport RI NORFOLK NAVSTA Norfolk VA NORTH ISLAND NAS San Diego CA OCEANA NAS Virginia Beach VA OFFUTT AFB Bellevue NE ORD MILITARY CMTY Monterey CA OROTE (GUAM) Agana Guam OSAN AFB Osan South Korea PARRIS ISLAND MCRD Beaufort SC PATRICK AFB Cocoa Beach FL PATUXENT NAS Lexington Park MD PEARL HARBOR Honolulu HI PENSACOLA NAS Pensacola FL PETERSON AFB Colorado Springs CO PORT HUENEME Port Hueneme CA PORTSMOUTH NSY Portsmouth NH PORTSMOUTH NNSY Portsmouth VA PUSAN Pusan South Korea QUANTICO MCB Woodbridge VA RANDOLPH AFB San Antonio TX REDSTONE ARSENAL Huntsville AL ROBINS AFB Macon GA ROCK ISLAND AR Rock Island IL ROOSEVELT ROADS NS Ceiba Puerto Rico SAGAMI DEPOT Tokyo Japan SAGAMIHARA Tokyo Japan SAN DIEGO NB San Diego CA SAN ONOFRE San Clemente CA SASEBO Sasebo Japan SCHOFIELD BKS Wahiawa HI SCOTIA Schenectady NY SCOTT AFB Belleville IL SELFRIDGE ANG Mt Clemens MI SEYMOUR JOHNSON Goldsboro NC
Page 3
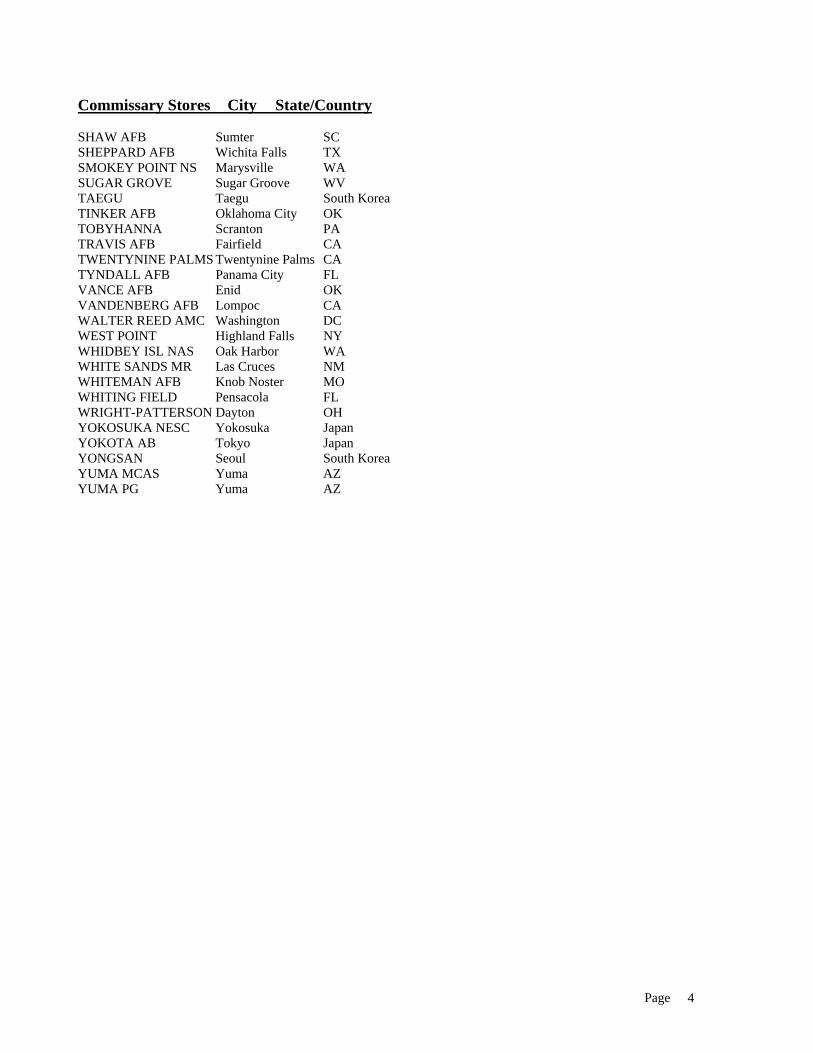
Commissary Stores City State/Country SHAW AFB Sumter SC SHEPPARD AFB Wichita Falls TX SMOKEY POINT NS Marysville WA SUGAR GROVE Sugar Groove WV TAEGU Taegu South Korea TINKER AFB Oklahoma City OK TOBYHANNA Scranton PA TRAVIS AFB Fairfield CA TWENTYNINE PALMS Twentynine Palms CA TYNDALL AFB Panama City FL VANCE AFB Enid OK VANDENBERG AFB Lompoc CA WALTER REED AMC Washington DC WEST POINT Highland Falls NY WHIDBEY ISL NAS Oak Harbor WA WHITE SANDS MR Las Cruces NM WHITEMAN AFB Knob Noster MO WHITING FIELD Pensacola FL WRIGHT-PATTERSON Dayton OH YOKOSUKA NESC Yokosuka Japan YOKOTA AB Tokyo Japan YONGSAN Seoul South Korea YUMA MCAS Yuma AZ YUMA PG Yuma AZ
Page 4
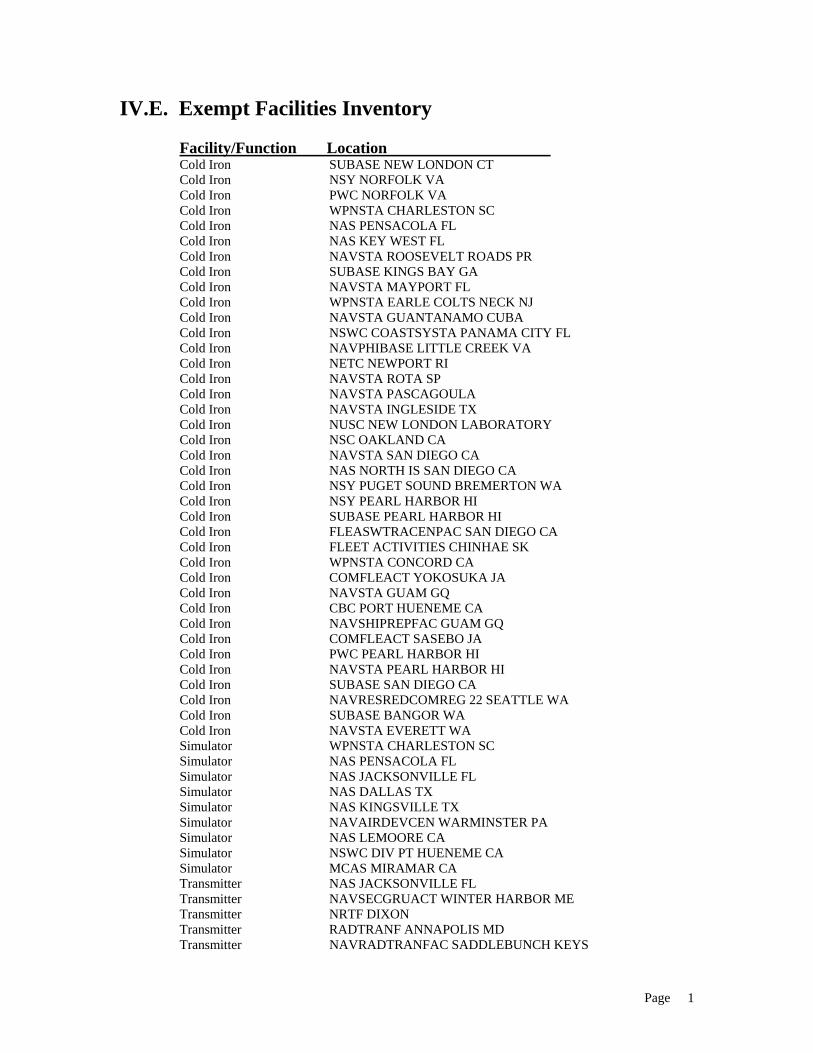
IV.E. Exempt Facilities Inventory
Facility/Function Location Cold Iron SUBASE NEW LONDON CT Cold Iron NSY NORFOLK VA Cold Iron PWC NORFOLK VA Cold Iron WPNSTA CHARLESTON SC Cold Iron NAS PENSACOLA FL Cold Iron NAS KEY WEST FL Cold Iron NAVSTA ROOSEVELT ROADS PR Cold Iron SUBASE KINGS BAY GA Cold Iron NAVSTA MAYPORT FL Cold Iron WPNSTA EARLE COLTS NECK NJ Cold Iron NAVSTA GUANTANAMO CUBA Cold Iron NSWC COASTSYSTA PANAMA CITY FL Cold Iron NAVPHIBASE LITTLE CREEK VA Cold Iron NETC NEWPORT RI Cold Iron NAVSTA ROTA SP Cold Iron NAVSTA PASCAGOULA Cold Iron NAVSTA INGLESIDE TX Cold Iron NUSC NEW LONDON LABORATORY Cold Iron NSC OAKLAND CA Cold Iron NAVSTA SAN DIEGO CA Cold Iron NAS NORTH IS SAN DIEGO CA Cold Iron NSY PUGET SOUND BREMERTON WA Cold Iron NSY PEARL HARBOR HI Cold Iron SUBASE PEARL HARBOR HI Cold Iron FLEASWTRACENPAC SAN DIEGO CA Cold Iron FLEET ACTIVITIES CHINHAE SK Cold Iron WPNSTA CONCORD CA Cold Iron COMFLEACT YOKOSUKA JA Cold Iron NAVSTA GUAM GQ Cold Iron CBC PORT HUENEME CA Cold Iron NAVSHIPREPFAC GUAM GQ Cold Iron COMFLEACT SASEBO JA Cold Iron PWC PEARL HARBOR HI Cold Iron NAVSTA PEARL HARBOR HI Cold Iron SUBASE SAN DIEGO CA Cold Iron NAVRESREDCOMREG 22 SEATTLE WA Cold Iron SUBASE BANGOR WA Cold Iron NAVSTA EVERETT WA Simulator WPNSTA CHARLESTON SC Simulator NAS PENSACOLA FL Simulator NAS JACKSONVILLE FL Simulator NAS DALLAS TX Simulator NAS KINGSVILLE TX Simulator NAVAIRDEVCEN WARMINSTER PA Simulator NAS LEMOORE CA Simulator NSWC DIV PT HUENEME CA Simulator MCAS MIRAMAR CA Transmitter NAS JACKSONVILLE FL Transmitter NAVSECGRUACT WINTER HARBOR ME Transmitter NRTF DIXON Transmitter RADTRANF ANNAPOLIS MD Transmitter NAVRADTRANFAC SADDLEBUNCH KEYS
Page 1
Page 2
Transmitter NAVSECGRUACT SABANA SECA PR Transmitter NAVCOMMSTA JACKSONVILLE FL Transmitter NAVRADSTA /T/ JIM CREEK WA Transmitter NAVSECGRUACT GALETA IS PN Private Party NAS DALLAS TX Private Party NAVCOMMU WASHINGTON DC Private Party NAF EL CENTRO CA Private Party NSWC COASTSYSTA PANAMA CITY FL Private Party COMFLEACT YOKOSUKA JA Private Party NAVOBSY WASHINGTON DC Private Party NAF ATSUGI JA Private Party CBC PORT HUENEME CA Private Party CBC GULFPORT MS Private Party MCAS IWAKUNI JA Private Party PWC PEARL HARBOR HI Private Party NAVSTA ROTA SP Private Party NAS KEFLAVIK IC Private Party NAVCOMMSTA KEFLAVIK IC Private Party DOD SCHOOLS KEFLAVIK ICELAND Private Party HDQTRS 4TH MARDIV NEW ORLEANS Private Party NAVSTA PASCAGOULA M

IV. F. Exhibit A “Format for Reporting Green Energy Purchases To Receive Credit Toward Executive Order Goals”
Page 3