Embed Size (px)
Citation preview
IMPACT OF THE PRACTICE OF SPREADING
MANURE FROM INTENSIVE LIVESTOCK
OPERATIONS
ON GROUNDWATER IN ALBERTA
January 2, 2009
Government
of Alberta
IMPACT OF THE PRACTICE OF SPREADING MANURE
FROM INTENSIVE LIVESTOCK OPERATIONS ON
GROUNDWATER IN ALBERTA
Prepared by:
Hendry Groundwater Sciences
Prepared for Alberta Agriculture, Food and Rural Development
Resource Management and Irrigation Division
Conservation and Development Branch
January 2, 2009
Table of Contents
Executive Summary ...................................................................................................................................... x 1. Introduction and Project Overview ........................................................................................................... 1
1.1. Purpose ........................................................................................................................................1 1.2. The Problem ................................................................................................................................2 1.3. Scope of Work .............................................................................................................................3 1.4. Terminology and Definitions.......................................................................................................3 1.5. References ...................................................................................................................................4
2. Distribution of Livestock Operations and Manure Production Rates ....................................................... 6 2.1. Changes in CFO Production with Time.......................................................................................6
5.2. Irrigation ....................................................................................................................................40 5.3. Soils ...........................................................................................................................................41 5.4. Geologic Controls on the Migration of Water and Contaminants .............................................42 5.5. References .................................................................................................................................45
6. Characteristics of Manure in Alberta ...................................................................................................... 46 6.1. Source Chemistry of Alberta Livestock Manure .......................................................................46
6.1.1. Cattle Feedlot Manure........................................................................................................46 6.1.1.1. Major ions.....................................................................................................................476.1.1.2. Pathogens .....................................................................................................................476.1.1.3. Pharmaceuticals ...........................................................................................................49
6.1.2. Manure Storage Lagoons (Swine, Dairy, Cattle) ...............................................................50
i
2.2. Distribution of Operations ...........................................................................................................7 2.3. Manure Production Rates and Field Application.........................................................................8 2.4. References .................................................................................................................................10
3. Regulatory Frameworks in Alberta and Other Jurisdictions in North America...................................... 11 3.1. Synthesis of Regulatory Frameworks ........................................................................................12
3.1.1. Summary of Requirements.................................................................................................15 3.1.1.1. Permits..........................................................................................................................15 3.1.1.2. Nutrient Management and Other Plans........................................................................16 3.1.1.3. Soil Sampling................................................................................................................16 3.1.1.4. Application Rates and Frequency.................................................................................17 3.1.1.5. Application Procedures ................................................................................................18 3.1.1.6. Setback Requirements...................................................................................................18 3.1.1.7. Groundwater Monitoring..............................................................................................19
3.2. References .................................................................................................................................19 4. Geochemical Controls on Manure Derived N and P in Soils and Groundwaters .................................. 24
4.1. Nitrogen Contamination ............................................................................................................24 4.1.1. Geochemical Controls on Nitrogen....................................................................................25
4.1.1.1. Volatilization ................................................................................................................25 4.1.1.2. Nitrification ..................................................................................................................26 4.1.1.3. Denitrification ..............................................................................................................26 4.1.1.4. Oxygen in the Subsurface and its Controls on Nitrification and Denitrification .........28
4.1.2. Fate of Nitrogen from Manure Spreading ..........................................................................29 4.2. Phosphorous Contamination......................................................................................................32
4.2.1. Geochemical Controls on Phosphorous .............................................................................33 4.2.2. Fate of Phosphorous from Manure Spreading....................................................................34
4.3. References .................................................................................................................................35 5. Physical Controls on the Migration of Contaminants from Manure in the Subsurface ......................... 39
5.1. Climate.......................................................................................................................................39
6.1.2.1. Major ions.....................................................................................................................506.1.2.2. Pathogens .....................................................................................................................526.1.2.3. Pharmaceuticals ...........................................................................................................53
6.1.3. Poultry Manure...................................................................................................................53 6.1.3.1. Major ions.....................................................................................................................546.1.3.2. Pathogens .....................................................................................................................566.1.3.3. Pharmaceuticals ...........................................................................................................56
6.2. Methods of Manure Application................................................................................................57 6.2.1. Injection..............................................................................................................................58 6.2.2. Broadcast............................................................................................................................58
6.3. Timing of Manure Application..................................................................................................59 6.4. Distance from CFO to Manure Application Sites......................................................................59
8.1.1.2. Effect of Irrigation ........................................................................................................938.1.1.3. Effect of soil texture and permeability on N migration ................................................938.1.1.4. Impact of N on regional groundwaters.........................................................................94
8.1.2. Phosphorous Contamination ..............................................................................................94 8.1.2.1. Long-term Fate of P......................................................................................................948.1.2.2. Effect of Irrigation ........................................................................................................968.1.2.3. Effect of soil texture and permeability on P migration.................................................968.1.2.4. Impact of P on regional groundwaters .........................................................................96
8.2. Extent of Subsurface N Contamination .....................................................................................97 8.2.1. Extent of N Contamination in Canada ...............................................................................97 8.2.2. Extent of N Contamination in the United States ..............................................................103
ii
6.5. Rates of Manure Application.....................................................................................................59 6.6. References .................................................................................................................................60
7. Subsurface Contamination in Alberta due to Manure Spreading............................................................ 66 7.1. Subsurface Contamination Studies ............................................................................................66 7.2. Nitrogen Contamination ............................................................................................................67
7.2.1. Long-term fate and effect of irrigation...............................................................................67 7.2.2. Effect of soil texture and permeability ...............................................................................70 7.2.3. Impact on regional groundwaters .......................................................................................74 7.2.4. Implications........................................................................................................................76
7.3. Phosphorus Contamination........................................................................................................77 7.3.1. Long-term fate and effect of irrigation...............................................................................77 7.3.2. Effect of soil texture and permeability ...............................................................................80 7.3.3. Impact on regional groundwaters .......................................................................................82 7.3.4. Implications........................................................................................................................83
7.4. Contamination by Salts..............................................................................................................83 7.4.1. Long-term fate and effect of irrigation...............................................................................83 7.4.2. Effect of soil texture and permeability ...............................................................................84 7.4.3. Impact on regional groundwaters .......................................................................................85 7.4.4. Implications........................................................................................................................85
7.5. Pharmaceuticals .........................................................................................................................85 7.6. Pathogens...................................................................................................................................86 7.7. Extent of Subsurface N Contamination in Alberta ....................................................................87 7.8. Extent of Subsurface P Contamination in Alberta.....................................................................89 7.9. References .................................................................................................................................90
8. Subsurface Contamination in North America due to Manure Spreading................................................ 92 8.1. Subsurface Contamination Studies ............................................................................................92
8.1.1. Nitrogen Contamination.....................................................................................................92 8.1.1.1. Long-term Fate of N .....................................................................................................92
8.3. Extent of Subsurface P Contamination....................................................................................106 8.3.1. Extent of P Contamination in Canada ..............................................................................107 8.3.2. Extent of P Contamination in the United States...............................................................110
8.4. Salts .........................................................................................................................................111 8.5. Pharmaceuticals .......................................................................................................................111 8.6. Pathogens.................................................................................................................................112 8.7. References ...............................................................................................................................113
9. Summary and Implications ................................................................................................................... 118 9.1. Introduction .............................................................................................................................118 9.2. Distribution of Livestock Operations in Alberta .....................................................................118 9.3. The Alberta Regulatory Program.............................................................................................119 9.4. Controls on Groundwater Pollution of N and P Derived from Land Application of Manure .120
B.3.9. South Dakota ...................................................................................................................221 B.3.10. Texas..............................................................................................................................227 B.3.11. Utah ...............................................................................................................................233
B.4 References...............................................................................................................................236 Appendix C. Oxygen in the Subsurface and its Controls on Nitrification and Denitrification................. 241
C.1. Vadose Zones..........................................................................................................................241 C.2. Groundwaters ..........................................................................................................................242 C.3. References...............................................................................................................................245
Appendix D. Geologic Controls on the Migration of Water and Contaminants....................................... 248 D.1. Clay-rich till and lacustrine deposits ......................................................................................248 D.2. Sand layering ..........................................................................................................................251
iii
9.5. Timing of Manure Applications and Rates of Application......................................................120 9.6. Overview of the Natural Controls on Pollutants Derived from Manure..................................121 9.7. Behaviour of Manure-Derived Pollutants in the Alberta Environment ...................................122 9.8. Behaviour of Manure-Derived Pollutants elsewhere in North America..................................123
10. Recommendations............................................................................................................................... 125 10.1. Regulating Land-Based Application Rates of Manure to Minimize Groundwater Pollution125 10.2. Monitoring of Nutrients in Manure and Groundwater...........................................................126 10.3. Research Needs......................................................................................................................127
Appendix A. Maps .................................................................................................................................... 128 A.1. Maps .......................................................................................................................................128 A.2. References...............................................................................................................................154
Appendix B. Details of Regulatory Requirements.................................................................................... 156 B.1. Canada.....................................................................................................................................156
B.1.1. Alberta .............................................................................................................................156 B.1.2. Manitoba..........................................................................................................................160 B.1.3. Ontario.............................................................................................................................166 B.1.4. Quebec.............................................................................................................................174 B.1.5. Saskatchewan ..................................................................................................................179
B.2. United States Federal Regulations ..........................................................................................180 B.3. State Regulations ....................................................................................................................183
B.3.1. Colorado ..........................................................................................................................183 B.3.2. Georgia ............................................................................................................................191 B.3.3. Idaho ................................................................................................................................194 B.3.4. Iowa .................................................................................................................................198 B.3.5. Kansas..............................................................................................................................205 B.3.6. Michigan..........................................................................................................................211 B.3.7. Nebraska ..........................................................................................................................214 B.3.8. North Dakota ...................................................................................................................220
D.3. Topographic effects on water and solute transport .................................................................252 D.4. Effects of diffusion vs. advection of solutes in fractured media.............................................253 D.5. References...............................................................................................................................255
Appendix E. Subsurface Contamination Studies ...................................................................................... 258 E.1. Studies from Alberta ...............................................................................................................258
E.1.1. Materials and Methods.....................................................................................................258 E.1.1.1. Long-term fate of nutrients and effect of irrigation on nutrient migration ................258E.1.1.2. Effect of soil texture and permeability on nutrient migration ....................................260E.1.1.3. Impact of nutrients on regional groundwaters...........................................................261
E.2. Studies from elsewhere in North America ..............................................................................262 E.2.1. Long-term Fate of N ........................................................................................................262
Mg/ha [after Chang and Entz, 1996]........................................................................................................... 68 Figure 7.2. Estimated annual nitrate leaching losses under irrigated sites between 1978 and 1992 [Chang and Entz, 1996]. .......................................................................................................................................... 69 Figure 7.3. Cumulative leaching losses from the irrigated site as influenced by rate of manure application [Chang and Janzen, 1996]........................................................................................................................... 69 Figure 7.4. Nitrate profile in soil after seven years (only last five shown) of manure application at 60 and 120 Mg/ha on a coarse-grained soil (loamy-sand) [after Olson et al., 2003]............................................. 71 Figure 7.5. Nitrate profile in soil after seven years of manure application at 60 and 120 Mg/ha on a site of medium-grained soil (loam to loamy-clay) [after Olson et al., 2003]........................................................ 71 Figure 7.6. Soil extractable NO3-N content at the (a) coarse-textured and (b) medium-textured sites [after Olson et al., 2003]. ...................................................................................................................................... 72
iv
E.2.1.1. Kimble et al. (1972)....................................................................................................262 E.2.1.2. Mathers and Stewart (1974).......................................................................................266 E.2.1.3. Meek et al. (1982).......................................................................................................268 E.2.1.4. Liebhardt et al. (1979) ...............................................................................................270 E.2.1.5. Sharpley et al. (1993) .................................................................................................273 E.2.1.6. Basso and Ritchie (2005) ...........................................................................................275
E.2.2. Long-term Fate of P.........................................................................................................278 E.2.2.1. Eghball et al. (1996)...................................................................................................278 E.2.2.2. Kleinman et al. (2003)................................................................................................280 E.2.2.3. Mathers and Stewart (1974).......................................................................................280 E.2.2.4. Meek et al. (1982).......................................................................................................282 E.2.2.5. Sharpley et al. (1993) .................................................................................................283
E.3. References ...............................................................................................................................284
List of Figures and Maps
Figure 4.1. Flow chart showing the proportion of manure N applied to soil which becomes N available to the crop. Numbers in parenthesis indicates units of N [after Choudhary et al., 1996 and Beauchamp, 1983]. .......................................................................................................................................................... 30 Figure 4.2. Nitrogen cycle: The fate of nitrogen applied as a component of manure fertilizer [after AAFRD, 2004; Chang and Janzen, 1996]................................................................................................... 32 Figure 4.3. Phosphorous cycle: The fate of phosphorus applied as a component of manure fertilizer [after Flaten, 2003]. .............................................................................................................................................. 35 Figure 5.1. Conceptual models of the dominant hydrogeologic scenarios in Alberta. ............................... 44 Figure 5.2. Conceptual models of the effects of depression focused recharge conditions under conditions of (a) fractures not extending to the aquifer and (b) fractures in the till extending to the aquifer (sand or gravel layer or seam or a permeable bedrock). ........................................................................................... 44 Figure 7.1. Nitrate distribution under non-irrigated conditions with manure applications of (a) 30, (b) 60, (c) 90 Mg/ha and under irrigated conditions with manure applications of (d) 60, (e) 120, and (f) 180
Figure 7.7. Mean NO3-N content in the groundwater for the control and manure treatments at the coarse-textured plots [Olson et al., 2003]............................................................................................................... 73 Figure 7.8. Mean NO3-N content in the groundwater for the control and manure treatments at the coarse-textured plots [Olson et al., 2003]............................................................................................................... 74 Figure 7.9. Nitrate concentrations vs. depth in 2001. Different symbols represent different piezometer nests, except for squares that indicate nests represented by a single piezometer [Rodvang et al., 2004]. .. 75 Figure 7.10. Nitrate vs. chloride concentrations in coarse-textured sediments [Rodvang et al., 2004]...... 76 Figure 7.11. Geometric mean nitrate concentrations with time. Bars indicate standard error (SE) of means. The number of wells sampled is shown above the SE lines. Points (dates) with the same letter (a, b) are not significantly different from one another. [after Rodvang et al., 2004]. ................................................ 77 Figure 7.12. Recovery of total P from manure in crop and soil P (to the 150-cm depth) pools in non-irrigated plots receiving annual manure applications of (A) 30, (B) 60, and (C) 90 Mg/ha [Whalen and
Saskatchewan)........................................................................................................................................... 129 Map A3. Livestock Density on Farmland in British Columbia [Statistics Canada, 1996]. ...................... 130 Map A4. Distribution and number of cattle per SLC (Soil Landscape Component) for the Census year 2001 [AAFC, 2003a]. ............................................................................................................................... 131 Map A5. Distribution and number of pigs per SLC (Soil Landscape Component) for the Census year 2001 [AAFC, 2003a]. ............................................................................................................................... 132 Map A6. Annual precipitation in Alberta [AAF, 2007b].......................................................................... 133 Map A7. Annual lake evaporation for Alberta to demonstrate special variability of evapotranspiration [Alberta Environment, 2005]. ................................................................................................................... 134 Map A8. Annual moisture surplus/deficit in millimetres for the assessed agricultural areas of Alberta generated in Land Management Areas from Soil Landscapes of Canada (SLC) v3.0 database [AAFC, 2003b]. ...................................................................................................................................................... 135 Map A9. Ecoregions of Alberta [AAF, 2007b]. ....................................................................................... 136 Map A10. Extent of irrigation in Alberta in hectares generated in Land Management Areas from Soil Landscapes of Canada (SLC) [AAFC, 2003b]. ........................................................................................ 137
v
Chang, 2001]............................................................................................................................................... 79 Figure 7.13. Recovery of P from manure in crop and soil P (to the 150-cm depth) pools in irrigated plots receiving annual manure applications of (A) 60, (B) 120, and (C) 180 Mg/ha [Whalen and Chang, 2001]. .................................................................................................................................................................... 79 Figure 7.14. Soil profile of orthophosphate-P in soil after seven years of manure application rates of 60 Mg/ha and 120 Mg/ha on the coarse-grained plots [after Olson et al., 2003]............................................. 81 Figure 7.15. Soil profile of orthophosphate-P in soil after seven years of manure application rates of 60 Mg/ha and 120 Mg/ha on the medium-grained soil [after Olson et al., 2003]........................................... 81 Figure 7.16. Soil extractable orthophosphate-P in the 0-0.6 m soil layer for the control manure treatments at (a) the coarse-textured site, and (b) the medium-textured site [Olson et al., 2003]. .............................. 82 Figure 7.17. Geometric mean chloride concentrations with time. Bars indicate standard error (SE) of means. The number of wells sampled is shown above the SE lines. Points (dates) with the same letter (a, b) are not significantly different from one another. [after Rodvang et al., 2004]. ...................................... 87 Figure 8.1. Concentration of NO3-N and NH4 -N as affected by poultry manure and soil depth [after Liebhardt et al., 1979]. ................................................................................................................................ 95 Figure 8.2. Proposed pathway of NO3-N from plot receiving poultry manure to drainage ditch [Liebhardt et al., 1979]. ................................................................................................................................................ 95 Figure 8.3. Manure N spread to Canada’s cultivated land, by region (1991–1996) [Environment Canada, 2001]. .......................................................................................................................................................... 99 Figure 8.4. Phosphorous as manure (1991–1996) spread to Canada’s cultivated land, by region [Environment Canada, 2001]. ................................................................................................................... 108 Map A1. Confined feeding operations in Alberta [AAF, 2007a]. ............................................................ 128 Map A2. Livestock Density on Farmland in Alberta and Saskatchewan (from T. Fonstad, University of
Map A11. Extent of irrigation in Alberta showing irrigation districts and locations of private irrigation [AAFRD, 2007]. ....................................................................................................................................... 138 Map A12. Livestock manure production by sub-sub-drainage area for Western Canada in 2001 [Statistics Canada, 2006]. .......................................................................................................................................... 139 Map A13. Risk of groundwater contamination by nitrogen (based on residual nitrogen and climatic conditions) for 1986 and 1991 [AAFC, 2003b]. ....................................................................................... 140 Map A14. Risk of water contamination by nitrogen (based on residual nitrogen and climatic conditions) for 1996 and 2001 [AAFC, 2003b]. .......................................................................................................... 141 Map A15. Available P for dryland annual crops in (a) 1993 to 1997, and (b) 1963 to 1967 [after AAFRD, 2006]. ........................................................................................................................................................ 142 Map A16. Soil P limits for Alberta to reduce contamination of surface body waters with phosphorous from runoff and erosion. Based on a runoff water quality limit of 1.0 ppm total phosphorous [AAFRD,
the Birsay-King field site [Schmidt, 1998]. .............................................................................................. 245 Figure D1. Field determined K values with depth at the King research site, Saskatchewan. The upper 3 m of till is weathered and the underlying 77 m is unweathered. The high K at 15 m BG reflects a sand layer [Harrington et al., 2007]............................................................................................................................ 249 Figure D2. Field determined K values with depth at the Dalmany research site, Saskatchewan [Keller et al., 1988b]. The upper 8-12 m of till is weathered and the mean bulk K is 5x10⁻⁹ m/s. ........................... 251 Figure D3. EPM conditions related to bulk K, fracture spacing and fracture aperture (Case: n=0.3, i = 1.0, D*= 0.01 m2/y) [after GEONET, 2000]. Inclined lines marked as 3, 10 and 30 m separate EPM (lower left) and non-EPM (upper right) conditions for these assumed transport distances. ................................ 254 Figure E1. Annual precipitation (a), average air temperature (b), and pan evaporation (c) for the study period (limited to 1974 to 1998) in semi-arid southern Alberta [Hao and Chang, 2003]. ....................... 259 Figure E2. NO3 distribution with soil depth as influenced by treatments with manure and NH4NO3, from samples collected in the fall of 1970 [Kimble et al., 1972]. .................................................................... 264 Figure E3. NO3 distribution with soil depth as influenced by treatments with manure and NH4NO3, from samples collected in the spring of 1971 [Kimble et al. 1972].................................................................. 264
vi
2006]. ........................................................................................................................................................ 143 Map A17. Estimated N production in livestock manure by sub-sub-basin in Canada. Data from the census year 1996 [Statistics Canada, 2001]. ............................................................................................. 144 Map A18. Risk of water contamination by nitrogen for the Canadian prairies (based on residual nitrogen and climatic conditions) for the year 2001 [AAFC, 2003b]. ................................................................... 145 Map A19. Risk of water contamination by N in southern Ontario (based on residual N and climatic conditions) for the year 2001 [AAFC, 2003b]. ......................................................................................... 146 Map A20. Estimated manure N production from confined livestock operations in 1997 [Gollehon et al., 2001]. ........................................................................................................................................................ 147 Map A21. The risk of ground-water (< 100 feet deep) contamination by NO3 from both agricultural and non-agricultural sources [USGS, 1998; Nolan et al., 1997]. .................................................................... 148 Map A22. Areal distribution of NO3 concentrations in groundwater in the contiguous USA [Madison and Brunett, 1985]. .......................................................................................................................................... 149 Map A23. The modelled concentration of NO3 in groundwater in the United States [Nolan and Hitt, 2006]. ........................................................................................................................................................ 150 Map A24. Estimated Phosphorous production in livestock manure by sub-sub-basin in Canada. Data from the census year 1996 [Statistics Canada, 2001]. .............................................................................. 151 Map A25. Risk of phosphorous contamination due to runoff or erosion from agricultural sources by sub-sub-basin in Quebec [AAFC, 2003b]........................................................................................................ 152 Map A26. Estimated manure P production from confined livestock [Lander et al., 1998]. ..................... 153 Figure C1. Histograms of measured O2 gas and dissolved oxygen concentrations from vadose zone sites (a) and from aquifers (b) [from Wassenaar and Hendry, 2007]............................................................... 242 Figure C2. Vertical redox potential (Eh) vs. depth for selected days between May 1997 and April 1998 at
Figure E4. NO3-N / chloride ratios with soil depth as influenced by treatments with manure and NH4NO3, from samples collected in the fall of 1970 [Kimble et al., 1972]............................................................. 265 Figure E5. NO3-N / chloride ratios with soil depth as influenced by treatments with manure and NH4NO3, from samples collected in the spring of 1971 [Kimble et al., 1972]. ....................................................... 265 Figure E6. NO3-N in the top 180 cm of soil after three corn silage crops as affected by manure rates [Mathers and Stewart, 1974]. .................................................................................................................... 267 Figure E7. Total amount and distribution of NO3-N to 360 cm in the soil as affected by manure rates after three corn silage crops (rates given in metric tonnes, T same as Mg) [Mathers and Stewart, 1974]........ 268 Figure E8. Average and standard deviation of total N, NO3-N, and NH4-N content of the 12 soils untreated and treated with poultry litter [Sharpley et al., 1993]. .............................................................. 274 Figure E9. Cumulative N leached from lysimeters 1 through to 4 in an alfalfa-maize rotation (1994-1999) [Basso and Ritchie, 2005]. ........................................................................................................................ 277 Figure E10. Cumulative N leached from lysimeters 5 through to 8 in an alfalfa-maize rotation (19941999) [Basso and Ritchie 2005]................................................................................................................ 277 Figure E11. Available (sodium bicarbonate-soluble) soil P levels at various soil depth increments for manure and fertilizer treatments. Horizontal bars are standard errors [Eghball et al., 1996]. .................. 279 Figure E12. Mean daily loss (kg/ha) of dissolved reactive P (DRP) and total-P (TP) in leachate for all Buchanan and Hartleton soil columns included in the study. ................................................................... 281 Figure E13. Sodium bicarbonate extractable P after three corn silage crops as affected by manure rates [Mathers and Stewart, 1974]. .................................................................................................................... 282
Table 6.3. Chemistry of cattle manure applied during two long-term studies in Alberta sites. ................. 48 Table 6.4. Average concentrations of feedlot manure from studies conducted in North America (incl. Olsen and Papworth, 2006)......................................................................................................................... 48 Table 6.5. Average swine and cattle manure storage lagoon wastewater concentrations from two Alberta sites. ............................................................................................................................................................ 51 Table 6.6. Average concentration of cattle lagoon wastewater collected from a 10 year old cattle feedlot located in Vegreville, Alberta [Kennedy et al., 1999]. ............................................................................... 51 Table 6.7. Comparison of average nutrient concentrations in swine EMS wastewater from CFO sites in North America. ........................................................................................................................................... 51 Table 6.8. NH4-N variation between swine, dairy and cattle EMS sites..................................................... 52 Table 6.9. Average concentrations of poultry litter and manure from poultry production sites across North America. Results from Edwards and Daniel [1992] incorporate average results from several studies. ..... 55 Table 6.10. Comparison of total-N and P concentrations in swine, cattle and poultry manure, demonstrating the greater concentrations associated with poultry litter (after Hooda et al. [2000]). ........ 55 Table 6.11. Concentration of antibiotics in poultry litter samples from Virginia, United States (after Kumar et al. [2005]).................................................................................................................................... 57
vii
Figure E14. Average and standard deviation of total P, Bray P, and P sorption index of the 12 soils untreated and treated with poultry litter [Sharpley et al., 1993]. .............................................................. 284
List of Tables
Table 2.1. Applications to the land, by province [Statistics Canada, 2001]. ................................................ 9 Table 3.1. Summary of Perceived Costs and Benefits of BMPs [Hilliard et al., 2002]. ............................ 12 Table 3.2. Summary of Requirements in Various Jurisdictions. “Yes” and “No” indicate the program does or does not include, respectively, some aspect of this feature as it relates to land application of animal waste. .......................................................................................................................................................... 14 Table 4.1. Estimated mineralization of manure organic N and availability of total N in the first and second year after application to the soil [after Eghball et al., 2002]....................................................................... 32 Table 6.1. Average annual manure, nitrogen and phosphorous production rates for livestock animals [Statistics Canada, 2006]. ........................................................................................................................... 46 Table 6.2. Average cattle feedlot manure chemistry from several Alberta feedlots. .................................. 48
Table 7.1. IROWC-N risk classes based on nitrate-N concentration in groundwater and total amount of nitrate lost [Lefebvre et al., 2005]............................................................................................................... 88 Table 8.1. Comparison of nutrient (N) loadings to surface water and groundwater from various sources in Canada, 1996 [after Environment Canada, 2001; Chambers et al., 2001]. ................................................ 98 Table 8.2. Summary of NO3-N concentrations in rural wells in Canada [after Environment Canada, 2001; Chambers et al., 2001]. ............................................................................................................................. 100 Table 8.3. IROWC-N risk classes based on NO3-N concentration in water and total amount of NO3 lost [Lefebvre et al., 2005]............................................................................................................................... 102 Table 8.4. Comparison of nutrient (phosphorous) loadings to surface water and groundwater from various sources in Canada, 1996 [after Environment Canada, 2001; Chambers et al., 2001]. ............................. 107 Table B.1. Details of Alberta Regulatory Program [Standards and Practices Regulation 267/2001]....... 157 Table B.2. Limits for nitrate-nitrogen (NO
Table B.16. P application rates based on soil test P concentrations as compared to the site TH.............. 197 Table B.17. Iowa required separation distances (in feet) to buildings or public uses areas by type of manure and method of manure application............................................................................................... 198 Table B.18. Iowa required separation distances (in feet) to designated areas by type of manure and method of manure application................................................................................................................... 199 Table B.19. Iowa required separation distances (in feet) for land application of irrigated liquid manure. .................................................................................................................................................................. 200 Table B.20. Details of Iowa Requirements for Land Application of Manure [567 IAC Ch 65].............. 203 Table B.21. Details of Kansas Swine Waste Management Operations [K.S.A 65-1,182]....................... 206 Table B.22. Details of Kansas Animal Waste Management from Other than Swine Operations [K.A.R.28-18]. .......................................................................................................................................... 209 Table B.23. Details of Michigan Guidance for Agricultural and Management Practices [Generally Accepted Agricultural and Management Practices for Manure Management and Utilization (June 2007)]. .................................................................................................................................................................. 213 Table B.24. Details of Nebraska animal waste management regulations [Nebraska Administrative Code Title 130]................................................................................................................................................... 216
viii
3-N) levels in the top 60 cm of the soil profile. .................... 160 Table B.3. Details of Manitoba Animal Waste Management Regulations [Livestock Manure and Mortalities Management Regulation, Man. Reg. 42/98]........................................................................... 163 Table B.4. Minimum setback distance requirements applicable where livestock manure application on land adjacent to surface water or to a surface watercourse is allowed under Manitoba regulations........ 166 Table B.5. Details of Ontario Animal Waste Management Regulations [Regulation 267/03]. ............... 167 Table B.6. Details of Quebec Animal Waste Management Regulations [Agricultural Operations Regulation]................................................................................................................................................ 175 Table B.7. Charts of Maximum Annual Deposits for all Fertilizers used on a Parcel According to the Crop Grown and Expressed in Kilograms of Total Phosphorus (P2O5) per Hectare. .............................. 178 Table B.8. Details of Animal Waste Management Regulation in Saskatchewan [Agricultural Operations Act Regulations a-12.1 Reg. 1(1996)]. ..................................................................................................... 180 Table B.9. Summary of major manure producing states in 1997 [adapted from www.scorecard.org/env-releases/aw/rank-states.tcl?]...................................................................................................................... 183 Table B.10. Details of Colorado Regulations (except Housed Swine) [General Permit No. COA-931000 and 5 CCR 1002-61]. ................................................................................................................................ 187 Table B.11. Details of Colorado Regulations (Housed Swine) [General Permit No. COA-931000 and 5 CCR 1002-61]. .......................................................................................................................................... 188 Table B.12. Details of Colorado Best Management Practices for AFOs [5 CCR 1002- 81]. .................. 190 Table B.13. Details of Animal Waste Management Regulation for Swine and Non-Swine Operations in Georgia [§391-3-6]. .................................................................................................................................. 192 Table B.14. Details of Idaho Nutrient Management Plan Requirements [NRCS Practice Standard 590 (1999)]. ..................................................................................................................................................... 195 Table B.15. Phosphorus Threshold (TH) concentrations by Resource Concern. ..................................... 197
Table B.25. North Dakota State Requirements for Land Application Facilities other than CAFOs [Control of Pollution from Animal Feeding Operations Chapter 33-16-03.1 (2004)]. ........................................... 220 Table B.26. Details of South Dakota Regulations for Animal Waste Management [SDR Ch 74.54]. .... 223 Table B.27. Details of Animal Waste Management from Large CAFOs in Texas [TPDES General Permit Number TXG920000 and NRCS Practice Standard Code 590.] .............................................................. 228 Table B.28. Discharge from Medium and Small CAFOs in Texas [TPDES General Permit Number TXG920000 Relating to the Discharge of Manure, Litter and Wastewater from CAFO Facilities]. ....... 230 Table B.29. Texas Regulation of Animal Waste Management from Compost Facilities [General Permit No. WQG200000 (October 1, 2002)]. ...................................................................................................... 232 Table B.30. Details of Utah Regulations Relating to Animal Waste Management [General Permit No. UTG080000 (2000)]. ................................................................................................................................ 235
ix
Table E1. Results of a 300 hour incubation study showing NO3-N lost with soil depth as influenced by treatment with manure and NH4NO3 [Kimble et al., 1972]. ..................................................................... 263 Table E2. Average N balance for treatments in 1971, 1972 and 1973 [Meek et al., 1982]. .................... 269 Table E3. Concentrations of NO3-N in the water as affected by poultry manure applications [Liebhardt et al., 1979]. .................................................................................................................................................. 271 Table E4. Concentrations of NH4-N in water as affected by poultry manure application and soil depth [Liebhardt et al., 1979].............................................................................................................................. 272 Table E5.Characteristics of sites in eastern Oklahoma from which soils samples were taken [Sharpley et al., 1993]. .................................................................................................................................................. 273 Table E6. Annual precipitation (mm) for the period 1994-1999 [Basso and Ritchie, 2005]. .................. 275 Table E7. Yearly data (1994-1999) of yield (kg/ha), drainage (mm) and NO3 leaching (kg NO3-N/ha) for each lysimeters treatment [Basso and Ritchie, 2005]. .............................................................................. 276 Table E8. Post-harvest NAHCO3-extractable P in soil samples taken from manure treated plots [Meek et al., 1982]. .................................................................................................................................................. 283
EXECUTIVE SUMMARY
In January 2002 the Alberta Provincial Government assumed responsibility for the regulation of
Confined Feeding Operations (CFOs) when they amended the Agriculture Operation Practices
Act (AOPA). The Natural Resources Conservation Board (NRCB) is the Provincial agency
responsible for the administration of the AOPA. Among the agricultural activities regulated by
the NRCB is the management of animal waste through land application. The NRCB and Alberta
manure.
The literature review conducted for this report was extensive. In the case of the Alberta data, all
available refereed and “grey” literature (non-peer reviewed scientific journal publications) was
used. Because associated literature for the rest of North America can be found in disparate
sources (e.g., scientific literature, government reports, conference proceedings, web-based
reports), our efforts focused on the refereed literature for other jurisdictions. The aim of
x
Agriculture and Food are aware land application of manure may pose a risk to groundwater
resources, but are uncertain of the extent to which this activity is having or could be having an
impact on the groundwater environment.
The objective of this study was to complete a comprehensive literature review on impacts
livestock manure application may have on groundwater quality within the major livestock
producing regions of North America. In addition, the report identifies mitigation, monitoring,
and research that may be necessary to assess the effect of livestock manure application on this
resource.
This report provides two perspectives on the issues associated with land application and
groundwater in Alberta: a review of comparative regulations throughout North America to
understand how various jurisdictions manage the risk to groundwater from land application of
manure; and a review of scientific literature in Alberta and North America to assess the extent of
present and future groundwater impacts from land application of manure. The report summarizes
key findings from both perspectives. The report concludes with recommendations for mitigation,
monitoring, and additional research in Alberta pertaining to: regulations applicable to land
application rates; monitoring of land application areas both on an individual and regional basis;
and additional information needed to manage the risks to groundwater from land application of
applied. Some jurisdictions base application rates on the mass of P (e.g., Idaho) or P + N (e.g., Manitoba) in the soil profiles; others base their application rates on the N (e.g., North Dakota) or P (e.g., Ontario) required for plant uptake.
reviewing the non-Alberta literature was to obtain information that either supported or refuted
the findings of the Alberta literature or that added a new dimension to the Alberta literature. The
literature review demonstrates the long-term manure application studies conducted in southern
Alberta provide the clearest insights into the impacts of manure application on soils and
groundwater of all studies reviewed. A detailed list of key observations from the literature
reviews is presented in the report. Key observations include:
1. Land application of manure derived from commercial feedlots is the dominant form of manure disposal in Alberta and can contribute pollutants to the groundwater environment. The primary pollutants associated with animal wastes are nitrogen (N) compounds, specifically nitrate (NO
2.
3.
4. While Alberta’s manure application procedures are not as detailed as other jurisdictions (e.g., Ontario) and procedures for applying manure to frozen land are not as prescriptive as other jurisdictions (e.g., Quebec), Alberta regulations have more specific limits relating to application on slopes in irrigated areas.
5. For most Alberta soils, consistent annual manure applications in excess of crop uptake requirements leads to the accumulation of N within the soil profile and potential groundwater pollution. Long-term Alberta research studies show continued land application of manure under current application rates is not sustainable over the long term. The potential exists in Alberta for increased groundwater contamination under current application rates.
xi
3), which can readily leach through the soil and into the groundwater and as such is a major potential groundwater contaminant. In many cases, the movement of phosphorus (P) through the soil profile and into groundwater can be considered negligible because it is removed from the aqueous phase by geochemical reactions with the solids phases. Although Alberta regulations identify salt loading limits, salts present in manure can build up in the soil. The impact of antibiotics, pathogens, pesticides, and hormones derived from land-applied manure on groundwater quality is not clear; they may also prove to be pollutants of concern.
Most land application of manure is performed very close to production areas. As such, the areas of concentrated CFOs in Alberta (i.e., around Lethbridge, between Calgary and Edmonton, and north of Edmonton) may define the areas of greatest groundwater vulnerability to pollution from manure application.
When compared to other jurisdictions, the Alberta regulatory program is neither the most stringent nor the most lenient. Alberta (like most other jurisdictions) requires agency authorization for land application of manure and the preparation of a comprehensive plan for management of nutrients from animal wastes. Alberta bases its land-application rates for manure on the NO3 levels in the top 60 cm of the soil profile, depending on the type of soil. This approach (i.e., mass of N present in the soil profile) is not universally
6. As Alberta hosts approximately 50% of the national beef cattle herd and close to 33% of the beef farms, and with significant projected growth in the size of beef cattle operations, the extent of groundwater contamination from land-applied manure in Alberta could be exacerbated due to the addition of excessive manure to a limited, local, land base.
7. Shallow sandy aquifers are the most sensitive to groundwater pollution, followed by the fine-textured tills and clay systems in which open fractures extend from near surface to an underlying aquifer. In Alberta, the prevalence of clay-rich till and lacustrine deposits over much of the landscape and the lack of extensive shallow aquifer systems suggest geologic conditions are not “highly” sensitive to groundwater contamination. However,
report. Key recommendations include:
1. Consideration should be given to altering the regulations defining the land-based application rates of manure to minimize groundwater pollution by NO3.
Research suggests application rates based on P instead of N provide a more conservative and
predictable method of control. Other jurisdictions have already made this switch (e.g., Iowa).
Alternately, the risk of excessive N build-up in the soil and pollution of groundwater could be
minimized by reducing the recommended manure application rates to better represent N crop
experience suggests fractures are common in these clay-rich sediments in Alberta and they extend deep into these sediments. These fractures can increase the potential for rapid migration of pollutants to greater depths and into underlying aquifers.
Based on available data, areas of additional research specific to conditions in Alberta are
recommended. Key areas to consider include the development of more information about manure
characteristics, site geological conditions of the land application areas, and long-term
groundwater impacts from existing sites. Specifics of the recommendations are presented in the
requirements.
A workshop should be organized to review our current understanding of the impact of manure
loading on soils and groundwaters and options for determining the best (in terms of soil loading
and groundwater pollution) method to regulate manure application rates. The meeting should
include stakeholders (e.g., operators, Alberta Environment, Alberta Agriculture Food and Rural
Development, and NRCB). Data presented in the current report could provide the background for
such a meeting. Questions that should be discussed include: (1) should manure application rates
be based on N requirements of crops, rather than residual N in the soil and if so, how will those
rates be calculated; (2) should manure application rates be based on P requirements of crops,
rather than N, and if so, how would those rates be calculated? and (3) should any other controls
xii
be considered? This discussion should consider the risk of over-application under the current N-
based system.
2. Monitoring of nutrients in manure and groundwater should be undertaken.
Alberta does not require sampling and analyses of manure and wastewater for nutrients prior to
land application. Thus, nutrient availability in manure on a case-by-case basis is not known. This
limits the ability to develop accurate nutrient management plans. Although generalized data are
available re the chemical characteristics of manure, nutrient analyses of land applied manure
difficult. As a result, the government should establish and monitor a network of research wells to
determine long-term (10+ years) changes in groundwater quality under representative fields
subject to long-term application of manure. To provide data on background conditions, research
wells should also be located in areas where manure is not applied.
Operators should install sentinel wells in fields receiving manure. The quality of the groundwater
collected from these wells should be routinely monitored. These wells would provide field-
specific data on groundwater contamination from manure application as well as province-wide
data on the health of the groundwater under fields receiving manure. When used in conjunction
should be established to improve the nutrient management plan.
Research demonstrates land application of manure has a detrimental effect on the quality of
shallow groundwaters. However, the long-term effects of manure application on groundwater
quality are not clear. Without long-term groundwater quality data, assessing the impact of
changes in manure application rates (see above) on the long-term groundwater quality will be
with available geologic, climatic, precipitation/irrigation, manure application rate (and nutrient
chemistry; see above) information, these data could also be used assess the impact(s) of manure
application rates on groundwater quality regionally throughout the province. As is the case for
long-term monitoring wells, installing wells upgradient of the sentinel wells to provide data on
background conditions would be advantageous.
Contamination of soil and groundwater by pathogens and pharmaceuticals, including antibiotics
and growth hormones, is a poorly understood area of the scientific literature. Given the lack of
research currently being conducted and the growing concern of the public with respect to the
potential effects of these compounds in the environment, investigation of these potential
xiii
contaminants would be prudent. Thus, a monitoring program should be established to assess the
impact of these compounds on groundwaters. This could be addressed by analyzing for the
presence of selected parameters in the network of long-term research wells, as discussed above.
3. Research needs
Long-term research studies have proven invaluable in assessing the impacts of manure on soils
and groundwaters near Lethbridge. Similar research studies should be established in other high-
impact regions of the province. Data from these studies will allow the long-term impact of
manure on soils and groundwaters to be assessed as well as providing sound data to refine
manure management strategies.
Fractured glacial tills and lacustrine deposits dominate the near-surface landscape of Alberta.
critical to developing manure application rates in these geologic media, but they not well
understood. Research should be conducted to determine the impact of these conditions on the
downward migration of manure to the groundwater regime and to assess what, if any, of these
conditions may be identified as a primary risk control for manure management.
Understanding the hydrologic and hydrogeologic conditions controlling the downward migration
of water and pollutants derived from manure to the groundwater through these fractured media is
xiv
(unconfined and confined) aquifers, deep aquifers].
1. INTRODUCTION AND PROJECT OVERVIEW
1.1. Purpose
In January 2002, the Provincial Government of Alberta assumed responsibility for the regulation
of confined feeding operations (CFOs) when they amended the Agriculture Operation Practices
Act (AOPA). The Natural Resources Conservation Board (NRCB) is the Provincial agency
responsible for the administration of AOPA, and provides producers and other stakeholders with
a one-window process for new or expanding confined feeding operations. The legislation ensures
of the risk these releases pose or could pose to the groundwater environment.
The objective of this project is to complete a comprehensive literature review that assesses the
extent to which liquid and solid manure spreading has had an impact on groundwater quality in
Alberta and other relevant jurisdictions in Canada and the United States.
To meet the objective, specific aspects of groundwater contamination from the application of
manure to ground surface will be addressed, including:
1. Assessing the relative size and intensity of confined feeding operations in the various jurisdictions, and relating those to the Alberta scenarios.
that manure management standards are met for intensive agricultural operations, including the
livestock facilities, storage lagoons, and the lands on which manure is spread.
The NRCB and Alberta Agriculture and Food are aware that the application of manure to lands is
releasing manure constituents into shallow groundwater resources but are uncertain of the extent
2. Identifying and categorizing specific impacts on groundwater systems [shallow
3. Identifying the groundwater contaminants resulting from manure spreading practices in the jurisdictions being studied.
4. Identifying the restrictions and requirements that the above jurisdictions place on manure spreading to address groundwater contamination.
5. Characterizing factors (e.g., soils, climate, geology, application practices, timing of applications) that may contribute to or mitigate/ impede releases to groundwater.
6. Assessing impacts of manure application at agronomic rates on groundwater quality.
1
7. Assessing, where possible, potential future impacts of continued manure spreading on groundwater quality.
8. Defining impacts of manure application on the quality of groundwater resources (human and livestock drinking water).
9. Summarizing available research on best management practices for reducing impacts of manure spreading on groundwater resources.
10. Providing recommendations for further research, monitoring and mitigation work as required to address these issues.
1.2. The Problem
Land application of manure is of concern because this practice has the potential to contribute
pollutants to the groundwater environment. The primary pollutants associated with animal wastes
having the potential to affect groundwater include nitrogen (N) compounds and phosphorus (P).
Comparison of chemistry data associated with manure (presented in Chapter 6) with the
maximum acceptable concentration (MAC) suggests nitrate (NO3) is a contaminant of concern
with respect to groundwater impacted by manure. As established by the Federal-Provincial-
Territorial Committee on Drinking Water, the MAC for nitrate in drinking water is 45 mg/L (or
10 mg/L nitrate-nitrogen (NO3-N)) [Guidelines for Canadian Drinking Water Quality, 2006].
The MAC for NO3 in drinking water of 45 mg/L was derived from the no-observed-adverse
effect level (NOAEL) for infantile methemoglobinemia (cyanosis or “blue baby syndrome”) of
45 mg/L. Recommendations for NO3 in drinking water for mature livestock are commonly < 100
mg/L [Alberta Environment, 1999] with recommendations for young animals similar to those for
infants.
P is not included in the Guidelines for Canadian Drinking Water Quality [2006]. It is, however,
defined as a chronic nutrient in surface waters in Alberta when present in concentrations (as P)
greater than 0.05 mg/L [Alberta Environment, 1999] and may be a threat to surface waters at
concentrations exceeding 100 parts per billion (μg/L) [US EPA Office of Water, 1997].
Additional pollutants associated with animal wastes with the potential to affect groundwater
include organics, antibiotics, pathogens, pesticides, and hormones. Fecal bacteria in manure
could contaminate groundwater if waste seeps into nearby wells, causing such infectious diseases
2
as dysentery, typhoid and hepatitis. Organic materials, which may lend an undesirable taste and
odour to drinking water, are not known to be dangerous to health, but their presence suggests
other contaminants may be migrating in the groundwater.
The extent to which liquid and solid manure spreading has had an impact on groundwater quality
in Alberta and other relevant jurisdictions in Canada and the United States is not clear. However,
concern regarding potential impacts on groundwaters is increasing; as the animal population
grows in Canada, so too does the pressure for additional land application. Statistics Canada
The scope of work for this report included a review of relevant regulations, guidance, and
technical literature relating to the impacts of manure application on groundwater resources. The
scope does not address groundwater contamination from manure storage and collection facilities;
this topic was addressed in an earlier report by Hendry et al. [2007].
The literature review conducted for this report was extensive. In the case of Alberta data, all
available refereed and “grey” literature (non-peer reviewed scientific journal publications) was
used. Associated literature for the rest of North America can be found in disparate sources (e.g.,
reported that Canadian livestock in 1996 produced an estimated 361 million kilograms of manure
daily, equal to over 132 billion kilograms annually [Statistics Canada, 1996]. In 1996, five areas
in Canada were identified as having high concentrations exceeding 2,000 kilograms of manure
per hectare of total land [Statistics Canada, 1996]. These clusters include central and southern
Alberta, where 40% of Canada’s beef cattle industry is located.
1.3. Scope of Work
scientific literature, government reports, conference proceedings, web-based reports), and
therefore in those jurisdictions we focused our efforts on the refereed literature and only used the
grey literature to a limited extent.
1.4. Terminology and Definitions
Definitions of the key terms and abbreviations used in this report were taken or adapted from the
AOPA and its implementing regulations [Alberta Standards and Administration Regulation,
2006]. In the discussion of other jurisdictions, words and phrases may differ from those used in
Alberta; these alternative definitions are provided when used.
3
feedlot pen and a catch basin where manure collects, but does not include the floor of a livestock
Agricultural Operations Practices Act (AOPA).
Alberta Natural Resources Conservation Board (NRCB).
Best Management Practices (BMPs). Unless otherwise noted, refers to voluntary operational activities that have been identified or recommended as preferred practices.
Concentrated Animal Feeding Operation (CAFO).
Confined feeding operation (CFO) means fenced or enclosed land or buildings where livestock are confined for the purpose of growing, sustaining, finishing or breeding by means other than grazing and any other building or structure directly related to that purpose but not including
manure storage facility that is being used as a water supply for the purposes of domestic use, or if no aquifer exists that is being used as a water supply for domestic use, an aquifer that has a sustained yield of 0.76 L/min or more and a total dissolved solids concentration of 4000 mg/L or less as determined by well records, well drilling logs, hydrogeological maps, hydrogeological reports or other evidence satisfactory to an approval officer or the Board or, if there is more than one aquifer that meets these requirements, the aquifer that an approval officer or the Board considers to be the best suited for development as a water supply for the purposes of domestic use.
Livestock means poultry, cattle, or swine.
Manure means livestock excreta, associated feed losses, bedding, litter, soil and wash water.
Manure collection area mean the floor of a barn, the under-floor pits of a barn, the floor of a
residences, livestock seasonal feeding and bedding sites, equestrian stables, auction markets, race tracks or exhibition grounds.
General Permit is a generic permit issued by a regulatory agency that applies to a specific class of activities. A person may be authorized to conduct the activity by agreeing to comply with the General Permit and no individual permit will be required.
Groundwater resource means an aquifer below the site of a concentrated feeding operation or a
corral.
Manure storage facility means a facility for the storage of manure, composting materials and compost, and a facility for composting, but does not include such a facility at an equestrian stable, an auction market, a race track or exhibition grounds.
Nutrient Management Plan (NMP).
Solid manure means manure that is 20% or more solid matter and that does not flow when piled.
1.5. References
Alberta Environment, 1999, Surface water quality guidelines for use in Alberta, Environmental Assurance Division. Publication No. T/483, http://environment.gov.ab.ca/info/library/5713.pdf, November 1999.
4
Alberta Standards and Administration Regulation 267/2001 consolidated up to 306/2006. Guidelines for Canadian Drinking Water Quality, 2006, www.healthcanada.gc.ca/waterquality. Hendry, M.J., Shaw, S., Barbour, S.L., Salamone, T.B., and Fonstad, T., 2007, Impact of manure
collection and storage facilities in groundwater in Alberta: Alberta Agriculture, Food and Rural Development. 175 pp.
Statistics Canada, 1996, A Geographical Profile of Manure Production in Canada, Catalogue No. 16F0025XIB.
US EPA Office of Water, 1997, Voluntary Stream Monitoring: A Methods Manual, EPA 841-B97-003.
5
2. DISTRIBUTION OF LIVESTOCK OPERATIONS AND MANURE PRODUCTION RATES
2.1. Changes in CFO Production with Time
In general, the animal population in Canada is increasing. In 2004, the national beef cattle
population was 14.6 million head, up 39% since 1990. The national dairy cow population is in
decline, decreasing 29% since 1990 to 1.1 million head in 2004. This has occurred because milk
production per cow has increased, allowing national milk production to increase slightly, despite
a declining dairy cow population. Statistics Canada [2003b] reports an overall increase in cattle
average numbers of cattle per farm increased from 105 in 1996 to 127 in 2001 as feedlots have
become more prevalent [Statistics Canada, 2003b].
The swine population has also increased. According to Statistics Canada [2004], the number of
pigs in Canada increased to 14.0 million in 2001, up 37% since 1991. A few larger producers
started up during the 1990s, some producers expanded, and some smaller operations went out of
business. 14,000 fewer farms reported pigs in 2001 than in 1991. The average hog farm nearly
tripled in size during that period, to 902 animals. A more recent report confirms this increasing
trend in Alberta; Statistics Canada [2007b] reports an increase in the number of swine in Alberta
(beef and dairy) production of 4.4% on Canadian farms between 1996 and 2001. Most of this
increase occurred in Alberta, with an increase 673,000 (11.4%) cattle from 1996 and 2001.
Alberta accounts for 6.5 million (43%) of the national herd followed by Saskatchewan with 3.1
million (<20%). A further increase from 6.5 million to 6.7 million occurred between 2001 and
2005 and has declined to just under 6.5 million as of 2007 [Statistics Canada, 2007a]. The
from 1.9 million in 2000 to 2.0 million in 2007, or an increase of 7.3%. This increase coincided
with a very large decrease in the number of swine operations, resulting in an increase in number
of swine per farm in Alberta from 588 in 2000 to 1,092 in 2007.
The total poultry population (layers, broilers and turkeys) in Canada is also increasing, up 33%
since 1990 to 154.8 million head in 2004 [Statistics Canada, 2004]. For Alberta, available data
for poultry production showed a slight decrease in the number of birds (56.5 down to 55.5
million) from 2000 to 2006. No numbers were obtained for the trend in farm sizes for poultry
production [Statistics Canada, 2007c].
6
2.2. Distribution of Operations
Approximately 121,000 farms report livestock in Canada [Statistics Canada, 2003a] ranging
from small scale mixed family farms to large scale specialized industrial farms.
The animal population in Canada is not evenly distributed. The beef cattle industry is located
predominantly in the Prairie Provinces, especially Alberta, where 40% of the population resides.
According to Statistics Canada [2004], Alberta has about half of the national beef cattle herd,
and close to one-third of the beef farms. Alberta, Saskatchewan, Manitoba, and Ontario together
In contrast, the dairy industry is concentrated in Ontario and Québec, which contain 75% of the
dairy cows in the country [Statistics Canada, 2004]. Similarly, the pork and poultry industries are
predominantly found in Ontario and Québec where 55 and 60%, respectively, of the populations
reside [Statistics Canada, 2004]. In 2001, Québec and Ontario had more than half of all the hogs
in Canada.
The majority of CFOs in Alberta are located in the corridor between Lethbridge and Edmonton.
Three areas of concentrated CFOs exist in Alberta: around Lethbridge, between Calgary and
Edmonton, and north of Edmonton. In Saskatchewan, the distribution is relatively uniform across
the southern part of the province. The dominant concentration of CFOs in British Columbia is in
the Vancouver-Abbotsford region. Maps A1-A3 (Appendix A) depict livestock density in
western Canada.
Whalen et al. [2002] report the 4800 cattle feed lots found in Alberta have the capacity to feed
1.2 million cattle per year. In Alberta, the greatest concentration of cattle occurs in the south,
specifically north of Lethbridge (Map A4). As of 2003, the County of Lethbridge contained
699,246 feedlot cattle, 14,760 dairy cattle, and 3,424 cow/calf within 3,080 km2 [Olson et al.,
2003], yielding an average of 23.3 animals/ha.
7
account for more than 80% of Canada’s beef farms and beef cattle. In 1991, the average beef
cattle farm in Canada had 115 head; 10 years later, the average had increased to 163. Most of the
growth was in Alberta, which had 1.8 million more cattle in 2001 than in 1991. In these Prairie
regions, improved and unimproved pasture is more available during the warmer months for
grazing, whereas the land available for grazing in eastern Canada is more limited.
Swine feedlots are most prevalent in central and southern Alberta (Map A5). The number of
swine per region is typically smaller than cattle throughout the province. In the County of
Lethbridge, for example, swine were found at an average of 2.3 animals/ha (calculated from data
in Olson et al. [2003]), equivalent to less than 10% of the cattle population in 2003.
According to the United States Department of Agriculture [2001], the number of potential CAFO
operations in the United States more than doubled from 1982 to 1997, increasing from about
5,000 to 11,200 (up 124%), or from 1 to 5 percent of all operations. During the same period, the
generate in excess of 140 Tg of manure annually [Methane to Markets Partnership, 2006].
Similarly, Statistics Canada [1996] reported that Canadian livestock in 1996 produced an
estimated 361 million kilograms of manure daily, equal to over 132 billion kilograms annually.
In 1996, five areas in Canada were identified as having elevated mass levels, exceeding 2,000
kilograms of manure per hectare of total land [Statistics Canada, 1996]. These clusters were
located in central and southern Alberta, southern Manitoba, southern Ontario, southeastern
8
number of animal units (AU) on these farms almost doubled from 9.1 million (30% of total
confined AU) to 18.0 million (54%). Nationally, the average number of AU on each potential
CAFO did not increase over the period. The gain in AUs on potential CAFO farms was
attributed entirely to the increase in the number of potential CAFO operations. The distribution
of potential CAFO farms by animal type underwent substantial change from 1982 to 1997. The
share of feedlot beef operations declined from 47 to 17% of potential CAFO farms, and swine
and poultry experienced growth, from 21 to 39% and 24 to 33%, respectively. The poultry sector
experienced the smallest decline in farm numbers over 1982 to 1997, and again, smaller farms
dominated; almost 90 percent of confined poultry farms had fewer than 300 AU. The greatest
numbers of confined animals are located in a band from southeastern New Mexico through the
Plains States to eastern Nebraska and then eastward through Iowa to the Great Lakes. Other areas
with large numbers of confined animals include the Northeast, mid-Atlantic, California’s
southern Central Valley, western Arkansas, and far Northwest areas. Almost every State has at
least 1 county with more than 10,000 AUs.
2.3. Manure Production Rates and Field Application
The 121,000 farms reporting livestock in Canada [Statistics Canada, 2003a] are estimated to
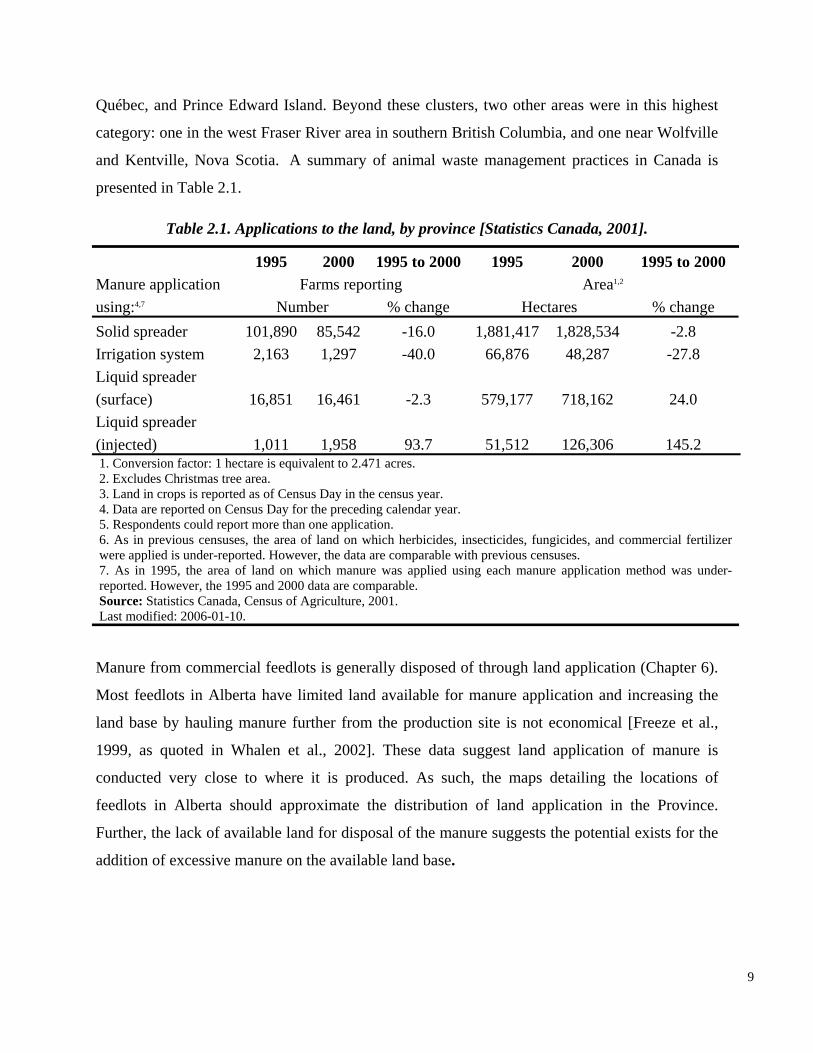
Québec, and Prince Edward Island. Beyond these clusters, two other areas were in this highest
category: one in the west Fraser River area in southern British Columbia, and one near Wolfville
and Kentville, Nova Scotia. A summary of animal waste management practices in Canada is
presented in Table 2.1.
Table 2.1. Applications to the land, by province [Statistics Canada, 2001].
1995 2000 1995 to 2000 1995 2000 1995 to 2000 Manure application Farms reporting Area1,2
using:4,7 Number % change Hectares % change Solid spreader 101,890 85,542 -16.0 1,881,417 1,828,534 -2.8 Irrigation system 2,163 1,297 -40.0 66,876 48,287 -27.8 Liquid spreader (surface) 16,851 16,461 -2.3 579,177 718,162 24.0 Liquid spreader (injected) 1,011 1,958 93.7 51,512 126,306 145.2 1. Conversion factor: 1 hectare is equivalent to 2.471 acres. 2. Excludes Christmas tree area. 3. Land in crops is reported as of Census Day in the census year. 4. Data are reported on Census Day for the preceding calendar year. 5. Respondents could report more than one application. 6. As in previous censuses, the area of land on which herbicides, insecticides, fungicides, and commercial fertilizer were applied is under-reported. However, the data are comparable with previous censuses. 7. As in 1995, the area of land on which manure was applied using each manure application method was under-reported. However, the 1995 and 2000 data are comparable. Source: Statistics Canada, Census of Agriculture, 2001. Last modified: 2006-01-10.
Manure from commercial feedlots is generally disposed of through land application (Chapter 6).
Most feedlots in Alberta have limited land available for manure application and increasing the
land base by hauling manure further from the production site is not economical [Freeze et al.,
1999, as quoted in Whalen et al., 2002]. These data suggest land application of manure is
conducted very close to where it is produced. As such, the maps detailing the locations of
feedlots in Alberta should approximate the distribution of land application in the Province.
Further, the lack of available land for disposal of the manure suggests the potential exists for the
addition of excessive manure on the available land base.
9
2.4. References
Freeze, B., Heigh, J., Larney, F.J., and Olson, A.F., 1999, Economics of windrow composting and land application of manure. In: Proc. Manure Management ’99, pp. 311-320, Saskatoon, SK, Canada, June 22-25, 1999.
Methane to Markets Partnership – Canada Profile for Animal Waste Management (November 2006): http://www.methantomarkets.org/resources/ag/docs/canadaprofile.pdf
Olson, D.M., McKenzie, R.H., Bennett, D.R., Ormann, T., and Atkins, R.P., 2003., Manure application effects on soil and groundwater quality under irrigation in southern Alberta, Alberta Agriculture, Food and Rural Development, Lethbridge, Alberta, Canada.
Statistics Canada, 1996, Census of Agriculture. Statistics Canada, 2001, Census of Agriculture. Statistics Canada, 2003a, Census of Agriculture. Statistics Canada, 2003b, Livestock, Accessed: February 5, 2008,
http://www.statcan.ca/english/agcensus2001/first/farmop/03livestock.htm Statistics Canada, 2004, Canadian Agriculture at a Glance 96-325-XPB, June, 2004. Statistics Canada, 2007a, Cattle Statistics, 2007, Catalogue no. 23-012-XIE. Statistics Canada, 2007b, Hog Statistics, 2007, vol. 6 no. 1, Catalogue no. 23-010-XIE. Statistics Canada, 2007c, A Poultry and Egg Statistics July to September 2007, Catalogue no. 23
015-X. United States Department of Agriculture (USDA), 2001, Confined Animal Production and
Manure Nutrients (Chapter 3), 2001-06-26, http://www.ers.usda.gov/publications/aib771/aib771e.pdf
Whalen, J.K., Chang, C., and Clayton, G.W., 2002, Cattle manure and lime amendments to improve crop production of acidic soils in northern Alberta: Canadian Journal of Soil Science 82, 227-238.
10
3. REGULATORY FRAMEWORKS IN ALBERTA AND OTHER JURISDICTIONS IN NORTH AMERICA
The regulations and guidance in various jurisdictions, including Alberta, that relate to the
protection of groundwater from the land application of animal waste are summarized in this
chapter. Specifics of each jurisdiction are presented in Appendix B, including a general summary
of the regulatory program followed by a table summarizing details that relate to groundwater
protection. The summary includes regulations or guidance associated with land application areas
• Nutrient Management – a management practice that seeks to apply only the amount of plant nutrient that is required to make up the difference between what is available to plants in the field and what is required to produce a target yield. This is typically addressed through application rates, fertilizer timing, soils analysis, size of application area, and recognizing the variation in nutrients in manure.
and does not include regulations specific to the production area. In many cases the regulations
and guidance do not specifically require groundwater monitoring as a way of assessing potential
impacts to groundwater from land application but do provide for other practices such as site-
specific application rates that may provide some protection.
The selected jurisdictions represent areas with high manure production and geological features
similar to Alberta or jurisdictions with regulations specific to the protection of groundwater. In
Canada, the jurisdictions considered were Alberta, Manitoba, Ontario, Québec and
Saskatchewan. In the United States, the jurisdictions considered include the federal program
(which is generally authorized to the states), and the state programs in Colorado, Georgia, Idaho,
Iowa, Kansas, Michigan, Nebraska, North Dakota, South Dakota, Texas and Utah.
The activities specifically identified for each jurisdiction were selected based on their relevance
to potential groundwater protection from land application of animal waste. These activities
generally fit into the categories of “Agricultural Best Management Practices” (or BMPs)
previously identified for the Canadian Prairies [Hilliard et al., 2002]. BMPs were defined as “…a
practice or combination of practices for preventing or reducing non-point source pollution” [Id.
at p. 5], although some BMPs would also provide protection of groundwater. The following
BMPs relating to land application of wastes were considered:
11
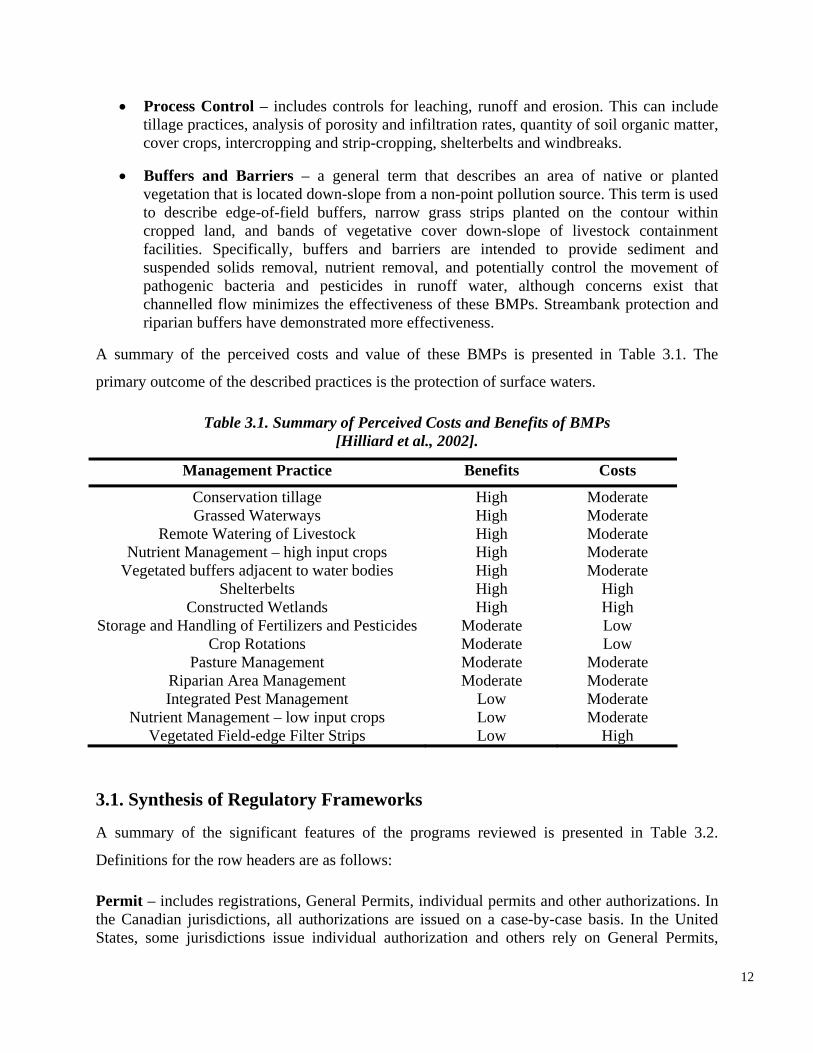
channelled flow minimizes the effectiveness of these BMPs. Streambank protection and riparian buffers have demonstrated more effectiveness.
A summary of the perceived costs and value of these BMPs is presented in Table 3.1. The
primary outcome of the described practices is the protection of surface waters.
Table 3.1. Summary of Perceived Costs and Benefits of BMPs
• Process Control – includes controls for leaching, runoff and erosion. This can include tillage practices, analysis of porosity and infiltration rates, quantity of soil organic matter, cover crops, intercropping and strip-cropping, shelterbelts and windbreaks.
• Buffers and Barriers – a general term that describes an area of native or planted vegetation that is located down-slope from a non-point pollution source. This term is used to describe edge-of-field buffers, narrow grass strips planted on the contour within cropped land, and bands of vegetative cover down-slope of livestock containment facilities. Specifically, buffers and barriers are intended to provide sediment and suspended solids removal, nutrient removal, and potentially control the movement of pathogenic bacteria and pesticides in runoff water, although concerns exist that
[Hilliard et al., 2002].
Management Practice Benefits Costs
Conservation tillage High Moderate Grassed Waterways High Moderate
Remote Watering of Livestock High Moderate Nutrient Management – high input crops High Moderate
Vegetated buffers adjacent to water bodies High Moderate Shelterbelts High High
Constructed Wetlands High High Storage and Handling of Fertilizers and Pesticides Moderate Low
Crop Rotations Moderate Low Pasture Management Moderate Moderate
Riparian Area Management Moderate Moderate Integrated Pest Management Low Moderate
Nutrient Management – low input crops Low Moderate Vegetated Field-edge Filter Strips Low High
3.1. Synthesis of Regulatory Frameworks
A summary of the significant features of the programs reviewed is presented in Table 3.2.
Definitions for the row headers are as follows:
Permit – includes registrations, General Permits, individual permits and other authorizations. In the Canadian jurisdictions, all authorizations are issued on a case-by-case basis. In the United States, some jurisdictions issue individual authorization and others rely on General Permits,
12
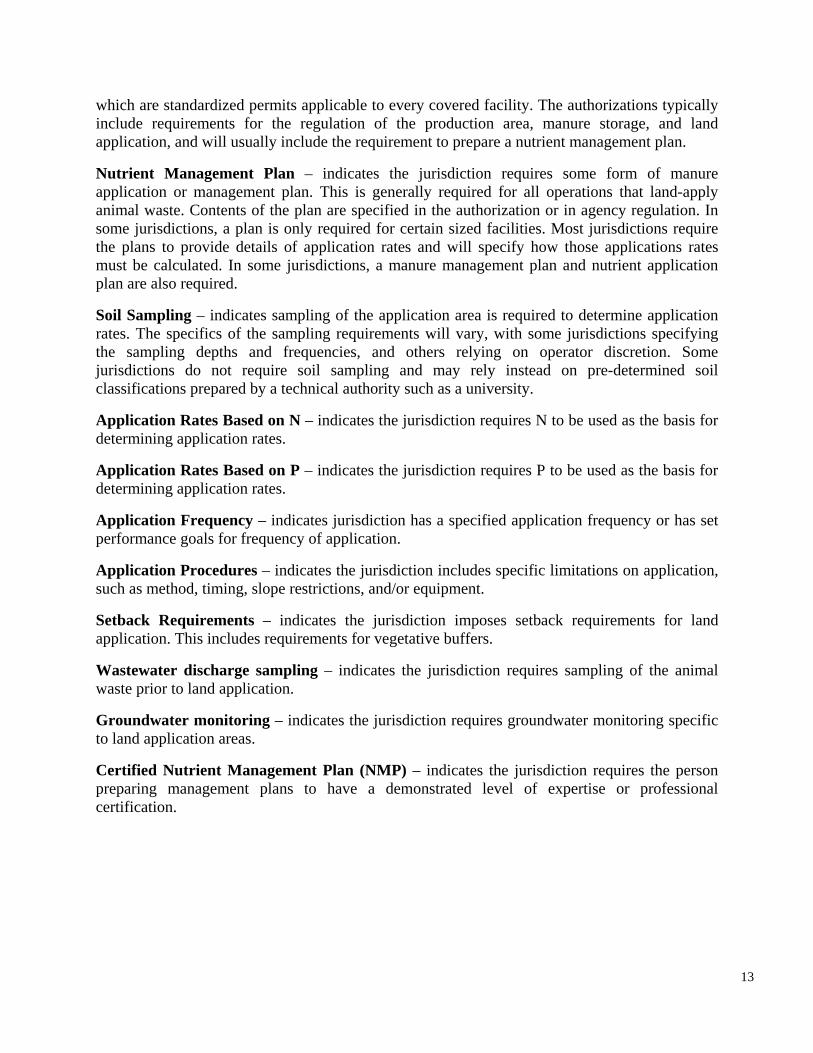
waste prior to land application.
which are standardized permits applicable to every covered facility. The authorizations typically include requirements for the regulation of the production area, manure storage, and land application, and will usually include the requirement to prepare a nutrient management plan.
Nutrient Management Plan – indicates the jurisdiction requires some form of manure application or management plan. This is generally required for all operations that land-apply animal waste. Contents of the plan are specified in the authorization or in agency regulation. In some jurisdictions, a plan is only required for certain sized facilities. Most jurisdictions require the plans to provide details of application rates and will specify how those applications rates must be calculated. In some jurisdictions, a manure management plan and nutrient application plan are also required.
Soil Sampling
Application Rates Based on P – indicates the jurisdiction requires P to be used as the basis for determining application rates.
Application Frequency – indicates jurisdiction has a specified application frequency or has set performance goals for frequency of application.
Application Procedures – indicates the jurisdiction includes specific limitations on application, such as method, timing, slope restrictions, and/or equipment.
Setback Requirements – indicates the jurisdiction imposes setback requirements for land application. This includes requirements for vegetative buffers.
Wastewater discharge sampling – indicates the jurisdiction requires sampling of the animal
– indicates sampling of the application area is required to determine application rates. The specifics of the sampling requirements will vary, with some jurisdictions specifying the sampling depths and frequencies, and others relying on operator discretion. Some jurisdictions do not require soil sampling and may rely instead on pre-determined soil classifications prepared by a technical authority such as a university.
Application Rates Based on N – indicates the jurisdiction requires N to be used as the basis for determining application rates.
Groundwater monitoring – indicates the jurisdiction requires groundwater monitoring specific to land application areas.
Certified Nutrient Management Plan (NMP) – indicates the jurisdiction requires the person preparing management plans to have a demonstrated level of expertise or professional certification.
13
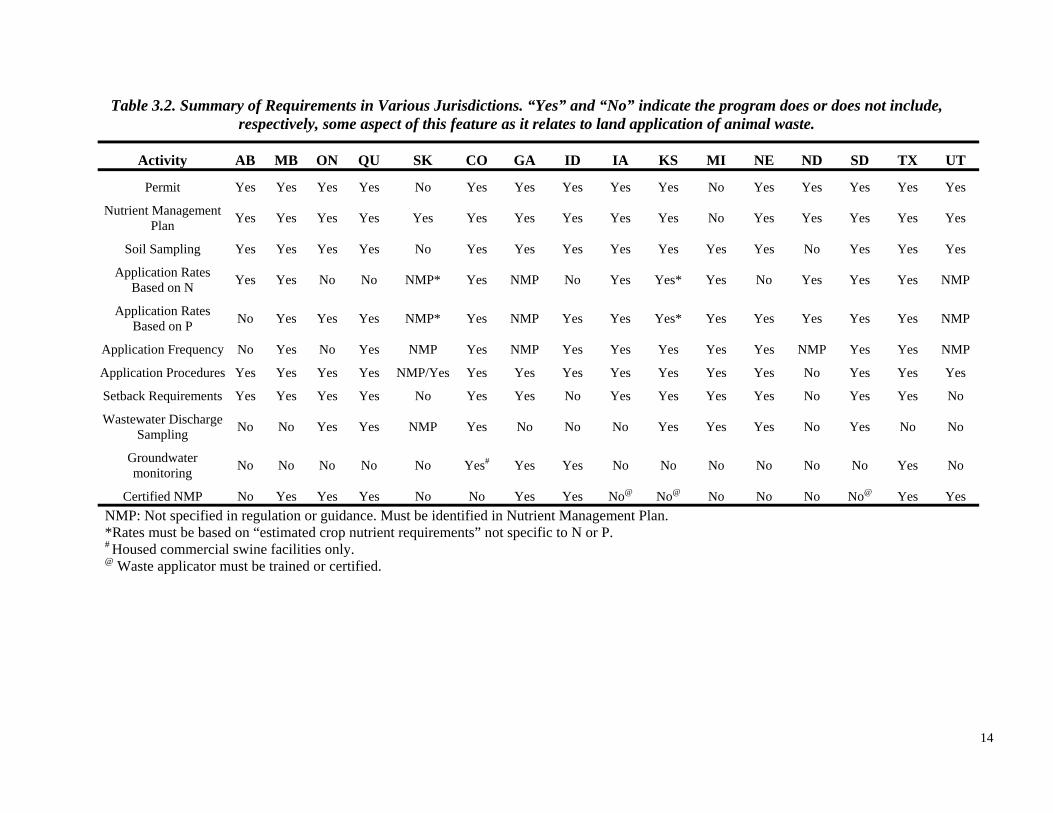
Table 3.2. Summary of Requirements in Various Jurisdictions. “Yes” and “No” indicate the program does or does not include, respectively, some aspect of this feature as it relates to land application of animal waste.
Activity AB MB ON QU SK CO GA ID IA KS MI NE ND SD TX UT
Permit Yes Yes Yes Yes No Yes Yes Yes Yes Yes No Yes Yes Yes Yes Yes
Nutrient Management Plan Yes Yes Yes Yes Yes Yes Yes Yes Yes Yes No Yes Yes Yes Yes Yes
Soil Sampling Yes Yes Yes Yes No Yes Yes Yes Yes Yes Yes Yes No Yes Yes Yes
Application Rates Based on N Yes Yes No No NMP* Yes NMP No Yes Yes* Yes No Yes Yes Yes NMP
Application Rates Based on P No Yes Yes Yes NMP* Yes NMP Yes Yes Yes* Yes Yes Yes Yes Yes NMP
Application Frequency No Yes No Yes NMP Yes NMP Yes Yes Yes Yes Yes NMP Yes Yes NMP
Application Procedures Yes Yes Yes Yes NMP/Yes Yes Yes Yes Yes Yes Yes Yes No Yes Yes Yes
Setback Requirements Yes Yes Yes Yes No Yes Yes No Yes Yes Yes Yes No Yes Yes No
Wastewater Discharge Sampling No No Yes Yes NMP Yes No No No Yes Yes Yes No Yes No No
Groundwater monitoring No No No No No Yes# Yes Yes No No No No No No Yes No
Certified NMP No Yes Yes Yes No No Yes Yes No@ No@ No No No No@ Yes Yes NMP: Not specified in regulation or guidance. Must be identified in Nutrient Management Plan. *Rates must be based on “estimated crop nutrient requirements” not specific to N or P. # Housed commercial swine facilities only. @ Waste applicator must be trained or certified.
14
3.1.1. Summary of Requirements
Most jurisdictions in Canada and the United States manage the risk to surface water and
groundwater from land application of animal wastes by specifying manure application rates and
operational practices. The following is a summary of the regulatory requirements most likely to
result in groundwater protection.
3.1.1.1. Permits
As noted, most Canadian jurisdictions including Alberta, Manitoba, Québec and Ontario require
In the United States, the federal government has issued a General Permit for the regulation of
certain concentrated animal feeding operations (as defined by the number of animal units), which
includes a requirement to prepare a Nutrient Management Plan. Colorado, Nebraska, North
Dakota, Texas, Utah and South Dakota have adopted some form of the federal General Permit.
In addition, Texas has also issued a General Permit for animal waste composters. Colorado has a
separate General Permit for Housed Swine Operations. In North Dakota, facilities with no
“potential to discharge” are only required to prepare a nutrient management plan and no permit is
necessary. Since Idaho is not authorized for the federal surface water discharge program, the
all animal management facilities such as feedlots to have authorization to operate. In contrast,
Saskatchewan only requires a nutrient management plan from facilities designated as “Intensive
Livestock Operations” (facilities with less than 370 square meters per animal unit) and does not
issue permits or licenses for those or for land application areas.
United States Environmental Protection Agency (EPA) issued a state-specific General Permit for
Idaho. Georgia, Idaho, Kansas, and Nebraska issue individual permits and most other states will
issue individual permits if warranted by site conditions. Georgia will also issue a separate land
application permit. In Michigan, although surface water runoff is regulated under a permit, Best
Management Practices specific to land application are incorporated into industry guidance.
Compliance with the guidance is not mandatory, although compliance will eliminate liability
under nuisance laws.
15
3.1.1.2. Nutrient Management and Other Plans
In most jurisdictions in Canada and the United States, the NMP is typically a required element
of a permit or authorization. The required content of plans varies widely among jurisdictions but
must generally include application rates, application practices, and sampling protocols to ensure
appropriate waste application. In Canada, each province has specified the content of the NMP.
In Québec, the plan is called an “agro-environmental fertilization plan”. In Saskatchewan, a
waste management plan is only required for certain Intensive Livestock Operations and although
Nebraska, the operator must also prepare a Production Management Plan (relating to manure
production and management.)
3.1.1.3. Soil Sampling
Most jurisdictions (except North Dakota and Saskatchewan) have some regulations or guidance
for sampling soils in the waste application area prior to land application. The specifics of the
the required content of the plan is specified, the details are left to the preparer. In Iowa, a NMP
is required for “open feedlots” only; feedlots that are not “open” are required to prepare a
Manure Management plan. New swine facilities with a certain capacity in Kansas must prepare
a Manure Management Plan, and must prepare a Nutrient Utilization Plan if land applying waste.
Utah, Idaho, Texas specify that the NMP must comply with varying versions of the NRCS
Nutrient Management Standard Practice No. 590 (for example, Idaho requires the 1999 version
of Practice 590 be used even though a 2006 version exists.) Several jurisdictions (Manitoba,
Québec, Ontario, Georgia, Idaho, Texas, and Utah) require the person preparing the plan to have
certain credentials.
In some jurisdictions, plans in addition to the NMP may also be prepared. In Alberta, an operator
may submit a Manure Handling Plan to reduce or eliminate the need to meet manure application
and storage requirements. In Manitoba, an operator with more than 300 animal units who is land
applying waste must prepare a Manure Management Plan before the start of the growing season.
In Ontario, an operator must prepare a Nutrient Management Strategy that sets out an
environmentally acceptable method for managing all prescribed materials generated at an
agricultural or non-agricultural operation. In Colorado, the operator of a housed swine operation
must prepare a Swine Management Plan, including construction and operation plans. In
16
sampling requirements vary widely, with some jurisdictions specifying the sampling depths and
frequencies, and others relying on operator discretion or government or standardized soil
classifications. The nature of the sampling also varies, depending on whether the jurisdiction
emphasizes N rates (Alberta), P rates (Ontario, Québec, Iowa), or both (Manitoba, Colorado,
Kansas, Nebraska, South Dakota, Texas) as a measure of appropriate waste application.1 In
addition to N and P, Kansas also requires analysis of chloride, copper and zinc. Alberta and
Texas also require measurements for electrical conductivity. In Texas, small and medium
operations must also test for zinc and copper. Alberta provides a specific range of nitrate-
nitrogen levels that must not be exceeded in the top 60 cm of the soil profile.
Some sampling programs must be conducted within a certain time frame. This includes Alberta
(certain operators within 3 years prior to application), Colorado (P every 5 years or as
necessary), Iowa (every four years), Kansas (prior to land application and annually thereafter),
Michigan (every three years), South Dakota (prior to land application), and Texas (samples no
older than 5 years). Other jurisdictions do not specify a time frame for sampling (Manitoba,
Ontario, Québec, Georgia).
3.1.1.4. Application Rates and Frequency
Application rates are generally set based on an evaluation of soil samples, crop uptake, and the
nature of the material to be disposed. In Alberta, application rates must not exceed the nitrate-
1 Generally, the choice of regulation of P relates to concerns for surface water quality. For example, the Iowa animal waste management program traditionally regulated N, but in 2004 shifted its focus to P. As explained in a review of Iowa non-point sources of water pollution:
In the past interest in phosphorus, as a nonpoint source pollutant was not as great as for nitrogen because phosphorus is generally less mobile than nitrogen in the agricultural landscape. Phosphorus is immobile because it is easily adsorbed to soil particles. However, high soil and streambank erosion can lead to increased amounts of phosphorus in surface waters. Additionally, dissolved phosphorus contributions are more significant than previously thought. These facts along with the heightening concern of the impacts of poultry and livestock manure on surface water quality has increased the interest in phosphorus movement and management in the landscape.
Zaines, G.N. and Schultz, R.C., 2002, Phosphorus in Agricultural Watersheds, Department of Forestry, Iowa State University, Ames, Iowa, p. v, http://www.buffer.forestry.iastate.edu/Assets/Phosphorus review.pdf
17
nitrogen limits specified in the regulation. In Manitoba, rates must not exceed residual nitrogen
limits set out in the regulations. Ontario, Québec, Saskatchewan, Iowa, Kansas, Michigan, North
Dakota, South Dakota, Texas and Utah mandate limits of P and/or N based on expected crop
uptake. In Nebraska, the criterion is field capacity of the receiving soil. Colorado evaluates the
risk of P and N runoff to surface water as a way to determine application rates. In Georgia,
where groundwater monitoring of land application areas is required, the rate of application may
not result in an excess of 10 mg/L of nitrate-nitrogen in groundwater at the property line.
3.1.1.5. Application Procedures
Many jurisdictions specify procedures that must be followed when land-applying animal waste.
Specific procedures include the following:
1. Animal waste incorporation under certain conditions (Alberta, Manitoba, Ontario, Colorado, Idaho, South Dakota).
2. No application on crops for human consumption (Alberta).
3. Adequate land must be available (Québec, Nebraska).
4. No application to frozen land except under certain conditions (Alberta, Ontario, Québec, Idaho, Iowa, Kansas, Michigan, Nebraska, South Dakota, Texas).
5. No application to highly erodible land (Iowa, Kansas, South Dakota).
6. Must apply to land in crops or to be cropped (Manitoba, Idaho).
7. Timing specified (typically no application October-April) (Manitoba, Ontario, Québec).
8. Slope limits application (Manitoba, Ontario, Iowa, Michigan, South Dakota).
9. No application during rainfall (Kansas, Texas).
10. Specifications for application equipment (Ontario, Québec, Iowa).
11. Visual observation required for direct flow application (Ontario).
3.1.1.6. Setback Requirements
Most jurisdictions include some setback requirements, some more specific than others. Most
jurisdictions impose setbacks based on proximity of the waste management activities to surface
18
water sources (Manitoba, Georgia, Kansas, Michigan) but others include proximity or risk of
impacts to groundwater or wells (Colorado, Idaho, Nebraska, South Dakota, Texas). Kansas has
separate setback requirements for construction and for land application. Ontario has the most
detailed requirements in Canada, including setbacks from drilled wells of specific use, depths
and construction, setbacks from surface water and its banks, and setbacks from vegetated buffers.
Among the US states, Iowa has the most detailed and specific setback requirements, which vary
depending on the kind of materials being land applied and include separation distances from
public buildings, residential areas, and different kinds of wells.
3.1.1.7. Groundwater Monitoring
Hilliard, C., Scott, N., Lessa, A., and Reedy, S., 2002, Agricultural Best Management Practices for the Canadian Prairies a review of literature, Canada-Saskatchewan Agri-Food Innovation Fund, File No.: 6672-1-12-1-18, March 31.
Methane to Markets Partnership – Canada Profile for Animal Waste Management (November 2006) http://www.methanetomarkets.org/resources/ag/docs/canada profile.pdf
Statistics Canada, A Geographical Profile of Manure Production in Canada, Catalogue No. 16F0025XIB http://www.statcan.ca/english/freepub/16F0025XIB/m/manure.htm
Alberta Standards and Practices Administration Regulation
http://www.qp.gov.ab.ca/documents/Regs/2001 267.cfm?frm isbn=0779730372&type=htm
19
Only three of the jurisdictions reviewed expressly include groundwater monitoring for land
application areas. In Colorado, housed swine operations require quarterly monitoring of land
application areas. Groundwater analyses include, at a minimum, N species, P, heavy metals and
salts. A waiver may be granted from monitoring requirements based on no demonstrated
potential for impact to groundwater. In Georgia, certain size operations are required to install one
up gradient and two down gradient wells in the area of the spray irrigation field. These wells will
be sampled semi-annually for Total Kjeldahl Nitrogen and nitrate-nitrogen. Monitoring may also
be required for P adsorption, sodium adsorption ratio (SAR), cation exchange capacity (CEC),
and cumulative loading of copper and zinc. In Idaho, if nutrient contamination has already been
identified as a groundwater concern, the Nutrient Management Plan must include an assessment
of the potential risk for nitrogen and/or P to adversely impact groundwater quality.
3.2. References
Canada
Agricultural Best Management Practices for the Canadian Prairies-A Review of Literature, File No. 6672-1-12-1-18 (March 31, 2002).
Manitoba Livestock Manure and Mortalities Management Regulation, Man. Reg. 42/98,
http://www.canlii.org/mb/laws/regu/1998r.42/20071213/whole.html Audit of the Department of Conservation’s Management of the Environmental Livestock
Program (November 2007), www.oag.mb.ca Recommendations for Regulating Phosphorus from Livestock Operations in Manitoba, Final
Report by the Manitoba Phosphorus Experts Committee to the Manitoba Minster of
The Agricultural Operations Act (Chapter A-12.1), http://www.qp.gov.sk.ca/documents/English/Statutes/Statutes/A12-1.pdf
The Agricultural Operations Act Regulations (Chapter A-12.1 Reg. 1), http://www.qp.gov.sk.ca/documents/English/Regulations/Regulations/A12-1R1.pdf
United States CAFO Final Rule, 68 Fed. Reg. 7176 (February 12, 2003). CAFO Proposed revisions to final rule, 71 Fed. Reg. 37744 (June 30, 2006). CAFO extension of deadlines, 72 Fed. Reg. 40247 (July 24, 2007).
Conservation (January 2006), http://www.gov.mb.ca/conservation/envprograms/livestock/pdf/final report manitoba phosph orus expert committee.pdf
Ontario The Nutrient Management Act 2002, http://www.e-laws.gov.on.ca/html/statutes/english/elaws
statutes 02n04 e.htm Ontario Regulation 267/03, http://www.e
laws.gov.on.ca/html/regs/english/elawsregs032767e.htm Ontario Nutrient Management Protocol,
http://www.omafra.gov.on.ca/english/nm/regs/nmpro/nmprotcj05.htm Ontario Pub. 811 Agronomy Guide for Field Crops (March 2002),
http://www.omafra.gov.on.ca/english/crops/pub811/p811toc3.htm Compliance Tools for Nutrient Management (Ministry of Agriculture 2005),
http://www.omafra.gov.on.ca/english/nm/approvals/tools.htm#links Guidelines for the Utilization of Biosolids and Other Wastes on Agricultural Land , Ministry of
Environment, Ministry of Agriculture, Food and Rural Affairs, (March 1996), http://www.ene.gov.on.ca/envision/gp/3425e.pdf
Québec Agricultural Operations Regulation,
http://www2.publicationsduquebec.gouv.qc.ca/dynamicSearch/telecharge.php?type=3&file=/Q _2/Q2R11_1_A.htm
Agro-Environmental Fertilization Guide (Ministry of Sustainable Development, Environment and Parks), http://www.mddep.gouv.qc.ca/milieu agri/agricole-en/guide1.htm#modalities
Saskatchewan
20
ntrated%20Animal%20Feedlot%20Operaaho University of Idaho Soil Sampling Guidance No. 704 (revised) (8-97).
http://info.ag.uidaho.edu/resources/PDFs/EXT0704.pdf
United States Department of Agriculture 2002 Agricultural Census, http://wwwnass.usda.gov/census/census02/volume1/us/CenV1US1.txt
Waterkeeper Alliance et al. v. EPA, 399 F.3d 486 (February 28, 2005). Natural Resource Conservation Service eField Services Guides (including Standard Practice
590), http://www.nrcs.usda.gov/Technical/efotg/ Summary of manure production in the United States, www.scorecard.org/env-releases/aw/rank
states.tcl? Colorado General Permit for Concentrated Animal Feeding Operations, Authorization to Discharge under
the Colorado Discharge Permit System, Permit No. COA-931000, effective August 14, 2005, http://www.cdphe.state.co.us/el/eap/eapdocs/permit931000.pdf
Colorado Discharge Permit System Regulations 5 CCR 1002-61, http://www.cdphe.state.co.us/regulations/wqccregs/100261dischargepermitsystem1107.pdf
Animal Feeding Operations Control Regulation 5 CCR 1002-81, http://www.cdphe.state.co.us/regulations/wqccregs/100281confinedanimalfeedingregs.pdf
Georgia 391-3-6-.19 General Permit - Land Application System Requirements. 391-3-6-.20 Swine Feeding Operation Permit Requirements. 391-3-6-.21 Animal (Non-Swine) Feeding Operation Permit Requirements. http://rules.sos.state.ga.us/cgi-
bin/page.cgi?g=GEORGIA DEPARTMENT OF NATURAL RESOURCES/ENVIRONME NTAL_PROTECTION/WATER_QUALITY_CONTROL/index.html&d=1
Idaho General Permit,
http://yosemite.epa.gov/R10/WATER.NSF/NPDES+Permits/General+NPDES+Permits#Conce
Natural Resources Conservation Service Practice Standard Nutrient Management (Acre) Code 590 (1999), http://www.agri.state.id.us/Categories/Environment/nmp/nmpPDF/NRCS%20Standards%206_ 99.pdf
Rules Governing Nutrient Management ( IDAPA 02.04.30), http://www.agri.state.id.us/Categories/Environment/nmp/nmpPDF/Rules-Governing-NutrientManagement.pdf
Rules of the Department of Agriculture Governing Dairy Waste (IDAPA 02.04.14), http://adm.idaho.gov/adminrules/rules/idapa02/0414.pdf
Rules Governing Beef Cattle Animal Feeding Operations (IDAPA 02.04.15), http://adm.idaho.gov/adminrules/rules/idapa02/0415.pdf
21
Environmental Regulatory Guidance for Concentrated Animal Feeding Operations (with emphasis on Large Dairy Operations) KDHE (Dec. 2003), http://www.kdheks.gov/feedlots/download/DairyGuidance04.pdf
Idaho Waste Management Guidelines for Confined Feeding Operations Idaho Department of Health and Welfare, Division of Environmental Quality (Amended 1997), http://www.idahoag.us/Categories/Animals/Dairy/Documents/Idaho%20Waste%20Manageme nt%20Guidelines%20For%20Confined%20Feeding%20Operations,%20Amended%20in%201 997.pdf
Guidelines to Prepare your Nutrient Management Plan (University of Idaho), http://www.agri.state.id.us/Categories/Environment/nmp/nmpPDF/Nutrient%20Management.p df
Best Management Practices for Nutrient Management In the State of Idaho, http://www.agri.state.id.us/Categories/Environment/nmp/nmpPDF/BMPs.pdf
Iowa Separation Distances for Land application of Manure from Open Feedlots & Confinement
Feeding Operations, including SAFOs, (IDNR, Jan 2003.) USDA Natural Resources Conservation Service (NRCS) Iowa Technical Note No. 25. Separation Distances for Land application of Manure from Open Feedlots & Confinement
Feeding Operations, including SAFOs, (IDNR, Jan 2003.) Regulations for Confined Feeding Operations, Chapter 65,
Kansas Technical Standard – Nutrient Management (revised 12/15/2006), http://www.kdheks.gov/feedlots/index.html#links
USDA NRCS Site Assessment Index-Phosphorus, Series No. 1201, (2004), http://www.nrcs.usda.gov/technical/ECS/nutrient/pindex.html
Michigan Generally Accepted Agricultural and Management Practices for Manure Management and
Utilization (June 2007), http://www.michigan.gov/gamps Michigan Right To Farm Act (Act 93 of 1991),
http://www.legislature.mi.gov/(S(dst5qnbb4ympdb45c3cu4f55))/mileg.aspx?page=getobject& objectname=mcl-act-93-of-1981&queryid=8769063&highlight=
22
http://www.legis.state.ia.us/Rules/Current/iac/567iac/56765/56765.pdf Iowa Technical Note 25 - The Phosphorus Index, ftp://ftp-
fc.sc.ecgov.usda.gov/IA/technical/PIndexFOTGJan01.pdf Zaines, G.N. and Schultz, R.C., 2002. Phosphorus in Agricultural Watersheds. Iowa State
University, 106 pp. KansasConfined Animal Feeding Operations Statutes
http://www.kdheks.gov/feedlots/statutes/statutes.htmAnimal and Related Waste Control Regulation K.A.R. 28-18-1 et.seq. Swine and Related Waste Control K.A.R. 28-18a -1 et.seq.
http://www.kdheks.gov/feedlots/download/Article 18a combined w index.pdf
TPDES General Permit Number TXG200000 Relating to the Natural Resource Conservation Practice Standard Nutrient Management Code 590 (June 1998), http://www.soil.ncsu.edu/interagency/attachments/NRCS590.pdf
Michigan's Natural Resources and Environmental Protection Act (NREPA), Act 451 of 1994, http://www.michiganlegislature.org/mileg.asp?page=getObject&objName=mcl-Act-451-of1994&highlight=
Manure Management Sheet #2, MSUE Bulletin E-2344 by Jacobs et al. (1992). Nebraska Nebraska Department of Environmental Quality (see Rules and Regulations Livestock Waste
Control Regulations Title 130), http://www.deq.state.ne.us/ North Dakota Control of Pollution from Animal Feeding Operations CHAPTER 33-16-03.1,
Texas
00.pdf
Utah Regulations relating to Concentrated Animal Feeding Operations,
http://www.health.state.nd.us/WQ/AnimalFeedingOperations/Final%20Rules/33-16-03.1%20Rules.pdf
South Dakota Groundwater Protection Rules, http://legis.state.sd.us/rules/DisplayRule.aspx?Rule=74:54:01 General Permit No. SDG-0100000,
http://www.state.sd.us/denr/DES/Surfacewater/IPermits/AllAnimalGPermit.pdf Nutrient Management/Manure Management Tools,
http://www.state.sd.us/denr/DES/Surfacewater/ManureMgt/Tools.htm SDSU Extension Publication EXEX 8009, Quantities of Plant Nutrients Contained in Crops
(January 1985), http://agbiopubs.sdstate.edu/articles/ExEx8009.pdf
TPDES General Permit Number TXG920000 Relating to the Discharge of Manure, Litter and Wastewater from CAFO Facilities, http://www.tceq.state.tx.us/assets/public/permitting/waterquality/attachments/cafo/txg920000.p df
TNRCC General Permit Number WQG200000 Relating to Discharge of Waste Water from Manure Compost Facilities (2000), http://www.tceq.state.tx.us/assets/public/permitting/waterquality/attachments/general/wqg2000
http://www.rules.utah.gov/publicat/code/r317/r317-006.htm General Permit for Concentrated Animal Feeding Operations Permit No. UTG080000,
http://www.waterquality.utah.gov/updes/cafo gen permit.pdf
23
4. GEOCHEMICAL CONTROLS ON MANURE DERIVED N AND P IN SOILS AND GROUNDWATERS
Manure spreading is essential for the disposal of animal wastes from livestock operations
(Chapter 6), as well as an economically beneficial (and some would argue necessary) source of
nutrients important for the growth of crops. Although 16 nutrients are classified as essential, N
and P are the most in demand by crops. Over-application of these two nutrients can lead to
masses in excess of those needed by crops. If applied in excess of crop requirements, soluble
forms of nitrogen readily move with water through the soil profile to the groundwater. The most
Geochemical reactions in the subsurface can control the concentrations of many dissolved
species and thus their migration in groundwaters. An understanding of these controls is necessary
to characterize the fate of manure applied to ground surface, and therefore this Chapter provides
an overview of the geochemical controls on N and P, and summarizes our general understanding
of the fate of N and P species from manure spreading.
4.1. Nitrogen Contamination
Nitrogen in groundwater can be derived from a number of point and non-point or distributed
sources. In the case of agricultural practices, these sources include: manure storage facilities
common nitrogen contaminant identified in groundwater is dissolved nitrogen in the form of
nitrate (NO3). Nitrate pollution of groundwater is an increasing problem throughout North
America and Europe and is a major health-related concern for water supplies and surface waters
(Chapter 8).
(MSF), confined feedlot operations (CFO; excluding the MSF), manure applications to fields,
and the application of inorganic N fertilizers to fields. Unlike the migration of conservative
solutes (e.g., halogens such as chloride), which are controlled by advection and diffusion in
groundwater systems, N is also subject to biogeochemical transformations that are controlled by
environmental conditions in the subsurface.
Evaluating the impact of N contamination from land application of manure-derived N on
groundwater requires an assessment of the impact of chemical transformations within the
subsurface regime on the form(s) and concentrations of the N species in the groundwater both
24
over time and space. It also requires an understanding of both the organic and inorganic forms of
N found in manure.
4.1.1. Geochemical Controls on Nitrogen
Nitrogen can occur in many forms in the dissolved state in the subsurface, including NO3
(nitrate), nitrite (NO2), nitrous oxide (N2O), nitrogen gas (N2), ammonia gas (NH3), and
ammonium (NH4). Nitrogen can occur in oxidation states ranging from –III (NH4) to +V (NO3),
Volatilization is the process by which nitrogen is lost to the atmosphere by conversion from NH4,
the largest component of inorganic nitrogen in spread manure, to ammonia gas (NH3(g)).
NH4 ↔ NH3(g) + H+ [4.2]
The rate of ammonia volatilization is enhanced by environmental factors such as high soil
moisture, alkalinity and temperature, and with increased air movement. Methods of application
can limit or enhance the exposure of ammonia to volatilization. For example, surface applied
solid feedlot manure left exposed to the atmosphere can lose 15 to 30% of its total N over four
days if not tilled into the soil [Choudhary et al., 1996; Beauchamp, 1983; Schoenau and Assefa,
2004]. Liquid manure applied by broadcast spreading can lose up to 5% of its total N whereas
injection of the manure under the surface of the soil can reduce these losses to less than 2%
[Schoenau and Assefa, 2004; Sutton, 1994].
25
and its reduction series can be written as:
NO3 -→ NO2 → NO2
-→ NO → N20 → N2 → NH3 / NH4 [4.1]
Microorganisms facilitate many N transformations in groundwaters at normal temperatures and
pressures [c.f., Paul and Clark, 1996]. The multiple valence states in which N can exist in
groundwaters indicate the distribution of N species is controlled by oxidation-reduction
reactions. The distribution of some N species is also controlled by pH. NO3 is stable in oxic
groundwaters while NH4 is stable in anoxic groundwaters when the pH is <8 (typical for most
groundwaters). The most important overall N reactions in the subsurface are volatilization,
denitrification and nitrification.
4.1.1.1. Volatilization
4.1.1.2. Nitrification
Nitrification results in the oxidation of NH4 to NO3. For example, in the first stage of nitrification
the net reaction (ignoring the intermediate steps; USEPA [2002]) is:
1 + 1 1 − 1 + 1NH + O → NO + H + H O4 2 2 2 [4.3]6 4 6 3 6
NH3 + +O2 →NO2
− + 3H+ + 2e−
− − + −NO2 + H 2O → NO3 + 2H + 2e
The process of denitrification results in the reduction of NO3 to N2(g) by bacteria through a
complicated pathway involving intermediaries such as NO2. The reductive biological pathway
can be described by:
NO3-→ NO2
-→ NO → N2O → N2 [4.4]
In addition to the presence of NO3, labile organic carbon, and appropriate bacteria, denitrification
is also controlled by the presence or absence of O2.
26
Nitrification requires the presence of NH4, labile organic carbon, and appropriate bacteria, and is
controlled by the presence or absence of O2. In nitrification, bacteria use labile organic carbon as
their energy source. In many natural groundwaters, sufficient labile organic carbon exists to
support heterotrophic nitrification [Korom, 1992], although most nitrification occurs in the soil
zone (above the water table) where the presence of organic carbon and O2 are not limiting.
Manure has been noted to provide the necessary labile carbon to stimulate nitrifying bacteria
[Schoenau and Assefa, 2004]. Because nitrification is a biological process, temperature affects
nitrification rates (30 to 35oC is optimum). Nitrification, although slow below 5oC, occurs under
snow cover in many soils [Paul and Clark, 1996]. Nitrification rates are also dependent upon pH
with optimum values occurring between 6.6 and 8.0; rates typically decrease below pH 6.0 and
become negligible below pH 4.5. High pH values inhibit the transformations of nitrite to nitrate
[Paul and Clark, 1996].
4.1.1.3. Denitrification
Denitrification is the dominant mechanism by which NO3 concentrations are reduced below the
root zone and in groundwaters [c.f., Trudell et al., 1986; Mercado et al., 1988; Parkin and
Meisinger, 1989; Gillham et al., 1990]. Denitrification can be accomplished by heterotrophic
bacteria that use labile organic matter as an electron donor:
5CH2O + 4NO3- → 2N2(g) + 4HCO3
- + CO2 + 3H2O [4.5]
where CH2O represents labile organic carbon. As was also the case for nitrification, manure has
al., 1990], and enrichment in the stable isotope of 15N [c.f., Hendry et al., 1984; Wassenaar et al.,
2006].
Rates of denitrification are usually greater in topographic lows than on topographic highs
[Gambrell et al., 1975; Geyer et al., 1992; Farrell et al., 1996] because shallow water tables are
more often associated with low areas, which are more likely to be anoxic and are closer to the
source or labile organic C (the soil zone).
27
been noted to provide the necessary labile carbon to stimulate denitrifying bacteria [Schoenau
and Assefa, 2004]. Denitrification can occur without microbial conversion but is exceedingly
slow. Most denitrifying bacteria function best at pH 6 to 8 and the rates of denitrification slow
below pH 5, although this process can still be significant. Importantly, denitrification is not a
reversible process.
In addition to volatilization, Bouldin et al. [1984] suggest denitrification is a major pathway of
manure N loss in soils. This was supported by Kimble et al. [1972] who show in lab experiments
that potential denitrification is greater in manure treated soil plots than in those receiving no
source of N or inorganic N fertilizer, and by Loro et al. [1997] who show solid beef and liquid
dairy manure enhances denitrification over fields fertilized with inorganic N. Loro et al. [1997]
further show liquid dairy manure stimulates rapid denitrification while solid beef manure yields a
slower but sustained rate of denitrification.
When the intermediaries of denitrification (Equation 4.4) are found (not often, and in low
concentrations when present), they confirm the presence of ongoing nitrate reduction.
Denitrification has been shown to occur in groundwater systems by studying the decrease in NO3
vs. a conservative species such as Cl [e.g., Gambrell et al., 1975], decreases in NO3 with depth
[Gillham et al., 1974], decreases in NO3 with decreasing O2 [c.f., Hendry et al., 1983; Gillham et
thousands of years.
Rates of denitrification in groundwater from lab and field studies are reported by Korum [1992],
with a range of 0.12 to 3.1 mg-N/L per day (44 to 1132 mg-N/L/year) and an average of 0.86
mg-N/L per day. Temperature affects denitrification exponentially above 15 to 20oC and linearly
below 15 to 20oC [Paul and Clark, 1996].
Denitrification rates in fine textured vadose zones are controlled by moisture content. Tindall et
al. [1995] show denitrification is unlikely to occur along preferential flow paths in structured
clays, except when preferred flow pathways are filled with water.
al. [1986] used the increase in HCO3- to estimate the rate of denitrification in a shallow sand
aquifer.
Although denitrification has been documented in many geologic media ranging from coarse
gravels to fractured clays, it cannot always be assumed to occur in all groundwater environments.
NO3 can be persistent for long time periods in many groundwaters. For example, Hendry et al.
[1984] show, using ion and Eh measurements, that NO3 can exist in isolated aerobic enclaves at
depths below the water table in fractured glacial till deposits of southern Alberta for hundreds to
Dissimilatory NO3 reduction to NH4, although possible in groundwaters, normally plays a
subordinate role [Appelo and Postma, 2002]. However, NH4 produced by dissimilatory NO3
reduction to NH4 can be nitrified if redox conditions become favourable [Korum, 1992].
4.1.1.4. Oxygen in the Subsurface and its Controls on Nitrification and Denitrification
As mentioned above, nitrification and denitrification reactions are controlled by a numerous
factors, including the presence of NO3 or NH4 (for nitrification or denitrification, respectively),
labile organic carbon, appropriate bacteria, and the presence or absence of O2. A detailed
28
Laboratory studies show denitrification is an active process in weathered and non-weathered clay
tills [Lind, 1985; Fujikawa and Hendry, 1991; Cambardella et al., 1999]. Fujikawa and Hendry
[1991] measured rates of denitrification below the water table in a fractured glacial till. Most
rates of denitrification are in keeping with those reported by Korom [1992]. The rates reported
by Fujikawa and Hendry [1991] are anomalously high [Rodvang and Simpkins, 2001]. Trudell et
discussion on the interaction of these factors in the subsurface is presented in Appendix C, and is
summarized below.
Nitrate (NO3) is soluble in water and thus can be readily leached through the soil and into the
groundwater. However, NH4 readily adsorbs to clays and organic matter [Hendry et al., 1997]. In
most soils, nitrification of free NH4 should occur, and the NO3 produced should be stable under
oxic conditions. However, denitrification (reduction of NO3 to N2) should occur under anoxic
conditions. In most groundwaters, denitrification occurs when the oxygen concentrations are low
short distances would be beneficial to a well owner concerned with NO3 contamination, because
NO3 would not persist for great distances along flow paths in the aquifer.
4.1.2. Fate of Nitrogen from Manure Spreading
The concentrations and ratios of organic and inorganic forms of N present in manure are strongly
dependant on the source (type of livestock). Organic N in manure is transformed to inorganic N
29
but not necessarily anoxic.
In vadose zones (from the top of the ground surface to the water table), research suggests oxic
conditions should exist in all but fine-textured media and, as a result, N reactions in most vadose
zones should be dominated by nitrification. In fine-textured media, under wet conditions,
research suggests denitrification should occur.
Groundwaters in aquifers cannot be assumed to be completely oxic or anoxic. The groundwater
in an aquifer can evolve from oxic to anoxic as it migrates along its flow path. Thus, NO3 could
be conservative near the recharge area and be attenuated (through denitrification) further along
the flow path.
Under conditions whereby microbial activity is limited by the availability of labile organic
carbon (which can occur in some aquifers), the aquifer can remain oxic for great distances and
long time periods. As such, NO3 will also migrate great distances and be stable for long time
periods. Groundwaters in weathered clay-rich tills can be either oxic or anoxic, with conditions
stable with time in enclaves or transient at a location, whereas the groundwater in the unoxidized
till zones are anoxic. Limited data suggest the interface between oxidized and unoxidized till
zones is sharp. Notably, aquifers that transition from oxic to anoxic conditions over relatively
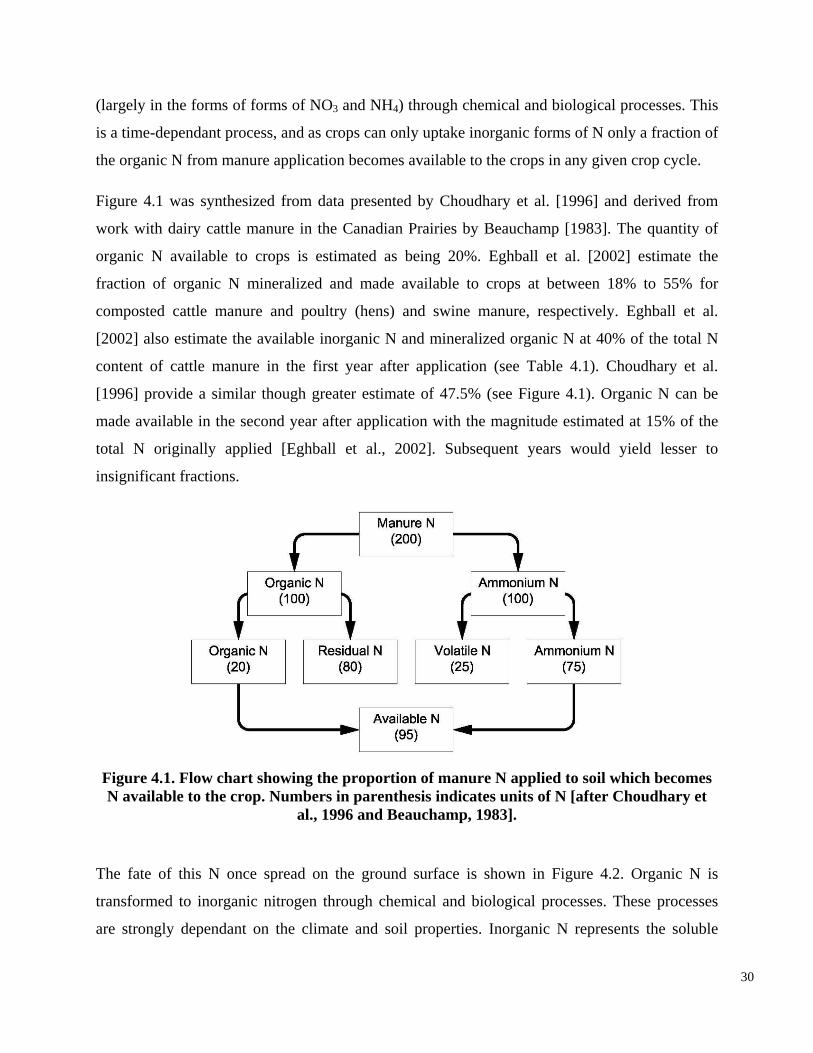
(largely in the forms of forms of NO3 and NH4) through chemical and biological processes. This
is a time-dependant process, and as crops can only uptake inorganic forms of N only a fraction of
the organic N from manure application becomes available to the crops in any given crop cycle.
Figure 4.1 was synthesized from data presented by Choudhary et al. [1996] and derived from
work with dairy cattle manure in the Canadian Prairies by Beauchamp [1983]. The quantity of
organic N available to crops is estimated as being 20%. Eghball et al. [2002] estimate the
fraction of organic N mineralized and made available to crops at between 18% to 55% for
composted cattle manure and poultry (hens) and swine manure, respectively. Eghball et al.
[2002] also estimate the available inorganic N and mineralized organic N at 40% of the total N
insignificant fractions.
content of cattle manure in the first year after application (see Table 4.1). Choudhary et al.
[1996] provide a similar though greater estimate of 47.5% (see Figure 4.1). Organic N can be
made available in the second year after application with the magnitude estimated at 15% of the
total N originally applied [Eghball et al., 2002]. Subsequent years would yield lesser to
Figure 4.1. Flow chart showing the proportion of manure N applied to soil which becomes N available to the crop. Numbers in parenthesis indicates units of N [after Choudhary et
al., 1996 and Beauchamp, 1983].
The fate of this N once spread on the ground surface is shown in Figure 4.2. Organic N is
transformed to inorganic nitrogen through chemical and biological processes. These processes
are strongly dependant on the climate and soil properties. Inorganic N represents the soluble
30
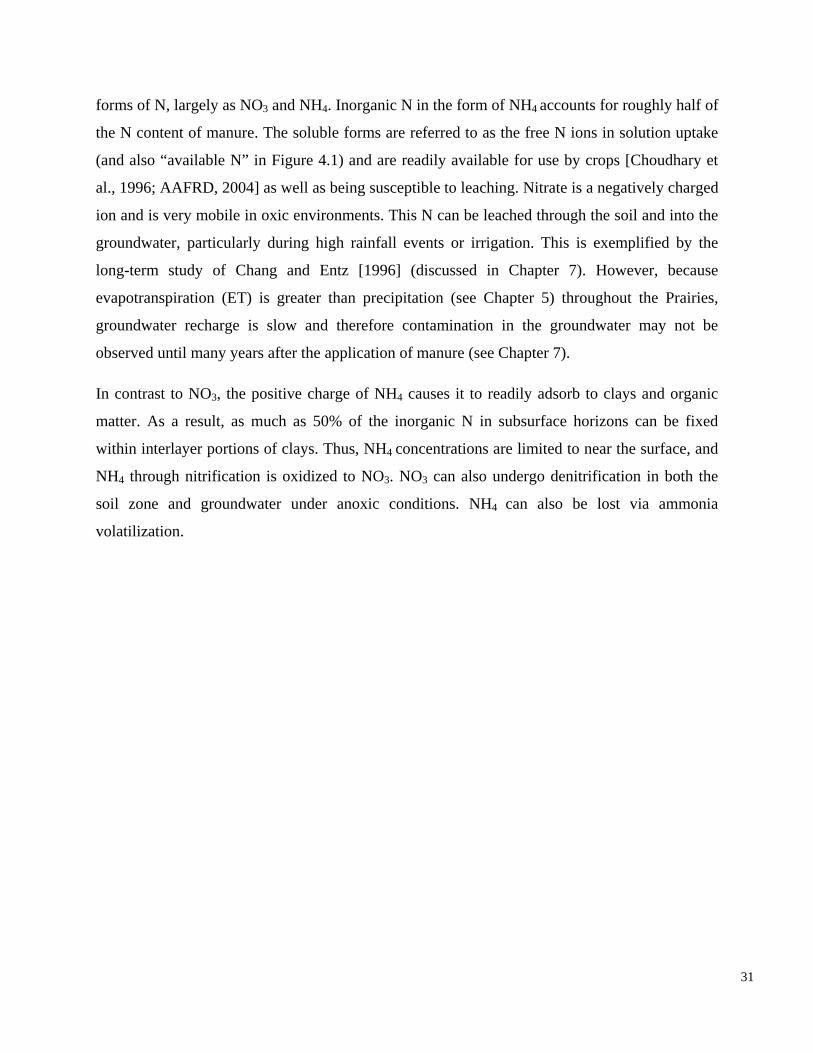
forms of N, largely as NO3 and NH4. Inorganic N in the form of NH4 accounts for roughly half of
the N content of manure. The soluble forms are referred to as the free N ions in solution uptake
(and also “available N” in Figure 4.1) and are readily available for use by crops [Choudhary et
al., 1996; AAFRD, 2004] as well as being susceptible to leaching. Nitrate is a negatively charged
ion and is very mobile in oxic environments. This N can be leached through the soil and into the
groundwater, particularly during high rainfall events or irrigation. This is exemplified by the
long-term study of Chang and Entz [1996] (discussed in Chapter 7). However, because
evapotranspiration (ET) is greater than precipitation (see Chapter 5) throughout the Prairies,
groundwater recharge is slow and therefore contamination in the groundwater may not be
observed until many years after the application of manure (see Chapter 7).
In contrast to NO3, the positive charge of NH4 causes it to readily adsorb to clays and organic
matter. As a result, as much as 50% of the inorganic N in subsurface horizons can be fixed
within interlayer portions of clays. Thus, NH4 concentrations are limited to near the surface, and
NH4 through nitrification is oxidized to NO3. NO3 can also undergo denitrification in both the
soil zone and groundwater under anoxic conditions. NH4 can also be lost via ammonia
volatilization.
31
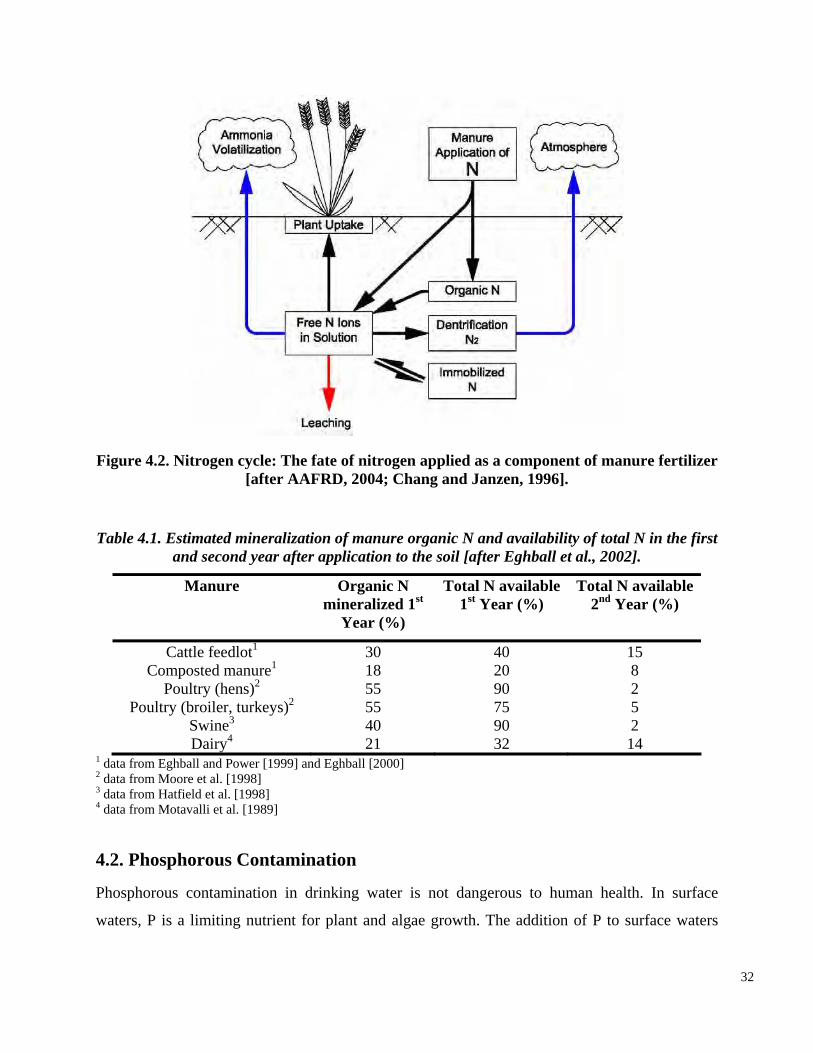
Figure 4.2. Nitrogen cycle: The fate of nitrogen applied as a component of manure fertilizer [after AAFRD, 2004; Chang and Janzen, 1996].
Table 4.1. Estimated mineralization of manure organic N and availability of total N in the first and second year after application to the soil [after Eghball et al., 2002].
Manure Organic N mineralized 1st
Year (%)
Total N available 1st Year (%)
Total N available 2nd Year (%)
Cattle feedlot1 30 40 15 Composted manure1 18 20 8
Poultry (hens)2 55 90 2 Poultry (broiler, turkeys)2 55 75 5
Swine3 40 90 2 Dairy4 21 32 14
1 data from Eghball and Power [1999] and Eghball [2000] 2 data from Moore et al. [1998] 3 data from Hatfield et al. [1998] 4 data from Motavalli et al. [1989]
4.2. Phosphorous Contamination
Phosphorous contamination in drinking water is not dangerous to human health. In surface
waters, P is a limiting nutrient for plant and algae growth. The addition of P to surface waters
32
adsorption to colloids.
from agriculture has been identified as a major cause of the acceleration of fresh water
eutrophication and the resulting destruction of natural wetland and surface water environments.
Most of the P contamination of freshwater is derived from erosion of surface soil with high
concentrations of adsorped P or runoff carrying soluble P. In many cases, the movement of P
through the soil profile can be negligible [Hansen et al., 2002].
In cases with soils with low P sorption capacity (low clay content, or low pH) or with high P
content due to year over year of over-application, the leaching of P to groundwater can be an
When present in groundwaters, P does not biodegrade or change into benign forms such as
nitrate. It only has one important oxidation state in groundwater and is removed from the
aqueous phase by adsorption on geologic media or precipitation by minerals. These processes
can account for a substantial amount of phosphorus removal from the aqueous phase of leachate
water, greatly retarding the transport of P in groundwaters [Colman, 2005]. Schoenau et al.
[2000] and Foth [1990] also report that P is generally fixed to soils by precipitation and
important (though minor) pathway for movement to surface waters [Kleinman et al., 2003;
Hansen et al., 2002]. Isolated cases have been reported where subsurface transport of
phosphorous exceeded the surface (erosion and runoff) transport of phosphorous, via large
macro-pores and preferential flow channels during large rainfall events [Howard et al., 1999].
4.2.1. Geochemical Controls on Phosphorous
Adsorption is a reaction between the surface of the soils particles and the soluble and plant
available P. Soils with high specific surface area (clays, with high clay content or organic matter)
have a higher P retention capacity [Flaten, 2002; Hansen et al., 2002]. Thus, soils with high clay
content have the highest P sorption capacity while sandy soils have the lowest P sorption
capacity [Hansen et al., 2002]. Because P is present as an amphoteric oxyanion in water, it may
strongly bind with metal hydroxides of aluminum and iron at groundwater-solid surface sites.
The adsorption of oxyanions on pure metal hydroxide surfaces is well known [Dzombak and
Morel, 1990; Moldovan et al., 2003; Moldovan and Hendry, 2005]. Because P is an oxyanion, its
adsorption changes with pH and cation concentrations.
33
Little is known about the reactions involving the precipitation of P in minerals. The iron-
phosphate minerals vivianite and strengite [Parkhurst et al., 2003] and the aluminum-phosphate
mineral variscite [Robertson, 2003] are typically supersaturated in wastewater plumes [Colman,
2005], suggesting their formation is kinetically driven. Although P has only one oxidation state
in groundwater, the common metals with which it forms minerals are controlled by redox
conditions in the groundwater. As a result, the migration of P in groundwaters should be
considered in light of redox controls [Hendry et al., 2007].
Excess soluble P can begin to leach through the soil profile when the soils become saturated or
the amount of adsorbed P is nearing the sorption capacity of the soil. This only occurs with long-
term excessive application of P to soils [Hansen et al., 2002; Kleinman et al., 2003]. Thus, the
soil P sorption capacity is strongly linked to the phosphorous leaching potential [Kleinman et al.,
2003; McDowell et al., 2002].
4.2.2. Fate of Phosphorous from Manure Spreading
As was the case for N, P in manure exists in both organic and inorganic (soluble and adsorbed)
forms. Organic P is a part of all living organisms, including microbial tissues and plant residue,
and is the principal form of P in the manure of most animals.
The concentrations and ratios of the organic and inorganic forms are strongly dependant of the
source of the manure (type of livestock). Flaten [2003] provides ranges of the inorganic to
organic P content ratio from 1:1 up to 4:1 for all manure types. He and Honeycutt [2001] report
cattle manure with 44% organic P; Eghball et al. [2002] indicate >75% of the total P from spread
cattle manure is typically inorganic, and 85% of the total P is available (inorganic) by the end of
the first year. Brookes et al. [1997] and Scoumans and Groenendijk [2000] show the organic P
content ratio can be as high as 9:1 for swine manure. Chapter 6 discusses the variability in
manure chemistry in more detail.
Soluble P is sometimes termed available inorganic P. Orthophosphate-P is the form of inorganic
P used by plants, and is also the form subject to loss by dissolution in runoff and to a lesser
extent, leaching. Unavailable (to plant uptake) P is adsorbed P, which is susceptible to erosion
along with the material (clay or organic matter) to which it is adsorbed.
34
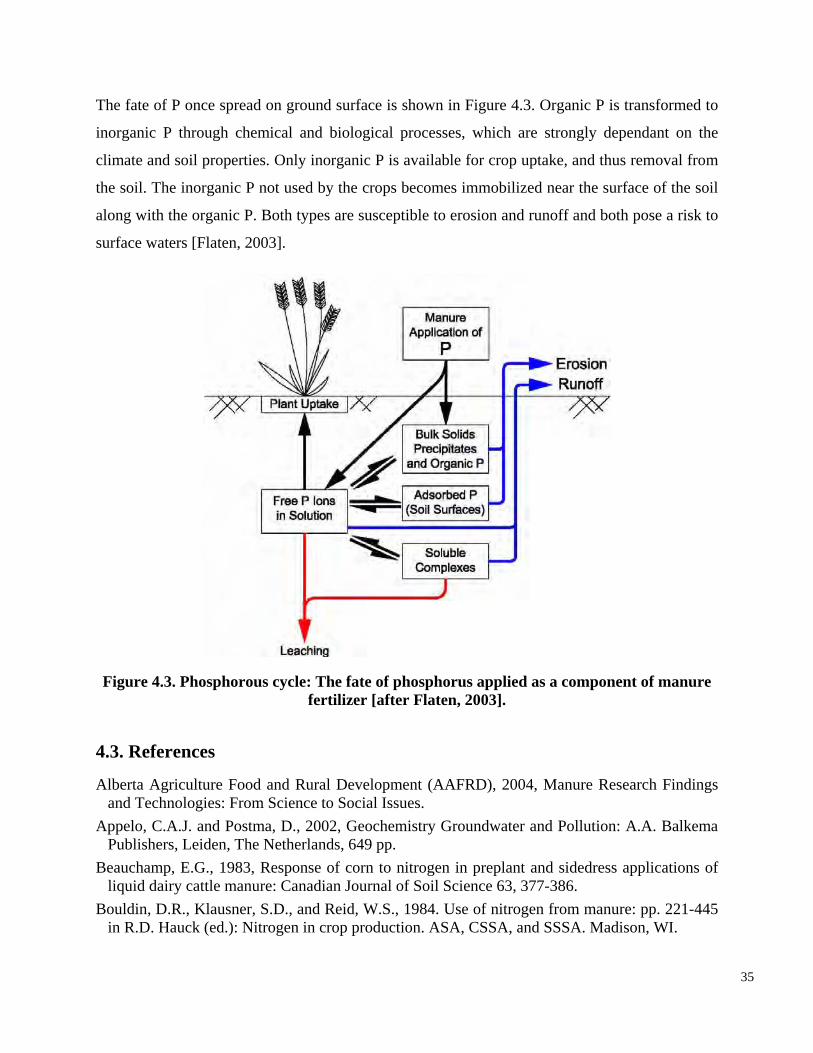
The fate of P once spread on ground surface is shown in Figure 4.3. Organic P is transformed to
inorganic P through chemical and biological processes, which are strongly dependant on the
climate and soil properties. Only inorganic P is available for crop uptake, and thus removal from
the soil. The inorganic P not used by the crops becomes immobilized near the surface of the soil
along with the organic P. Both types are susceptible to erosion and runoff and both pose a risk to
surface waters [Flaten, 2003].
Figure 4.3. Phosphorous cycle: The fate of phosphorus applied as a component of manure fertilizer [after Flaten, 2003].
4.3. References
Alberta Agriculture Food and Rural Development (AAFRD), 2004, Manure Research Findings and Technologies: From Science to Social Issues.
Appelo, C.A.J. and Postma, D., 2002, Geochemistry Groundwater and Pollution: A.A. Balkema Publishers, Leiden, The Netherlands, 649 pp.
Beauchamp, E.G., 1983, Response of corn to nitrogen in preplant and sidedress applications of liquid dairy cattle manure: Canadian Journal of Soil Science 63, 377-386.
Bouldin, D.R., Klausner, S.D., and Reid, W.S., 1984. Use of nitrogen from manure: pp. 221-445 in R.D. Hauck (ed.): Nitrogen in crop production. ASA, CSSA, and SSSA. Madison, WI.
35
Brookes, P.C., Heckrath, G., DeSmet, J., Hofman, G., and Vanderdeelen, J., 1997, Losses of phosphorus in drainage water: pp. 253-271 in Tunney H., Carton, O.T., Brookes, P.C., and Johnston, A.E. (eds), Phosphorus loss from soil water: CAB International, Wallingford, UK. pp. 253-271.
Cambardella, C.A., Moorman, T.B., Jaynes, D.B., Hatfield, J.L., Parkin, T.B., Simpkins, W.W., and Karlen, D.L., 1999. Water quality in Walnut Creek watershed: nitrate-nitrogen in soils, subsurface drainage water, and shallow groundwater: Journal of Environmental Quality 28, 2534.
Chang, C., and Janzen, H.H., 1996, Long-term fate of nitrogen from annual feedlot manure
aquifers: U.S.G.S. Scientific investigation report 2004-5299, 34 pp. Dzombak D.A. and Morel, F.M.M., 1990, Surface complexation modeling – hydrous ferric
oxide: New York, Wiley Publishers, 393 pp. Eghball, B., 2000, Nitrogen mineralization from field-applied beef cattle feedlot manure or
compost: Soil Science Society of America Journal 64, 2024-2030. Eghball, B., and Power, J.F., 1999, Phosphorus- and Nitrogen-Based Manure and Compost
Applications: Soil Science Society of America Journal 63(4): 895-901. Eghball, B., Wienhold, B.J., Gilley, J.E., and Eigenberg, R.A., 2002, Mineralization of manure
nutrients: Journal of Soil and Water Conservation 57(6): 470-473. Farrell, R.E., Sandercock, P.J., Pennock, D.J., and Van Kessel, C., 1996, Landscape-scale
variations in leached nitrate: relationship to denitrification and natural nitrogen-15 abundance: Soil Science Society of America Journal 60, 1410-1415.
applications: Journal of Environmental Quality 25(4): 785-790. Chang, C., and Entz, T., 1996, Nitrate leaching losses under repeated cattle feedlot manure
applications in Southern Alberta: Journal of Environmental Quality, 25(1): 145-153. Choudhary, M., Bailey, L.D., and Grant, C.A., 1996, Review of the use of swine manure in crop
production: effects on yield and composition and on soil and water quality. Waste Management and Research 14(6): 581-595.
Colman, J.A., 2005, Response curves for phosphorus plume lengths from reactive-solutetransport simulations of onland disposal of wastewater in noncarbonated sand and gravel
Flaten, D., 2003, The Risk of Phosphorus Transfer to Water from Manure Application onto Agricultural Land. In 46th Annual Manitoba Society of Soil Science Meeting, Winnipeg, MB. January 2003.
Foth, H.D., 1990, Fundamentals of Soil Science, 8th ed.: John Wiley and Sons Inc. U.S.A. Fujikawa, J.I., and Hendry, M.J., 1991, Denitrification rates in till: Journal of Hydrology 127,
337-348. Gambrell, R.P., Gillham, J.W., and Weed, S.B., 1975, Denitrification of subsoils of North
Carolina coastal plain as affected by soil drainage: Journal of Environmental Quality 4, 311316.
Geyer, D.J., Keller, C.K., Smith, J.L., and Johnstone, D.L., 1992, Subsurface fate of nitrate as a function of depth and landscape position in Missouri Flats Creek watershed U.S.A.: Journal of Contaminant Hydrology 11, 127-147.
36
Research 28, 1657-1668.
nitrogen cycle. Plenum Press, New York. Pp 145-156.
Gillham, J.W., Daniels, R.B., and Lutz, J.F., 1974, Nitrogen content in shallow ground water in the North Carolina coastal plain: Journal of Environmental Quality 3, 147.
Gillham, R.W., Starr, R.C., and Miller, D.J., 1990, A device for in situ determination of geochemical transport parameters. 2. Biochemical reactions: Groundwater Journal 28(6), 858862.
Hansen, N.C., Daniel, T.C., Sharpley, A.N., and Lemunyon, J.L., 2002, The fate and transport of phosphorus in agricultural systems: Journal of Soil and Water Conservation 57(6): 408-416.
Hatfield, J.C., Brumm, M.C., and Melvin, S.W., 1998, Chapter 4. Swine Manure Management. In Agricultural Uses of Municipal, Animal, and Industrial Byproducts: United States Department of Agriculture. pp. 78-90.
He, Z., and Honeycutt, C.W., 2001, Enzymatic characterization of organic phosphorus in animal
nitrate in a glacial till of southern Alberta, Canada: Journal of Hydrology 70, 177-198. Hendry, M.J., Gillham, R.W., and Cherry, J.A., 1983, An integrated approach to the study of
groundwater flow - A case study: Journal of Hydrology 63, 211-232. Howard, A.E., Olson, B.M., and Cooke, S., 1999, Impact of Soil Phosphorus Loading on Water
Quality in Alberta: A Review, Alberta Agriculture, Food and Rural Development. Kimble, J.M., Bartlett, R.J., McIntosh, J.L., and Varney, K.E., 1972, Fate of nitrate from manure
and inorganic nitrogen in clay soil cropped to continuous corn: Journal of Environmental Quality 1, 413-415.
Kleinman, P.J.A., Needelman, B.A., Sharpley, A.N., and McDowell, R.W., 2003, Using soil phosphorus profile data to assess phosphorus leaching potential in manured soils: Soil Science Society of America Journal 67(1): 215-224.
Korum, S.F., 1992, Natural denitrification in the saturated zone: a review: Water Resources
manure: Journal of Environmental Quality 30: 1685-1692. Hendry, M.J., Shaw, S., Barbour, S.L., Salamone, T.B., and Fonstad, T., 2007, Impact of Manure
Collection and Storage Facilities on Groundwater in, Alberta Agriculture, Food and Rural Development Resource Management and Irrigation Division Conservation and Development Branch.
Hendry, M.J., McCready, R.G.L., and Gould, W.D., 1984, Distribution, source and evolution of
Lind, A.M., 1985, Nitrate reduction in the subsoil. In: Golterman H.L.(ed) Denitrification in the
Loro, P.J., Bergstrom, D.W., and Beauchamp, E.G., 1997, Intensity and duration of denitrification following application of manure and fertilizer to soil: Journal of Environmental Quality 26, 706-713.
McDowell, R., Sharpley, A., and Withers, P., 2002, Indicator to predict the movement of phosphorus from soil to subsurface flow: Environmental Science and Technology 36(7): 15051509.
Mercado, A., Libhaber, M., and Soares, M.I.N., 1988, In situ biological groundwater denitrification – concepts and preliminary field-tests: Water Science and Techlology 20(3): 197-209.
37
Moore, P.A., Daniel, T.C., Sharpley, A.N., and Wood, C.W., 1998, Chapter 3 Poultry Manure Management. In Agricultural Uses of Municipal, Animal, and Industrial By products. United States Department of Agriculture. pp. 60-77.
Motavalli, P.P., Kelling, K.A., and Converse, J.C., 1989, First-year nutrient availability from injected dairy manure: Journal of Environmental Quality 18, 180-185.
Moldovan, B. J., and Hendry, M.J., 2005, Characterizing and quantifying controls on arsenic solubility over a pH range of 1-11 in a uranium mill-scale experiment: Environmental Science and Technology 39, 4913-4920.
Moldovan, B.J., Jiang, D.-T., and Hendry, M.J., 2003, Mineralogical characterization of arsenic
Massachusetts: U.S. Geol. Surv. Water-Resources Invest. Report 03-4017, 33 pp. Robertson, W.D., 2003, Enhanced attenuation of septic system phosphate in noncalcareous
sediments: Ground Water 41, 48-56. Rodvang, S.J., and Simpkins, W.W., 2001, Agricultural contaminants in Quaternary aquitards: A
review of occurrence and fate in North America: Hydrogeology Journal 9, 44-59. Schoenau, J.J., and Assefa, B., 2004, Land application and handling of manure: In Science to
Social Issues, Ed. by Amrani, M., 97-148 pp. Schoenau, J.J., Bolton, K., and Panchuk, K., 2000, Managing Manure as a fertilizer. Farm Facts.
Saskatchewan Agriculture and Food. ISSN 0840-9447. Scoumans, O.F., and Groenendijk, P., 2000, Modeling soil phosphorus levels and phosphorus
leaching from agricultural land in the Netherlands: Journal of Environmental Quality 10: 160-
in uranium mine tailings precipitated from iron-rich hydrometallurgical solutions: Environmental Science and Technology 37, 873-879.
Parkin, T.B., and Meisinger, J.J., 1989, Denitrification below the crop rooting zone as influenced by surface tillage: Journal of Environmental Quality 18(1), 12-16.
Paul, E.A., and Clark, F.E., 1996, Soil Microbiology and Chemistry: Academic Press, San Diego, CA.
Parkhurst, D.L., Stollenwerk, K.G., and Coleman, J.A., 2003, Reactive-transport simulation of phosphorus in the sewage plume at the Massachusetts Military Reservation, Cape Cod,
165. Sutton, A.L., 1994, Proper animal manure utilization: Journal of Soil and Water Conservation
49, 65-70. Tindall, J.A., Petrusak, R.L., and McMahon, P.B., 1995, Nitrate transport and transformation
processes in unsaturated porous media. Journal of Hydrology 169, 51-94. Trudell M.R., Gillham, R.W., and Cherry, J.A., 1986, An in situ study of the occurrence and rate
of dentrification in a shallow unconfined sand aquifer: Journal of Hydrology 83 (3-4), 251-268. United States Environmental Protection Agency (USEPA), 2002. Nitrification. Distribution
System Issue Paper, http://epa.gov/OGWDW/disinfection/tcr/pdfs/whitepaper_tcr_nitrification.pdf
Wassenaar, L.I., Hendry, M.J., and Harrington, N., 2006, Decadal Geochemical and Isotopic Trends for Nitrate in a Transboundary Aquifer and Implications for Agricultural Beneficial Management Practices: Environmental Sciences and Technology 40 (15), 4626 -4632.
38
5. PHYSICAL CONTROLS ON THE MIGRATION OF CONTAMINANTS FROM MANURE IN THE SUBSURFACE
In addition to the geochemical controls on N and P derived from surface applied manure as
described in Chapter 4, physical factors also exert a control on the migration of water and
contaminants into the subsurface. These include: climatic conditions (i.e., precipitation and
evapotranspiration), irrigation, topography, and hydrogeology. The receptors for contaminants
derived from manure could include nearby groundwater wells or surface water bodies (e.g.,
streams or lake) into which the groundwater discharges or deeper groundwater flow systems.
5.1. Climate
Alberta has a continental climate with warm summers and cold winters [AAF, 2007]. The
agricultural area of the province has a semiarid climate because the annual precipitation is less
than the water evaporated by the wind and heat and transpired by plants.
Temperatures are generally greater in southern than in northern Alberta. In July, the average
daily temperature ranges from warmer than 18°C in the south to cooler than 13°C in the Rocky
Mountains and the north. In January, the average daily temperature ranges from cooler than
24°C in the far north to warmer than -10°C in the south and the mountains. The warming effect
of the Chinook winds near the mountains produces a west (warmer) to east (cooler) trend in
winter temperatures.
Precipitation (Map A6) is generally greatest along the mountains and into west central Alberta.
Precipitation from May 1 to August 31 varies from slightly below 200 millimetres (mm) in the
driest Prairie areas to more than 325 mm in the mountains. From September 1 to April 30,
precipitation ranges from less than 150 mm in the driest Prairie region to greater than 275 mm in
the mountains.
Evapotranspiration (ET) is the rate loss of soil moisture as the net result of evaporation and
transpiration; neither can be measured directly and therefore must be estimated using energy
balance calculations. Evapotranspiration can be calculated from available formulas that include
temperature, wind, solar radiation, sunshine duration, relative humidity and vegetation. Similar
factors (with the exception of vegetation) are used in the calculation of the evaporation rate from
lakes (Map A7) and can provide the spatial variability of the evapotranspiration within Alberta.
39
Due to the distribution of daylight hours and temperature, south-western Alberta has the highest
potential for evapotranspiration with this potential decreasing with increasing latitude. The
increased humidity and cloud cover in west-central Alberta, from increased precipitation,
reduces the potential evapotranspiration for that area causing a variation to the north south
gradient.
The net moisture (water) balance for the soils (precipitation less potential evapotranspiration)
(Map A8) follows the pattern of the precipitation and is generally greatest along the mountains
Climate strongly influences many of the other characteristics in an ecoregion, such as soils,
vegetation, water, fauna and land use.
In the agricultural area of Alberta, the Mixed Grasslands in southeastern Alberta have the lowest
precipitation and hottest summers. Moving west and north through the Moist Mixed Grasslands,
Aspen Parkland, Boreal Transition and Western Alberta Uplands, the climate becomes moister
and cooler. The Peace River Region is an exception, with relatively warm summer temperatures
and low precipitation for its latitude. The long daylight hours during summer days in the Peace
River Region improves the agricultural potential of this area.
and into west-central Alberta. In all but a few areas along south-west and west-central Alberta,
an average annual moisture deficit is maintained, with the driest areas in the south-east of
Alberta.
In general, climate regions can be represented by ecoregions (Map A9). An ecoregion is an area
of similar climate, physiography, vegetation, soil, water, fauna and land use characteristics.
5.2. Irrigation
The majority of the irrigation in Alberta is located in the drier southern areas (Map A10), with
1,207,000 irrigated acres (488,500 ha) occurring within the thirteen irrigation districts in the
southern part of the Province (Map A11). An additional 2,888 individual projects irrigate
approximately 297,000 acres (120,000 ha) [AAFRD, 2007].
Rates of irrigation are provided by AAFRD [2007] for the southern regions of the province (for
Lethbridge, Bow Island, and Brooks areas). These rates, calculated from the annual cop water
demand (for a three cut Alfalfa crop) less the average precipitation in the growing season
40
average from 1928 through to 2006, range from 438 to 480 mm of irrigation. From the total
annual diversion (averaged from 1972 to 2006) of 1,750,000 acre-feet of water from the Oldman
River and Bow River basins, this results in an average of 442 mm of water applied to the
1,207,000 acres of irrigated land (neglecting losses in the system). This rate of irrigation could
bring the average soil deficit in these areas to a slight soil moisture surplus. This calculation is
supported by Grace and Hobbs [1986] who state the annual irrigation amounts, generally about
300 to 450 mm/year, significantly reduce the annual moisture deficit. The application of
irrigation water has been shown to notably increase the downward migration of solutes through
Chernozemic soils, typical of grassland soils, are well to imperfectly drained. Soil profiles have
brown to black A horizons with brownish B horizons and are underlain by light-colored C
horizons with lime accumulations. Depth to lime is a function of long-term moisture penetration,
reflecting the lack of natural leaching potential and supporting the net ET loss in these areas
(Map A8). Lime is generally present at depths of 100 to 120 cm in central and northern Alberta,
but at depths of 30 to 40 cm in southern Alberta. The lack of long-term downward migration of
water in the soils is a reflection of the net water deficit in the south, which should also result in a
limited depth of penetration of contaminants derived from the application of manure to dryland
soils (Chapter 7). However, during periodic intense rainfall events or during spring snowmelt the
soils in Alberta [c.f., Chang and Entz, 1996] (Chapter 7).
5.3. Soils
Mixed Grassland is dominated by Brown Chernozemic soils, Moist Mixed Grassland by Dark
Brown Chernozems, and Fescue Grassland and Aspen Parkland by Black Chernozems.
accumulation of contaminants proximal to the lime layer will provide sporadic pulses of
contaminants to the deeper media and the groundwater regime. Deep migration of contaminants
in the subsurface as a result of a rainfall event is supported by studies by Chang and Entz [1996]
and Schuh et al. [1997]. Chang and Entz [1996] show leaching in southern Alberta is minimal
below 1.5 m, except during years with unusually high precipitation. Schuh et al. [1997] observed
the rapid migration of a bromide tracer to a depth of 6 m in a shallow, fractured, weathered till in
North Dakota immediately following a rainfall event.
41
5.4. Geologic Controls on the Migration of Water and Contaminants
The Quaternary geology of the Albertan Grassland and Peace Lowland regions is dominated by
till, a poorly sorted mixture of sand, silt and clay, and glaciolacustrine deposits, dominated by
well sorted and stratified silt and clay but with some sand. Outwash deposits, consisting of
coarse textured sands and gravels, are much less common. For example, in the Canadian Interior
Plains, of which Alberta is part, till makes up more than ~60% of the surficial geology,
glaciolacustrine deposits make up about ~40%, and outwash makes up less that 1% [Meyboom,
1967]. A detailed discussion of clay-rich till and lacustrine deposits as well as sand layering in
present in the weathered zones and can be present (or absent) in unweathered zones. Fractures
can be difficult to characterize in the unweathered zones. The fractures provide conduits for
water and contaminants to migrate at greater velocities than in non-fractured environments.
Much of the Canadian Prairies, and specifically Alberta, is characterized by a large water deficit
where potential evaporation exceeds precipitation. Groundwater recharge under such conditions
is generally lacking, demonstrate by the presence of a lime layer, reflecting the lack of natural
leaching potential, at depths of 30 to 120 cm. Of particular importance to the downward
contaminants in Alberta is
western Canada is provided in Appendix D.
The near surface hydrogeology of Alberta is dominated by aquitards, consisting of clay-rich till
and lacustrine deposits, and, to a lesser extent, aquifers consisting of glacial outwash. The till and
lacustrine deposits can be characterized as either weathered or unweathered media. Fracturing is
The effects of manure spreading in areas where depression-focused recharge occurs can be
significant. Depressions are usually cultivated and, as such, can receive land-applied manure.
The focused infiltration of water in these depressions can result in the rapid leaching of the
recharge water to the water table, carrying with it contaminants derived from the manure. The
42
migration of the existence of depression-focussed recharge.
Depressions concentrate the runoff generated by spring thaws and heavy rainfall events into a
small area, resulting in sufficiently large infiltration events that can exceed evaporation and
recharge the groundwater below the root zone [Berthold et al., 2004]. A detailed discussion of
topographic effects on water and solute transport as well as effects of diffusion vs. advection of
solutes in fractured media is provided in Appendix D.
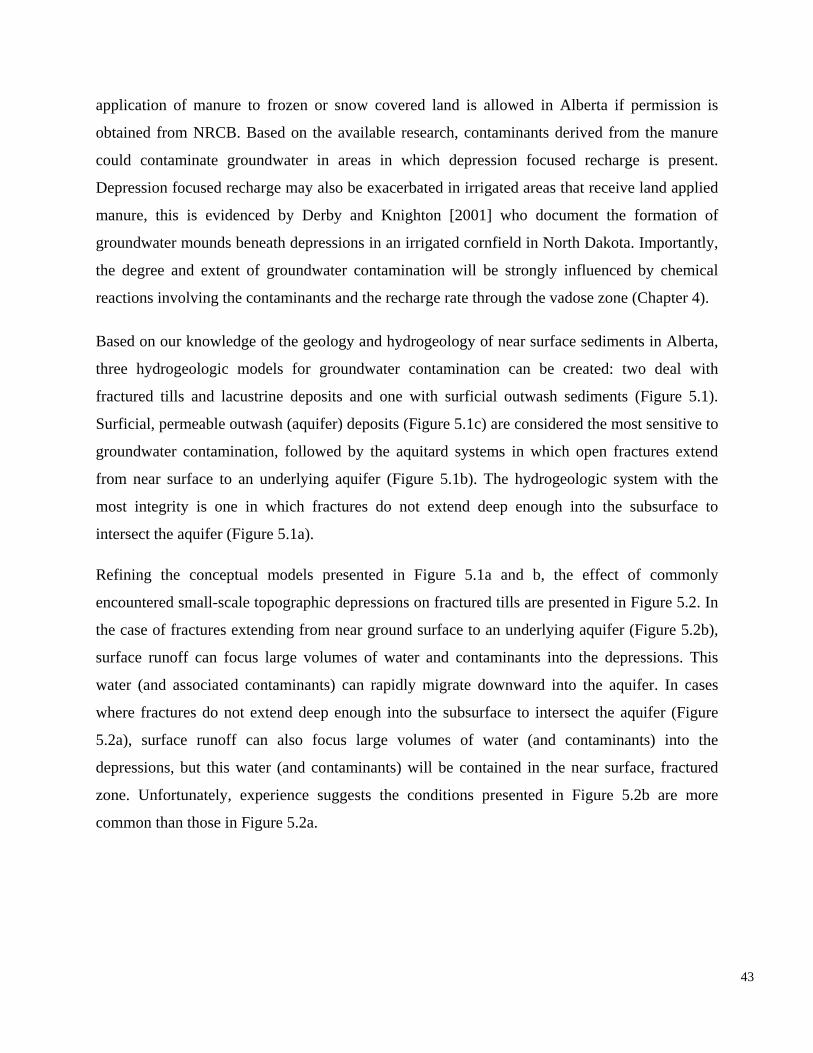
application of manure to frozen or snow covered land is allowed in Alberta if permission is
obtained from NRCB. Based on the available research, contaminants derived from the manure
could contaminate groundwater in areas in which depression focused recharge is present.
Depression focused recharge may also be exacerbated in irrigated areas that receive land applied
manure, this is evidenced by Derby and Knighton [2001] who document the formation of
groundwater mounds beneath depressions in an irrigated cornfield in North Dakota. Importantly,
the degree and extent of groundwater contamination will be strongly influenced by chemical
reactions involving the contaminants and the recharge rate through the vadose zone (Chapter 4).
Based on our knowledge of the geology and hydrogeology of near surface sediments in Alberta,
three hydrogeologic models for groundwater contamination can be created: two deal with
fractured tills and lacustrine deposits and one with surficial outwash sediments (Figure 5.1).
Surficial, permeable outwash (aquifer) deposits (Figure 5.1c) are considered the most sensitive to
water (and associated contaminants) can rapidly migrate downward into the aquifer. In cases
where fractures do not extend deep enough into the subsurface to intersect the aquifer (Figure
5.2a), surface runoff can also focus large volumes of water (and contaminants) into the
depressions, but this water (and contaminants) will be contained in the near surface, fractured
zone. Unfortunately, experience suggests the conditions presented in Figure 5.2b are more
common than those in Figure 5.2a.
groundwater contamination, followed by the aquitard systems in which open fractures extend
from near surface to an underlying aquifer (Figure 5.1b). The hydrogeologic system with the
most integrity is one in which fractures do not extend deep enough into the subsurface to
intersect the aquifer (Figure 5.1a).
Refining the conceptual models presented in Figure 5.1a and b, the effect of commonly
encountered small-scale topographic depressions on fractured tills are presented in Figure 5.2. In
the case of fractures extending from near ground surface to an underlying aquifer (Figure 5.2b),
surface runoff can focus large volumes of water and contaminants into the depressions. This
43
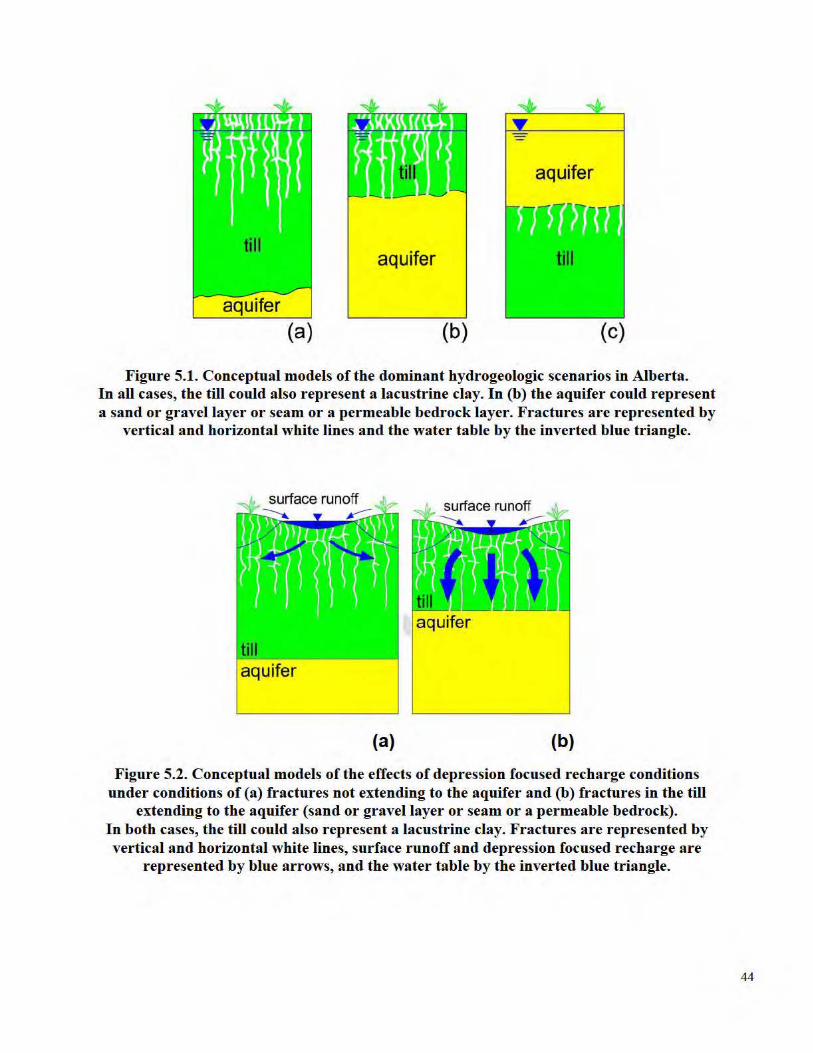
5.5. References
Alberta Agriculture and Food (AAF), 2007, Agroclimatic Atlas of Alberta. Accessed March 10, 2008. http://www1.agric.gov.ab.ca/$department/deptdocs.nsf/all/sag6278
Alberta Agriculture, Food and Rural Development (AAFRD), 2007, Alberta Irrigation Information 2006.
Berthold, S., Bentley, L.R., and Hayashi, M., 2004, Integrated hydrogeological and geophysical study of depression-focused groundwater recharge in the Canadian prairies: Water Resources Research 40, W06505, doi:10.1029/2003WR002982.
Chang, C., and Entz, T., 1996, Nitrate leaching losses under repeated cattle feedlot manure applications in Southern Alberta: Journal of Environmental Quality 25(1), 145-153.
Derby, N.E., and Knighton, R.E., 2001, Field-scale preferential transport of water and chloride tracer by depression-focused recharge: Journal of Environmental Quality 30, 194-199.
Grace, B. and Hobbs, E.H., 1986, The climate of the Lethbridge agricultural area: 1902-1985. Lethbridge Research Station Mimeo. Report 3. Res. Branch Agric. Canada, Lethbridge, AB.
Meyboom, P., 1967, Interior plains hydrogeological region. In: I.C. Brown (ed) Groundwater in Canada. Geol. Surv. Can. Econ. Rep. 24, pp 131-158.
Schuh, W.M., Klinkebiel, D.L., Gardner, J.C., and Meyer, R.F., 1997, Tracer and nitrate movement to groundwater in the Northern Great Plains, Journal of Environmental Quality 26, 1335-1347.
45
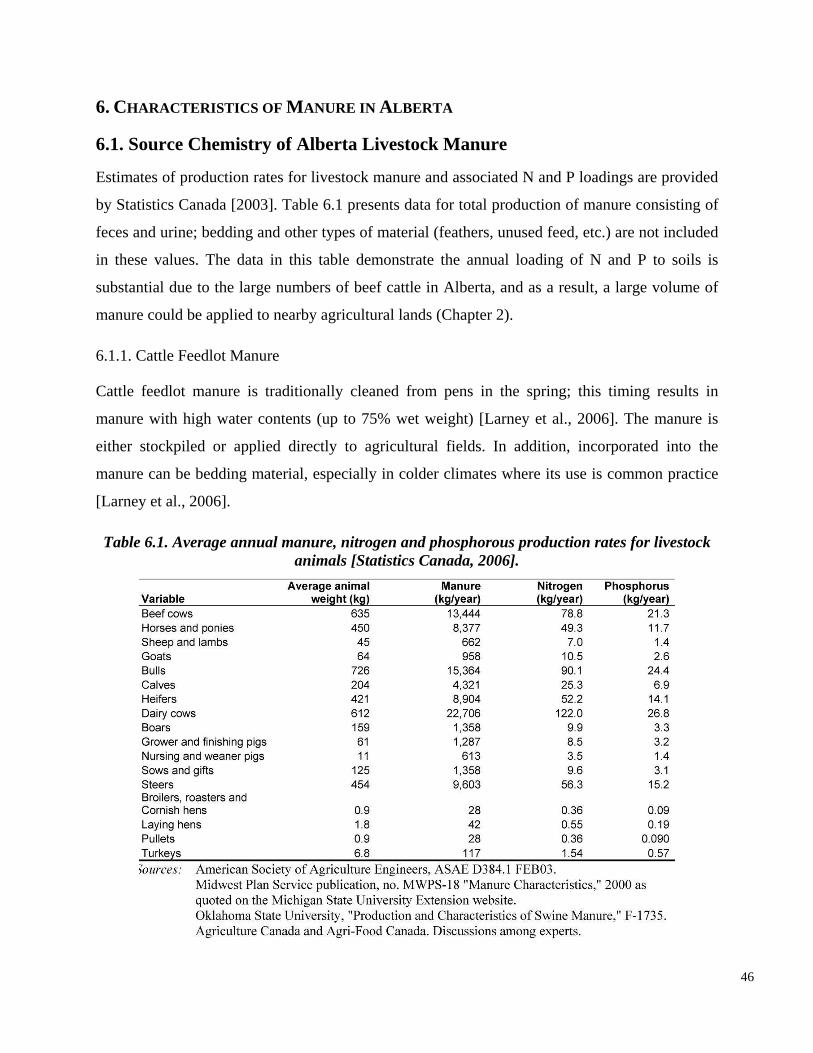
6. CHARACTERISTICS OF MANURE IN ALBERTA
6.1. Source Chemistry of Alberta Livestock Manure
Estimates of production rates for livestock manure and associated N and P loadings are provided
by Statistics Canada [2003]. Table 6.1 presents data for total production of manure consisting of
feces and urine; bedding and other types of material (feathers, unused feed, etc.) are not included
in these values. The data in this table demonstrate the annual loading of N and P to soils is
substantial due to the large numbers of beef cattle in Alberta, and as a result, a large volume of
manure could be applied to nearby agricultural lands (Chapter 2).
6.1.1. Cattle Feedlot Manure
[Larney et al., 2006].
Cattle feedlot manure is traditionally cleaned from pens in the spring; this timing results in
manure with high water contents (up to 75% wet weight) [Larney et al., 2006]. The manure is
either stockpiled or applied directly to agricultural fields. In addition, incorporated into the
manure can be bedding material, especially in colder climates where its use is common practice
Table 6.1. Average annual manure, nitrogen and phosphorous production rates for livestock animals [Statistics Canada, 2006].
46
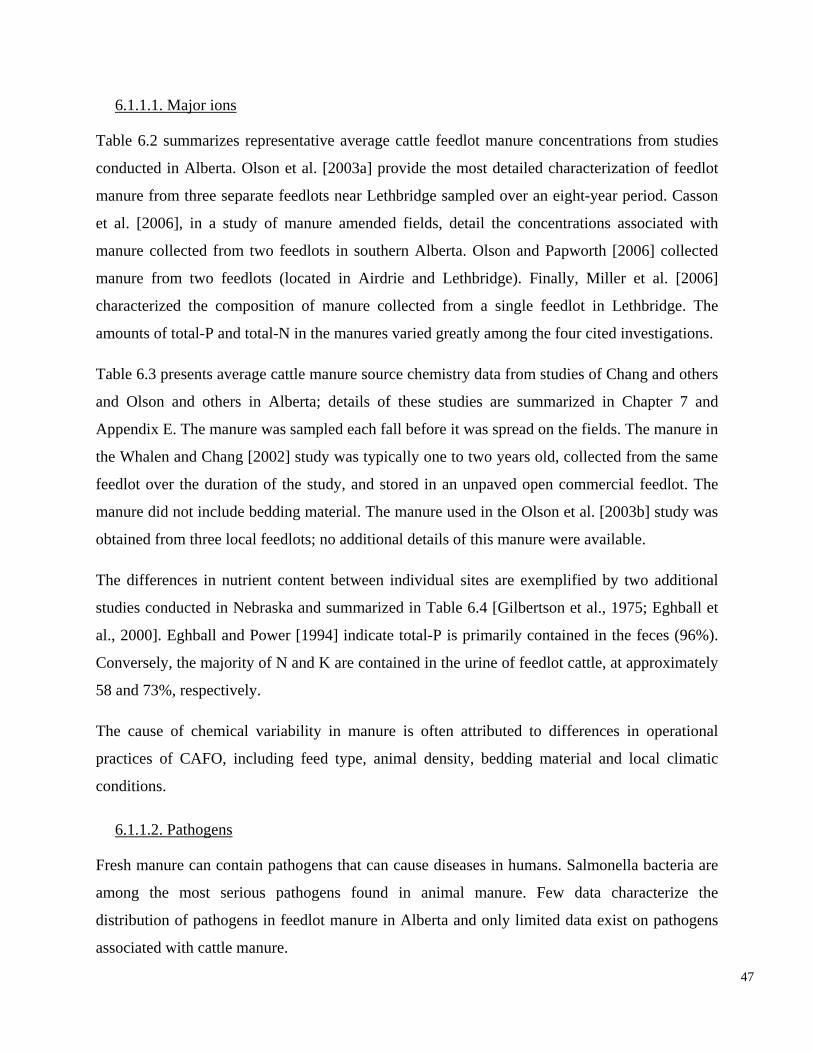
58 and 73%, respectively.
6.1.1.1. Major ions
Table 6.2 summarizes representative average cattle feedlot manure concentrations from studies
conducted in Alberta. Olson et al. [2003a] provide the most detailed characterization of feedlot
manure from three separate feedlots near Lethbridge sampled over an eight-year period. Casson
et al. [2006], in a study of manure amended fields, detail the concentrations associated with
manure collected from two feedlots in southern Alberta. Olson and Papworth [2006] collected
manure from two feedlots (located in Airdrie and Lethbridge). Finally, Miller et al. [2006]
characterized the composition of manure collected from a single feedlot in Lethbridge. The
amounts of total-P and total-N in the manures varied greatly among the four cited investigations.
Table 6.3 presents average cattle manure source chemistry data from studies of Chang and others
and Olson and others in Alberta; details of these studies are summarized in Chapter 7 and
Appendix E. The manure was sampled each fall before it was spread on the fields. The manure in
The cause of chemical variability in manure is often attributed to differences in operational
practices of CAFO, including feed type, animal density, bedding material and local climatic
conditions.
6.1.1.2. Pathogens
Fresh manure can contain pathogens that can cause diseases in humans. Salmonella bacteria are
among the most serious pathogens found in animal manure. Few data characterize the
distribution of pathogens in feedlot manure in Alberta and only limited data exist on pathogens
associated with cattle manure.
47
the Whalen and Chang [2002] study was typically one to two years old, collected from the same
feedlot over the duration of the study, and stored in an unpaved open commercial feedlot. The
manure did not include bedding material. The manure used in the Olson et al. [2003b] study was
obtained from three local feedlots; no additional details of this manure were available.
The differences in nutrient content between individual sites are exemplified by two additional
studies conducted in Nebraska and summarized in Table 6.4 [Gilbertson et al., 1975; Eghball et
al., 2000]. Eghball and Power [1994] indicate total-P is primarily contained in the feces (96%).
Conversely, the majority of N and K are contained in the urine of feedlot cattle, at approximately
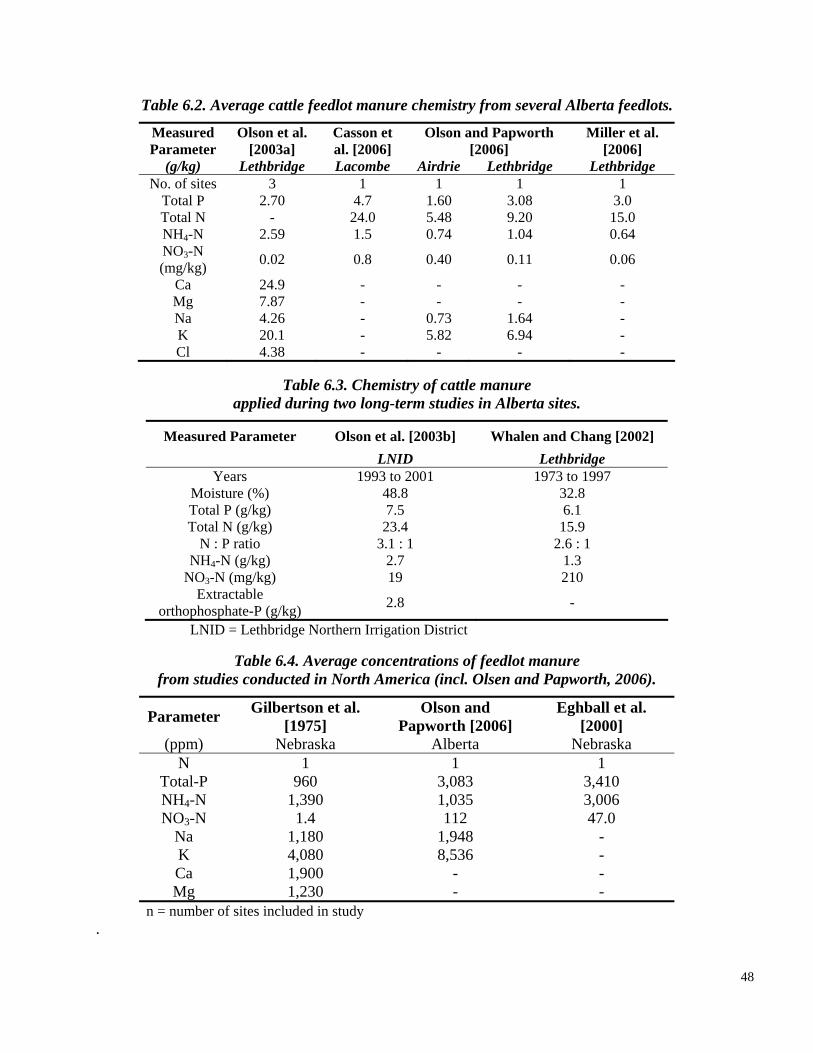
Table 6.2. Average cattle feedlot manure chemistry from several Alberta feedlots.
Measured Olson et al. Casson et Olson and Papworth Miller et al. Parameter [2003a] al. [2006] [2006] [2006]
(g/kg) Lethbridge Lacombe Airdrie Lethbridge Lethbridge No. of sites 3 1 1 1 1
Total P 2.70 4.7 1.60 3.08 3.0 Total N - 24.0 5.48 9.20 15.0 NH4-N 2.59 1.5 0.74 1.04 0.64 NO3-N 0.02 0.8 0.40 0.11 0.06(mg/kg)
Ca 24.9 - - - -Mg 7.87 - - - -Na 4.26 - 0.73 1.64 -K 20.1 - 5.82 6.94 -Cl 4.38 - - - -
Table 6.3. Chemistry of cattle manure applied during two long-term studies in Alberta sites.
Measured Parameter Olson et al. [2003b] Whalen and Chang [2002] LNID Lethbridge
Years 1993 to 2001 1973 to 1997 Moisture (%) 48.8 32.8 Total P (g/kg) 7.5 6.1 Total N (g/kg) 23.4 15.9
N : P ratio 3.1 : 1 2.6 : 1 NH4-N (g/kg) 2.7 1.3
NO3-N (mg/kg) 19 210 Extractable
orthophosphate-P (g/kg) 2.8 -
LNID = Lethbridge Northern Irrigation District
Table 6.4. Average concentrations of feedlot manure from studies conducted in North America (incl. Olsen and Papworth, 2006).
Parameter Gilbertson et al. [1975]
Olson and Papworth [2006]
Eghball et al. [2000]
(ppm) Nebraska Alberta Nebraska N 1 1 1
Total-P 960 3,083 3,410 NH4-N 1,390 1,035 3,006 NO3-N 1.4 112 47.0
Na 1,180 1,948 -K 4,080 8,536 -Ca 1,900 - -Mg 1,230 - -
n = number of sites included in study .
48
The most commonly studied pathogen originating from cattle feedlots is E. coli, specifically E.
coli 0157:H7 [APHIS, 1999; Galland et al., 2001; Burkholder et al., 2007]. In a comprehensive
study involving 11 of the top producing beef cattle states in the US, 73 feedlots were selected
and 25 manure samples taken from three pens on each site over the course of a year [APHIS,
1999]. No geographic trend in pathogen content was observed in the data. In addition, all 73
feedlots had at least one positive test, suggesting E. coli is widely distributed amongst cattle
feedlots in the US. Similarly, in a study of four feedlots in Kansas, only 45 of 24,184 samples
collected were positive for
E. coli
extremely low, human outbreaks of E. coli O157:H7 and Salmonella have originated from a
variety of animals, including cattle [Tuttle et al., 1999; Michel et al., 2006].
Cryptosporidium parvum (C. parvum) is a waterborne pathogen that has been identified within
cattle manure at rates between 0 and 10% (e.g., Villacorta et al. [1991]; Atwill et al. [1998,
2003]; Huetink et al. [2001]) or higher [Scott et al., 1995; Grazyck et al., 2000], with most
studies focused on dairy feedlot cattle [Atwill et al., 2006]. Atwill et al. [2006] investigated the
prevalence of C. parvum by collecting 5274 manure samples from 22 feedlots in seven states and
found detectable levels in only nine samples (0.17%). This is similar to the results of Hoar et al.
[1999] who noted the prevalence of C. parvum in manure collected from feedlot floors (0.18%)
was an order of magnitude less than samples collected directly from the cattle rectum (1.1%),
suggesting C. parvum is susceptible to environmental stresses that reduce the overall
environmental loading of the parasite.
6.1.1.3. Pharmaceuticals
As was the case for pathogens, available data on pharmaceuticals associated with cattle feedlot
manure are lacking.
49
E. coli (0.2%), of which 44 were from manure samples and one was
from a water trough [Galland et al., 2001]. O157:H7 can be recovered from
environmental water for up to 12 weeks [Porter et al., 1997]. This suggests, in the case of field
applied manure, E. coli should not pose an environmental problem to groundwaters because of
the long storage times for manure before being applied to ground surface. Although the
incidence rate of E. coli in cattle feedlots and other CAFO types has been demonstrated to be
6.1.2. Manure Storage Lagoons (Swine, Dairy, Cattle)
6.1.2.1. Major ions
Few examples of swine manure wastewater concentrations are available for Alberta. Olson and
Papworth [2006] characterized swine manure from two separate sites (Airdrie and Lethbridge)
(Table 6.5).
Similar to swine, studies involving characterization of cattle and dairy wastewater are generally
lacking. In a study conducted on a 10-year-old cattle feedlot near Vegreville, Kennedy et al.
[1999] characterized the average concentrations associated with wastewater held in a storage
lagoon (Table 6.6).
Other studies characterizing wastewater in swine EMS sites report significant differences in
solids and nutrient content with depth and between individual sites. These differences are
the dilution of the manure nutrients through the addition of water. The typical swine diet consists
of corn and soybeans, which contain P sources not readily available to swine; therefore,
inorganic sources of P are added to the feedstock. Consequently, high levels of Total-P are
usually present in swine manure. However, the concentration present in the manure wastewater
would be dependent upon the amount of added P and the amount available to the animals at each
individual EMS site. DOC concentrations in swine manure wastewater also vary considerably
between EMS sites, attributed to variations in diet, bedding material and the age of manure
wastewaters [Levi-Minzi et al., 1986]. Similar to NH4-N, the concentration of Cl in swine
wastewater varies considerably between sites, potentially as a result of variation in diet, amount
of urine mixed in with manure solids, and dilution of wastewater through precipitation.
50
exemplified in a comparison of studies summarized in Table 6.7 [Campbell et al., 1997; Ham et
al., 1999; Fonstad et al., 2000; Fonstad, 2004; Fernando et al., 2005].
The large variations in ammonium (NH4-N) in liquid manure may result from variations in solids
content or animal diet. At the time of the Campbell et al. [1997] study, American swine were
sold at a higher finished weight than their Canadian counterparts. Older animals tend be less
efficient at feed conversion, which is reflected in higher nutrient levels in the manure. The lower
wastewater NH4-N values observed by Ham et al. [1999] (Table 6.7) are potentially an artefact
of some American operations where the waste storage system is flushed, which would result in
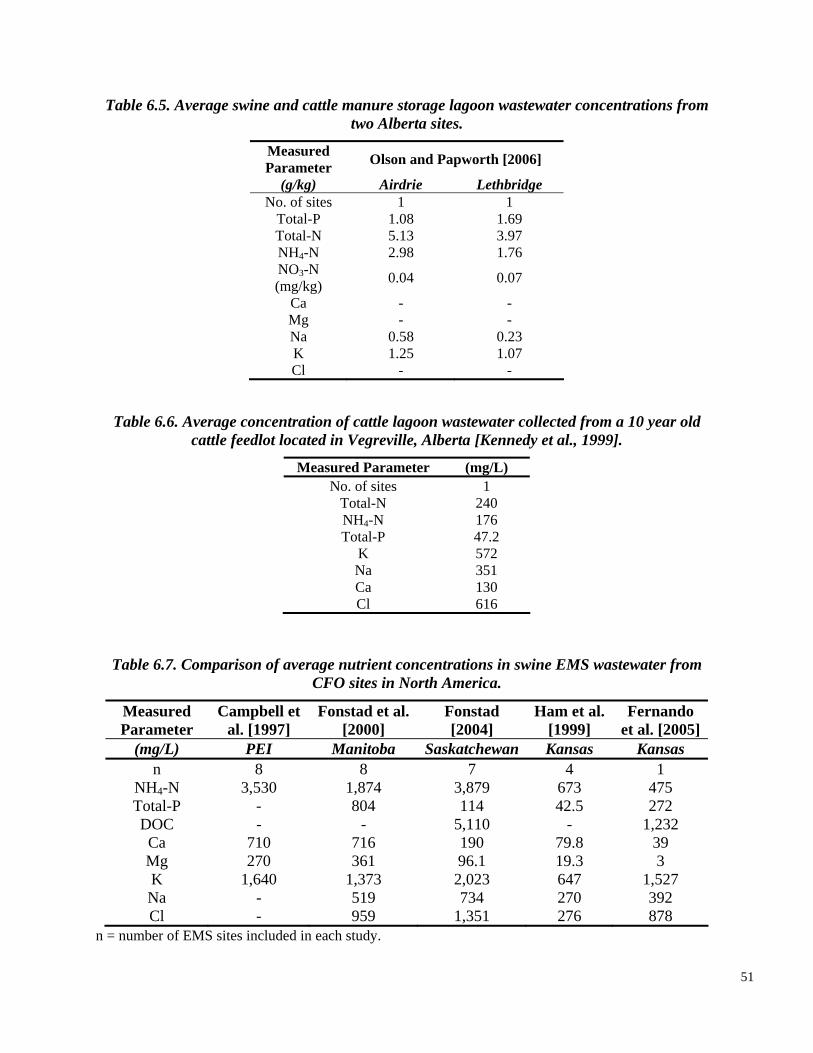
Table 6.5. Average swine and cattle manure storage lagoon wastewater concentrations from two Alberta sites.
Measured Parameter Olson and Papworth [2006]
(g/kg) Airdrie Lethbridge No. of sites 1 1
Total-P 1.08 1.69 Total-N 5.13 3.97 NH4-N 2.98 1.76 NO3-N (mg/kg) 0.04 0.07
Ca - -Mg - -Na 0.58 0.23 K 1.25 1.07 Cl - -
Table 6.6. Average concentration of cattle lagoon wastewater collected from a 10 year old cattle feedlot located in Vegreville, Alberta [Kennedy et al., 1999].
Measured Parameter (mg/L) No. of sites 1
Total-N 240 NH4-N 176 Total-P 47.2
K 572 Na 351 Ca 130 Cl 616
Table 6.7. Comparison of average nutrient concentrations in swine EMS wastewater from CFO sites in North America.
Measured Parameter
Campbell et al. [1997]
Fonstad et al. [2000]
Fonstad [2004]
Ham et al. [1999]
Fernando et al. [2005]
(mg/L) PEI Manitoba Saskatchewan Kansas Kansas n 8 8 7 4 1
NH4-N 3,530 1,874 3,879 673 475 Total-P - 804 114 42.5 272 DOC - - 5,110 - 1,232 Ca 710 716 190 79.8 39 Mg 270 361 96.1 19.3 3 K 1,640 1,373 2,023 647 1,527 Na - 519 734 270 392 Cl - 959 1,351 276 878
n = number of EMS sites included in each study.
51
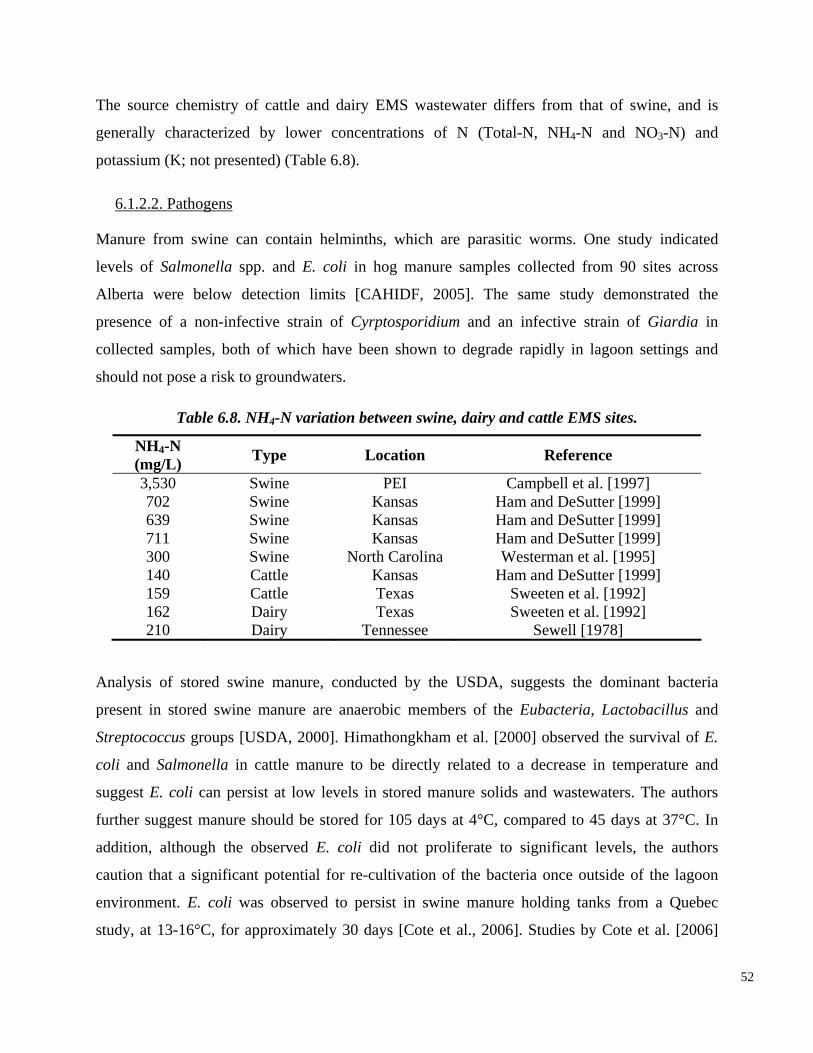
The source chemistry of cattle and dairy EMS wastewater differs from that of swine, and is
generally characterized by lower concentrations of N (Total-N, NH4-N and NO3-N) and
potassium (K; not presented) (Table 6.8).
6.1.2.2. Pathogens
Manure from swine can contain helminths, which are parasitic worms. One study indicated
levels of Salmonella spp. and E. coli in hog manure samples collected from 90 sites across
3,530 Swine PEI Campbell et al. [1997] 702 Swine Kansas Ham and DeSutter [1999] 639 Swine Kansas Ham and DeSutter [1999] 711 Swine Kansas Ham and DeSutter [1999] 300 Swine North Carolina Westerman et al. [1995] 140 Cattle Kansas Ham and DeSutter [1999] 159 Cattle Texas Sweeten et al. [1992] 162 Dairy Texas Sweeten et al. [1992] 210 Dairy Tennessee Sewell [1978]
Analysis of stored swine manure, conducted by the USDA, suggests the dominant bacteria
present in stored swine manure are anaerobic members of the Eubacteria, Lactobacillus and
Streptococcus groups [USDA, 2000]. Himathongkham et al. [2000] observed the survival of E.
coli and Salmonella in cattle manure to be directly related to a decrease in temperature and
suggest E. coli can persist at low levels in stored manure solids and wastewaters. The authors
further suggest manure should be stored for 105 days at 4°C, compared to 45 days at 37°C. In
addition, although the observed E. coli did not proliferate to significant levels, the authors
caution that a significant potential for re-cultivation of the bacteria once outside of the lagoon
environment. E. coli was observed to persist in swine manure holding tanks from a Quebec
study, at 13-16°C, for approximately 30 days [Cote et al., 2006]. Studies by Cote et al. [2006]
52
Alberta were below detection limits [CAHIDF, 2005]. The same study demonstrated the
presence of a non-infective strain of Cyrptosporidium and an infective strain of Giardia in
collected samples, both of which have been shown to degrade rapidly in lagoon settings and
should not pose a risk to groundwaters.
Table 6.8. NH4-N variation between swine, dairy and cattle EMS sites.
NH4-N (mg/L) Type Location Reference
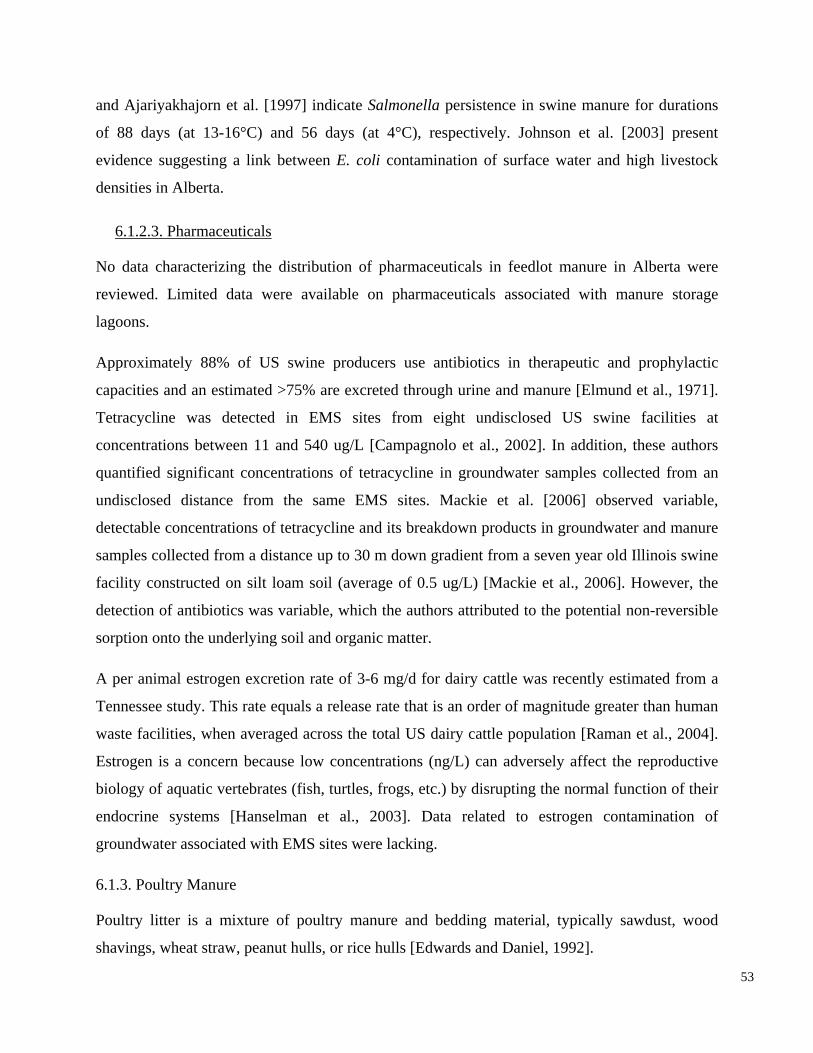
and Ajariyakhajorn et al. [1997] indicate Salmonella persistence in swine manure for durations
of 88 days (at 13-16°C) and 56 days (at 4°C), respectively. Johnson et al. [2003] present
evidence suggesting a link between E. coli contamination of surface water and high livestock
densities in Alberta.
6.1.2.3. Pharmaceuticals
No data characterizing the distribution of pharmaceuticals in feedlot manure in Alberta were
biology of aquatic vertebrates (fish, turtles, frogs, etc.) by disrupting the normal function of their
endocrine systems [Hanselman et al., 2003]. Data related to estrogen contamination of
groundwater associated with EMS sites were lacking.
6.1.3. Poultry Manure
Poultry litter is a mixture of poultry manure and bedding material, typically sawdust, wood
shavings, wheat straw, peanut hulls, or rice hulls [Edwards and Daniel, 1992].
53
reviewed. Limited data were available on pharmaceuticals associated with manure storage
lagoons.
Approximately 88% of US swine producers use antibiotics in therapeutic and prophylactic
capacities and an estimated >75% are excreted through urine and manure [Elmund et al., 1971].
Tetracycline was detected in EMS sites from eight undisclosed US swine facilities at
concentrations between 11 and 540 ug/L [Campagnolo et al., 2002]. In addition, these authors
quantified significant concentrations of tetracycline in groundwater samples collected from an
undisclosed distance from the same EMS sites. Mackie et al. [2006] observed variable,
detectable concentrations of tetracycline and its breakdown products in groundwater and manure
samples collected from a distance up to 30 m down gradient from a seven year old Illinois swine
facility constructed on silt loam soil (average of 0.5 ug/L) [Mackie et al., 2006]. However, the
detection of antibiotics was variable, which the authors attributed to the potential non-reversible
sorption onto the underlying soil and organic matter.
A per animal estrogen excretion rate of 3-6 mg/d for dairy cattle was recently estimated from a
Tennessee study. This rate equals a release rate that is an order of magnitude greater than human
waste facilities, when averaged across the total US dairy cattle population [Raman et al., 2004].
Estrogen is a concern because low concentrations (ng/L) can adversely affect the reproductive
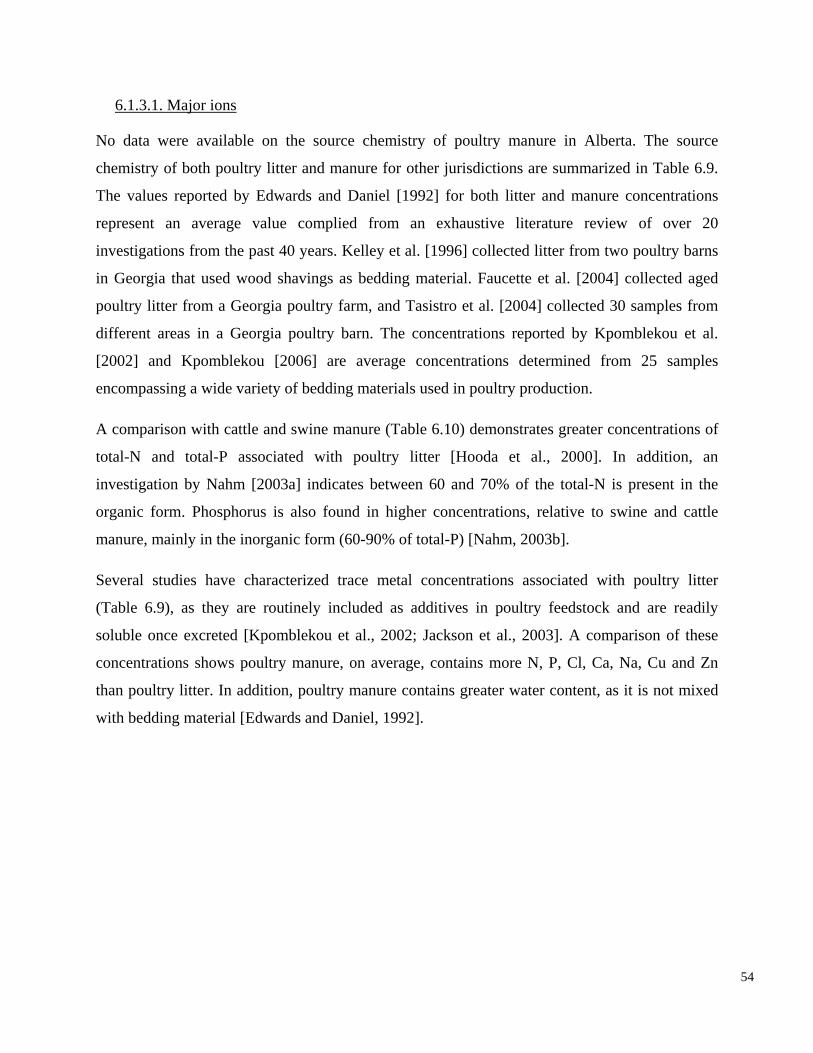
6.1.3.1. Major ions
No data were available on the source chemistry of poultry manure in Alberta. The source
chemistry of both poultry litter and manure for other jurisdictions are summarized in Table 6.9.
The values reported by Edwards and Daniel [1992] for both litter and manure concentrations
represent an average value complied from an exhaustive literature review of over 20
investigations from the past 40 years. Kelley et al. [1996] collected litter from two poultry barns
in Georgia that used wood shavings as bedding material. Faucette et al. [2004] collected aged
poultry litter from a Georgia poultry farm, and Tasistro et al. [2004] collected 30 samples from
different areas in a Georgia poultry barn. The concentrations reported by Kpomblekou et al.
[2002] and Kpomblekou [2006] are average concentrations determined from 25 samples
encompassing a wide variety of bedding materials used in poultry production.
A comparison with cattle and swine manure (Table 6.10) demonstrates greater concentrations of
total-N and total-P associated with poultry litter [Hooda et al., 2000]. In addition, an
investigation by Nahm [2003a] indicates between 60 and 70% of the total-N is present in the
organic form. Phosphorus is also found in higher concentrations, relative to swine and cattle
manure, mainly in the inorganic form (60-90% of total-P) [Nahm, 2003b].
Several studies have characterized trace metal concentrations associated with poultry litter
(Table 6.9), as they are routinely included as additives in poultry feedstock and are readily
soluble once excreted [Kpomblekou et al., 2002; Jackson et al., 2003]. A comparison of these
concentrations shows poultry manure, on average, contains more N, P, Cl, Ca, Na, Cu and Zn
than poultry litter. In addition, poultry manure contains greater water content, as it is not mixed
with bedding material [Edwards and Daniel, 1992].
54
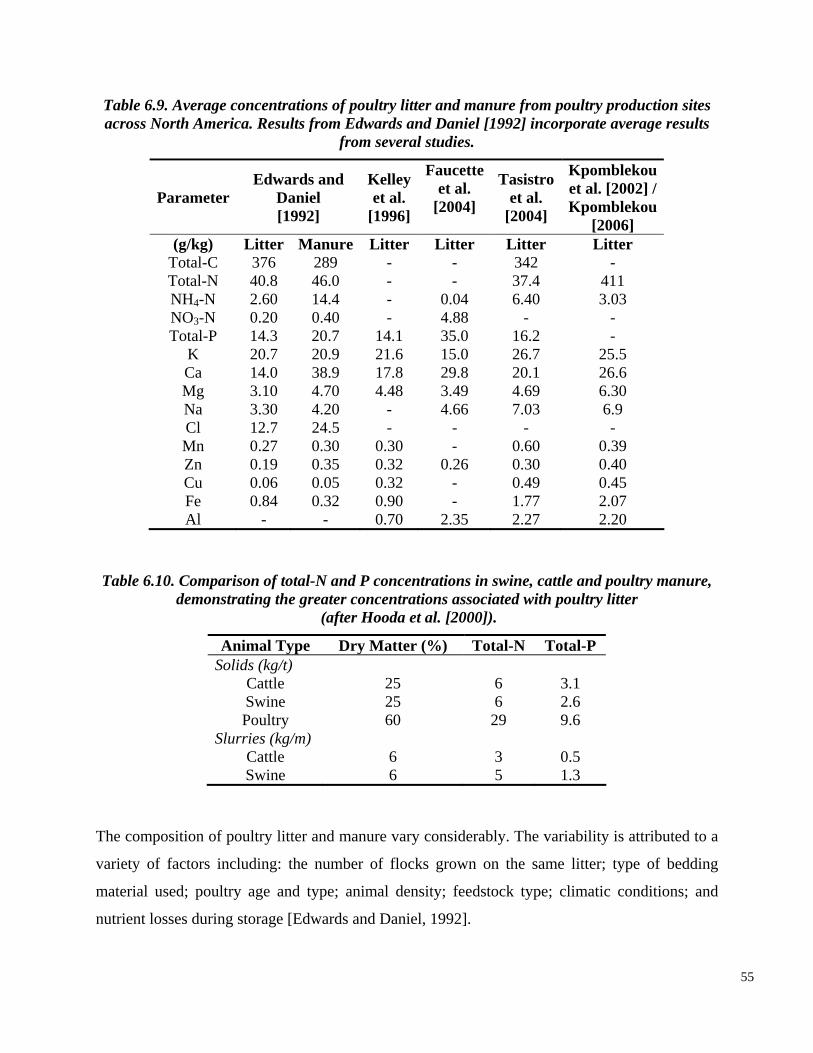
15.0 26.7 29.8 20.1
Table 6.9. Average concentrations of poultry litter and manure from poultry production sites across North America. Results from Edwards and Daniel [1992] incorporate average results
from several studies.
Faucette KpomblekouEdwards and Kelley Tasistroet al. et al. [2002] /Parameter Daniel et al. et al.[2004] Kpomblekou[1992] [1996] [2004] [2006] (g/kg) Litter Manure Litter Litter Litter Litter
Total-C 376 289 - - 342 -Total-N 40.8 46.0 - - 37.4 411 NH4-N 2.60 14.4 - 0.04 6.40 3.03 NO3-N 0.20 0.40 - 4.88 - -Total-P 14.3 20.7 14.1 35.0 16.2 -
0.30
0.32 0.90
0.30 - 0.60 0.39 Zn 0.19 0.35 0.32 0.26 0.30 0.40 Cu 0.06 0.05 - 0.49 0.45 Fe 0.84 0.32 - 1.77 2.07 Al - - 0.70 2.35 2.27 2.20
Table 6.10. Comparison of total-N and P concentrations in swine, cattle and poultry manure, demonstrating the greater concentrations associated with poultry litter
(after Hooda et al. [2000]).
Animal Type Dry Matter (%) Total-N Total-P
Cattle 25 6 3.1 Swine Poultry
Slurries (kg/m)
25 6 2.6 60 29 9.6
Solids (kg/t)
Cattle 6 3 0.5 Swine 6 5 1.3
The composition of poultry litter and manure vary considerably. The variability is attributed to a
variety of factors including: the number of flocks grown on the same litter; type of bedding
material used; poultry age and type; animal density; feedstock type; climatic conditions; and
nutrient losses during storage [Edwards and Daniel, 1992].
55
K 20.7 20.9 21.6 25.5 Ca 14.0 38.9 17.8 26.6 Mg 3.10 4.70 4.48 3.49 4.69 6.30 Na 3.30 4.20 - 4.66 7.03 6.9 Cl 12.7 24.5 - - - -Mn 0.27
6.1.3.2. Pathogens
No data were reviewed that characterize the distribution of pathogens in poultry manure in
Alberta and limited data exist on pathogens associated with poultry manure. Gooddy [2002]
observed no detectable fecal bacteria in the contaminated soil beneath a long-term (20 years)
turkey litter stockpile constructed on chalk in Britain. Testing of both fresh and composted
poultry litter, by Hartel et al. [2000], resulted in predominantly non-detectable counts of fecal
coliforms. In addition, litter samples spiked with fecal coliforms demonstrated reductions in the
No data were reviewed that characterize the distribution of pharmaceuticals in poultry manure in
Alberta and limited data exist on pharmaceuticals associated with poultry manure. The majority
of studies focused on the effects of litter application to agricultural fields as a fertilizer source
(e.g., Nichols et al. [1997, 1998]; Hemmings and Hartel [2006]).
56
pathogen to below detectable limits within eight days [Hartel et al., 2000]. Investigations by
Himathongkham et al. [2000] indicate increased survival of fecal coliforms, E. coli, and
Salmonella are directly related to decreasing poultry litter temperature. Additionally, Jones
[1986] suggests Salmonella can survive from 3 days to 36 months in litter and 5 to 598 days in
soil depending on individual environmental conditions.
A detailed Polish examination of poultry litter observed quantifiable populations of E. coli,
Klebsiella sp., Shigella sp., Salmonella OC, Pseudomonas sp., Pasteurella sp., and
Staphyllococcus [Latala et al., 1999]. A study of 86 poultry litter samples, collected from
production facilities throughout Georgia, indicated quantifiable but insignificant counts of
pathogenic bacteria in 47 of the samples, with Staphyllococcus as the dominant species [Martin
et al., 1998]. Terzich et al. [2000] conducted a detailed examination of poultry litter from 12 of
the top poultry producing states in the US, collecting samples from five locations within each
barn from at least 10 poultry farms in each state. The results generally indicated Staphyllococcus
was the predominant bacteria found amongst the sampled locations and the prevalence of
pathogens increased with increasing litter pH.
6.1.3.3. Pharmaceuticals
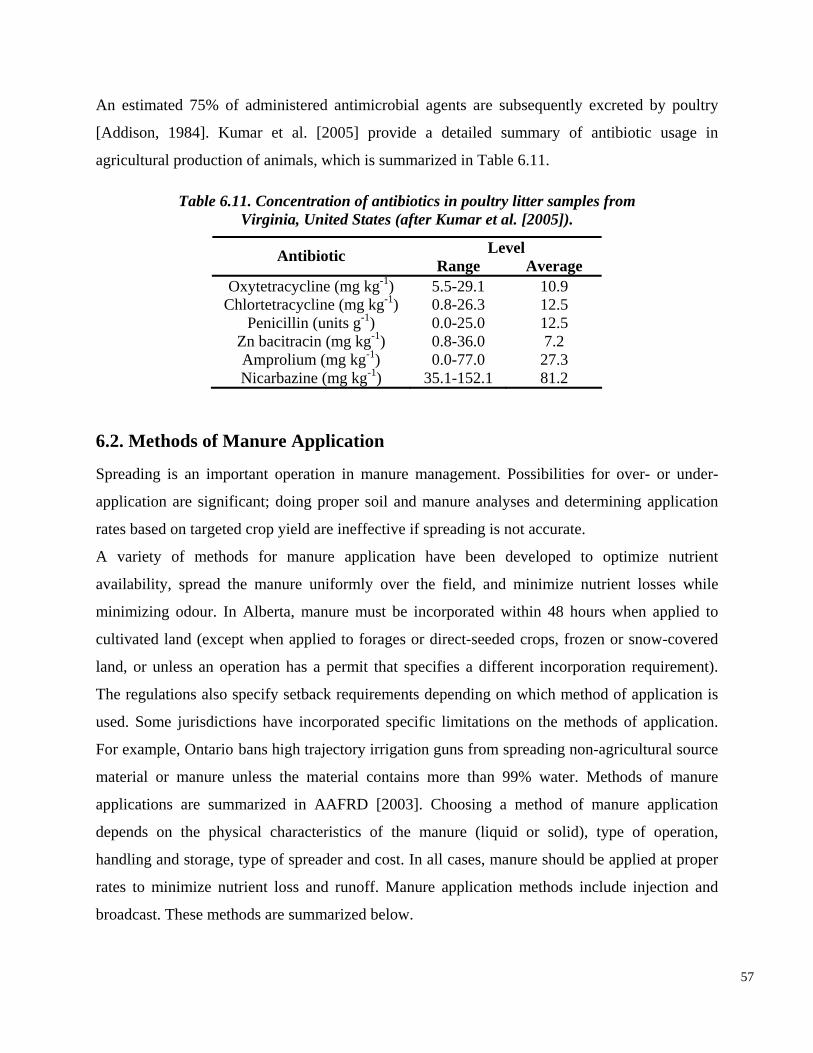
An estimated 75% of administered antimicrobial agents are subsequently excreted by poultry
[Addison, 1984]. Kumar et al. [2005] provide a detailed summary of antibiotic usage in
agricultural production of animals, which is summarized in Table 6.11.
Table 6.11. Concentration of antibiotics in poultry litter samples from Virginia, United States (after Kumar et al. [2005]).
LevelAntibiotic Range Average Oxytetracycline (mg kg-1) 5.5-29.1 10.9
Chlortetracycline (mg kg-1) 0.8-26.3 12.5 Penicillin (units g-1)
Zn bacitracin (mg kg-1) Amprolium (mg kg-1) Nicarbazine (mg kg-1)
6.2. Methods of Manure Application
0.0-25.0 12.5 0.8-36.0 7.2 0.0-77.0 27.3
35.1-152.1 81.2
Spreading is an important operation in manure management. Possibilities for over- or under-
application are significant; doing proper soil and manure analyses and determining application
rates based on targeted crop yield are ineffective if spreading is not accurate.
A variety of methods for manure application have been developed to optimize nutrient
availability, spread the manure uniformly over the field, and minimize nutrient losses while
minimizing odour. In Alberta, manure must be incorporated within 48 hours when applied to
cultivated land (except when applied to forages or direct-seeded crops, frozen or snow-covered
land, or unless an operation has a permit that specifies a different incorporation requirement).
The regulations also specify setback requirements depending on which method of application is
used. Some jurisdictions have incorporated specific limitations on the methods of application.
For example, Ontario bans high trajectory irrigation guns from spreading non-agricultural source
material or manure unless the material contains more than 99% water. Methods of manure
applications are summarized in AAFRD [2003]. Choosing a method of manure application
depends on the physical characteristics of the manure (liquid or solid), type of operation,
handling and storage, type of spreader and cost. In all cases, manure should be applied at proper
rates to minimize nutrient loss and runoff. Manure application methods include injection and
broadcast. These methods are summarized below.
57
6.2.1. Injection
Injection is an acceptable method of manure application provided pooling of manure on the soil
is minimized, and the soil covers all the manure and trenches. Manure is placed in the soil using
a shank mounted opener. Proper injection provides low runoff potential and low nutrient loss
through volatilization and leaching. The drawback to injection is high soil disturbance, especially
at higher ground speeds. This may pose a problem in minimal till and forage situations.
A modified injection method, termed low disturbance injection, places the manure at or below
injection provides low runoff potential and low-to-moderate nutrient loss from volatilization or
leaching. The drawback of low disturbance injection is the cost of the equipment.
6.2.2. Broadcast
Broadcast application places the manure above the soil surface on top of the soil, crop and trash.
Broadcast is only acceptable without incorporation on forage crops, direct-seeded crops and/or
frozen or snow-covered ground. A modified broadcast method, termed broadcast with
incorporation, places the manure above the soil surface whereby manure is placed on top of the
soil, crop and litter and is later tilled into the soil. Broadcast with incorporation is an acceptable
the soil surface. A small furrow is created in the soil using a cutting disk and manure is placed in
the furrow using a delivery hose. Some machines then close the furrow using a packing wheel.
Low disturbance injection is an acceptable method of manure application provided the manure is
placed and remains in the furrows, pooling of manure outside the furrows does not occur, and
manure placed in the furrows is not visible for very long after application. Proper surface
method of manure application provided pooling of manure on the soil surface does not occur
after incorporation. Proper broadcasting with incorporation provides moderate-to-high nutrient
loss and moderate runoff potential. The drawback of broadcast with incorporation is the resulting
soil disturbance. This method is, therefore, incompatible with minimal till and forage situations.
Schoenau and Assefa [2004] state solid manures broadcast and incorporation by tillage to a depth
of about 10-12.5 cm below the surface is the customary method of applying solid manure, such
as from beef cattle [Mathers and Stewart, 1980; Charles, 1999; Schoenau et al., 2000; Assefa,
2002].
58
6.3. Timing of Manure Application
Alberta does not specify a particular time period within which application must occur although
the regulations do specify application procedures on frozen lands. Other jurisdictions, such as
Manitoba, specify certain size operators may not apply manure between November of one year
and April of the following year. Timing for manure applications are summarized in AAFRD
[2003]. In general, the optimum time for the application of manure is before the early stages of
crop growth, with spring application being the most desirable for Alberta conditions, as high
nutrient availability will match crop uptake. However, few opportunities for application may
6.4. Distance from CFO to Manure Application Sites
No details are reported with respect to the distance from the production sites to fields upon which
manure is applied. In general, these distances are not believed to be great because the cost of
transporting of the manure is expensive relative to its value. As such, the distribution of CFO
sites in Alberta (Maps A1 and A2) likely reflects the distribution of lands upon which the manure
is applied. A similar map, prepared by Agriculture and Food Canada yields similar data.
exist in the spring due to inclement weather, risk of soil compaction, and time required for other
activities. The risk of nutrient losses increases with the time between manure application and
when the crop can use the nutrients. Within a given season, nitrogen loss by ammonia
volatilization to the atmosphere from surface applications is higher on dry, warm, windy days
than on days that are humid and/or cold.
6.5. Rates of Manure Application
The Alberta regulations establish nitrate-nitrogen levels in the top 60 cm of the soil profile
depending on the type of soil. The maximum recommended rates of cattle feedlot manure
application in Alberta are 30 and 60 Mg/ha (wet wt.) on non-irrigated and irrigated land,
respectively [Alberta Agriculture, 1980]. Similar recommendations were made in a recent study
conducted on non-irrigated Gray Luvisolic soil of the Peace River Region, north-western Alberta
[Assefa, 2002]. Data suggest manure application rates in the range of 16 to 30 Mg/ha (wet wt.)
for cattle manure and 35 to 40 kL/ha for hog manure are required for optimal crop production.
Map A12 shows the prairie provinces with estimates of total manure production by sub basin.
59
shedding of Cryptosporidium parvum in adult beef cattle: Applied and Environmental Microbiology 69: 4604-4610.
Assuming the manure is applied to the fields locally (Chapter 2), the application rates in much of
the central part of Alberta were > 2 Mg/ha in 2001.
6.6. References
Addison, J.B., 1984, Antibiotics in Sediments and Run-Off Waters from Feedlots: Residue Reviews, v. 92, p. 1-28.
Agriculture and Agri-Food Canada (AAFC), 2003, The National Land and Water Information Service: Agri-Environmental Indicators Accessed January 23, 2008. http://nlwissnite1.agr.gc.ca/ind2001/index.phtml?lang=en-CA
Ajariyakhajorn, C., Goyal, S.M., Robinson, R.A., Johnston, L.J., and Clanton, C.A., 1997, The
for Dairy Producers http://www1.agric.gov.ab.ca/$department/deptdocs.nsf/all/epw7716 Accessed: January 2008.
Animal and Plant Health Inspection Service (APHIS), 1999, Info Sheet: Escherichia coli 0157 in United States Feedlots: Animal and Plant Health Inspection Service.
Assefa, B.A., 2002, Single and repeated applications of hog and cattle manure and their effects on soil conditions and plant growth in Gray Luvisolic and Black Chernozemic soils: MSc thesis, Department of Soil Science, University of Saskatchewan, Saskatoon, SK.
Atwill, E.R., Pereira, M.D.C., Alonso, L.H., Elmi, C., Epperson, W.B., Smith, R., Riggs, W., Carpenter, L.V., Dargatz, D.A., and Hoar, B., 2006, Environmental load of Cryptosporidium parvum oocysts from cattle manure in feedlots from the central and western United States: Journal of Environmental Quality 35: 200-206.
Atwill, E.R., Hoar, B., Pereira, M.D.C., Tate, K.W., Rulofson, F., and Nader, G., 2003, Improved quantitative estimates of low environmental loading and sporadic periparturient
survival of Salmonella anatum, pseudorabies virus and porcine reproductive and respiratory syndrome virus in swine slurry: Microbiologica, v. 20, p. 365-369.
Alberta Agriculture. 1980. Land application of manure. Agdex 538-1. Alberta Agriculture. Edmonton AB.
Alberta Agriculture, Food and Rural Development (AAFRD), 2003, Beneficial Management Practices: Environmental Manual in Alberta.
Atwill, E.R., Harp, J.A., Jones, T., Jardon, P.W., Checel, S., and Zylstra, M., 1998, Evaluation of periparturient dairy cows and contact surfaces as a reservoir of Cryptosporidium parvum for calfhood infection: American Journal of Veterinary Research 59: 1116-1121.
Burkholder, J., Libra, B., Weyer, P., Heathcote, S., Kolpin, D., Thorne, P.S., and Wichman, M., 2007, Impacts of waste from concentrated animal feeding operations on water quality: Environmental Health Perspectives, v. 115, p. 308-312.
Campagnolo, E.R., Johnson, K.R., Karpati, A., Rubin, C.S., Kolpin, D.W., Meyer, M.T., Esteban, J.E., Currier, R.W., Smith, K., Thu, K.M., and McGeehin, M., 2002, Antimicrobial residues in animal waste and water resources proximal to large-scale swine and poultry feeding operations: Science of the Total Environment 299: 89-95.
Campbell, A.J., MacLeod, J.A., and Stewart, C., 1997, Nutrient characterization of stored liquid hog manure: Canadian Agricultural Engineering 39: 43-48.
60
seepage. Department Saskatchewan, Saskatoon, SK.
Canada-Alberta Hog Industry Development Fund, 2005, CAHIDF Project 57: A survey of the hydrogeologic integrity of earthen manure storage ponds in Alberta: www.albertapork.com/Uploads/For%20Producers/Research/CAHIDF_Reports/CAHIDF200501-proj11.pdf. Accessed March 12, 2007.
Casson, J.P., Bennett, D.R., Nolan, S.C., Olson, B.M., and Ontkean, G.R., 2006, Degree of phosphorus saturation thresholds in manure-amended soils of Alberta: Journal of Environmental Quality 35: 2212-2221.
Charles, J.J., 1999, Soil and crop response to hog and cattle manure additional in east central Saskatchewan: MSc thesis, Department of Soil Science, University of Saskatchewan, Saskatoon, SK.
Cote, C., Villeneuve,
Eghball, B., Gilley, J.E., Kramer, L.A., and Moorman, T.B., 2000, Narrow grass hedge effects on phosphorus and nitrogen in runoff following manure and fertilizer application: Journal of Soil
Elmund, G.K., Morrison, S.M., Grant, D.W., and Nevins, M.P., 1971, Role of Excreted Chlortetracycline in Modifying Decomposition Process in Feedlot Waste: Bulletin of Environmental Contamination and Toxicology 6: 129-132.
Faucette, L.B., Risse, L.M., Nearing, M.A., Gaskin, J.W., and West, L.T., 2004, Runoff, erosion, and nutrient losses from compost and mulch Mankets under simulated rainfall: Journal of Soil and Water Conservation 59: 154-160.
Fernando, W.A.R.N., Xia, K., and Rice, C.W., 2005, Sorption and desorption of ammonium from liquid swine waste in soils: Soil Science Society of America Journal 69: 1057-1065.
Fonstad, T.A., 2004, PhD Thesis: Transport and fate of nitrogen from earthen manure storage of Civil and
A., Lessard, L., and Quessy, S., 2006, Fate of pathogenic and nonpathogenic microorganisms during storage of liquid hog manure in Quebec: Livestock Science 102: 204-210.
Edwards, D.R., and Daniel, T.C., 1992, Environmental Impacts of on-Farm Poultry Waste-Disposal - a Review: Bioresource Technology 41: 9-33.
Eghball, B., and Power, J.F., 1994, Beef-Cattle Feedlot Manure Management: Journal of Soil and Water Conservation 49: 113-122.
and Water Conservation 55: 172-176.
effluent Geological Engineering, University of
Fonstad, T.A., Salamone, T.B. and Thrasher-Haug, J., 2000, Review of regulatory requirements and current practices for siting, design and construction of earthen manure storages: Department of Agricultural and Bioresource Engineering, University of Saskatchewan, v. Pub. No.: 2000-01, P: 72.
Galland, J.C., Hyatt, D.R., Crupper, S.S., and Acheson, D.W., 2001, Prevalence, antibiotic susceptibility, and diversity of Escherichia coli O157: H7 isolates from a longitudinal study of beef cattle feedlots: Applied and Environmental Microbiology 67: 1619-1627.
Gilbertson, C.B., Ellis, J.R., Nienaber, J.A., McCalla, T.M., and Klopfenstein, T.J., 1975, Properties of Manure Accumulations from Midwest Beef-Cattle Feedlots: Transactions of the ASAE 18: 327-330.
61
Parasitology 102: 53-67.
Gooddy, D.C., 2002, Movement of leachate from beneath turkey litter sited over chalk in southern England: Journal of Environmental Science and Health Part B-Pesticides Food Contaminants and Agricultural Wastes 37: 81-91.
Graczyk, T.K., Evans, B.M., Shiff, C.J., Karreman, H.J., and Patz, J.A., 2000, Environmental and geographical factors contributing to watershed contamination with Cryptosporidium parvum oocysts: Environmental Research 82: 263-271.
Ham, J.M., Reddi, L.N. and Rice, C.W., 1999, Animal waste lagoon water quality study: A research report by Kansas State University.
Ham, J.M., and DeSutter, T.M., 1999, Seepage losses and nitrogen export from swine-waste
Himathongkham, S., Riemann, H., Bahari, S., Nuanualsuwan, S., Kass, P., and Cliver, D. O., 2000, Survival of Salmonella typhimurium and Escherichia coil O157: H7 in poultry manure and manure slurry at sublethal temperatures: Avian Diseases 44: 853-860.
Hoar, B.R., Atwill, E.R., Elmi, C., Utterback, W.W., and Edmondson, A.J., 1999, Comparison of fecal samples collected per rectum and off the ground for estimation of environmental contamination attributable to beef cattle: American Journal of Veterinary Research 60: 1352-1356.
Hooda, P.S., Edwards, A.C., Anderson, H.A., and Miller, A., 2000, A review of water quality concerns in livestock farming areas: Science of the Total Environment 250: 143-167.
Huetink, R.E.C., van der Giessen, J.W.B., Noordhuizen, J.P.T.M., and Ploeger, H.W., 2001, Epidemiology of Cryptosporidium spp. and Giardia duodenalis on a dairy farm: Veterinary
lagoons: A water balance study: Journal of Environmental Quality 28: 1090-1099. Hanselman, T.A., Graetz, D.A., and Wilkie, A.C., 2003, Fate of poultry manure estrogens in
soils: A review: Soil and Crop Science Society of Florida Proceedings 62: 8-12. Hartel, P.G., Segars, W.I., Summer, J.D., Collins, J.V., Phillips, A.T., and Whittle, E., 2000,
Survival of fecal coliforms in fresh and stacked broiler litter: Journal of Applied Poultry Research 9: 505-512.
Hemmings, S.N.J., and Hartel, P.G., 2006, Mineralization of hormones in breeder and broiler litters at different water potentials and temperatures: Journal of Environmental Quality 35: 701-706.
Jackson, B.P., Bertsch, P.M., Cabrera, M.L., Camberato, J.J., Seaman, J.C., and Wood, C.W., 2003, Trace element speciation in poultry litter: Journal of Environmental Quality 32: 535-540.
Johnson, J.Y.M., Thomas, J.E., Graham, T.A., Townshend, I., Byrne, J., Selinger, L.B., and Gannon, V.P.J., 2003, Prevalence of Escherichia coli O157: H7 and Salmonella spp. in surface waters of southern Alberta and its relation to manure sources: Canadian Journal of Microbiology 49: 326-335.
Jones, P.W., 1986, Sewage sludge as a vector of Salmonelosis: In: Epidemiological studies of risk associated with agricultural use of sewage sludge: knowledge and needs, pp. 21-31.
Kelley, T.R., Pancorbo, O.C., Merka, W.C., Thompson, S.A., Cabrera, M.L., and Barnhart, H.M., 1996, Elemental concentrations of stored whole and fractionated broiler litter: Journal of Applied Poultry Research 5: 276-281.
Kennedy, B., et al., 1999, Feedlot Runoff: Volume 1: Quantity and quality of rainfall and snowmelt, CAESA Research Project RES-109-94.
62
Kpomblekou, A.K., 2006, Relative proportion of inorganic and total nitrogen in broiler litter as determined by various methods: Journal of the Science of Food and Agriculture 86: 23542362.
Kpomblekou, A.K., Ankumah, R.O., and Ajwa, H.A., 2002, Trace and nontrace element contents of broiler litter: Communications in Soil Science and Plant Analysis 33: 1799-1811.
Kumar, K., Gupta, S.C., Chander, Y., and Singh, A.K., 2005, Antibiotic use in agriculture and its impacts on the terrestrial environment: Advances in Agronomy 87: 1-54.
Larney, F.J., Buckley, K.E., Hao, X., and McCaughey, W.P., 2006, Fresh, stockpiled, and composted beef cattle feedlot manure: Nutrient levels and mass balance estimates in Alberta
Martin, S.A., McCann, M.A., and Waltman, W.D., 1998, Microbiological survey of Georgia poultry litter: Journal of Applied Poultry Research 7: 90-98.
Mathers, A.C., and Stewart, B.A., 1980, The effect of feedlot manure on soil physical and chemical properties. In Livestock Waste: A renewable resource. Proceedings of the 4th
International Symposium on Livestock Wastes. R.J. Smith (ed). ASAE, St. Joseph, MI, USA. Pp. 159-162.
Michel, P., Martin, L.J., Tinga, C.E., Dore, K., and Typhimurium, M.P.S., 2006, Regional, seasonal, and antimicrobial resistance distributions of Salmonella typhimurium in Canada - A multi-provincial study: Canadian Journal of Public Health-Revue Canadienne De Sante Publique, v. 97, p. 470-474.
Miller, J.J., et al., 2006, Phosphorus and nitrogen in rainfall simulation runoff after fresh and composted beef cattle manure application: Journal of Environmental Quality 35: 1279-1290.
and Manitoba: Journal of Environmental Quality 35: 1844-1854. Latala, A., Krzysko-Lupicka, T., Grata, K., and Nabrdalik, M., 1999, Microbiological
contamination of poultry manure from poultry farms: Medycyna Weterynaryjna 55: 451-454. Levi-Minzi, R., Riffaldi, R., and Saviozzi, A., 1986, Organic-Matter and Nutrients in Fresh and
Mature Farmyard Manure: Agricultural Wastes 16: 225-236. Mackie, R.I., Koike, S., Krapac, I., Chee-Sanford, J., Maxwell, S., and Aminov, R.I., 2006,
Tetracycline residues and tetracycline resistance genes in groundwater impacted by swine production facilities: Animal Biotechnology 17: 157-176.
Nahm, K.H., 2003a, Bioavailability of phosphorus in poultry manure: Avian and Poultry Biology Reviews 14: 53-62.
Nahm, K.H., 2003b, Evaluation of the nitrogen content in poultry manure: Worlds Poultry Science Journal 59: 77-88.
Nichols, D.J., Daniel, T.C., Edwards, D.R., Moore, P.A., and Pote, D.H., 1998, Use of grass filter strips to reduce 17 beta-estradiol in runoff from fescue-applied poultry litter: Journal of Soil and Water Conservation 53: 74-77.
Nichols, D.J., Daniel, T.C., Moore, P.A., Edwards, D.R., and Pote, D.H., 1997, Runoff of estrogen hormone 17 beta-estradiol from poultry litter applied to pasture: Journal of Environmental Quality 26: 1002-1006.
Olson, B.M., et al., 2003a, Manure nutrient management to sustain groundwater quality near feedlots: CAESA Research Project RES-028-93.
63
are needed? Journal of Applied Poultry Research 13: 163-170.
Olson, D.M., McKenzie, R.H., Bennett, D.R., Ormann, T., and Atkins, R.P. 2003b. Manure application effects on soil and groundwater quality under irrigation in southern Alberta, Alberta Agriculture, Food and Rural Development, Lethbridge, Alberta, Canada.
Olson, B.M., and Papworth, L.W., 2006, Soil chemical changes following manure application on irrigated alfalfa and rainfed timothy in southern Alberta: Canadian Journal of Soil Science 86: 119-132.
Porter, J., Mobbs, K., Hart, C.A., Saunders, J.R., Pickup, R.W., and Edwards, C., 1997, Detection, distribution and probable fate of Escherichia coli O157 from asymptomatic cattle on a dairy farm: Journal of Applied Microbiology 83: 297-306.
Raman, D.R., Williams, E.L., Layton, A.C., Burns, R.T., Easter, J.P., Daugherty, A.S., Mullen,
Cryptosporidium-Parvum in 2 Herds of Adult Beef-Cattle: Veterinary Parasitology 57: 277-
Sewell, J.I., 1978, Dairy Lagoon Effects on Groundwater Quality: Transactions of the ASAE 21: 948-952.
Statistics Canada, 2006, A Geographical Profile of Manure Production in Canada, 2001, Catalogue no. 21-601-MIE — No. 077, http://www.statcan.ca/english/research/21-601-MIE/21-601-MIE2006077.pdf
Statistics Canada, 2003, Livestock, Accessed: February 5, 2008, http://www.statcan.ca/english/agcensus2001/first/farmop/03livestock.htm
Sweeten, J.M., Marek, T.H., and McReynolds, D., 1992, Groundwater quality beneath cattle feedlots in Texas: American Society of Agricultural Engineers Paper Number 92-2038. American Society of Agricultural Engineers, St. Joseph, Michigan 49085.
M.D., and Sayler, G.S., 2004, Estrogen content of dairy and swine wastes: Environmental Science & Technology 38: 3567-3573.
Schoenau, J.J., and Assefa, B., 2004, Land application and handling of manure. In Science to Social Issues, Ed by Amrani, M., 97-148 pp.
Schoenau, J.J., Bolton, K., and Panchuk, K., 2000, Managing Manure as a fertilizer. Farm Facts. Saskatchewan Agriculture and Food. ISSN 0840-9447.
Scott, C.A., Smith, H.V., Mtambo, M.M.A., and Gibbs, H.A., 1995, An Epidemiologic-Study of
288.
Tasistro, A.S., Kissel, D.E., and Bush, P.B., 2004, Sampling broiler litter: How many samples
Terzich, M., Pope, M.J., Cherry, T.E., and Hollinger, J., 2000, Survey of pathogens in poultry litter in the United States: Journal of Applied Poultry Research 9: 287-291.
Tuttle, J., Gomez, T., Doyle, M.P., Wells, J.G., Zhao, T., Tauxe, R.V., and Griffin, P.M., 1999, Lessons from a large outbreak of Escherichia coli O157: H7 infections: insights into the infectious dose and method of widespread contamination of hamburger patties: Epidemiology and Infection 122: 185-192.
USDA, 2000, Part I: Reference of swine health and management in the United States: 2000 N338.0801 National Animal Health Monitoring System.
Villacorta, I., Aresmazas, E., and Lorenzo, M.J., 1991, Cryptosporidium-Parvum in Cattle, Sheep and Pigs in Galicia (Nw Spain): Veterinary Parasitology 38: 249-252.
64
Westerman, P.W., Huffman, R.L., and Feng, J.S., 1995, Swine-lagoon seepage in sandy soil: Transactions of the ASAE 38: 1749-1760.
Whalen, J.K., Chang, C., and Olson, B.M., 2001, Nitrogen and phosphorus mineralization potentials of soils receiving repeated annual cattle manure applications: Biology and Fertility of Soils 34(5): 334-341.
Whalen, J.K., and Chang, C., 2002, Phosphorus sorption capacities of calcareous soils receiving cattle manure applications for 25 years. Communications in Soil Science & Plant Analysis 33(7/8): 1011-1027.
65
7. SUBSURFACE CONTAMINATION IN ALBERTA DUE TO MANURE SPREADING
This Chapter synthesizes our current knowledge of soil and groundwater contamination due to
surface-applied manure in Alberta. The majority of the synthesized data was derived from three
long-term studies, all conducted near Lethbridge, Alberta. These studies comprise the basis of
our knowledge on the fate of nutrients from manure spreading, as well as the impact of the
nutrients contained in the manure on the groundwater in Alberta (Section 7.1). When compared
2002, 2004]. This objective of this study, conducted from 1995 to 2001 in the Northern Lethbridge Irrigation District, was to determine whether groundwater quality was impacted by manure application and to investigate the spatial and temporal variations in the nitrate and chloride content of the groundwater under the agricultural areas in the drainage basin.
The materials and methods of these studies are provided in Appendix E.
66
to research findings from other jurisdictions in North America (Chapter 8), the results of these
long-term studies provide the most detailed data available on the impacts of manure application
on groundwaters. Further, we present the known extent of subsurface contamination by N and P
and an assessment of the risk of contamination of Alberta groundwater resources (Sections 7.2
and 7.3).
7.1. Subsurface Contamination Studies
Three long-term studies have explored different facets of the subsurface fate and transport of
nutrients derived from manure application. Specifically:
1. The long-term fate of nutrients spread on irrigated and non-irrigated fields [Chang and Entz, 1996; Chang and Janzen, 1996; Whalen and Chang, 2001; Hao et al., 2004; Chang et al., 2005]. This study based out of the Lethbridge Research Centre has been ongoing for over 35 years (1973-present). The purpose of the study is to determine the long-term effects of annual application of cattle manure on the accumulation and movement of nutrients within the soil and to assess the environmental impacts of these annual manure applications.
2. The effects of soil texture and permeability on the accumulation and leaching of nutrients from the soil [Olson et al., 1998, 2003]. The purpose of this study, conducted from 19932001 in the Lethbridge Northern Irrigation District, was to determine the effects of manure application and commercial (N) fertilizer application on soil and groundwater quality on two different soil types in southern Alberta under irrigated conditions.
3. The temporal and spatial variations of contaminants within an entire drainage basin to determine the movement of these nutrients in the soil and the groundwater [Rodvang et al.,
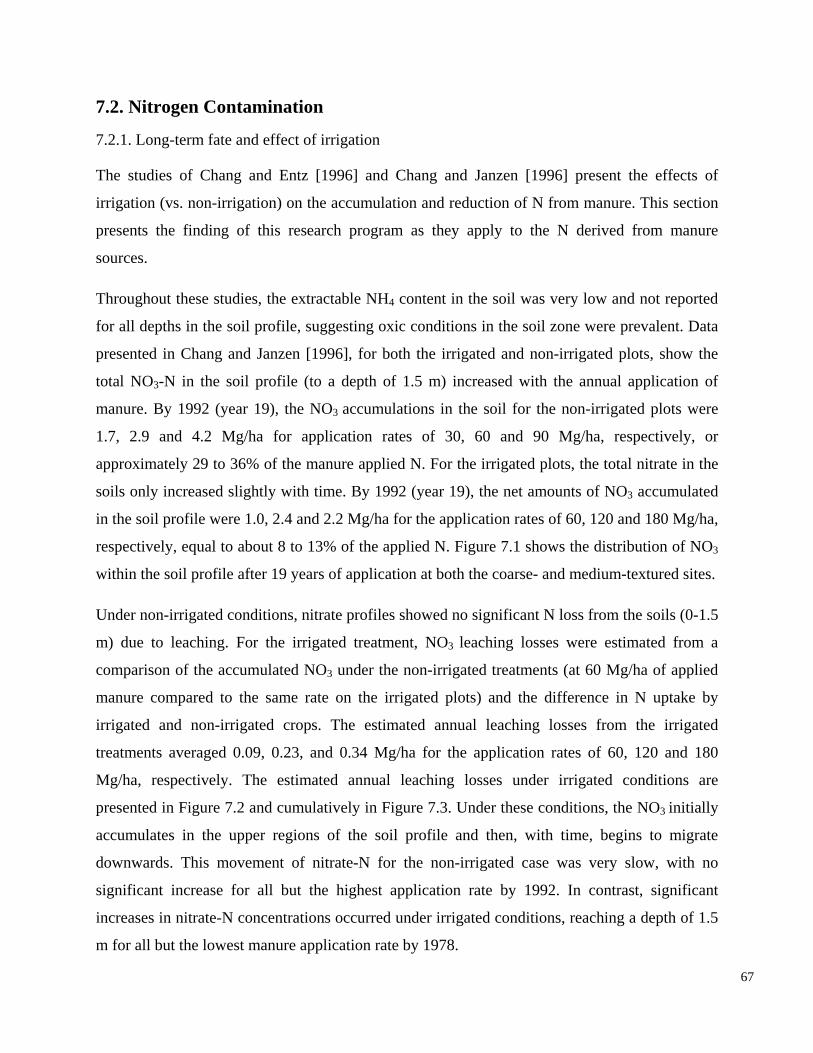
7.2. Nitrogen Contamination
7.2.1. Long-term fate and effect of irrigation
The studies of Chang and Entz [1996] and Chang and Janzen [1996] present the effects of
irrigation (vs. non-irrigation) on the accumulation and reduction of N from manure. This section
presents the finding of this research program as they apply to the N derived from manure
sources.
Throughout these studies, the extractable NH4 content in the soil was very low and not reported
for all depths in the soil profile, suggesting oxic conditions in the soil zone were prevalent. Data
presented in Chang and Janzen [1996], for both the irrigated and non-irrigated plots, show the
total NO3-N in the soil profile (to a depth of 1.5 m) increased with the annual application of
manure. By 1992 (year 19), the NO3 accumulations in the soil for the non-irrigated plots were
1.7, 2.9 and 4.2 Mg/ha for application rates of 30, 60 and 90 Mg/ha, respectively, or
manure compared to the same rate on the irrigated plots) and the difference in N uptake by
irrigated and non-irrigated crops. The estimated annual leaching losses from the irrigated
treatments averaged 0.09, 0.23, and 0.34 Mg/ha for the application rates of 60, 120 and 180
Mg/ha, respectively. The estimated annual leaching losses under irrigated conditions are
presented in Figure 7.2 and cumulatively in Figure 7.3. Under these conditions, the NO3 initially
accumulates in the upper regions of the soil profile and then, with time, begins to migrate
downwards. This movement of nitrate-N for the non-irrigated case was very slow, with no
significant increase for all but the highest application rate by 1992. In contrast, significant
increases in nitrate-N concentrations occurred under irrigated conditions, reaching a depth of 1.5
m for all but the lowest manure application rate by 1978.
67
approximately 29 to 36% of the manure applied N. For the irrigated plots, the total nitrate in the
soils only increased slightly with time. By 1992 (year 19), the net amounts of NO3 accumulated
in the soil profile were 1.0, 2.4 and 2.2 Mg/ha for the application rates of 60, 120 and 180 Mg/ha,
respectively, equal to about 8 to 13% of the applied N. Figure 7.1 shows the distribution of NO3
within the soil profile after 19 years of application at both the coarse- and medium-textured sites.
Under non-irrigated conditions, nitrate profiles showed no significant N loss from the soils (0-1.5
m) due to leaching. For the irrigated treatment, NO3 leaching losses were estimated from a
comparison of the accumulated NO3 under the non-irrigated treatments (at 60 Mg/ha of applied
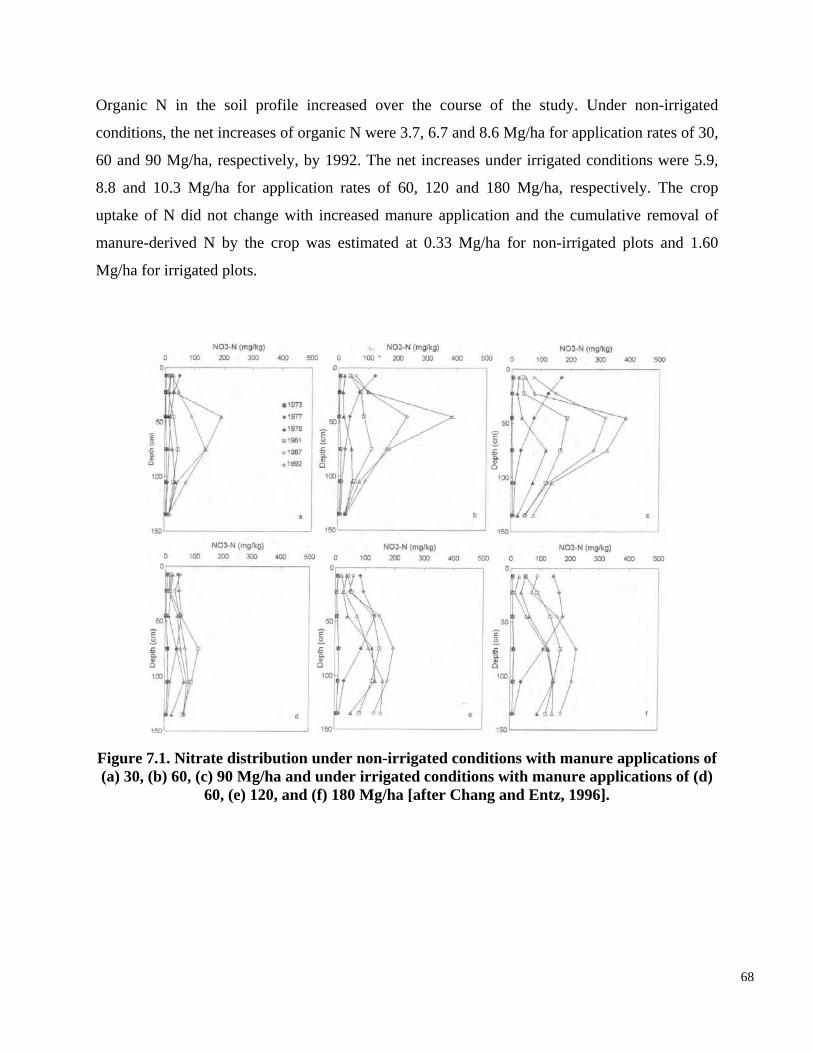
Organic N in the soil profile increased over the course of the study. Under non-irrigated
conditions, the net increases of organic N were 3.7, 6.7 and 8.6 Mg/ha for application rates of 30,
60 and 90 Mg/ha, respectively, by 1992. The net increases under irrigated conditions were 5.9,
8.8 and 10.3 Mg/ha for application rates of 60, 120 and 180 Mg/ha, respectively. The crop
uptake of N did not change with increased manure application and the cumulative removal of
manure-derived N by the crop was estimated at 0.33 Mg/ha for non-irrigated plots and 1.60
Mg/ha for irrigated plots.
Figure 7.1. Nitrate distribution under non-irrigated conditions with manure applications of (a) 30, (b) 60, (c) 90 Mg/ha and under irrigated conditions with manure applications of (d)
60, (e) 120, and (f) 180 Mg/ha [after Chang and Entz, 1996].
68
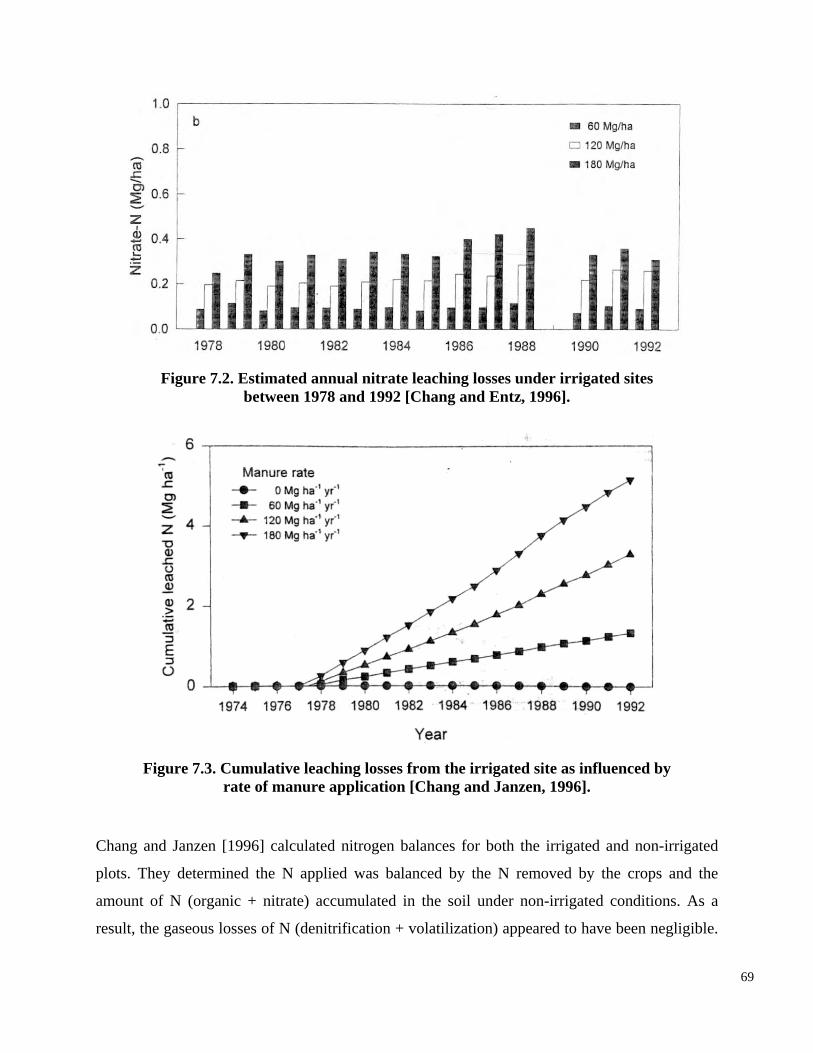
Figure 7.2. Estimated annual nitrate leaching losses under irrigated sites
Figure 7.3. Cumulative leaching losses from the irrigated site as influenced by rate of manure application [Chang and Janzen, 1996].
between 1978 and 1992 [Chang and Entz, 1996].
Chang and Janzen [1996] calculated nitrogen balances for both the irrigated and non-irrigated
plots. They determined the N applied was balanced by the N removed by the crops and the
amount of N (organic + nitrate) accumulated in the soil under non-irrigated conditions. As a
result, the gaseous losses of N (denitrification + volatilization) appeared to have been negligible.
69
A similar N balance for the irrigated plots suggested a significant gaseous loss of N (probably)
via denitrification. The high concentrations of NO3, organic C and moisture likely provided
conditions for denitrification at the irrigated site. The estimated losses amount to 0, 1.75 and 7.40
Mg/ha during the 19 years (to 1992) for application rates of 60, 120 and 180 Mg/ha, respectively.
The research conducted on these plots suggested a long-term application rate of less than 13.77
Mg/ha of manure would be required, under both irrigated conditions and non-irrigated
conditions, to prevent the accumulation of NO
under irrigated conditions. This section presents the finding of this research program as they
apply to the N derived from manure.
The NO3 content in the soil profile (top 1.5 m measured) increased over the course of this study.
The rate at which the NO3 accumulated increased with the amount of manure applied to the study
plots for both the coarse-textured (Figure 7.4) and medium-textured (Figure 7.5) sites. The
amount of NO3 in the soil increased somewhat linearly with the cumulative manure total N
added (Figure 7.6). For every 1 Mg/ha of total N added, the NO3 content in the soil profile
increased by 40.1 to 95.1 kg/ha. Initially, the accumulation of NO3 occurred within the upper soil
layers and decreased with depth. Subsequently, the accumulated NO3 migrated downwards
3 in the soil profile and subsequent downward
movement to the groundwater [Chang et al., 1991; Chang and Entz, 1996].
7.2.2. Effect of soil texture and permeability
Olson et al. [2003] show the effects of soil texture and permeability on the accumulation,
transportation and reduction of nitrogen from manure and commercial fertilizer applications
through the soil profile (the upper 1.5 m). At the medium-textured site treated with 120 Mg/ha of
manure, the NO3 front moved at a rate of 0.3 to 0.35 m/year and reached a depth of 1.5 m (extent
of the soil profile study) by the end of the study (eight years). Unlike the medium-textured site,
the NO3 content at the coarse-textured site changed throughout the entire profile (1.5 m) within
one year. This suggests N from manure spread on irrigated coarse-textured soils can impact the
whole soil profile and possibly the groundwater in as little as one year.
70
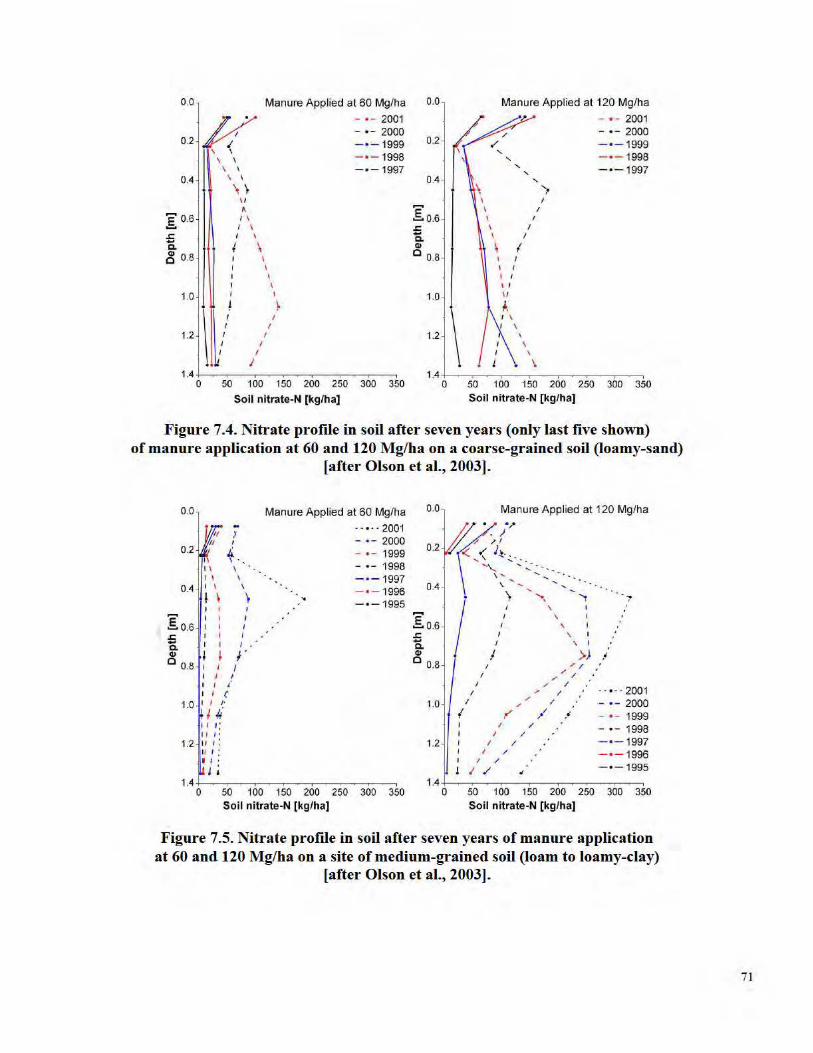
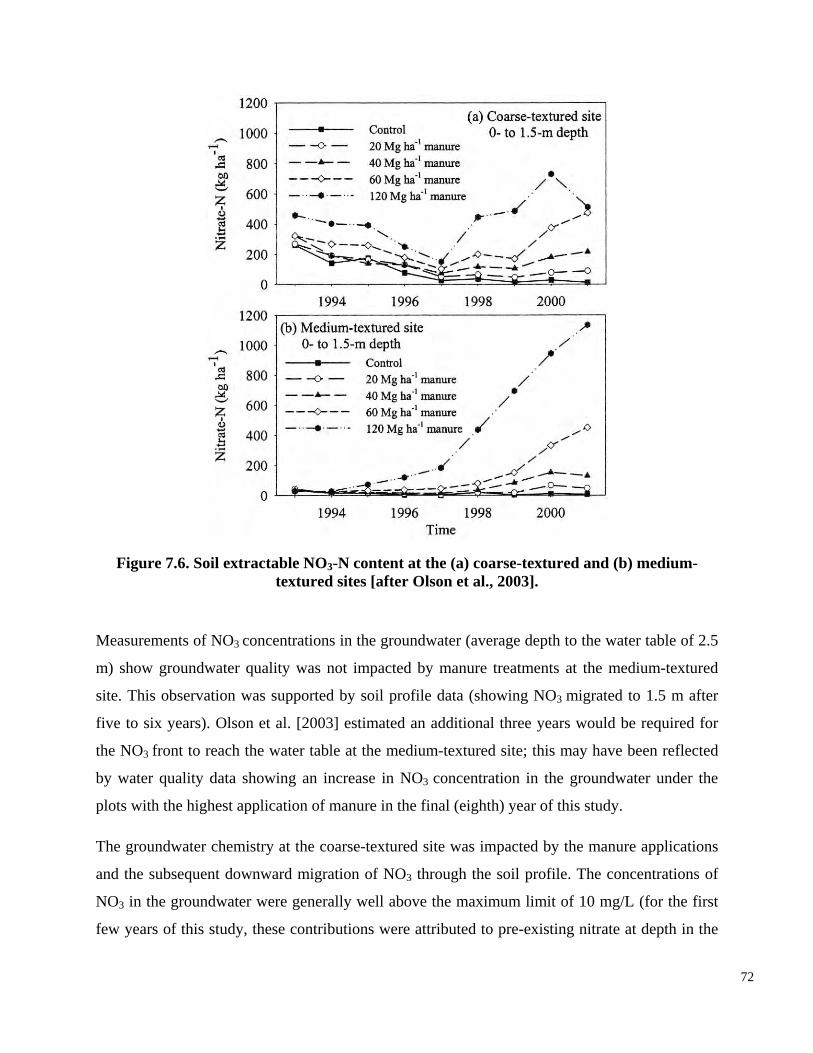
Figure 7.6. Soil extractable NO3-N content at the (a) coarse-textured and (b) medium-textured sites [after Olson et al., 2003].
Measurements of NO3 concentrations in the groundwater (average depth to the water table of 2.5
m) show groundwater quality was not impacted by manure treatments at the medium-textured
site. This observation was supported by soil profile data (showing NO3 migrated to 1.5 m after
five to six years). Olson et al. [2003] estimated an additional three years would be required for
the NO3 front to reach the water table at the medium-textured site; this may have been reflected
by water quality data showing an increase in NO3 concentration in the groundwater under the
plots with the highest application of manure in the final (eighth) year of this study.
The groundwater chemistry at the coarse-textured site was impacted by the manure applications
and the subsequent downward migration of NO3 through the soil profile. The concentrations of
NO3 in the groundwater were generally well above the maximum limit of 10 mg/L (for the first
few years of this study, these contributions were attributed to pre-existing nitrate at depth in the
72
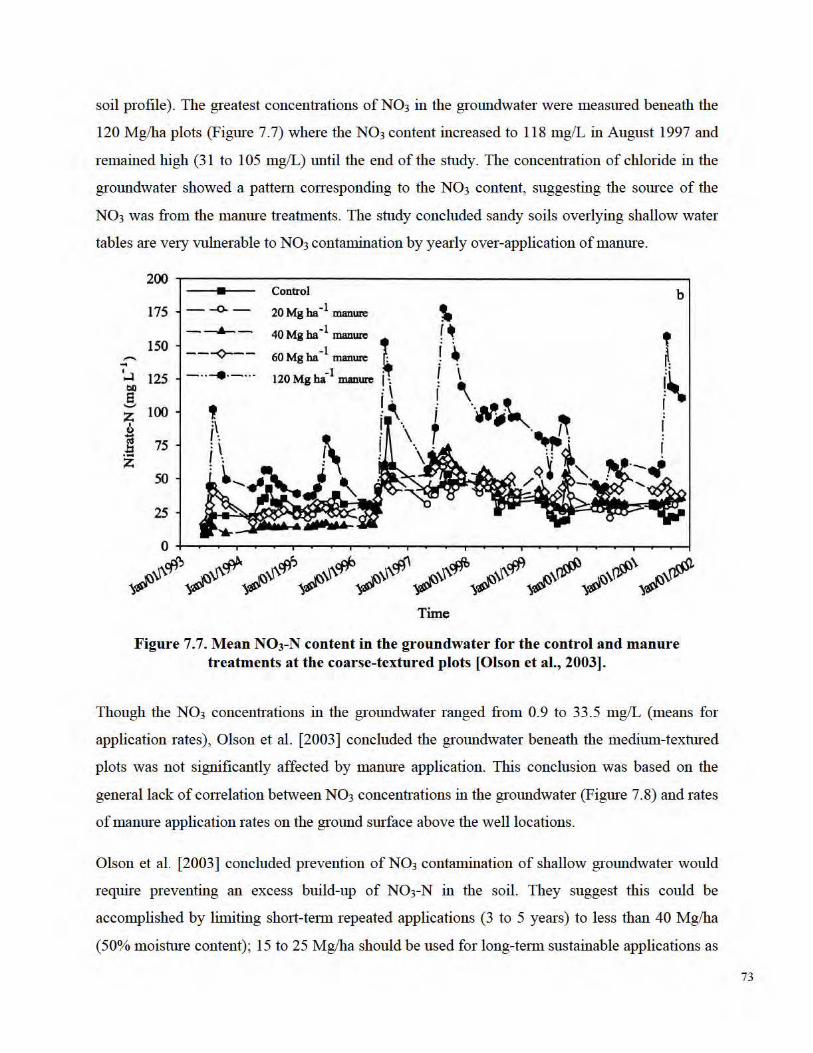
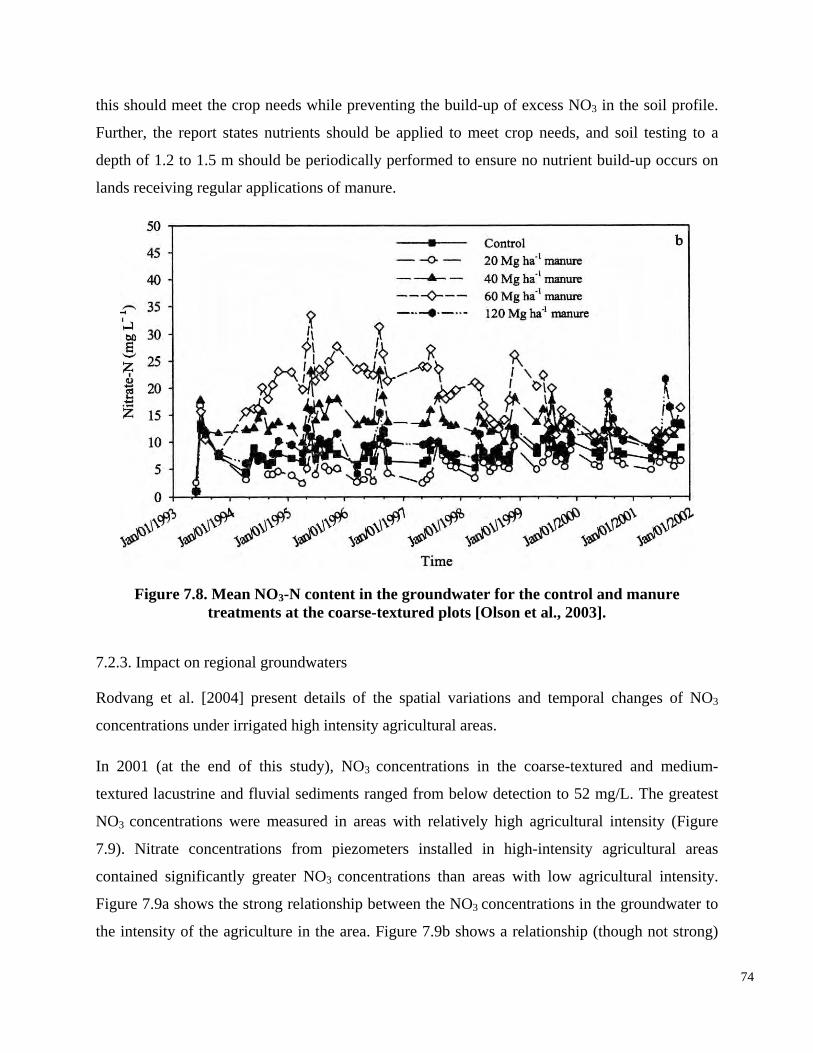
Figure 7.8. Mean NO3-N content in the groundwater for the control and manure treatments at the coarse-textured plots [Olson et al., 2003].
7.2.3. Impact on regional groundwaters
Rodvang et al. [2004] present details of the spatial variations and temporal changes of NO3
concentrations under irrigated high intensity agricultural areas.
this should meet the crop needs while preventing the build-up of excess NO3 in the soil profile.
Further, the report states nutrients should be applied to meet crop needs, and soil testing to a
depth of 1.2 to 1.5 m should be periodically performed to ensure no nutrient build-up occurs on
lands receiving regular applications of manure.
In 2001 (at the end of this study), NO3 concentrations in the coarse-textured and medium-
textured lacustrine and fluvial sediments ranged from below detection to 52 mg/L. The greatest
NO3 concentrations were measured in areas with relatively high agricultural intensity (Figure
7.9). Nitrate concentrations from piezometers installed in high-intensity agricultural areas
contained significantly greater NO3 concentrations than areas with low agricultural intensity.
Figure 7.9a shows the strong relationship between the NO3 concentrations in the groundwater to
the intensity of the agriculture in the area. Figure 7.9b shows a relationship (though not strong)
74
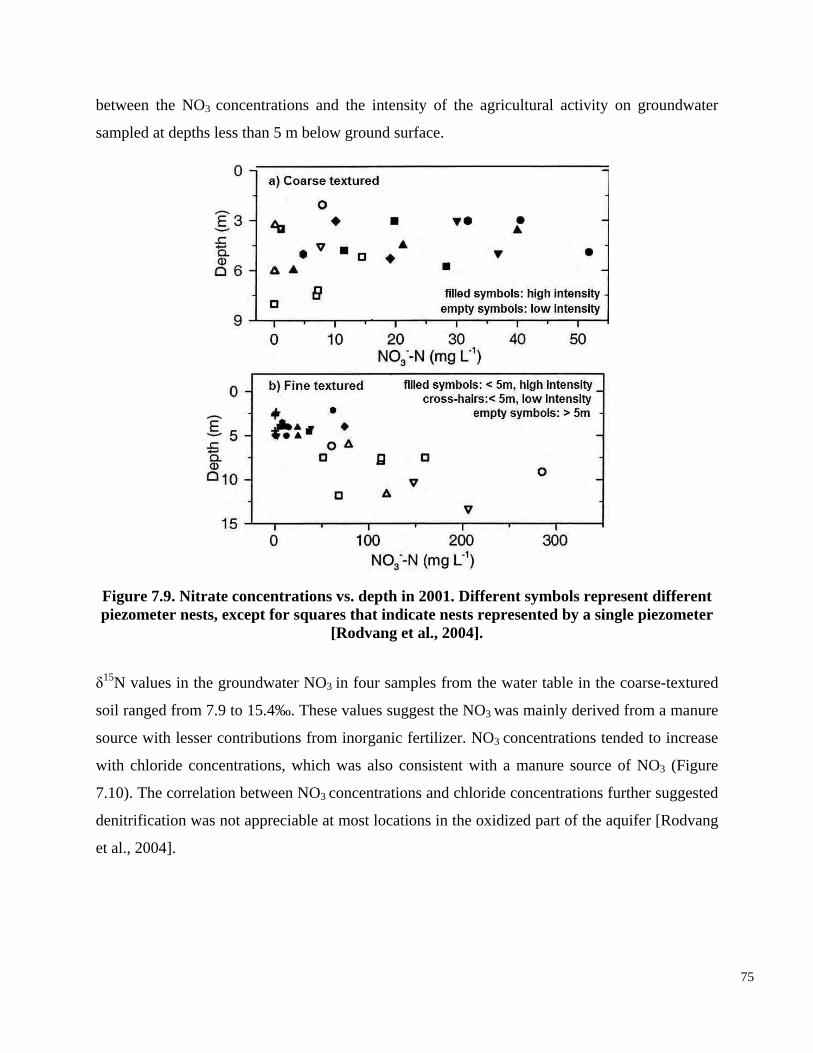
Figure 7.9. Nitrate concentrations vs. depth in 2001. Different symbols represent different piezometer nests, except for squares that indicate nests represented by a single piezometer
[Rodvang et al., 2004].
between the NO3 concentrations and the intensity of the agricultural activity on groundwater
sampled at depths less than 5 m below ground surface.
δ15N values in the groundwater NO3 in four samples from the water table in the coarse-textured
soil ranged from 7.9 to 15.4‰. These values suggest the NO3 was mainly derived from a manure
source with lesser contributions from inorganic fertilizer. NO3 concentrations tended to increase
with chloride concentrations, which was also consistent with a manure source of NO3 (Figure
7.10). The correlation between NO3 concentrations and chloride concentrations further suggested
denitrification was not appreciable at most locations in the oxidized part of the aquifer [Rodvang
et al., 2004].
75
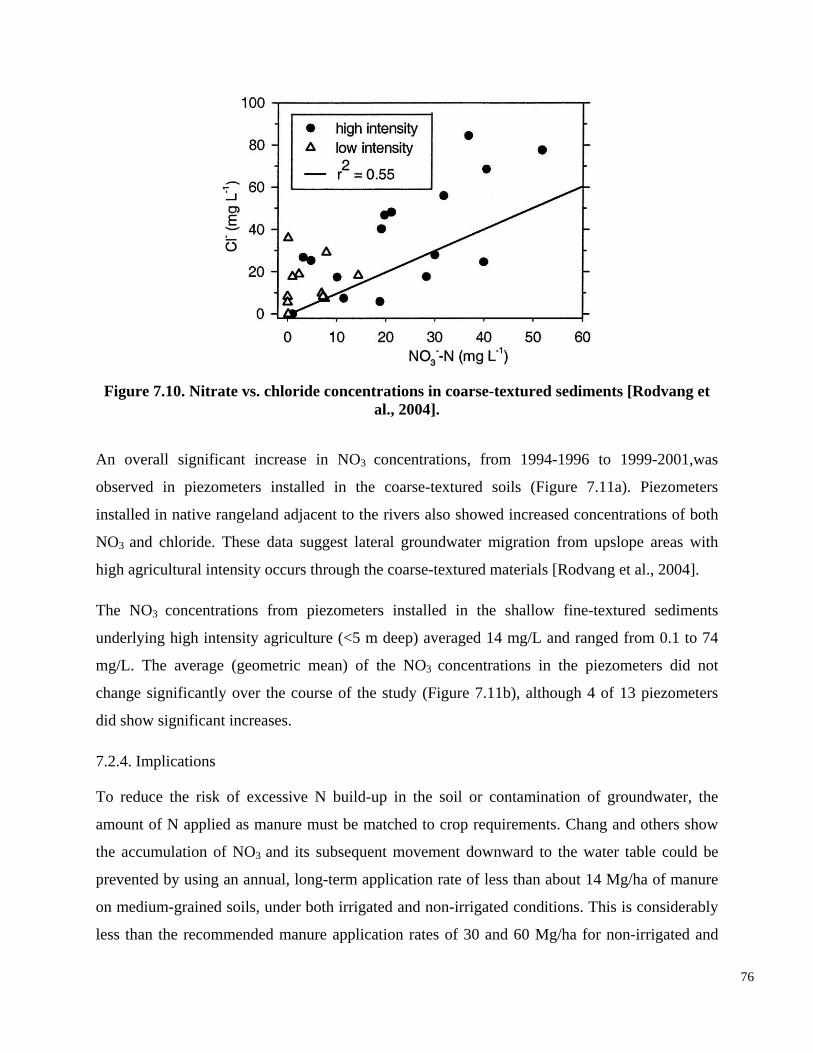
Figure 7.10. Nitrate vs. chloride concentrations in coarse-textured sediments [Rodvang et al., 2004].
An overall significant increase in NO3 concentrations, from 1994-1996 to 1999-2001,was
observed in piezometers installed in the coarse-textured soils (Figure 7.11a). Piezometers
installed in native rangeland adjacent to the rivers also showed increased concentrations of both
NO3 and chloride. These data suggest lateral groundwater migration from upslope areas with
high agricultural intensity occurs through the coarse-textured materials [Rodvang et al., 2004].
The NO3 concentrations from piezometers installed in the shallow fine-textured sediments
underlying high intensity agriculture (<5 m deep) averaged 14 mg/L and ranged from 0.1 to 74
mg/L. The average (geometric mean) of the NO3 concentrations in the piezometers did not
change significantly over the course of the study (Figure 7.11b), although 4 of 13 piezometers
did show significant increases.
7.2.4. Implications
To reduce the risk of excessive N build-up in the soil or contamination of groundwater, the
amount of N applied as manure must be matched to crop requirements. Chang and others show
the accumulation of NO3 and its subsequent movement downward to the water table could be
prevented by using an annual, long-term application rate of less than about 14 Mg/ha of manure
on medium-grained soils, under both irrigated and non-irrigated conditions. This is considerably
less than the recommended manure application rates of 30 and 60 Mg/ha for non-irrigated and
76
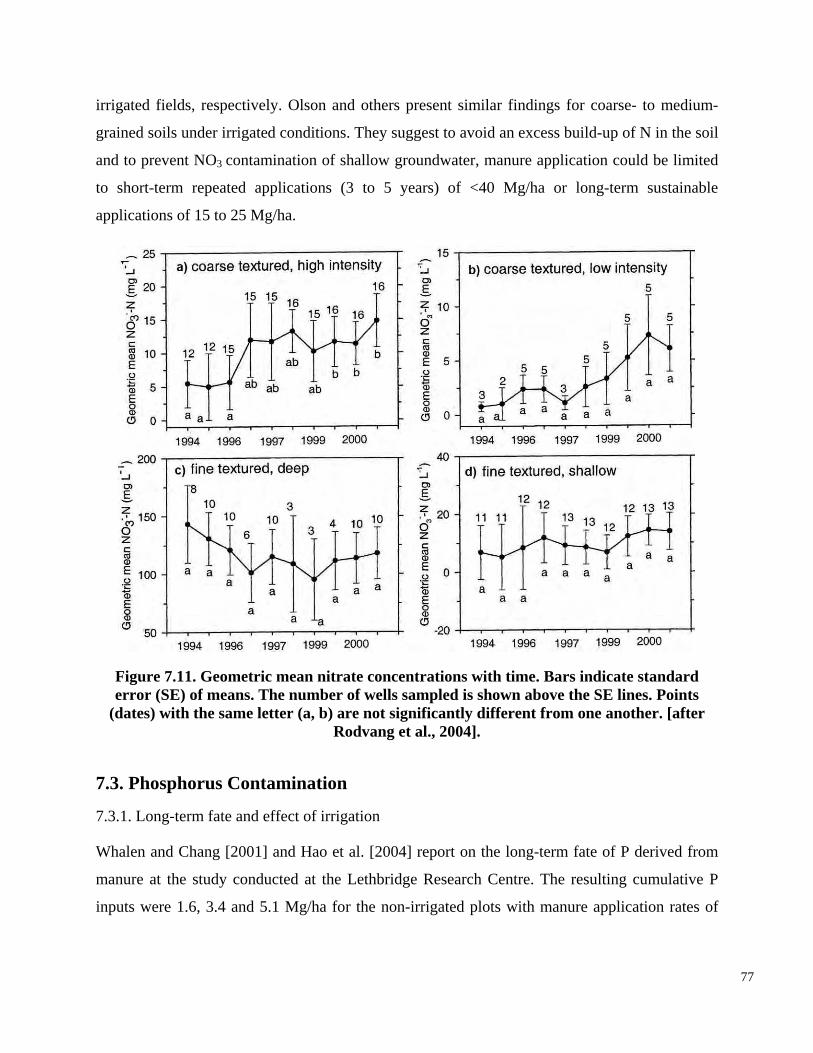
Figure 7.11. Geometric mean nitrate concentrations with time. Bars indicate standard
irrigated fields, respectively. Olson and others present similar findings for coarse- to medium-
grained soils under irrigated conditions. They suggest to avoid an excess build-up of N in the soil
and to prevent NO3 contamination of shallow groundwater, manure application could be limited
to short-term repeated applications (3 to 5 years) of <40 Mg/ha or long-term sustainable
applications of 15 to 25 Mg/ha.
error (SE) of means. The number of wells sampled is shown above the SE lines. Points (dates) with the same letter (a, b) are not significantly different from one another. [after
Rodvang et al., 2004].
7.3. Phosphorus Contamination
7.3.1. Long-term fate and effect of irrigation
Whalen and Chang [2001] and Hao et al. [2004] report on the long-term fate of P derived from
manure at the study conducted at the Lethbridge Research Centre. The resulting cumulative P
inputs were 1.6, 3.4 and 5.1 Mg/ha for the non-irrigated plots with manure application rates of
77
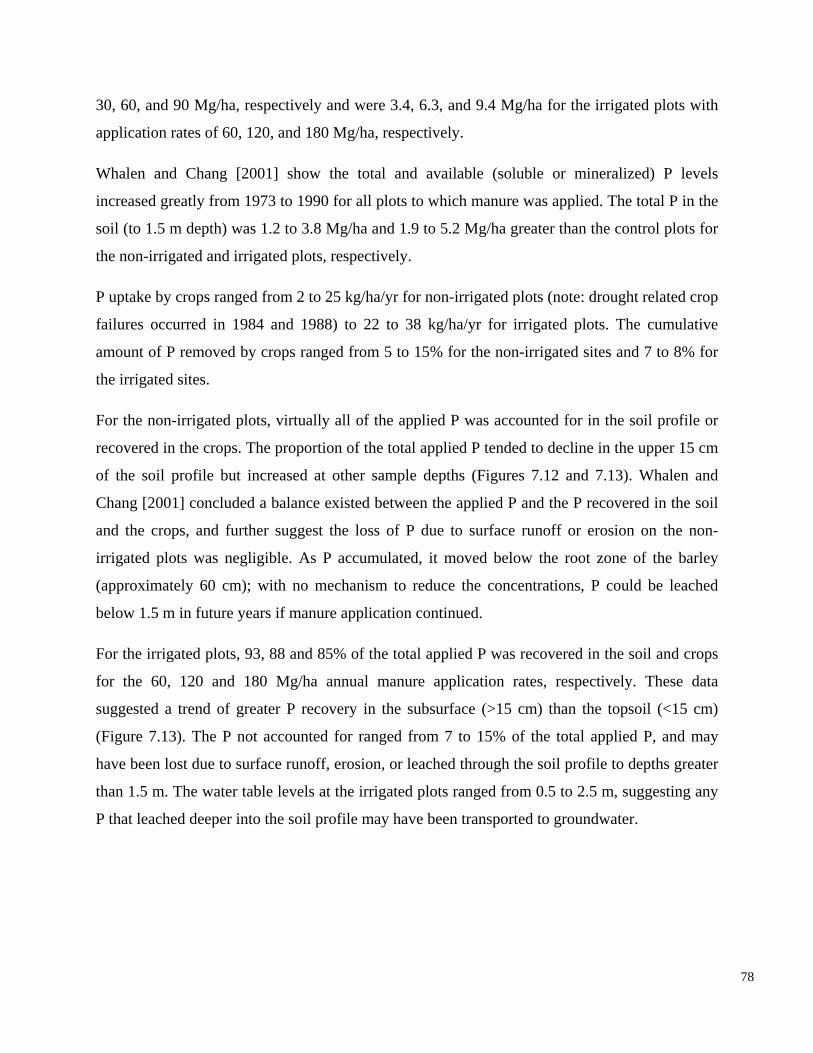
30, 60, and 90 Mg/ha, respectively and were 3.4, 6.3, and 9.4 Mg/ha for the irrigated plots with
application rates of 60, 120, and 180 Mg/ha, respectively.
Whalen and Chang [2001] show the total and available (soluble or mineralized) P levels
increased greatly from 1973 to 1990 for all plots to which manure was applied. The total P in the
soil (to 1.5 m depth) was 1.2 to 3.8 Mg/ha and 1.9 to 5.2 Mg/ha greater than the control plots for
the non-irrigated and irrigated plots, respectively.
P uptake by crops ranged from 2 to 25 kg/ha/yr for non-irrigated plots (note: drought related crop
failures occurred in 1984 and 1988) to 22 to 38 kg/ha/yr for irrigated plots. The cumulative
amount of P removed by crops ranged from 5 to 15% for the non-irrigated sites and 7 to 8% for
the irrigated sites.
For the non-irrigated plots, virtually all of the applied P was accounted for in the soil profile or
recovered in the crops. The proportion of the total applied P tended to decline in the upper 15 cm
of the soil profile but increased at other sample depths (Figures 7.12 and 7.13). Whalen and
Chang [2001] concluded a balance existed between the applied P and the P recovered in the soil
and the crops, and further suggest the loss of P due to surface runoff or erosion on the non-
irrigated plots was negligible. As P accumulated, it moved below the root zone of the barley
(approximately 60 cm); with no mechanism to reduce the concentrations, P could be leached
below 1.5 m in future years if manure application continued.
For the irrigated plots, 93, 88 and 85% of the total applied P was recovered in the soil and crops
for the 60, 120 and 180 Mg/ha annual manure application rates, respectively. These data
suggested a trend of greater P recovery in the subsurface (>15 cm) than the topsoil (<15 cm)
(Figure 7.13). The P not accounted for ranged from 7 to 15% of the total applied P, and may
have been lost due to surface runoff, erosion, or leached through the soil profile to depths greater
than 1.5 m. The water table levels at the irrigated plots ranged from 0.5 to 2.5 m, suggesting any
P that leached deeper into the soil profile may have been transported to groundwater.
78
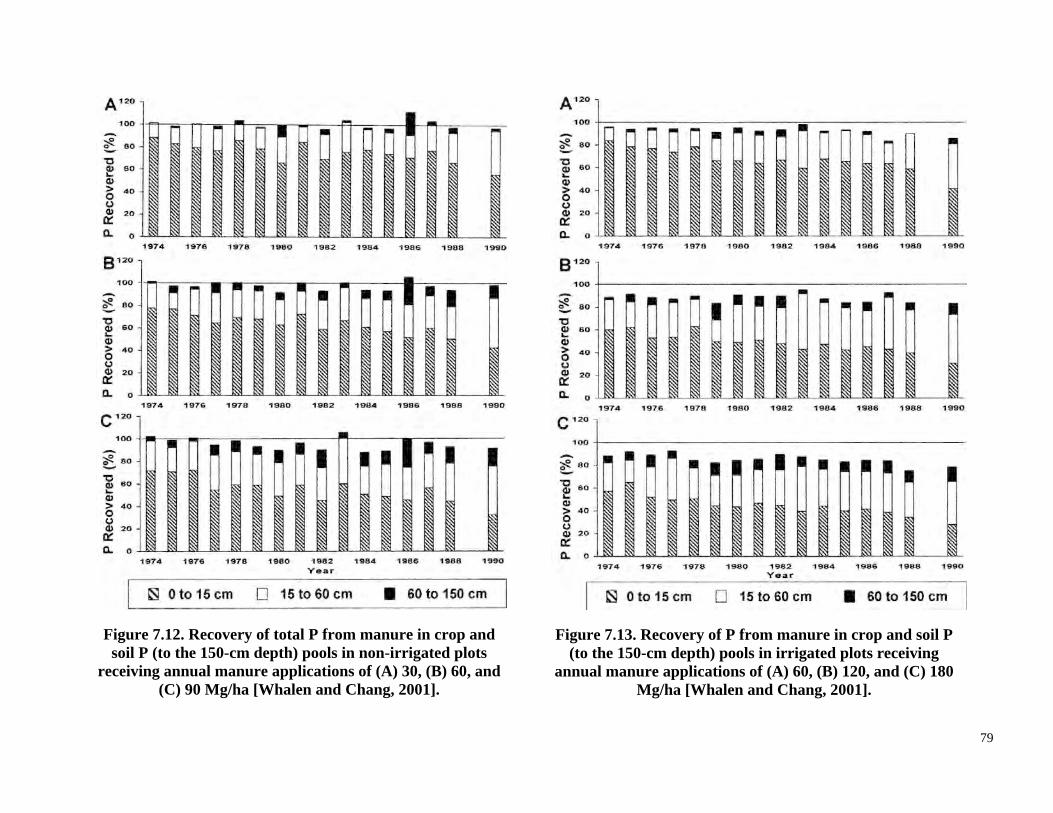
Figure 7.12. Recovery of total P from manure in crop and Figure 7.13. Recovery of P from manure in crop and soil P soil P (to the 150-cm depth) pools in non-irrigated plots (to the 150-cm depth) pools in irrigated plots receiving
receiving annual manure applications of (A) 30, (B) 60, and annual manure applications of (A) 60, (B) 120, and (C) 180 (C) 90 Mg/ha [Whalen and Chang, 2001]. Mg/ha [Whalen and Chang, 2001].
79
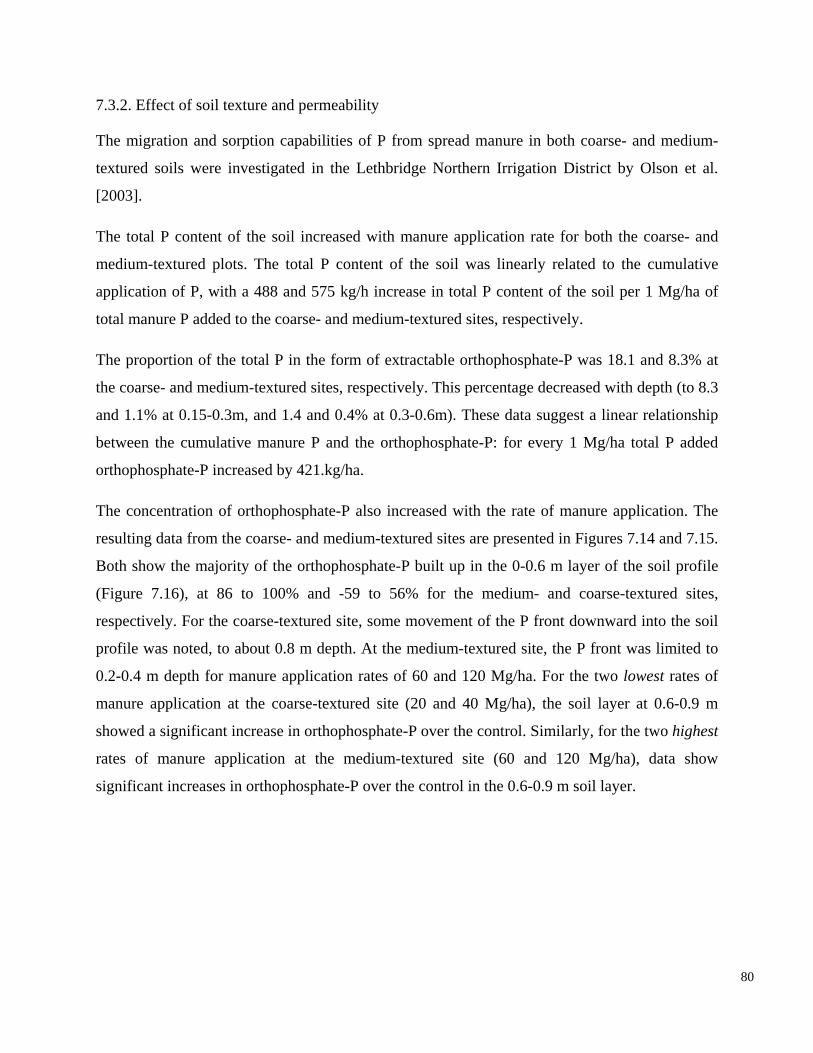
7.3.2. Effect of soil texture and permeability
The migration and sorption capabilities of P from spread manure in both coarse- and medium-
textured soils were investigated in the Lethbridge Northern Irrigation District by Olson et al.
[2003].
The total P content of the soil increased with manure application rate for both the coarse- and
medium-textured plots. The total P content of the soil was linearly related to the cumulative
application of P, with a 488 and 575 kg/h increase in total P content of the soil per 1 Mg/ha of
between the cumulative manure P and the orthophosphate-P: for every 1 Mg/ha total P added
orthophosphate-P increased by 421.kg/ha.
The concentration of orthophosphate-P also increased with the rate of manure application. The
resulting data from the coarse- and medium-textured sites are presented in Figures 7.14 and 7.15.
Both show the majority of the orthophosphate-P built up in the 0-0.6 m layer of the soil profile
(Figure 7.16), at 86 to 100% and -59 to 56% for the medium- and coarse-textured sites,
respectively. For the coarse-textured site, some movement of the P front downward into the soil
profile was noted, to about 0.8 m depth. At the medium-textured site, the P front was limited to
0.2-0.4 m depth for manure application rates of 60 and 120 Mg/ha. For the two lowest rates of
total manure P added to the coarse- and medium-textured sites, respectively.
The proportion of the total P in the form of extractable orthophosphate-P was 18.1 and 8.3% at
the coarse- and medium-textured sites, respectively. This percentage decreased with depth (to 8.3
and 1.1% at 0.15-0.3m, and 1.4 and 0.4% at 0.3-0.6m). These data suggest a linear relationship
manure application at the coarse-textured site (20 and 40 Mg/ha), the soil layer at 0.6-0.9 m
showed a significant increase in orthophosphate-P over the control. Similarly, for the two highest
rates of manure application at the medium-textured site (60 and 120 Mg/ha), data show
significant increases in orthophosphate-P over the control in the 0.6-0.9 m soil layer.
80
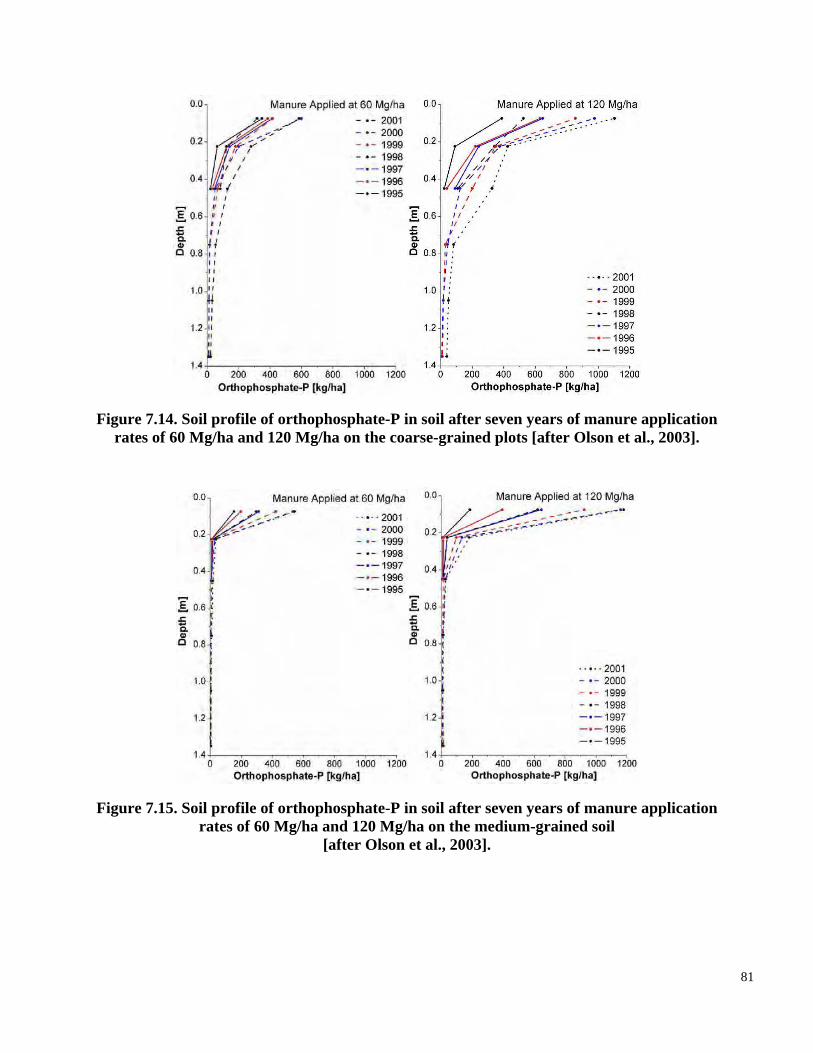
Figure 7.14. Soil profile of orthophosphate-P in soil after seven years of manure application rates of 60 Mg/ha and 120 Mg/ha on the coarse-grained plots [after Olson et al., 2003].
Figure 7.15. Soil profile of orthophosphate-P in soil after seven years of manure application rates of 60 Mg/ha and 120 Mg/ha on the medium-grained soil
[after Olson et al., 2003].
81
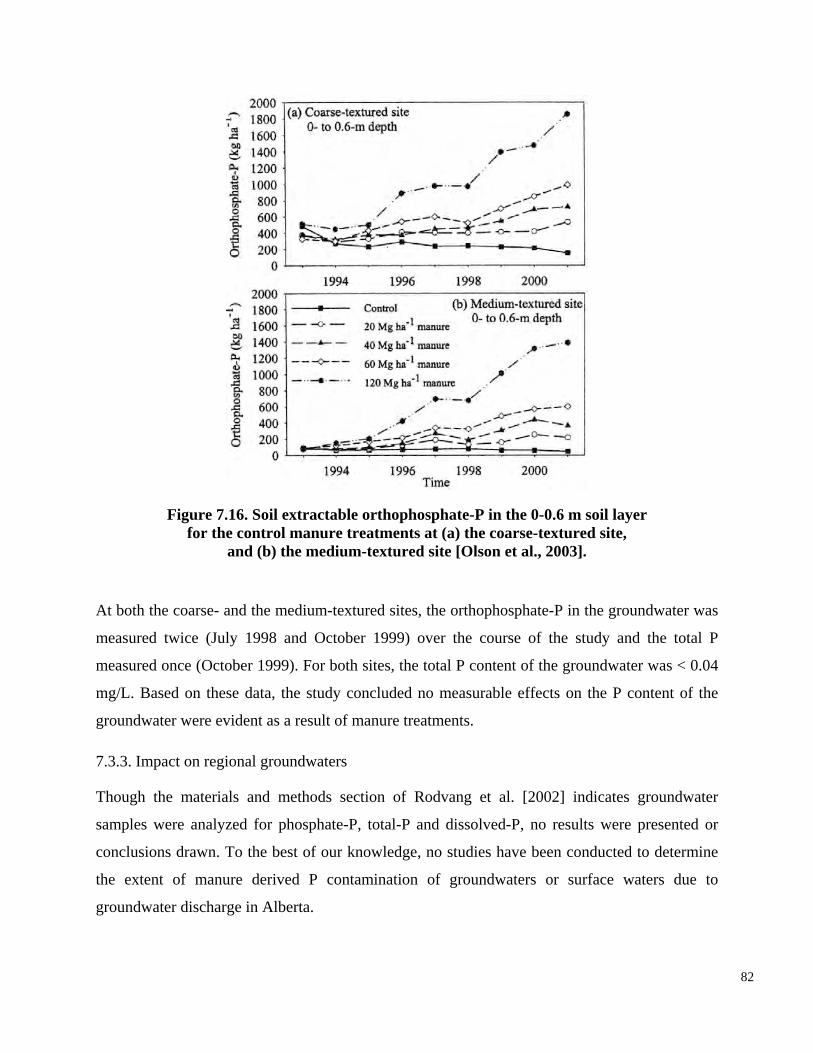
Though the materials and methods section of Rodvang et al. [2002] indicates groundwater
samples were analyzed for phosphate-P, total-P and dissolved-P, no results were presented or
conclusions drawn. To the best of our knowledge, no studies have been conducted to determine
the extent of manure derived P contamination of groundwaters or surface waters due to
groundwater discharge in Alberta.
82
Figure 7.16. Soil extractable orthophosphate-P in the 0-0.6 m soil layer for the control manure treatments at (a) the coarse-textured site,
and (b) the medium-textured site [Olson et al., 2003].
At both the coarse- and the medium-textured sites, the orthophosphate-P in the groundwater was
measured twice (July 1998 and October 1999) over the course of the study and the total P
measured once (October 1999). For both sites, the total P content of the groundwater was < 0.04
mg/L. Based on these data, the study concluded no measurable effects on the P content of the
groundwater were evident as a result of manure treatments.
7.3.3. Impact on regional groundwaters
7.3.4. Implications
Whalen and Chang [2001] conclude fertilizer application rates based on N requirements of crops
or standard manure application rates for irrigated and non-irrigated fields apply P in excess of the
requirements of the crops; the 30 and 60 Mg/ha loading for non-irrigated and irrigated plots
provides five to six times the required P. Irrigated plots receiving high (>60 Mg/ha) manure
applications represented a risk of P contamination of groundwater. Further, the quantity of
manure that could be applied to fields to support crop production (for a mean P content of 6.2
g/kg) was calculated to be 6 Mg/ha (wet weight). If correct, this would require amending the
soils further with a commercial nitrogen fertilizer to meet the crop requirements.
7.4. Contamination by Salts
Most groundwater supplies in southern Alberta are high in natural excess salinity and sodicity
(sodium, Na+), with shallow aquifers lower in dissolved salts than deeper aquifers. Many
Albertans drink groundwater that exceeds salt guidelines, with the majority of salts derived from
natural sources [AAFRD, 2002]. The excessive application of manure can increase salt
concentrations in the soils, which can then migrate into the underlying groundwaters (and
shallow aquifers).
7.4.1. Long-term fate and effect of irrigation
Hao and Chang [2003] documented the amount of soluble salts added to the soils as a result of
25 years of manure applications. They observed this mass was substantial, with the lowest (30
Mg/ha/yr) and highest (180 Mg/ha/yr) rates of manure application yielding 20.4 and 112.7
Mg/ha, respectively.
Associated with the increases of salinity of the soil were changes in the concentration and
composition of soluble ions throughout the soil profile. Concentrations of Na, K, Mg, HCO3,
SO4 and Cl increased significantly with the rate of manure application. These increases were
significantly greater for the non-irrigated plots compared to the irrigated plots, as salts were
leached below the 1.5 m sampling limit. Cl and Na concentrations increased throughout the soil
profile, which was attributed to their mobility (Cl is often used as a tracer to determine
groundwater flow rates). K, Mg, HCO3 and SO4 concentrations were to differing degrees limited
to the upper layers of soil. Under non-irrigated conditions these concentrations become very high
83
due to negligible leaching losses. K+ is the most probable to cause salinity problems, especially
in the cropland of southern Alberta [Hao and Chang, 2003].
7.4.2. Effect of soil texture and permeability
Olson et al. [2003] found the mobility of K, Na and Cl from manure applications were influenced
by soil texture and permeability. Manure applications only minimally altered the concentrations
of Ca, SO4 and Mg in the soil profile.
Extractable-K was measured on the soil samples, and the resulting data show a significant
extended much deeper into the soil profile, reaching the 0.3 to 0.6 m soil layer.
Extractable-Na data from the soil samples indicate a significant change in extractable Na content,
attributed to the long-term application of manure; however, the interpretation of the results was
difficult due to the highly variable pre-existing Na content at both sites. Olson et al. [2003] show
the medium-textured site accumulated more Na in the soil profile (0 to 1.5 m) than the coarse-
textured site. With a Na balance, Na was determined to have leached below 1.5 m at both sites,
with almost all of the applied Na at the medium-textured site and less than half of the applied Na
at the coarse-textured site retained in the soil profile.
increase in the concentration of K in the soil profile due to the application of manure. K at the
medium-textured site was limited to the upper 15 cm of the soil, though for the highest manure
application rate this extended down to include the upper 0.15 to 0.3 m layer of soil by the
seventh year of the study. In the coarse-textured soil, the increase in the concentration of K
Soil samples showed a significant change in extractable-Cl content, which was attributed to the
long-term application of manure. After the first year of manure application, the Cl content
increased significantly at both sites to depths of 0.3 to 0.6 m. Accumulation of Cl in the soil
profile at the medium-textured site produced a Cl “bulge” in the 0.3 to 1 m layer, and proceeded
to move deeper at a rate of 25 to 30 cm per year from 1995 to 1998, reaching the 1.5 m limit of
the soil samples in 1999. The coarse-textured site also produced a “bulge”, though this migrated
much more rapidly, reaching a 1.5 m depth in fall 1996. Most of the accumulated Cl at the
coarse-textured site leached below 1.5 m by fall 1997. Leaching of Cl below 1.5 m commenced
at the coarse-textured site in 1996 and at the medium-textured site only after 1998.
84
groundwater with K, Mg, HCO3 and SO4
7.4.3. Impact on regional groundwaters
Rodvang et al. [2002] only measured Cl- concentrations, the distribution of which strongly
correlates to the previously described distribution of NO3. This was attributed to the mobility of
both ions within the soil profile, while noting Cl- is not subject to reactions such as
denitrification that reduce its quantity.
The greatest Cl- concentrations were measured in areas with relatively high agricultural intensity.
Cl
concentrations, from 1994-1996 as compared to 1999-2001, was
observed in piezometers installed in the coarse-textured material (Figure 7.17a). Piezometers
installed in native rangeland adjacent to the rivers also show increased concentrations of Cl-.
These data suggest lateral groundwater migration from upslope areas with high agricultural
intensity occurs through the coarse-textured materials, thus disbursing Cl- from manure
applications within the regional groundwater [Rodvang et al., 2004].
7.4.4. Implications
Similar to P, prolonged long-term applications of manure are required to contaminate
- concentrations from piezometers installed in high-intensity agricultural areas were
significantly higher than in areas with low agricultural intensity. A strong relationship was
evident between the Cl- concentrations in the groundwater and the intensity of the agriculture in
the area. This relationship was not as strong in groundwater sampled at depths less than 5 m
below ground surface.
. Cl and Na are of greater concern for groundwater
An overall increase in Cl
contamination [Chang and Entz, 1996; Hao and Chang, 2002, 2003]. Hao and Chang [2003]
conclude higher rates of manure application are not sustainable and will eventually lead to soil
salinization under non-irrigated conditions or groundwater contamination under irrigated
conditions.
7.5. Pharmaceuticals
To the best of our knowledge, no studies have been conducted to determine the extent of
contamination and transport of pharmaceuticals (antibiotics, hormones, etc.) in the groundwater,
or documented cases of pharmaceuticals being transported into the groundwater in Alberta.
85
7.6. Pathogens
To the best of our knowledge, no studies have been conducted to determine the extent of
contamination and transport of pathogens (bacteria, viruses, etc.) in the groundwater, or
documented cases of pathogens being transported into the groundwater in Alberta. However,
preliminary data indicate some bacterial leaching to groundwater below areas with excess
manure in southern Alberta may occur [AAFRD, 2002]. Based on preliminary data, AAFRD
[2002] indicates some bacterial leaching to groundwater below areas with excess manure in
southern Alberta could be occurring, but conclude more study is needed. Other studies could also
be used to infer potential groundwater contamination by pathogens. A one-time sampling and
analysis of water samples from 192 farm dugouts and wells in Alberta shows 7% of wells
sampled did not meet microbiological standards for drinking water [Fitzgerald, 1995]. Further,
Johnson et al. [2003] indicate the Lethbridge area, which has a high cattle density, has one of the
highest incidence rates of gastroenteritis in Canada as a result of E. coli and Salmonella spp,
which are commonly present in cattle manure. However, these authors did not suggest a
correlation between infection rates and manure application rates. All sources generally agree
more research is required in this area.
86
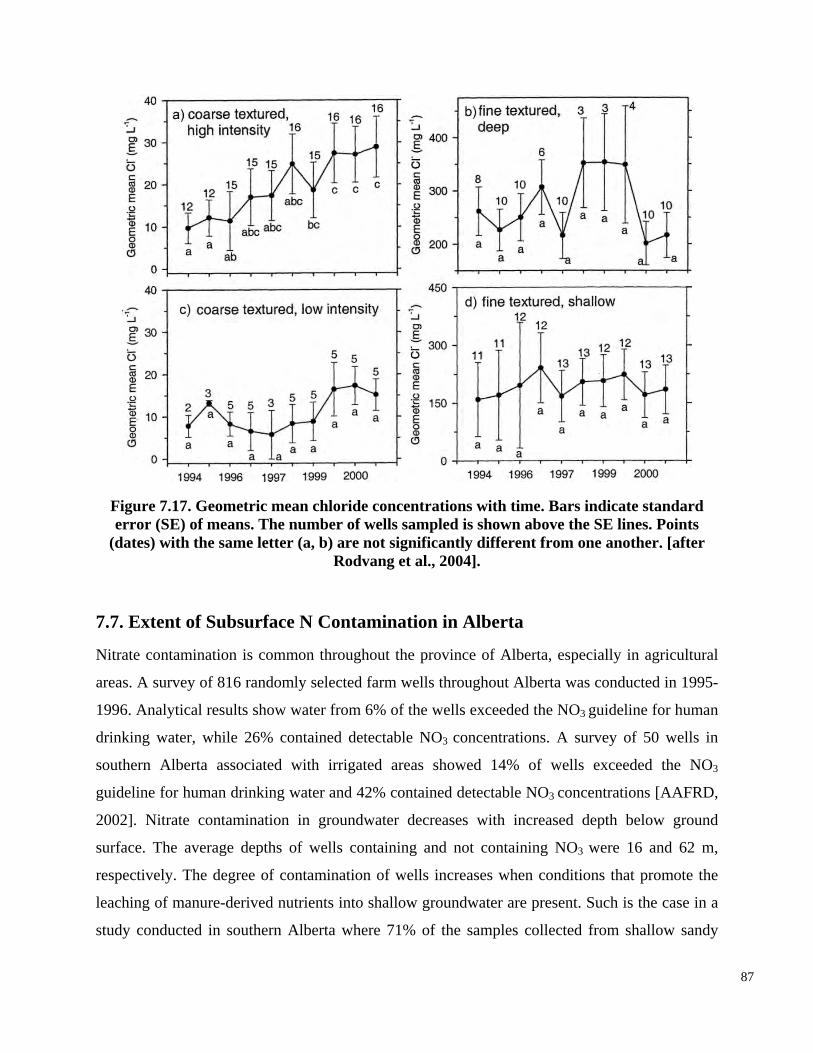
Figure 7.17. Geometric mean chloride concentrations with time. Bars indicate standard error (SE) of means. The number of wells sampled is shown above the SE lines. Points
(dates) with the same letter (a, b) are not significantly different from one another. [after Rodvang et al., 2004].
7.7. Extent of Subsurface N Contamination in Alberta
Nitrate contamination is common throughout the province of Alberta, especially in agricultural
areas. A survey of 816 randomly selected farm wells throughout Alberta was conducted in 1995
1996. Analytical results show water from 6% of the wells exceeded the NO3 guideline for human
drinking water, while 26% contained detectable NO3 concentrations. A survey of 50 wells in
southern Alberta associated with irrigated areas showed 14% of wells exceeded the NO3
guideline for human drinking water and 42% contained detectable NO3 concentrations [AAFRD,
2002]. Nitrate contamination in groundwater decreases with increased depth below ground
surface. The average depths of wells containing and not containing NO3 were 16 and 62 m,
respectively. The degree of contamination of wells increases when conditions that promote the
leaching of manure-derived nutrients into shallow groundwater are present. Such is the case in a
study conducted in southern Alberta where 71% of the samples collected from shallow sandy
87
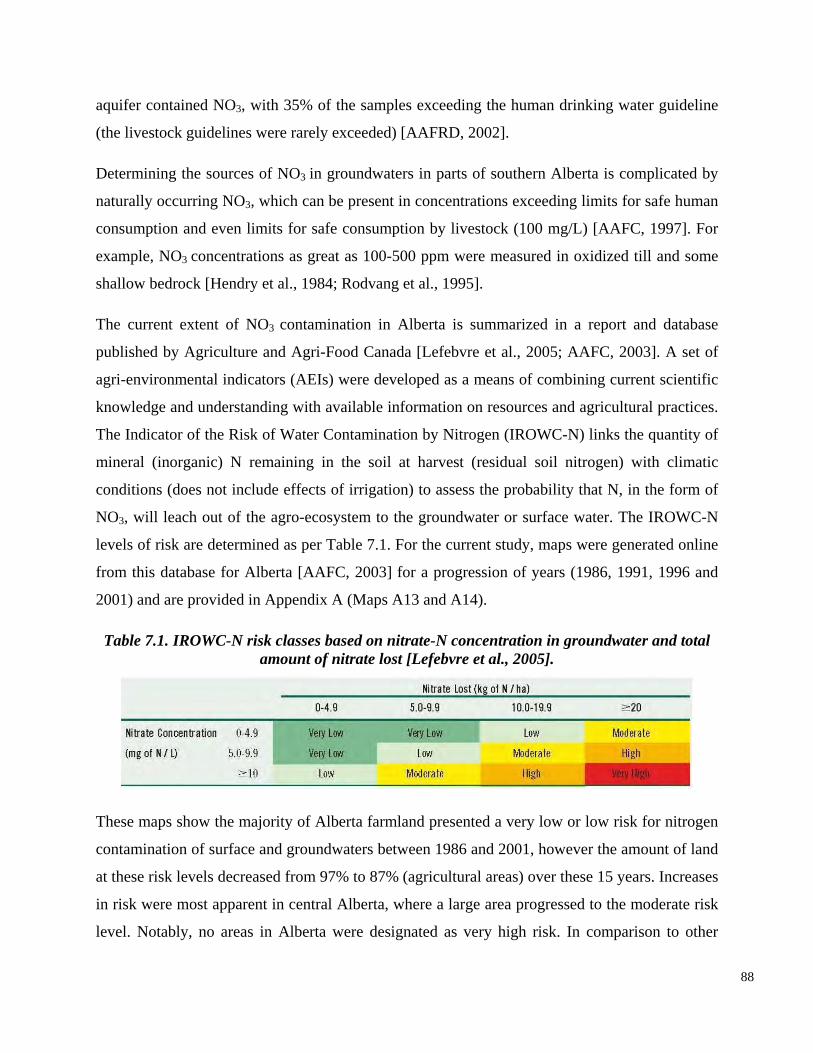
aquifer contained NO3, with 35% of the samples exceeding the human drinking water guideline
(the livestock guidelines were rarely exceeded) [AAFRD, 2002].
Determining the sources of NO3 in groundwaters in parts of southern Alberta is complicated by
naturally occurring NO3, which can be present in concentrations exceeding limits for safe human
consumption and even limits for safe consumption by livestock (100 mg/L) [AAFC, 1997]. For
example, NO3 concentrations as great as 100-500 ppm were measured in oxidized till and some
shallow bedrock [Hendry et al., 1984; Rodvang et al., 1995].
The current extent of NO3 contamination in Alberta is summarized in a report and database
published by Agriculture and Agri-Food Canada [Lefebvre et al., 2005; AAFC, 2003]. A set of
2001) and are provided in Appendix A (Maps A13 and A14).
Table 7.1. IROWC-N risk classes based on nitrate-N concentration in groundwater and total amount of nitrate lost [Lefebvre et al., 2005].
These maps show the majority of Alberta farmland presented a very low or low risk for nitrogen
contamination of surface and groundwaters between 1986 and 2001, however the amount of land
at these risk levels decreased from 97% to 87% (agricultural areas) over these 15 years. Increases
in risk were most apparent in central Alberta, where a large area progressed to the moderate risk
level. Notably, no areas in Alberta were designated as very high risk. In comparison to other
88
agri-environmental indicators (AEIs) were developed as a means of combining current scientific
knowledge and understanding with available information on resources and agricultural practices.
The Indicator of the Risk of Water Contamination by Nitrogen (IROWC-N) links the quantity of
mineral (inorganic) N remaining in the soil at harvest (residual soil nitrogen) with climatic
conditions (does not include effects of irrigation) to assess the probability that N, in the form of
NO3, will leach out of the agro-ecosystem to the groundwater or surface water. The IROWC-N
levels of risk are determined as per Table 7.1. For the current study, maps were generated online
from this database for Alberta [AAFC, 2003] for a progression of years (1986, 1991, 1996 and
regions in Canada presented later in this report (Chapter 9), the general level of risk in Alberta is
relatively low.
7.8. Extent of Subsurface P Contamination in Alberta
To the best of our knowledge, no documented studies have defined the extent of groundwater
contamination due to P from spreading manure or the specific contribution of P from
groundwater to surface waters in Alberta. The majority of the research on the extent of
level for crops of 60 ppm (approximately 120 kg/ha) in the top 15 cm of the soil. Soil tests also
showed P levels did not significantly change between the 1960s and 1990s (Map A15) [AAFRD,
2006].
The P Limits Project modelled soil P limits for Alberta by sub-basin based on restricting the
concentration of P in runoff to 1.0 (Map A16) and 0.5 ppm. The study concluded new guidelines
89
phosphorous contamination due to manure spreading has focused on the major contaminant
transport pathways to surface waters by runoff and erosion of soluble P and P-bearing materials
into local streams and tributaries [Howard et al., 1999; Hansen et al., 2002; Whalen and Chang,
2001].
Leaching of P can still occur in acid, sandy, waterlogged soils or soils with P concentrations
exceeding threshold values [Hansen et al., 2002; Kleinman et al., 2003; Whalen and Chang,
2001]. Subsurface transport of P may exceed the surface (erosion and runoff) transport of P via
large macro-pores and preferential flow channels during large rainfall events [Howard et al.,
1999].
The most comprehensive study of P contamination in Alberta – the Alberta Soil Phosphorus
Limits Project – was commissioned by the AAFRD [2006]. This study evaluated the current
extent of P ‘contamination’ of soils and the current level of risk associated with P contamination
to Alberta’s surface waters, and determined whether new guidelines for the application of P
(including manure spreading) were required to protect the quality of surface waters. The study
did not address groundwater contamination.
The P Limits Project determined most soils in Alberta are deficient in plant-available P. Soil P
levels from agricultural areas were significantly below (25 to 30 ppm) the agronomic threshold
exchangeable cations in soil: Soil Science 167(2): 126-134.
to limit the application of manure based on P content of the soil were not currently reasonable
(from a policy perspective), except in sensitive areas such as floodplains and riparian zones
where the risk of runoff and nutrient movement is very high [AAFRD, 2006].
7.9. References
Alberta Agriculture, Food and Rural Development (AAFRD), 2002, Agricultural impact on groundwater quality in the irrigated areas of Alberta: http://www1.agric.gov.ab.ca/$department/deptdocs.nsf/all/irr4452. Accessed March 18, 2007.
Alberta Agriculture, Food and Rural Development (AAFRD), 2006, Alberta Soil Phosphorus
Accessed January
Limits Project. Agriculture and Agri-Food Canada (AAFC), 2003, The National Land and Water Information
Service: Agri-Enviromental Indicators 13, 2008. http://nlwissnite1.agr.gc.ca/ind2001/index.phtml?lang=en-CA
Agriculture and Agri-Food Canada (AAFC), 1997, A Prairie-wide Perspective of Nonpoint Agricultural Effects on Water Quality: A Review of Documented Evidence and Expert Opinion.
Hao, X., and Chang, C., 2002, Effect of 25 annual cattle manure applications on soluble and
Hao, X., and Chang, C., 2003, Does long-term heavy cattle manure application increase salinity of a clay loam soil in semi-arid southern Alberta? Agriculture, Ecosystems & Environment 94(1): 89-103.
Hao, X., Chang, C., and Li, X., 2004, Long-term and residual effects of cattle manure application on distribution of P in soil aggregates: Soil Science 169(10): 715-728.
Hendry, M.J., McCready, D., and Gould, D., 1984, Distribution, source and evolution of nitrate in till of southern Alberta. J. of Hydrology Vol. 70: 177-198.
Howard, A.E., Olson, B.M., and Cooke, S. 1999. Impact of Soil Phosphorus Loading on WaterQuality in Alberta: A Review, Alberta Agriculture, Food and Rural Development.
90
Chang, C., and Entz, T., 1996, Nitrate leaching losses under repeated cattle feedlot manure applications in Southern Alberta: Journal of Environmental Quality 25(1): 145-153.
Chang, C., and Janzen, H.H., 1996, Long-term fate of nitrogen from annual feedlot manure applications: Journal of Environmental Quality 25(4): 785-790.
Chang, C., Whalen, J.K., and Hao, X., 2005, Increase in phosphorus concentration of a clay loam surface soil receiving repeated annual feedlot cattle manure applications in southern Alberta: Canadian Journal of Soil Science 85: 589-597.
Chang, C., Sommerfeldt, T.G., and Enz, T., 1991, Soil chemistry after eleven annual applications of cattle feedlot manure: Journal of Environmental Quality 20: 475-480.
Fitzgerald, D., 1995, Alberta farmstead water quality survey: Proceedings, Agricultural Impacts on Water Quality. CAESA. Red Deer, Alberta. p. 138-140.
Hansen, N.C., Daniel, T.C., Sharpley, A.N., and Lemunyon, J.L., 2002, The fate and transport of phosphorus in agricultural systems: Journal of Soil and Water Conservation 57(6): 408-416.
Johnson, J.Y.M., Thomas, J.E., Graham, T.A., Townshend, I., Byrne, J., Selinger, L.B., and Gannon, V.P.J., 2003, Prevalence of Escherichia coli O157: H7 and Salmonella spp. in surface waters of southern Alberta and its relation to manure sources: Canadian Journal of Microbiology 49(1), 326-335.
Kleinman, P.J.A., Needelman, B.A., Sharpley, A.N., and McDowell, R.W, 2003, Using soil phosphorus profile data to assess phosphorus leaching potential in manured soils: Soil Science Society of America Journal 67(1): 215-224.
Lefebvre, A., Eilers, W., and Chunn, B. (eds.), 2005, Environmental Sustainability of Canadian Agriculture: Agri-Environmental Indicator Report Series – Report #2. Agriculture and Agri-Food Canada, Ottawa, Ontario.
Olson, B.M., Bennett, D.R., McKenzie, R.H., Ormann, T., and Atkins, R.P., 1998, Manure qualitynutrient management to sustain groundwater near feedlots, Canada-Alberta
Environmentally Sustainable Agriculture; Proposal Based Research Program (RES-028-93). Olson, D.M., McKenzie, R.H., Bennett, D.R., Ormann, T., and Atkins, R.P., 2003, Manure
application effects on soil and groundwater quality under irrigation in southern Alberta, Alberta Agriculture, Food and Rural Development, Lethbridge, Alberta, Canada.
Rodvang, J., Schmidt-Bellach, R., Wassenaar, L.I., and Carefoot, J., 1995, Nitrates in soil and groundwater below irrigated fields in southern Alberta: Proc. International Assoc. of
91
Hydrogeologists 26. Edmonton, AB. Hydrology Vol. 70: 177-198. Rodvang, S.J., Mikalson, D.M., and Ryan, C.R., 2004, Changes in ground water quality in an
irrigated area of southern Alberta: Journal of Environmental Quality 33: 476-487. Rodvang, S.J., Mikalson, D.M., Ryan, C.R., and Hill, B.D., 2002, Groundwater Quality in the
Eastern Portion of the Lethbridge Northern Irrigation District 1995 to 2001, Alberta Agriculture, Food and Rural Development.
Whalen, J.K., and Chang, C., 2001, Phosphorus accumulation in cultivated soils from long-term annual applications of cattle feedlot manure: Journal of Environmental Quality 30: 229–237.
8. SUBSURFACE CONTAMINATION IN NORTH AMERICA DUE TO MANURE SPREADING
8.1. Subsurface Contamination Studies
The studies presented in this Chapter provide additional insight into the fate and transport of
nutrients derived from manure application, specifically regarding:
1) the long-term fate of the nutrients spread on fields;
2) the effect of irrigation and deficit irrigation on the leaching of nutrients from manure;
others studies are cited in Chapters 4 and 5. However, they provide a cross-section of the
research conducted on the effects of manure spreading, and confirm or elaborate on the findings
of the studies conducted in Alberta and presented in Chapter 7.
8.1.1. Nitrogen Contamination
8.1.1.1. Long-term Fate of N
The long-term fate of manure-derived N includes consideration of N within the soil profile, the
extent to which N leaches into the underlying groundwater, and the resulting changes in the
3) the effects of soil texture and permeability on the accumulation and leaching of nutrients from the soil; and
4) the spatial variation of contaminants within agricultural regions to determine the movement of these nutrients in the soil and the groundwater.
These studies discussed here do not represent all of the scientific literature from outside Alberta;
chemical composition of the soil. Six studies [Kimble et al., 1972; Mathers and Stewart, 1974;
Meek et al., 1982; Liebhardt et al., 1979; Sharpley et al., 1993; Basso and Ritchie, 2002] were
reviewed and demonstrate key aspects of the long-term fate of N from manure spreading. Detail
on the studies, including methods and materials for context, are provided in Appendix E.
Kimble et al. [1972] clearly show the effect of denitrification on the NO3-N within the soil
profile, with the rate of denitrification a function of depth. This depth relationship creates the
characteristic bulge of NO3-N concentrations within the soil profile due to reduced NO3-N
concentrations at shallower depths.
92
Mathers and Stewart [1974] clearly relate the rate of manure application on the surface of the soil
to plant uptake, leaching, and the rate of N accumulation within the soil. Leibhart et al. [1979]
further relate the rate of manure application to the NO3-N concentrations within the groundwater.
The movement of NH4-N within the soil profile is very limited. Leibhart et al. [1979] do not
show increases in NH4-N in the groundwater. Sharpley et al. [1993] in their study of very long-
term application of (poultry) manure show both total-N and NH4-N accumulate within the upper
limits of the soil while NO
The rates of manure application that minimally impact groundwater NO3-N concentrations
varied considerably. Mathers and Stewart [1974] demonstrate manure application rates of 22 and
44 Mg/ha/yr for four years (on clay loam) did not result in the accumulation of NO3-N in the soil
profile at a depth corresponding to the groundwater. Conversely, Liebhardt et al. [1979] report a
coarse-grained soil receiving applications of 13 Mg/ha/yr resulted in groundwater NO3-N
concentrations exceeding 10 mg/L within only a few years.
8.1.1.2. Effect of Irrigation
To the best of our knowledge, no studies other than those presented in the previous Chapter
3-N is the only form of N to substantially increase in concentration
below the upper 10 cm.
Basso and Ritchie [2005] show the leaching of NO3-N varies throughout the year; NO3-N is
taken up by crops and leaching is minimal during the growing season, but leaching is increased
during the rest of the year.
[Chang and Entz, 1996; Chang and Janzen, 1996; Whalen and Chang, 2001; Hao et al., 2004;
Chang et al., 2005] have specifically investigated the effects of irrigation on N migration through
the soil profile.
8.1.1.3. Effect of soil texture and permeability on N migration
To the best of our knowledge no studies other than those presented in the previous Chapter
[Olson et al., 2003] have specifically investigated the effects of soil texture and permeability on
the migration of N. Liebhardt et al. [1979] clearly show NO3-N from manure applications can
move throughout the soil profile and into groundwater in coarse-grained soils within the first
year of application.
93
8.1.1.4. Impact of N on regional groundwaters
As discussed in Chapter 7, Rodvang et al. [2004] demonstrated the ability of NO3-N to move
laterally in coarse grained-soils and affect NO3 concentrations in groundwater on a regional
level. Liebhardt et al. [1979] also show the ability of NO3-N from spread manure to leach into
and subsequently impact regional groundwater, presented spatially in Figure 8.1. The wells
outside of the experimental plots show average NO3-N and NH4-N concentrations from seven
sampling dates at depths of 3 and 6 m; data from within the plots are from a single sampling date
NO3-N concentrations twice as high at 3 m depth compared to 6 m depth. Figure 8.2 shows the
proposed flow path for the NO3-N from beneath the 179 Mg/ha plot through the coarse-grained
soil to the ditch. This proposed flow path shows lateral movement of NO3-N in the groundwater
through coarse-grained soil, similar to the movement in Rodvang et al. [2004], but in this case
leading to surface waters
8.1.2. Phosphorous Contamination
8.1.2.1. Long-term Fate of P
Five studies [Eghball et al., 1996; Kleinman et al., 2003; Mathers and Stewart, 1974; Meek et al.,
(April 1977) for well depths of 3, 4.5, and 6 m. The wells between the plot receiving 179 Mg/ha
manure and the ditch are clearly influenced by the addition of manure to the plots. In the well
located halfway between the 179 Mg/ha plot and the ditch (#), NO3-N concentrations were
higher at 6 vs. 3 m, indicating the source was not from local surface application but from
movement of NO3-N from below the surface of the plots. The well closer to the ditch (*) shows
1982; Sharpley et al., 1993] were reviewed and demonstrate the long-term fate of the P from
spread manure within the soil profile. Detail on the studies, including methods and materials for
context, are provided in Appendix E.
P has limited mobility within soils, which limits increases in concentrations due to manure
spreading to near the surface. Elevated P concentrations extend slightly deeper into the soil
profile with very high rates of manure application or with coarser soils. Eghball et al. [1996]
conclude heavy long-term application of manure to coarse-grained soils could pose a risk to
ground water, though at the rates studied this would take 51 years.
94
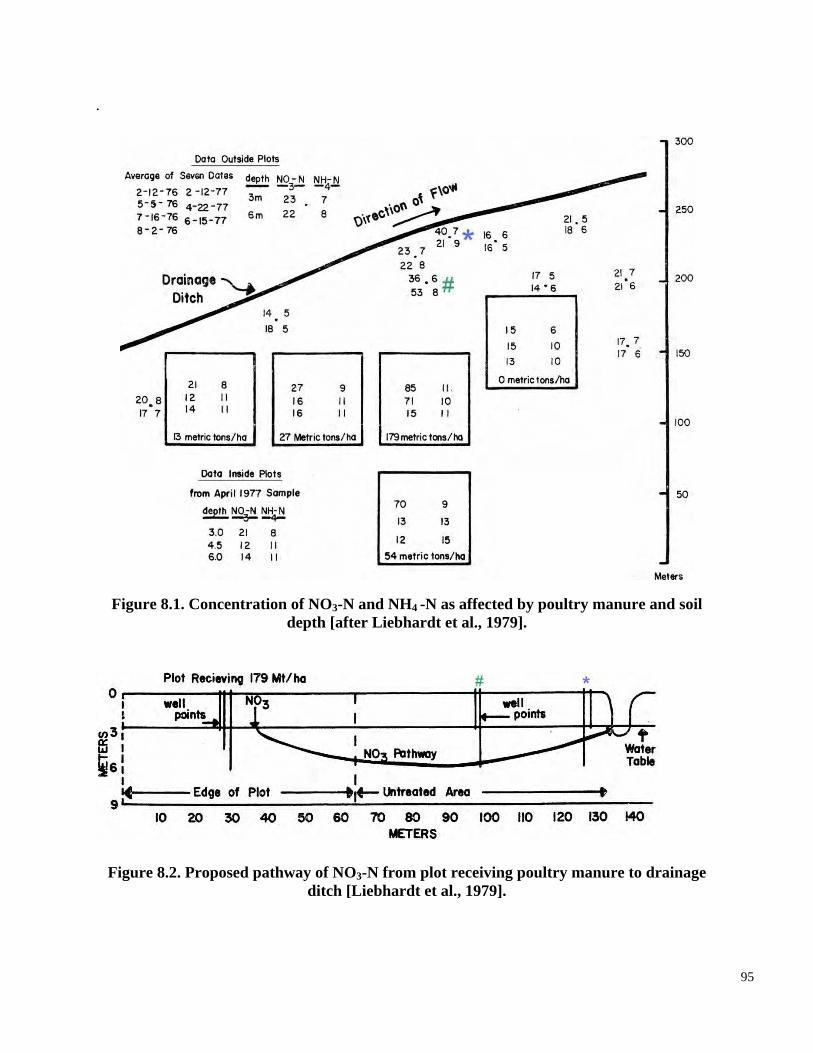
.
Figure 8.1. Concentration of NO3-N and NH4 -N as affected by poultry manure and soil depth [after Liebhardt et al., 1979].
Figure 8.2. Proposed pathway of NO3-N from plot receiving poultry manure to drainage ditch [Liebhardt et al., 1979].
95
the upper 40 cm of soil even with very long-term manure application.
Significant amounts of P were found to move into the groundwater by Kleinman et al. [2003],
not by moving through the soil profile but through macropores acting as preferential flow
channels. This movement overcomes the limited mobility of P to the groundwater.
8.1.2.2. Effect of Irrigation
To the best of our knowledge, no study has determined the effects of irrigation on P
contamination of groundwaters. The limited mobility of P though the soil profile likely results in
little to no contamination of groundwaters from manure-derived P. Whalen and Chang [2001]
permeability on P migration through the soil profile. The limited mobility of P though the soil
profile [Mathers and Stewart, 1974; Meek et al., 1982; Sharpley et al., 1993; Eghball et al., 1996;
Kleinman et al., 2003] likely results in little to no contamination of groundwaters from manure-
derived P.
Mathers and Stewart [1974] (clay-loam soil) and Meek et al. [1982] (silty-clay to silty clay loam)
both show the standard distribution of P within the soil profile, with P limited to the upper soil
layers. In both studies the P accumulated within the upper 0-30 cm soil layer, only reaching the
30-60 cm layer for the highest rates of manure application. Sharpley et al. [1993] document a
(see discussion in Chapter 7) best illustrate the effects of irrigation on the movement of P
through the soil profile.
8.1.2.3. Effect of soil texture and permeability on P migration
To the best of our knowledge, no study has determined the effects of soil texture and
similar limited penetration of P into the soil profile, with the increase in P content still limited to
The results from Eghball et al. [1996] show the ability of P to move deeper into profile of coarse-
grained soils, significantly increasing the concentrations of P in a 0.9 to 1.2 m soil layer. This
demonstrates the effect of the lower sorption capacity of coarse-grained soils relative to soils
with a high clay content.
8.1.2.4. Impact of P on regional groundwaters
To the best of our knowledge, no study has determined the impact of P contamination on
regional groundwaters. The limited mobility of P though the soil profile [Mathers and Stewart
96
potential contribution of manure to groundwater NO3
production and application are included when available.
1974; Meek et al. 1982; Sharpley et al. 1993; Eghball et al. 1996; Kleinman et al. 2003] likely
results in little to no contamination of groundwaters from manure-derived P.
8.2. Extent of Subsurface N Contamination
NO3 contamination is the widest spread chemical contaminant in aquifers throughout the world,
with an ever increasing extent and intensity of contamination. Areas with long histories of
intensive farming and high levels of precipitation in the European Union (EU) exhibit
particularly elevated levels of N contamination. Examples of this contamination include
3. Denmark, where 8% of public water works are supplied by groundwater that exceeds EU limits; and
4. Germany, where 5% of the public water works supply is from groundwater that exceeds the EU limits.
The extent of N contamination of groundwater is also a significant concern in the intensive
agricultural areas of North America. The remainder of this section focuses on the extent and
magnitude of N contamination within Canada and the United States. Limited data are available
regarding the sources of NO3 in groundwater in agricultural areas. In addition, whether NO3 is
from manure or commercial fertilizer is uncertain in most studies. To provide insight into the
[Spalding and Exner, 1993]:
1. France, where more than 20% of the population or approximately 10 million have drinking water which exceeds the EU limit (1993 estimate);
2. Belgium, where large areas have groundwater with concentrations ranging from 4-11.4 mg/L of NO3;
contamination, the rates of manure
8.2.1. Extent of N Contamination in Canada
Approximately 8 million Canadians (26% of the population) rely on groundwater for their
domestic water supply [Chambers et al., 2002]. The majority of this population (60%) lives in
rural areas and the remainder in smaller municipalities [Environment Canada, 1990]. NO3 is the
most common contaminant of groundwater in Canada and all provinces have some groundwater
supplies contaminated with NO3 in excess of 10 mg/L [Chambers et al., 2002].
97
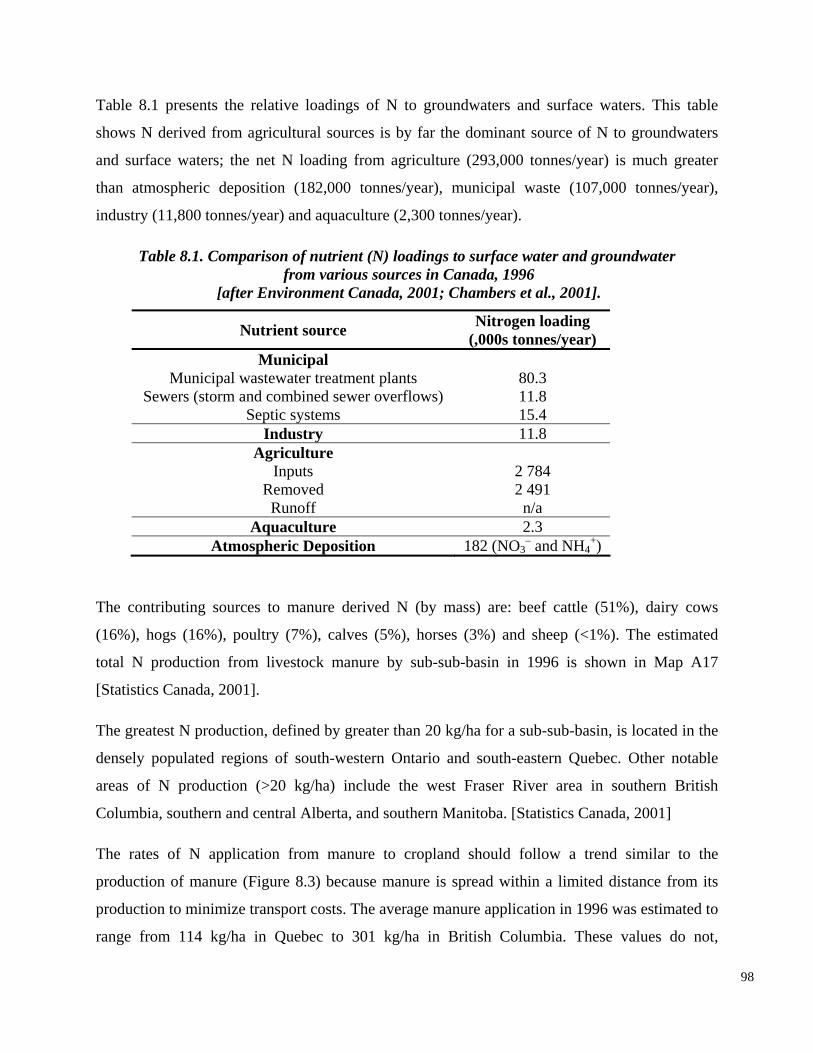
Table 8.1 presents the relative loadings of N to groundwaters and surface waters. This table
shows N derived from agricultural sources is by far the dominant source of N to groundwaters
and surface waters; the net N loading from agriculture (293,000 tonnes/year) is much greater
than atmospheric deposition (182,000 tonnes/year), municipal waste (107,000 tonnes/year),
industry (11,800 tonnes/year) and aquaculture (2,300 tonnes/year).
Table 8.1. Comparison of nutrient (N) loadings to surface water and groundwater from various sources in Canada, 1996
[after Environment Canada, 2001; Chambers et al., 2001].
Nutrient source Nitrogen loading (,000s tonnes/year)
Municipal Municipal wastewater treatment plants
Sewers (storm and combined sewer overflows) Septic systems
80.3 11.8 15.4
Industry 11.8 Agriculture
Inputs Removed Runoff
2 784 2 491
n/a Aquaculture 2.3
Atmospheric Deposition 182 (NO3 – and NH4
+)
The contributing sources to manure derived N (by mass) are: beef cattle (51%), dairy cows
(16%), hogs (16%), poultry (7%), calves (5%), horses (3%) and sheep (<1%). The estimated
total N production from livestock manure by sub-sub-basin in 1996 is shown in Map A17
[Statistics Canada, 2001].
The greatest N production, defined by greater than 20 kg/ha for a sub-sub-basin, is located in the
densely populated regions of south-western Ontario and south-eastern Quebec. Other notable
areas of N production (>20 kg/ha) include the west Fraser River area in southern British
Columbia, southern and central Alberta, and southern Manitoba. [Statistics Canada, 2001]
The rates of N application from manure to cropland should follow a trend similar to the
production of manure (Figure 8.3) because manure is spread within a limited distance from its
production to minimize transport costs. The average manure application in 1996 was estimated to
range from 114 kg/ha in Quebec to 301 kg/ha in British Columbia. These values do not,
98
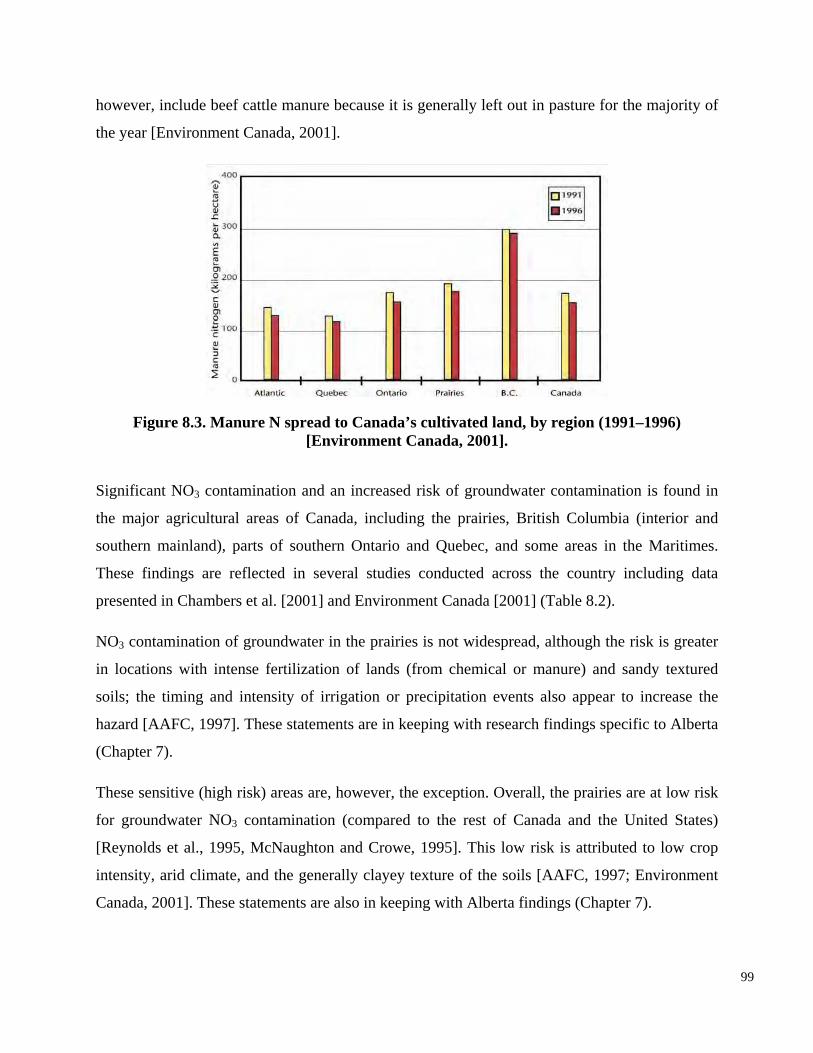
however, include beef cattle manure because it is generally left out in pasture for the majority of
the year [Environment Canada, 2001].
Figure 8.3. Manure N spread to Canada’s cultivated land, by region (1991–1996)
soils; the timing and intensity of irrigation or precipitation events also appear to increase the
hazard [AAFC, 1997]. These statements are in keeping with research findings specific to Alberta
(Chapter 7).
These sensitive (high risk) areas are, however, the exception. Overall, the prairies are at low risk
for groundwater NO3 contamination (compared to the rest of Canada and the United States)
[Reynolds et al., 1995, McNaughton and Crowe, 1995]. This low risk is attributed to low crop
intensity, arid climate, and the generally clayey texture of the soils [AAFC, 1997; Environment
Canada, 2001]. These statements are also in keeping with Alberta findings (Chapter 7).
99
[Environment Canada, 2001].
Significant NO3 contamination and an increased risk of groundwater contamination is found in
the major agricultural areas of Canada, including the prairies, British Columbia (interior and
southern mainland), parts of southern Ontario and Quebec, and some areas in the Maritimes.
These findings are reflected in several studies conducted across the country including data
presented in Chambers et al. [2001] and Environment Canada [2001] (Table 8.2).
NO3 contamination of groundwater in the prairies is not widespread, although the risk is greater
in locations with intense fertilization of lands (from chemical or manure) and sandy textured
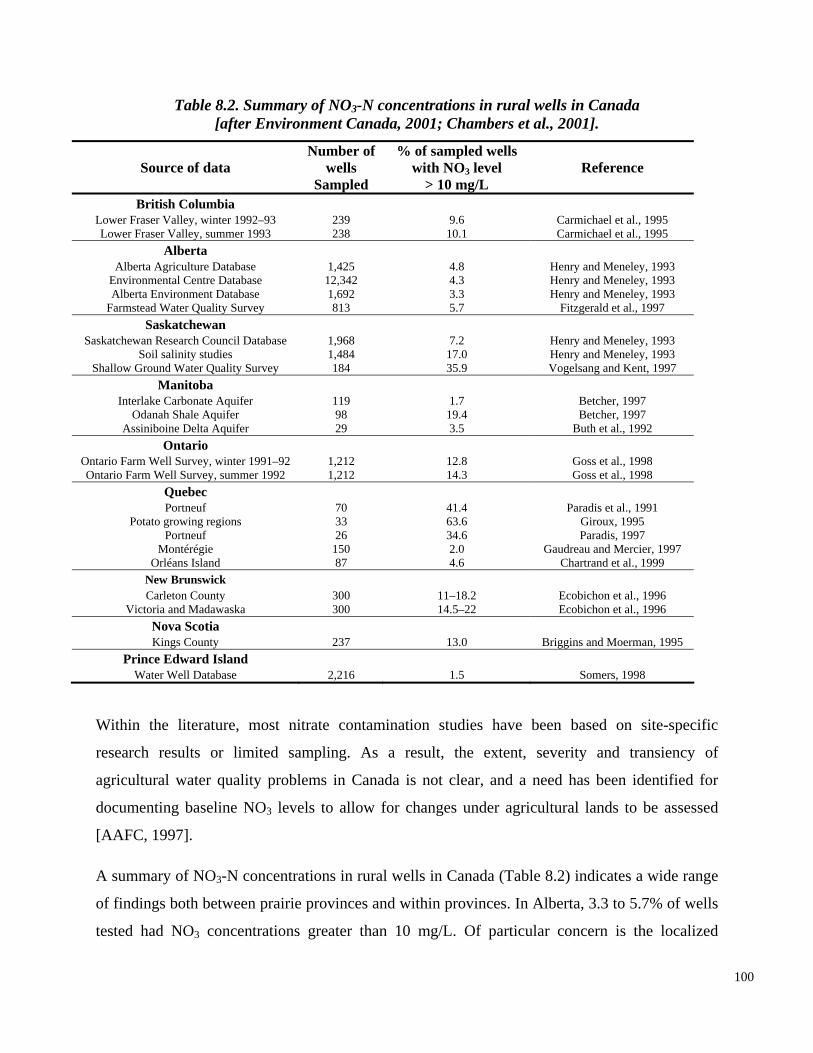
Table 8.2. Summary of NO3-N concentrations in rural wells in Canada [after Environment Canada, 2001; Chambers et al., 2001].
Number of % of sampled wells Source of data wells with NO3 level Reference
Sampled > 10 mg/L British Columbia
Lower Fraser Valley, winter 1992–93 239 9.6 Carmichael et al., 1995 Lower Fraser Valley, summer 1993 238 10.1 Carmichael et al., 1995
Alberta Alberta Agriculture Database 1,425 4.8 Henry and Meneley, 1993
Environmental Centre Database 12,342 4.3 Henry and Meneley, 1993 Alberta Environment Database 1,692 3.3 Henry and Meneley, 1993
Farmstead Water Quality Survey 813 5.7 Fitzgerald et al., 1997 Saskatchewan
Saskatchewan Research Council Database 1,968 7.2 Henry and Meneley, 1993 Soil salinity studies 1,484 17.0 Henry and Meneley, 1993
Shallow Ground Water Quality Survey 184 35.9 Vogelsang and Kent, 1997 Manitoba
Interlake Carbonate Aquifer 119 1.7 Betcher, 1997 Odanah Shale Aquifer 98 19.4 Betcher, 1997
Assiniboine Delta Aquifer 29 3.5 Buth et al., 1992 Ontario
Ontario Farm Well Survey, winter 1991–92 1,212 12.8 Goss et al., 1998 Ontario Farm Well Survey, summer 1992 1,212 14.3 Goss et al., 1998
Quebec Portneuf 70 41.4 Paradis et al., 1991
Potato growing regions 33 63.6 Giroux, 1995 Portneuf 26 34.6 Paradis, 1997
Montérégie 150 2.0 Gaudreau and Mercier, 1997 Orléans Island 87 4.6 Chartrand et al., 1999
New Brunswick Carleton County 300 11–18.2 Ecobichon et al., 1996
Victoria and Madawaska 300 14.5–22 Ecobichon et al., 1996 Nova Scotia Kings County 237 13.0 Briggins and Moerman, 1995
Prince Edward Island Water Well Database 2,216 1.5 Somers, 1998
Within the literature, most nitrate contamination studies have been based on site-specific
research results or limited sampling. As a result, the extent, severity and transiency of
agricultural water quality problems in Canada is not clear, and a need has been identified for
documenting baseline NO3 levels to allow for changes under agricultural lands to be assessed
[AAFC, 1997].
A summary of NO3-N concentrations in rural wells in Canada (Table 8.2) indicates a wide range
of findings both between prairie provinces and within provinces. In Alberta, 3.3 to 5.7% of wells
tested had NO3 concentrations greater than 10 mg/L. Of particular concern is the localized
100
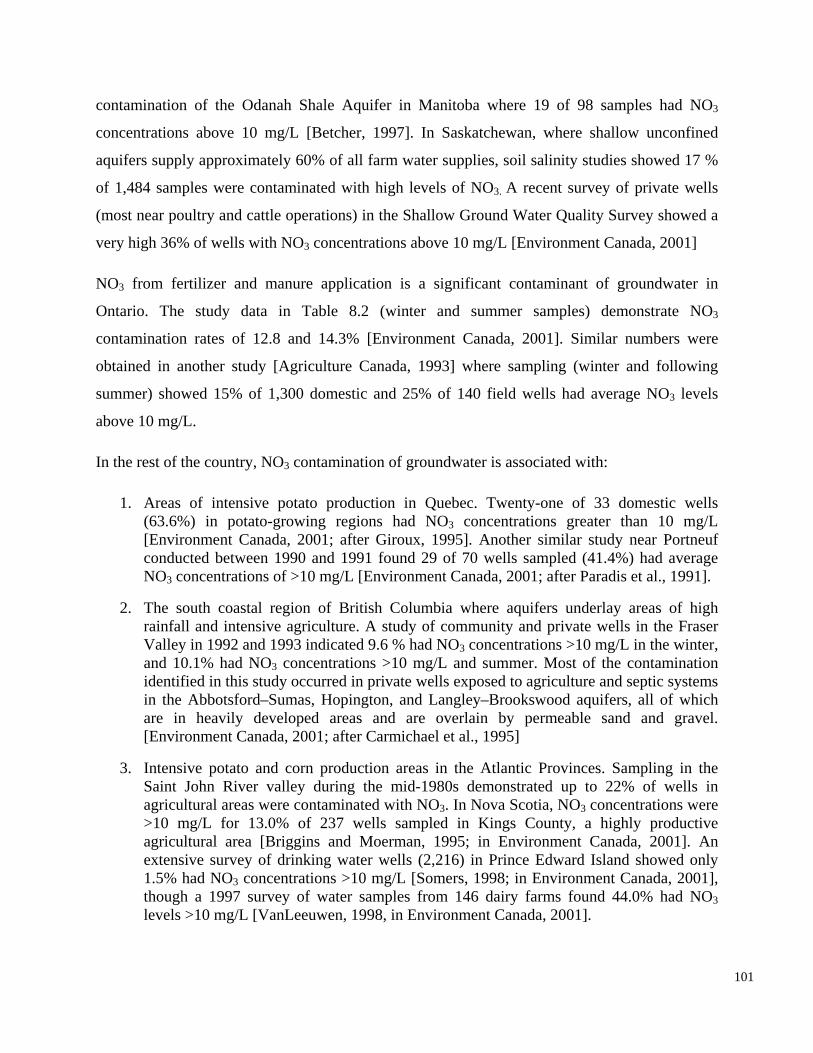
contamination of the Odanah Shale Aquifer in Manitoba where 19 of 98 samples had NO3
concentrations above 10 mg/L [Betcher, 1997]. In Saskatchewan, where shallow unconfined
aquifers supply approximately 60% of all farm water supplies, soil salinity studies showed 17 %
of 1,484 samples were contaminated with high levels of NO3. A recent survey of private wells
(most near poultry and cattle operations) in the Shallow Ground Water Quality Survey showed a
very high 36% of wells with NO3 concentrations above 10 mg/L [Environment Canada, 2001]
NO3 from fertilizer and manure application is a significant contaminant of groundwater in
Ontario. The study data in Table 8.2 (winter and summer samples) demonstrate NO3
contamination rates of 12.8 and 14.3% [Environment Canada, 2001]. Similar numbers were
obtained in another study [Agriculture Canada, 1993] where sampling (winter and following
summer) showed 15% of 1,300 domestic and 25% of 140 field wells had average NO3 levels
above 10 mg/L.
in the Abbotsford–Sumas, Hopington, and Langley–Brookswood aquifers, all of which are in heavily developed areas and are overlain by permeable sand and gravel. [Environment Canada, 2001; after Carmichael et al., 1995]
3. Intensive potato and corn production areas in the Atlantic Provinces. Sampling in the Saint John River valley during the mid-1980s demonstrated up to 22% of wells in agricultural areas were contaminated with NO3. In Nova Scotia, NO3 concentrations were >10 mg/L for 13.0% of 237 wells sampled in Kings County, a highly productive agricultural area [Briggins and Moerman, 1995; in Environment Canada, 2001]. An extensive survey of drinking water wells (2,216) in Prince Edward Island showed only 1.5% had NO3 concentrations >10 mg/L [Somers, 1998; in Environment Canada, 2001], though a 1997 survey of water samples from 146 dairy farms found 44.0% had NO3 levels >10 mg/L [VanLeeuwen, 1998, in Environment Canada, 2001].
101
In the rest of the country, NO3 contamination of groundwater is associated with:
1. Areas of intensive potato production in Quebec. Twenty-one of 33 domestic wells (63.6%) in potato-growing regions had NO3 concentrations greater than 10 mg/L [Environment Canada, 2001; after Giroux, 1995]. Another similar study near Portneuf conducted between 1990 and 1991 found 29 of 70 wells sampled (41.4%) had average NO3 concentrations of >10 mg/L [Environment Canada, 2001; after Paradis et al., 1991].
2. The south coastal region of British Columbia where aquifers underlay areas of high rainfall and intensive agriculture. A study of community and private wells in the Fraser Valley in 1992 and 1993 indicated 9.6 % had NO3 concentrations >10 mg/L in the winter, and 10.1% had NO3 concentrations >10 mg/L and summer. Most of the contamination identified in this study occurred in private wells exposed to agriculture and septic systems
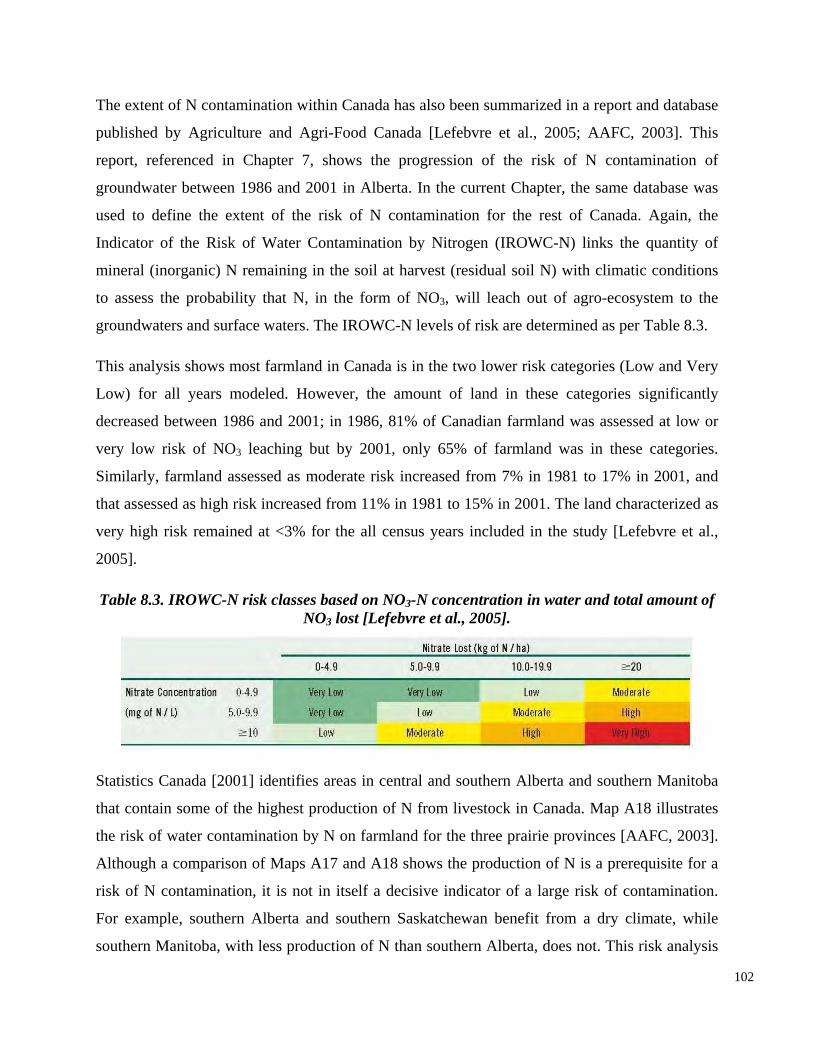
The extent of N contamination within Canada has also been summarized in a report and database
published by Agriculture and Agri-Food Canada [Lefebvre et al., 2005; AAFC, 2003]. This
report, referenced in Chapter 7, shows the progression of the risk of N contamination of
groundwater between 1986 and 2001 in Alberta. In the current Chapter, the same database was
used to define the extent of the risk of N contamination for the rest of Canada. Again, the
Indicator of the Risk of Water Contamination by Nitrogen (IROWC-N) links the quantity of
mineral (inorganic) N remaining in the soil at harvest (residual soil N) with climatic conditions
to assess the probability that N, in the form of NO3, will leach out of agro-ecosystem to the
groundwaters and surface waters. The IROWC-N levels of risk are determined as per Table 8.3.
Statistics Canada [2001] identifies areas in central and southern Alberta and southern Manitoba
that contain some of the highest production of N from livestock in Canada. Map A18 illustrates
the risk of water contamination by N on farmland for the three prairie provinces [AAFC, 2003].
Although a comparison of Maps A17 and A18 shows the production of N is a prerequisite for a
risk of N contamination, it is not in itself a decisive indicator of a large risk of contamination.
For example, southern Alberta and southern Saskatchewan benefit from a dry climate, while
southern Manitoba, with less production of N than southern Alberta, does not. This risk analysis
102
This analysis shows most farmland in Canada is in the two lower risk categories (Low and Very
Low) for all years modeled. However, the amount of land in these categories significantly
decreased between 1986 and 2001; in 1986, 81% of Canadian farmland was assessed at low or
very low risk of NO3 leaching but by 2001, only 65% of farmland was in these categories.
Similarly, farmland assessed as moderate risk increased from 7% in 1981 to 17% in 2001, and
that assessed as high risk increased from 11% in 1981 to 15% in 2001. The land characterized as
very high risk remained at <3% for the all census years included in the study [Lefebvre et al.,
2005].
Table 8.3. IROWC-N risk classes based on NO3-N concentration in water and total amount of NO3 lost [Lefebvre et al., 2005].
is limited in that it does not address the effects of irrigation. Notably, southern Alberta has the
highest concentration and amount of irrigation in the country.
The proportion of prairie farmland in the very low and low risk classes decreased from 1981 to
2001: from 97 to 87% in Alberta; from 95 to 79% in Saskatchewan; and from 12 to 4% in
Manitoba. Of the three prairie provinces, Manitoba had the highest proportion of farmland in the
high and very high risk classes, or 66% and 3% respectively in 2001, down 9% from 1981 levels
[Lefebvre et al., 2005].
risk for groundwater N contamination [Lefebvre et al., 2005].
8.2.2. Extent of N Contamination in the United States
Groundwater contamination significantly impacts the United States as groundwater provides
drinking water for more than half of the population, and accounts for 39% of the public water
103
Southern Ontario had the highest assessed risk of N contamination of groundwater in the
country. Sixty percent of the farmland in Ontario was assessed as low or very low in 1981
(similar values for 1986, 1991, 1996). However, this value dropped substantially to 10% in 2001,
indicating 90% of the agricultural areas with considerable risk of N contamination of
groundwater resources [Lefebvre et al., 2005].
Southern Ontario contains some of the most concentrated livestock production (and consequently
highest N production [Statistics Canada, 2001]) combined with a fairly wet climate (relative to
the prairies). This results in the large majority of the farmland having a groundwater
contamination risk of high or very high (73% and 8%, respectively, for 2001; Map A19)
[Lefebvre et al., 2005]. Agricultural fields have been identified as the main diffuse source of NO3
leaching into the groundwater in southern Ontario [Goss et al., 1998].
Both British Columbia and Quebec show trends similar to the national trend, with a majority of
the farmland in the low and very low categories; percentages in both risk categories decreased
from 1981 to 2001 (from 62 to 51% for BC, and from 80 to 63% for Quebec). The maritime
provinces also exhibit concentrated areas of high to very high risk; most notable is Prince
Edward Island where the entirety of the province has been assessed at either moderate or high
supply for cities and towns. Groundwater is the sole source of drinking water in many rural
communities and several larger cites [Nolan et al., 1997].
The United States contains areas of significant risk for NO3 contamination. The U.S. Geological
Survey conducted a study between 1993 and 2000 as part of their National Water-Quality
Assessment (NAWQA) program. Their sampling of 1,710 domestic wells and 264 public-supply
wells showed 9% of domestic wells and 2% of public-supply wells had NO3 concentrations
exceeding the U.S. Environmental Protection Agency’s (USEPA) maximum contaminant level
of 10 mg/L [Nolan et al., 2002].
The USEPA conducted a much more extensive study of US drinking water wells between 1988
and 1990. NO3 was found in over half of the 94,600 community water system wells sampled,
with 1.2% exceeding 10 mg/L; in the 10.5 million rural domestic wells the USEPA found or
estimated NO3 in almost 60%, with 2.4% exceeding 10 mg/L. This confirms the prevalence of
Map A21 was generated as part of a study by the USGS [Nolan et al., 1997] that modelled the
risk to groundwater due to N from both agricultural and non-agricultural sources. The modelled
risk of shallow groundwater contamination by NO3 was found to be dependant upon N inputs to
the soil surface, the degree to which the soils lend to leaching of the NO3 to the aquifer, and the
accumulation of N in the soil. Population density was used as a measure to indicate additional
non-agricultural sources of N in urban areas [USGS, 1998; Nolan et al., 1997].
Map A21 indicates in red the parts of United States with a high risk of NO3 contamination of
shallow groundwater; these areas generally have well-drained soils, high N input, and low
woodland to cropland ratios. High woodland to cropland ratios indicate areas receiving smaller
104
NO3 in drinking water, making it the most frequently detected chemical in water supplies. The
percentage of wells with concentrations exceeding 10 mg/L is small but represents 4.5 million
people (66,000 infants) using water exceeding the NO3 contamination guidelines [USDA, 1997].
Map A20 presents the manure N production from confined livestock operations in 1997, and is a
good representation of the distribution of the production of manure-based N in the United States.
Regions of high N-based manure production coincide with regions with relatively high residual
N and intensive agriculture, including the Corn Belt, parts of the Southeast, and the areas of the
West under intense irrigation (Washington, California, and Idaho).
amounts of fertilizer and manure, thus decreasing the risk of NO3 contamination of groundwater
[Nolan et al., 1997].
Map A21, generated by Nolan et al. [1997], correlates well with a study published by Madison
and Brunett [1985] (Map A22) that mapped NO3 concentrations in 87,000 wells within the
conterminous United States using a 25-year data base from the USGS Water Storage and
Retrieval System. While this data set is not representative of a particular time (though all
samples predate 1985), and sampling is based on special projects and municipal wells, it was
contains some of the most productive, fertile, and intensely cropped land in world. It consists of
flat fertile land, with relatively high levels of precipitation. The highest concentrations of NO3
are found in wells near feedlots and cropland. Areas of the Corn Belt are at increased risk of
groundwater contamination due to non-point N sources (commercial fertilizer and manure
applications) from intensive agriculture [Madison and Brunett, 1985; Nolan et al., 1997; Nolan
and Hitt, 2006]. Counties with the most intensive agriculture may often not show the highest
NO3 concentrations in wells, as evidence indicates drainage tiles used in these areas intercept
105
considered useful for identifying regions with NO3 problems [Spalding and Exner, 1993]. The
strongest agreement between Maps A20 and A21 is in the identification of high risk areas in the
Great Plains of the Midwestern states and Texas, the Western states of California, Washington
and Arizona, the Corn Belt states, and the Northeast.
Nolan and Hitt [2006] is a continuation of the modelling work from Nolan et al. [1997]; this
work focused on modelling the contamination of the shallow groundwater. This new model
predicted NO3 concentration (rather than probability of occurrence), which can be directly
compared with EPA guidelines, and employed a mechanistic structure that segregates sources of
N, and soil and climate variables that enhance or restrict NO3 transport and accumulation in
ground water. As expected, areas with high N input, irrigation or precipitation, well-drained
soils, fractured rocks, or those with high effective porosity and lack of attenuation processes have
the highest predicted NO3 concentration. Moderate to severe NO3 contamination is predicted to
occur in the High Plains, northern Midwest, and selected other areas. The results of this model
are presented in Map A23 [Nolan and Hitt, 2006].
The Corn Belt (primarily Iowa, Indiana, Illinois, and Ohio, though often inclusive of parts of
South Dakota, Nebraska, Kansas, Minnesota, Wisconsin, Michigan, Missouri, and Kentucky)
NO3 and divert it away from groundwaters to surface waters, and this mechanism is more
significant in the reduction of NO3 in groundwaters than denitrification [Spalding and Exner,
1993].
Maps A20, A21 and A22 indicate large parts of Nebraska are at high risk for groundwater
contamination. Though Illinois, Iowa and Nebraska are the three top corn producers, Nebraska
has the greatest NO3 contamination. This NO3 contamination is not due to the intensity of the
agriculture or the availability of abundant shallow aquifers for both irrigation and contamination,
but rather to the coincidence of shallow aquifers with the presence of well-drained soils provides
ample opportunity for excess N to leach into groundwater sources. Studies of the Platte River
Basin in Nebraska indicate a high incidence (183 of 256; 71%) of NO3 contamination with wells
exceeding 10 mg/L [Gormly and Spalding, 1979 in Canter, 1987; AAFC, 1997].
Very similar geological conditions and agricultural practices are prevalent throughout this region
Intensive agriculture and application of N also occurs in the south-eastern States; however, high
rainfall and temperature allow for a ‘rapid up-take’ of NO3 and provide ideal conditions for
denitrification, and therefore the risk of contamination of groundwaters is significantly reduced
[Spalding and Exner, 1993].
8.3. Extent of Subsurface P Contamination
To the best of our knowledge, no studies have determined the extent of groundwater
contamination due to phosphorous from spread manure or the specific contribution of
phosphorous from groundwater to surface waters. As with Alberta, the majority of the research
on phosphorous contamination due to manure spreading has focused on the major contaminant
106
of the High Plains, which in addition to Nebraska includes eastern New Mexico, north-western
Texas, western Oklahoma, eastern Colorado, western Kansas, and south-eastern Wyoming.
Heavily irrigated agriculture over well drained and permeable vadose zones also occurs in the
sand plain region of Wisconsin, and in the highly concentrated agricultural areas in central and
southern California and south-eastern Washington [Spalding and Exner, 1993]. In California, a
study of tile effluent from a mature irrigated orange grove was 50-60 mg/L NO3, equivalent to
50% of the applied N leaching through to the tile beds (although perhaps not from that source )
[Bingham et al., 1971 in Canter, 1987; AAFC, 1997].
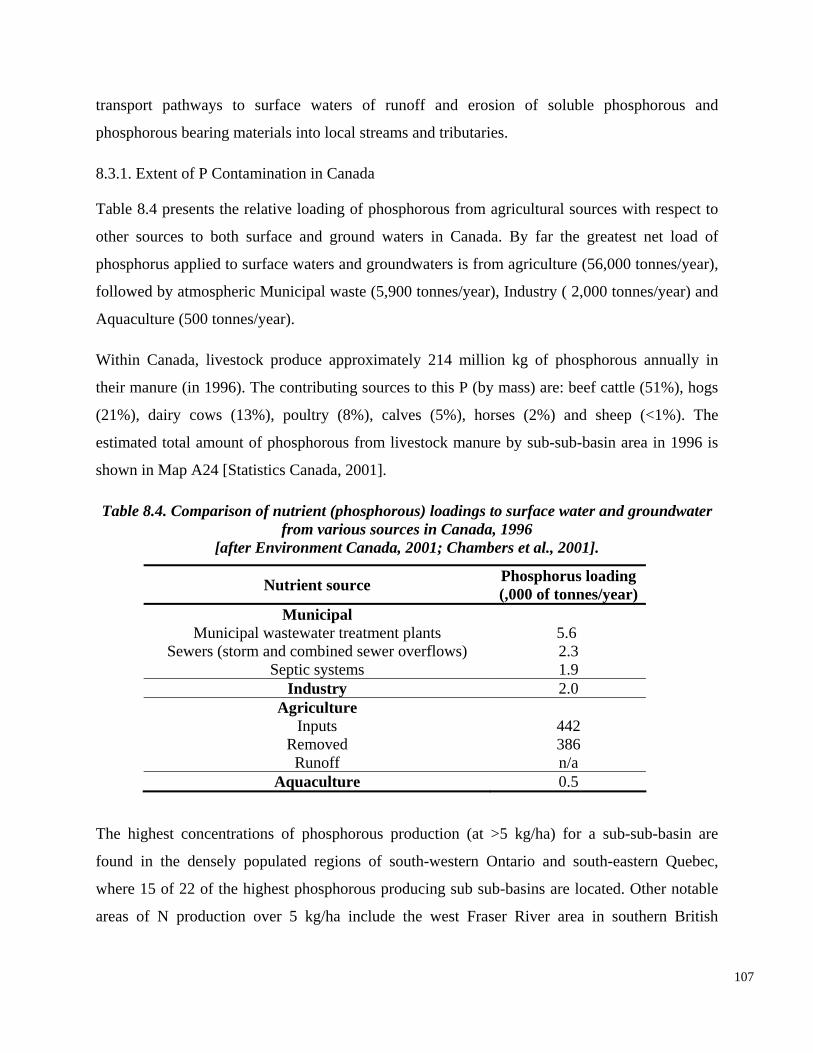
transport pathways to surface waters of runoff and erosion of soluble phosphorous and
phosphorous bearing materials into local streams and tributaries.
8.3.1. Extent of P Contamination in Canada
Table 8.4 presents the relative loading of phosphorous from agricultural sources with respect to
other sources to both surface and ground waters in Canada. By far the greatest net load of
phosphorus applied to surface waters and groundwaters is from agriculture (56,000 tonnes/year),
Municipal Municipal wastewater treatment plants
Sewers (storm and combined sewer overflows) Septic systems
5.6 2.3 1.9
Industry 2.0 Agriculture
Inputs Removed Runoff
442 386 n/a
Aquaculture 0.5
The highest concentrations of phosphorous production (at >5 kg/ha) for a sub-sub-basin are
found in the densely populated regions of south-western Ontario and south-eastern Quebec,
where 15 of 22 of the highest phosphorous producing sub sub-basins are located. Other notable
areas of N production over 5 kg/ha include the west Fraser River area in southern British
107
followed by atmospheric Municipal waste (5,900 tonnes/year), Industry ( 2,000 tonnes/year) and
Aquaculture (500 tonnes/year).
Within Canada, livestock produce approximately 214 million kg of phosphorous annually in
their manure (in 1996). The contributing sources to this P (by mass) are: beef cattle (51%), hogs
(21%), dairy cows (13%), poultry (8%), calves (5%), horses (2%) and sheep (<1%). The
estimated total amount of phosphorous from livestock manure by sub-sub-basin area in 1996 is
shown in Map A24 [Statistics Canada, 2001].
Table 8.4. Comparison of nutrient (phosphorous) loadings to surface water and groundwater from various sources in Canada, 1996
[after Environment Canada, 2001; Chambers et al., 2001].
Nutrient source Phosphorus loading (,000 of tonnes/year)
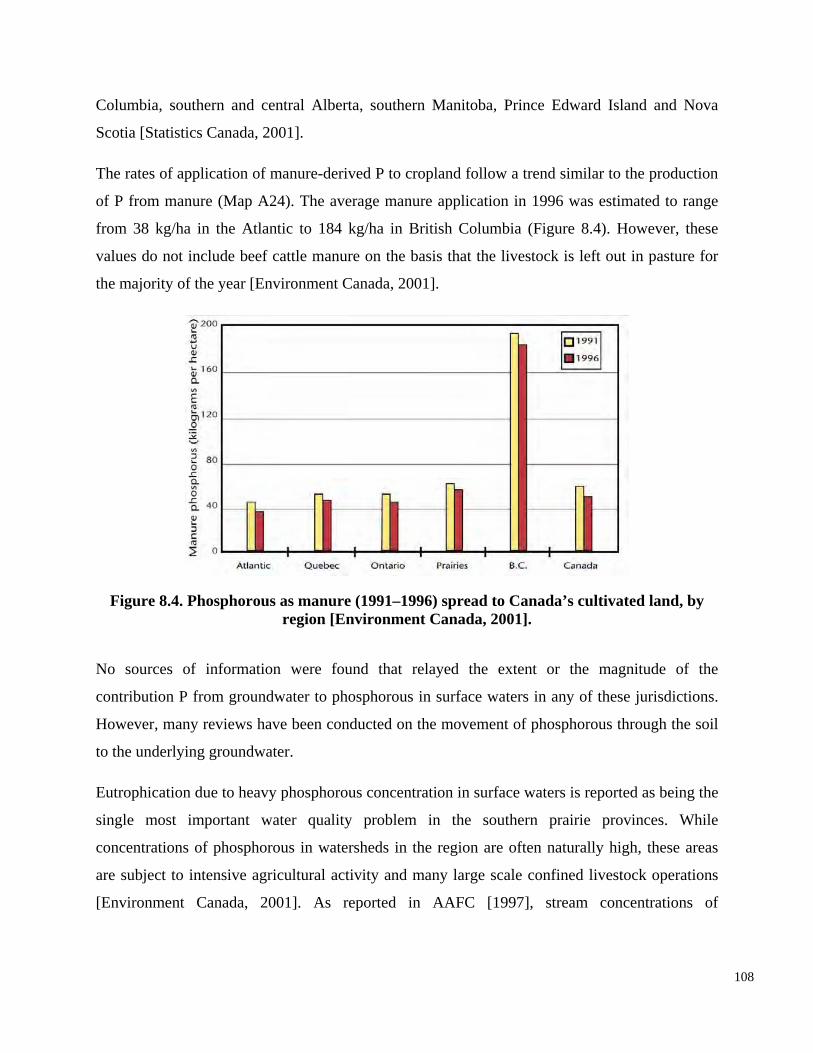
Columbia, southern and central Alberta, southern Manitoba, Prince Edward Island and Nova
Scotia [Statistics Canada, 2001].
The rates of application of manure-derived P to cropland follow a trend similar to the production
of P from manure (Map A24). The average manure application in 1996 was estimated to range
from 38 kg/ha in the Atlantic to 184 kg/ha in British Columbia (Figure 8.4). However, these
values do not include beef cattle manure on the basis that the livestock is left out in pasture for
the majority of the year [Environment Canada, 2001].
Figure 8.4. Phosphorous as manure (1991–1996) spread to Canada’s cultivated land, by region [Environment Canada, 2001].
No sources of information were found that relayed the extent or the magnitude of the
contribution P from groundwater to phosphorous in surface waters in any of these jurisdictions.
However, many reviews have been conducted on the movement of phosphorous through the soil
to the underlying groundwater.
Eutrophication due to heavy phosphorous concentration in surface waters is reported as being the
single most important water quality problem in the southern prairie provinces. While
concentrations of phosphorous in watersheds in the region are often naturally high, these areas
are subject to intensive agricultural activity and many large scale confined livestock operations
[Environment Canada, 2001]. As reported in AAFC [1997], stream concentrations of
108
phosphorous are often highest near cattle operations, and phosphorous loading tends to increase
with the number of cattle [Mitchell and Hamilton, 1982 in Mitchell, 1992; AAFC, 1997].
Southern Ontario is subject to both heavy agriculture as well as municipal sewage from a large
and growing population, and this has substantially impacted surface water quality. The effects
are greatest in the Lake Erie basin, but are also visible in Lake Simcoe and Lake Rice. Southern
Ontario rivers such as the Thames, Grand, Don, and Humber all have total P concentrations
exceeding Ontario's provincial water quality objective for rivers of 30 mg/L and are thus
considered eutrophic [Environment Canada, 2001]. Other findings related to sediment loadings
indicate agricultural land accounts for up to 60% of the diffuse P load in Ontario [Environment
Canada, 1990].
In agricultural areas located adjacent to the St. Lawrence lowland in southern Quebec, the effects
of high nutrient inputs became apparent in rivers and lakes between 1968 and 1988. Surveys of
calculated based on residual P levels in the soil, climate data, dominant soil type, degree of
saturation, and estimates from census data of livestock production. This assessment measures the
ability of agricultural soil with a given degree of P saturation and receiving a given quantity of P
to release that P to streams and rivers. Map A25 illustrates the risk assessment for Quebec for the
loss of P to surface waters.
Census data indicate an increase in the amount of farmland in Quebec assessed as low risk from
phosphorus contamination both during the intervals 1981-1991 (an increase of 15%) and 1996
2001 (an increase of 30%). The proportion of land assessed at moderate risk class varied between
65% and 50% of the total land assessed. The amount of farmland assessed as high risk remained
109
Quebec rivers reported total P concentrations above the provincial guideline of 30 mg/L,
primarily from agricultural sources [Environment Canada, 2001].
Whereas most provinces have N guidelines for manure application to soil, Quebec has a P
guideline for manure application to soil so as to protect surface water quality from P loadings
due to P-saturated soil [Environment Canada, 2001].
The only province to provide data for the concentration of phosphorous for the report and
database published by Agriculture and Agri-Food Canada was Quebec [Lefebvre et al., 2005;
AAFC, 2003]. The risk of phosphorous contamination is limited to runoff or erosion and is
areas [USDA, 1997].
fairly constant at 18%. The reduction in overall risk of phosphorous contamination was
interpreted as due to the increase of approximately 144% in the amount of assessed agricultural
area planted with corn (a high P-demanding crop); this crop demand more than compensated for
an increase of 9% in the total amount of P available from manure due to increases in poultry and
swine production [Lefebvre et al., 2005].
8.3.2. Extent of P Contamination in the United States
In the 1980’s, the largest anthropogenic sources of P to the environment were fertilizer
application (1.8 million metric tons), manure application (1.8 million metric tons), other non-
point sources (1.1 million metric tons), and wastewater-treatment plant discharges (260,000
metric tons) [Litke, 1999]. The estimated production of P from confined livestock per county (in
1998) is presented in Map A26. While the recent decline in point source loadings of P is having a
detectable effect on water quality, only a small proportion of stream sites have a large enough
Even with these reductions in phosphorous in surface waters, manure produced from CFOs
remains a significant potential P source as CFOs tend to lack sufficient cropland on which
manure can be spread without exceeding potential crop nutrient uptake [Gollehon et al., 2001].
Phosphorous from land applied manure is the greatest threat to water quality degradation in parts
of the Appalachian, Delta, Southeast and Pacific States [USDA, 2003]. Watersheds potentially
vulnerable to P in manure are more widespread, and are located in parts of the Northeast, Lake
States, Corn Belt, Southern Plains, and Northern Plains.
110
point-source component for water quality improvements to be appreciable [Litke, 1999; USDA,
2003].
USGS analysis of nutrients in surface waters over the 1980’s indicated different trends for NO3
and P in surface water. P concentrations in water during the 1970’s and 1980’s underwent a
significant decline, likely due to improved treatment of municipal wastewater, decreased P
content of detergents, reduced P fertilizer use, and a reduction in soil erosion. The reduction in P
in surface waters in areas with significant cropland areas was more than twice that in more urban
8.5. Pharmaceuticals
8.4. Salts
The majority of studies on the fate of manure-derived salts focus on the accumulations of salts
(especially K) within the soils. This accumulation of salts in the soil can reduce the productivity
of farmland. Significantly less attention has been paid to the contamination of groundwater by
salts.
Research conducted on the transportation of salts within the soil profile and into the groundwater
concurs with the results presented in Olson et al. [2003]; Ca, Mg, and K from manure application
accumulate in the soil, and most notably K accumulates near the surface (little movement below
1.5 m) and is a large concern for soil salinity [Pratt et al., 1977; Amoozegar-Fard et al., 1980].
Na and Cl move quickly through the soil profile to groundwater under irrigation [Kimble et al.,
1972; Pratt et al., 1977]. Harter et al. [2002] found significant increases in the salinity of a
shallow unconfined aquifer under irrigated forage crops that received treatments of dairy manure
The use of pharmaceuticals in livestock is widespread throughout North America, and large
quantities pass through the digestive process and are present in the resulting manure.
Approximately 88% of US swine producers use antibiotics in therapeutic and prophylactic
capacities and an estimated >75% is excreted through urine and manure [Elmund et al., 1971]. A
per animal estrogen excretion rate of 3-6 mg/d for dairy cattle was recently estimated from a
Tennessee study. This rate is equivalent to a release rate that is an order of magnitude greater
than human waste facilities, when averaged across the total US dairy cattle population [Raman et
al., 2004].
111
relative to groundwater upstream of the dairy farm under untreated land. Pratt [1984] concludes
significant amounts of salts can pass through soil to groundwater under irrigated conditions and
heavy applications of manure, and that K presents a greater threat to agriculture production than
Na in groundwater (used for irrigation).
To the best of our knowledge, limited research has been conducted regarding the transportation
of salts into and within groundwater; and the literature available is insufficient to allow for the
determination of the extent or severity of contamination in any North American jurisdiction.
fractures and coarser materials [Crowe et al., 2002].
To the best of our knowledge, limited research has been conducted regarding the transportation
of pharmaceuticals into and within groundwater; and the literature available is insufficient to
allow for the determination of the extent or severity of contamination in any North American
jurisdiction.
8.6. Pathogens
In general, few studies have been conducted regarding the transportation and survival of
pathogens to and within groundwater. Laboratory studies have provided a wealth of knowledge
as to the survivability of all pathogens in varying temperatures, pH, UV exposure, and other
stressors [Amrani et al., 2004], though the application of these to field models and testing has
been very limited [Crowe et al., 2002].
The research done on pathogens from livestock manure has focused on bacteria; protozoa and
Survival of bacteria is higher in finer-grained materials (high clay content); clays afford higher
moisture content, required nutrients and other environmental factors that extend the life of
bacteria [Tate, 1978; Howell et al., 1996].
Transportation of bacteria through macropores and fractures is the dominant means of
transportation. As coarser-grained soils (sandy soils) are not as likely as clayey soils to develop
macropores or to weather and fracture, they are less likely to allow for the transport of bacteria
[Conboy and Goss, 2000].
112
viruses have received less attention though they are more apt to survive in soils. The available
research suggests the distance pathogens can be transported is strongly related to the speed of
water flow, and therefore permeability, grain-size and the prevalence of fractures within the soil
materials are strongly influential [Crowe et al., 2002]. The velocity of water increases
exponentially within the vicinity of a pumped well, and provides the mechanism by which
pathogens in the vicinity of wells are expedited to the well [Conboy and Goss, 2000; Crowe et
al., 2002]. Fine- to medium-grained soils feature very little movement of pathogens; in gravels
and fractured soils, movement can be measured in the 10s to 100s of meters [Crowe et al., 2002].
Bacteria and some protozoa are unable to fit in pore spaces of silts and clays and are restricted to
The extent of well contamination has been the subject of considerable research; most wells
become contaminated due to runoff entering via cracked casings or improper seals. The extent of
contamination due to the movement of pathogens into and through groundwater is unknown
[Conboy and Goss, 2000; Crowe et al., 2002].
8.7. References
Agriculture and Agri-Food Canada (AAFC), 1997, A Prairie-wide Perspective of Nonpoint
Lewis Publishers, Chelsea, Michigan. p. 153-174. Carmichael, V., Wei, M., and Ringham, L., 1995, Fraser Valley groundwater monitoring
program: final report. Victoria: B.C. Ministry of Health, B.C. Ministry of Environment, Lands and Parks, and B.C. Ministry of Agriculture, Food and Fisheries.
Chambers, P.A., Guy, M., Roberts, E.S., Charlton, M.N., Kent, C., Gagnon, C., Grove, C., and Foster, N., 2001, Nutrients and their Impact on the Canadian Environment., Agriculture and Agri-Food Canada (AAFC), Fisheries and Oceans Canada, Health Canada, and Natural Resources Canada. http://www.durable.gc.ca/group/nutrients/report/index_e.phtml
113
Agricultural Effects on Water Quality: A Review of Documented Evidence and Expert Opinion.
Agriculture and Agri-Food Canada (AAFC), 2003, The National Land and Water Information Service: Agri-Enviromental Indicators. Accessed January 13, 2008. http://nlwissnite1.agr.gc.ca/ind2001/index.phtml?lang=en-CA
Agriculture Canada, 1993, Ontario Farm Groundwater Quality Survey. ISBN 0- 662-20879-X. 162 pp.
Amoozegar-Fard, A., Warrick, A.W., and Fuller, W.H., 1980, Movement of salts from soils following heavy application of feedlot wastes: Journal of Environmental Quality 9(2): 269-273
Amrani, D.M., Okine, D.E., Schoenau, D.J., Olson, D.M., Feddes, D.J., Atia, D.A., Haugen-Kozyra, K., and Banham, F., 2004, Manure Research Findings and Technologies: From Science to Social Issues, Alberta Agriculture and Food.
Basso, B., and Ritchie, J.T., 2005, Impact of compost, manure and inorganic fertilizer on nitrate leaching and yield for a 6-year maize-alfalfa rotation in Michigan: Agriculture, Ecosystems & Environment, 108(4): 329-341.
Betcher, R.N., 1997, Rural groundwater quality surveys: southern and central Manitoba. In Proceedings of Rural Water Quality Symposium, 25–26 March 1997, Winnipeg, Manitoba.
Bingham, F.T., Davis S., and Shade, E., 1971, Water relations, salt balance, and nitrate leaching losses of a 960-acre country watershed: Soil Science 112: 410-417.
Briggins, D.R., and Moerman, D.E., 1995, Pesticides, nitrate-N and bacteria in farm wells of KingsCounty, Nova Scotia: Water Quality Research Journal of Canada 30:429–442.
Buth, J.L., Rohde, H., and Butler, R., 1992, Groundwater quality assessment of the Assiniboine Delta Aquifer. Carman, Manitoba: Manitoba Agriculture.
Canter, L.W., 1987, Nitrates and pesticides in ground water: An analysis of a computer- based literature search. In D.M. Fairchild (ed.). Groundwater Quality and Agricultural Practices.
Canada's Environment. Accessed: ree/English/SOER/nutrients.cfm
Chambers, P.A., Dupont, J., Schaefer, K.A., and Bielak, A.T. 2002. Effects of Agricultural Activities on Water Quality, Canadian Council of Ministers of the Environment (CCME), Winnipeg, Manitoba.
Chang, C., and Entz, T., 1996, Nitrate leaching losses under repeated cattle feedlot manure applications in Southern Alberta: Journal of Environmental Quality 25(1): 145-153.
Chang, C., and Janzen, H.H., 1996, Long-term fate of nitrogen from annual feedlot manure applications: Journal of Environmental Quality 25(4): 785-790.
Chang, C., Whalen, J.K., and Hao, X., 2005, Increase in phosphorus concentration of a clay loam surface soil receiving repeated annual feedlot cattle manure applications in southern Alberta: Canadian Journal of Soil Science 85: 589-597.
Chartrand, J., Levallois, P., Gauvin, D., Gingras, S., Rouffignat, J., and Gagnon, M.-F., 1999, La contamination de l’eau potable par les nitrates à l’Île d’Orléans: Vecteur Environnement 32:37–46.
Conboy, M.J., and Goss, M.J., 2000, Natural protection of groundwater against bacteria of fecal origin: Journal of Contaminant Hydrology 43(1): 1-24.
Crowe, A., Schaefer, K.A., Kohut, A., Shikaze, S., and Ptacek, C., 2002, Linking Water Science to Policy: Groundwater Quality. In Canadian Council of Ministers of the Environment: Linking
pp. Environment Canada, 2001, Nutrients in the Canadian Environment: Reporting on the State of
January 26, 2008 http://www.ec.gc.ca/soer-
Fitzgerald, D.A., Kiely, D.A., Neilson, R.D., Shaw, S., Audette, R.J., Prior, M., Ashton, E., and Allison, E., 1997, Alberta farmstead water quality survey. Lethbridge, Alberta: Canada– Alberta Environmentally Sustainable Agriculture Agreement.
Gaudreau, D., and Mercier, M., 1997, La contamination de l’eau des puits privés par les nitrates en milieu rural. Direction de la Santé Publique de la Montérégie.
Giroux, I., 1995, Contamination de l’eau souterraine par les pesticides et les nitrates dans les régions de culture de pommes de terre, Campagnes d’échantillonnage 1991–1992–1993. Québec: Ministère de l’Environnement et de la Faune.
114
Water Science to Policy: Groundwater Quality. p. 52. Ecobichon, D.J., Hicks, R., Allen, M.C., and Albert, R., 1996, Ground water contamination in
rural New Brunswick. In Agriculture and Groundwater Quality Workshop, April 1996, Grand Falls,New Brunswick. Agricultural Advisory Committee on the Environment.
Eghball, B., Binford, G.D., and Baltensperger, D.D., 1996, Phosphorus movement and adsorption in a soil receiving long-term manure and fertilizer application: Journal of Environmental Quality 25(6): 1339-1343.
Elmund, G. K., Morrison, S. M., Grant, D. W., and Nevins, M. P., 1971, Role of Excreted Chlortetracycline in Modifying Decomposition Process in Feedlot Waste: Bulletin of Environmental Contamination and Toxicology, v. 6, p. 129-&.
Environment Canada, 1990, Off-Farm Sediment Impacts in the Saskatchewan River Basin. M.A. Carson & Associates, Victoria B.C., for Inland Waters Directorate, Saskatchewan District. 87
8(2): 211-215.
Gollehon, N., Caswell, M., Ribaudo, M., Kellogg, R., Lander, C., and Letson, D., 2001, Confined Animal Production and Manure Nutrients, United States Department of Agriculture (USDA): Economic Research Service.
Gormly, J.R., and Spalding, R.F., 1979, Sources and concentrations of nitratenitrogen in ground water of the Central Platte Region, NB: Ground Water 17(3), 291-301.
Goss, M.J., Barry, D.A.J., and Rudolph, D.L., 1998, Contamination in Ontario farmstead domestic wells and its association with agriculture: 1. Results from drinking water wells: Journal of Contaminant Hydrology 32:267-293.
Hao, X., Chang, C., and Li, X., 2004, Long-term and residual effects of cattle manure application
Kimble, J.M., Bartlett, R.J., McIntosh, J.L., and Varney, K.E., 1972, Fate of Nitrate from Manure and Inorganic Nitrogen in a Clay Soil Cropped to Continuous Corn: Journal of Environmental Quality 1(4): 413-415.
Kleinman, P.J.A., Needelman, B.A., Sharpley, A.N., and McDowell, R.W., 2003, Using soil phosphorus profile data to assess phosphorus leaching potential in manured soils: Soil Science Society of America Journal 67(1): 215-224.
Lefebvre, A., Eilers, W., and Chunn, B. (eds.), 2005, Environmental Sustainability of Canadian Agriculture: Agri-Environmental Indicator Report Series – Report #2. Agriculture and Agri-Food Canada, Ottawa, Ontario.
Liebhardt, W.C., Golt, C., and Tupin, J., 1979, Nitrate and Ammonium Concentrations of Ground Water Resulting from Poultry Manure Applications: Journal of Environmental Quality
on distribution of P in soil aggregates: Soil Science 169(10): 715-728. Harter, T., Davis, H., Mathews, M.C., and Meyer, R.D., 2002, Shallow groundwater quality on
dairy farms with irrigated forage crops: Journal of Contaminant Hydrology 55(3-4): 287-315. Henry, J.L. and Meneley, W.A., 1993, Fertilizers and groundwater nitrate. Surrey, B.C.: Western
Canada Fertilizer Association. Howell, J.M., Coyne, M.S., and Cornelius, P.L. 1996. Effect of sediment particle size and
temperature on fecal bacteria mortality rates and the fecal coliform/fecal streptococci ratio. 25, 25(6): 1216-1220.
Litke, D.W., 1999, Review of Phosphorus Control Measures in the United States and their Effects on Water Quality. Water-Resources Investigations Report 99-407, U.S. Geological Survey.
Madison, R.J., and Brunett, J.O., 1985, Overview of the occurrence of nitrate in ground water of the United States, in National Water Summary 1984; Hydrologic events, selected water-quality trends, and ground-water resources: U.S. Geological Survey Water-Supply Paper 2275, p. 93105.
Mathers, A.C., and Stewart, B.A., 1974, Corn Silage Yield and Soil chemical Properties as Affected by Cattle Feedlot Manure: Journal of Environmental Quality 3(3): 143-147.
Meek, B., Graham, L., and Donovan, T., 1982, Long-term effects of manure on soil nitrogen, phosphorus, potassium, sodium, organic matter, and water infiltration rate: Soil Science Society of America Journal 46(5): 1014-1019.
115
Environmental Science & Technology, v. 38, p. 3567-3573.
McNaughton, D.C., and Crowe, A.S., 1995, Investigation of pesticides in groundwater at three irrigated sites near Outlook, Saskatchewan: Water Quality Research Journal of Canada 30(3), 399-427.
Mitchell, P., 1992, Status Report on the Water Quality of Moose Lake. Environmental Quality Monitoring Branch, Alberta Environment, Edmonton.
Mitchell, P., and Hamilton, H.R., 1982, Assessment of Phosphorus Export From the Majeau Creek watershed Lac la Nonne. Water Quality Control Branch, Alberta Environment. Edmonton, AB.
Nolan, B.T., and Hitt, K.J., 2006, Vulnerability of Shallow Groundwater and Drinking-Water Wells to Nitrate in the United States: Environmental Science and Technology 40(24): 7834 7840.
Nolan, B.T., Hitt, K.J., and Ruddy, B.C., 2002, Probability of Nitrate Contamination of Recently Recharged Ground Waters in the Conterminous United States: Environmental Science & Technology 36(10): 2138-2145.
Nolan, B.T., Ruddy, B.C., Hitt, K.J., and Helsel, D.R., 1997, Risk of Nitrate in Groundwaters of the United States-A National Perspective: Environmental Science and Technology 31(8): 2229 -2238.
Raman, D. R., Williams, E. L., Layton, A. C., Burns, R. T., Easter, J. P., Daugherty, A. S., Mullen, M. D., and Sayler, G. S., 2004, Estrogen content of dairy and swine wastes:
Reynolds, W.D., Campbell, C.A., Chang, C., Cho, C.M., Ewanek, J.H., Kachanoski, R.G., MacLeod, J.A., Milburn, P.H., Simard, R.R., Webster, G.R.B., and Zebarth, B.J., 1995, Agrochemical entry into groundwater. In D.F. Acton and L.J. Gregorich (eds.). The Health of Our Soils, CLBRR, Research Branch, AAFC. p. 97-109.
Rodvang, S.J., Mikalson, D.M., and Ryan, C.R., 2004, Changes in Ground Water Quality in an Irrigated Area of Southern Alberta. Journal of Environmental Quality, 33: 476-487.
Sharpley, A.N., Smith, S.J., and Bain, W.R., 1993, Nitrogen and phosphorus fate from long-term poultry litter applications to Oklahoma soils: Soil Science Society of America Journal 57(4): 1131-1137.
Spalding, R.F., and Exner, M.E., 1993, Occurrence of nitrate in groundwater - a review: Journal of Environmental Quality 22(3): 392-402.
116
Olson, B. M., et al., 2003, Manure nutrient management to sustain groundwater quality near feedlots: CAESA Research Project RES-028-93.
Paradis, D., Bernier, P.J., and Levallois, P., 1991, Qualité de l’eau souterraine dans la MRC de Portneuf. Québec: Ministère de l’Environnement, Ministère de l’Agriculture, des Pêcheries et de l’Alimentation et Département de santé communautaire du Centre Hospitalier de l’Université Laval.
Paradis, D., 1997, Qualité de l’eau souterraine en zone de culture intensive de la pomme de terre dans la MRC de Portneuf. Québec: Ministère de l’Environnement et de la Faune.
Pratt, P.F., 1984, Salinity, Sodium, and Potassium in an Irrigated Soil Treated with Bovine Manure: Soil Science Society of America Journal 48: 823-828
Pratt, P.F., Davis, S., and Laag, A.E., 1977, Manure Management in an Irrigated Basin Relative to Salt Leachate to Ground Water: Journal of Enviromental Quality 6: 397-402
United States Department of Agriculture (USDA), 2003, Agricultural Resources and Environmental Indicators 2003, Agriculture Handbook No. (AH722) Accessed January 13 2008. http://www.ers.usda.gov/publications/arei/ah722/
United States Geological Survey (USGS), 1998, (USGS), U.S.G.S. 1998. A National Look at Nitrate Contamination of Ground Water. Accessed January 15 2008. http://water.usgs.gov/nawqa/nutrients/pubs/est_v36_no10/
Somers, G., 1998, Distribution and trends for the occurrence of nitrate in P.E.I. groundwaters. InProceedings of Workshop on Nitrate — Agricultural Sources and Fate in the Environment — Perspectives and Direction, Charlottetown, 26 February 1998.
Statistics Canada, 2001, A Geographical Profile of Manure Production in Canada, Accessed December 14, 2007. http://www.statcan.ca/english/freepub/16F0025XIB/16F0025XIB2000001.htm
Tate, R.L., 1978, Cultural and environmental factors affecting the longevity of Escherichia coli in histosols. Applied and Environmental Microbiology, 35: 935-929.
United States Department of Agriculture (USDA), 1997, Agricultural Resources and Environmental Indicators, 1996-97, Agriculture Handbook No. (AH712) Accessed January 13 2008. http://www.ers.usda.gov/publications/arei/ah712/
VanLeeuwen, J.A., 1998, Human and animal health implications of elevated nitrate intake. In Proceedings of Workshop on Nitrate — Agricultural Sources and Fate in the Environment — Perspectives and Direction, Charlottetown, 26 February 1998.
Vogelsang, G.F., and Kent, D.B., 1997, Shallow groundwater survey summary report. Report prepared by Clifton Associates Ltd. for Saskatchewan Environment and Resource Management, Regina.
Whalen, J.K., and Chang, C., 2001, Phosphorus accumulation in cultivated soils from long-term annual applications of cattle feedlot manure: Journal of Environmental Quality 30: 229-237.
117
The animal population is generally increasing in feedlots across Canada, although the distribution of animals is not uniform across the country.
The size of Canadian beef cattle operations is also increasing, with the most significant growth occurring in Alberta.
9. SUMMARY AND IMPLICATIONS
9.1. Introduction 1. Land application of manure is an environmental concern because this practice has the
potential to contribute pollutants to the groundwater environment.
2. The primary groundwater pollutants associated with animal wastes are nitrogen (N) compounds, specifically nitrate (NO3).
3. The MAC for NO3 in drinking water is 45 mg/L (or 10 mg/L nitrate-nitrogen (NO3-N)).
6. Many variables define the risk posed by land application of manure in Alberta. These include climate, topography, geology, manure application technology, chemistry of manure and receiving soils, timing of application, and crop uptake potential. The applicable regulatory program in Alberta, intended to manage the land application process, can also be considered a variable because regulations exert a control on land application.
7. The scope of work for this report included a review of relevant regulations, guidance, and technical literature relating to the impacts of manure application on groundwater resources. The scope does not address groundwater pollution from manure storage and collection facilities as this topic was addressed in an earlier report.
9.2. Distribution of Livestock Operations in Alberta
Recommendations for NO3 in drinking water for mature livestock are commonly <100 mg/L, and recommendations for young animals are similar to those for infants.
4. Similar to N, phosphorus (P) is a major nutrient in manure. Although P is not included in the drinking water guidelines, it is defined as a chronic nutrient in surface waters in Alberta when present in concentrations (as P) greater than 0.05 mg/L and may be a threat to surface waters at concentrations exceeding 100 parts per billion (μg/L).
5. Additional pollutants associated with animal wastes with the potential to affect groundwater include salts, organics, antibiotics, pathogens, pesticides, and hormones.
8.
9.
10. Alberta hosts approximately half of the national beef cattle herd, and close to one-third of the beef farms.
11. In Alberta, manure from commercial feedlots is generally disposed of by land application.
12. Most of the land application of manure is conducted very close to where it is produced. As such, the areas of concentrated confined feeding operations (CFOs) in Alberta (i.e., around Lethbridge, between Calgary and Edmonton, and north of Edmonton) should define the areas of greatest risk for groundwater pollution.
118
13. The lack of land close to the CFOs for disposal of manure suggests the potential exists for the addition of excessive manure on the available land base. Further, the increasing growth of the beef cattle industry in Alberta suggests the potential for the addition of excessive manure on the proximal land base could increase and, as a result, the risk to groundwater pollution would also increase.
9.3. The Alberta Regulatory Program 14. When compared to other jurisdictions, the Alberta regulatory program is neither the most
stringent nor the most lenient. Alberta (and most other jurisdictions) requires agency authorization for land application of manure and the preparation of a comprehensive plan for management of nutrients from animal wastes.
15. Alberta bases its land-application rates for manure on the mass of N present in the soil.
17. The approach used to regulate manure application to soil surfaces used by Alberta (i.e., mass of N present in the soil profile) is not universally applied. Some jurisdictions base application rates on the mass of P (e.g., Idaho) or P + N (e.g., Manitoba) in the soil profiles. Other jurisdictions base their application rates on the N required for plant uptake (e.g., North Dakota) or on the P required for plant uptake (e.g., Ontario).
18. In Alberta, soil sampling in the land application area is required to determine how much N can be added to the soil. These requirements are more detailed than other jurisdictions (e.g., Saskatchewan, North Dakota).
19. Alberta stipulates setback requirements that include protection of groundwater as well as surface water.
20. Alberta does not require that the preparer of the comprehensive nutrient management plan have recognized qualifications.
16. The Alberta regulations establish NO3-N levels in the top 60 cm of the soil profile depending on the type of soil. The maximum recommended rates for cattle feedlot manure application in Alberta as set out in the literature are 30 and 60 Mg/ha (wet wt.) on non-irrigated and irrigated land, respectively. Other jurisdictions reviewed either assess both N and P or generally require application based on “agrinomic rates”.
21. While Alberta’s requirements for application procedures are not as detailed as in other jurisdictions (e.g., Ontario) and the procedures for applying to frozen land are not as prescriptive as in other jurisdictions (e.g., Quebec), the Alberta regulations have more specific limits relating to slope of the irrigated area.
22. Alberta does not require sampling of animal waste prior to application. Two Canadian provinces (Ontario, Québec) and five American states (Colorado, Kansas, Michigan, Nebraska, South Dakota) require some sampling prior to application to determine the nutrient concentration of the manure.
23. The Alberta regulations provide that an operator must demonstrate access to sufficient land necessary to meet the application rates.
119

wastewater prior to land application, limited data exist on the chemical characteristics of
9.4. Controls on Groundwater Pollution of N and P Derived from Land Application of Manure
24. Organic N, present in high concentrations in manure, is transformed to inorganic N (largely in the forms of NO3 and NH4) through chemical and biological processes.
25. NO3 can be readily leached through the soil and into the groundwater, and as such is a major potential groundwater contaminant.
26. In contrast to NO3, NH4 readily adsorbs to clays and organic matter. As a result, as much as 50% of inorganic N in subsurface horizons can be fixed within interlayer portions of clays. Thus, NH4 concentrations are usually limited to near the surface environment.
27. Nitrification (production of NO3 from NH4) should occur in most soils. Under oxic conditions, the NO3 should be stable and can migrate great distances.
28. Under anoxic conditions, denitrification (attenuation of NO3) should occur. In most groundwaters, denitrification occurs when the oxygen concentrations are low to anoxic. In fine-textured, vadose zones, under wet conditions, denitrification should occur.
29. Groundwater in an aquifer can evolve from oxic to anoxic as it migrates along its flow path. Thus, NO3 could be conservative near its point of entry into the groundwater system
manure and wastewater applied to land surface. As such, nutrient availability in manure is not exactly known. This represents a limitation to nutrient management planning.
33. Available data show considerable variability in the source chemistry of manure, due to factors including operational practices, feed type, animal density, animal age and type, bedding material and local climatic conditions. In general, poultry manure contains higher concentrations of Total-P than either cattle or swine manure. Total-N concentrations in manure are typically found in the order poultry > swine ≥ cattle.
34. Given the variable concentration of pollutants in manure, compliance with the Alberta regulatory application rates could result in over-application of nitrogen relative to crop requirements, which poses a potential risk to environmental quality.
120
and be attenuated further along the flow path.
30. Groundwaters in weathered clay-rich tills can be either oxic or anoxic, with conditions stable with time in enclaves or transient at a location, whereas groundwaters in unoxidized till zones are anoxic. Limited data suggest the interface between oxidized and unoxidized till zones is sharp.
31. In many cases, the movement of P through the soil profile and into the groundwater can be negligible. P is removed from the aqueous phase by adsorption on geologic media or precipitation by minerals. In the case of adsorption, soils with high clay content have the highest P sorption capacity while sandy soils have the lowest P sorption capacity.
9.5. Timing of Manure Applications and Rates of Application 32. Because Alberta does not require sampling and nutrient analyses of manure and
43. The most common surficial deposits in Alberta are clay-rich tills and lacustrine (aquitards) in which open fractures extend downward from near ground surface.
35. Raw manure should be considered a potential source of pathogens. However, the persistence of pathogens and pharmaceuticals in manure and wastewater does not appear to be well understood.
36. Bacterial pathogens die off naturally during extended storage or after field application; complete die-off of bacterial pathogens occurs in days to months depending on the pathogen and environmental conditions. However, helminths from swine manure can persist in soil for years.
37. In Alberta, regulations suggest manure be spread at the proper rate over the field and be incorporated into the soil within 48 hours of being applied to cultivated land (except
weather, risk of soil compaction, and time required for other activities.
40. The Alberta regulations establish nitrate-nitrogen levels in the top 60 cm of the soil profile depending on the type of soil. The maximum recommended rates of cattle feedlot manure in Alberta are 30 and 60 Mg/ha (wet wt.) on non-irrigated and irrigated land, respectively [Alberta Agriculture, 1980].
9.6. Overview of the Natural Controls on Pollutants Derived from Manure 41. An annual water deficit and the presence of the lime layer in soils in Alberta suggest a
lack of long-term downward migration of water and pollutants through the soils.
42. In Alberta, shallow sandy aquifers are the most susceptible to NO3 pollution. These coarse-grained soils allow for lateral movement of N and facilitate pollution of the
when applied to forages or direct-seeded crops, frozen or snow-covered land or unless an operation has a permit that specifies a different incorporation requirement). A variety of manure application techniques are available.
38. Alberta does not specify a particular time period within which application must occur although the regulations set some controls on the application of waste to frozen lands.
39. In general, spring application is considered the most desirable for Alberta conditions. However, few opportunities for application may exist in the spring due to inclement
regional groundwater.
44. In the case of geologic media with fractures extending from near ground surface to an underlying aquifer, large volumes of surface runoff (and soluble contaminants) can be focused in depressions. This water (and associated contaminants) can rapidly migrate downward, though fractures, to the aquifer and then off site.
45. In cases where fractures do not extend deep enough into the subsurface to intersect the aquifer surface, runoff can also focus large volumes of water (and contaminants) into the depressions, but this water (and contaminants) will be contained in the near surface, fractured zone.
121
46. Experience suggests fracturing in Alberta extends deeper into the aquitard media, thus implying the potential for more rapid migration of pollutants to greater depths and into underlying aquifers. However, based on our current, but limited, understanding of the characteristics of the fractures in these aquitards, the rapid migration of pollutants via transport along fractures in these clay-rich aquitards may not be a concern.
9.7. Behaviour of Manure-Derived Pollutants in the Alberta Environment 47. Nitrate contamination is common throughout the province of Alberta, especially in
agricultural areas. Nitrate contamination in groundwater decreases with increased depth below ground surface. In Alberta, shallow sandy aquifer are the most susceptible to NO3 contamination.
48. Determining the sources of NO
50. For most Alberta soils, consistent annual manure applications in excess of crop requirements leads to the accumulation of N within the soil profile. N accumulating below the root zone of crops will either move further down in the soil profile or undergo denitrification.
51. Without irrigation, the migration of N through the soil profile is slowed, and denitrification can become negligible; this causes N to build up in the soil leading, in the long-term, to groundwater pollution fed by a large reservoir of accumulated NO3.
52. With irrigation, the N moves significantly faster towards the groundwater, concurrent with large gaseous losses of N due to volatilization. Coarse-grained soils provide conditions in which N from manure spread at high rates can reach shallow groundwater
3 in groundwaters in parts of southern Alberta is complicated by the presence of naturally occurring NO3, which can be present in concentrations exceeding limits for safe human consumption.
49. Research projects conducted in Alberta represent some of the most detailed and extensive studies into the long-term impact of surface-applied manure on soils and groundwaters. Scientific literature from other jurisdictions in North America support the findings of research conducted in Alberta.
within a year of spreading.
53. The extent of accumulated N in Alberta soils due to agriculture is increasing, and consequently so is the risk of groundwater pollution. This risk of groundwater NO3 pollution in Alberta in a regional context (local areas are more affected by local best management practices and intensity of livestock production) is significantly lower than other agricultural areas in Canada, even with the relatively high intensity of livestock production. This lower risk is due to the texture and permeability of Alberta’s soils, and the dry climate, especially the high annual moisture deficit in southern Alberta.
54. Reducing the risk of excessive N build-up in the soil or pollution of groundwater may be accomplished by reducing the recommended manure application rates of 30 and 60 Mg/ha for non-irrigated and irrigated fields, respectively, to crop requirements or limits suggested by research studies (long-term application rate <25 Mg/ha).
122
findings from Alberta. NO3
55. P pollution of groundwater and surface waters due to discharge of contaminated groundwater has not been researched extensively; most studies have focused on the transportation of P to surface waters by erosion and runoff as these pathways are the most significant.
56. When manure is spread to meet the N requirements of the crops, P quickly builds up in the soil. This P can potentially contaminate groundwater provided long-term heavy application of manure on irrigated sites has occurred; however, the studies cited did not directly measure increases of P concentrations in groundwater due to manure spreading.
57. Coarse-grained soils can expedite the movement of P to the groundwater, because they
the impact of
60. Cattle manure contains high concentrations of soluble salts. These salts can impact crop productivity.
61. Long-term studies show land application of manure under current application rates is not sustainable over the long term.
62. The potential exists in Alberta for increased groundwater pollution under existing application rates. Further increases in groundwater contamination pollution will continue if excess land application of manure takes place, a risk that increases with the growth in the number and size of livestock operations.
9.8. Behaviour of Manure-Derived Pollutants elsewhere in North America 63. Scientific literature from other jurisdictions in North America supports the research
are more permeable to leaching and P does not readily sorb to aquifer media.
58. If land application rates were based on P rather than N concentrations of manure, a much larger land area would be required for manure disposal when compared to the nitrogen-based approach currently used. This is because the N to P ratio in manure is different than the ratio required by the crop. This has special significance to producers operating on a limited land base.
59. No literature exists on contamination from manure-derived salts, pharmaceuticals and pathogens.
pollution of groundwater is common throughout North America, especially in agricultural areas. N from livestock manure is the largest contributor to NO3 contamination in North America including Alberta.
64. The extent of accumulated N in Canada’s soils due to agriculture is increasing, and consequently so is the risk of groundwater contamination. The risk of groundwater NO3 contamination in Alberta is significantly lower than in other agricultural areas in Canada, even considering the relatively high intensity of livestock production.
65. NH4 from manure does not directly contaminate groundwater as it is relatively immobile; NH4 can undergo nitrification to the more mobile NO3 which can be transported to and contaminate groundwater. Rates of NO3 in groundwater are proportional to the rates of manure spreading.
123
66. Shallow sandy aquifers are the most susceptible to NO3 contamination, as NO3 can move through sandy soils to shallow groundwater within a few years of application. These shallow aquifers also provide sources of irrigation to further promote NO3 transportation to groundwater. These coarse-grained sediments allow for lateral movement of NO3 and facilitate the contamination of regional groundwater, provided movement of groundwater is occurring.
67. Consistent annual manure applications in excess of crop requirements can result in the accumulation of N within the soil profile, and increase the risk of future contamination of groundwater.
68. The risk of N contamination of groundwater is influences by soil characteristics.
69. N accumulating below the root zone of crops will either move further deeper in the soil profile or undergo denitrification. The rate of denitrification is limited and decreases with increasing depth in the soil zone due to the reduced availability of energy sources for microbes.
70. Research findings show the risk of excessive N build-up in the soil or contamination of groundwater may be reduced by reducing manure application rates.
P accumulation). Na and Cl move quickly through the soil profile into groundwater, especially under irrigated conditions. No literature was found on the impact or extent of groundwater contamination from manure-derived Na or Cl.
75. The use of pharmaceutical in livestock is common, and the manure from these animals has high concentrations of residual pharmaceuticals. No literature was found on the impact or extent of groundwater contamination from manure-derived pharmaceuticals.
76. Research on the survival and transportation of pathogens (bacteria, viruses and protozoa) to and within groundwater is limited. The extent of contamination of wells by bacteria is well documented and researched and implicates well construction and age as opposed to rates of manure (pathogen) application to the soils. No literature was found on the impact or extent of groundwater contamination from manure-derived pathogens.
124
71. P contamination of groundwater has not been researched extensively; most studies have focused on the transportation of P to surface waters by erosion and runoff as these pathways are the most significant.
72. Over the long term, P could contaminate groundwater if long-term heavy application of manure occurs on irrigated sites. However, most studies did not measure increases in P concentrations in groundwater due to manure spreading.
73. Coarse-grained soils can expedite the movement of P to the groundwater as they do not adsorb significant amounts of P and are more permeable to leaching. The movement of P from fields to groundwater can occur within coarse-grained soils though not in the same magnitude as P transported to surface waters by erosion and runoff.
74. Literature on manure-derived salts is focused on salinity of soils and their detrimental effects on crops. K, Mg and Ca are limited to the upper layers of the soil profile, and pose little risk to groundwater until accumulation exceeds sorption capacities of soil (similar to
10. RECOMMENDATIONS
Based on the material presented in previous Chapters, additional research specific to conditions
in Alberta is suggested. Detail on some key areas that require research is presented below.
10.1. Regulating Land-Based Application Rates of Manure to Minimize Groundwater Pollution
Alberta regulates manure application rates based on the mass of N present in the soil. Research
shows land application of manure under current application rates is not sustainable over the long
term. Annual manure application rates as described in the current AOPA regulations, but in
excess of crop requirements, leads to the accumulation of N in the soil profile and potential
groundwater pollution. Furthermore, when manure is spread to meet N requirements of crops, P
quickly builds up in the soil. This P can also potentially pollute the groundwater, although only
under certain conditions. Similarly, although Alberta identifies salt loading limits in the
requirements.
Recommendation 1 is that a workshop be organized to review our current understanding of the
impact of manure loading on soils and groundwaters. The workshop could consider options for
research to determine the best (in terms of soil loading and groundwater pollution) method to
regulate manure application rates. The meeting should include stakeholders (e.g., operators,
Alberta Environment, Alberta Agriculture Food and Rural Development, and NRCB). Data
presented in the current report could provide the background for such a meeting. Questions that
should be discussed include:
125
regulations, salts present in manure can build up in the soil. Research suggests using P as the
control instead of N will provide a more conservative and predictable method of control. Other
jurisdictions have switched (e.g., Iowa) from using N as the primary target because of this risk of
over-application when P is not considered.
The risk of excessive N build-up in the soil and pollution of groundwater may be minimized by
reducing recommended manure application rates to better represent N crop requirements.
Similarly, the risk of excessive P build-up in the soil and potential pollution of groundwater may
be minimized by reducing the recommended manure application rates to better represent P crop
When used
(1) Should manure application rates be based on N requirements of crops, rather than residual N in the soil and if so, how will those rates be calculated;
(2) Should manure application rates be based on P requirements of crops, rather than N, and if so, how would those rates be calculated?; and
(3) Should any other controls be considered?
This discussion should consider the risk of over-application under the current N-based system.
10.2. Monitoring of Nutrients in Manure and Groundwater
Alberta does not require sampling and analyses of manure and wastewater for nutrients prior to
land application. Thus, nutrient availability in manure on a case-by-case basis is not known. This
limits the ability to develop nutrient management plans. Recommendation 2 is that a nutrient
monitoring program for land applied manure be established.
Land application of manure has a detrimental effect of the quality of shallow groundwaters.
However, the long-term effects of manure application on groundwater quality are not clear.
monitored. These wells would provide field-specific data on groundwater contamination from
manure application as well as province-wide data on the health of the groundwater under fields
receiving manure. in conjunction with available geologic, climatic,
precipitation/irrigation, and manure application rate (and nutrient chemistry; see above)
information, these data could also be used assess the impact(s) of manure application rates on the
groundwater quality regionally throughout the province. As is the case for long-term monitoring
wells, installing companion wells upgradient of the sentinel wells to provide data on background
conditions would be advantageous. Because of the importance of these wells, a qualified
hydrogeologist should supervise their installation.
126
Without long-term groundwater quality data, assessing the impact of changes in manure
application rates (see above) on groundwater quality will be difficult. As a result,
Recommendation 3 is that a network of research-grade wells be established by the government
to monitor long-term (10+ years) changes in groundwater quality under representative fields
receiving long-term manure application. To provide data on background conditions, wells should
also be located in areas where manure is not applied.
Recommendation 4 is that sentinel wells be installed by the operators in fields receiving
manure. The quality of the groundwater collected from these wells should be routinely
Contamination of soil and groundwater by pathogens and pharmaceuticals, including antibiotics
and growth hormones, is a poorly understood area of the scientific literature. Investigation of
these potential contaminants would be prudent given the lack of research currently being
conducted and the growing concern of the public with respect to the potential effects of these
compounds in the environment. Recommendation 5 is that a monitoring program be established
to assess the impact of these parameters on groundwaters. This could be addressed by analyzing
for the presence of selected parameters in the network of long-term research wells discussed
above.
10.3. Research Needs
Long-term research studies, reported in Chapter 7, have proven invaluable in assessing the
impacts of manure on soils and groundwaters near Lethbridge. Recommendation 6 is that
similar research studies be established in other high-impact regions of the province. Data from
irrigation, and during spring snowmelt (when manure is applied to frozen or snow covered land)
is not clear. Recommendation 7 is that research be conducted to determine the impact of these
conditions on the downward migration of manure to the groundwater regime and to assess what,
if any, of these conditions may be identified as a primary risk control for manure management.
127
these studies will allow the long-term impact of manure on soils and groundwaters to be assessed
as well as providing sound data to refine manure management strategies.
Fractured glacial tills and lacustrine deposits dominate the near-surface landscape of Alberta.
Understanding the hydrologic and hydrogeologic conditions controlling the downward migration
of water and pollutants derived from manure to the groundwater through these fractured media is
critical to developing manure application rates in these geologic media, but they are not well
understood. For example, the effects of the downward migration of pollutants from land-applied
manure via depression-focused recharge under periods of intense rainfall events, periods of
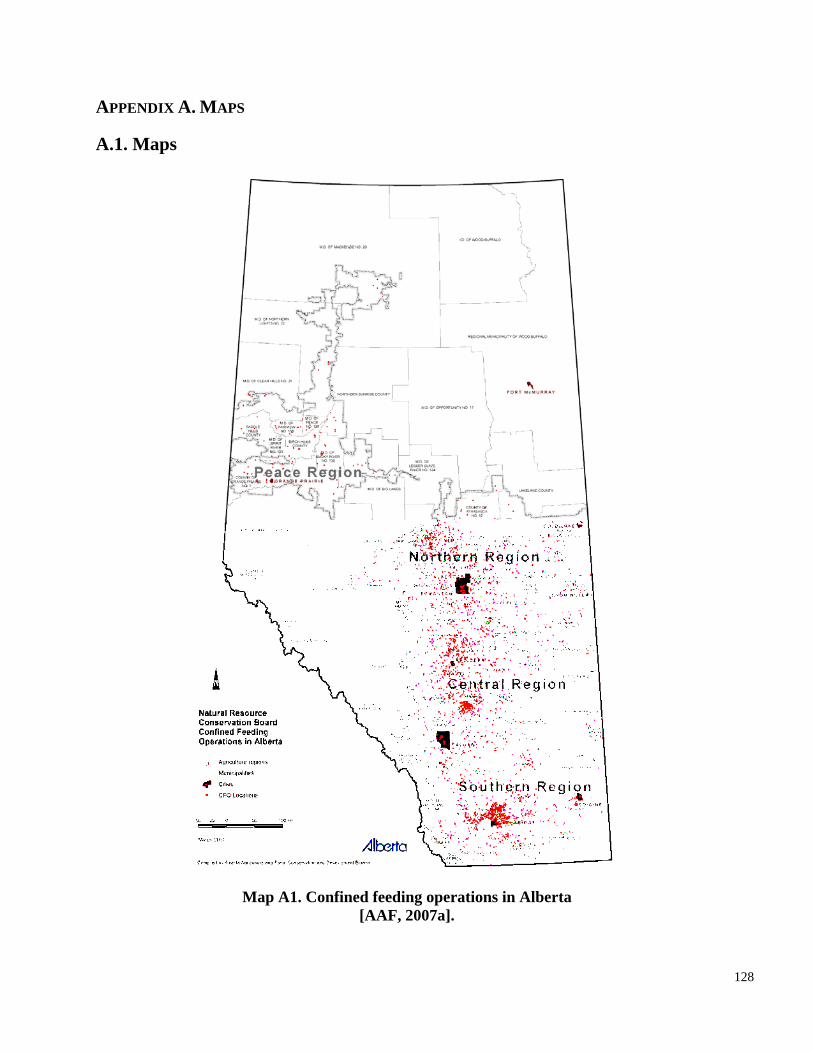
APPENDIX A. MAPS
A.1. Maps
Map A1. Confined feeding operations in Alberta [AAF, 2007a].
128
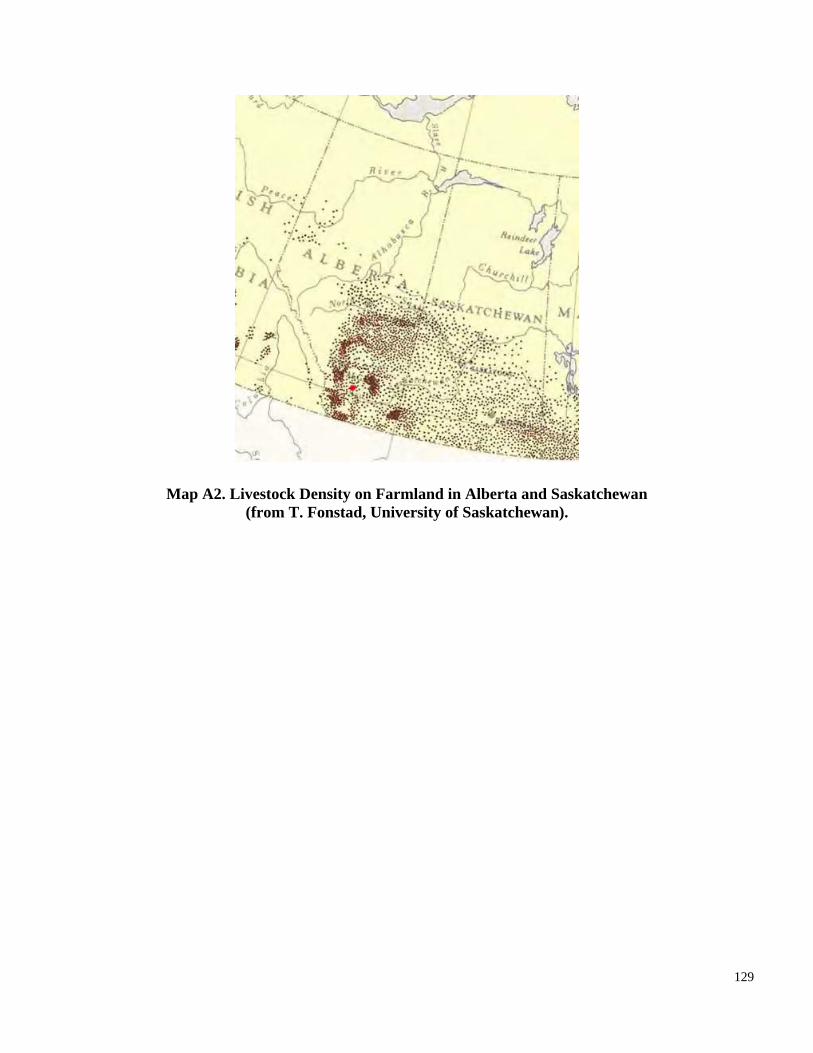
Map A2. Livestock Density on Farmland in Alberta and Saskatchewan (from T. Fonstad, University of Saskatchewan).
129
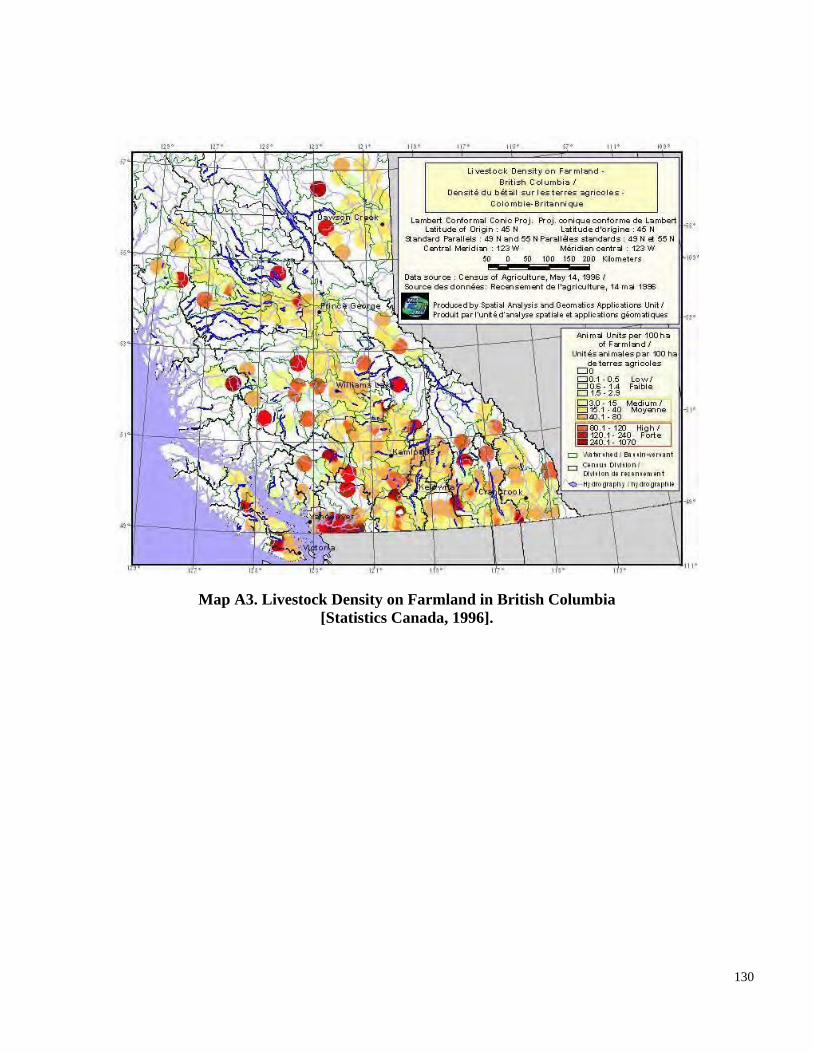
Map A3. Livestock Density on Farmland in British Columbia [Statistics Canada, 1996].
130
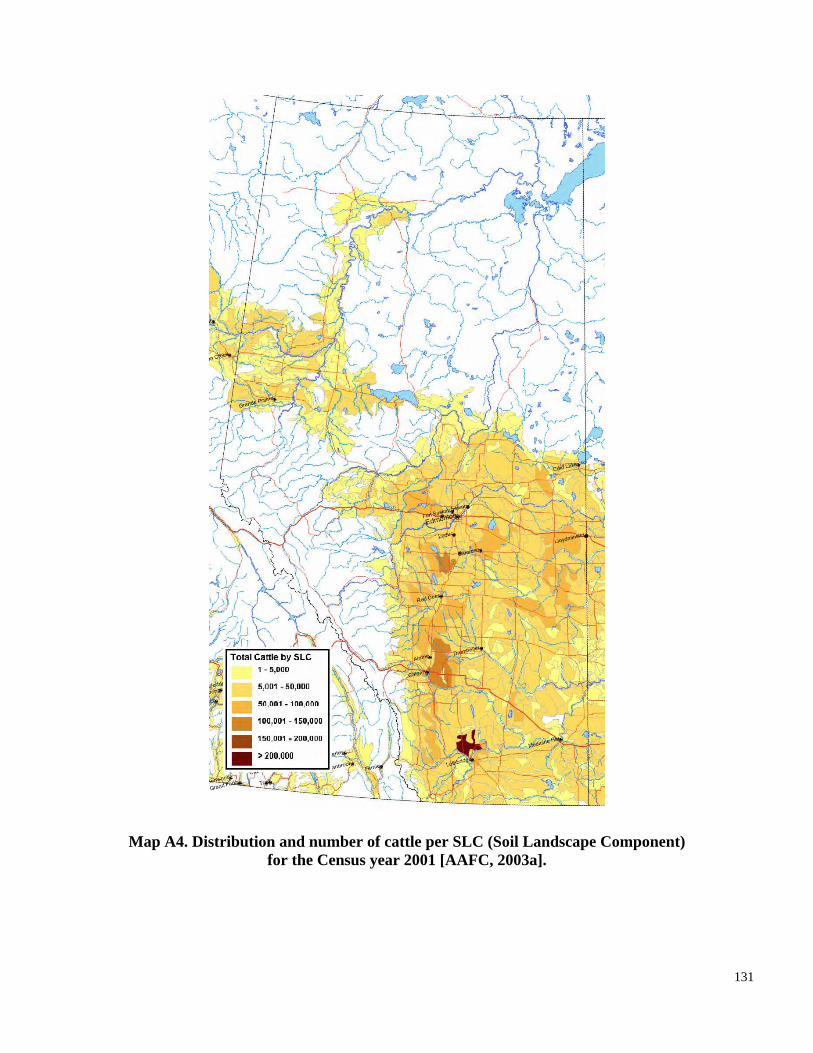
Map A4. Distribution and number of cattle per SLC (Soil Landscape Component) for the Census year 2001 [AAFC, 2003a].
131
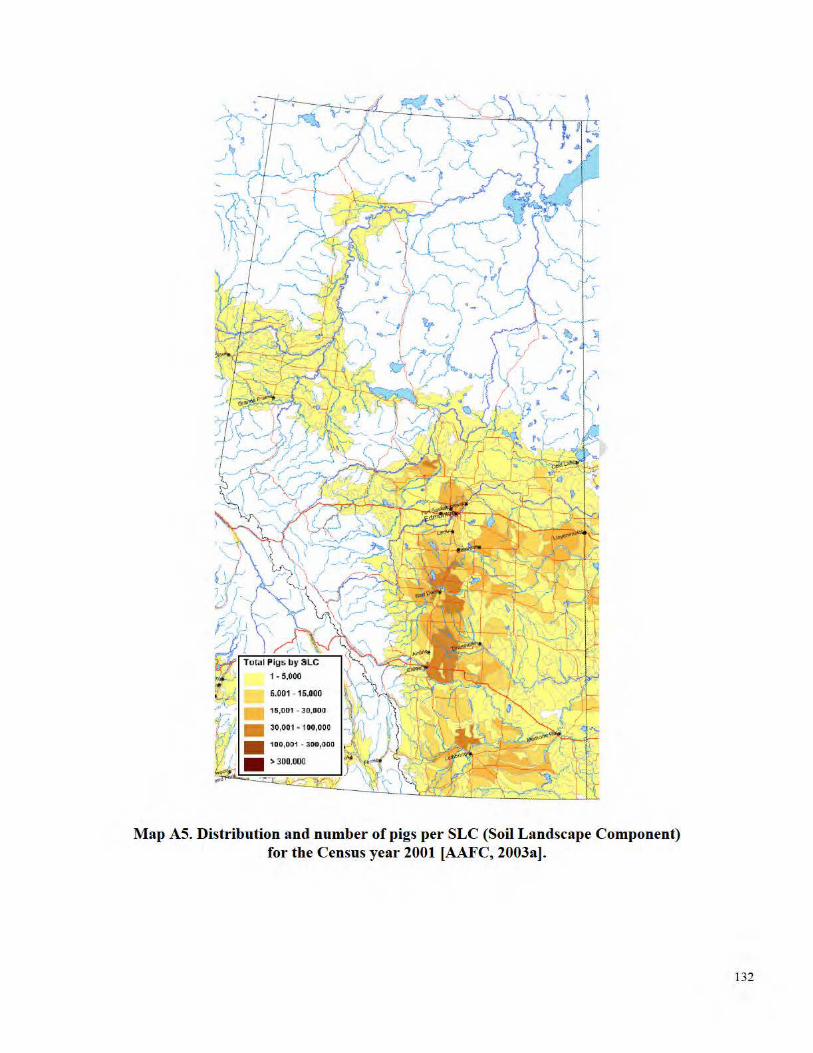
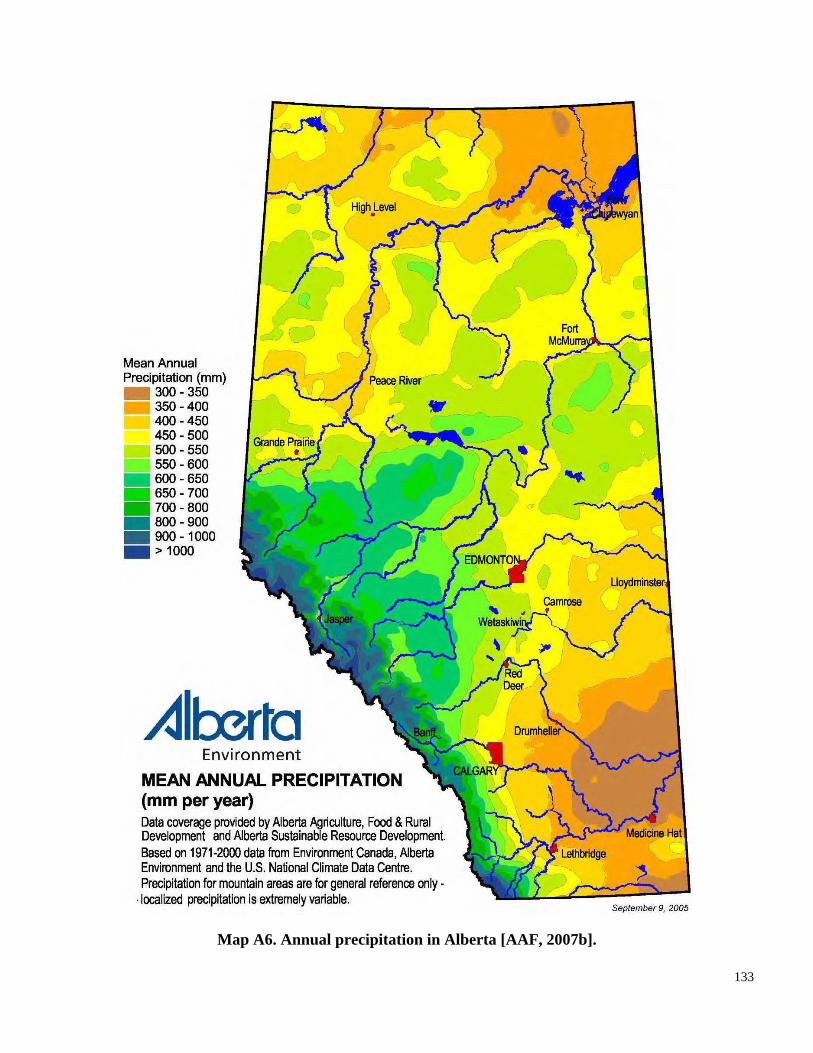
Map A6. Annual precipitation in Alberta [AAF, 2007b].
133
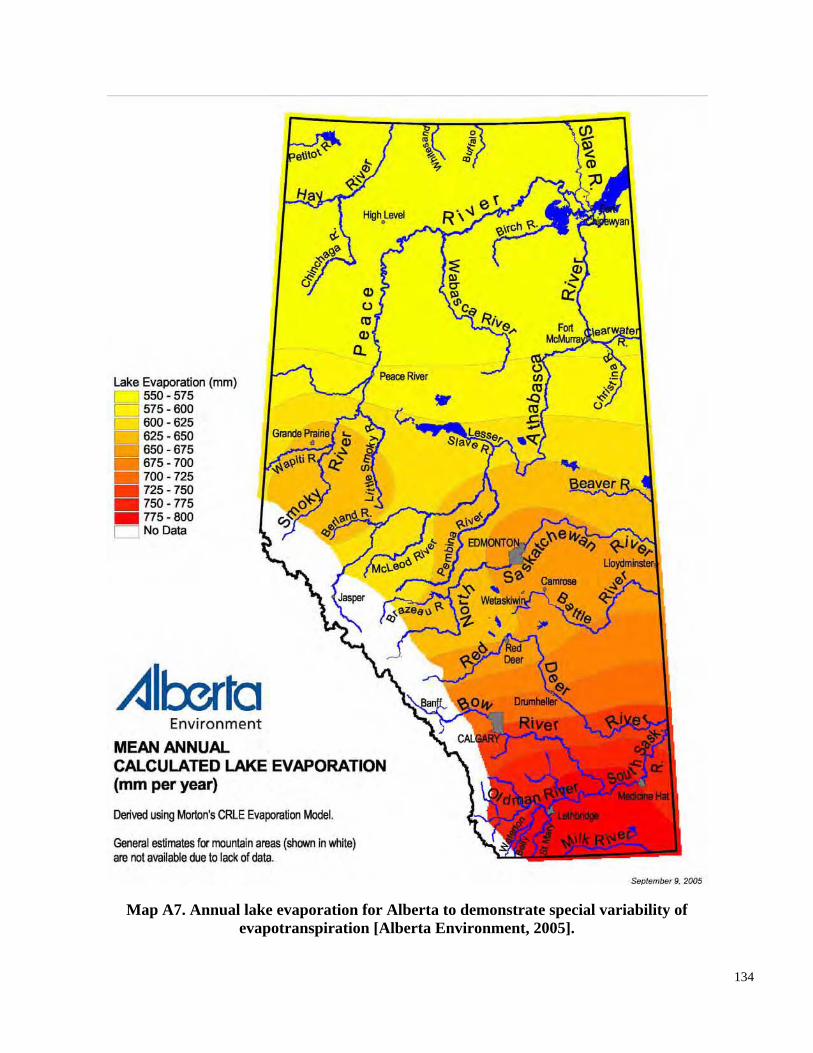
Map A7. Annual lake evaporation for Alberta to demonstrate special variability of evapotranspiration [Alberta Environment, 2005].
134
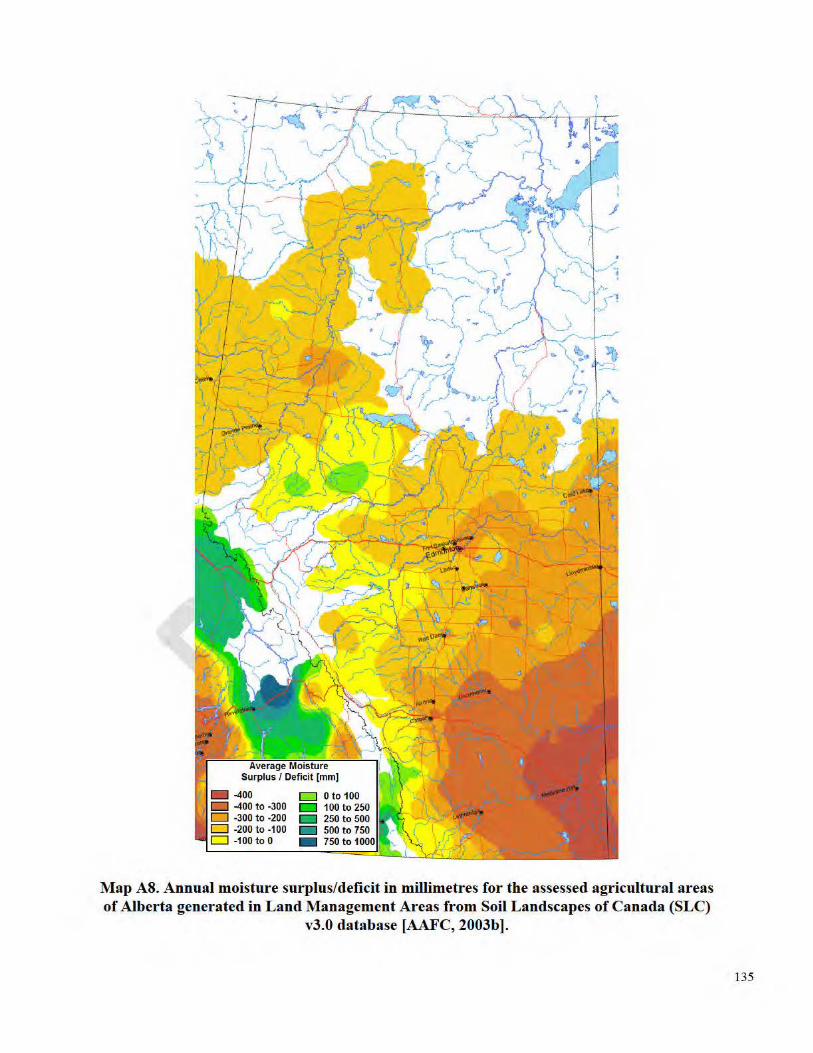
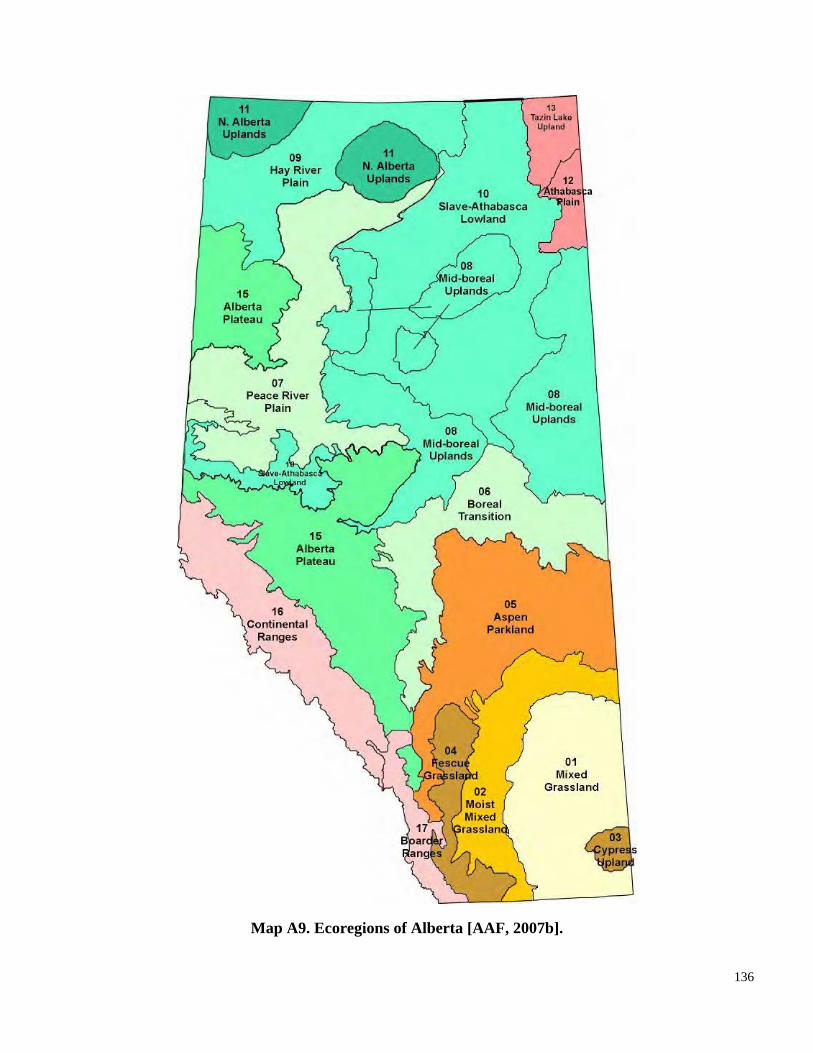
Map A9. Ecoregions of Alberta [AAF, 2007b].
136
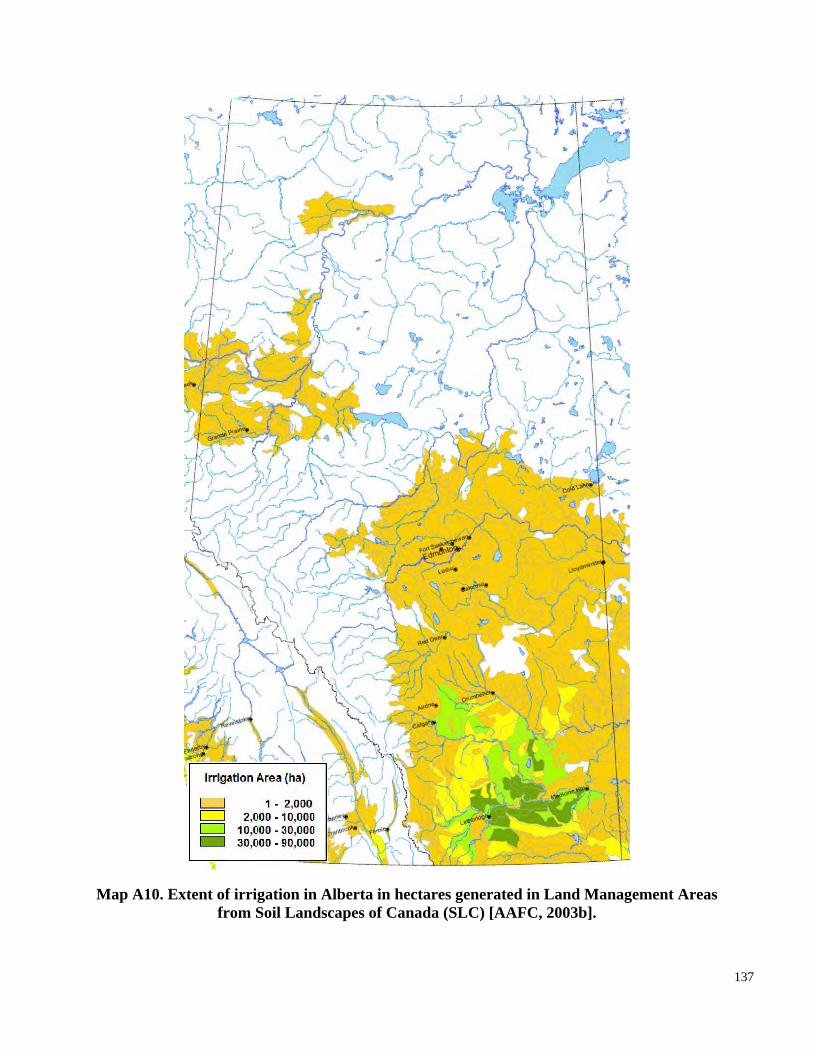
Map A10. Extent of irrigation in Alberta in hectares generated in Land Management Areas from Soil Landscapes of Canada (SLC) [AAFC, 2003b].
137
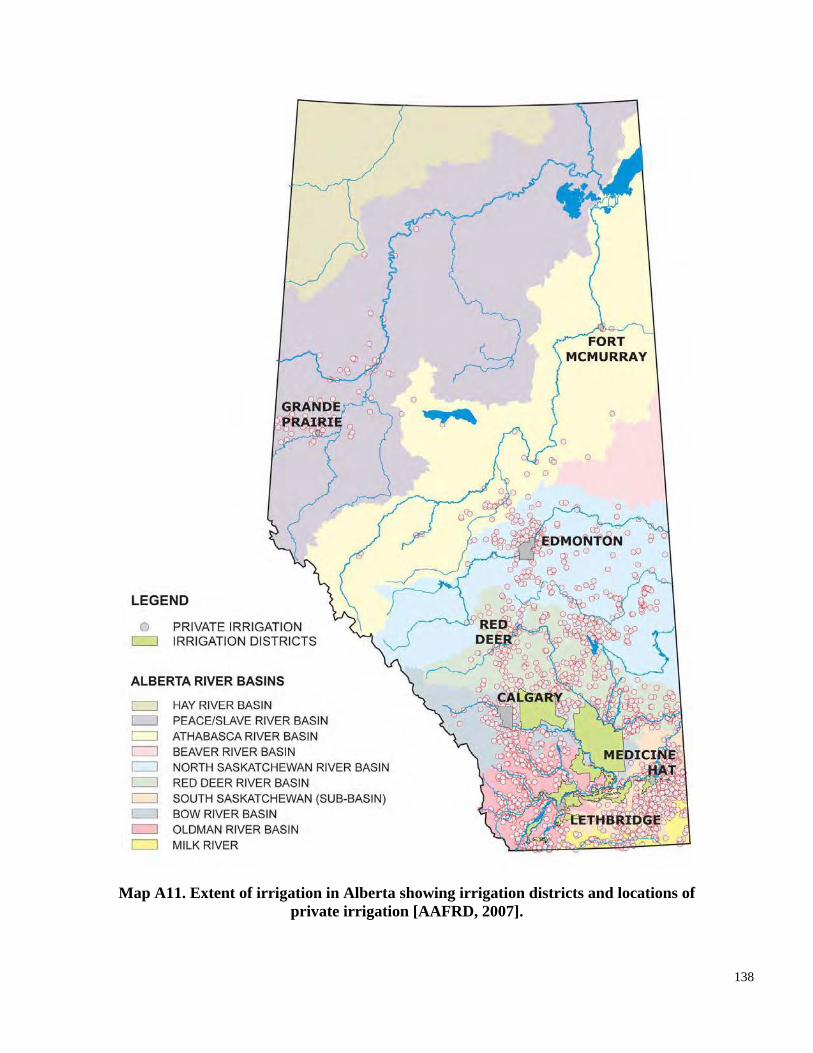
Map A11. Extent of irrigation in Alberta showing irrigation districts and locations of private irrigation [AAFRD, 2007].
138
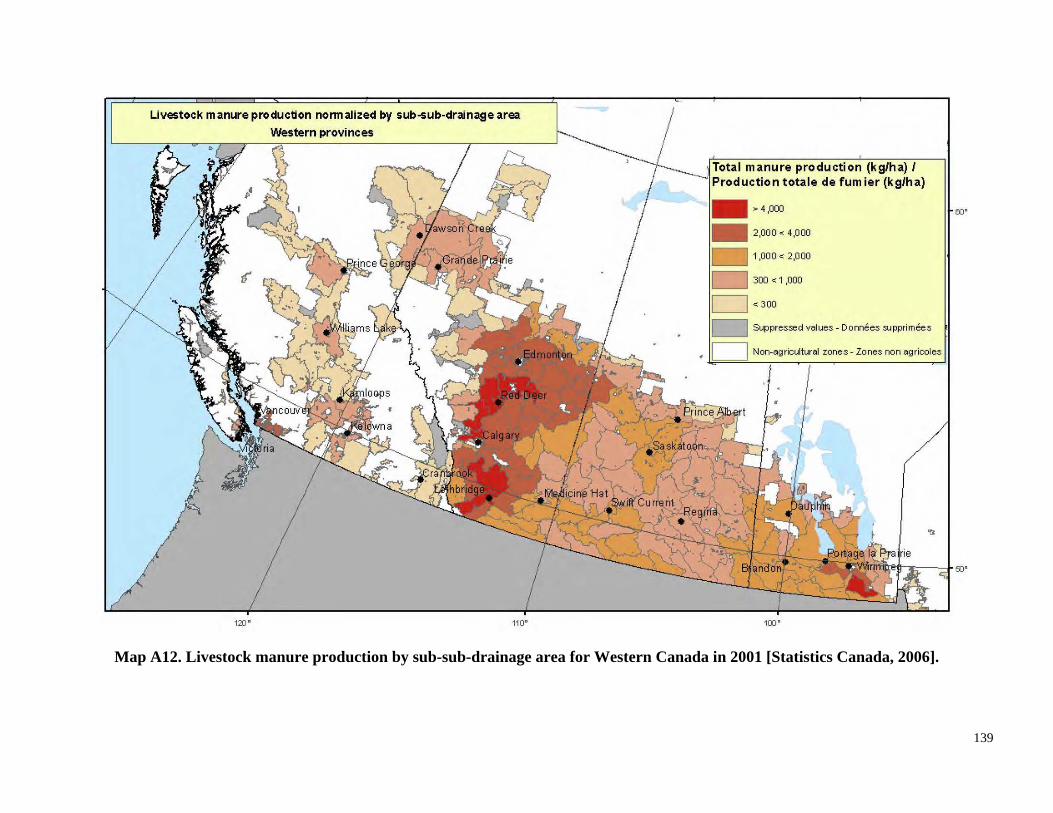
Map A12. Livestock manure production by sub-sub-drainage area for Western Canada in 2001 [Statistics Canada, 2006].
139
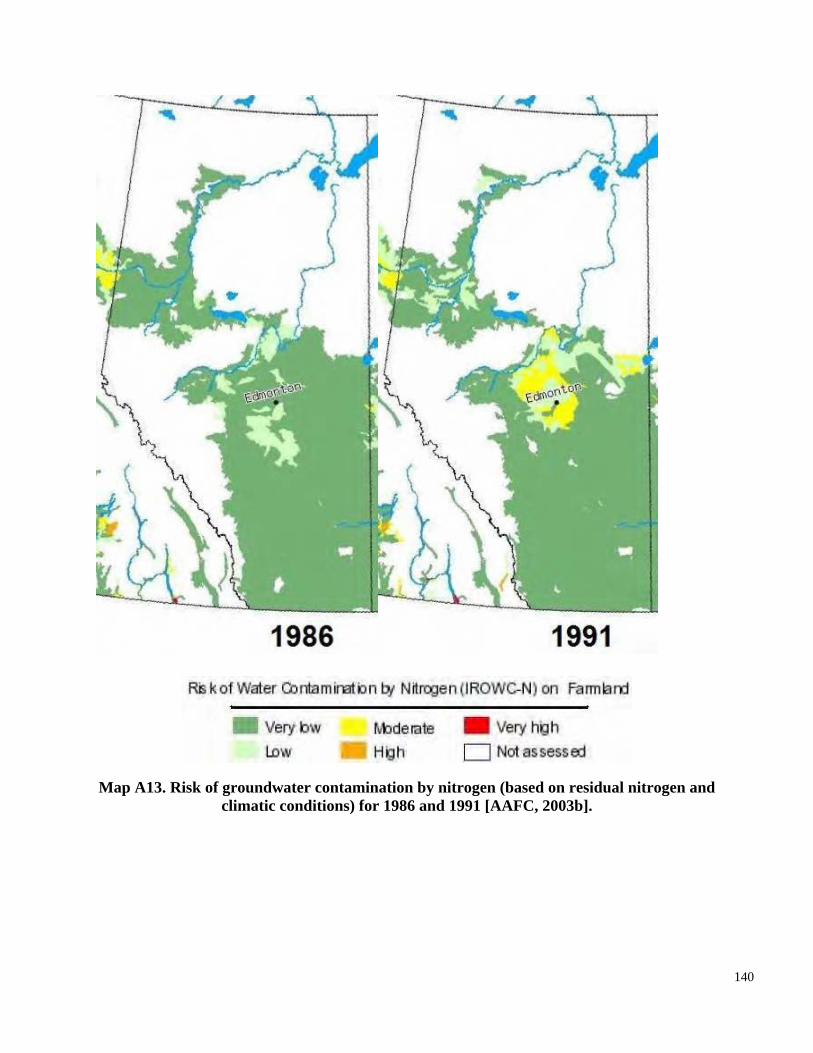
Map A13. Risk of groundwater contamination by nitrogen (based on residual nitrogen and climatic conditions) for 1986 and 1991 [AAFC, 2003b].
140
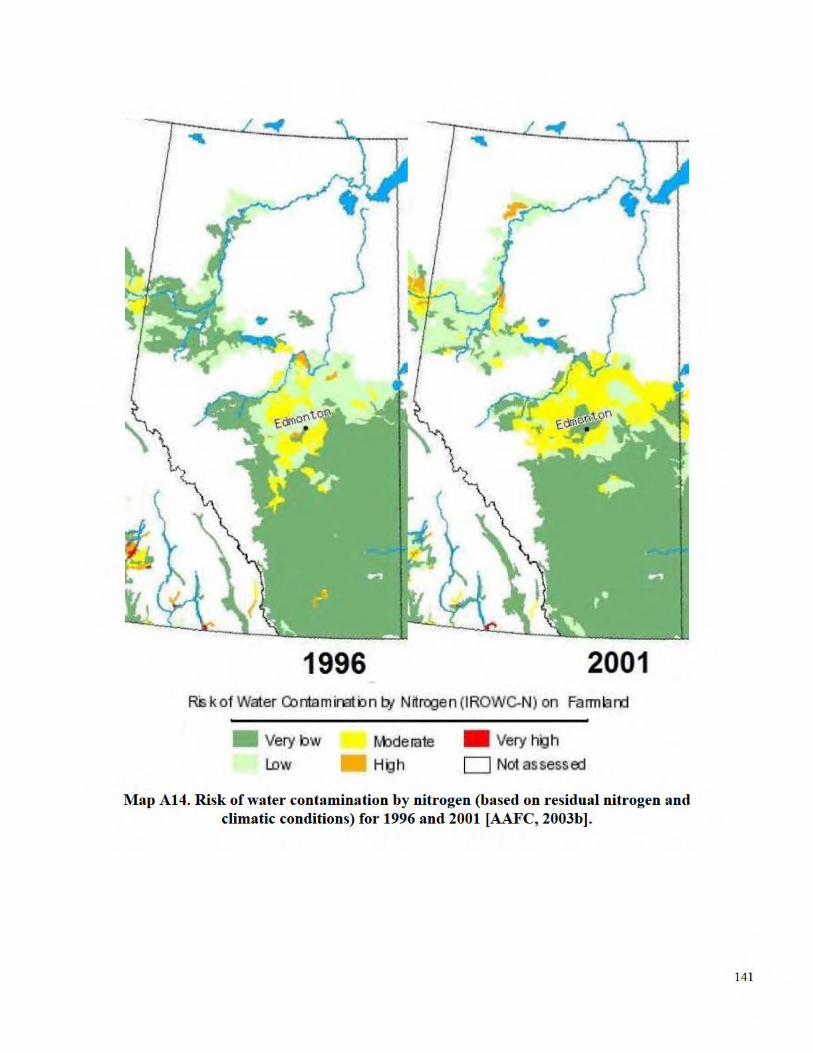
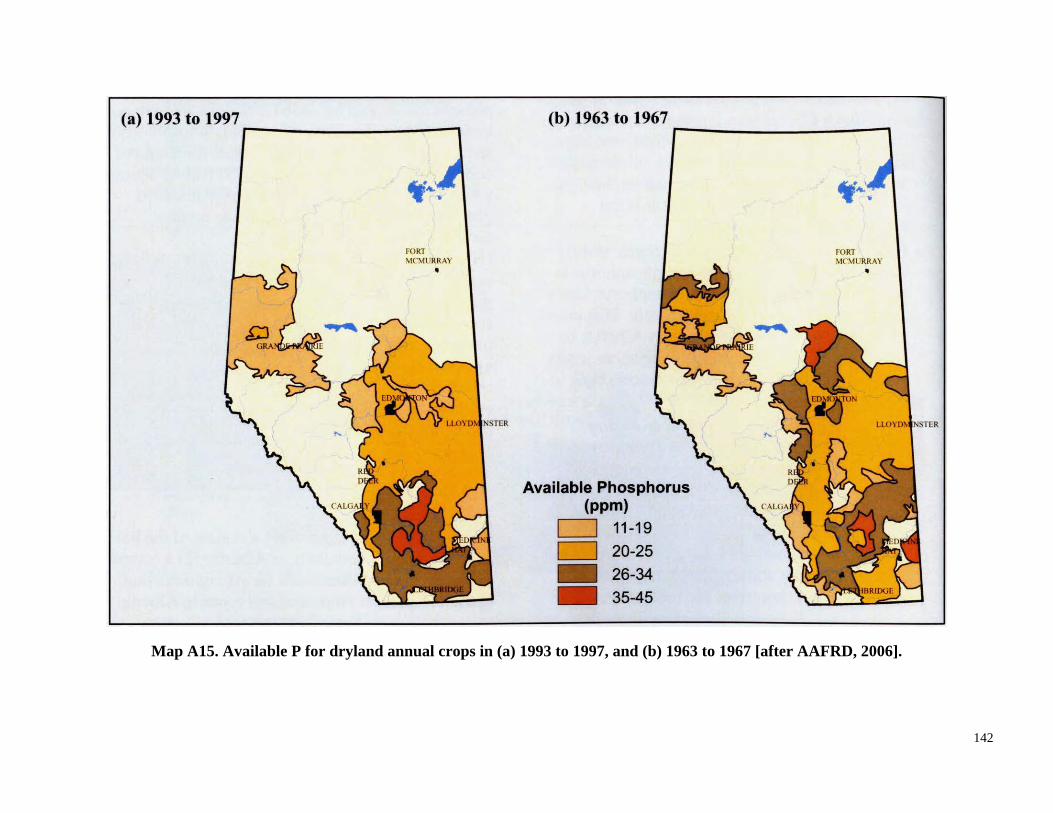
Map A15. Available P for dryland annual crops in (a) 1993 to 1997, and (b) 1963 to 1967 [after AAFRD, 2006].
142
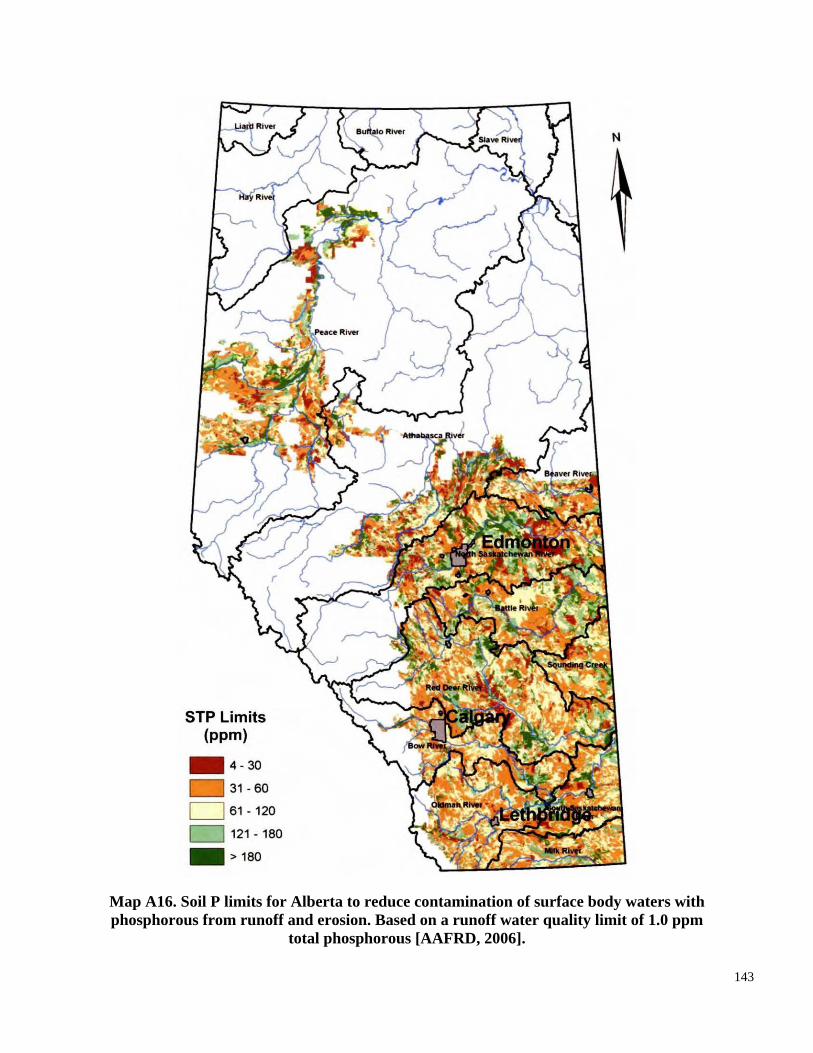
Map A16. Soil P limits for Alberta to reduce contamination of surface body waters with phosphorous from runoff and erosion. Based on a runoff water quality limit of 1.0 ppm
total phosphorous [AAFRD, 2006].
143
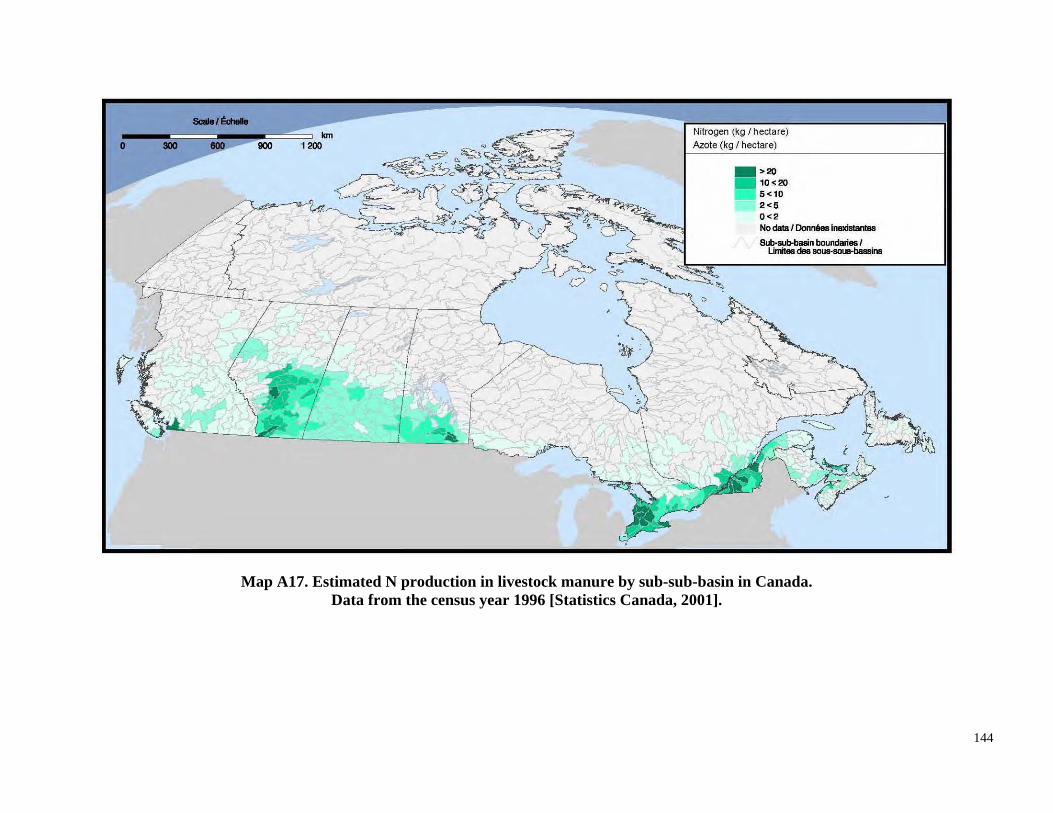
Data from the census year 1996 [Statistics Canada, 2001]. Map A17. Estimated N production in livestock manure by sub-sub-basin in Canada.
144
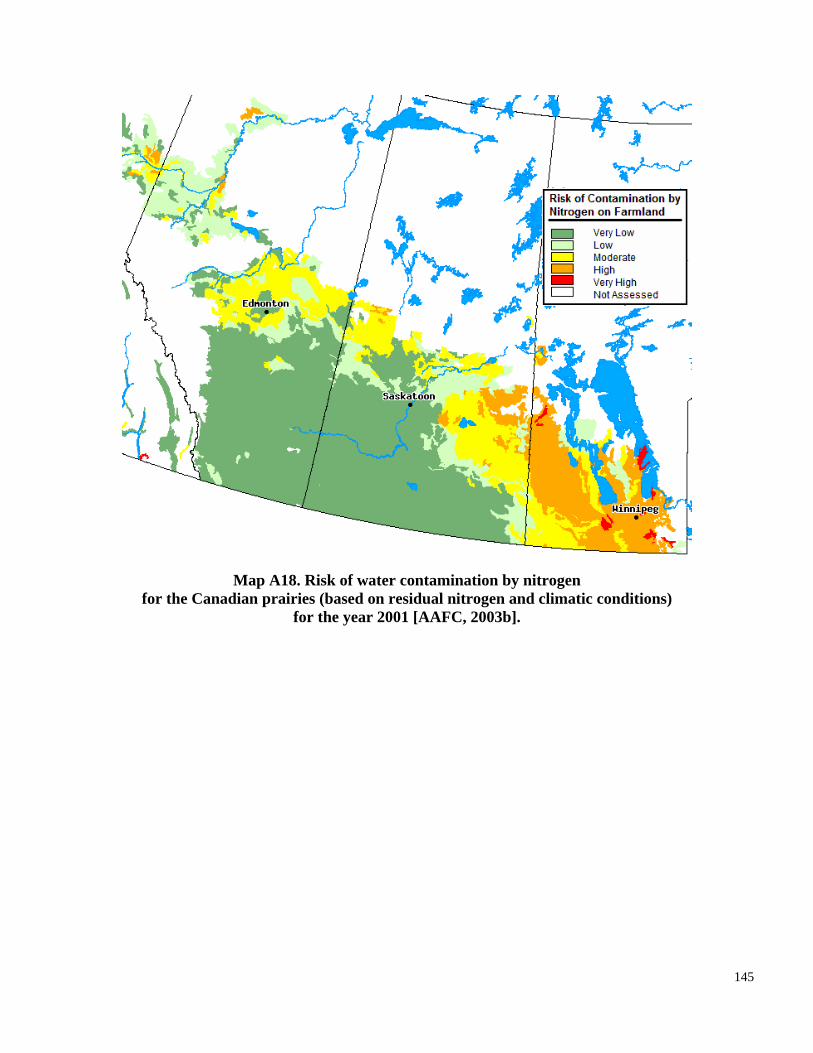
Map A18. Risk of water contamination by nitrogen for the Canadian prairies (based on residual nitrogen and climatic conditions)
for the year 2001 [AAFC, 2003b].
145
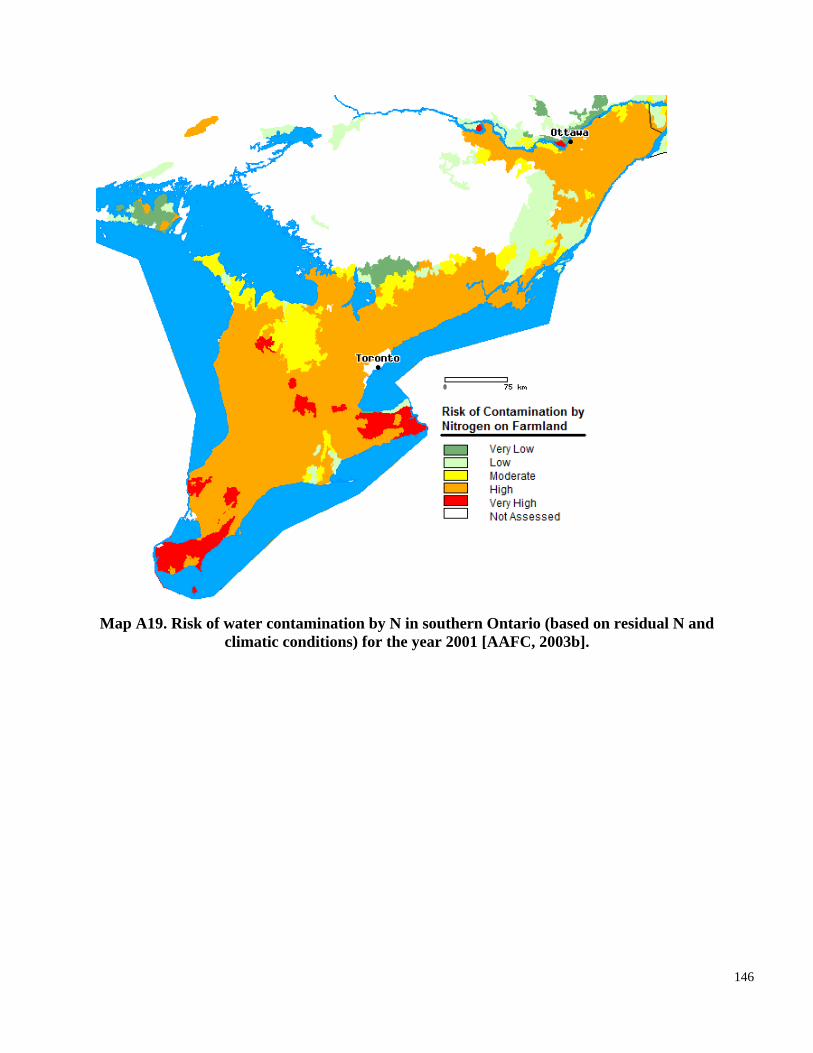
Map A19. Risk of water contamination by N in southern Ontario (based on residual N and climatic conditions) for the year 2001 [AAFC, 2003b].
146
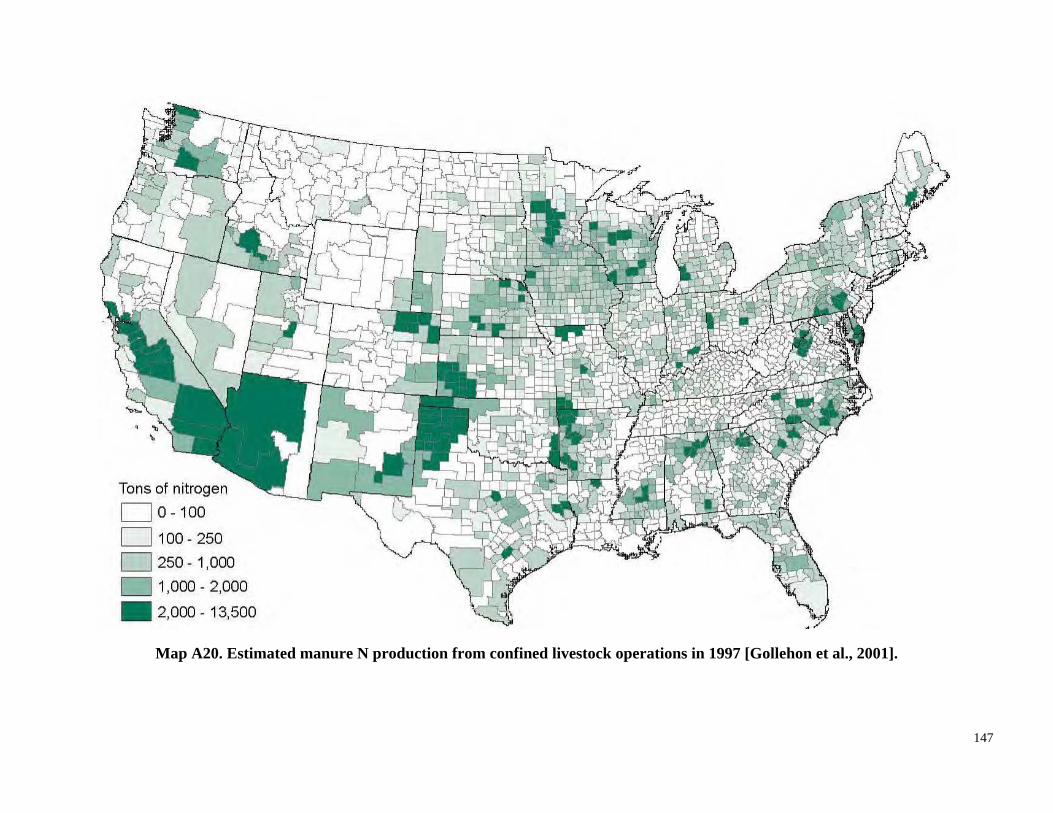
Map A20. Estimated manure N production from confined livestock operations in 1997 [Gollehon et al., 2001].
147
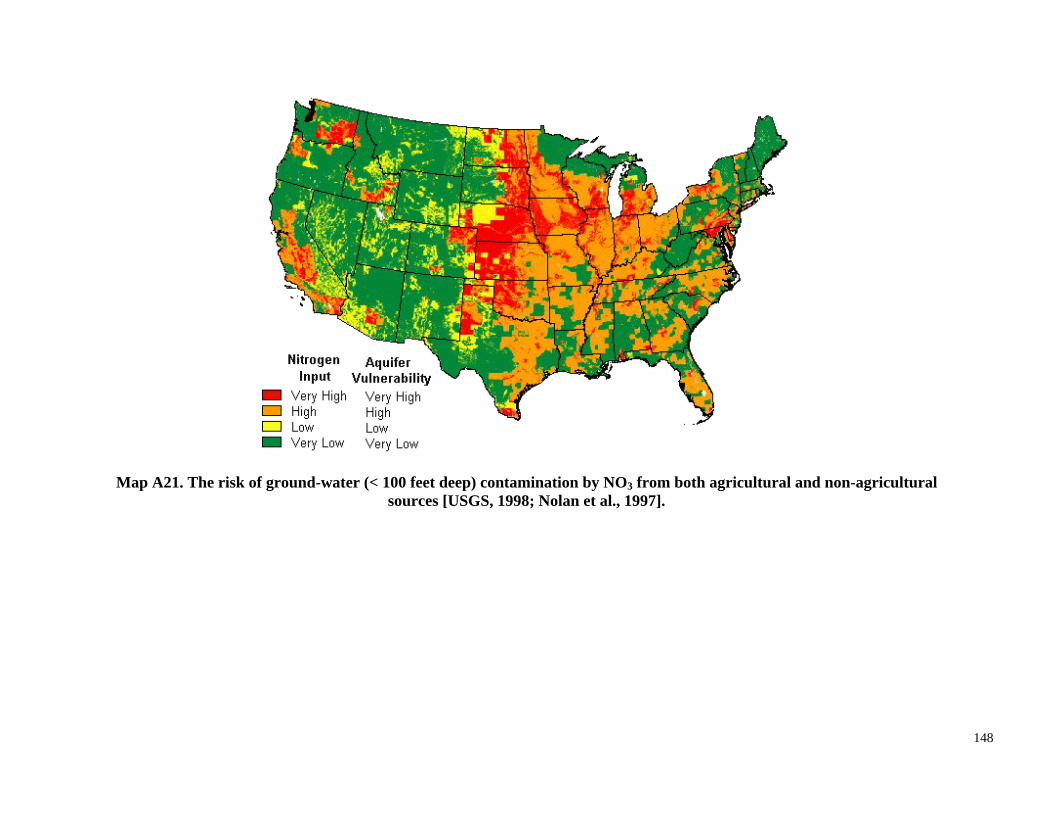
Map A21. The risk of ground-water (< 100 feet deep) contamination by NO3 from both agricultural and non-agricultural sources [USGS, 1998; Nolan et al., 1997].
148
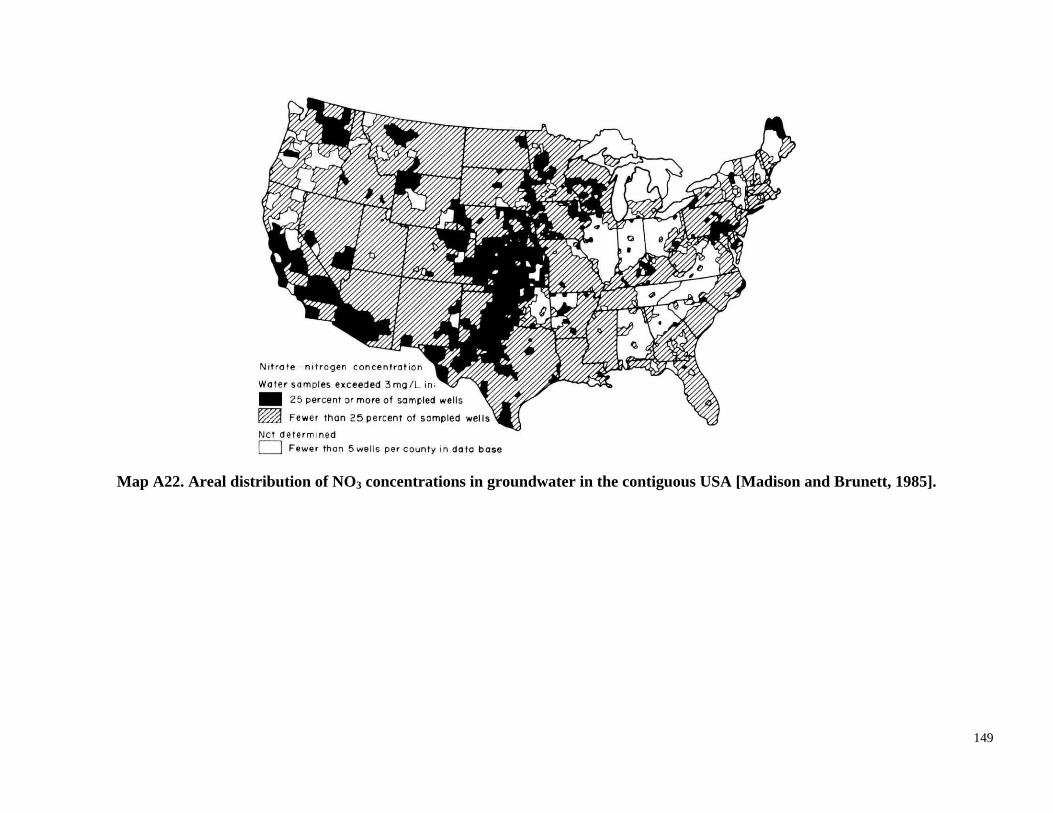
Map A22. Areal distribution of NO3 concentrations in groundwater in the contiguous USA [Madison and Brunett, 1985].
149
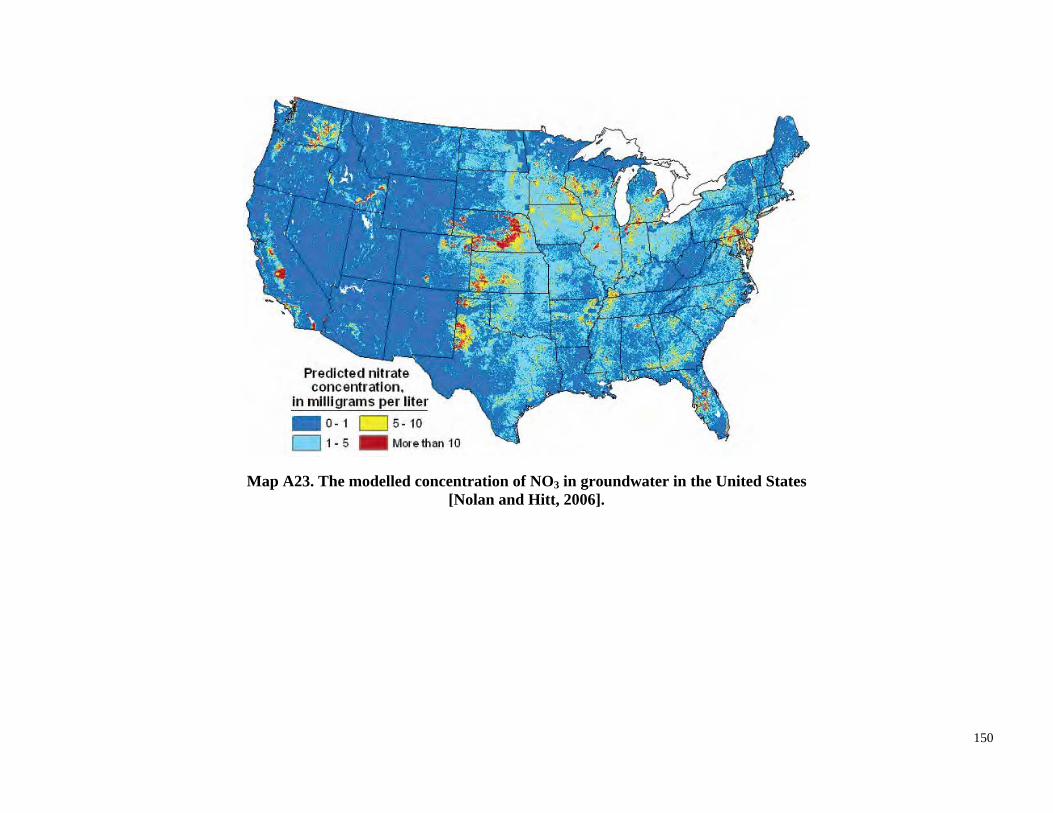
Map A23. The modelled concentration of NO3 in groundwater in the United States [Nolan and Hitt, 2006].
150
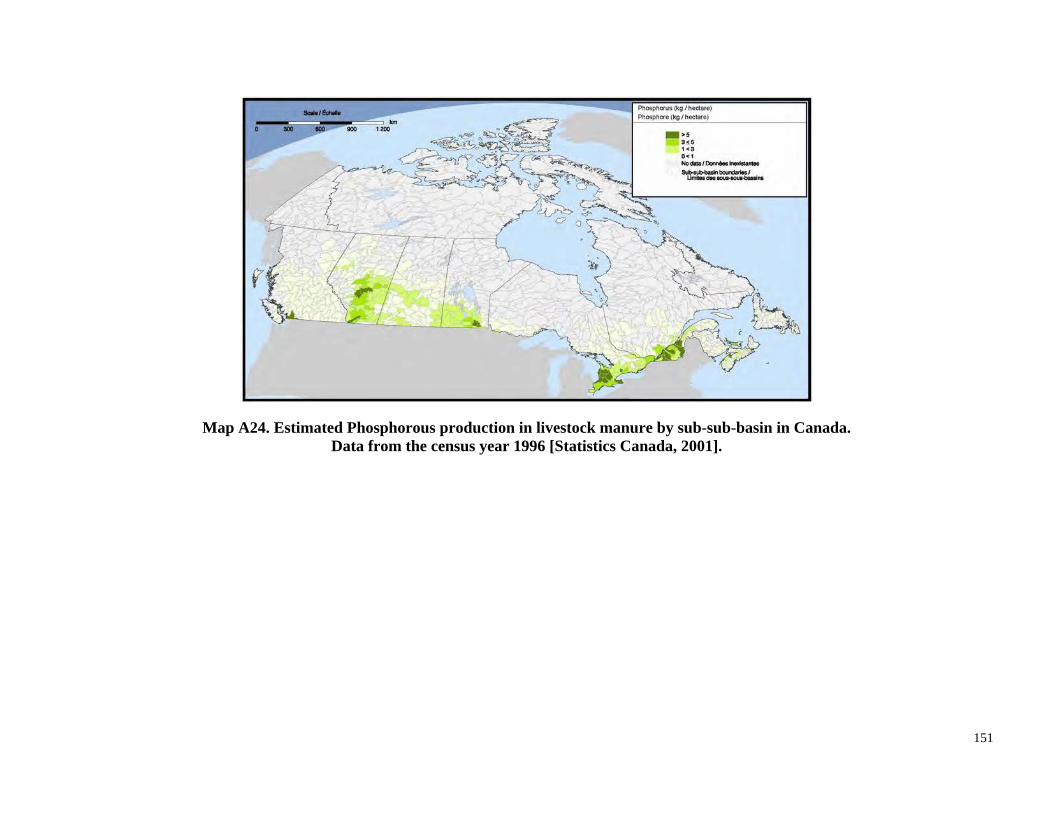
Map A24. Estimated Phosphorous production in livestock manure by sub-sub-basin in Canada. Data from the census year 1996 [Statistics Canada, 2001].
151
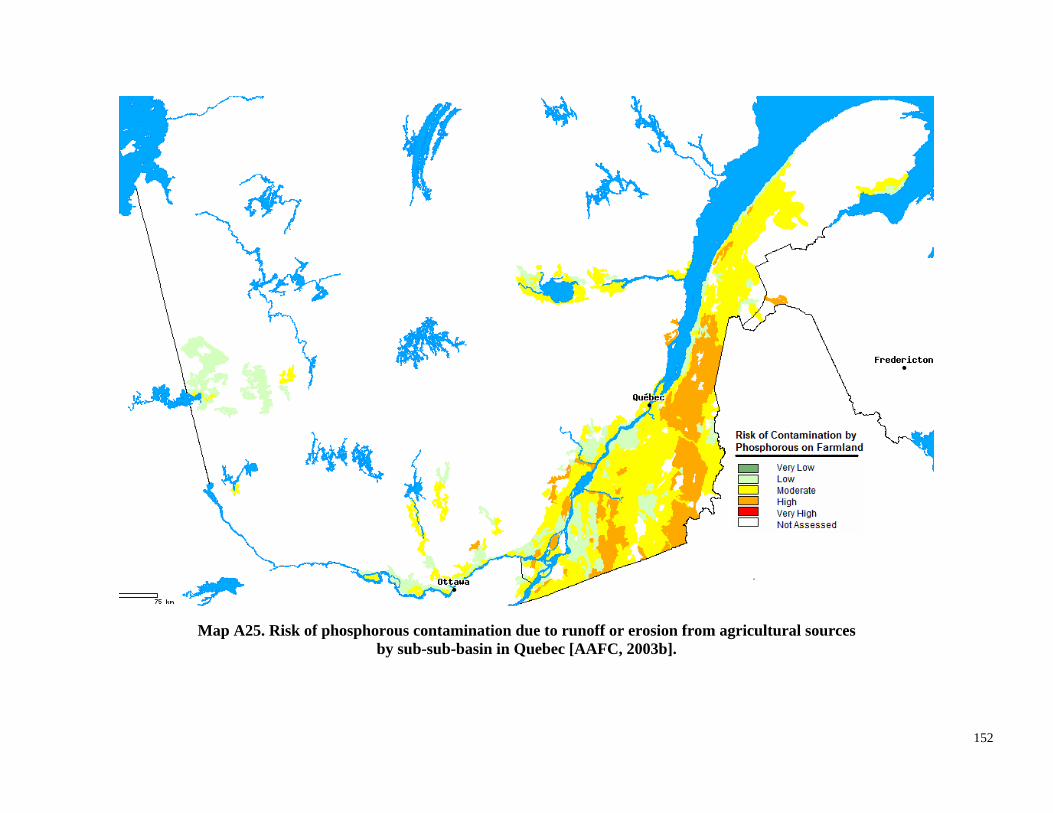
Map A25. Risk of phosphorous contamination due to runoff or erosion from agricultural sources by sub-sub-basin in Quebec [AAFC, 2003b].
152
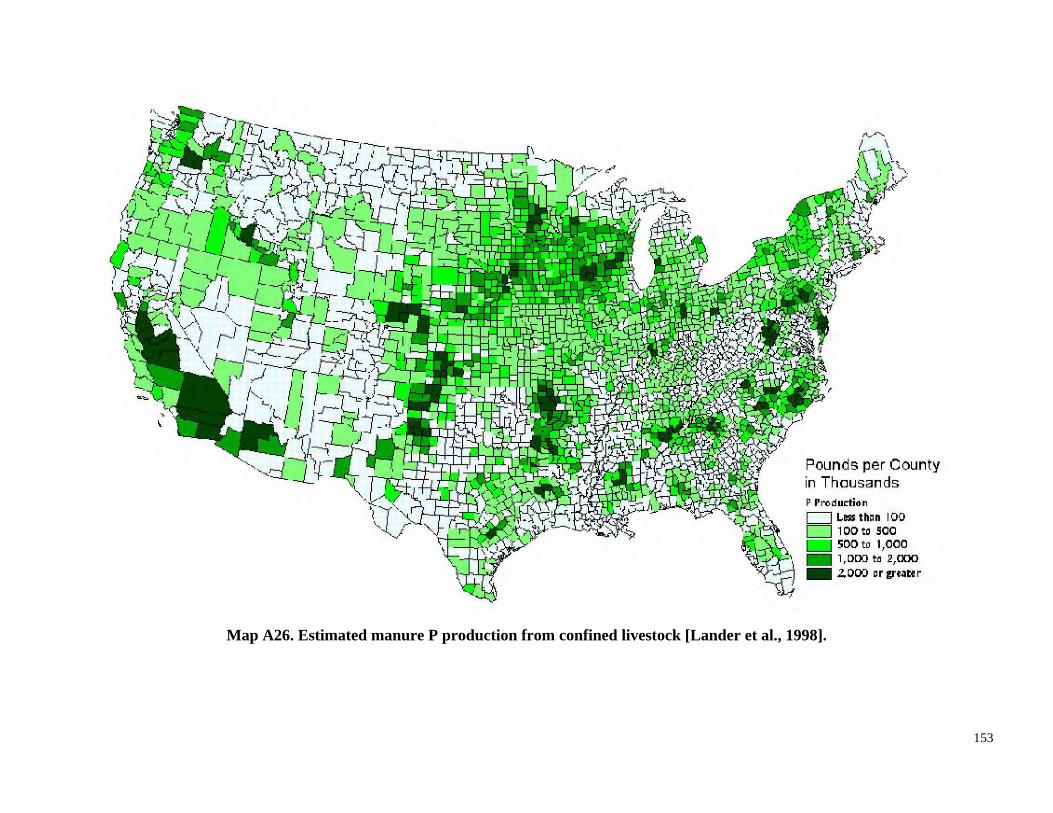
Map A26. Estimated manure P production from confined livestock [Lander et al., 1998].
153
Wells to Nitrate in the United States: Environmental Science and Technology 40(24): 7834
A.2. References
Alberta Agriculture and Food (AAF), 2007a, Conservation and Development Branch, March. Alberta Agriculture and Food (AAF), 2007b, Agroclimatic Atlas of Alberta. Accessed March 10,
2008. http://www1.agric.gov.ab.ca/$department/deptdocs.nsf/all/sag6278 Agriculture and Agri-Food Canada (AAFC), 2003a, The National Land and Water Information
Service: The Land Resource Viewer. Accessed January 13, 2008; http://www.agr.gc.ca/nlwissnite/index e.cfm?s1=maps cartes&page=intro
Agriculture and Agri-Food Canada (AAFC), 2003b, The National Land and Water Information January
Gollehon, N., Caswell, M., Ribaudo, M., Kellogg, R., Lander, C., and Letson, D., 2001, Confined Animal Production and Manure Nutrients, United States Department of Agriculture (USDA): Economic Research Service.
Lander, C.H., Moffitt, D., and Alt, K., 1998, Nutrients Available from Livestock Manure Relative to Crop Growth Requirements, United States Department of Agriculture. Natural Resources Conservation Service, Washington, D.C. http://www.nrcs.usda.gov/Technical/land/pubs/nlweb.html
Madison, R.J., and Brunett, J.O., 1985, Overview of the occurrence of nitrate in ground water of the United States, in National Water Summary 1984; Hydrologic events, selected water-quality trends, and ground-water resources: U.S. Geological Survey Water-Supply Paper 2275, p. 93-105.
Nolan, B.T., and Hitt, K.J., 2006, Vulnerability of Shallow Groundwater and Drinking-Water
Service: Agri-Enviromental Indicators. Accessed 13, 2008. http://nlwissnite1.agr.gc.ca/ind2001/index.phtml?lang=en-CA
Alberta Agriculture, Food and Rural Development (AAFRD), 2007, Alberta Irrigation Information 2006.
Alberta Agriculture, Food and Rural Development (AAFRD), 2006, Alberta Soil Phosphorus Limits Project.
Alberta Environment, 2005, Learn About Water: Climate Data. Accessed March 10, 2008. http://www3.gov.ab.ca/env/water/GWSW/quantity/learn/what/CLM climate/CLM1 metdata.h tml
7840. Nolan, B.T., Ruddy, B.C., Hitt, K.J., and Helsel, D.R., 1997, Risk of Nitrate in Groundwaters of
the United States-A National Perspective: Environmental Science and Technology 31(8): 2229 -2238.
Statistics Canada, 2006, A Geographical Profile of Manure Production in Canada, 2001, Catalogue no. 21-601-MIE — No. 077, http://www.statcan.ca/english/research/21-601MIE/21-601-MIE2006077.pdf
Statistics Canada, 2001, A Geographical Profile of Manure Production in Canada, Accessed December 14, 2007. http://www.statcan.ca/english/freepub/16F0025XIB/16F0025XIB2000001.htm
Statistics Canada, 1996, Census of Agriculture.
154

United States Geological Survey (USGS), 1998, (USGS), U.S.G.S. 1998. A National Look at Nitrate Contamination of Ground Water. Accessed January 15 2008. http://water.usgs.gov/nawqa/nutrients/pubs/est_v36_no10/
155
APPENDIX B. DETAILS OF REGULATORY REQUIREMENTS
B.1. Canada
B.1.1. Alberta
In Alberta, agricultural animal waste management is regulated by the Natural Resources
Conservation Board (NRCB) pursuant to the Agricultural Operations Practices Act [Chapter A-7,
Standards and Practices Regulation 267/2001]. No one may apply manure, composting materials
or compost in a manner inconsistent with the regulations unless the person holds an approval,
registration or authorization that specifies otherwise [AOPA §15].
156
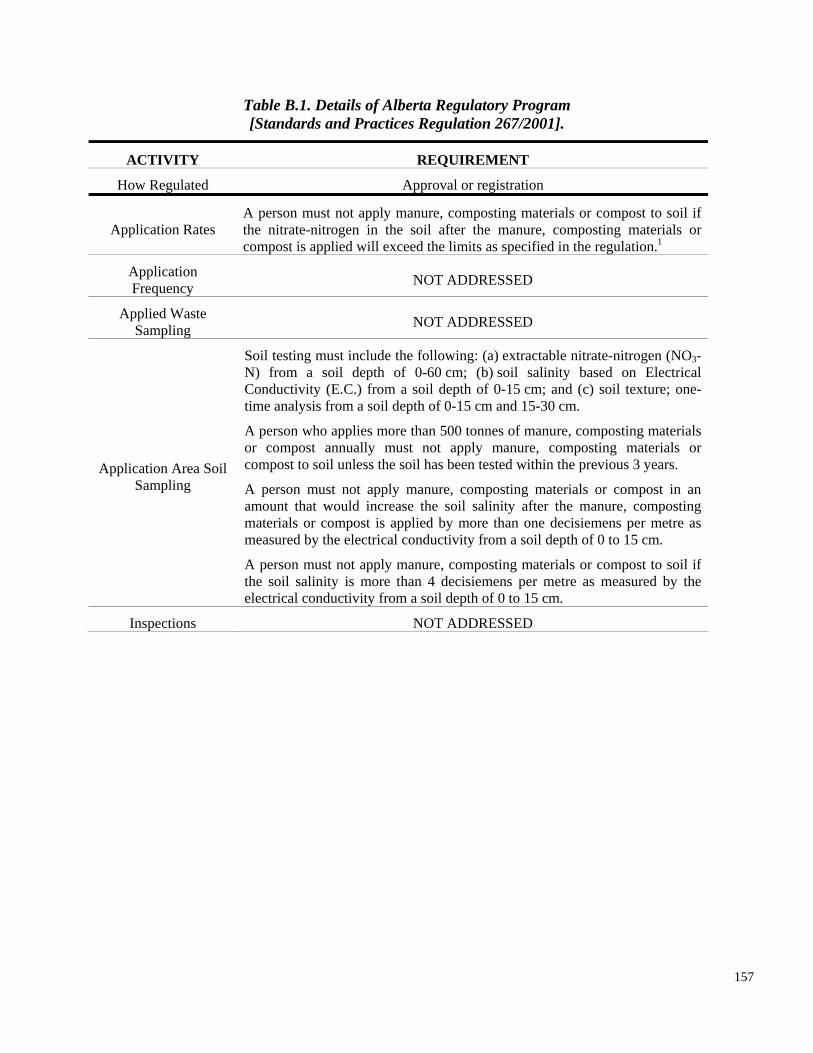
Inspections NOT ADDRESSED
Table B.1. Details of Alberta Regulatory Program [Standards and Practices Regulation 267/2001].
ACTIVITY
How Regulated
Application Rates
REQUIREMENT
Approval or registration
A person must not apply manure, composting materials or compost to soil if the nitrate-nitrogen in the soil after the manure, composting materials or compost is applied will exceed the limits as specified in the regulation.1
NOT ADDRESSED
Application Frequency
Applied Waste Sampling
Application Area Soil Sampling
NOT ADDRESSED
157
Soil testing must include the following: (a) extractable nitrate-nitrogen (NO3N) from a soil depth of 0-60 cm; (b) soil salinity based on Electrical Conductivity (E.C.) from a soil depth of 0-15 cm; and (c) soil texture; onetime analysis from a soil depth of 0-15 cm and 15-30 cm.
A person who applies more than 500 tonnes of manure, composting materials or compost annually must not apply manure, composting materials or compost to soil unless the soil has been tested within the previous 3 years.
A person must not apply manure, composting materials or compost in an amount that would increase the soil salinity after the manure, composting materials or compost is applied by more than one decisiemens per metre as measured by the electrical conductivity from a soil depth of 0 to 15 cm.
A person must not apply manure, composting materials or compost to soil if the soil salinity is more than 4 decisiemens per metre as measured by the electrical conductivity from a soil depth of 0 to 15 cm.
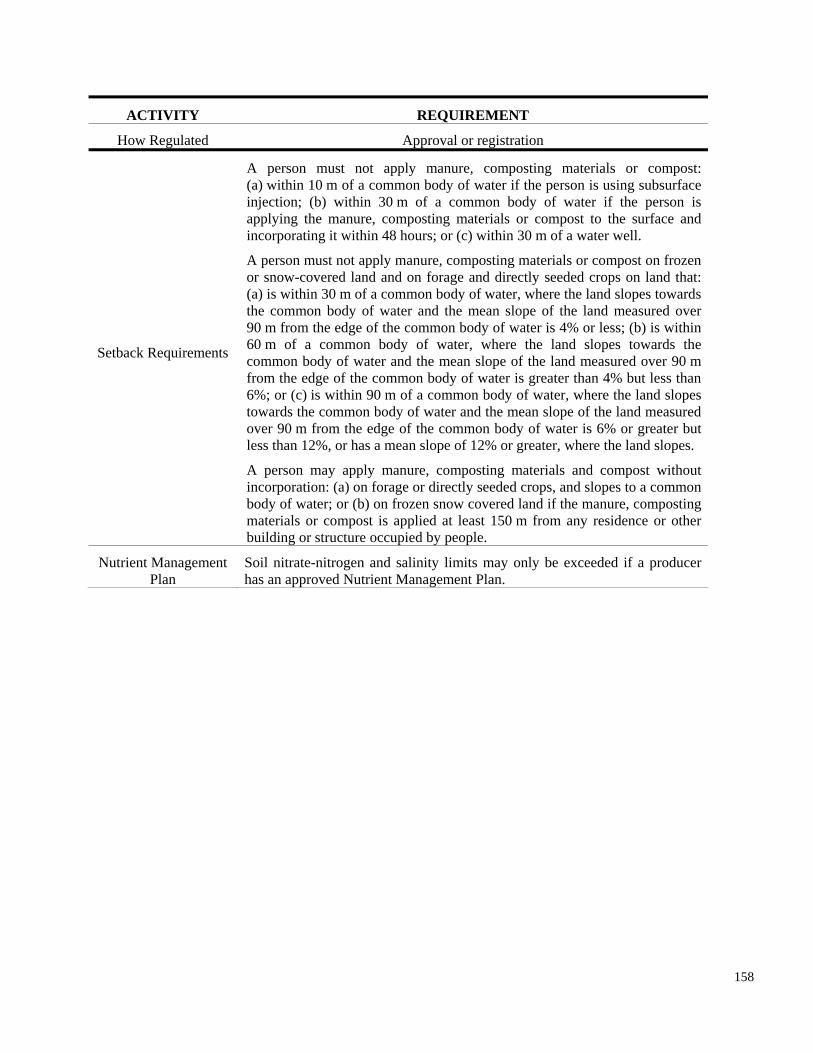
ACTIVITY REQUIREMENT
How Regulated Approval or registration
materials or compost is applied at least 150 m from any residence or other building or structure occupied by people.
Nutrient Management Plan
Soil nitrate-nitrogen and salinity limits may only be exceeded if a producer has an approved Nutrient Management Plan.
Setback Requirements
A person must not apply manure, composting materials or compost: (a) within 10 m of a common body of water if the person is using subsurface injection; (b) within 30 m of a common body of water if the person is applying the manure, composting materials or compost to the surface and incorporating it within 48 hours; or (c) within 30 m of a water well.
A person must not apply manure, composting materials or compost on frozen or snow-covered land and on forage and directly seeded crops on land that:
158
(a) is within 30 m of a common body of water, where the land slopes towards the common body of water and the mean slope of the land measured over 90 m from the edge of the common body of water is 4% or less; (b) is within 60 m of a common body of water, where the land slopes towards the common body of water and the mean slope of the land measured over 90 m from the edge of the common body of water is greater than 4% but less than 6%; or (c) is within 90 m of a common body of water, where the land slopes towards the common body of water and the mean slope of the land measured over 90 m from the edge of the common body of water is 6% or greater but less than 12%, or has a mean slope of 12% or greater, where the land slopes.
A person may apply manure, composting materials and compost without incorporation: (a) on forage or directly seeded crops, and slopes to a common body of water; or (b) on frozen snow covered land if the manure, composting
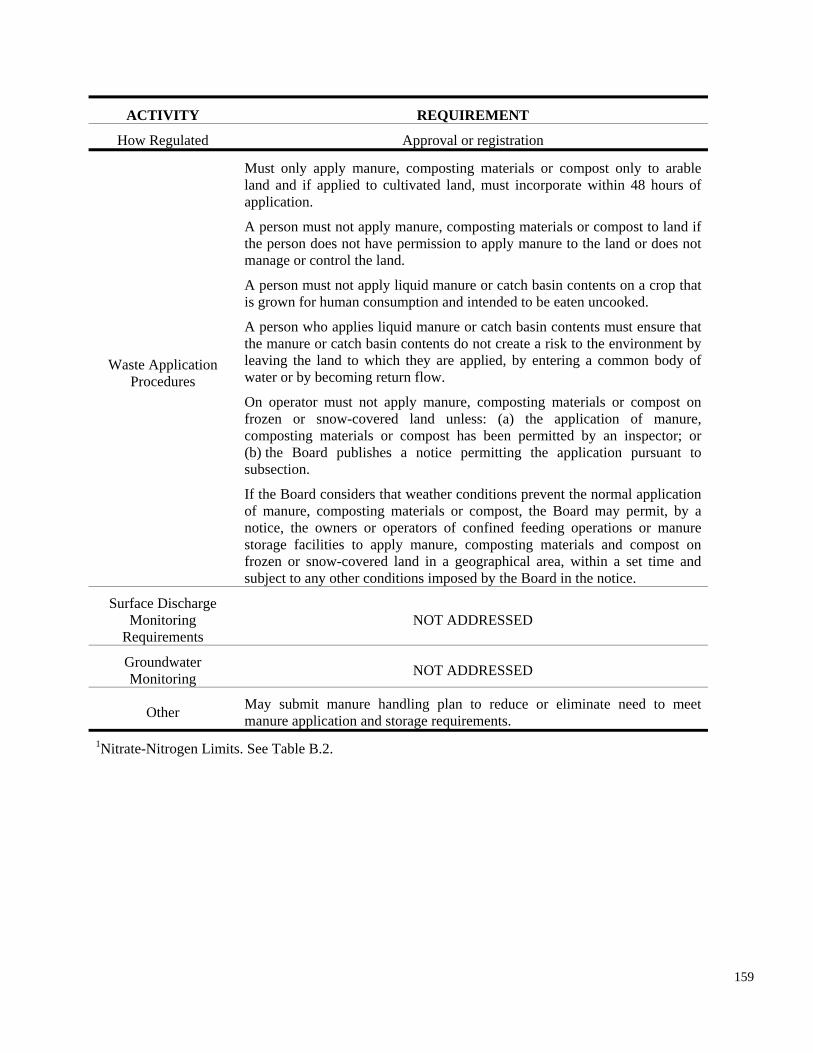
is grown for human consumption and intended to be eaten uncooked.
A person who applies liquid manure or catch basin contents must ensure that the manure or catch basin contents do not create a risk to the environment by leaving the land to which they are applied, by entering a common body of water or by becoming return flow.
On operator must not apply manure, composting materials or compost on frozen or snow-covered land unless: (a) the application of manure, composting materials or compost has been permitted by an inspector; or (b) the Board publishes a notice permitting the application pursuant to subsection.
If the Board considers that weather conditions prevent the normal application of manure, composting materials or compost, the Board may permit, by a
ACTIVITY REQUIREMENT
How Regulated Approval or registration
notice, the owners or operators of confined feeding operations or manure storage facilities to apply manure, composting materials and compost on frozen or snow-covered land in a geographical area, within a set time and subject to any other conditions imposed by the Board in the notice.
Surface Discharge Monitoring
Requirements NOT ADDRESSED
Groundwater Monitoring NOT ADDRESSED
Other May submit manure handling plan to reduce or eliminate need to meet manure application and storage requirements.
1Nitrate-Nitrogen Limits. See Table B.2.
Waste Application Procedures
Must only apply manure, composting materials or compost only to arable land and if applied to cultivated land, must incorporate within 48 hours of application.
A person must not apply manure, composting materials or compost to land if the person does not have permission to apply manure to the land or does not manage or control the land.
A person must not apply liquid manure or catch basin contents on a crop that
159
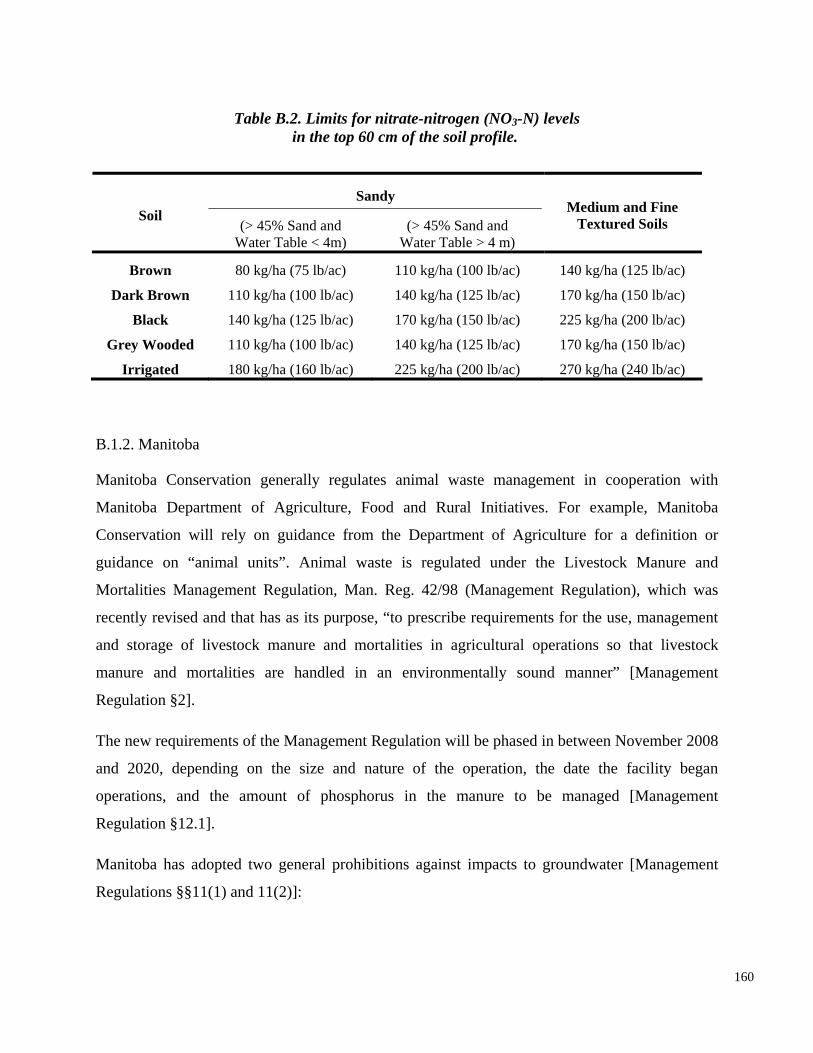
Table B.2. Limits for nitrate-nitrogen (NO3-N) levels in the top 60 cm of the soil profile.
Sandy Medium and FineSoil
(> 45% Sand and (> 45% Sand and Textured Soils Water Table < 4m) Water Table > 4 m)
Brown 80 kg/ha (75 lb/ac) 110 kg/ha (100 lb/ac) 140 kg/ha (125 lb/ac)
Dark Brown 110 kg/ha (100 lb/ac) 140 kg/ha (125 lb/ac) 170 kg/ha (150 lb/ac)
Black 140 kg/ha (125 lb/ac) 170 kg/ha (150 lb/ac) 225 kg/ha (200 lb/ac)
Grey Wooded 110 kg/ha (100 lb/ac) 140 kg/ha (125 lb/ac) 170 kg/ha (150 lb/ac)
Irrigated 180 kg/ha (160 lb/ac) 225 kg/ha (200 lb/ac) 270 kg/ha (240 lb/ac)
Regulation §12.1].
Manitoba has adopted two general prohibitions against impacts to groundwater [Management
Regulations §§11(1) and 11(2)]:
160
B.1.2. Manitoba
Manitoba Conservation generally regulates animal waste management in cooperation with
Manitoba Department of Agriculture, Food and Rural Initiatives. For example, Manitoba
Conservation will rely on guidance from the Department of Agriculture for a definition or
guidance on “animal units”. Animal waste is regulated under the Livestock Manure and
Mortalities Management Regulation, Man. Reg. 42/98 (Management Regulation), which was
recently revised and that has as its purpose, “to prescribe requirements for the use, management
and storage of livestock manure and mortalities in agricultural operations so that livestock
manure and mortalities are handled in an environmentally sound manner” [Management
Regulation §2].
The new requirements of the Management Regulation will be phased in between November 2008
and 2020, depending on the size and nature of the operation, the date the facility began
operations, and the amount of phosphorus in the manure to be managed [Management
• No person shall handle, use or dispose of livestock manure, or store livestock manure in an agricultural operation, in such a manner that it is discharged or otherwise released into surface water, a surface watercourse or groundwater.
• An operator shall ensure that livestock manure that is handled, used, disposed of or stored in an agricultural operation is not discharged or otherwise released into surface water, a surface watercourse or groundwater.
The regulations also provide [Management Regulations 12(2)]:
• No person shall apply livestock manure to land if, due to meteorological, topographical or soil conditions, or the rate of application, livestock manure: (a) causes pollution of surface water, groundwater or soil; or (b) escapes from the boundary of the agricultural operation.
An applicant may request approval to conduct experimental application of manure with prior
approval of the agency [Management Regulation §17.1].
Manitoba considered issues associated with manure waste management through the Manitoba
Phosphorus Expert Committee, which issued a report in 2006 that resulted in revisions to the
Management Regulations that require consideration of phosphorus during application. The 2006
report included the following recommendations [Manitoba Phosphorus Expert Committee,
2006]:
• The most promising approach to regulating the land application of phosphorus is to use soil test phosphorus threshold ranges to trigger a change in management. The environmental risk associated with elevated soil phosphorus concentrations arising from livestock manure applications should be managed through incrementally restrictive requirements for use of phosphorus at different thresholds of soil test phosphorus. Four ranges of soil test phosphorus thresholds are proposed and imply an increasing degree of restriction for land application of livestock manure based upon the soil’s phosphorus content.
In 2007, the Manitoba Auditor General issued a report on the livestock management practices in
Manitoba. The purpose of the audit was to “evaluate [Manitoba] Conservation’s operational
efforts to protect surface and groundwater from potential contamination caused by livestock
operations”. Specifically, the objectives of the audit were [Manitoba Auditor General, 2007]:
• To determine whether the Regulation was generally comparable to legislation in other Canadian jurisdictions.
161
of the Environmental Livestock Program, “Conservation did not use this information to the
• To determine whether Conservation had adequate processes in place to ensure operators of livestock operations (operators) comply with the key provisions of the Regulation.
• To determine whether Conservation used information available to further its efforts to protect surface and groundwater from contamination.
• To determine whether Conservation was sufficiently consulting with the Departments of Agriculture, Food and Rural Initiatives, Health, Intergovernmental Affairs, and Water Stewardship, as well as municipalities, on common issues related to water quality.
The report concluded that legislation in the Province of Manitoba
Controls to address the effects of chemical fertilizers combined with manure
• The submission of contingency plans to deal with potential emergencies related to livestock manure; and
• Controls related to the application of manure on frozen or snow-covered ground.
The report also concluded that some of the processes in place to implement the regulations
needed attention. With regard to land application, this included monitoring of manure application
to land and utilization of the Department’s information system.
Finally, the report concluded that although significant data were available from various elements
“was more comprehensive and proactive than in some other provinces. There were some areas that were not addressed in Manitoba’s Regulation and some that were addressed more stringently in other jurisdictions. These areas included [Manitoba Auditor General, 2007]:
• Controls related to the application of manure by operations with multiple species; • Minimum acceptable storage capacity for manure storage facility constructions; •
application;
extent they should have to further efforts in protecting surface and groundwater from
contamination.” Moreover, Conservation had limited consultation with other government
departments and municipalities on common issues related to water quality. Manitoba also
amended The Planning Act to require municipalities to take more control over the siting of
animal management facilities.
The primary attention in Manitoba is to surface water impacts although Manitoba continues to
consider all environmental impacts from animal waste management including air emissions.
162
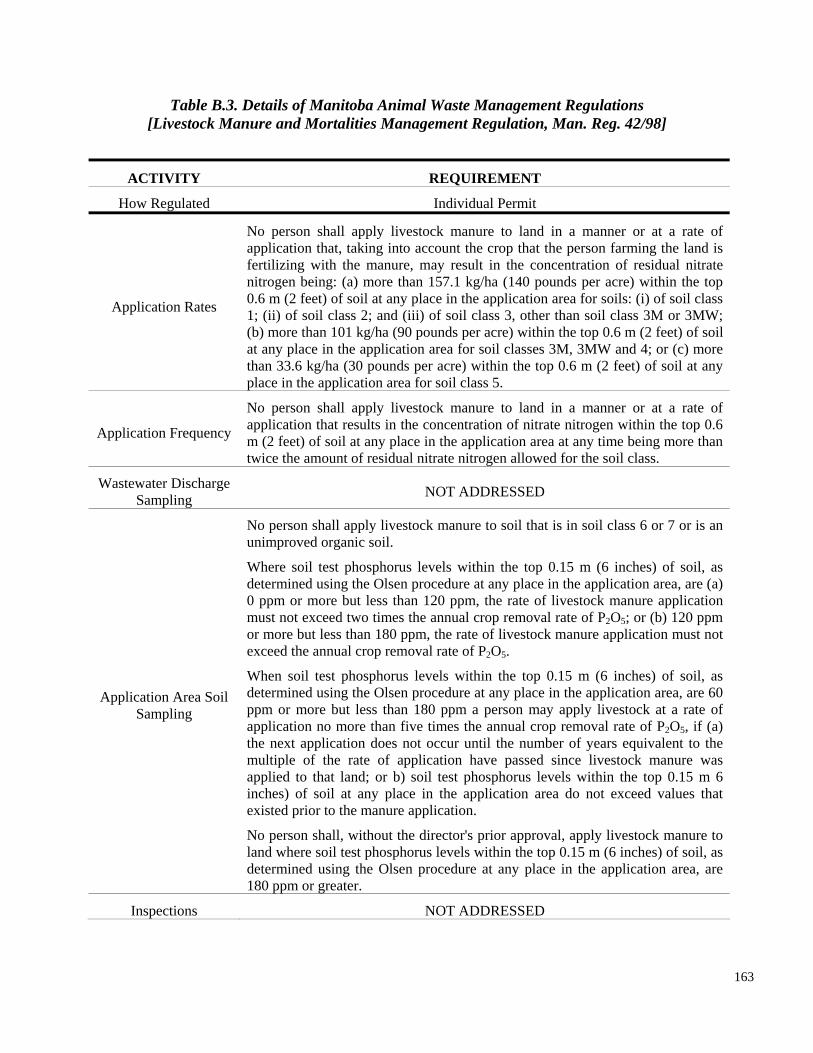
Application Area Soil Sampling
Table B.3. Details of Manitoba Animal Waste Management Regulations [Livestock Manure and Mortalities Management Regulation, Man. Reg. 42/98]
ACTIVITY REQUIREMENT
How Regulated Individual Permit
Application Rates
Application Frequency
Wastewater Discharge Sampling
No person shall apply livestock manure to land in a manner or at a rate of application that, taking into account the crop that the person farming the land is fertilizing with the manure, may result in the concentration of residual nitrate nitrogen being: (a) more than 157.1 kg/ha (140 pounds per acre) within the top 0.6 m (2 feet) of soil at any place in the application area for soils: (i) of soil class 1; (ii) of soil class 2; and (iii) of soil class 3, other than soil class 3M or 3MW; (b) more than 101 kg/ha (90 pounds per acre) within the top 0.6 m (2 feet) of soil at any place in the application area for soil classes 3M, 3MW and 4; or (c) more than 33.6 kg/ha (30 pounds per acre) within the top 0.6 m (2 feet) of soil at any place in the application area for soil class 5.
No person shall apply livestock manure to land in a manner or at a rate of application that results in the concentration of nitrate nitrogen within the top 0.6 m (2 feet) of soil at any place in the application area at any time being more than
determined using the Olsen procedure at any place in the application area, are 60 ppm or more but less than 180 ppm a person may apply livestock at a rate of application no more than five times the annual crop removal rate of P2O5, if (a) the next application does not occur until the number of years equivalent to the multiple of the rate of application have passed since livestock manure was applied to that land; or b) soil test phosphorus levels within the top 0.15 m 6 inches) of soil at any place in the application area do not exceed values that existed prior to the manure application.
No person shall, without the director's prior approval, apply livestock manure to land where soil test phosphorus levels within the top 0.15 m (6 inches) of soil, as determined using the Olsen procedure at any place in the application area, are 180 ppm or greater.
Inspections NOT ADDRESSED
twice the amount of residual nitrate nitrogen allowed for the soil class.
NOT ADDRESSED
No person shall apply livestock manure to soil that is in soil class 6 or 7 or is an unimproved organic soil.
Where soil test phosphorus levels within the top 0.15 m (6 inches) of soil, as determined using the Olsen procedure at any place in the application area, are (a) 0 ppm or more but less than 120 ppm, the rate of livestock manure application must not exceed two times the annual crop removal rate of P2O5; or (b) 120 ppm or more but less than 180 ppm, the rate of livestock manure application must not exceed the annual crop removal rate of P2O5.
When soil test phosphorus levels within the top 0.15 m (6 inches) of soil, as
163
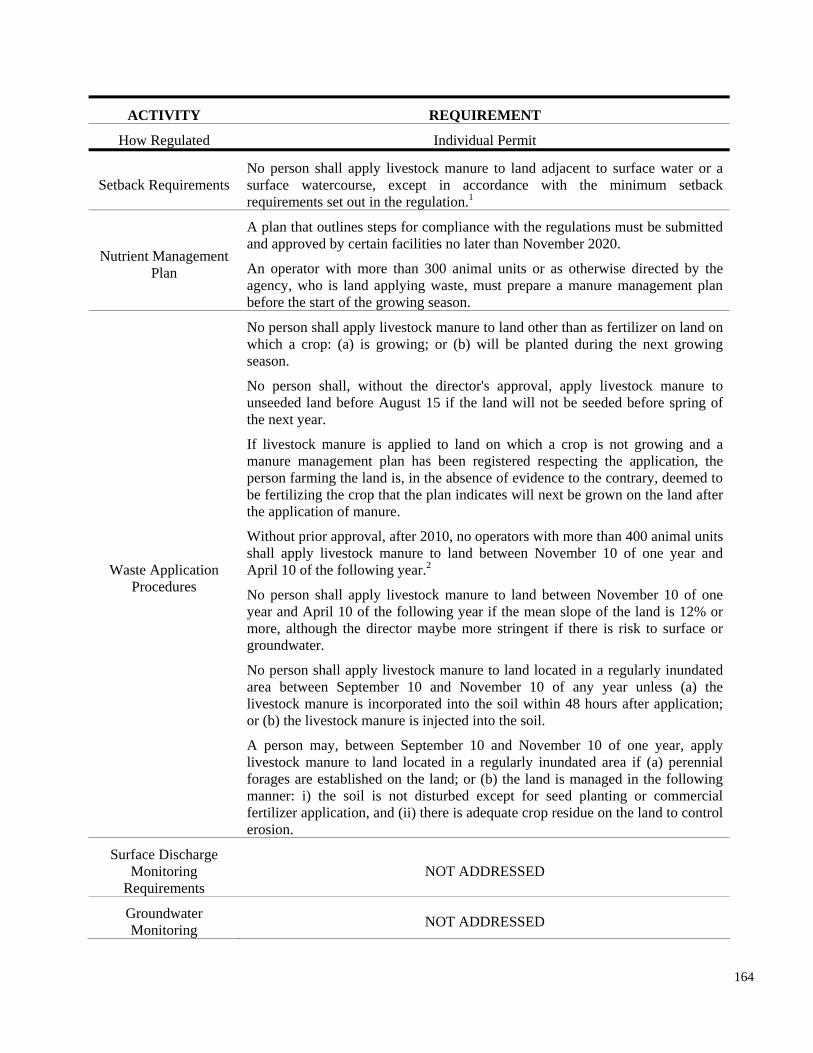
or (b) the livestock manure is injected into the soil.
ACTIVITY REQUIREMENT
How Regulated Individual Permit
No person shall apply livestock manure to land adjacent to surface water or a Setback Requirements surface watercourse, except in accordance with the minimum setback
requirements set out in the regulation.1
Surface Discharge Monitoring NOT ADDRESSED
Requirements
Groundwater NOT ADDRESSEDMonitoring
Nutrient Management Plan
Waste Application Procedures
A plan that outlines steps for compliance with the regulations must be submitted and approved by certain facilities no later than November 2020.
An operator with more than 300 animal units or as otherwise directed by the agency, who is land applying waste, must prepare a manure management plan before the start of the growing season.
No person shall apply livestock manure to land other than as fertilizer on land on which a crop: (a) is growing; or (b) will be planted during the next growing season.
No person shall, without the director's approval, apply livestock manure to unseeded land before August 15 if the land will not be seeded before spring of the next year.
area between September 10 and November 10 of any year unless (a) the livestock manure is incorporated into the soil within 48 hours after application;
If livestock manure is applied to land on which a crop is not growing and a manure management plan has been registered respecting the application, the person farming the land is, in the absence of evidence to the contrary, deemed to be fertilizing the crop that the plan indicates will next be grown on the land after the application of manure.
Without prior approval, after 2010, no operators with more than 400 animal units shall apply livestock manure to land between November 10 of one year and April 10 of the following year.2
No person shall apply livestock manure to land between November 10 of one year and April 10 of the following year if the mean slope of the land is 12% or more, although the director maybe more stringent if there is risk to surface or groundwater.
No person shall apply livestock manure to land located in a regularly inundated
A person may, between September 10 and November 10 of one year, apply livestock manure to land located in a regularly inundated area if (a) perennial forages are established on the land; or (b) the land is managed in the following manner: i) the soil is not disturbed except for seed planting or commercial fertilizer application, and (ii) there is adequate crop residue on the land to control erosion.
164
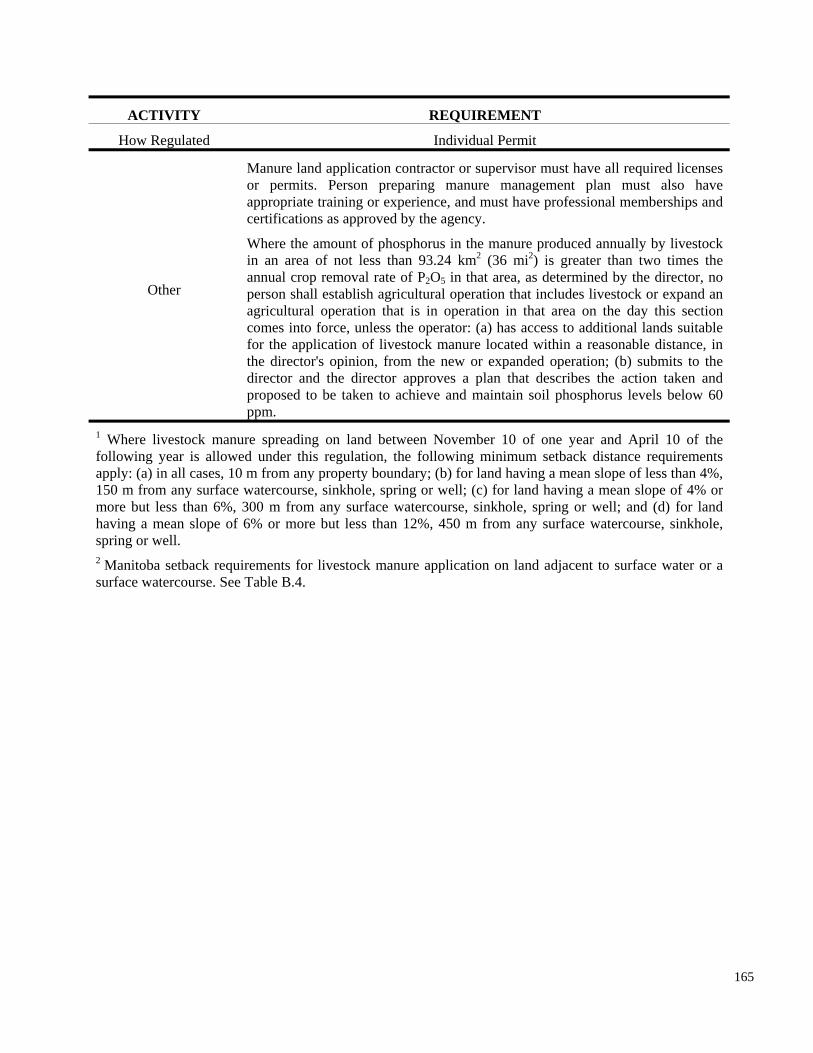
ACTIVITY REQUIREMENT
How Regulated Individual Permit
Manure land application contractor or supervisor must have all required licenses or permits. Person preparing manure management plan must also have appropriate training or experience, and must have professional memberships and certifications as approved by the agency.
Where the amount of phosphorus in the manure produced annually by livestock in an area of not less than 93.24 km2 (36 mi2) is greater than two times the annual crop removal rate of P2O5 in that area, as determined by the director, no
Other person shall establish agricultural operation that includes livestock or expand an agricultural operation that is in operation in that area on the day this section comes into force, unless the operator: (a) has access to additional lands suitable for the application of livestock manure located within a reasonable distance, in the director's opinion, from the new or expanded operation; (b) submits to the director and the director approves a plan that describes the action taken and proposed to be taken to achieve and maintain soil phosphorus levels below 60 ppm.
1 Where livestock manure spreading on land between November 10 of one year and April 10 of the following year is allowed under this regulation, the following minimum setback distance requirements apply: (a) in all cases, 10 m from any property boundary; (b) for land having a mean slope of less than 4%, 150 m from any surface watercourse, sinkhole, spring or well; (c) for land having a mean slope of 4% or more but less than 6%, 300 m from any surface watercourse, sinkhole, spring or well; and (d) for land having a mean slope of 6% or more but less than 12%, 450 m from any surface watercourse, sinkhole, spring or well. 2 Manitoba setback requirements for livestock manure application on land adjacent to surface water or a surface watercourse. See Table B.4.
165
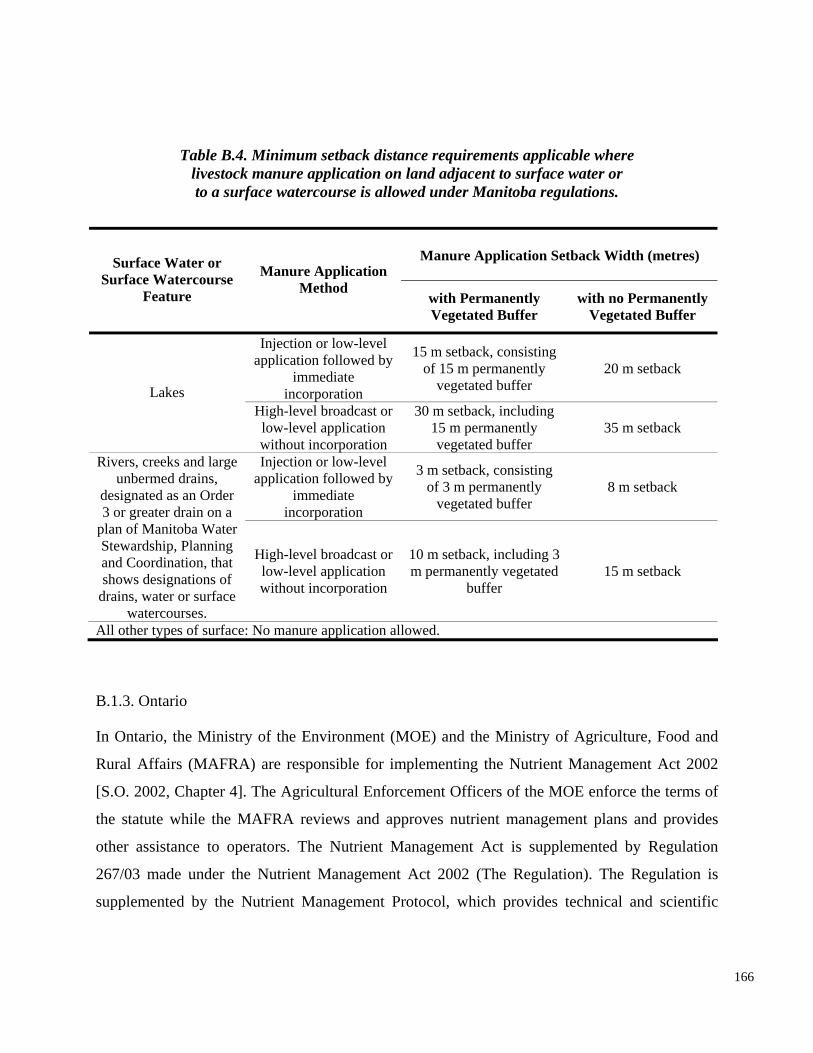
Table B.4. Minimum setback distance requirements applicable where livestock manure application on land adjacent to surface water or to a surface watercourse is allowed under Manitoba regulations.
Manure Application Setback Width (metres)Surface Water or Manure Application
[S.O. 2002, Chapter 4]. The Agricultural Enforcement Officers of the MOE enforce the terms of
the statute while the MAFRA reviews and approves nutrient management plans and provides
other assistance to operators. The Nutrient Management Act is supplemented by Regulation
267/03 made under the Nutrient Management Act 2002 (The Regulation). The Regulation is
supplemented by the Nutrient Management Protocol, which provides technical and scientific
Surface Watercourse Feature Method
with Permanently Vegetated Buffer
with no Permanently Vegetated Buffer
Injection or low-level application followed by
immediate incorporation
15 m setback, consisting of 15 m permanently
vegetated buffer 20 m setback
Lakes High-level broadcast or low-level application without incorporation
30 m setback, including 15 m permanently vegetated buffer
35 m setback
Injection or low-level application followed by
immediate incorporation
3 m setback, consisting of 3 m permanently
vegetated buffer 8 m setback
Rivers, creeks and large unbermed drains,
designated as an Order 3 or greater drain on a
plan of Manitoba Water Stewardship, Planning and Coordination, that shows designations of
drains, water or surface watercourses.
High-level broadcast or low-level application without incorporation
10 m setback, including 3 m permanently vegetated
buffer 15 m setback
All other types of surface: No manure application allowed.
B.1.3. Ontario
In Ontario, the Ministry of the Environment (MOE) and the Ministry of Agriculture, Food and
Rural Affairs (MAFRA) are responsible for implementing the Nutrient Management Act 2002
166
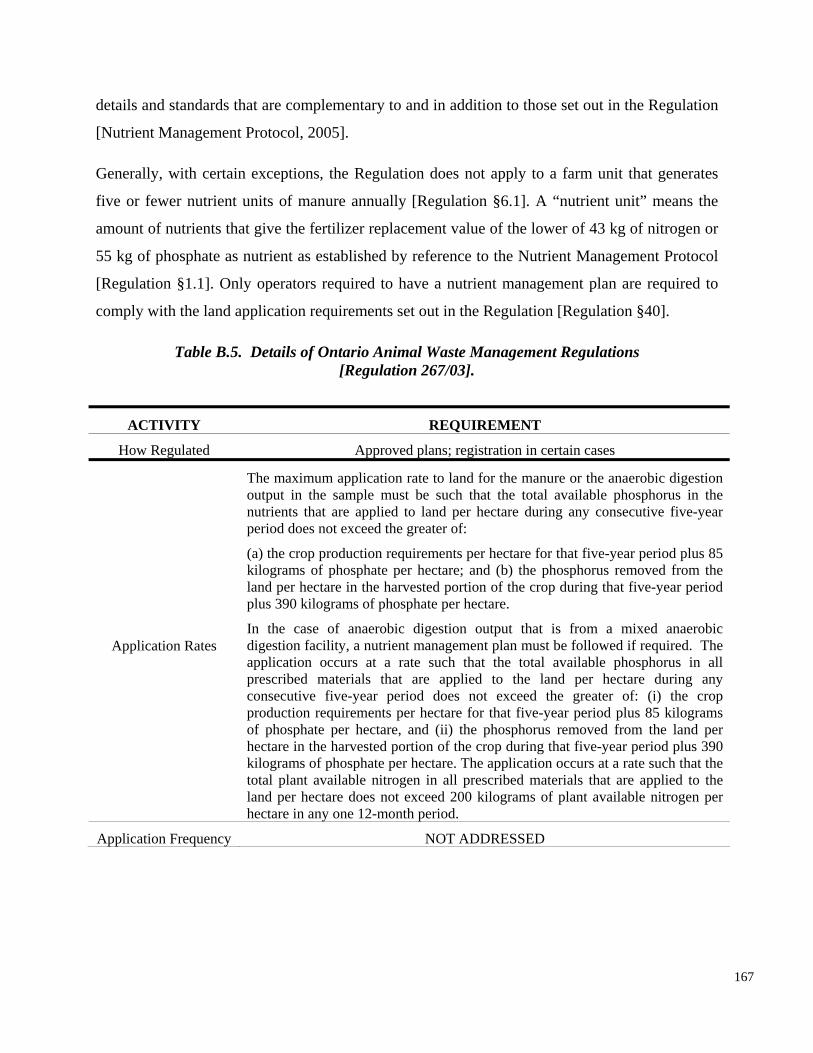
Application Rates
details and standards that are complementary to and in addition to those set out in the Regulation
[Nutrient Management Protocol, 2005].
Generally, with certain exceptions, the Regulation does not apply to a farm unit that generates
five or fewer nutrient units of manure annually [Regulation §6.1]. A “nutrient unit” means the
amount of nutrients that give the fertilizer replacement value of the lower of 43 kg of nitrogen or
55 kg of phosphate as nutrient as established by reference to the Nutrient Management Protocol
Table B.5. Details of Ontario Animal Waste Management Regulations [Regulation 267/03].
REQUIREMENT
Approved plans; registration in certain cases
The maximum application rate to land for the manure or the anaerobic digestion output in the sample must be such that the total available phosphorus in the nutrients that are applied to land per hectare during any consecutive five-year period does not exceed the greater of:
(a) the crop production requirements per hectare for that five-year period plus 85 kilograms of phosphate per hectare; and (b) the phosphorus removed from the land per hectare in the harvested portion of the crop during that five-year period plus 390 kilograms of phosphate per hectare.
In the case of anaerobic digestion output that is from a mixed anaerobic digestion facility, a nutrient management plan must be followed if required. The application occurs at a rate such that the total available phosphorus in all prescribed materials that are applied to the land per hectare during any
[Regulation §1.1]. Only operators required to have a nutrient management plan are required to
comply with the land application requirements set out in the Regulation [Regulation §40].
ACTIVITY
How Regulated
consecutive five-year period does not exceed the greater of: (i) the crop production requirements per hectare for that five-year period plus 85 kilograms of phosphate per hectare, and (ii) the phosphorus removed from the land per hectare in the harvested portion of the crop during that five-year period plus 390 kilograms of phosphate per hectare. The application occurs at a rate such that the total plant available nitrogen in all prescribed materials that are applied to the land per hectare does not exceed 200 kilograms of plant available nitrogen per hectare in any one 12-month period.
Application Frequency NOT ADDRESSED
167
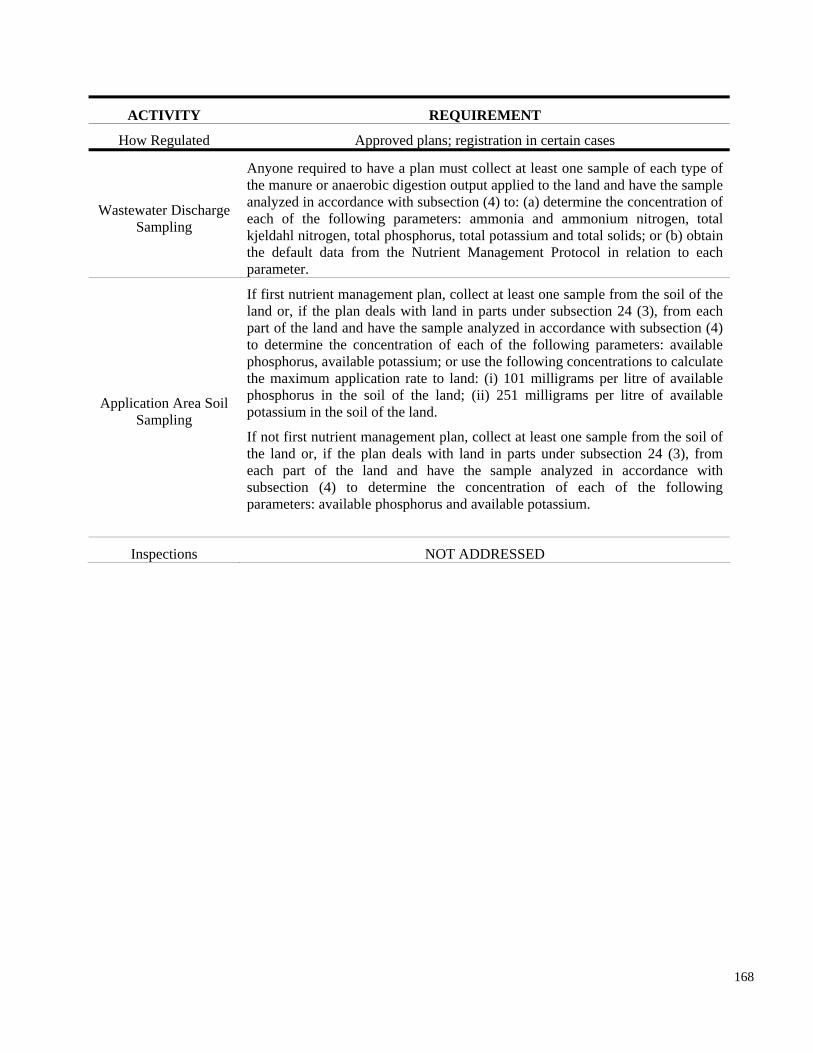
ACTIVITY REQUIREMENT
How Regulated Approved plans; registration in certain cases
Wastewater Discharge Sampling
Anyone required to have a plan must collect at least one sample of each type of the manure or anaerobic digestion output applied to the land and have the sample analyzed in accordance with subsection (4) to: (a) determine the concentration of each of the following parameters: ammonia and ammonium nitrogen, total kjeldahl nitrogen, total phosphorus, total potassium and total solids; or (b) obtain the default data from the Nutrient Management Protocol in relation to each parameter.
Application Area Soil Sampling
If first nutrient management plan, collect at least one sample from the soil of the land or, if the plan deals with land in parts under subsection 24 (3), from each part of the land and have the sample analyzed in accordance with subsection (4) to determine the concentration of each of the following parameters: available phosphorus, available potassium; or use the following concentrations to calculate the maximum application rate to land: (i) 101 milligrams per litre of available phosphorus in the soil of the land; (ii) 251 milligrams per litre of available potassium in the soil of the land.
If not first nutrient management plan, collect at least one sample from the soil of the land or, if the plan deals with land in parts under subsection 24 (3), from each part of the land and have the sample analyzed in accordance with subsection (4) to determine the concentration of each of the following parameters: available phosphorus and available potassium.
Inspections NOT ADDRESSED
168
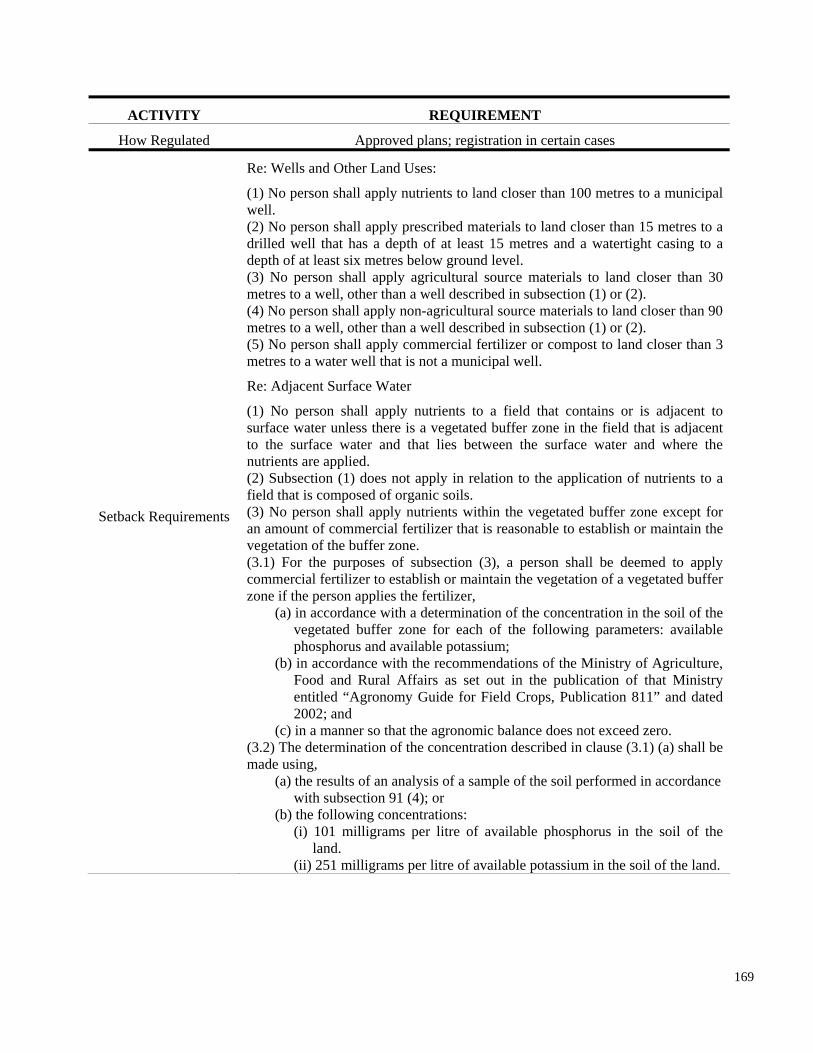
2002; and
ACTIVITY REQUIREMENT
How Regulated Approved plans; registration in certain cases
Setback Requirements
Re: Wells and Other Land Uses:
(1) No person shall apply nutrients to land closer than 100 metres to a municipal well. (2) No person shall apply prescribed materials to land closer than 15 metres to a drilled well that has a depth of at least 15 metres and a watertight casing to a depth of at least six metres below ground level. (3) No person shall apply agricultural source materials to land closer than 30
metres to a water well that is not a municipal well.
to the surface water and that lies between the surface water and where the nutrients are applied. (2) Subsection (1) does not apply in relation to the application of nutrients to a field that is composed of organic soils. (3) No person shall apply nutrients within the vegetated buffer zone except for an amount of commercial fertilizer that is reasonable to establish or maintain the vegetation of the buffer zone. (3.1) For the purposes of subsection (3), a person shall be deemed to apply commercial fertilizer to establish or maintain the vegetation of a vegetated buffer zone if the person applies the fertilizer,
(a) in accordance with a determination of the concentration in the soil of the vegetated buffer zone for each of the following parameters: available phosphorus and available potassium;
(b) in accordance with the recommendations of the Ministry of Agriculture, Food and Rural Affairs as set out in the publication of that Ministry
metres to a well, other than a well described in subsection (1) or (2). (4) No person shall apply non-agricultural source materials to land closer than 90 metres to a well, other than a well described in subsection (1) or (2). (5) No person shall apply commercial fertilizer or compost to land closer than 3
Re: Adjacent Surface Water
(1) No person shall apply nutrients to a field that contains or is adjacent to surface water unless there is a vegetated buffer zone in the field that is adjacent
entitled “Agronomy Guide for Field Crops, Publication 811” and dated
(c) in a manner so that the agronomic balance does not exceed zero. (3.2) The determination of the concentration described in clause (3.1) (a) shall be made using,
(a) the results of an analysis of a sample of the soil performed in accordance with subsection 91 (4); or
(b) the following concentrations: (i) 101 milligrams per litre of available phosphorus in the soil of the
land. (ii) 251 milligrams per litre of available potassium in the soil of the land.
169
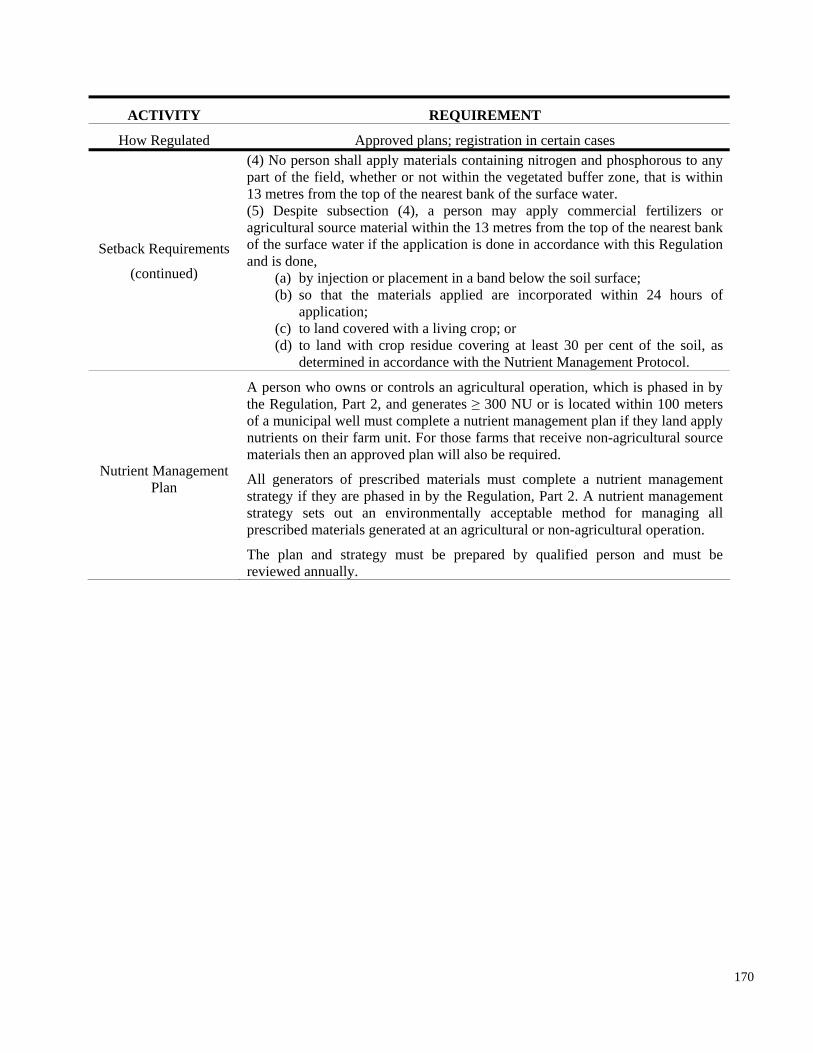
ACTIVITY REQUIREMENT
How Regulated Approved plans; registration in certain cases
Setback Requirements
(continued)
Nutrient Management Plan
(4) No person shall apply materials containing nitrogen and phosphorous to any part of the field, whether or not within the vegetated buffer zone, that is within 13 metres from the top of the nearest bank of the surface water. (5) Despite subsection (4), a person may apply commercial fertilizers or agricultural source material within the 13 metres from the top of the nearest bank of the surface water if the application is done in accordance with this Regulation and is done,
(a) by injection or placement in a band below the soil surface; (b) so that the materials applied are incorporated within 24 hours of
application; (c) to land covered with a living crop; or (d) to land with crop residue covering at least 30 per cent of the soil, as
determined in accordance with the Nutrient Management Protocol.
A person who owns or controls an agricultural operation, which is phased in by the Regulation, Part 2, and generates ≥ 300 NU or is located within 100 meters of a municipal well must complete a nutrient management plan if they land apply nutrients on their farm unit. For those farms that receive non-agricultural source materials then an approved plan will also be required.
All generators of prescribed materials must complete a nutrient management strategy if they are phased in by the Regulation, Part 2. A nutrient management strategy sets out an environmentally acceptable method for managing all prescribed materials generated at an agricultural or non-agricultural operation.
The plan and strategy must be prepared by qualified person and must be reviewed annually.
170
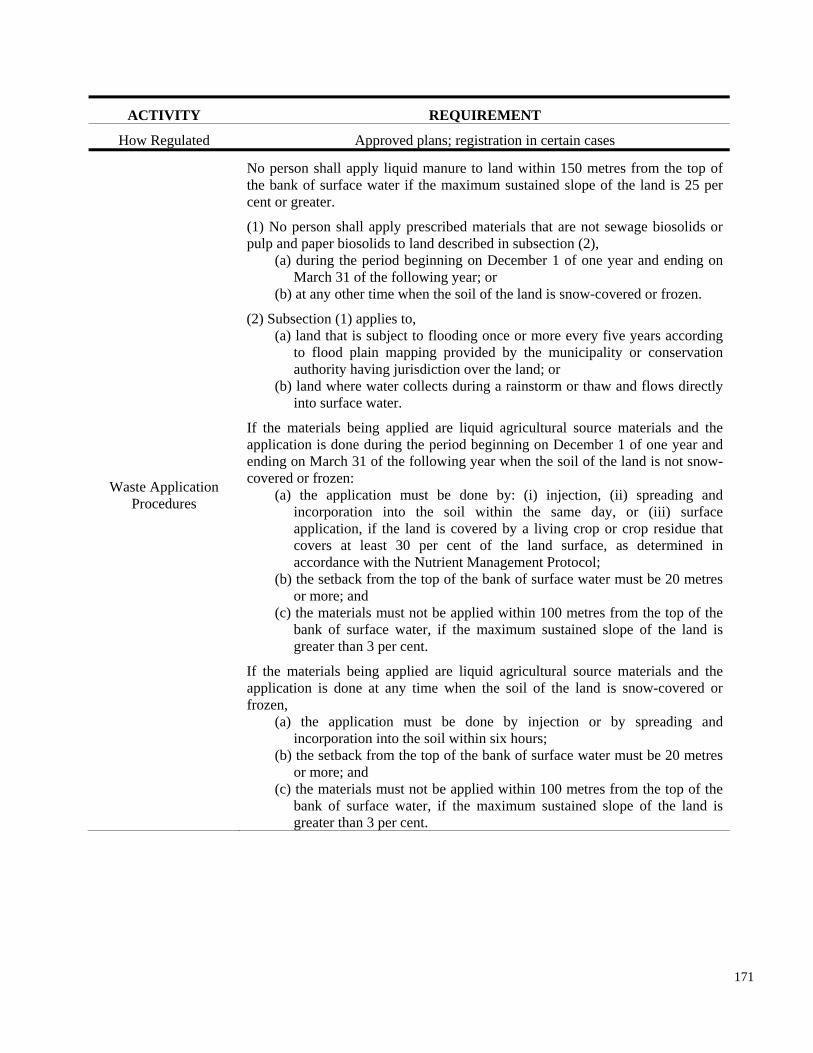
frozen,
ACTIVITY REQUIREMENT
How Regulated Approved plans; registration in certain cases
Waste Application Procedures
No person shall apply liquid manure to land within 150 metres from the top of the bank of surface water if the maximum sustained slope of the land is 25 per cent or greater.
(1) No person shall apply prescribed materials that are not sewage biosolids or pulp and paper biosolids to land described in subsection (2),
(a) during the period beginning on December 1 of one year and ending on March 31 of the following year; or
authority having jurisdiction over the land; or
application is done during the period beginning on December 1 of one year and ending on March 31 of the following year when the soil of the land is not snow-covered or frozen:
(a) the application must be done by: (i) injection, (ii) spreading and incorporation into the soil within the same day, or (iii) surface application, if the land is covered by a living crop or crop residue that covers at least 30 per cent of the land surface, as determined in accordance with the Nutrient Management Protocol;
(b) the setback from the top of the bank of surface water must be 20 metres or more; and
(c) the materials must not be applied within 100 metres from the top of the bank of surface water, if the maximum sustained slope of the land is greater than 3 per cent.
If the materials being applied are liquid agricultural source materials and the
(b) at any other time when the soil of the land is snow-covered or frozen.
(2) Subsection (1) applies to, (a) land that is subject to flooding once or more every five years according
to flood plain mapping provided by the municipality or conservation
(b) land where water collects during a rainstorm or thaw and flows directly into surface water.
If the materials being applied are liquid agricultural source materials and the
application is done at any time when the soil of the land is snow-covered or
(a) the application must be done by injection or by spreading and incorporation into the soil within six hours;
(b) the setback from the top of the bank of surface water must be 20 metres or more; and
(c) the materials must not be applied within 100 metres from the top of the bank of surface water, if the maximum sustained slope of the land is greater than 3 per cent.
171
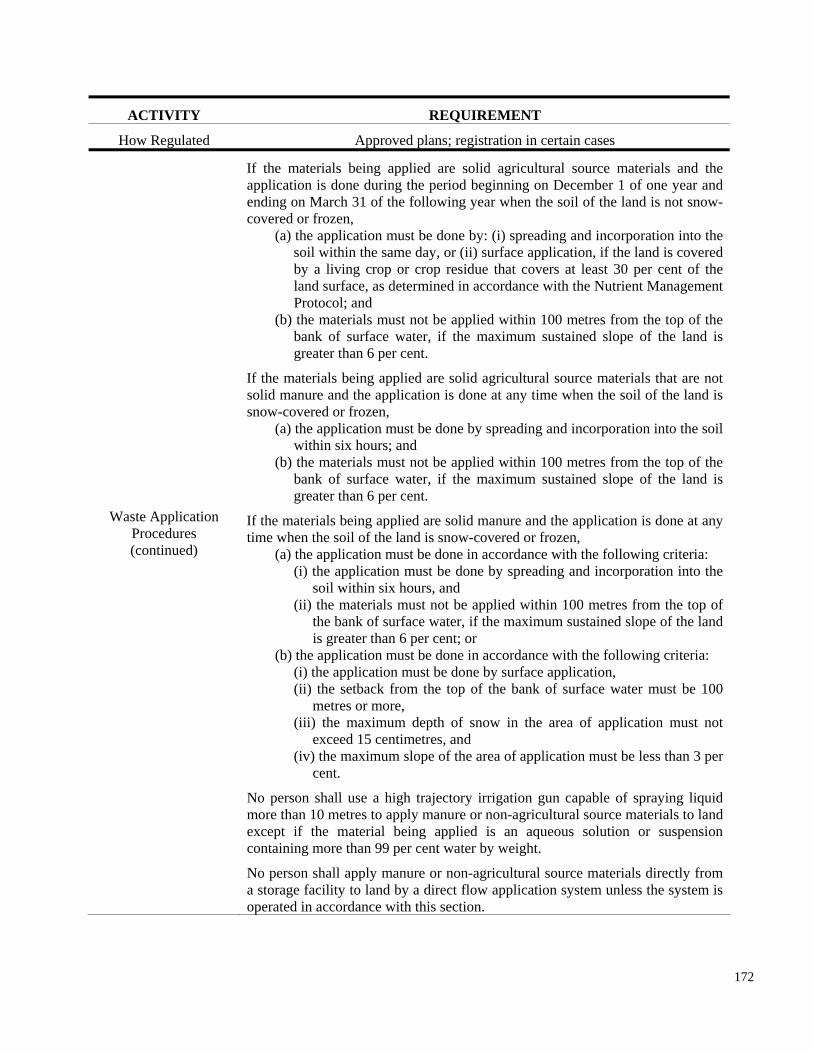
ACTIVITY REQUIREMENT
How Regulated Approved plans; registration in certain cases
Waste Application Procedures (continued)
If the materials being applied are solid agricultural source materials and the application is done during the period beginning on December 1 of one year and ending on March 31 of the following year when the soil of the land is not snow-covered or frozen,
(a) the application must be done by: (i) spreading and incorporation into the soil within the same day, or (ii) surface application, if the land is covered by a living crop or crop residue that covers at least 30 per cent of the
(a) the application must be done by spreading and incorporation into the soil within six hours; and
(b) the materials must not be applied within 100 metres from the top of the bank of surface water, if the maximum sustained slope of the land is greater than 6 per cent.
If the materials being applied are solid manure and the application is done at any time when the soil of the land is snow-covered or frozen,
(a) the application must be done in accordance with the following criteria: (i) the application must be done by spreading and incorporation into the
soil within six hours, and (ii) the materials must not be applied within 100 metres from the top of
the bank of surface water, if the maximum sustained slope of the land is greater than 6 per cent; or
(b) the application must be done in accordance with the following criteria: (i) the application must be done by surface application,
land surface, as determined in accordance with the Nutrient Management Protocol; and
(b) the materials must not be applied within 100 metres from the top of the bank of surface water, if the maximum sustained slope of the land is greater than 6 per cent.
If the materials being applied are solid agricultural source materials that are not solid manure and the application is done at any time when the soil of the land is snow-covered or frozen,
(ii) the setback from the top of the bank of surface water must be 100 metres or more,
(iii) the maximum depth of snow in the area of application must not exceed 15 centimetres, and
(iv) the maximum slope of the area of application must be less than 3 per cent.
No person shall use a high trajectory irrigation gun capable of spraying liquid more than 10 metres to apply manure or non-agricultural source materials to land except if the material being applied is an aqueous solution or suspension containing more than 99 per cent water by weight.
No person shall apply manure or non-agricultural source materials directly from a storage facility to land by a direct flow application system unless the system is operated in accordance with this section.
172
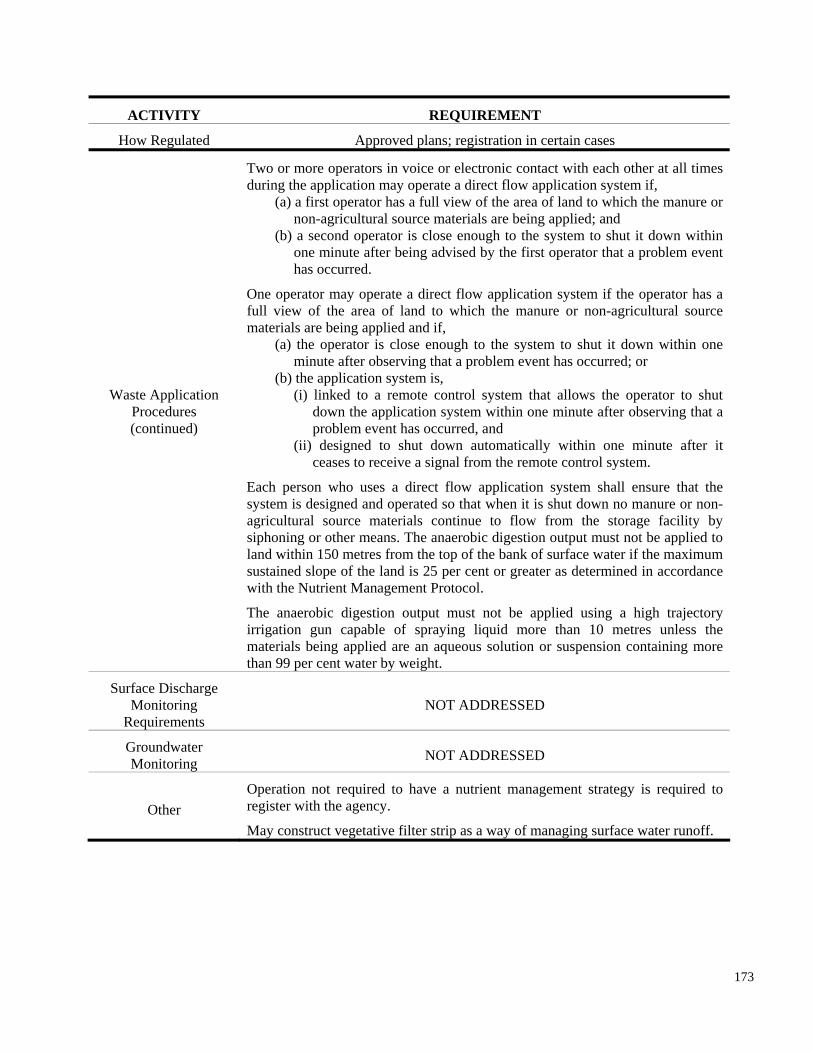
ACTIVITY REQUIREMENT
How Regulated Approved plans; registration in certain cases
Waste Application Procedures (continued)
NOT ADDRESSED
Two or more operators in voice or electronic contact with each other at all times during the application may operate a direct flow application system if,
(a) a first operator has a full view of the area of land to which the manure or non-agricultural source materials are being applied; and
(b) a second operator is close enough to the system to shut it down within one minute after being advised by the first operator that a problem event has occurred.
One operator may operate a direct flow application system if the operator has a full view of the area of land to which the manure or non-agricultural source materials are being applied and if,
(a) the operator is close enough to the system to shut it down within one minute after observing that a problem event has occurred; or
(b) the application system is, (i) linked to a remote control system that allows the operator to shut
down the application system within one minute after observing that a problem event has occurred, and
(ii) designed to shut down automatically within one minute after it ceases to receive a signal from the remote control system.
Each person who uses a direct flow application system shall ensure that the system is designed and operated so that when it is shut down no manure or non-agricultural source materials continue to flow from the storage facility by siphoning or other means. The anaerobic digestion output must not be applied to land within 150 metres from the top of the bank of surface water if the maximum sustained slope of the land is 25 per cent or greater as determined in accordance with the Nutrient Management Protocol.
The anaerobic digestion output must not be applied using a high trajectory irrigation gun capable of spraying liquid more than 10 metres unless the materials being applied are an aqueous solution or suspension containing more than 99 per cent water by weight.
Surface Discharge Monitoring
Requirements NOT ADDRESSED
Groundwater Monitoring
Operation not required to have a nutrient management strategy is required to register with the agency. Other May construct vegetative filter strip as a way of managing surface water runoff.
173
B.1.4. Quebec
Since 2005, the Ministry of Sustainable Development, Environment and Parks enforces the
Agricultural Operations Regulation, a regulation under The Environment Quality Act. Generally,
the regulations address subsurface water by stating:
“The owner of a lot as well as any person to whom the owner has transferred the custody, control or use of that lot shall take the measures necessary to prevent livestock waste from entering the surface or subsurface water.
Any owner or person who has knowledge of the discharge, deposit, storage or spreading of livestock waste on that lot that contravenes this Regulation shall take the measures required to terminate such discharge, deposit, storage or spreading and to immediately remove such substances from the lot and, if necessary, restore it to its previous condition.”
[Agricultural Regulation § 5]
knowledge of the time” [Agricultural Regulation § 55].
The regulation also specifically provides for an update: “The Minister of Sustainable
Development, Environment and Parks shall, no later than 15 June 2005, and thereafter every 5
years, report to the Government on the implementation of this Regulation, in particular on the
necessity of changing the manure management standards based on the scientific and technical
174
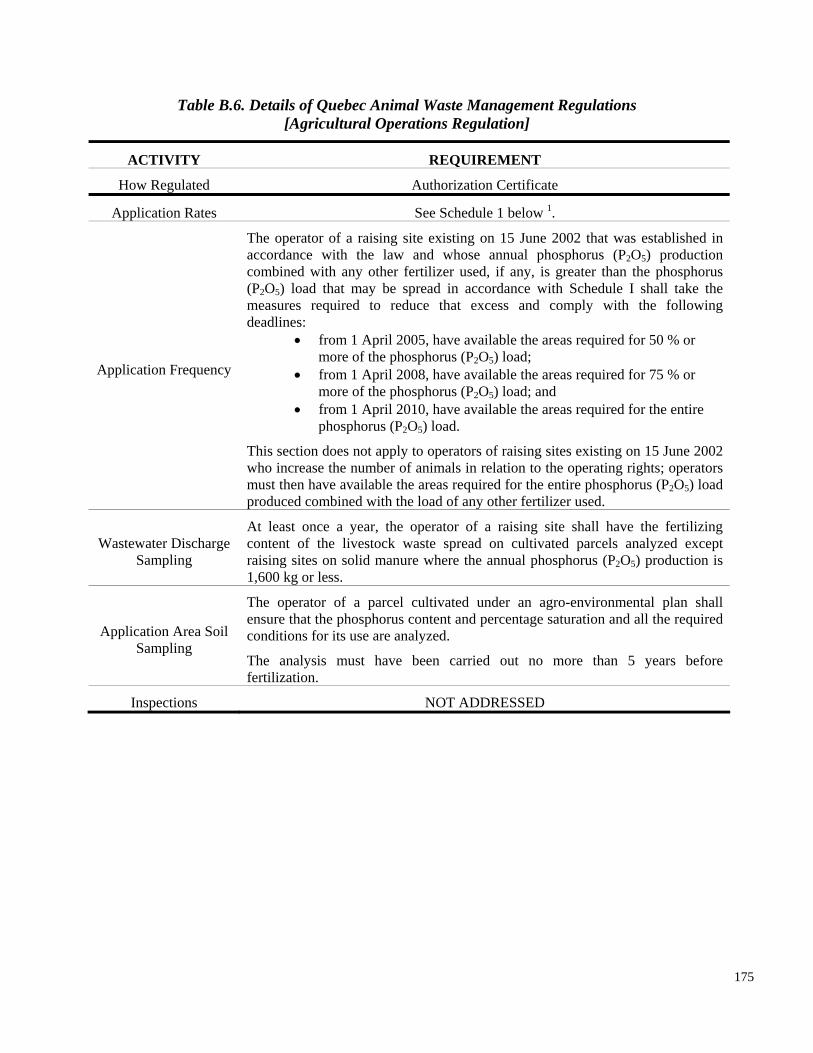
Table B.6. Details of Quebec Animal Waste Management Regulations [Agricultural Operations Regulation]
ACTIVITY REQUIREMENT
How Regulated Authorization Certificate
Application Rates See Schedule 1 below 1.
Application Frequency
The operator of a raising site existing on 15 June 2002 that was established in accordance with the law and whose annual phosphorus (P2O5) production combined with any other fertilizer used, if any, is greater than the phosphorus (P2O5) load that may be spread in accordance with Schedule I shall take the measures required to reduce that excess and comply with the following deadlines:
• from 1 April 2005, have available the areas required for 50 % or more of the phosphorus (P2O5) load;
• from 1 April 2008, have available the areas required for 75 % or more of the phosphorus (P2O5) load; and
• from 1 April 2010, have available the areas required for the entire phosphorus (P2O5) load.
This section does not apply to operators of raising sites existing on 15 June 2002 who increase the number of animals in relation to the operating rights; operators must then have available the areas required for the entire phosphorus (P2O5) load produced combined with the load of any other fertilizer used.
Wastewater Discharge Sampling
At least once a year, the operator of a raising site shall have the fertilizing content of the livestock waste spread on cultivated parcels analyzed except raising sites on solid manure where the annual phosphorus (P2O5) production is 1,600 kg or less.
Application Area Soil Sampling
The operator of a parcel cultivated under an agro-environmental plan shall ensure that the phosphorus content and percentage saturation and all the required conditions for its use are analyzed.
The analysis must have been carried out no more than 5 years before fertilization.
Inspections NOT ADDRESSED
175
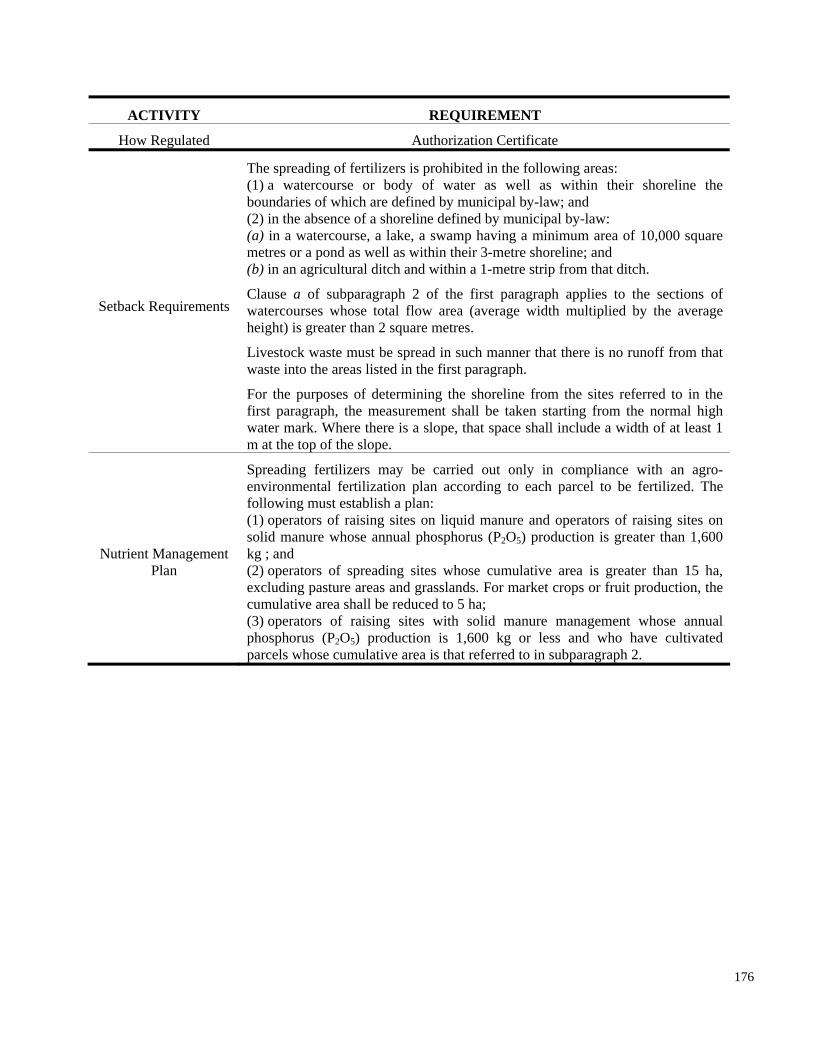
ACTIVITY REQUIREMENT
How Regulated Authorization Certificate
m at the top of the slope.
Spreading fertilizers may be carried out only in compliance with an agroenvironmental fertilization plan according to each parcel to be fertilized. The following must establish a plan: (1) operators of raising sites on liquid manure and operators of raising sites on solid manure whose annual phosphorus (P2O5kg ; and (2) operators of spreading sites whose cumulative area is greater than 15 ha, excluding pasture areas and grasslands. For market crops or fruit production, the cumulative area shall be reduced to 5 ha; (3) operators of raising sites with solid manure management whose annual phosphorus (P2O5) production is 1,600 kg or less and who have cultivated parcels whose cumulative area is that referred to in subparagraph 2.
Setback Requirements
Nutrient Management Plan
The spreading of fertilizers is prohibited in the following areas: (1) a watercourse or body of water as well as within their shoreline the boundaries of which are defined by municipal by-law; and (2) in the absence of a shoreline defined by municipal by-law: (a) in a watercourse, a lake, a swamp having a minimum area of 10,000 square metres or a pond as well as within their 3-metre shoreline; and (b) in an agricultural ditch and within a 1-metre strip from that ditch.
Clause a of subparagraph 2 of the first paragraph applies to the sections of watercourses whose total flow area (average width multiplied by the average height) is greater than 2 square metres.
Livestock waste must be spread in such manner that there is no runoff from that waste into the areas listed in the first paragraph.
For the purposes of determining the shoreline from the sites referred to in the first paragraph, the measurement shall be taken starting from the normal high water mark. Where there is a slope, that space shall include a width of at least 1
) production is greater than 1,600
176
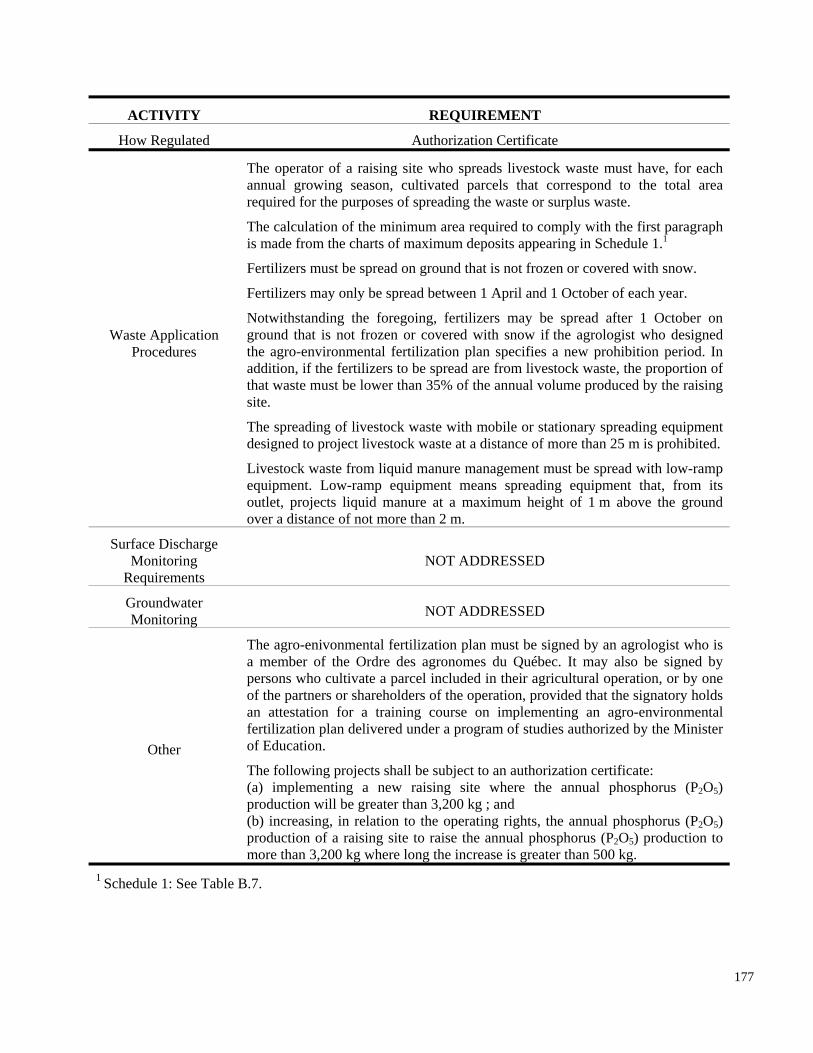
over a distance of not more than 2 m.
Surface Discharge Monitoring
Requirements NOT ADDRESSED
Groundwater Monitoring NOT ADDRESSED
The agro-enivonmental fertilization plan must be signed by an agrologist who is a member of the Ordre des agronomes du Québec. It may also be signed by persons who cultivate a parcel included in their agricultural operation, or by one
of Education.
ACTIVITY REQUIREMENT
How Regulated Authorization Certificate
1 Schedule 1: See Table B.7.
Waste Application Procedures
Other
The operator of a raising site who spreads livestock waste must have, for each annual growing season, cultivated parcels that correspond to the total area required for the purposes of spreading the waste or surplus waste.
The calculation of the minimum area required to comply with the first paragraph is made from the charts of maximum deposits appearing in Schedule 1.1
Fertilizers must be spread on ground that is not frozen or covered with snow.
Fertilizers may only be spread between 1 April and 1 October of each year.
Notwithstanding the foregoing, fertilizers may be spread after 1 October on ground that is not frozen or covered with snow if the agrologist who designed the agro-environmental fertilization plan specifies a new prohibition period. In addition, if the fertilizers to be spread are from livestock waste, the proportion of that waste must be lower than 35% of the annual volume produced by the raising site.
The spreading of livestock waste with mobile or stationary spreading equipment designed to project livestock waste at a distance of more than 25 m is prohibited.
Livestock waste from liquid manure management must be spread with low-ramp equipment. Low-ramp equipment means spreading equipment that, from its outlet, projects liquid manure at a maximum height of 1 m above the ground
of the partners or shareholders of the operation, provided that the signatory holds an attestation for a training course on implementing an agro-environmental fertilization plan delivered under a program of studies authorized by the Minister
The following projects shall be subject to an authorization certificate: (a) implementing a new raising site where the annual phosphorus (P2O5) production will be greater than 3,200 kg ; and (b) increasing, in relation to the operating rights, the annual phosphorus (P2O5) production of a raising site to raise the annual phosphorus (P2O5) production to more than 3,200 kg where long the increase is greater than 500 kg.
177
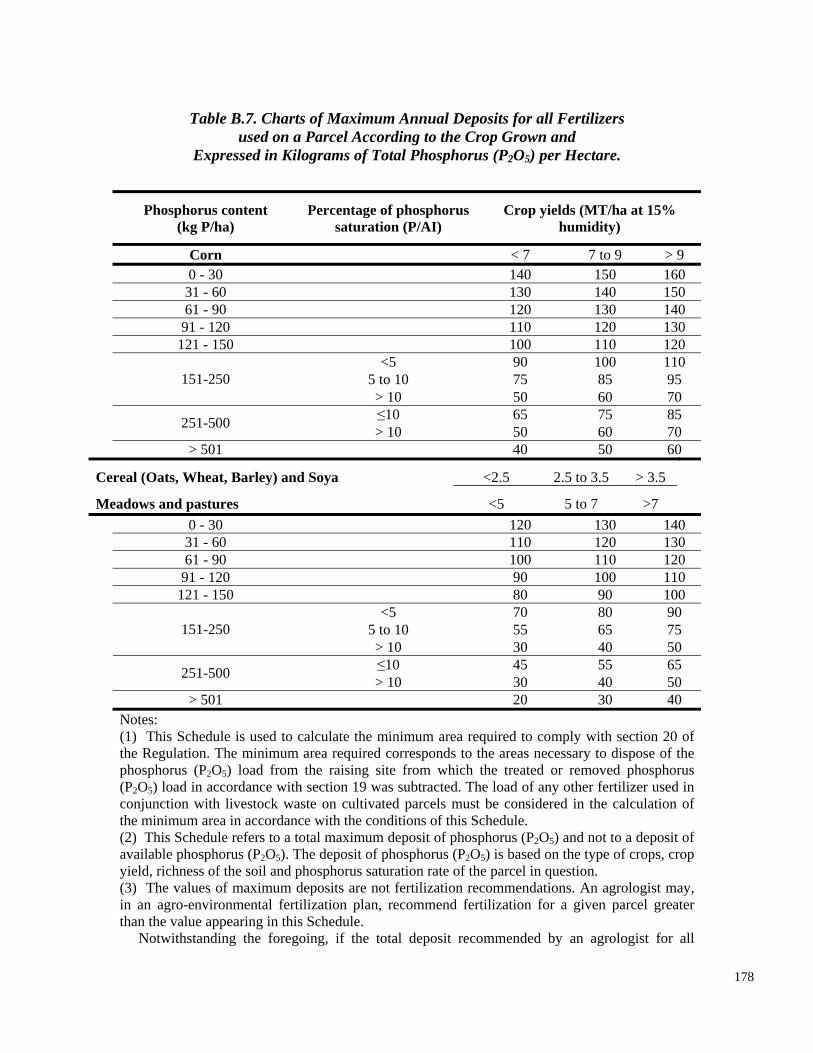
Table B.7. Charts of Maximum Annual Deposits for all Fertilizers used on a Parcel According to the Crop Grown and
Expressed in Kilograms of Total Phosphorus (P2O5) per Hectare.
Phosphorus content Percentage of phosphorus Crop yields (MT/ha at 15% (kg P/ha) saturation (P/AI) humidity)
Corn < 7 7 to 9 > 9 0 - 30 140 150 160
31 - 60 130 140 150 61 - 90 120 130 140
91 - 120 110 120 130 121 - 150 100 110 120
<5 90 100 110 5 to 10 75 85 95151-250 > 10 50 60 70 ≤10 65 75 85251-500 > 10 50 60 70
> 501 40 50 60
Cereal (Oats, Wheat, Barley) and Soya <2.5 2.5 to 3.5 > 3.5
Meadows and pastures <5 5 to 7 >7 0 - 30 120 130 140
31 - 60 110 120 130 61 - 90 100 110 120
91 - 120 90 100 110 121 - 150 80 90 100
<5 70 80 90 5 to 10 55 65 75151-250 > 10 30 40 50 ≤10 45 55 65251-500 > 10 30 40 50
> 501 20 30 40 Notes: (1) This Schedule is used to calculate the minimum area required to comply with section 20 of the Regulation. The minimum area required corresponds to the areas necessary to dispose of the phosphorus (P2O5) load from the raising site from which the treated or removed phosphorus (P2O5) load in accordance with section 19 was subtracted. The load of any other fertilizer used in conjunction with livestock waste on cultivated parcels must be considered in the calculation of the minimum area in accordance with the conditions of this Schedule. (2) This Schedule refers to a total maximum deposit of phosphorus (P2O5) and not to a deposit of available phosphorus (P2O5). The deposit of phosphorus (P2O5) is based on the type of crops, crop yield, richness of the soil and phosphorus saturation rate of the parcel in question. (3) The values of maximum deposits are not fertilization recommendations. An agrologist may, in an agro-environmental fertilization plan, recommend fertilization for a given parcel greater than the value appearing in this Schedule.
Notwithstanding the foregoing, if the total deposit recommended by an agrologist for all
178
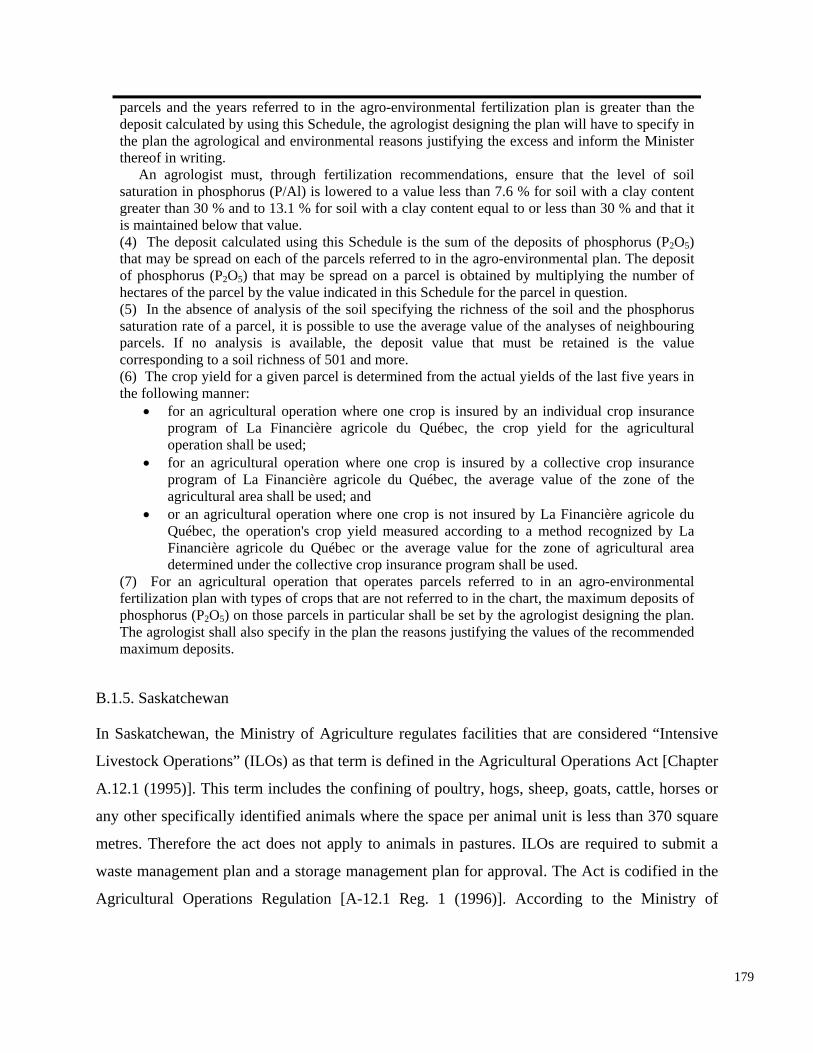
maximum deposits.
parcels and the years referred to in the agro-environmental fertilization plan is greater than the deposit calculated by using this Schedule, the agrologist designing the plan will have to specify in the plan the agrological and environmental reasons justifying the excess and inform the Minister thereof in writing.
An agrologist must, through fertilization recommendations, ensure that the level of soil saturation in phosphorus (P/Al) is lowered to a value less than 7.6 % for soil with a clay content greater than 30 % and to 13.1 % for soil with a clay content equal to or less than 30 % and that it is maintained below that value. (4) The deposit calculated using this Schedule is the sum of the deposits of phosphorus (P2O5) that may be spread on each of the parcels referred to in the agro-environmental plan. The deposit of phosphorus (P2O5) that may be spread on a parcel is obtained by multiplying the number of hectares of the parcel by the value indicated in this Schedule for the parcel in question.
operation shall be used; • for an agricultural operation where one crop is insured by a collective crop insurance
program of La Financière agricole du Québec, the average value of the zone of the agricultural area shall be used; and
• or an agricultural operation where one crop is not insured by La Financière agricole du Québec, the operation's crop yield measured according to a method recognized by La Financière agricole du Québec or the average value for the zone of agricultural area determined under the collective crop insurance program shall be used.
(7) For an agricultural operation that operates parcels referred to in an agro-environmental fertilization plan with types of crops that are not referred to in the chart, the maximum deposits of phosphorus (P2O5) on those parcels in particular shall be set by the agrologist designing the plan. The agrologist shall also specify in the plan the reasons justifying the values of the recommended
(5) In the absence of analysis of the soil specifying the richness of the soil and the phosphorus saturation rate of a parcel, it is possible to use the average value of the analyses of neighbouring parcels. If no analysis is available, the deposit value that must be retained is the value corresponding to a soil richness of 501 and more. (6) The crop yield for a given parcel is determined from the actual yields of the last five years in the following manner: • for an agricultural operation where one crop is insured by an individual crop insurance
program of La Financière agricole du Québec, the crop yield for the agricultural
B.1.5. Saskatchewan
In Saskatchewan, the Ministry of Agriculture regulates facilities that are considered “Intensive
Livestock Operations” (ILOs) as that term is defined in the Agricultural Operations Act [Chapter
A.12.1 (1995)]. This term includes the confining of poultry, hogs, sheep, goats, cattle, horses or
any other specifically identified animals where the space per animal unit is less than 370 square
metres. Therefore the act does not apply to animals in pastures. ILOs are required to submit a
waste management plan and a storage management plan for approval. The Act is codified in the
Agricultural Operations Regulation [A-12.1 Reg. 1 (1996)]. According to the Ministry of
179
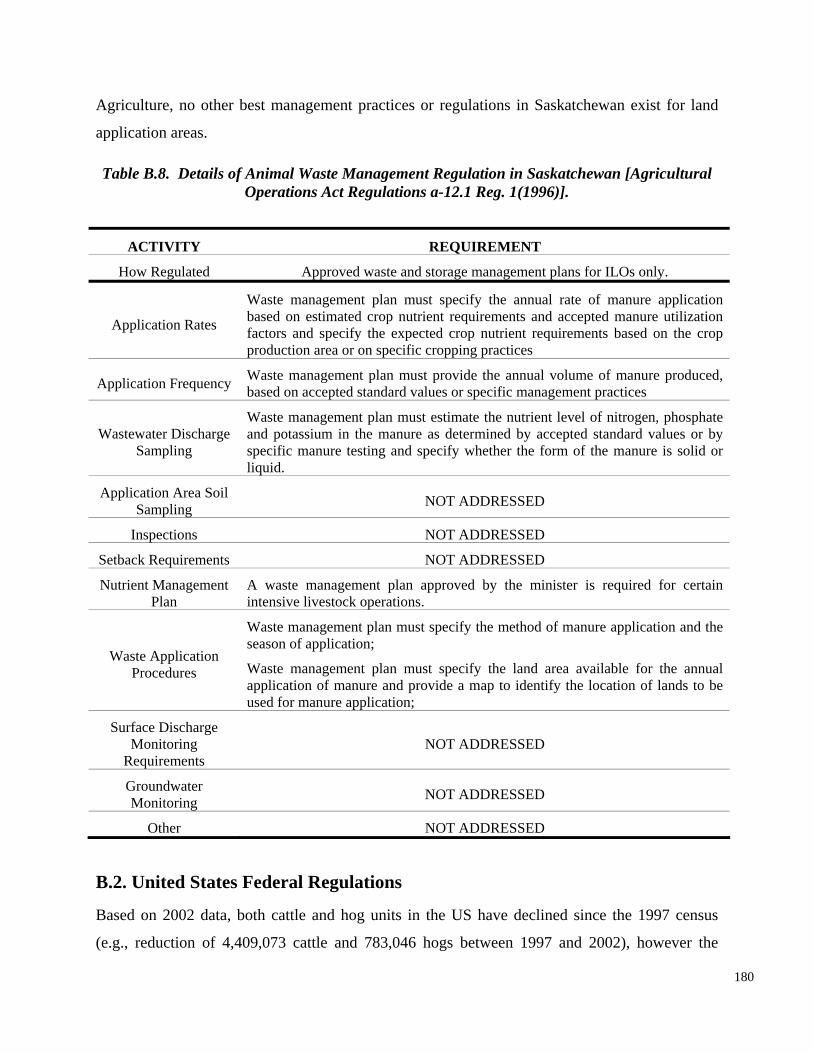
Agriculture, no other best management practices or regulations in Saskatchewan exist for land
application areas.
Table B.8. Details of Animal Waste Management Regulation in Saskatchewan [Agricultural Operations Act Regulations a-12.1 Reg. 1(1996)].
ACTIVITY REQUIREMENT
How Regulated Approved waste and storage management plans for ILOs only.
Wastewater Discharge Sampling
Waste management plan must estimate the nutrient level of nitrogen, phosphate and potassium in the manure as determined by accepted standard values or by specific manure testing and specify whether the form of the manure is solid or liquid.
Application Area Soil Sampling NOT ADDRESSED
Inspections NOT ADDRESSED
Setback Requirements NOT ADDRESSED
Nutrient Management Plan
A waste management plan approved by the minister is required for certain intensive livestock operations.
Waste Application Procedures
Waste management plan must specify the method of manure application and the season of application;
Waste management plan must specify the land area available for the annual application of manure and provide a map to identify the location of lands to be used for manure application;
Surface Discharge Monitoring
Requirements NOT ADDRESSED
Groundwater Monitoring NOT ADDRESSED
Other NOT ADDRESSED
B.2. United States Federal Regulations
Based on 2002 data, both cattle and hog units in the US have declined since the 1997 census
(e.g., reduction of 4,409,073 cattle and 783,046 hogs between 1997 and 2002), however the
180
Application Rates
Waste management plan must specify the annual rate of manure application based on estimated crop nutrient requirements and accepted manure utilization factors and specify the expected crop nutrient requirements based on the crop production area or on specific cropping practices
Application Frequency Waste management plan must provide the annual volume of manure produced, based on accepted standard values or specific management practices
geographic distribution remained generally the same [USDA, 2002]. Table B.9 provides a
summary of manure production rates by individual states. This summary was prepared using
1997 Agriculture census data. 2002 census data is available but was not incorporated.
The United States Environmental Protection Agency (EPA) promulgated regulations for
concentrated animal feeding operations (“CAFOs”) in February, 2003 [68 Fed. Reg. 7176,
February 12, 2003]. The 2003 CAFO rule required owners or operators of all CAFOs to seek
coverage under a discharge permit, comply with technical design and construction standards as
private wells with nitrate concentrations exceeding the [Safe Drinking Water Maximum Contaminant Level (MCL)] will have these concentrations reduced to levels below the MCL because of the effluent limitation guidelines for Large CAFOs” [68 FR 7176, 7241].
On February 28, 2005, the Second Circuit Court of Appeals issued its decision in Waterkeeper
Alliance et al. v. EPA, [399 F.3d 486]. The Court vacated rule provisions that allow permitting
authorities to issue permits to CAFOs without including the terms of the CAFO’s Nutrient
Management Plan (“NMP” or “Plan”) in the permit and without the Plan being reviewed by the
permitting agency and available to the public. The Court also found the terms of the NMPs
themselves are “effluent limitations” as that term is defined in the Act and therefore must be
applicable, and prepare a nutrient management plan. The final rule did not include groundwater
monitoring. The EPA believes that the rule:
“is expected to reduce nitrate levels in private drinking wells by reducing the rate at which manure is spread on cropland, thus reducing the rate at which pollutants will leach through soils and reach ground water...Based on [US Geological Survey data], EPA estimates that 9.2 percent of households that currently rely on
EPA is currently updating the CAFO rule to reflect the changes requested by the Court. [71 Fed.
Reg. 37744 (June 30, 2006.)] None of the proposed revisions relate to groundwater monitoring
although on March 3, 2008 the EPA issued a proposed rulemaking that would clarify the content
of NMPs in response to the court’s comments in the Waterkeeper Alliance case
[http://www.epa.gov/npdes/regulations/cafo_supp_proposed_rule.pdf].
181
made part of the permit. In addition, the Court found that the duty to apply, which the Agency
had based on a presumption that all CAFOs have at least a potential to discharge, was invalid,
because the CWA subjects only actual discharges to regulation rather than potential discharges.
A final rule issued July 18, 2007 extends CAFO permitting deadlines, establishing February 27,
2009 as the new date for newly defined CAFOs to seek NPDES permit coverage and for
permitted CAFOs to develop and implement nutrient management plans (NMPs) as required by
EPA’s 2003 CAFO rule [72 Fed. Reg. 40247 (July 24, 2007)]. This will also provide time for
State regulatory authorities and members of the agricultural community to adjust to the new
requirements once they are promulgated. In the meantime, a broad variation exists among the
states as they either wait for EPA to enact new regulations, or move ahead with their own
182
interpretation of the court ruling.
On October 15, 2007, EPA announced the names of recipients of $8 million in federal funding
for providing technical assistance to livestock operators, including animal feeding operations, for
the prevention of water discharges and reduction of air emissions. The two recipients of the
funding are RTI International of Research Triangle Park, NC, and Environmental Resources
Coalition (ERC) of Jefferson City, MO. The funding recipients will provide livestock operations
with two types of technical assistance at no cost to the operator: (1) comprehensive assessments
of water and air quality environmental challenges and recommendations for strategies to mitigate
these challenges; and (2) development or review of the facility's nutrient management plan,
which specifies the amount of manure that can be applied to crops so the potential for runoff to
waterbodies is minimized. The technical assistance will be available to any livestock operation in
the United States.
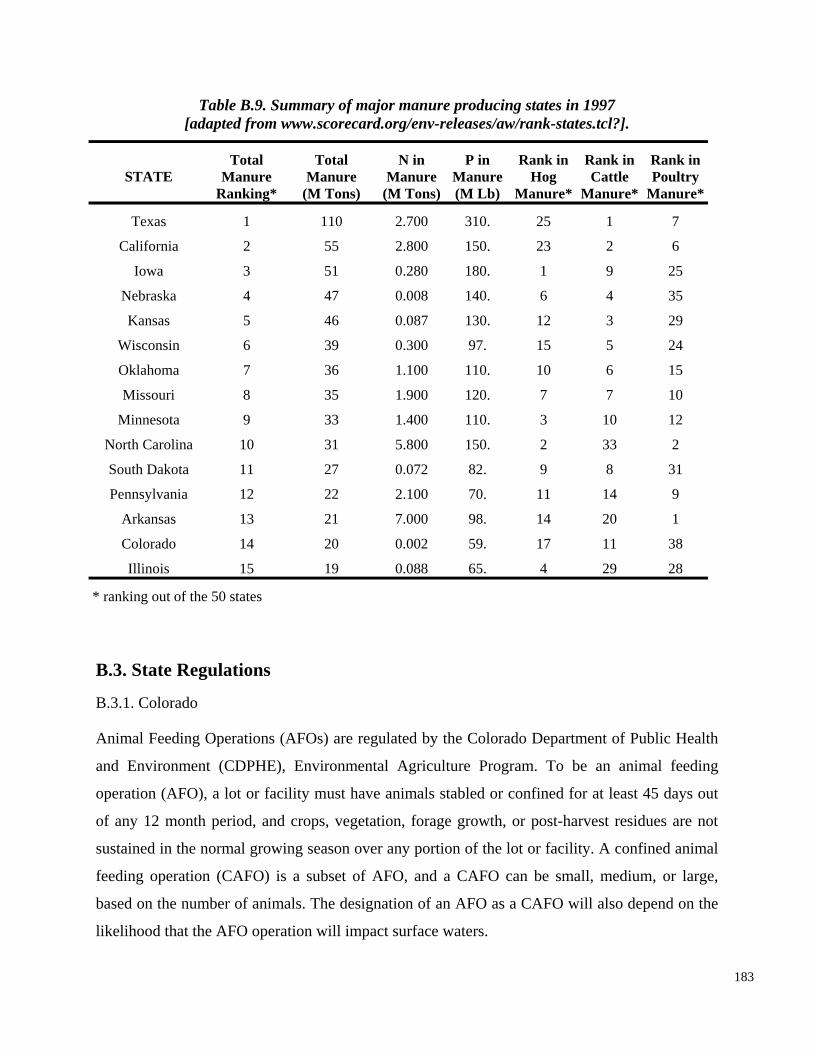
Table B.9. Summary of major manure producing states in 1997 [adapted from www.scorecard.org/env-releases/aw/rank-states.tcl?].
STATE Total
Manure Ranking*
Total Manure
(M Tons)
N in Manure
(M Tons)
P in Manure (M Lb)
Rank in Hog
Manure*
Rank in Cattle
Manure*
Rank in Poultry
Manure*
Texas 1 110 2.700 310. 25 1 7
Missouri 8 35 7 10
Minnesota 9 33 10 12
27
Arkansas 13 21 7.000 98. 14 20 1
Colorado 14 20 0.002 59. 17 11 38
Illinois 15 19 0.088 65. 4 29 28
* ranking out of the 50 states
B.3. State Regulations
B.3.1. Colorado
Animal Feeding Operations (AFOs) are regulated by the Colorado Department of Public Health
North Carolina 10 31 33 2
South Dakota 11 8 31
Pennsylvania 12 22 14 9
California 2 55 2.800 150. 23 2 6
Iowa 3 51 0.280 180. 1 9 25
Nebraska 4 47 4 35
Kansas 5 46 3 29
Wisconsin 6 39 5 24
Oklahoma 7 36 6 15
and Environment (CDPHE), Environmental Agriculture Program. To be an animal feeding
operation (AFO), a lot or facility must have animals stabled or confined for at least 45 days out
of any 12 month period, and crops, vegetation, forage growth, or post-harvest residues are not
sustained in the normal growing season over any portion of the lot or facility. A confined animal
feeding operation (CAFO) is a subset of AFO, and a CAFO can be small, medium, or large,
based on the number of animals. The designation of an AFO as a CAFO will also depend on the
likelihood that the AFO operation will impact surface waters.
183
0.008 140. 6
0.087 130. 12
0.300 97. 15
1.100 110. 10
1.900 120. 7
1.400 110. 3
5.800 150. 2
0.072 82. 9
2.100 70. 11
areas. The animal confinement area includes but is not limited to open lots, housed lots, feedlots, confinement houses, stall barns, free stall barns, milkrooms, milking centers, cowyards, barnyards, medication pens,
By state law, Colorado may not impose requirements that are more stringent than those of the
United States federal laws. Specifically, Colorado Revised Statutes (CCR) §25-8-504(2) restricts
the agency from issuing a permit for animal or agricultural waste on farms and ranches except as
may be required by the federal act or regulations. Therefore, in Colorado, the regulatory program
for animal feeding operations is consistent with the federal permitting program and only applies
to those facilities that discharge to what is defined as waters of the United States. Moreover,
federal CAFO regulations focus on protection of the nation’s surface waters and do not include
provisions for protection of groundwater from pollutants in manure or process wastewater.
control regulation which is “self implementing” rather than through a permit mechanism. As a
result, CDPHE has adopted Regulations #81, which is a control regulation and not a permit
regulation, to retain provisions pertaining to protection of ground water.2
Production and irrigation facilities that discharge to waters of the United States are subject to
General Permit No. COA-931000 and the corresponding requirements in Colorado Rule 61. A
production facility is defined as:
PRODUCTION AREA “means that part of an animal feeding operation that includes the animal confinement area, the manure and residual solids storage area, the raw materials storage area, and the waste containment
Therefore, in Colorado surface water protection provisions must be included in a permit, and
groundwater protection provisions cannot be included in a permit. Colorado is waiting for the
federal revisions in order to update its permitting program.
The CDPHE has chosen to regulate the discharge of process wastewater and manure through a
walkers, animal walkways, and stables. The manure and residual solids
2 5 CCR 1002-61.8(2)(b)(iii) For discharges potentially impacting ground water: (A) The Division, except as provided in (B) below, will establish effluent limitations at the point of compliance taking into account applicable ground water standards or numerical protection levels. When compliance with effluent limitations is predicated on attenuation of pollutant concentrations in the surface water, in the vadose zone and/or along the flow path in the ground water, the Division may deny the permit unless information substantiating such attenuation is provided. If substantiating information is provided, the Division may require verification monitoring and development and implementation of a control plan pursuant to sections §61.14(5) and (6). (B) Where the applicant has requested, and available information provides a reasonable basis for the Division to do so, effluent limitations may be established at the point of discharge or at another point prior to the point of compliance.
184
storage area includes but is not limited to lagoons, runoff ponds, storage sheds, stockpiles, under house or pit storages, liquid impoundments and tanks, static piles, and composting piles. The raw materials storage area includes but is not limited to feed silos, silage bunkers, and bedding materials. The waste containment area includes but is not limited to settling basins, and areas within berms and diversions which separate uncontaminated storm water. Also included in the definition of production area is any egg washing or egg processing facility, and any area used in the storage, handling, treatment, or disposal of mortalities” [Permit V(28)].
“Land application site” means “land under the control of a concentrated animal feeding operation
surface water discharge is authorized by the permit except under certain conditions set out in the
permit. This includes the preparation of a Nutrient Management Plan (NMP). The NMP must
incorporate “certain best management practices based on a field-specific assessment of the
potential for nitrogen and phosphorus transport from the field and that addresses the form,
source, amount, timing, and method of application of nutrients on each field to achieve realistic
production goals, while minimizing nitrogen and phosphorus movement to surface water”
[Permit II.A.2(b)].
Separate regulations are in place for housed commercial swine feeding operations, which are
defined as “a housed swine feeding operation that is capable of housing eight hundred thousand
operator, whether it is owned, rented, or leased, to which manure or process wastewater from the
production area is or may be applied” [Permit V(13)].
The General Permit does not specifically address groundwater monitoring requirements for land
application sites. Instead, for Large Dairy Cow, Cattle, Swine, Poultry and Veal Calf CAFOs, no
pounds or more of live animal weight of swine at any one time or is deemed a commercial
operation under local zoning or land use regulations” [(5 CCR §1002-61.2(40)]. These
operations must obtain individual surface water discharge permits and prepare a swine waste
management plan. Generally, land application activities at housed commercial swine feeding
operations must be conducted in a manner that “does not result in impairment of existing
beneficial uses of state waters or exceedances of applicable water quality standards for surface
water or ground water” [§61.13(3)(iii)]. The facility is required to conduct quarterly monitoring
of soils and groundwater. Groundwater analysis includes at a minimum nitrogen species,
phosphorus, heavy metals and salts. The agency may waive any monitoring requirements upon a
demonstration that there is no reasonable potential for contamination from such constituents at
185
the permitted facility. Well locations are selected by the permittee and specified in the swine
waste management plan.
The agency may also waive ground water monitoring requirements upon a showing by the
permittee of the following:
1. Ground water does not exist beneath a the land application site; 2. An impermeable geological layer exits beneath the land application site, and above the
2. Notify if the cumulative soil nitrate-nitrogen concentration level in any two foot increment within the monitoring zone, or in any one foot increment below the monitoring zone, exceeds the comparative concentration by greater than 10 milligrams per kilogram.
3. Prepare intervention protocol if exceedance.
As noted above, groundwater impacts from land application areas that do not discharge to waters
of the United States (and that therefore do not need a permit) are regulated under the self-
implementing regulation known Regulations #81. Regulation #81 has requirements for
protection of groundwater that are specific to production areas at CAFOs [§81.5]. These include
construction standards for waste management tanks, impoundments, and conveyance structures,
as well as procedures for inspection and safe removal of wastes from impoundments.
shallowest aquifer located beneath the land application site; or 3. A complete analysis of one dimensional transport of water within the vadose zone of the
land application site, using a transport model, mathematical calculation or other approved methods that conclude that water that annually passes below the root zone of the land application site will not reach ground water within one hundred years.
If the waiver is granted, the permittee must: 1. Sample two one-foot soil intervals beneath the land application site on a quarterly basis
and analysis for nitrate-nitrogen.
If an AFO has not been designated a CAFO (based on animal units and a low risk of impact to
surface and groundwater), the facility must comply with Best Management Practices (BMPs)
specified in §81.6. These BMPs include requirements for reducing runoff from production areas,
reducing waste water, decreasing wastewater and manure flow to surface water, and provide
specific requirements for management of wastes.
According to CDPHE agency staff, the effect of the remand of the federal regulations has created
some confusion and gaps in the regulations of AFOs in Colorado. The state is waiting to hear the
results of new federal agency action but in the meantime is considering revisions to Regulation
#81 to clarify groundwater protection requirements for all facilities.
186
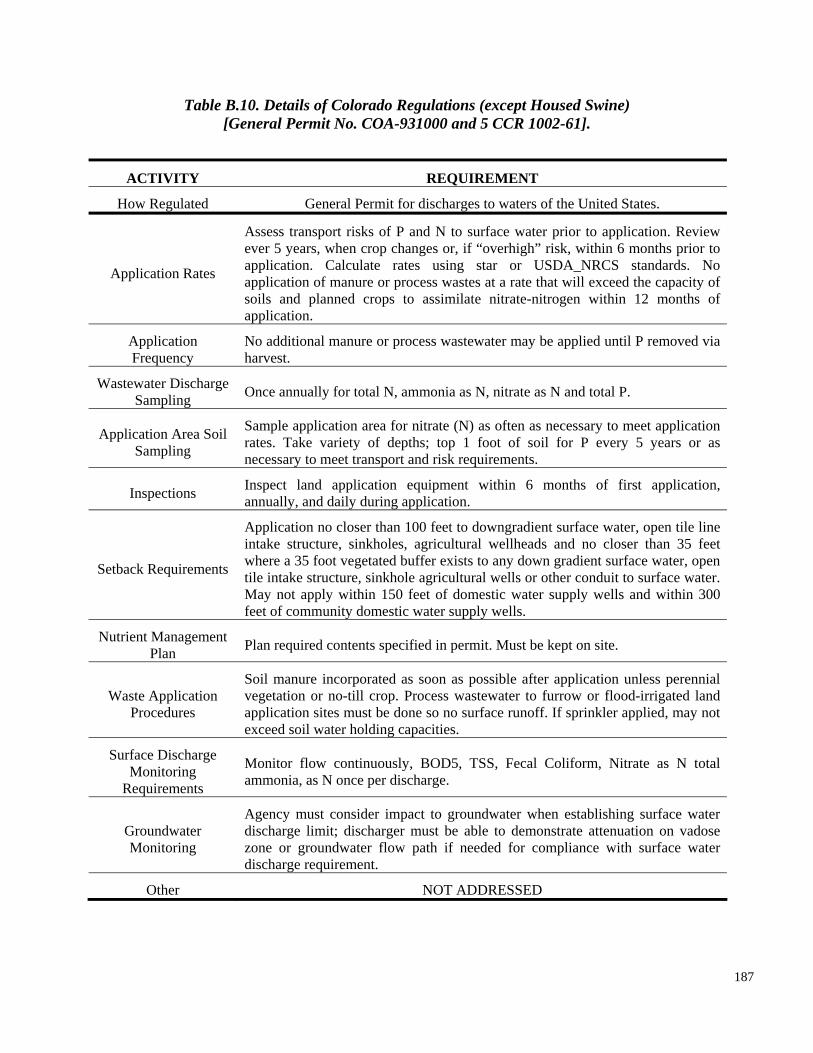
Table B.10. Details of Colorado Regulations (except Housed Swine) [General Permit No. COA-931000 and 5 CCR 1002-61].
ACTIVITY REQUIREMENT
How Regulated General Permit for discharges to waters of the United States.
Application Rates
Assess transport risks of P and N to surface water prior to application. Review ever 5 years, when crop changes or, if “overhigh” risk, within 6 months prior to application. Calculate rates using star or USDA_NRCS standards. No application of manure or process wastes at a rate that will exceed the capacity of
ammonia, as N once per discharge.
soils and planned crops to assimilate nitrate-nitrogen within 12 months of application.
Application Frequency
No additional manure or process wastewater may be applied until P removed via harvest.
Wastewater Discharge Sampling Once annually for total N, ammonia as N, nitrate as N and total P.
Application Area Soil Sampling
Sample application area for nitrate (N) as often as necessary to meet application rates. Take variety of depths; top 1 foot of soil for P every 5 years or as necessary to meet transport and risk requirements.
Inspections Inspect land application equipment within 6 months of first application, annually, and daily during application.
Nutrient Management Plan Plan required contents specified in permit. Must be kept on site.
Waste Application Procedures
Soil manure incorporated as soon as possible after application unless perennial vegetation or no-till crop. Process wastewater to furrow or flood-irrigated land application sites must be done so no surface runoff. If sprinkler applied, may not exceed soil water holding capacities.
Surface Discharge Monitoring
Requirements
Monitor flow continuously, BOD5, TSS, Fecal Coliform, Nitrate as N total
Agency must consider impact to groundwater when establishing surface water Groundwater discharge limit; discharger must be able to demonstrate attenuation on vadose Monitoring zone or groundwater flow path if needed for compliance with surface water
discharge requirement.
Other NOT ADDRESSED
187
Setback Requirements
Application no closer than 100 feet to downgradient surface water, open tile line intake structure, sinkholes, agricultural wellheads and no closer than 35 feet where a 35 foot vegetated buffer exists to any down gradient surface water, open tile intake structure, sinkhole agricultural wells or other conduit to surface water. May not apply within 150 feet of domestic water supply wells and within 300 feet of community domestic water supply wells.
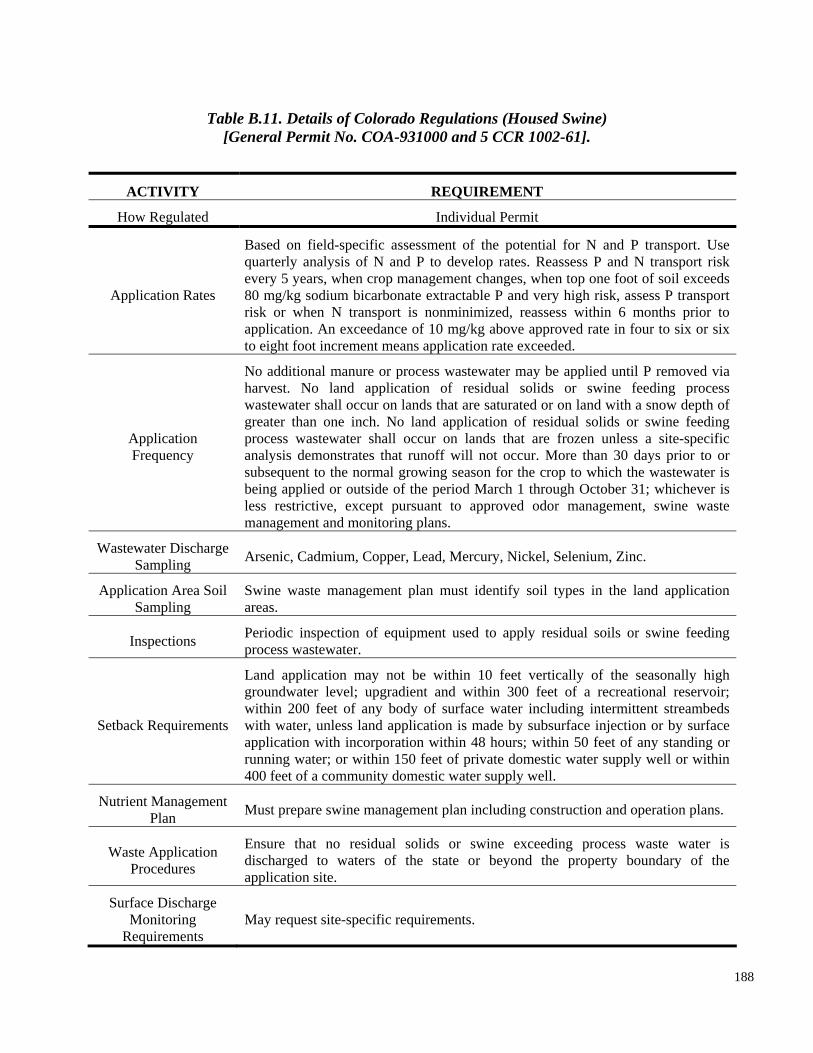
No additional manure or process wastewater may be applied until P removed via harvest. No land application of residual solids or swine feeding process wastewater shall occur on lands that are saturated or on land with a snow depth of greater than one inch. No land application of residual solids or swine feeding process wastewater shall occur on lands that are frozen unless a site-specific analysis demonstrates that runoff will not occur. More than 30 days prior to or subsequent to the normal growing season for the crop to which the wastewater is being applied or outside of the period March 1 through October 31; whichever is less restrictive, except pursuant to approved odor management, swine waste management and monitoring plans.
Wastewater Discharge Sampling Arsenic, Cadmium, Copper, Lead, Mercury, Nickel, Selenium, Zinc.
Application Area Soil Sampling
Swine waste management plan must identify soil types in the land application areas.
Inspections Periodic inspection of equipment used to apply residual soils or swine feeding process wastewater.
Setback Requirements
Land application may not be within 10 feet vertically of the seasonally high
to eight foot increment means application rate exceeded.
Table B.11. Details of Colorado Regulations (Housed Swine) [General Permit No. COA-931000 and 5 CCR 1002-61].
ACTIVITY REQUIREMENT
How Regulated Individual Permit
Nutrient Management Must prepare swine management plan including construction and operation plans. Plan
Ensure that no residual solids or swine exceeding process waste water is Waste Application discharged to waters of the state or beyond the property boundary of the Procedures application site.
Surface Discharge Monitoring May request site-specific requirements.
Requirements
Application Rates
Application Frequency
Based on field-specific assessment of the potential for N and P transport. Use quarterly analysis of N and P to develop rates. Reassess P and N transport risk every 5 years, when crop management changes, when top one foot of soil exceeds 80 mg/kg sodium bicarbonate extractable P and very high risk, assess P transport risk or when N transport is nonminimized, reassess within 6 months prior to application. An exceedance of 10 mg/kg above approved rate in four to six or six
groundwater level; upgradient and within 300 feet of a recreational reservoir; within 200 feet of any body of surface water including intermittent streambeds with water, unless land application is made by subsurface injection or by surface application with incorporation within 48 hours; within 50 feet of any standing or running water; or within 150 feet of private domestic water supply well or within 400 feet of a community domestic water supply well.
188

ACTIVITY REQUIREMENT
How Regulated Individual Permit
Quarterly monitoring at appropriate locations designated by permittee andGroundwater approved by agency for nitrogen species, P, heavy metals, and salts. May seek Monitoring variance from monitoring requirements upon certain demonstrations.
Other Financial assurance for closure and post closure care required.
189
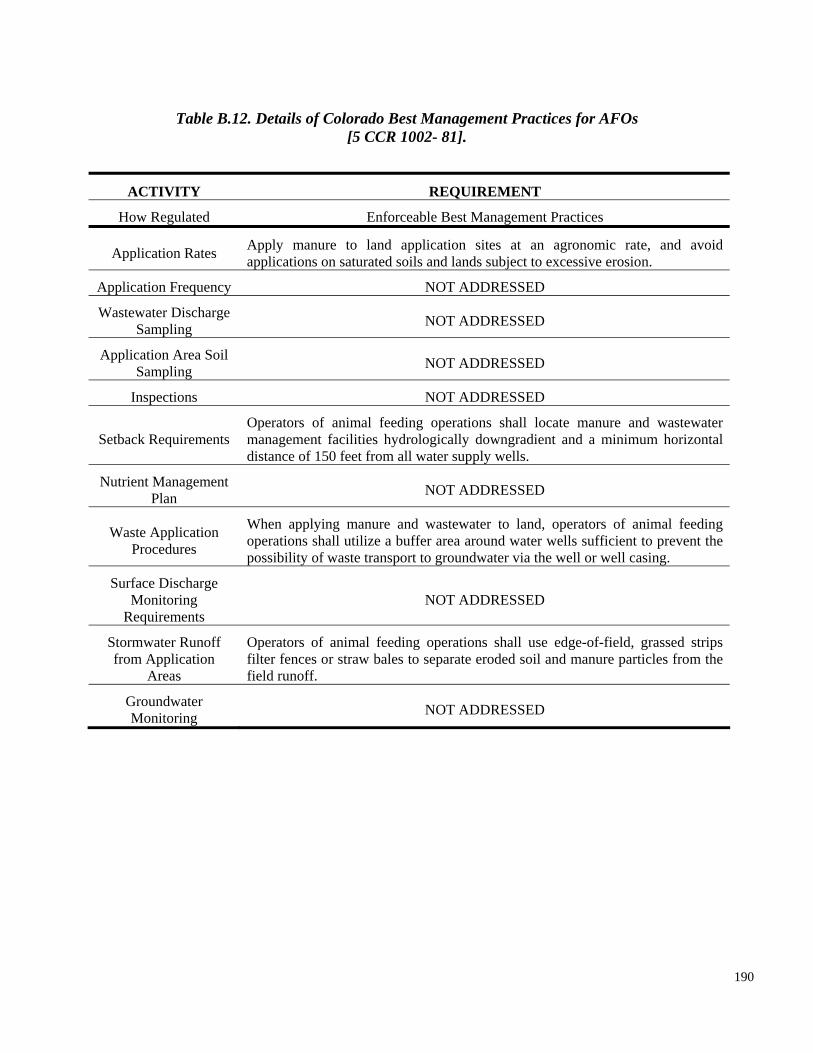
Table B.12. Details of Colorado Best Management Practices for AFOs [5 CCR 1002- 81].
ACTIVITY REQUIREMENT
How Regulated Enforceable Best Management Practices
Application Rates Apply manure to land application sites at an agronomic rate, and avoid applications on saturated soils and lands subject to excessive erosion.
Application Frequency NOT ADDRESSED
Wastewater Discharge Sampling NOT ADDRESSED
Application Area Soil Sampling NOT ADDRESSED
Inspections NOT ADDRESSED
Setback Requirements Operators of animal feeding operations shall locate manure and wastewater management facilities hydrologically downgradient and a minimum horizontal distance of 150 feet from all water supply wells.
Nutrient Management Plan NOT ADDRESSED
Waste Application Procedures
When applying manure and wastewater to land, operators of animal feeding operations shall utilize a buffer area around water wells sufficient to prevent the possibility of waste transport to groundwater via the well or well casing.
Surface Discharge Monitoring
Requirements NOT ADDRESSED
Stormwater Runoff from Application
Areas
Operators of animal feeding operations shall use edge-of-field, grassed strips filter fences or straw bales to separate eroded soil and manure particles from the field runoff.
Groundwater Monitoring NOT ADDRESSED
190
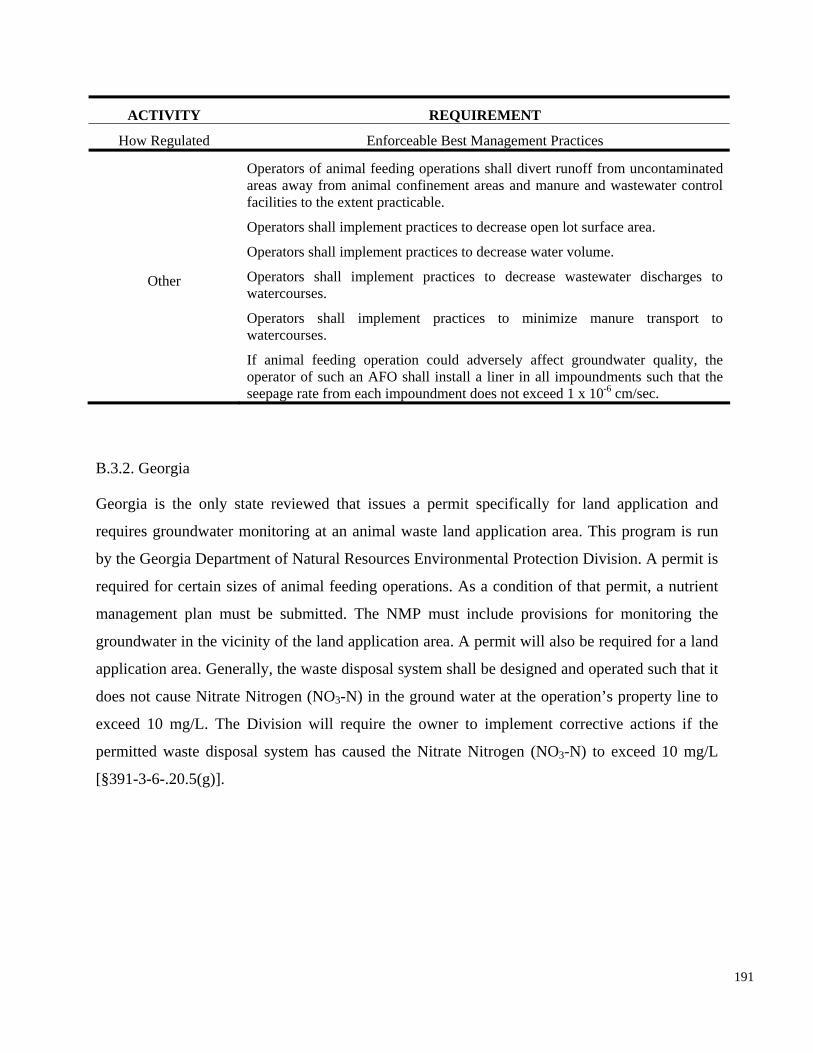
does not cause Nitrate Nitrogen (NO3-N) in the ground water at the operation’s property line to
ACTIVITY REQUIREMENT
How Regulated Enforceable Best Management Practices
Operators of animal feeding operations shall divert runoff from uncontaminated areas away from animal confinement areas and manure and wastewater control facilities to the extent practicable.
Operators shall implement practices to decrease open lot surface area.
Operators shall implement practices to decrease water volume.
Other Operators shall implement practices to decrease wastewater discharges to watercourses.
Operators shall implement practices to minimize manure transport to watercourses.
If animal feeding operation could adversely affect groundwater quality, the operator of such an AFO shall install a liner in all impoundments such that the seepage rate from each impoundment does not exceed 1 x 10⁻⁶ cm/sec.
B.3.2. Georgia
Georgia is the only state reviewed that issues a permit specifically for land application and
requires groundwater monitoring at an animal waste land application area. This program is run
by the Georgia Department of Natural Resources Environmental Protection Division. A permit is
required for certain sizes of animal feeding operations. As a condition of that permit, a nutrient
management plan must be submitted. The NMP must include provisions for monitoring the
groundwater in the vicinity of the land application area. A permit will also be required for a land
application area. Generally, the waste disposal system shall be designed and operated such that it
exceed 10 mg/L. The Division will require the owner to implement corrective actions if the
permitted waste disposal system has caused the Nitrate Nitrogen (NO3-N) to exceed 10 mg/L
[§391-3-6-.20.5(g)].
191
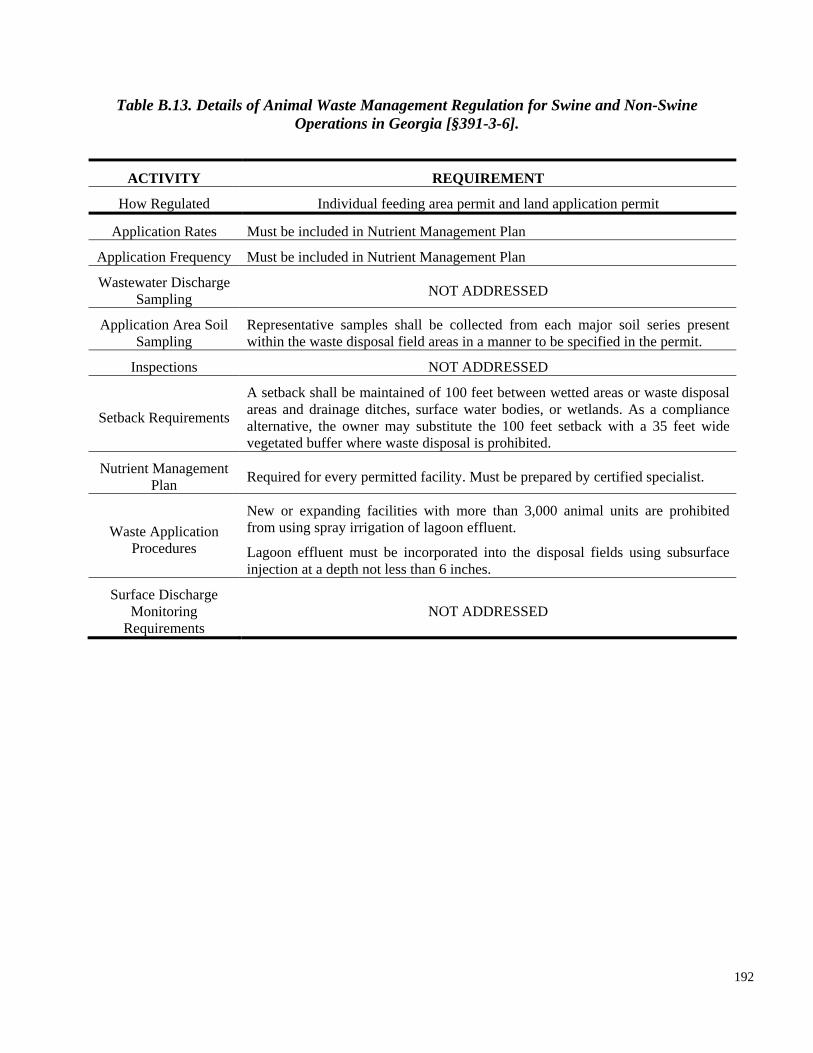
Table B.13. Details of Animal Waste Management Regulation for Swine and Non-Swine Operations in Georgia [§391-3-6].
ACTIVITY REQUIREMENT
How Regulated Individual feeding area permit and land application permit
Application Rates Must be included in Nutrient Management Plan
Application Frequency Must be included in Nutrient Management Plan
Wastewater Discharge Sampling NOT ADDRESSED
Application Area Soil Sampling
Representative samples shall be collected from each major soil series present within the waste disposal field areas in a manner to be specified in the permit.
Inspections NOT ADDRESSED
Setback Requirements
A setback shall be maintained of 100 feet between wetted areas or waste disposal areas and drainage ditches, surface water bodies, or wetlands. As a compliance alternative, the owner may substitute the 100 feet setback with a 35 feet wide vegetated buffer where waste disposal is prohibited.
Nutrient Management Plan Required for every permitted facility. Must be prepared by certified specialist.
Waste Application Procedures
New or expanding facilities with more than 3,000 animal units are prohibited from using spray irrigation of lagoon effluent.
Lagoon effluent must be incorporated into the disposal fields using subsurface injection at a depth not less than 6 inches.
Surface Discharge Monitoring
Requirements NOT ADDRESSED
192
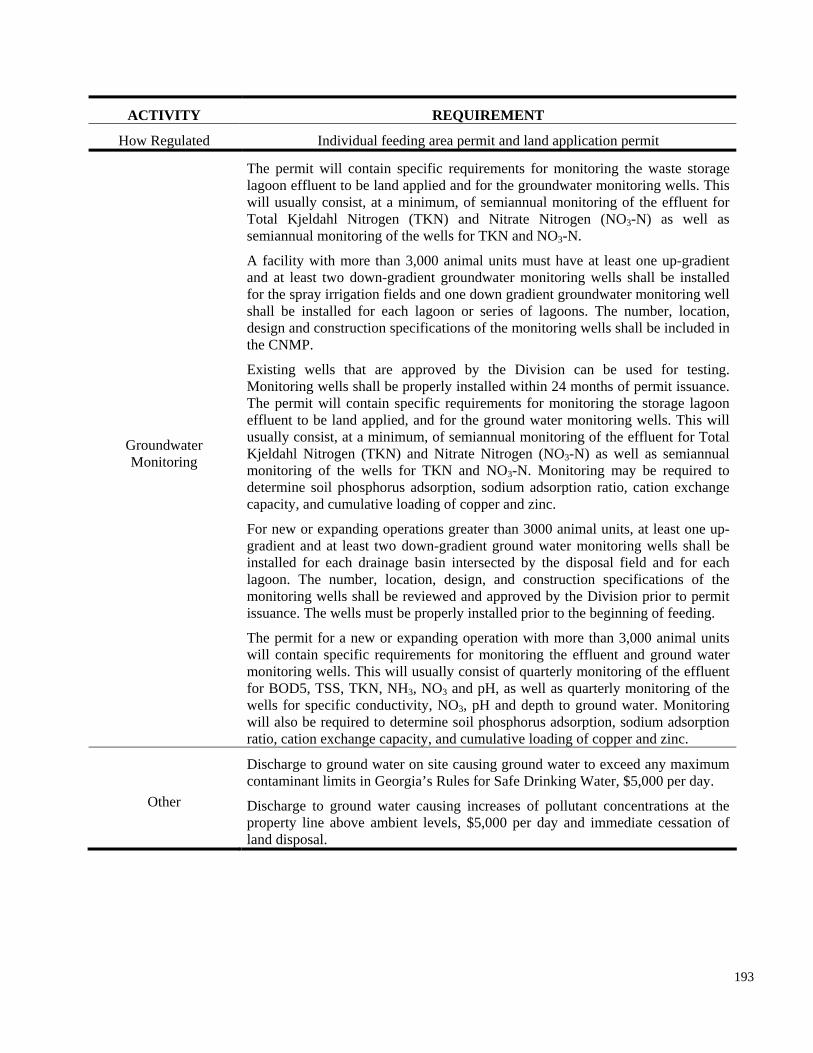
The permit for a new or expanding operation with more than 3,000 animal units will contain specific requirements for monitoring the effluent and ground water monitoring wells. This will usually consist of quarterly monitoring of the effluent for BOD5, TSS, TKN, NH3, NO3 and pH, as well as quarterly monitoring of the wells for specific conductivity, NO3, pH and depth to ground water. Monitoring will also be required to determine soil phosphorus adsorption, sodium adsorption ratio, cation exchange capacity, and cumulative loading of copper and zinc.
Other
ACTIVITY REQUIREMENT
How Regulated Individual feeding area permit and land application permit
Discharge to ground water on site causing ground water to exceed any maximum contaminant limits in Georgia’s Rules for Safe Drinking Water, $5,000 per day.
Discharge to ground water causing increases of pollutant concentrations at the property line above ambient levels, $5,000 per day and immediate cessation of land disposal.
Groundwater Monitoring
The permit will contain specific requirements for monitoring the waste storage lagoon effluent to be land applied and for the groundwater monitoring wells. This will usually consist, at a minimum, of semiannual monitoring of the effluent for Total Kjeldahl Nitrogen (TKN) and Nitrate Nitrogen (NO3-N) as well as semiannual monitoring of the wells for TKN and NO3-N.
A facility with more than 3,000 animal units must have at least one up-gradient and at least two down-gradient groundwater monitoring wells shall be installed for the spray irrigation fields and one down gradient groundwater monitoring well shall be installed for each lagoon or series of lagoons. The number, location, design and construction specifications of the monitoring wells shall be included in the CNMP.
193
Existing wells that are approved by the Division can be used for testing. Monitoring wells shall be properly installed within 24 months of permit issuance. The permit will contain specific requirements for monitoring the storage lagoon effluent to be land applied, and for the ground water monitoring wells. This will usually consist, at a minimum, of semiannual monitoring of the effluent for Total Kjeldahl Nitrogen (TKN) and Nitrate Nitrogen (NO3-N) as well as semiannual monitoring of the wells for TKN and NO3-N. Monitoring may be required to determine soil phosphorus adsorption, sodium adsorption ratio, cation exchange capacity, and cumulative loading of copper and zinc.
For new or expanding operations greater than 3000 animal units, at least one up-gradient and at least two down-gradient ground water monitoring wells shall be installed for each drainage basin intersected by the disposal field and for each lagoon. The number, location, design, and construction specifications of the monitoring wells shall be reviewed and approved by the Division prior to permit issuance. The wells must be properly installed prior to the beginning of feeding.
B.3.3. Idaho
Currently the state of Idaho does not have regulatory authority to issue surface water discharge
permits under the federal Clean Water Act and therefore this authority rests with the United
States Environmental Protection Agency (EPA) Region 10. As noted, the federal regulations for
managing waste from CAFOs covers only surface water, and therefore in Idaho, requirements for
protection of groundwater from land application of manure will be those imposed by the EPA in
a General Permit or any other imposed by state law.
EPA Region 10 has issued a general permit for the regulation of surface water discharge from
water. [General Permit Part II.B.1] Specifically, Part II.B.5 of the General permit requires that
any solid or liquid wastes from a CAFO which is land applied must be applied at agronomic
rates. This means that the application rate must not exceed that rate which will provide the crop
or forage growth with needed nutrients for optimum health and growth. The purpose of this
requirement is to limit the amount of nutrients to that required by crops and to prevent the use of
these fields as disposal sites. Fields with nutrient amounts in excess of agronomic rates are more
likely to discharge pollutants into waters of the United States.
In addition to the federal general permit requirements, each Idaho county will also have authority
CAFO [General Permit No.: IDG010000]. This permit specifies that “[a]t a minimum, the
management practices established in the Idaho State Waste Management Guidelines for Animal
Feeding Operations and the BMPs listed below shall be implemented to prevent contamination
of waters of the United States”. The management practices relate to surface water and not ground
to regulate animal feeding operations within their jurisdiction. The individual county regulations
will not be considered for purposes of this report. The state regulations also provide that beef and
dairy operations must prepare a nutrient management plan in accordance with state guidance
[IDAPA 02.03.14 and 02.03.15] and the NRCS 590 (1999 version).
194
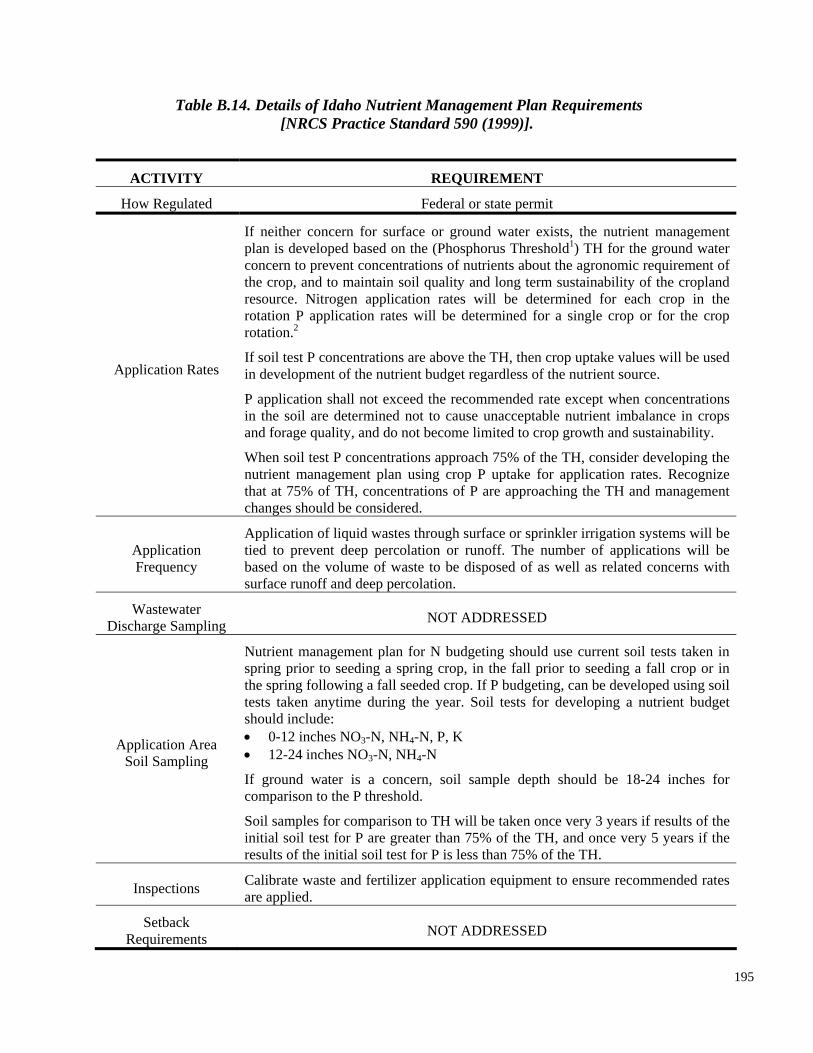
Application Frequency
Application of liquid wastes through surface or sprinkler irrigation systems will be tied to prevent deep percolation or runoff. The number of applications will be based on the volume of waste to be disposed of as well as related concerns with surface runoff and deep percolation.
Wastewater Discharge Sampling NOT ADDRESSED
Nutrient management plan for N budgeting should use current soil tests taken in spring prior to seeding a spring crop, in the fall prior to seeding a fall crop or in the spring following a fall seeded crop. If P budgeting, can be developed using soil
should include: 0-12 inches NO3-N, NH4-N, P, K
Table B.14. Details of Idaho Nutrient Management Plan Requirements [NRCS Practice Standard 590 (1999)].
ACTIVITY REQUIREMENT
How Regulated Federal or state permit
Inspections Calibrate waste and fertilizer application equipment to ensure recommended rates are applied.
Setback Requirements NOT ADDRESSED
195
Application Rates
Application Area Soil Sampling
If neither concern for surface or ground water exists, the nutrient management plan is developed based on the (Phosphorus Threshold1) TH for the ground water concern to prevent concentrations of nutrients about the agronomic requirement of the crop, and to maintain soil quality and long term sustainability of the cropland resource. Nitrogen application rates will be determined for each crop in the rotation P application rates will be determined for a single crop or for the crop rotation.2
If soil test P concentrations are above the TH, then crop uptake values will be used in development of the nutrient budget regardless of the nutrient source.
P application shall not exceed the recommended rate except when concentrations in the soil are determined not to cause unacceptable nutrient imbalance in crops and forage quality, and do not become limited to crop growth and sustainability.
When soil test P concentrations approach 75% of the TH, consider developing the nutrient management plan using crop P uptake for application rates. Recognize that at 75% of TH, concentrations of P are approaching the TH and management changes should be considered.
tests taken anytime during the year. Soil tests for developing a nutrient budget
•• 12-24 inches NO3-N, NH4-N
If ground water is a concern, soil sample depth should be 18-24 inches for comparison to the P threshold.
Soil samples for comparison to TH will be taken once very 3 years if results of the initial soil test for P are greater than 75% of the TH, and once very 5 years if the results of the initial soil test for P is less than 75% of the TH.
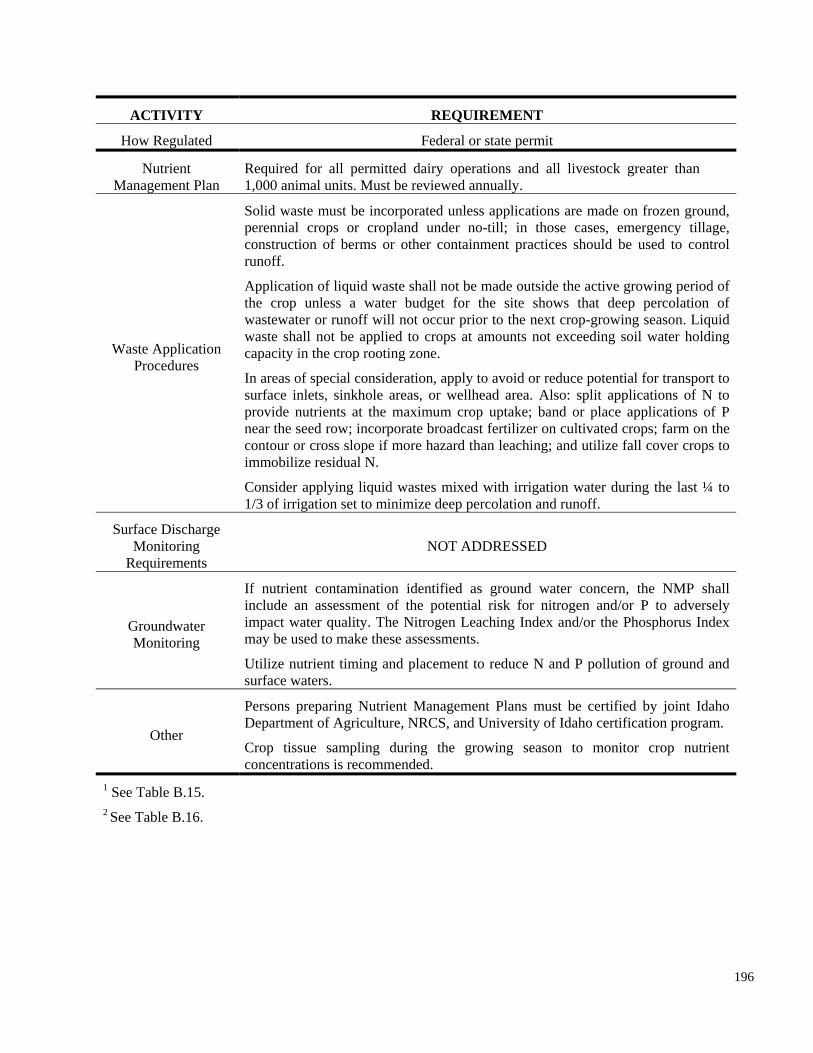
Application of liquid waste shall not be made outside the active growing period of the crop unless a water budget for the site shows that deep percolation of wastewater or runoff will not occur prior to the next crop-growing season. Liquid waste shall not be applied to crops at amounts not exceeding soil water holding capacity in the crop rooting zone.
In areas of special consideration, apply to avoid or reduce potential for transport to surface inlets, sinkhole areas, or wellhead area. Also: split applications of N to provide nutrients at the maximum crop uptake; band or place applications of P near the seed row; incorporate broadcast fertilizer on cultivated crops; farm on the
ACTIVITY REQUIREMENT
How Regulated Federal or state permit
Nutrient Required for all permitted dairy operations and all livestock greater than Management Plan 1,000 animal units. Must be reviewed annually.
Waste Application Procedures
Solid waste must be incorporated unless applications are made on frozen ground, perennial crops or cropland under no-till; in those cases, emergency tillage, construction of berms or other containment practices should be used to control runoff.
contour or cross slope if more hazard than leaching; and utilize fall cover crops to immobilize residual N.
Consider applying liquid wastes mixed with irrigation water during the last ¼ to 1/3 of irrigation set to minimize deep percolation and runoff.
Surface Discharge Monitoring
Requirements NOT ADDRESSED
Groundwater Monitoring
If nutrient contamination identified as ground water concern, the NMP shall include an assessment of the potential risk for nitrogen and/or P to adversely impact water quality. The Nitrogen Leaching Index and/or the Phosphorus Index may be used to make these assessments.
Utilize nutrient timing and placement to reduce N and P pollution of ground and surface waters.
Other
Persons preparing Nutrient Management Plans must be certified by joint Idaho Department of Agriculture, NRCS, and University of Idaho certification program.
Crop tissue sampling during the growing season to monitor crop nutrient concentrations is recommended.
1 See Table B.15. 2 See Table B.16.
196
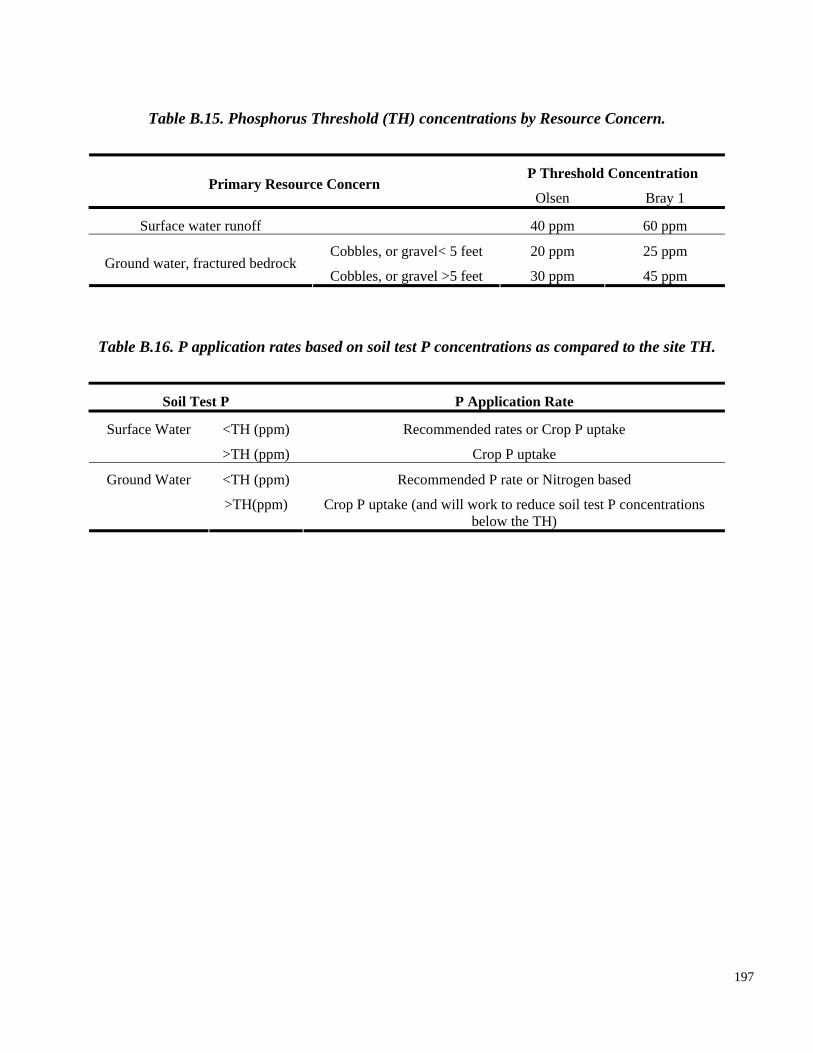
Table B.15. Phosphorus Threshold (TH) concentrations by Resource Concern.
Primary Resource Concern P Threshold Concentration
Olsen Bray 1
Surface water runoff 40 ppm 60 ppm
Ground water, fractured bedrock Cobbles, or gravel< 5 feet
Cobbles, or gravel >5 feet
20 ppm
30 ppm
25 ppm
45 ppm
Table B.16. P application rates based on soil test P concentrations as compared to the site TH.
Soil Test P P Application Rate
<TH (ppm) Recommended rates or Crop P uptake Surface Water
>TH (ppm) Crop P uptake
<TH (ppm) Recommended P rate or Nitrogen based Ground Water
>TH(ppm) Crop P uptake (and will work to reduce soil test P concentrations below the TH)
197
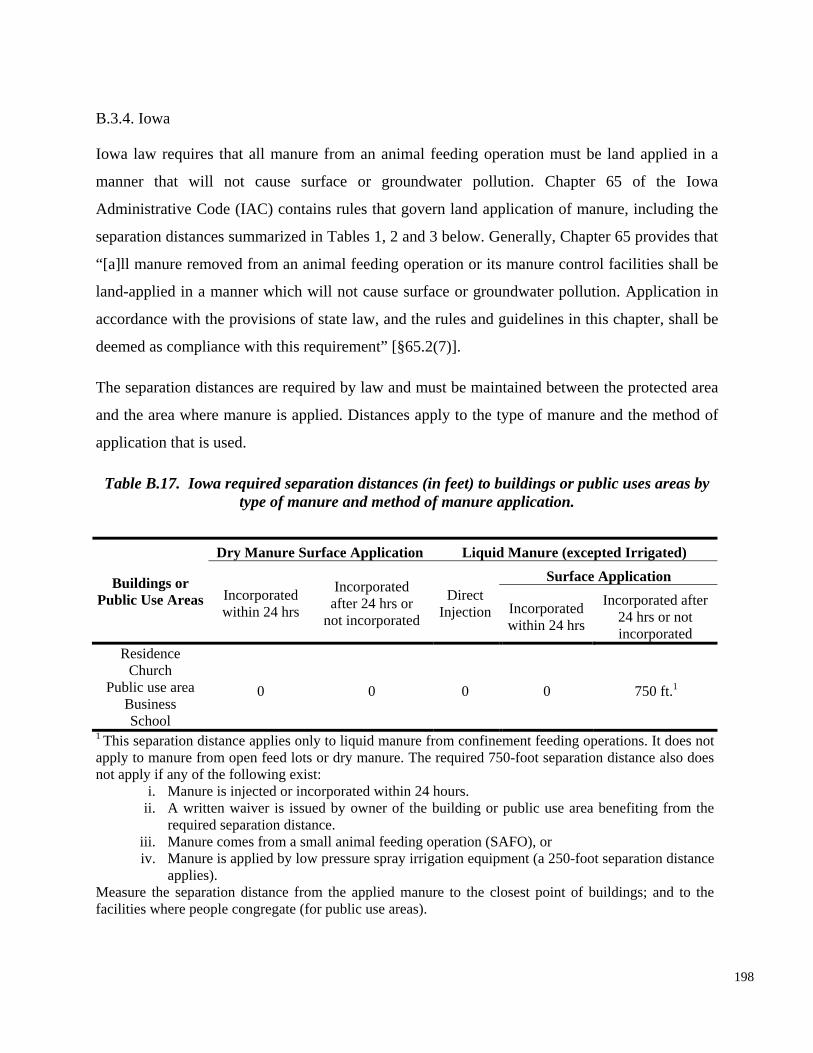
0
B.3.4. Iowa
Iowa law requires that all manure from an animal feeding operation must be land applied in a
manner that will not cause surface or groundwater pollution. Chapter 65 of the Iowa
Administrative Code (IAC) contains rules that govern land application of manure, including the
separation distances summarized in Tables 1, 2 and 3 below. Generally, Chapter 65 provides that
“[a]ll manure removed from an animal feeding operation or its manure control facilities shall be
Public use area 0 0 0 750 ft.1
Business School
1 This separation distance applies only to liquid manure from confinement feeding operations. It does not apply to manure from open feed lots or dry manure. The required 750-foot separation distance also does not apply if any of the following exist:
land-applied in a manner which will not cause surface or groundwater pollution. Application in
accordance with the provisions of state law, and the rules and guidelines in this chapter, shall be
deemed as compliance with this requirement” [§65.2(7)].
The separation distances are required by law and must be maintained between the protected area
and the area where manure is applied. Distances apply to the type of manure and the method of
application that is used.
Table B.17. Iowa required separation distances (in feet) to buildings or public uses areas by type of manure and method of manure application.
Dry Manure Surface Application Liquid Manure (excepted Irrigated) Surface Application Buildings or
Public Use Areas IncorporatedIncorporated
within 24 hrs after 24 hrs or not incorporated
Direct Injection Incorporated
within 24 hrs
Incorporated after 24 hrs or not incorporated
Residence Church
i. Manure is injected or incorporated within 24 hours. ii. A written waiver is issued by owner of the building or public use area benefiting from the
required separation distance. iii. Manure comes from a small animal feeding operation (SAFO), or iv. Manure is applied by low pressure spray irrigation equipment (a 250-foot separation distance
applies). Measure the separation distance from the applied manure to the closest point of buildings; and to the facilities where people congregate (for public use areas).
198
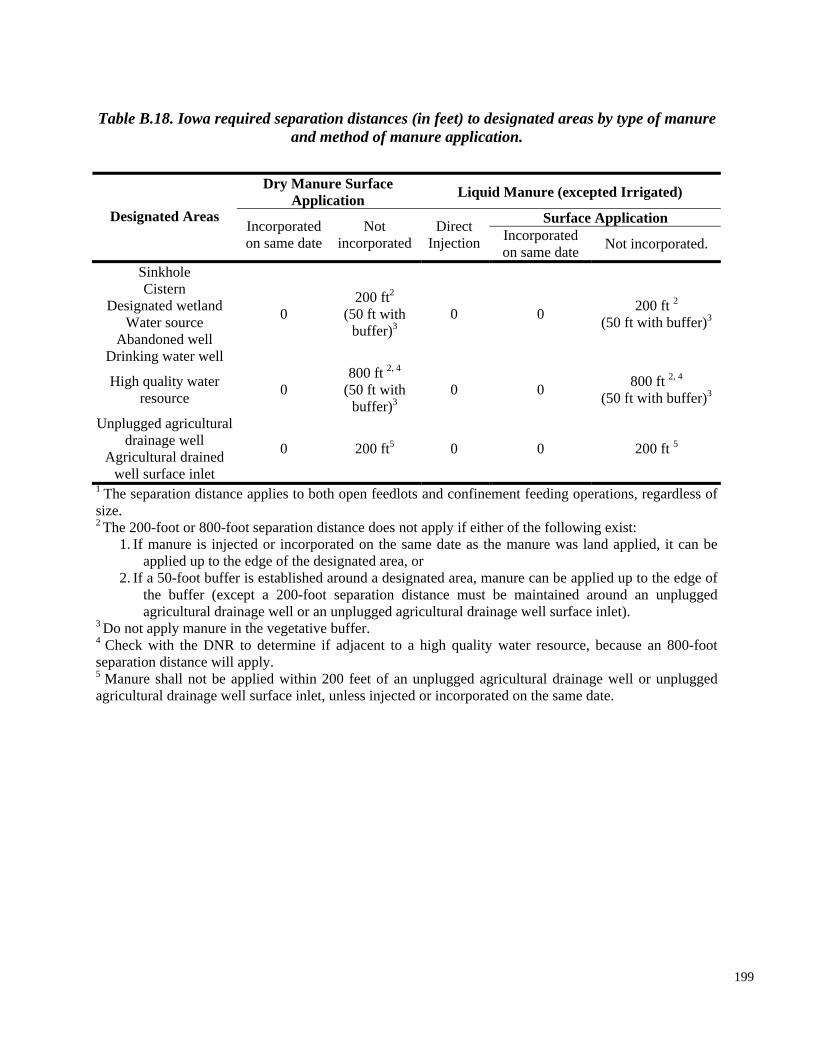
3 Do not apply manure in the vegetative buffer. 4 Check with the DNR to determine if adjacent to a high quality water resource, because an 800-foot separation distance will apply.5 Manure shall not be applied within 200 feet of an unplugged agricultural drainage well or unplugged agricultural drainage well surface inlet, unless injected or incorporated on the same date.
Table B.18. Iowa required separation distances (in feet) to designated areas by type of manure and method of manure application.
Dry Manure Surface Liquid Manure (excepted Irrigated) Application Designated Areas Surface Application Incorporated Not Direct Incorporatedon same date incorporated Injection Not incorporated. on same date
Sinkhole Cistern 200 ft2
Designated wetland 200 ft 2 0 (50 ft withWater source (50 ft with buffer)3
buffer)3 Abandoned well
Drinking water well
High quality water 0 800 ft 2, 4
resource (50 ft with buffer)3
Unplugged agricultural drainage well 0 200 ft 5
Agricultural drained well surface inlet
size.
0 0
800 ft 2, 4
(50 ft with 0 0 buffer)3
200 ft5 0 0
1 The separation distance applies to both open feedlots and confinement feeding operations, regardless of
2 The 200-foot or 800-foot separation distance does not apply if either of the following exist: 1. If manure is injected or incorporated on the same date as the manure was land applied, it can be
applied up to the edge of the designated area, or 2. If a 50-foot buffer is established around a designated area, manure can be applied up to the edge of
the buffer (except a 200-foot separation distance must be maintained around an unplugged agricultural drainage well or an unplugged agricultural drainage well surface inlet).
199
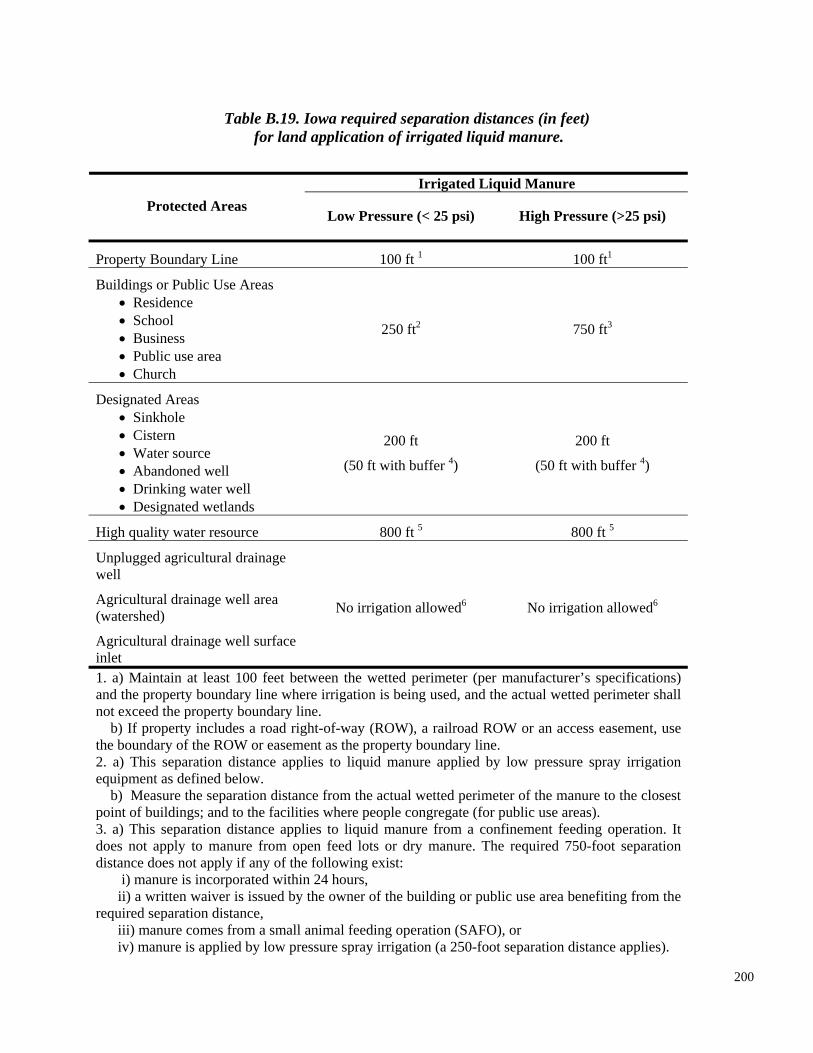
Table B.19. Iowa required separation distances (in feet) for land application of irrigated liquid manure.
Irrigated Liquid Manure Protected Areas
Low Pressure (< 25 psi) High Pressure (>25 psi)
Property Boundary Line 100 ft 1 100 ft1
Buildings or Public Use Areas • Residence • School
200 ft
(50 ft with buffer 4)
200 ft
800 ft 5
Unplugged agricultural drainage
Agricultural drainage well area
Agricultural drainage well surface
No irrigation allowed6
1. a) Maintain at least 100 feet between the wetted perimeter (per manufacturer’s specifications) and the property boundary line where irrigation is being used, and the actual wetted perimeter shall not exceed the property boundary line.
b) If property includes a road right-of-way (ROW), a railroad ROW or an access easement, use the boundary of the ROW or easement as the property boundary line.
250 ft2 750 ft3
• Business • Public use area • Church
Designated Areas • Sinkhole • Cistern • Water source
(50 ft with buffer 4)• Abandoned well • Drinking water well • Designated wetlands
High quality water resource 800 ft 5
well
No irrigation allowed6 (watershed)
inlet
2. a) This separation distance applies to liquid manure applied by low pressure spray irrigation equipment as defined below.
b) Measure the separation distance from the actual wetted perimeter of the manure to the closest point of buildings; and to the facilities where people congregate (for public use areas). 3. a) This separation distance applies to liquid manure from a confinement feeding operation. It does not apply to manure from open feed lots or dry manure. The required 750-foot separation distance does not apply if any of the following exist: i) manure is incorporated within 24 hours,
ii) a written waiver is issued by the owner of the building or public use area benefiting from the required separation distance, iii) manure comes from a small animal feeding operation (SAFO), or iv) manure is applied by low pressure spray irrigation (a 250-foot separation distance applies).
200
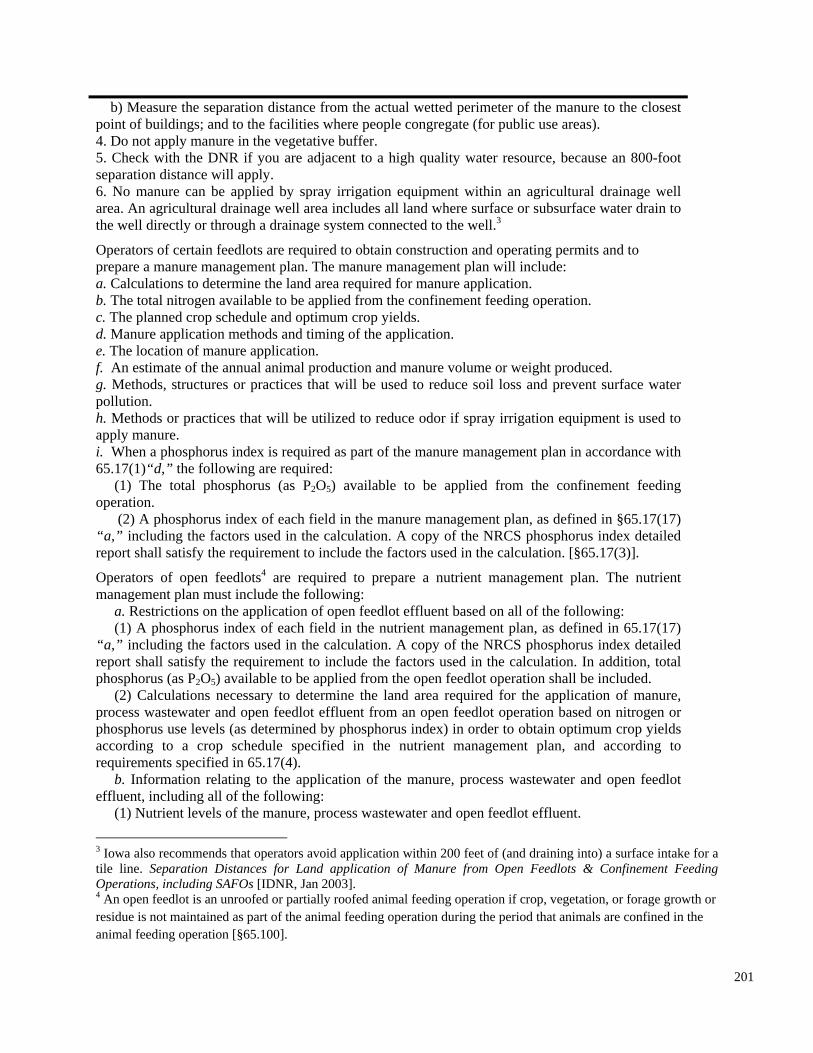
(2) Calculations necessary to determine the land area required for the application of manure,
b) Measure the separation distance from the actual wetted perimeter of the manure to the closest point of buildings; and to the facilities where people congregate (for public use areas). 4. Do not apply manure in the vegetative buffer. 5. Check with the DNR if you are adjacent to a high quality water resource, because an 800-foot separation distance will apply. 6. No manure can be applied by spray irrigation equipment within an agricultural drainage well area. An agricultural drainage well area includes all land where surface or subsurface water drain to the well directly or through a drainage system connected to the well.3
Operators of certain feedlots are required to obtain construction and operating permits and to prepare a manure management plan. The manure management plan will include: a. Calculations to determine the land area required for manure application. b. The total nitrogen available to be applied from the confinement feeding operation. c. The planned crop schedule and optimum crop yields. d. Manure application methods and timing of the application. e. The location of manure application. f. An estimate of the annual animal production and manure volume or weight produced. g. Methods, structures or practices that will be used to reduce soil loss and prevent surface water pollution. h. Methods or practices that will be utilized to reduce odor if spray irrigation equipment is used to apply manure.
process wastewater and open feedlot effluent from an open feedlot operation based on nitrogen or phosphorus use levels (as determined by phosphorus index) in order to obtain optimum crop yields according to a crop schedule specified in the nutrient management plan, and according to requirements specified in 65.17(4).
b. Information relating to the application of the manure, process wastewater and open feedlot effluent, including all of the following:
(1) Nutrient levels of the manure, process wastewater and open feedlot effluent.
3 Iowa also recommends that operators avoid application within 200 feet of (and draining into) a surface intake for a tile line. Separation Distances for Land application of Manure from Open Feedlots & Confinement Feeding Operations, including SAFOs [IDNR, Jan 2003]. 4 An open feedlot is an unroofed or partially roofed animal feeding operation if crop, vegetation, or forage growth or residue is not maintained as part of the animal feeding operation during the period that animals are confined in the animal feeding operation [§65.100].
201
i. When a phosphorus index is required as part of the manure management plan in accordance with 65.17(1)“d,” the following are required:
(1) The total phosphorus (as P2O5) available to be applied from the confinement feeding operation.
(2) A phosphorus index of each field in the manure management plan, as defined in §65.17(17) “a,” including the factors used in the calculation. A copy of the NRCS phosphorus index detailed report shall satisfy the requirement to include the factors used in the calculation. [§65.17(3)].
Operators of open feedlots4 are required to prepare a nutrient management plan. The nutrient management plan must include the following:
a. Restrictions on the application of open feedlot effluent based on all of the following: (1) A phosphorus index of each field in the nutrient management plan, as defined in 65.17(17)
“a,” including the factors used in the calculation. A copy of the NRCS phosphorus index detailed report shall satisfy the requirement to include the factors used in the calculation. In addition, total phosphorus (as P2O5) available to be applied from the open feedlot operation shall be included.

(2) Application methods, the timing of the application, and the location of the land where the application occurs. [§65.112(8)]
202
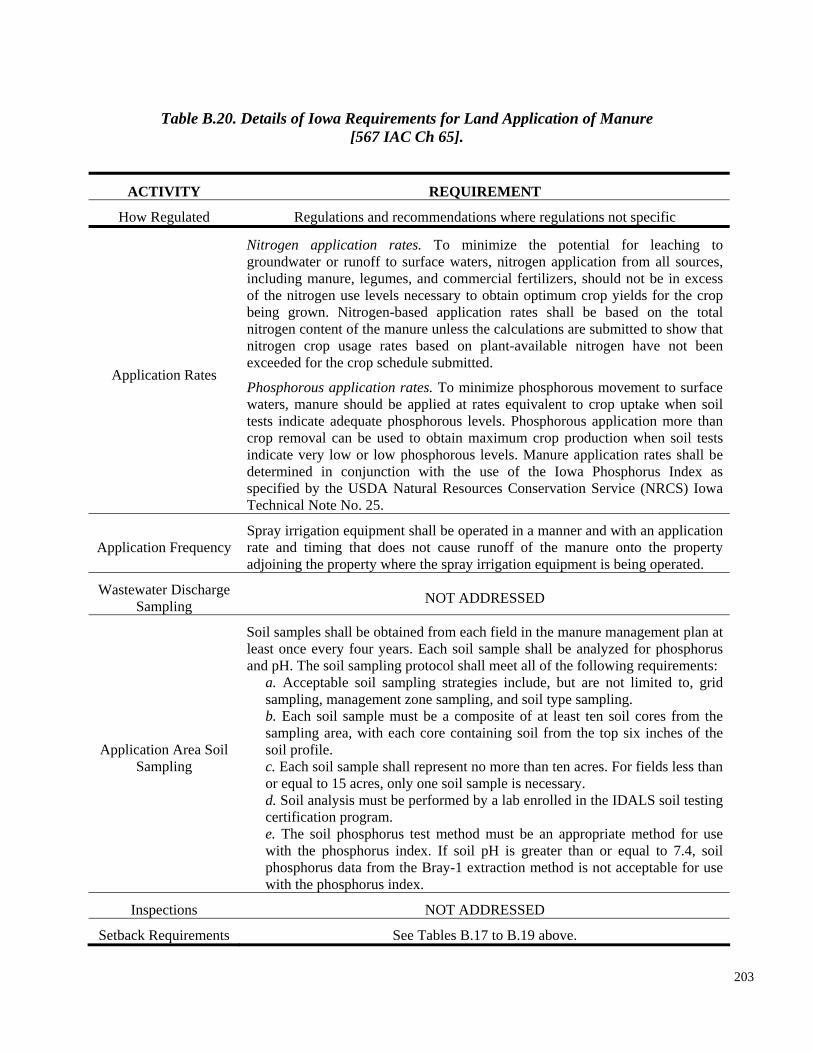
Table B.20. Details of Iowa Requirements for Land Application of Manure [567 IAC Ch 65].
ACTIVITY REQUIREMENT
How Regulated Regulations and recommendations where regulations not specific
Nitrogen application rates. To minimize the potential for leaching to groundwater or runoff to surface waters, nitrogen application from all sources, including manure, legumes, and commercial fertilizers, should not be in excess of the nitrogen use levels necessary to obtain optimum crop yields for the crop being grown. Nitrogen-based application rates shall be based on the total nitrogen content of the manure unless the calculations are submitted to show that nitrogen crop usage rates based on plant-available nitrogen have not been exceeded for the crop schedule submitted.
Application Rates Phosphorous application rates. To minimize phosphorous movement to surface waters, manure should be applied at rates equivalent to crop uptake when soil tests indicate adequate phosphorous levels. Phosphorous application more than
Sampling c. Each soil sample shall represent no more than ten acres. For fields less than or equal to 15 acres, only one soil sample is necessary.
crop removal can be used to obtain maximum crop production when soil tests indicate very low or low phosphorous levels. Manure application rates shall be determined in conjunction with the use of the Iowa Phosphorus Index as specified by the USDA Natural Resources Conservation Service (NRCS) Iowa Technical Note No. 25.
Application Frequency Spray irrigation equipment shall be operated in a manner and with an application rate and timing that does not cause runoff of the manure onto the property adjoining the property where the spray irrigation equipment is being operated.
Wastewater Discharge Sampling NOT ADDRESSED
Application Area Soil
Soil samples shall be obtained from each field in the manure management plan at least once every four years. Each soil sample shall be analyzed for phosphorus and pH. The soil sampling protocol shall meet all of the following requirements:
a. Acceptable soil sampling strategies include, but are not limited to, grid sampling, management zone sampling, and soil type sampling. b. Each soil sample must be a composite of at least ten soil cores from the sampling area, with each core containing soil from the top six inches of the soil profile.
d. Soil analysis must be performed by a lab enrolled in the IDALS soil testing certification program. e. The soil phosphorus test method must be an appropriate method for use with the phosphorus index. If soil pH is greater than or equal to 7.4, soil phosphorus data from the Bray-1 extraction method is not acceptable for use with the phosphorus index.
Inspections NOT ADDRESSED
Setback Requirements See Tables B.17 to B.19 above.
203
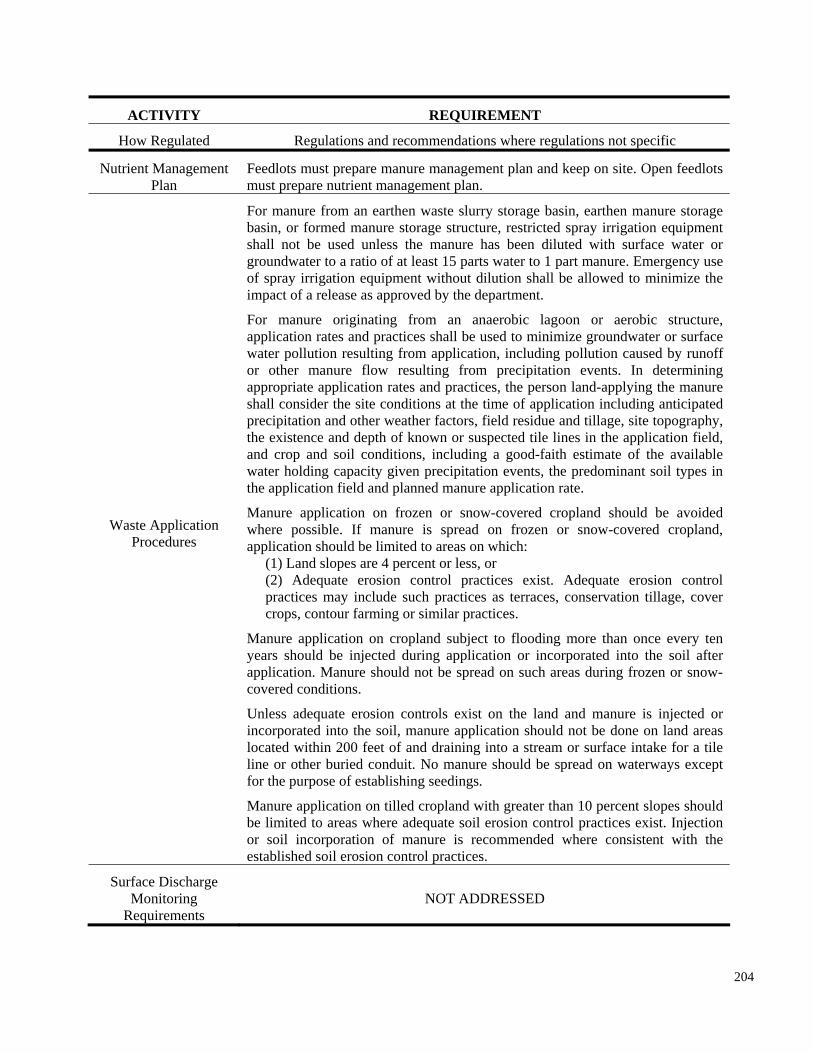
covered conditions.
ACTIVITY REQUIREMENT
How Regulated Regulations and recommendations where regulations not specific
Nutrient Management Feedlots must prepare manure management plan and keep on site. Open feedlots Plan must prepare nutrient management plan.
Surface Discharge Monitoring NOT ADDRESSED
Requirements
Waste Application Procedures
For manure from an earthen waste slurry storage basin, earthen manure storage basin, or formed manure storage structure, restricted spray irrigation equipment shall not be used unless the manure has been diluted with surface water or groundwater to a ratio of at least 15 parts water to 1 part manure. Emergency use of spray irrigation equipment without dilution shall be allowed to minimize the impact of a release as approved by the department.
For manure originating from an anaerobic lagoon or aerobic structure, application rates and practices shall be used to minimize groundwater or surface water pollution resulting from application, including pollution caused by runoff or other manure flow resulting from precipitation events. In determining appropriate application rates and practices, the person land-applying the manure shall consider the site conditions at the time of application including anticipated precipitation and other weather factors, field residue and tillage, site topography,
Unless adequate erosion controls exist on the land and manure is injected or incorporated into the soil, manure application should not be done on land areas located within 200 feet of and draining into a stream or surface intake for a tile line or other buried conduit. No manure should be spread on waterways except for the purpose of establishing seedings.
Manure application on tilled cropland with greater than 10 percent slopes should be limited to areas where adequate soil erosion control practices exist. Injection or soil incorporation of manure is recommended where consistent with the established soil erosion control practices.
204
the existence and depth of known or suspected tile lines in the application field, and crop and soil conditions, including a good-faith estimate of the available water holding capacity given precipitation events, the predominant soil types in the application field and planned manure application rate.
Manure application on frozen or snow-covered cropland should be avoided where possible. If manure is spread on frozen or snow-covered cropland, application should be limited to areas on which:
(1) Land slopes are 4 percent or less, or (2) Adequate erosion control practices exist. Adequate erosion control practices may include such practices as terraces, conservation tillage, cover crops, contour farming or similar practices.
Manure application on cropland subject to flooding more than once every ten years should be injected during application or incorporated into the soil after application. Manure should not be spread on such areas during frozen or snow-
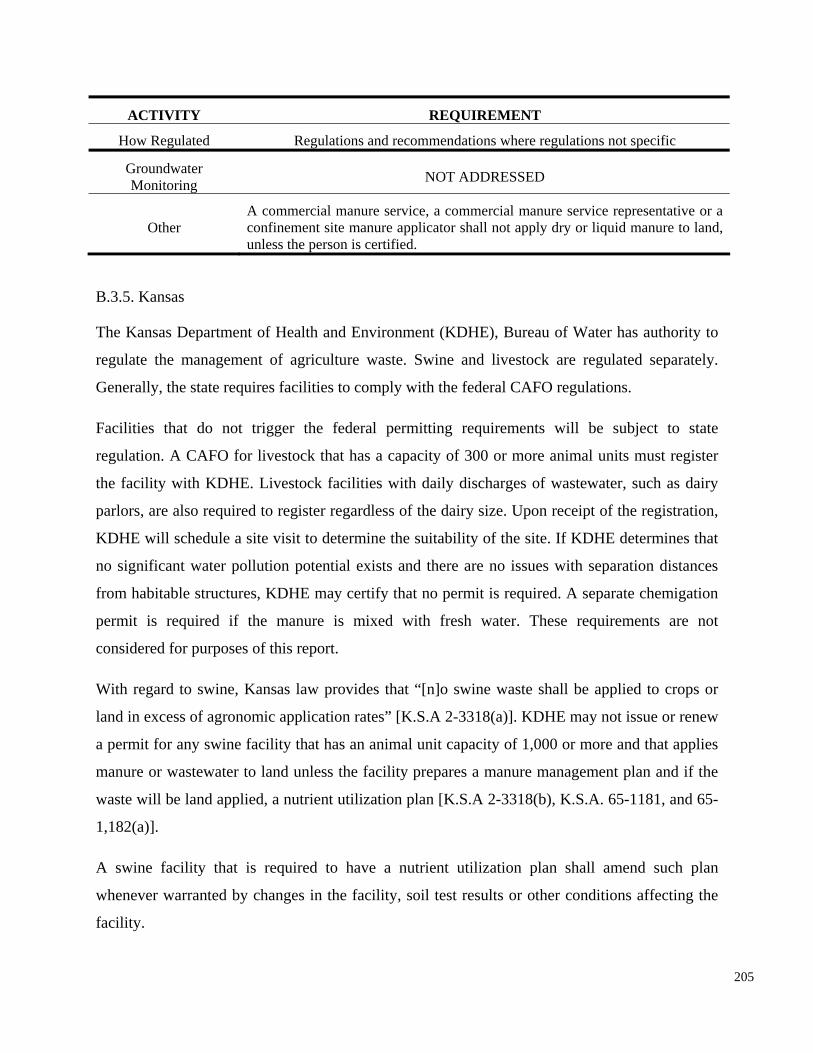
ACTIVITY REQUIREMENT
How Regulated Regulations and recommendations where regulations not specific
Groundwater NOT ADDRESSEDMonitoring
A commercial manure service, a commercial manure service representative or a Other confinement site manure applicator shall not apply dry or liquid manure to land,
unless the person is certified.
B.3.5. Kansas
The Kansas Department of Health and Environment (KDHE), Bureau of Water has authority to
regulate the management of agriculture waste. Swine and livestock are regulated separately.
Generally, the state requires facilities to comply with the federal CAFO regulations.
Facilities that do not trigger the federal permitting requirements will be subject to state
considered for purposes of this report.
With regard to swine, Kansas law provides that “[n]o swine waste shall be applied to crops or
land in excess of agronomic application rates” [K.S.A 2-3318(a)]. KDHE may not issue or renew
a permit for any swine facility that has an animal unit capacity of 1,000 or more and that applies
manure or wastewater to land unless the facility prepares a manure management plan and if the
waste will be land applied, a nutrient utilization plan [K.S.A 2-3318(b), K.S.A. 65-1181, and 65
1,182(a)].
A swine facility that is required to have a nutrient utilization plan shall amend such plan
whenever warranted by changes in the facility, soil test results or other conditions affecting the
facility.
205
regulation. A CAFO for livestock that has a capacity of 300 or more animal units must register
the facility with KDHE. Livestock facilities with daily discharges of wastewater, such as dairy
parlors, are also required to register regardless of the dairy size. Upon receipt of the registration,
KDHE will schedule a site visit to determine the suitability of the site. If KDHE determines that
no significant water pollution potential exists and there are no issues with separation distances
from habitable structures, KDHE may certify that no permit is required. A separate chemigation
permit is required if the manure is mixed with fresh water. These requirements are not
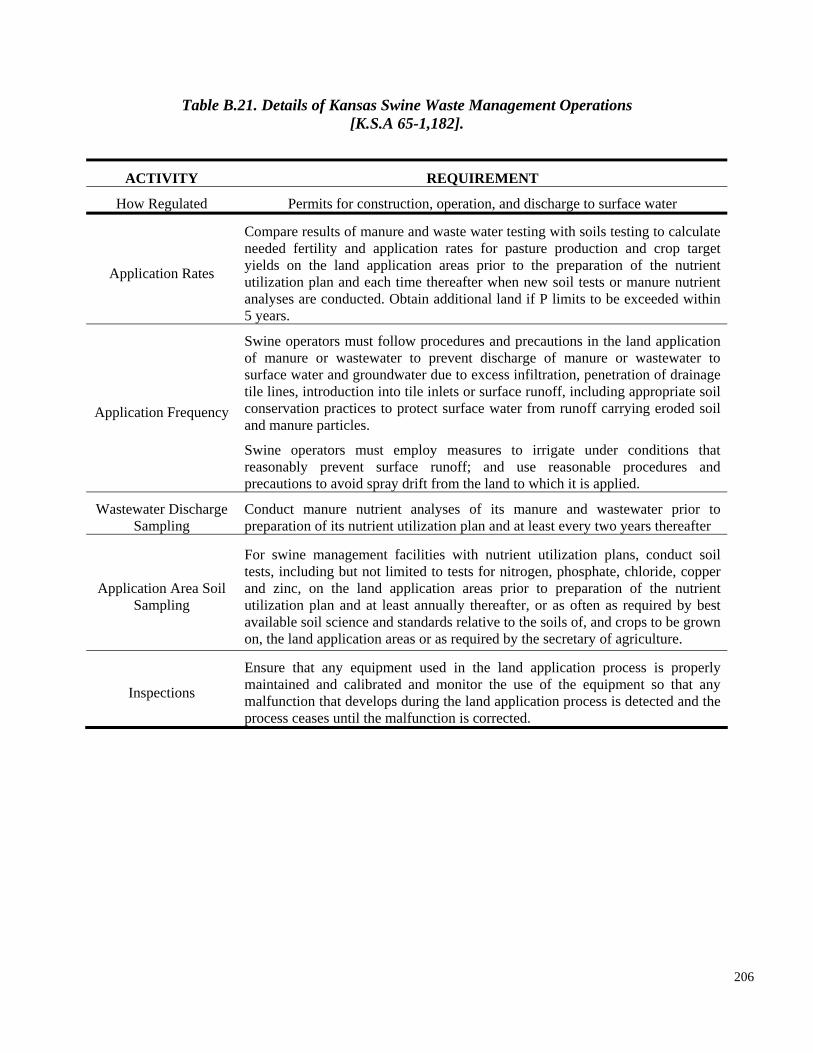
Table B.21. Details of Kansas Swine Waste Management Operations [K.S.A 65-1,182].
ACTIVITY REQUIREMENT
How Regulated Permits for construction, operation, and discharge to surface water
Compare results of manure and waste water testing with soils testing to calculate needed fertility and application rates for pasture production and crop target yields on the land application areas prior to the preparation of the nutrient Application Rates utilization plan and each time thereafter when new soil tests or manure nutrient
Wastewater Discharge Sampling
Conduct manure nutrient analyses of its manure and wastewater prior to preparation of its nutrient utilization plan and at least every two years thereafter
Application Area Soil Sampling
For swine management facilities with nutrient utilization plans, conduct soil tests, including but not limited to tests for nitrogen, phosphate, chloride, copper and zinc, on the land application areas prior to preparation of the nutrient utilization plan and at least annually thereafter, or as often as required by best available soil science and standards relative to the soils of, and crops to be grown on, the land application areas or as required by the secretary of agriculture.
Inspections
Ensure that any equipment used in the land application process is properly maintained and calibrated and monitor the use of the equipment so that any malfunction that develops during the land application process is detected and the process ceases until the malfunction is corrected.
206
analyses are conducted. Obtain additional land if P limits to be exceeded within 5 years.
Application Frequency
Swine operators must follow procedures and precautions in the land application of manure or wastewater to prevent discharge of manure or wastewater to surface water and groundwater due to excess infiltration, penetration of drainage tile lines, introduction into tile inlets or surface runoff, including appropriate soil conservation practices to protect surface water from runoff carrying eroded soil and manure particles.
Swine operators must employ measures to irrigate under conditions that reasonably prevent surface runoff; and use reasonable procedures and precautions to avoid spray drift from the land to which it is applied.
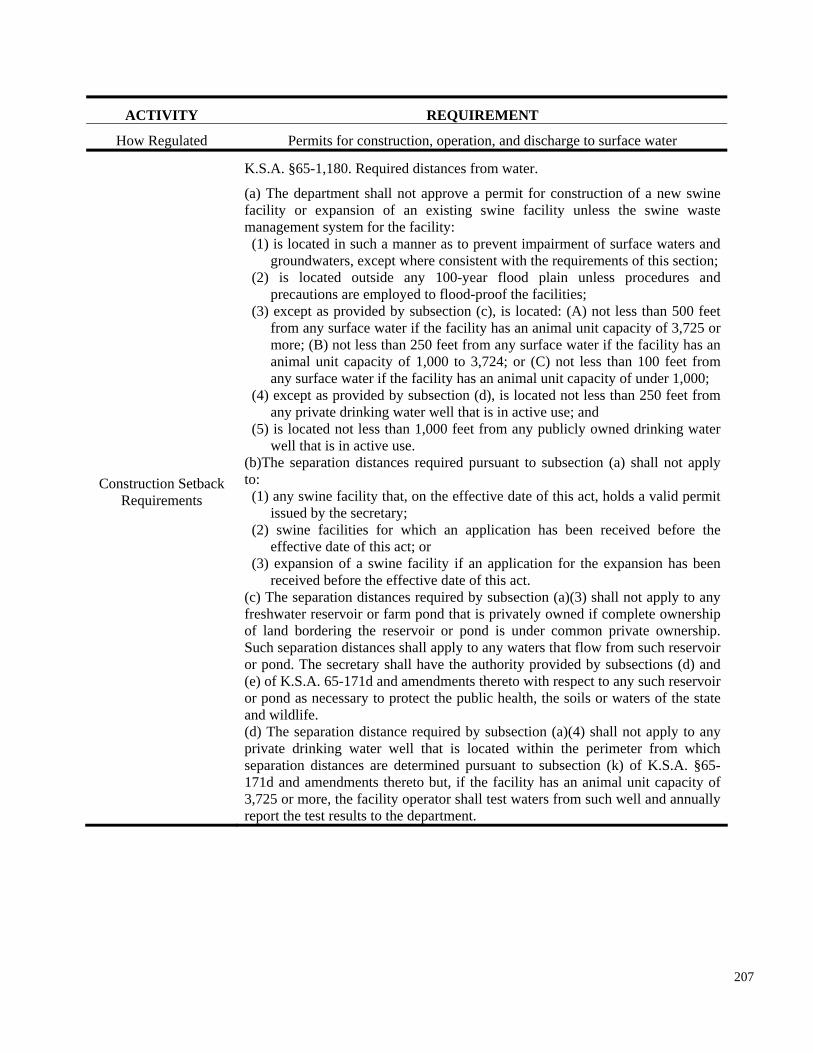
and wildlife.
ACTIVITY REQUIREMENT
How Regulated Permits for construction, operation, and discharge to surface water
Construction Setback Requirements
K.S.A. §65-1,180. Required distances from water.
(a) The department shall not approve a permit for construction of a new swine facility or expansion of an existing swine facility unless the swine waste management system for the facility: (1) is located in such a manner as to prevent impairment of surface waters and
groundwaters, except where consistent with the requirements of this section; (2) is located outside any 100-year flood plain unless procedures and
any private drinking water well that is in active use; and (5) is located not less than 1,000 feet from any publicly owned drinking water
well that is in active use. (b)The separation distances required pursuant to subsection (a) shall not apply to: (1) any swine facility that, on the effective date of this act, holds a valid permit
issued by the secretary; (2) swine facilities for which an application has been received before the
effective date of this act; or(3) expansion of a swine facility if an application for the expansion has been
received before the effective date of this act. (c) The separation distances required by subsection (a)(3) shall not apply to any freshwater reservoir or farm pond that is privately owned if complete ownership of land bordering the reservoir or pond is under common private ownership. Such separation distances shall apply to any waters that flow from such reservoir or pond. The secretary shall have the authority provided by subsections (d) and (e) of K.S.A. 65-171d and amendments thereto with respect to any such reservoir
precautions are employed to flood-proof the facilities; (3) except as provided by subsection (c), is located: (A) not less than 500 feet
from any surface water if the facility has an animal unit capacity of 3,725 or more; (B) not less than 250 feet from any surface water if the facility has an animal unit capacity of 1,000 to 3,724; or (C) not less than 100 feet from any surface water if the facility has an animal unit capacity of under 1,000;
(4) except as provided by subsection (d), is located not less than 250 feet from
or pond as necessary to protect the public health, the soils or waters of the state
(d) The separation distance required by subsection (a)(4) shall not apply to any private drinking water well that is located within the perimeter from which separation distances are determined pursuant to subsection (k) of K.S.A. §65171d and amendments thereto but, if the facility has an animal unit capacity of 3,725 or more, the facility operator shall test waters from such well and annually report the test results to the department.
207
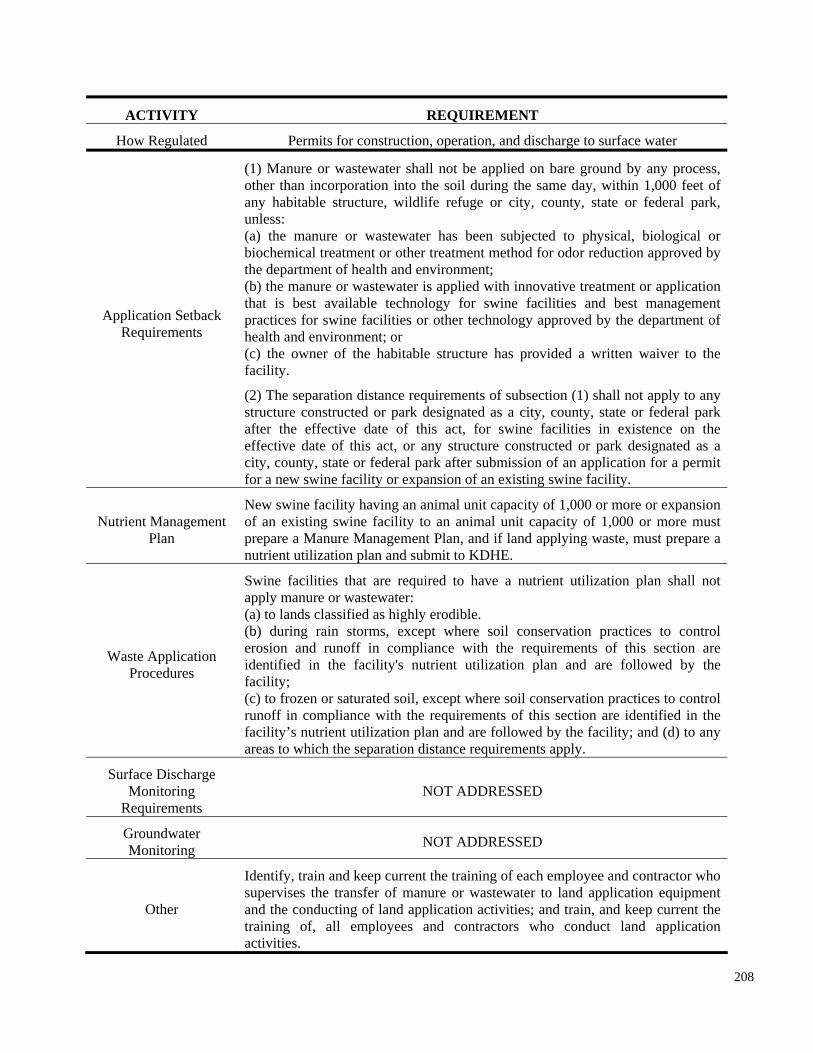
ACTIVITY REQUIREMENT
How Regulated Permits for construction, operation, and discharge to surface water
(1) Manure or wastewater shall not be applied on bare ground by any process, other than incorporation into the soil during the same day, within 1,000 feet of any habitable structure, wildlife refuge or city, county, state or federal park, unless: (a) the manure or wastewater has been subjected to physical, biological or biochemical treatment or other treatment method for odor reduction approved by the department of health and environment; (b) the manure or wastewater is applied with innovative treatment or application that is best available technology for swine facilities and best management practices for swine facilities or other technology approved by the department of health and environment; or (c) the owner of the habitable structure has provided a written waiver to the facility.
(2) The separation distance requirements of subsection (1) shall not apply to any structure constructed or park designated as a city, county, state or federal park after the effective date of this act, for swine facilities in existence on the effective date of this act, or any structure constructed or park designated as a city, county, state or federal park after submission of an application for a permit for a new swine facility or expansion of an existing swine facility.
New swine facility having an animal unit capacity of 1,000 or more or expansion of an existing swine facility to an animal unit capacity of 1,000 or more must prepare a Manure Management Plan, and if land applying waste, must prepare a nutrient utilization plan and submit to KDHE.
Waste Application Procedures
Swine facilities that are required to have a nutrient utilization plan shall not apply manure or wastewater: (a) to lands classified as highly erodible. (b) during rain storms, except where soil conservation practices to control erosion and runoff in compliance with the requirements of this section are identified in the facility's nutrient utilization plan and are followed by the facility; (c) to frozen or saturated soil, except where soil conservation practices to control runoff in compliance with the requirements of this section are identified in the facility’s nutrient utilization plan and are followed by the facility; and (d) to any areas to which the separation distance requirements apply.
Surface Discharge Monitoring
Requirements NOT ADDRESSED
Application Setback Requirements
Nutrient Management Plan
Groundwater NOT ADDRESSEDMonitoring
Identify, train and keep current the training of each employee and contractor who supervises the transfer of manure or wastewater to land application equipment
Other and the conducting of land application activities; and train, and keep current the training of, all employees and contractors who conduct land application activities.
208
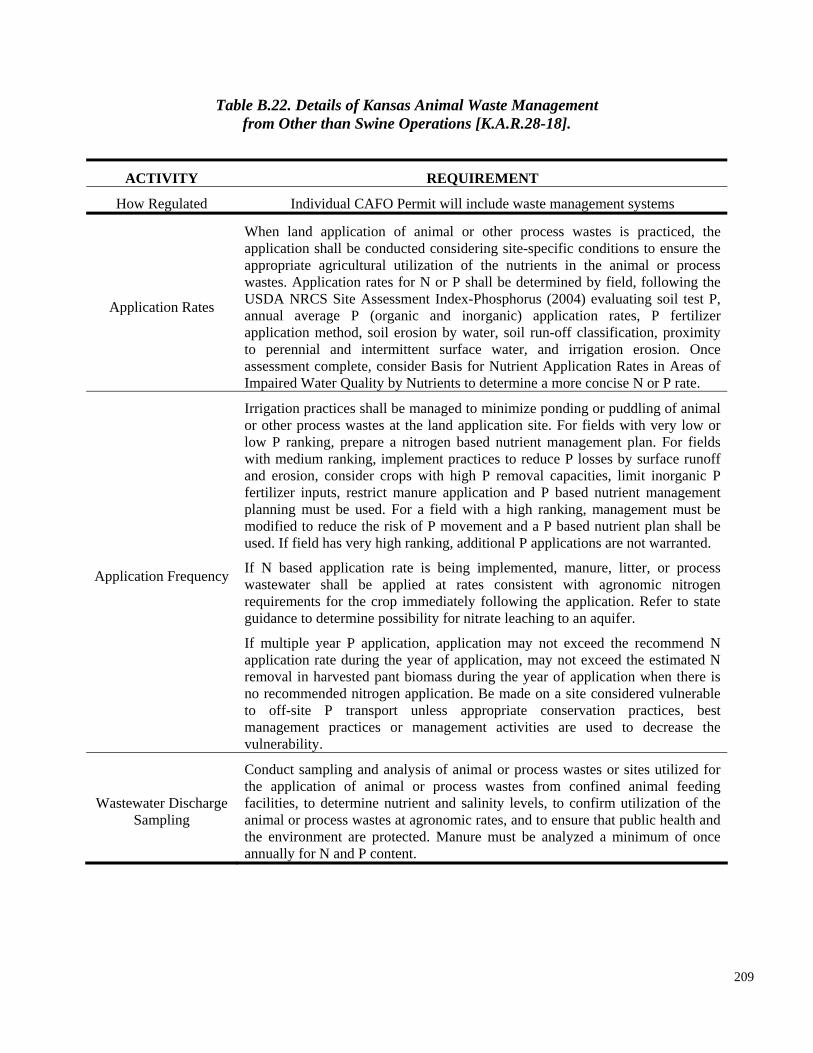
Table B.22. Details of Kansas Animal Waste Management from Other than Swine Operations [K.A.R.28-18].
ACTIVITY REQUIREMENT
How Regulated Individual CAFO Permit will include waste management systems
no recommended nitrogen application. Be made on a site considered vulnerable to off-site P transport unless appropriate conservation practices, best management practices or management activities are used to decrease the vulnerability.
Wastewater Discharge Sampling
Conduct sampling and analysis of animal or process wastes or sites utilized for the application of animal or process wastes from confined animal feeding facilities, to determine nutrient and salinity levels, to confirm utilization of the animal or process wastes at agronomic rates, and to ensure that public health and the environment are protected. Manure must be analyzed a minimum of once annually for N and P content.
Application Rates
When land application of animal or other process wastes is practiced, the application shall be conducted considering site-specific conditions to ensure the appropriate agricultural utilization of the nutrients in the animal or process wastes. Application rates for N or P shall be determined by field, following the USDA NRCS Site Assessment Index-Phosphorus (2004) evaluating soil test P, annual average P (organic and inorganic) application rates, P fertilizer application method, soil erosion by water, soil run-off classification, proximity to perennial and intermittent surface water, and irrigation erosion. Once assessment complete, consider Basis for Nutrient Application Rates in Areas of Impaired Water Quality by Nutrients to determine a more concise N or P rate.
Application Frequency
209
Irrigation practices shall be managed to minimize ponding or puddling of animal or other process wastes at the land application site. For fields with very low or low P ranking, prepare a nitrogen based nutrient management plan. For fields with medium ranking, implement practices to reduce P losses by surface runoff and erosion, consider crops with high P removal capacities, limit inorganic P fertilizer inputs, restrict manure application and P based nutrient management planning must be used. For a field with a high ranking, management must be modified to reduce the risk of P movement and a P based nutrient plan shall be used. If field has very high ranking, additional P applications are not warranted.
If N based application rate is being implemented, manure, litter, or process wastewater shall be applied at rates consistent with agronomic nitrogen requirements for the crop immediately following the application. Refer to state guidance to determine possibility for nitrate leaching to an aquifer.
If multiple year P application, application may not exceed the recommend N application rate during the year of application, may not exceed the estimated N removal in harvested pant biomass during the year of application when there is
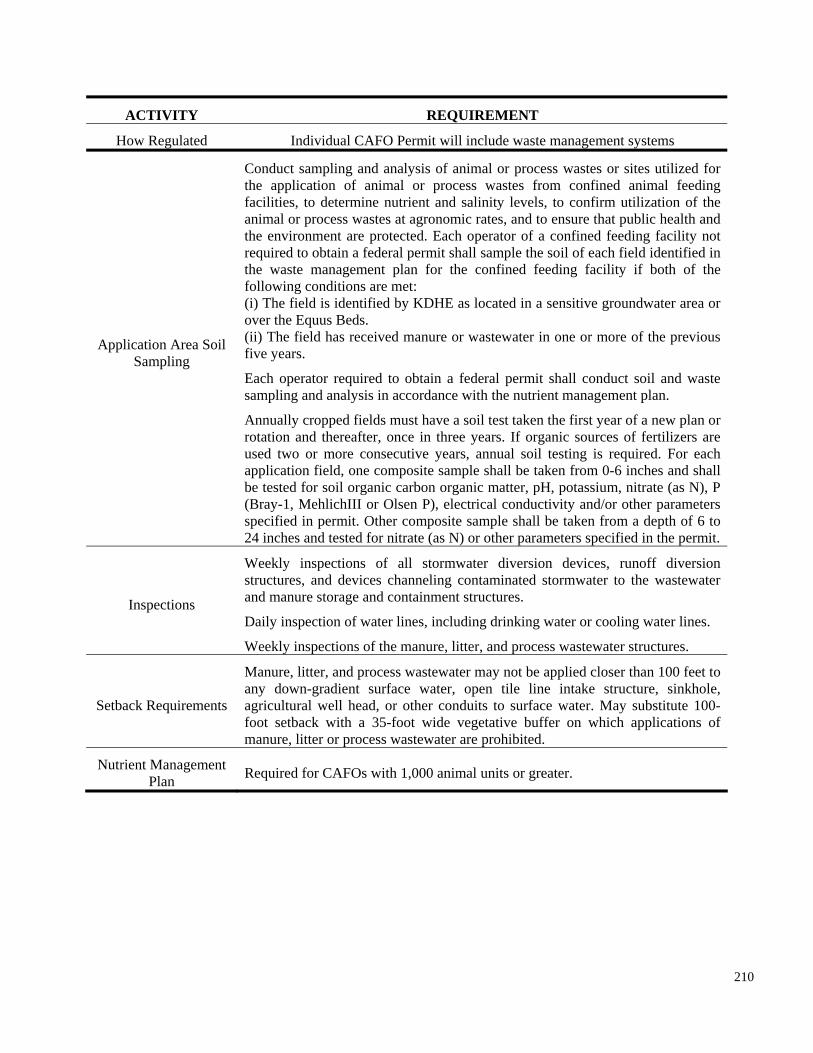
(i) The field is identified by KDHE as located in a sensitive groundwater area or over the Equus Beds. (ii) The field has received manure or wastewater in one or more of the previous five years.
Each operator required to obtain a federal permit shall conduct soil and waste sampling and analysis in accordance with the nutrient management plan.
Annually cropped fields must have a soil test taken the first year of a new plan or rotation and thereafter, once in three years. If organic sources of fertilizers are used two or more consecutive years, annual soil testing is required. For each application field, one composite sample shall be taken from 0-6 inches and shall be tested for soil organic carbon organic matter, pH, potassium, nitrate (as N), P (Bray-1, MehlichIII or Olsen P), electrical conductivity and/or other parameters
ACTIVITY REQUIREMENT
How Regulated Individual CAFO Permit will include waste management systems
Setback Requirements
Manure, litter, and process wastewater may not be applied closer than 100 feet to any down-gradient surface water, open tile line intake structure, sinkhole, agricultural well head, or other conduits to surface water. May substitute 100foot setback with a 35-foot wide vegetative buffer on which applications of manure, litter or process wastewater are prohibited.
Nutrient Management Required for CAFOs with 1,000 animal units or greater. Plan
Application Area Soil Sampling
Conduct sampling and analysis of animal or process wastes or sites utilized for the application of animal or process wastes from confined animal feeding facilities, to determine nutrient and salinity levels, to confirm utilization of the animal or process wastes at agronomic rates, and to ensure that public health and the environment are protected. Each operator of a confined feeding facility not required to obtain a federal permit shall sample the soil of each field identified in the waste management plan for the confined feeding facility if both of the following conditions are met:
210
specified in permit. Other composite sample shall be taken from a depth of 6 to 24 inches and tested for nitrate (as N) or other parameters specified in the permit.
Inspections
Weekly inspections of all stormwater diversion devices, runoff diversion structures, and devices channeling contaminated stormwater to the wastewater and manure storage and containment structures.
Daily inspection of water lines, including drinking water or cooling water lines.
Weekly inspections of the manure, litter, and process wastewater structures.
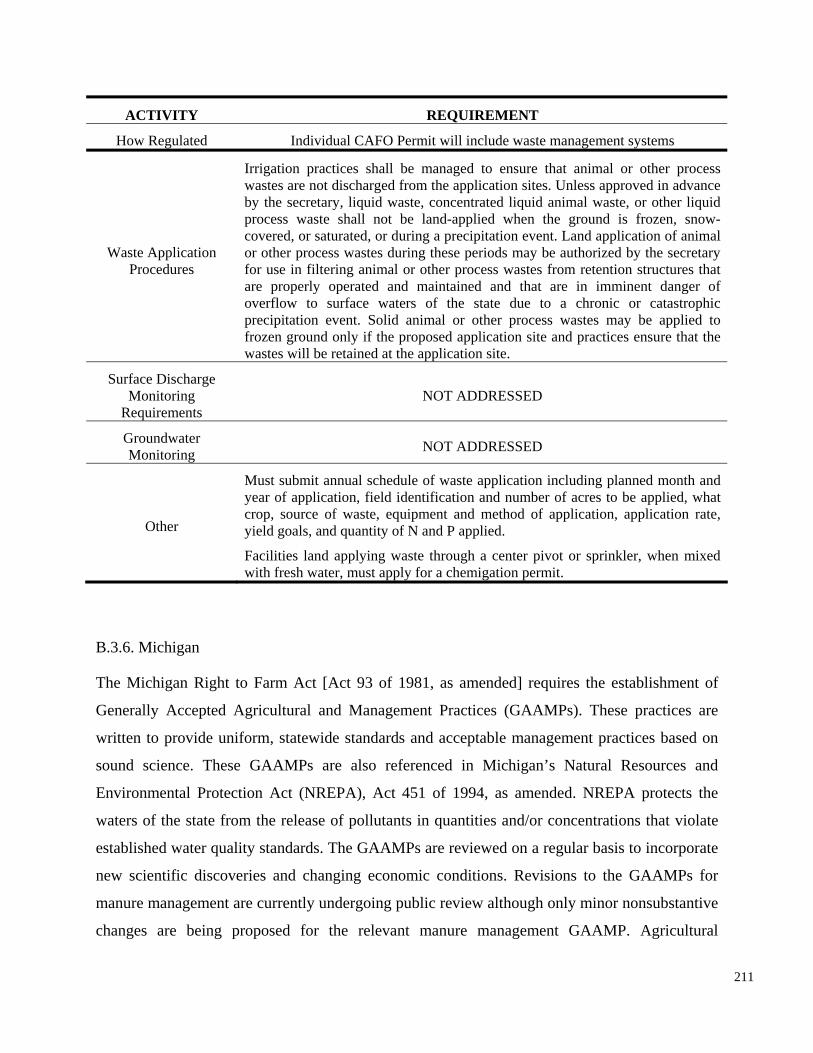
ACTIVITY REQUIREMENT
How Regulated Individual CAFO Permit will include waste management systems
Waste Application Procedures
Irrigation practices shall be managed to ensure that animal or other process wastes are not discharged from the application sites. Unless approved in advance by the secretary, liquid waste, concentrated liquid animal waste, or other liquid process waste shall not be land-applied when the ground is frozen, snow-covered, or saturated, or during a precipitation event. Land application of animal or other process wastes during these periods may be authorized by the secretary for use in filtering animal or other process wastes from retention structures that are properly operated and maintained and that are in imminent danger of overflow to surface waters of the state due to a chronic or catastrophic precipitation event. Solid animal or other process wastes may be applied to frozen ground only if the proposed application site and practices ensure that the wastes will be retained at the application site.
Surface Discharge Monitoring
Requirements NOT ADDRESSED
Groundwater Monitoring NOT ADDRESSED
Other
Must submit annual schedule of waste application including planned month and year of application, field identification and number of acres to be applied, what crop, source of waste, equipment and method of application, application rate, yield goals, and quantity of N and P applied.
Facilities land applying waste through a center pivot or sprinkler, when mixed with fresh water, must apply for a chemigation permit.
B.3.6. Michigan
The Michigan Right to Farm Act [Act 93 of 1981, as amended] requires the establishment of
Generally Accepted Agricultural and Management Practices (GAAMPs). These practices are
written to provide uniform, statewide standards and acceptable management practices based on
sound science. These GAAMPs are also referenced in Michigan’s Natural Resources and
Environmental Protection Act (NREPA), Act 451 of 1994, as amended. NREPA protects the
waters of the state from the release of pollutants in quantities and/or concentrations that violate
established water quality standards. The GAAMPs are reviewed on a regular basis to incorporate
new scientific discoveries and changing economic conditions. Revisions to the GAAMPs for
manure management are currently undergoing public review although only minor nonsubstantive
changes are being proposed for the relevant manure management GAAMP. Agricultural
211
producers who voluntarily follow these practices are provided protection from public or private
nuisance litigation under the Right to Farm Act.
The relevant GAAMP is titled: Generally Accepted Agricultural and Management Practices for
Manure Management and Utilization (June 2007). This guidance is divided into four topics: 1)
runoff control and wastewater management; 2) odor management; 3) construction and design for
manure storage and treatment; and 4) manure application to land. This summary will focus on
the third and fourth categories: runoff control and wastewater management and manure
application. (A separate GAAMP for Nutrient Management relates primarily to nitrogen in
commercial fertilizers will not be reviewed.)
The following is a summary of the main requirements in the GAAMPs for manure management.
212
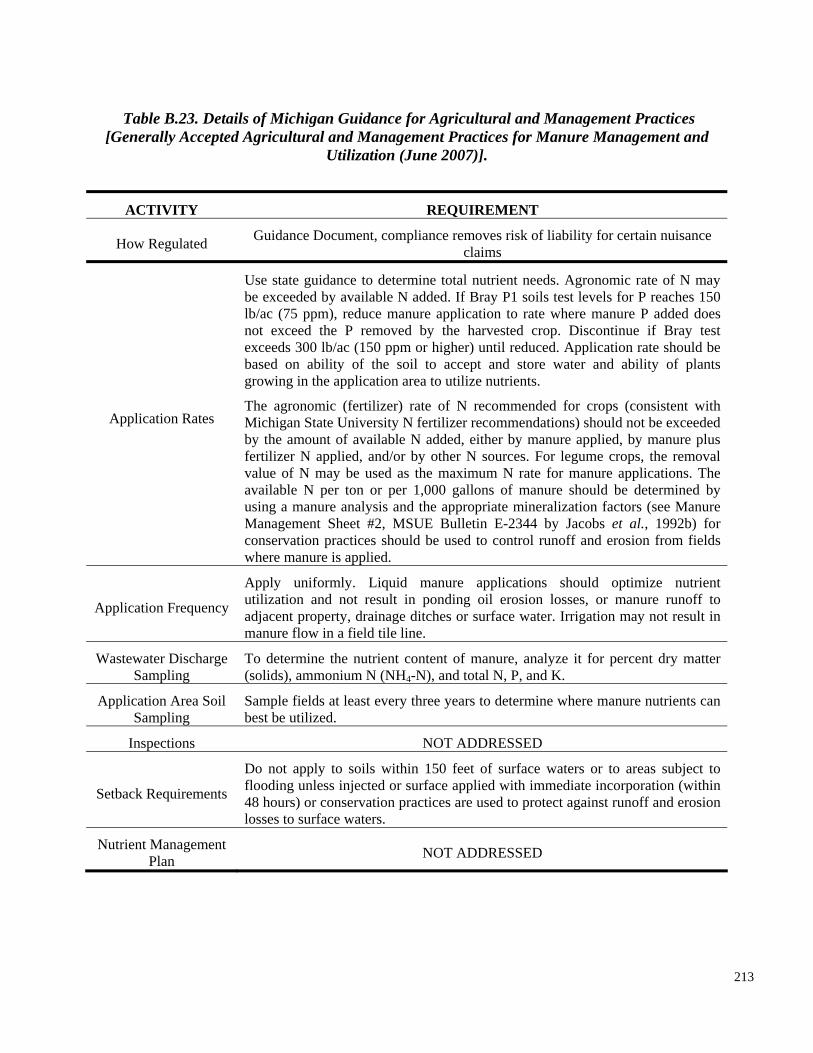
Table B.23. Details of Michigan Guidance for Agricultural and Management Practices [Generally Accepted Agricultural and Management Practices for Manure Management and
Utilization (June 2007)].
ACTIVITY REQUIREMENT
Guidance Document, compliance removes risk of liability for certain nuisance How Regulated claims
Management Sheet #2, MSUE Bulletin E-2344 by Jacobs et al., 1992b) for conservation practices should be used to control runoff and erosion from fields where manure is applied.
Application Frequency
Apply uniformly. Liquid manure applications should optimize nutrient utilization and not result in ponding oil erosion losses, or manure runoff to adjacent property, drainage ditches or surface water. Irrigation may not result in manure flow in a field tile line.
Wastewater Discharge Sampling
To determine the nutrient content of manure, analyze it for percent dry matter (solids), ammonium N (NH4-N), and total N, P, and K.
Application Area Soil Sampling
Sample fields at least every three years to determine where manure nutrients can best be utilized.
Inspections NOT ADDRESSED
Setback Requirements
Do not apply to soils within 150 feet of surface waters or to areas subject to flooding unless injected or surface applied with immediate incorporation (within 48 hours) or conservation practices are used to protect against runoff and erosion losses to surface waters.
Nutrient Management NOT ADDRESSEDPlan
Application Rates
213
Use state guidance to determine total nutrient needs. Agronomic rate of N may be exceeded by available N added. If Bray P1 soils test levels for P reaches 150 lb/ac (75 ppm), reduce manure application to rate where manure P added does not exceed the P removed by the harvested crop. Discontinue if Bray test exceeds 300 lb/ac (150 ppm or higher) until reduced. Application rate should be based on ability of the soil to accept and store water and ability of plants growing in the application area to utilize nutrients.
The agronomic (fertilizer) rate of N recommended for crops (consistent with Michigan State University N fertilizer recommendations) should not be exceeded by the amount of available N added, either by manure applied, by manure plus fertilizer N applied, and/or by other N sources. For legume crops, the removal value of N may be used as the maximum N rate for manure applications. The available N per ton or per 1,000 gallons of manure should be determined by using a manure analysis and the appropriate mineralization factors (see Manure
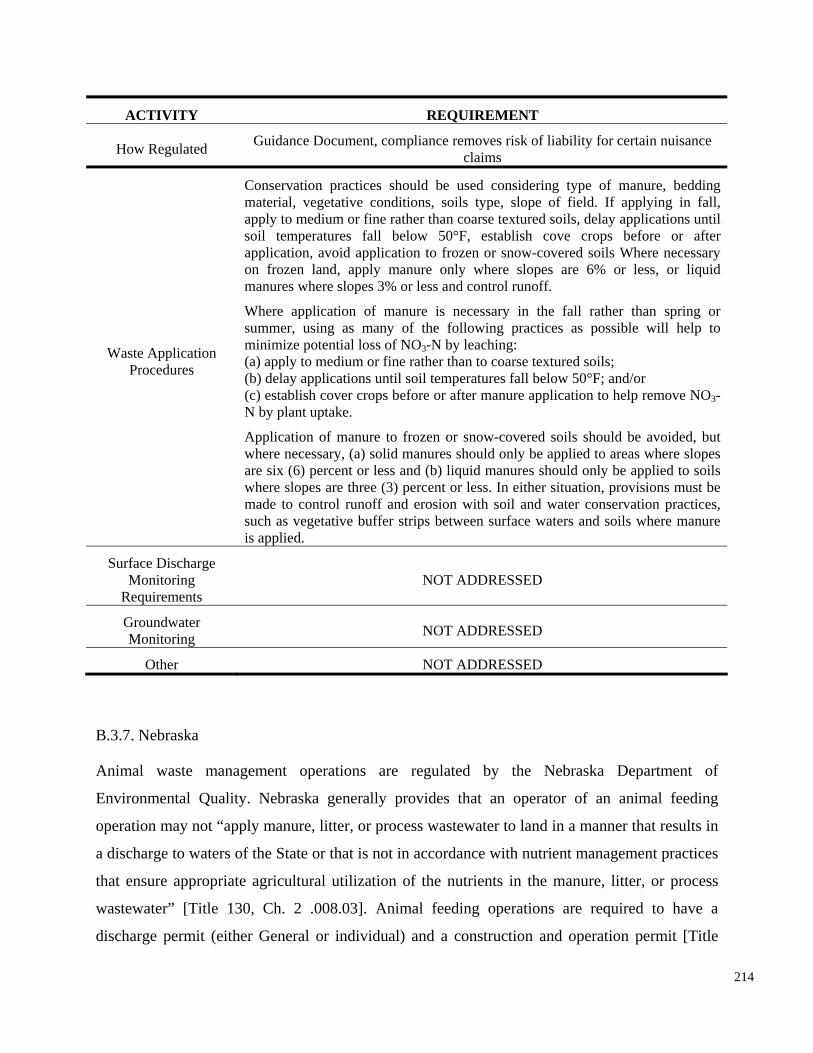
ACTIVITY REQUIREMENT
Guidance Document, compliance removes risk of liability for certain nuisance How Regulated claims
Conservation practices should be used considering type of manure, bedding material, vegetative conditions, soils type, slope of field. If applying in fall, apply to medium or fine rather than coarse textured soils, delay applications until soil temperatures fall below 50°F, establish cove crops before or after application, avoid application to frozen or snow-covered soils Where necessary on frozen land, apply manure only where slopes are 6% or less, or liquid manures where slopes 3% or less and control runoff.
Animal waste management operations are regulated by the Nebraska Department of
Environmental Quality. Nebraska generally provides that an operator of an animal feeding
operation may not “apply manure, litter, or process wastewater to land in a manner that results in
a discharge to waters of the State or that is not in accordance with nutrient management practices
that ensure appropriate agricultural utilization of the nutrients in the manure, litter, or process
wastewater” [Title 130, Ch. 2 .008.03]. Animal feeding operations are required to have a
discharge permit (either General or individual) and a construction and operation permit [Title
Waste Application Procedures
Where application of manure is necessary in the fall rather than spring or summer, using as many of the following practices as possible will help to minimize potential loss of NO3-N by leaching: (a) apply to medium or fine rather than to coarse textured soils; (b) delay applications until soil temperatures fall below 50°F; and/or (c) establish cover crops before or after manure application to help remove NO3-N by plant uptake.
Application of manure to frozen or snow-covered soils should be avoided, but where necessary, (a) solid manures should only be applied to areas where slopes are six (6) percent or less and (b) liquid manures should only be applied to soils where slopes are three (3) percent or less. In either situation, provisions must be made to control runoff and erosion with soil and water conservation practices, such as vegetative buffer strips between surface waters and soils where manure is applied.
Surface Discharge Monitoring
Requirements NOT ADDRESSED
Groundwater Monitoring NOT ADDRESSED
Other NOT ADDRESSED
B.3.7. Nebraska
214
livestock waste control facilities shall be operated and maintained to prevent water pollution and
to protect the environment of the State. The regulations specify that best management practices
“shall be implemented using the most effective methods based on the best available technology
achievable for specific sites to prevent or reduce the discharge of pollutants to waters of the State
and control odor where appropriate” [130 Ch. 11.001].
130 Ch. 5]. Permitted large beef, dairy, heifer, swine, poultry, horse, sheep, and veal
concentrated animal feeding operations that land apply manure, litter, or process wastewater,
discharges from the land application areas under control of the permittee are required to prepare
a nutrient management plan and a production area plan [Title 130 Ch. 13.005.1].
Permitted horse and sheep large concentrated animal feeding operations that land apply manure,
litter, or process wastewater, discharges from the land application areas will have management
plan requirements developed by the agency [Title 130 Ch.7.006]. Animal feeding operations and
215
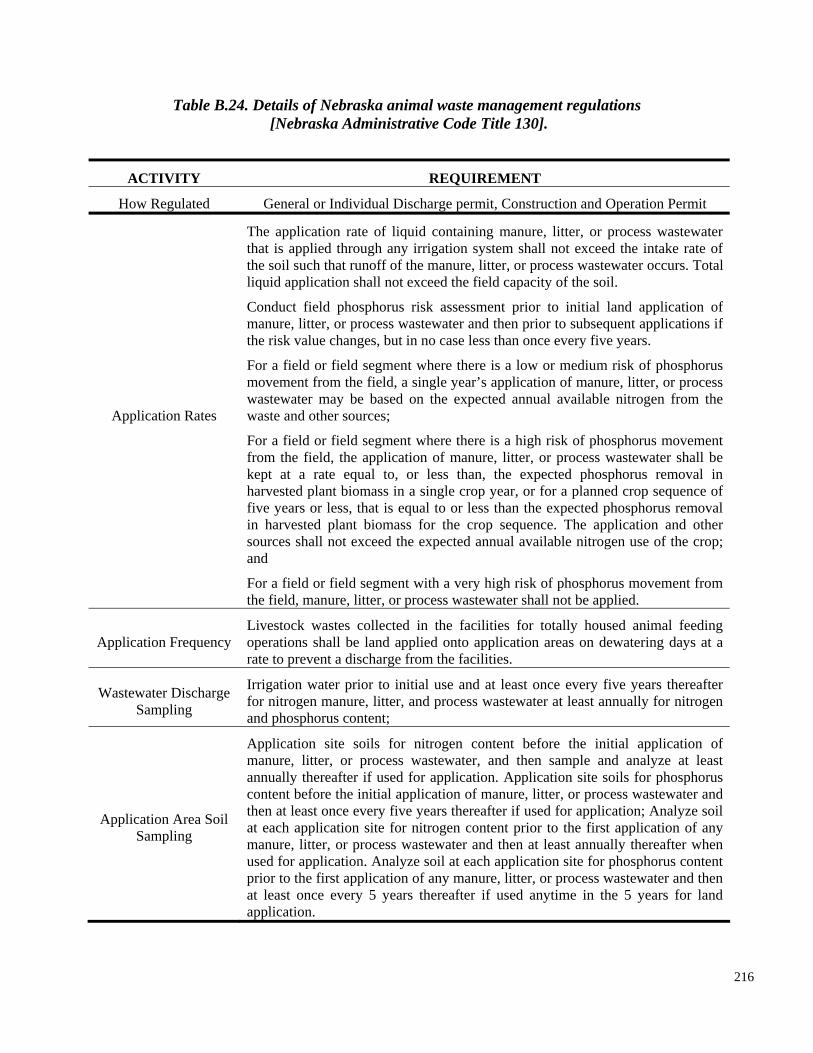
The application rate of liquid containing manure, litter, or process wastewater that is applied through any irrigation system shall not exceed the intake rate of the soil such that runoff of the manure, litter, or process wastewater occurs. Total liquid application shall not exceed the field capacity of the soil.
Conduct field phosphorus risk assessment prior to initial land application of manure, litter, or process wastewater and then prior to subsequent applications if the risk value changes, but in no case less than once every five years.
For a field or field segment where there is a low or medium risk of phosphorus movement from the field, a single year’s application of manure, litter, or process wastewater may be based on the expected annual available nitrogen from the waste and other sources;
For a field or field segment where there is a high risk of phosphorus movement from the field, the application of manure, litter, or process wastewater shall be kept at a rate equal to, or less than, the expected phosphorus removal in harvested plant biomass in a single crop year, or for a planned crop sequence of five years or less, that is equal to or less than the expected phosphorus removal in harvested plant biomass for the crop sequence. The application and other sources shall not exceed the expected annual available nitrogen use of the crop; and
For a field or field segment with a very high risk of phosphorus movement from the field, manure, litter, or process wastewater shall not be applied.
Application Frequency Livestock wastes collected in the facilities for totally housed animal feeding operations shall be land applied onto application areas on dewatering days at a rate to prevent a discharge from the facilities.
Wastewater Discharge Sampling
Irrigation water prior to initial use and at least once every five years thereafter for nitrogen manure, litter, and process wastewater at least annually for nitrogen and phosphorus content;
Table B.24. Details of Nebraska animal waste management regulations [Nebraska Administrative Code Title 130].
ACTIVITY REQUIREMENT
How Regulated General or Individual Discharge permit, Construction and Operation Permit
Application Rates
Application Area Soil Sampling
Application site soils for nitrogen content before the initial application of manure, litter, or process wastewater, and then sample and analyze at least annually thereafter if used for application. Application site soils for phosphorus content before the initial application of manure, litter, or process wastewater and then at least once every five years thereafter if used for application; Analyze soil at each application site for nitrogen content prior to the first application of any manure, litter, or process wastewater and then at least annually thereafter when used for application. Analyze soil at each application site for phosphorus content prior to the first application of any manure, litter, or process wastewater and then at least once every 5 years thereafter if used anytime in the 5 years for land application.
216
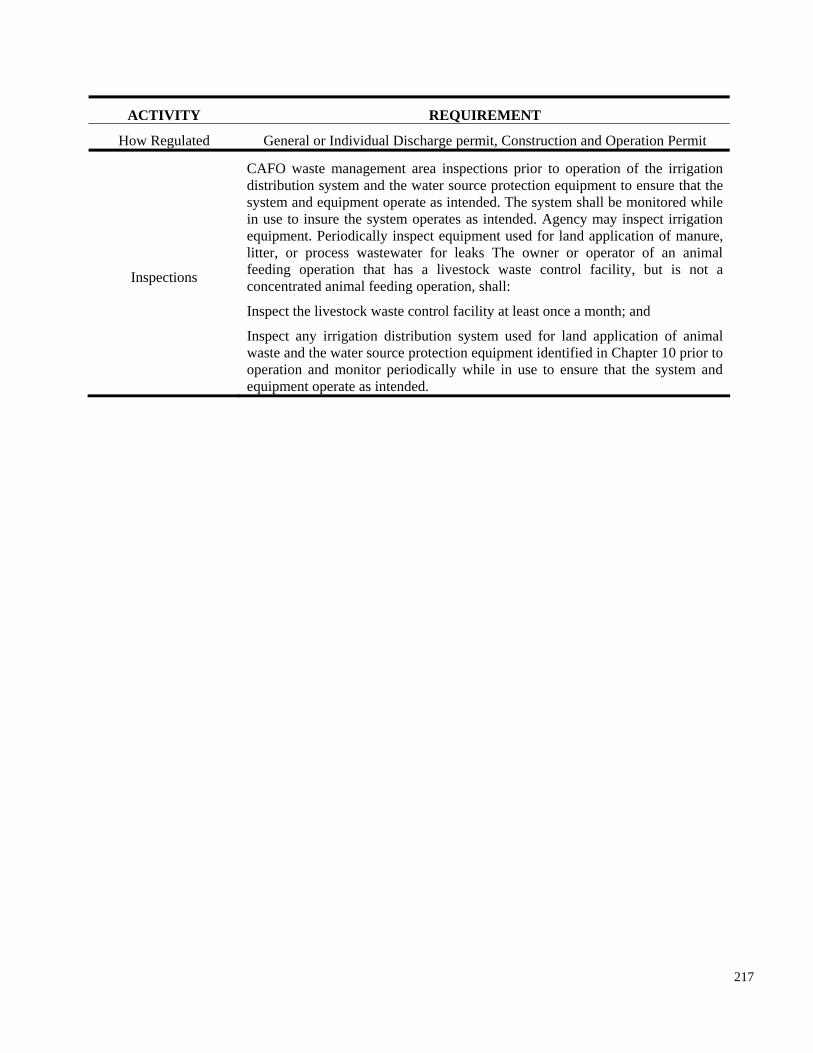
operation and monitor periodically while in use to ensure that the system and
equipment operate as intended.
ACTIVITY REQUIREMENT
How Regulated General or Individual Discharge permit, Construction and Operation Permit
Inspections
CAFO waste management area inspections prior to operation of the irrigation distribution system and the water source protection equipment to ensure that the system and equipment operate as intended. The system shall be monitored while in use to insure the system operates as intended. Agency may inspect irrigation equipment. Periodically inspect equipment used for land application of manure, litter, or process wastewater for leaks The owner or operator of an animal feeding operation that has a livestock waste control facility, but is not a concentrated animal feeding operation, shall:
Inspect the livestock waste control facility at least once a month; and
Inspect any irrigation distribution system used for land application of animal waste and the water source protection equipment identified in Chapter 10 prior to
217
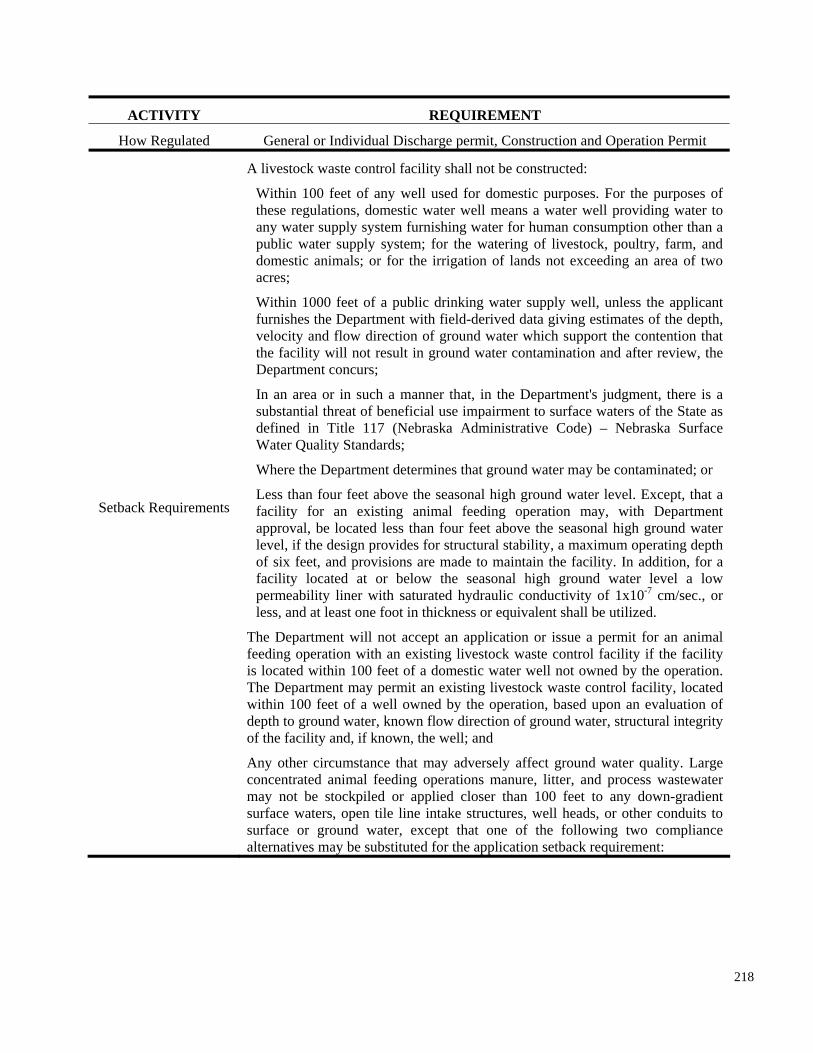
of the facility and, if known, the well; and
ACTIVITY REQUIREMENT
How Regulated General or Individual Discharge permit, Construction and Operation Permit
Setback Requirements
A livestock waste control facility shall not be constructed:
Within 100 feet of any well used for domestic purposes. For the purposes of these regulations, domestic water well means a water well providing water to any water supply system furnishing water for human consumption other than a public water supply system; for the watering of livestock, poultry, farm, and domestic animals; or for the irrigation of lands not exceeding an area of two acres;
defined in Title 117 (Nebraska Administrative Code) – Nebraska Surface Water Quality Standards;
Where the Department determines that ground water may be contaminated; or
Less than four feet above the seasonal high ground water level. Except, that a facility for an existing animal feeding operation may, with Department approval, be located less than four feet above the seasonal high ground water level, if the design provides for structural stability, a maximum operating depth of six feet, and provisions are made to maintain the facility. In addition, for a facility located at or below the seasonal high ground water level a low permeability liner with saturated hydraulic conductivity of 1x10⁻⁷ cm/sec., or less, and at least one foot in thickness or equivalent shall be utilized.
The Department will not accept an application or issue a permit for an animal feeding operation with an existing livestock waste control facility if the facility is located within 100 feet of a domestic water well not owned by the operation.
Within 1000 feet of a public drinking water supply well, unless the applicant furnishes the Department with field-derived data giving estimates of the depth, velocity and flow direction of ground water which support the contention that the facility will not result in ground water contamination and after review, the Department concurs;
In an area or in such a manner that, in the Department's judgment, there is a substantial threat of beneficial use impairment to surface waters of the State as
The Department may permit an existing livestock waste control facility, located within 100 feet of a well owned by the operation, based upon an evaluation of depth to ground water, known flow direction of ground water, structural integrity
Any other circumstance that may adversely affect ground water quality. Large concentrated animal feeding operations manure, litter, and process wastewater may not be stockpiled or applied closer than 100 feet to any down-gradient surface waters, open tile line intake structures, well heads, or other conduits to surface or ground water, except that one of the following two compliance alternatives may be substituted for the application setback requirement:
218
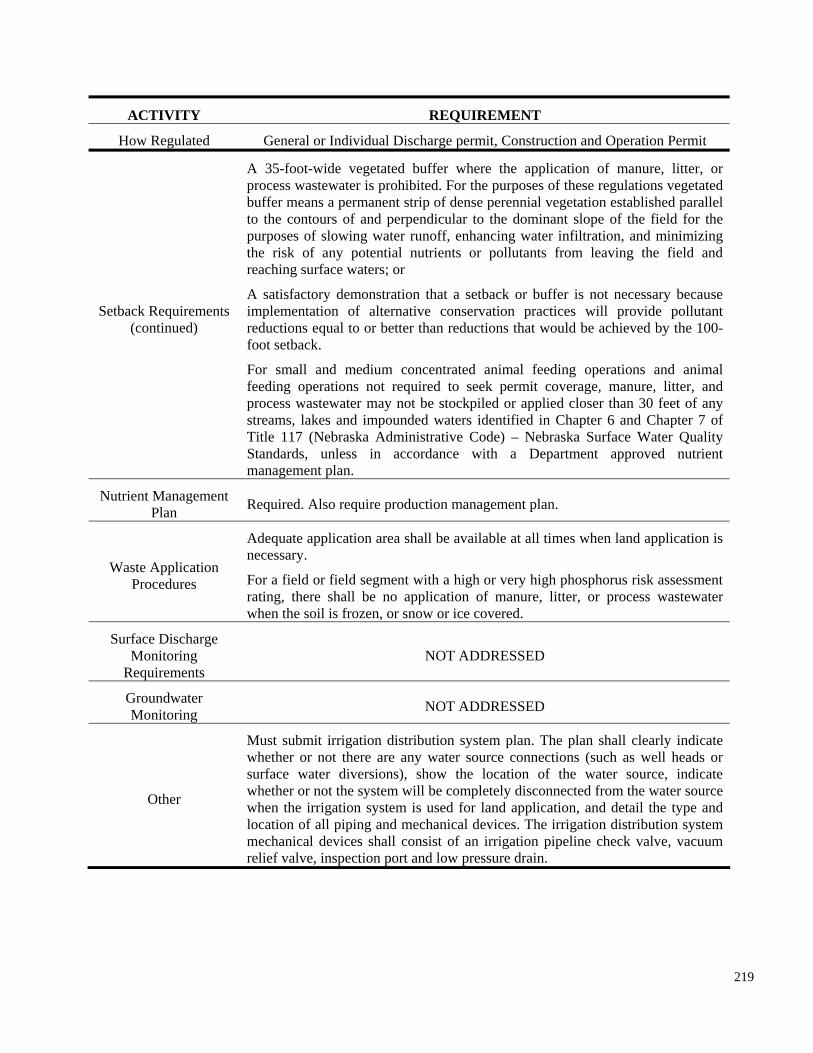
unless in accordance with a Department approved nutrient management plan.
Required. Also require production management plan.
Adequate application area shall be available at all times when land application is necessary.
For a field or field segment with a high or very high phosphorus risk assessment rating, there shall be no application of manure, litter, or process wastewater when the soil is frozen, or snow or ice covered.
Surface Discharge Monitoring
Requirements NOT ADDRESSED
Groundwater Monitoring
ACTIVITY REQUIREMENT
How Regulated General or Individual Discharge permit, Construction and Operation Permit
Setback Requirements (continued)
Nutrient Management Plan
Waste Application Procedures
Other
A 35-foot-wide vegetated buffer where the application of manure, litter, or process wastewater is prohibited. For the purposes of these regulations vegetated buffer means a permanent strip of dense perennial vegetation established parallel to the contours of and perpendicular to the dominant slope of the field for the purposes of slowing water runoff, enhancing water infiltration, and minimizing the risk of any potential nutrients or pollutants from leaving the field and reaching surface waters; or
NOT ADDRESSED
Must submit irrigation distribution system plan. The plan shall clearly indicate whether or not there are any water source connections (such as well heads or surface water diversions), show the location of the water source, indicate whether or not the system will be completely disconnected from the water source when the irrigation system is used for land application, and detail the type and location of all piping and mechanical devices. The irrigation distribution system mechanical devices shall consist of an irrigation pipeline check valve, vacuum relief valve, inspection port and low pressure drain.
219
A satisfactory demonstration that a setback or buffer is not necessary because implementation of alternative conservation practices will provide pollutant reductions equal to or better than reductions that would be achieved by the 100foot setback.
For small and medium concentrated animal feeding operations and animal feeding operations not required to seek permit coverage, manure, litter, and process wastewater may not be stockpiled or applied closer than 30 feet of any streams, lakes and impounded waters identified in Chapter 6 and Chapter 7 of Title 117 (Nebraska Administrative Code) – Nebraska Surface Water Quality Standards,
B.3.8. North Dakota
The North Dakota Department of Health has the statutory responsibility to control the pollution
of surface waters, ground waters, and the air of the state. State law prohibits handling livestock
waste in any way that would allow the waste to enter waters of the state, or to be washed into
these waters by runoff from rain or snow melt. Specifically, North Dakota has adopted the
United States federal regulations for the control of surface water runoff from confined animal
feeding operations under the North Dakota Century Code. Facilities other than CAFOs as that
No potential to pollute means the facility is located where there is no discharge of pollutants to
ground water and no discharge of pollutants to surface water from a rainfall event that is less
than or equal to a twenty-five-year, twenty-four-hour rainfall event [33-16-03.1-06 (2004)].
Table B.25. North Dakota State Requirements for Land Application Facilities other than CAFOs
[Control of Pollution from Animal Feeding Operations Chapter 33-16-03.1 (2004)].
ACTIVITY REQUIREMENT
220
term is defined in the federal regulations are regulated under state regulations [Control of
Pollution from Animal Feeding Operations, Chapter 33-16-03.1 (2004)]. These regulations
include requirements for the preparation of a nutrient management plan and best management
practices. Best management practices are defined as “schedules of activities, prohibitions of
practices, conservation practices, maintenance procedures, and other management strategies to
prevent or reduce the pollution of waters of the state. Best management practices also include
treatment requirements, operating procedures, and practices to control production area and land
application area runoff, spillage or leaks, sludge or waste disposal, or drainage from raw material
storage” [33-16-03.1-03.3 (2004)]. Best management practices are not specified in the
regulation, but must be included in the design of the facility or the nutrient management plan
[33-16-03.1-08 (2004)].
The department, upon request, may make a case-specific determination that a livestock facility
that is not a concentrated animal feeding operation has no potential to discharge pollutants to
waters of the state and does not require a state animal feeding operation permit. The department
shall review the determination at least every five years. Facilities that apply for the no potential
to discharge determination must develop a nutrient management plan.
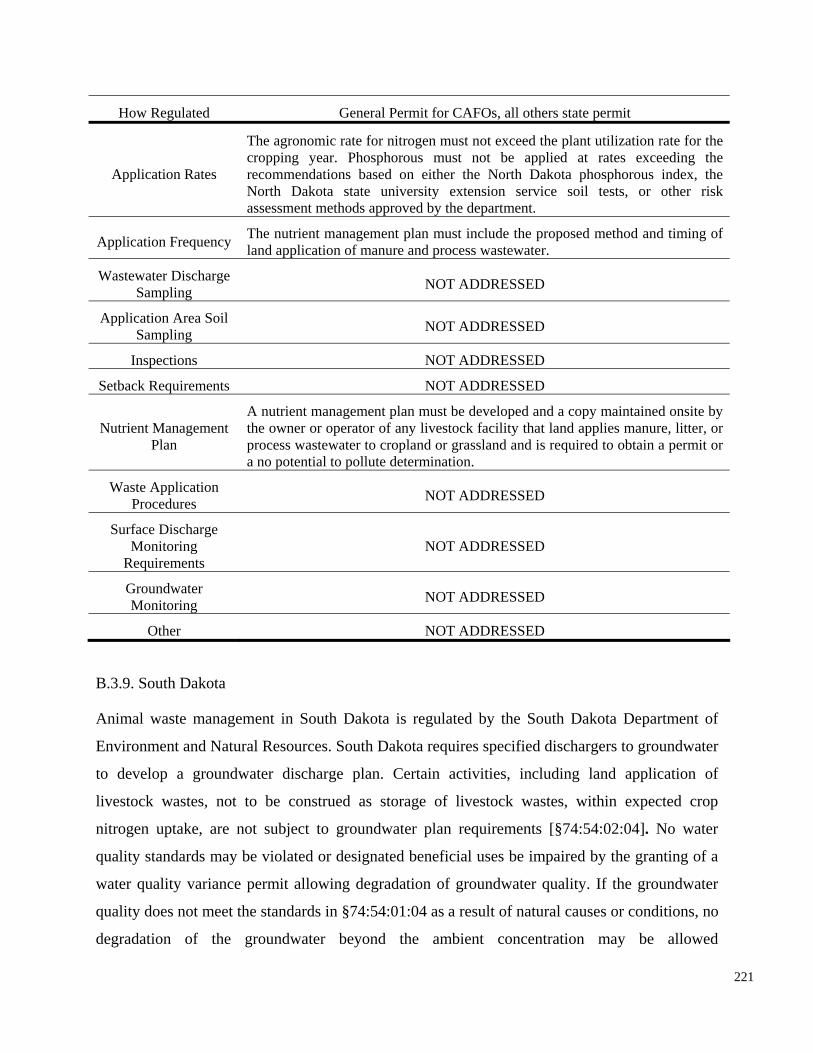
How Regulated General Permit for CAFOs, all others state permit
The agronomic rate for nitrogen must not exceed the plant utilization rate for the cropping year. Phosphorous must not be applied at rates exceeding the
Application Rates recommendations based on either the North Dakota phosphorous index, the North Dakota state university extension service soil tests, or other risk assessment methods approved by the department.
The nutrient management plan must include the proposed method and timing of Application Frequency land application of manure and process wastewater.
Wastewater Discharge Sampling NOT ADDRESSED
Application Area Soil Sampling NOT ADDRESSED
Inspections NOT ADDRESSED
Setback Requirements NOT ADDRESSED
Nutrient Management Plan
A nutrient management plan must be developed and a copy maintained onsite by the owner or operator of any livestock facility that land applies manure, litter, or process wastewater to cropland or grassland and is required to obtain a permit or a no potential to pollute determination.
Waste Application Procedures NOT ADDRESSED
Surface Discharge Monitoring
Requirements NOT ADDRESSED
Groundwater Monitoring NOT ADDRESSED
Other NOT ADDRESSED
B.3.9. South Dakota
Animal waste management in South Dakota is regulated by the South Dakota Department of
Environment and Natural Resources. South Dakota requires specified dischargers to groundwater
to develop a groundwater discharge plan. Certain activities, including land application of
livestock wastes, not to be construed as storage of livestock wastes, within expected crop
nitrogen uptake, are not subject to groundwater plan requirements [§74:54:02:04]. No water
quality standards may be violated or designated beneficial uses be impaired by the granting of a
water quality variance permit allowing degradation of groundwater quality. If the groundwater
quality does not meet the standards in §74:54:01:04 as a result of natural causes or conditions, no
degradation of the groundwater beyond the ambient concentration may be allowed
221
[§74:54:02:03]. The standards include the allowable pH range and maximum allowable
concentration in groundwater of 10,000 mg/L TDS concentration or less for certain contaminants
specified in the rule unless the ambient condition exceeds the standards. Regardless of whether
one or more contaminants are present in groundwater, when the ambient pH or concentration of
any water contaminant exceeds the standard specified in this section, the ambient pH or
concentration is the allowable limit, provided that the discharge at such concentrations will not
result for the present or the reasonably foreseeable future in concentrations at any place of
groundwater withdrawal in excess of the standards in this section. The ground water standards
include limits for nitrates (10 mg/L), nitrites (1 mg/L) and total nitrate/nitrite as N (10 mg/L),
metals, organics, radionuclides, and volatile organic compounds, but do not include a limit for P
[§74:54:02:04].
Large CAFOs are required to obtain a General Permit for surface water discharges [General
Permit No.: SDG-0100000]. As a condition of that permit, and lasting through the life of the
General Permit, the producer shall implement the department approved nutrient management
requirements, operation and maintenance guidelines, and best management practices required by
the permit for land application of manure and process wastewater to prevent discharge of manure
or process wastewater to waters of the state. [Permit 1.4.1.3].
222
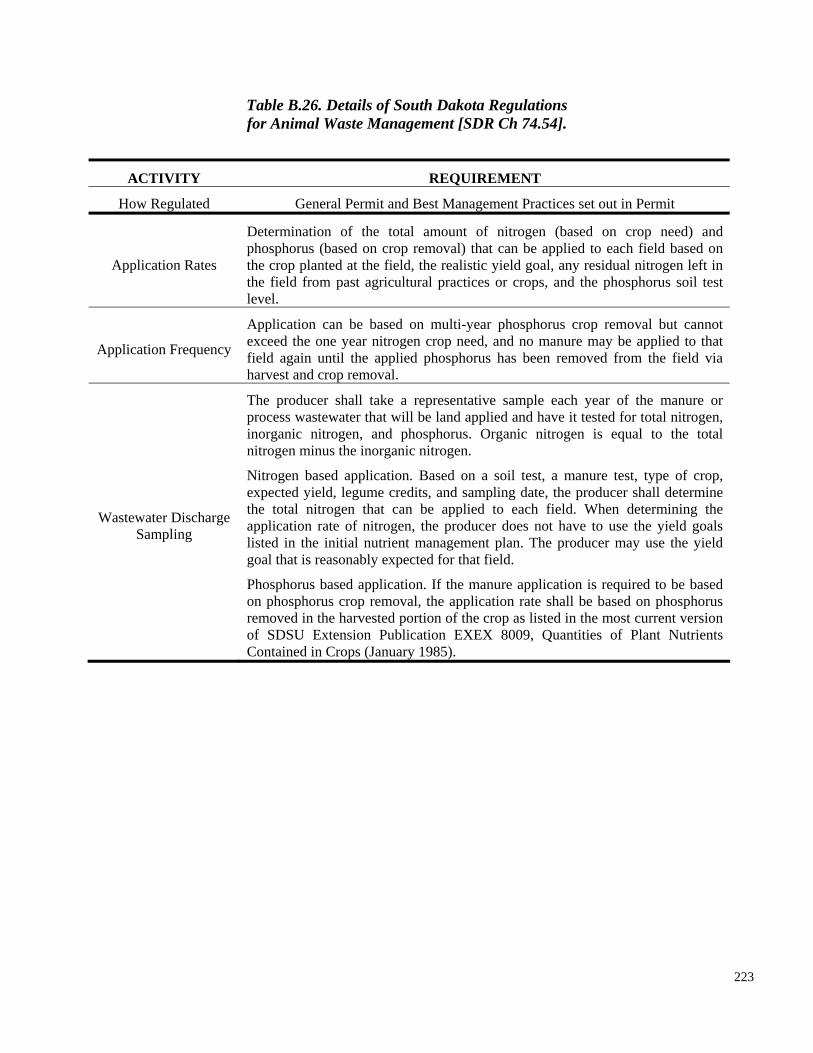
Table B.26. Details of South Dakota Regulations for Animal Waste Management [SDR Ch 74.54].
ACTIVITY REQUIREMENT
How Regulated General Permit and Best Management Practices set out in Permit
Application Rates
Application Frequency
Determination of the total amount of nitrogen (based on crop need) and phosphorus (based on crop removal) that can be applied to each field based on the crop planted at the field, the realistic yield goal, any residual nitrogen left in the field from past agricultural practices or crops, and the phosphorus soil test level.
Application can be based on multi-year phosphorus crop removal but cannot exceed the one year nitrogen crop need, and no manure may be applied to that field again until the applied phosphorus has been removed from the field via harvest and crop removal.
The producer shall take a representative sample each year of the manure or process wastewater that will be land applied and have it tested for total nitrogen, inorganic nitrogen, and phosphorus. Organic nitrogen is equal to the total nitrogen minus the inorganic nitrogen.
Nitrogen based application. Based on a soil test, a manure test, type of crop, expected yield, legume credits, and sampling date, the producer shall determine the total nitrogen that can be applied to each field. When determining the application rate of nitrogen, the producer does not have to use the yield goals listed in the initial nutrient management plan. The producer may use the yield goal that is reasonably expected for that field.
Phosphorus based application. If the manure application is required to be based on phosphorus crop removal, the application rate shall be based on phosphorus removed in the harvested portion of the crop as listed in the most current version of SDSU Extension Publication EXEX 8009, Quantities of Plant Nutrients
Wastewater Discharge Sampling
Contained in Crops (January 1985).
223
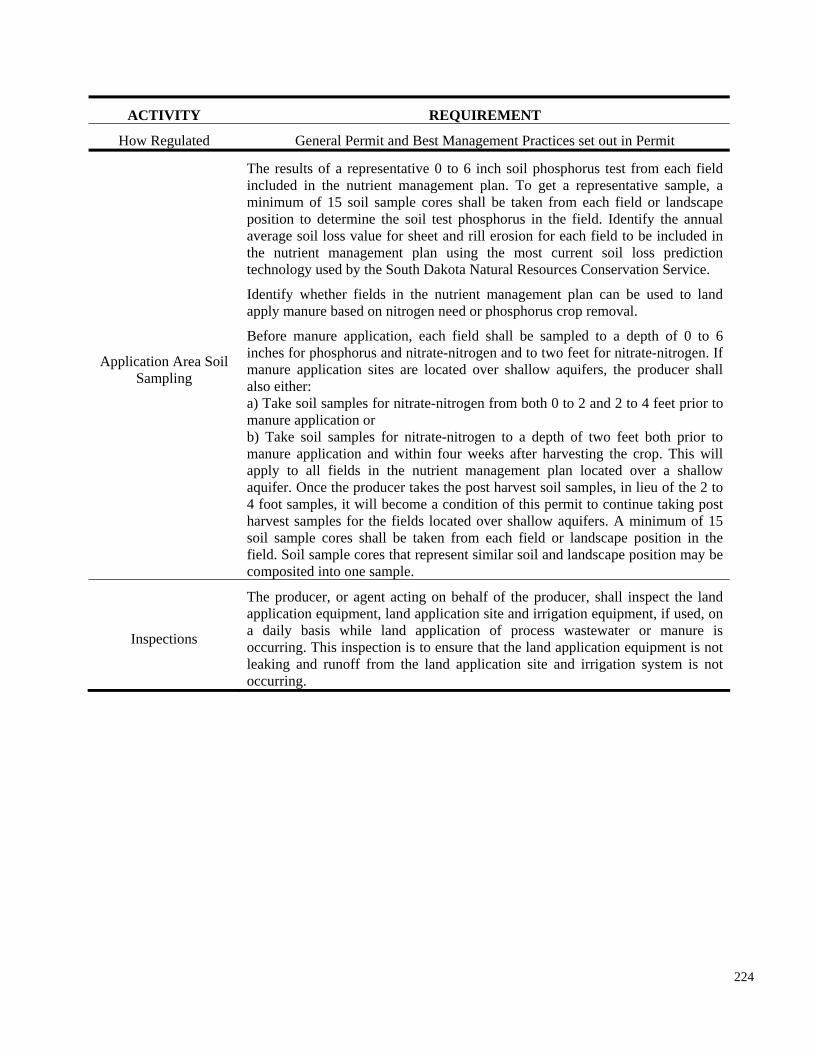
Identify whether fields in the nutrient management plan can be used to land apply manure based on nitrogen need or phosphorus crop removal.
Before manure application, each field shall be sampled to a depth of 0 to 6 inches for phosphorus and nitrate-nitrogen and to two feet for nitrate-nitrogen. If manure application sites are located over shallow aquifers, the producer shall also either: a) Take soil samples for nitrate-nitrogen from both 0 to 2 and 2 to 4 feet prior to manure application or b) Take soil samples for nitrate-nitrogen to a depth of two feet both prior to manure application and within four weeks after harvesting the crop. This will apply to all fields in the nutrient management plan located over a shallow aquifer. Once the producer takes the post harvest soil samples, in lieu of the 2 to 4 foot samples, it will become a condition of this permit to continue taking post
ACTIVITY REQUIREMENT
How Regulated General Permit and Best Management Practices set out in Permit
harvest samples for the fields located over shallow aquifers. A minimum of 15 soil sample cores shall be taken from each field or landscape position in the field. Soil sample cores that represent similar soil and landscape position may be composited into one sample.
Inspections
The producer, or agent acting on behalf of the producer, shall inspect the land application equipment, land application site and irrigation equipment, if used, on a daily basis while land application of process wastewater or manure is occurring. This inspection is to ensure that the land application equipment is not leaking and runoff from the land application site and irrigation system is not occurring.
Application Area Soil Sampling
The results of a representative 0 to 6 inch soil phosphorus test from each field included in the nutrient management plan. To get a representative sample, a minimum of 15 soil sample cores shall be taken from each field or landscape position to determine the soil test phosphorus in the field. Identify the annual average soil loss value for sheet and rill erosion for each field to be included in the nutrient management plan using the most current soil loss prediction technology used by the South Dakota Natural Resources Conservation Service.
224
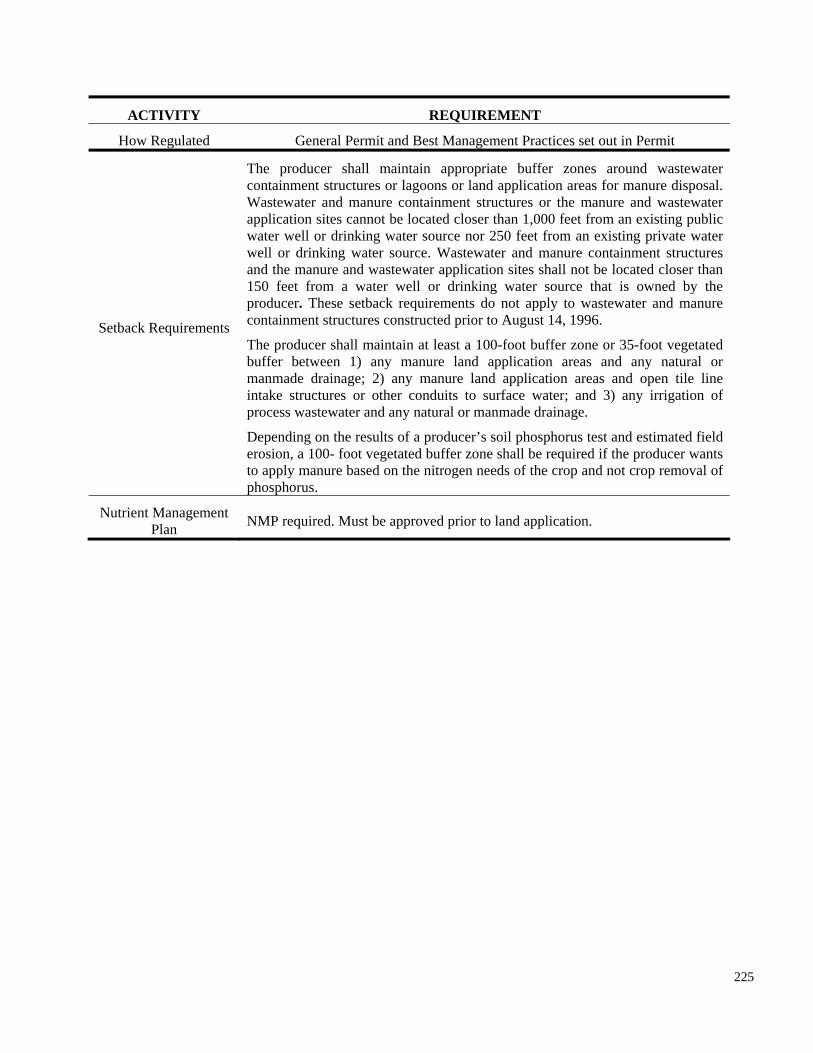
ACTIVITY REQUIREMENT
How Regulated General Permit and Best Management Practices set out in Permit
erosion, a 100- foot vegetated buffer zone shall be required if the producer wants to apply manure based on the nitrogen needs of the crop and not crop removal of phosphorus.
NMP required. Must be approved prior to land application.
Setback Requirements
Nutrient Management Plan
The producer shall maintain appropriate buffer zones around wastewater containment structures or lagoons or land application areas for manure disposal. Wastewater and manure containment structures or the manure and wastewater application sites cannot be located closer than 1,000 feet from an existing public water well or drinking water source nor 250 feet from an existing private water well or drinking water source. Wastewater and manure containment structures and the manure and wastewater application sites shall not be located closer than 150 feet from a water well or drinking water source that is owned by the producer. These setback requirements do not apply to wastewater and manure containment structures constructed prior to August 14, 1996.
The producer shall maintain at least a 100-foot buffer zone or 35-foot vegetated buffer between 1) any manure land application areas and any natural or manmade drainage; 2) any manure land application areas and open tile line intake structures or other conduits to surface water; and 3) any irrigation of process wastewater and any natural or manmade drainage.
Depending on the results of a producer’s soil phosphorus test and estimated field
225
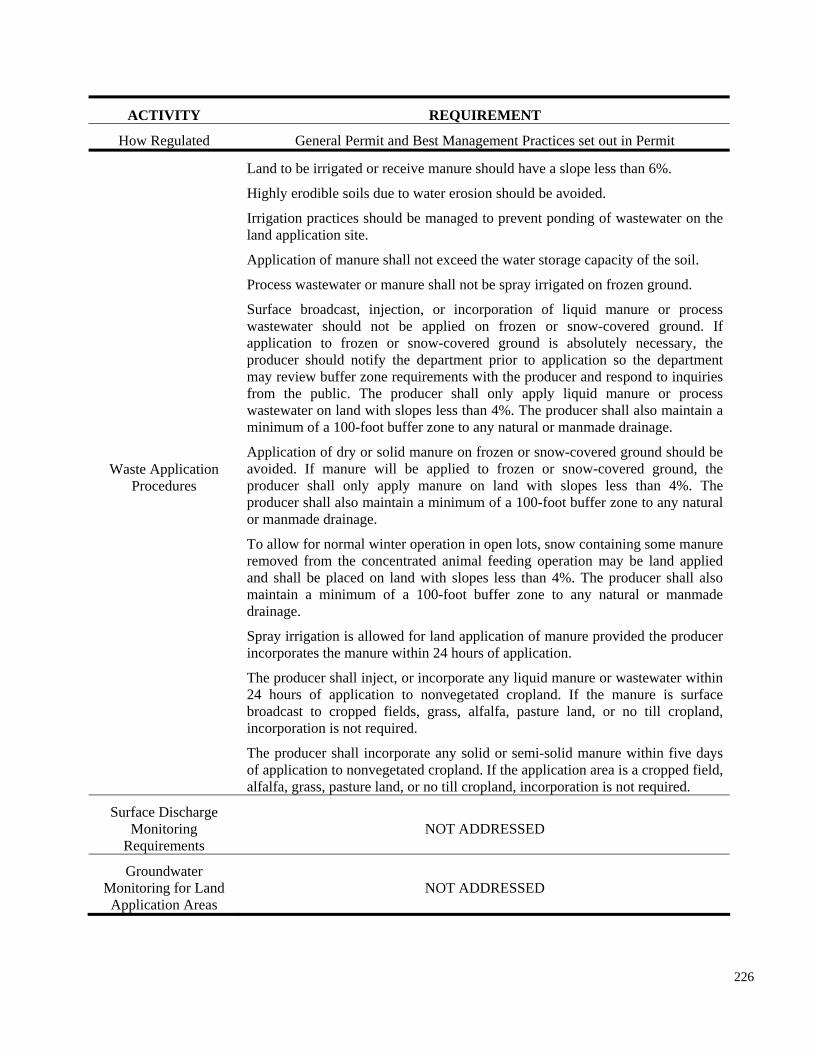
incorporation is not required.
ACTIVITY REQUIREMENT
How Regulated General Permit and Best Management Practices set out in Permit
Surface Discharge Monitoring NOT ADDRESSED
Requirements
Groundwater Monitoring for Land NOT ADDRESSED Application Areas
Waste Application Procedures
Land to be irrigated or receive manure should have a slope less than 6%.
Highly erodible soils due to water erosion should be avoided.
Irrigation practices should be managed to prevent ponding of wastewater on the land application site.
Application of manure shall not exceed the water storage capacity of the soil.
applied on
minimum of a 100-foot buffer zone to any natural or manmade drainage.
Application of dry or solid manure on frozen or snow-covered ground should be avoided. If manure will be applied to frozen or snow-covered ground, the producer shall only apply manure on land with slopes less than 4%. The producer shall also maintain a minimum of a 100-foot buffer zone to any natural or manmade drainage.
To allow for normal winter operation in open lots, snow containing some manure removed from the concentrated animal feeding operation may be land applied and shall be placed on land with slopes less than 4%. The producer shall also maintain a minimum of a 100-foot buffer zone to any natural or manmade drainage.
Spray irrigation is allowed for land application of manure provided the producer incorporates the manure within 24 hours of application.
The producer shall inject, or incorporate any liquid manure or wastewater within
Process wastewater or manure shall not be spray irrigated on frozen ground.
Surface broadcast, injection, or incorporation of liquid manure or process wastewater should not be frozen or snow-covered ground. If application to frozen or snow-covered ground is absolutely necessary, the producer should notify the department prior to application so the department may review buffer zone requirements with the producer and respond to inquiries from the public. The producer shall only apply liquid manure or process wastewater on land with slopes less than 4%. The producer shall also maintain a
24 hours of application to nonvegetated cropland. If the manure is surface broadcast to cropped fields, grass, alfalfa, pasture land, or no till cropland,
The producer shall incorporate any solid or semi-solid manure within five days of application to nonvegetated cropland. If the application area is a cropped field, alfalfa, grass, pasture land, or no till cropland, incorporation is not required.
226
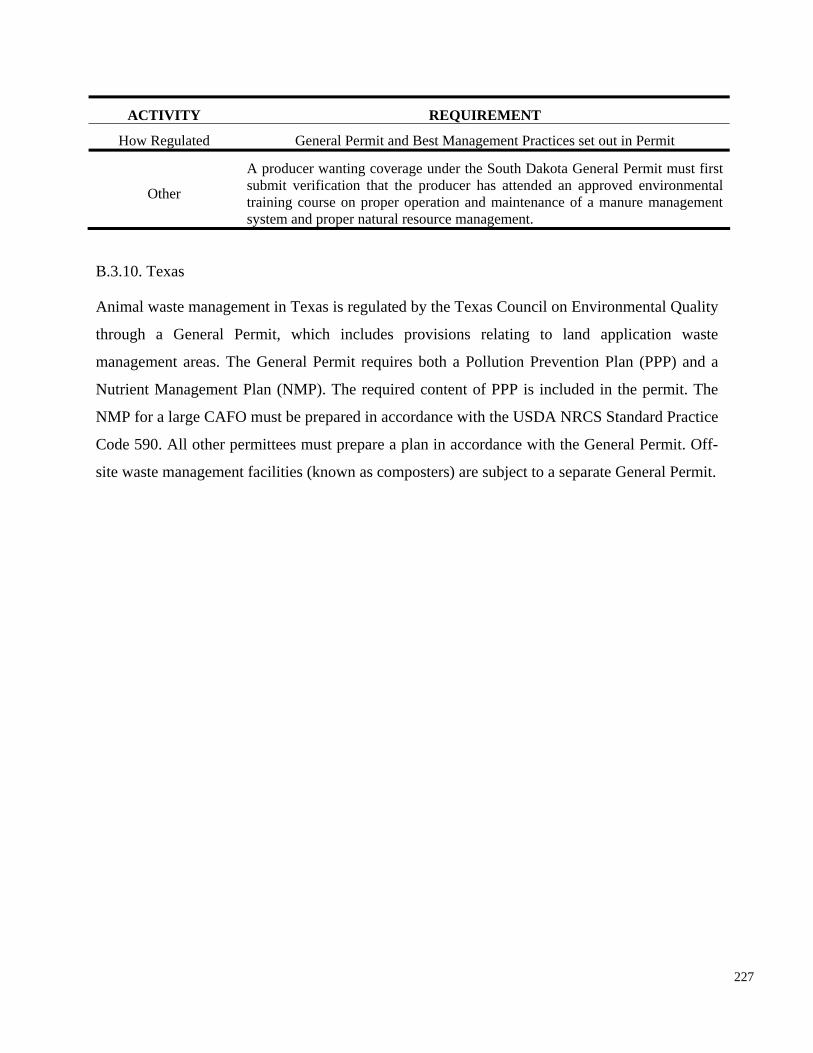
ACTIVITY REQUIREMENT
How Regulated General Permit and Best Management Practices set out in Permit
A producer wanting coverage under the South Dakota General Permit must first submit verification that the producer has attended an approved environmental Other training course on proper operation and maintenance of a manure management system and proper natural resource management.
B.3.10. Texas
Animal waste management in Texas is regulated by the Texas Council on Environmental Quality
through a General Permit, which includes provisions relating to land application waste
management areas. The General Permit requires both a Pollution Prevention Plan (PPP) and a
Nutrient Management Plan (NMP). The required content of PPP is included in the permit. The
NMP for a large CAFO must be prepared in accordance with the USDA NRCS Standard Practice
Code 590. All other permittees must prepare a plan in accordance with the General Permit. Off-
site waste management facilities (known as composters) are subject to a separate General Permit.
227
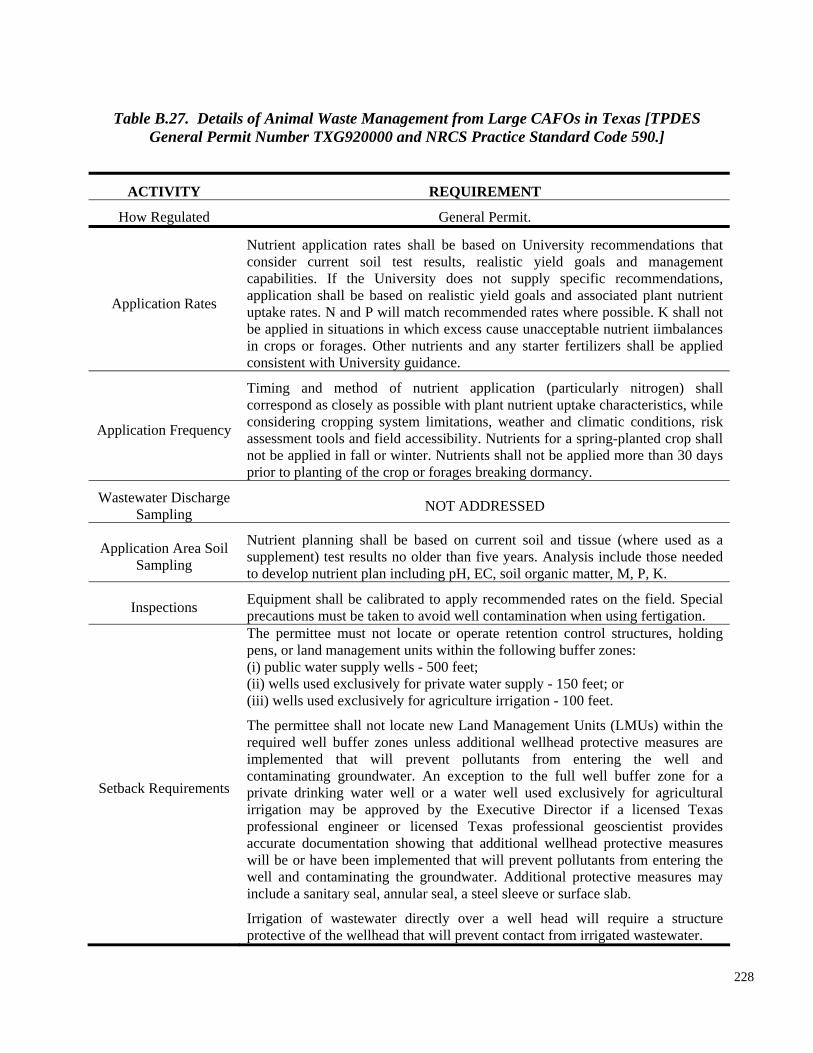
consistent with University guidance.
Timing and method of nutrient application (particularly nitrogen) shall correspond as closely as possible with plant nutrient uptake characteristics, while considering cropping system limitations, weather and climatic conditions, risk assessment tools and field accessibility. Nutrients for a spring-planted crop shall not be applied in fall or winter. Nutrients shall not be applied more than 30 days prior to planting of the crop or forages breaking dormancy.
Wastewater Discharge Sampling NOT ADDRESSED
Nutrient planning shall be based on current soil and tissue (where used as a supplement) test results no older than five years. Analysis include those needed to develop nutrient plan including pH, EC, soil organic matter, M, P, K.
Inspections Equipment shall be calibrated to apply recommended rates on the field. Special precautions must be taken to avoid well contamination when using fertigation. The permittee must not locate or operate retention control structures, holding pens, or land management units within the following buffer zones: (i) public water supply wells - 500 feet; (ii) wells used exclusively for private water supply - 150 feet; or (iii) wells used exclusively for agriculture irrigation - 100 feet.
implemented
Table B.27. Details of Animal Waste Management from Large CAFOs in Texas [TPDES General Permit Number TXG920000 and NRCS Practice Standard Code 590.]
ACTIVITY REQUIREMENT
How Regulated General Permit.
Application Rates
Application Frequency
Application Area Soil Sampling
Setback Requirements
Nutrient application rates shall be based on University recommendations that consider current soil test results, realistic yield goals and management capabilities. If the University does not supply specific recommendations, application shall be based on realistic yield goals and associated plant nutrient uptake rates. N and P will match recommended rates where possible. K shall not be applied in situations in which excess cause unacceptable nutrient iimbalances in crops or forages. Other nutrients and any starter fertilizers shall be applied
The permittee shall not locate new Land Management Units (LMUs) within the required well buffer zones unless additional wellhead protective measures are
that will prevent pollutants from entering the well and contaminating groundwater. An exception to the full well buffer zone for a private drinking water well or a water well used exclusively for agricultural irrigation may be approved by the Executive Director if a licensed Texas professional engineer or licensed Texas professional geoscientist provides accurate documentation showing that additional wellhead protective measures will be or have been implemented that will prevent pollutants from entering the well and contaminating the groundwater. Additional protective measures may include a sanitary seal, annular seal, a steel sleeve or surface slab.
Irrigation of wastewater directly over a well head will require a structure protective of the wellhead that will prevent contact from irrigated wastewater.
228
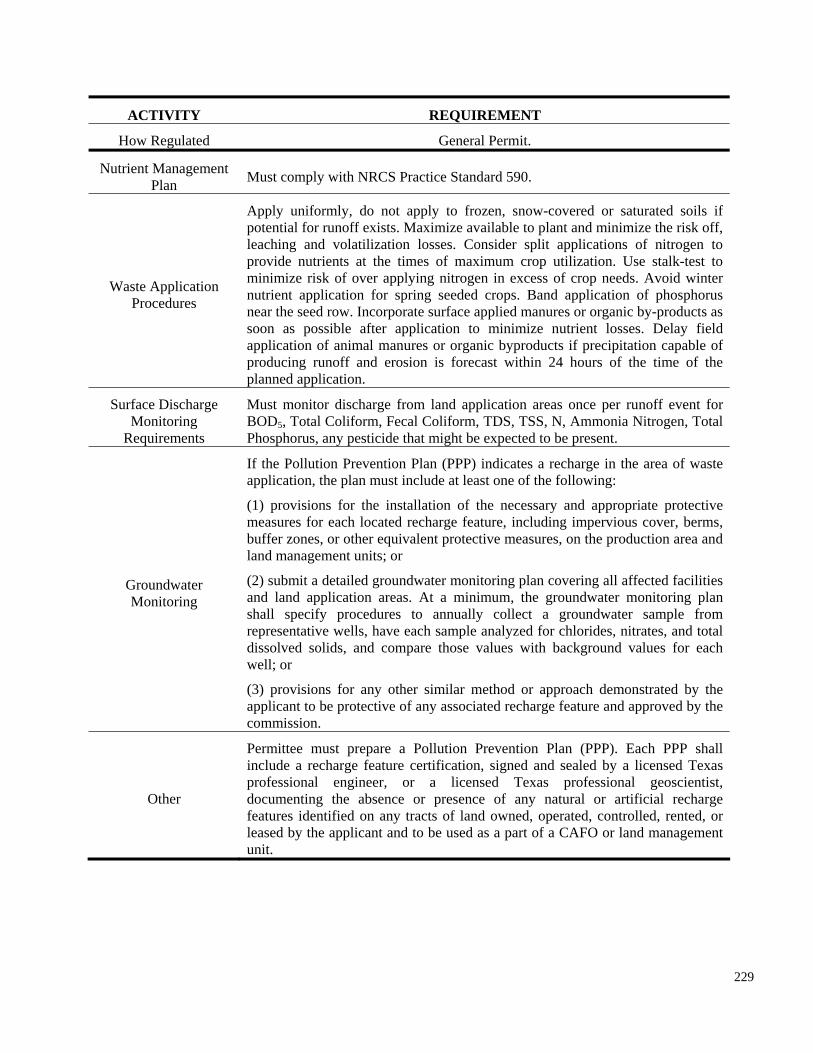
producing runoff and erosion is forecast within 24 hours of the time of the planned application.
Must monitor discharge from land application areas once per runoff event for BOD5, Total Coliform, Fecal Coliform, TDS, TSS, N, Ammonia Nitrogen, Total Phosphorus, any pesticide that might be expected to be present.
Monitoring
If the Pollution Prevention Plan (PPP) indicates a recharge in the area of waste application, the plan must include at least one of the following:
(1) provisions for the installation of the necessary and appropriate protective measures for each located recharge feature, including impervious cover, berms, buffer zones, or other equivalent protective measures, on the production area and land management units; or
(2) submit a detailed groundwater monitoring plan covering all affected facilities and land application areas. At a minimum, the groundwater monitoring plan shall specify procedures to annually collect a groundwater sample from representative wells, have each sample analyzed for chlorides, nitrates, and total dissolved solids, and compare those values with background values for each well; or
(3) provisions for any other similar method or approach demonstrated by the applicant to be protective of any associated recharge feature and approved by the commission.
ACTIVITY REQUIREMENT
How Regulated General Permit.
Nutrient Management Must comply with NRCS Practice Standard 590. Plan
Waste Application Procedures
Surface Discharge Monitoring
Requirements
Groundwater
Other
Apply uniformly, do not apply to frozen, snow-covered or saturated soils if potential for runoff exists. Maximize available to plant and minimize the risk off, leaching and volatilization losses. Consider split applications of nitrogen to provide nutrients at the times of maximum crop utilization. Use stalk-test to minimize risk of over applying nitrogen in excess of crop needs. Avoid winter nutrient application for spring seeded crops. Band application of phosphorus near the seed row. Incorporate surface applied manures or organic by-products as soon as possible after application to minimize nutrient losses. Delay field application of animal manures or organic byproducts if precipitation capable of
Permittee must prepare a Pollution Prevention Plan (PPP). Each PPP shall include a recharge feature certification, signed and sealed by a licensed Texas professional engineer, or a licensed Texas professional geoscientist, documenting the absence or presence of any natural or artificial recharge features identified on any tracts of land owned, operated, controlled, rented, or leased by the applicant and to be used as a part of a CAFO or land management unit.
229
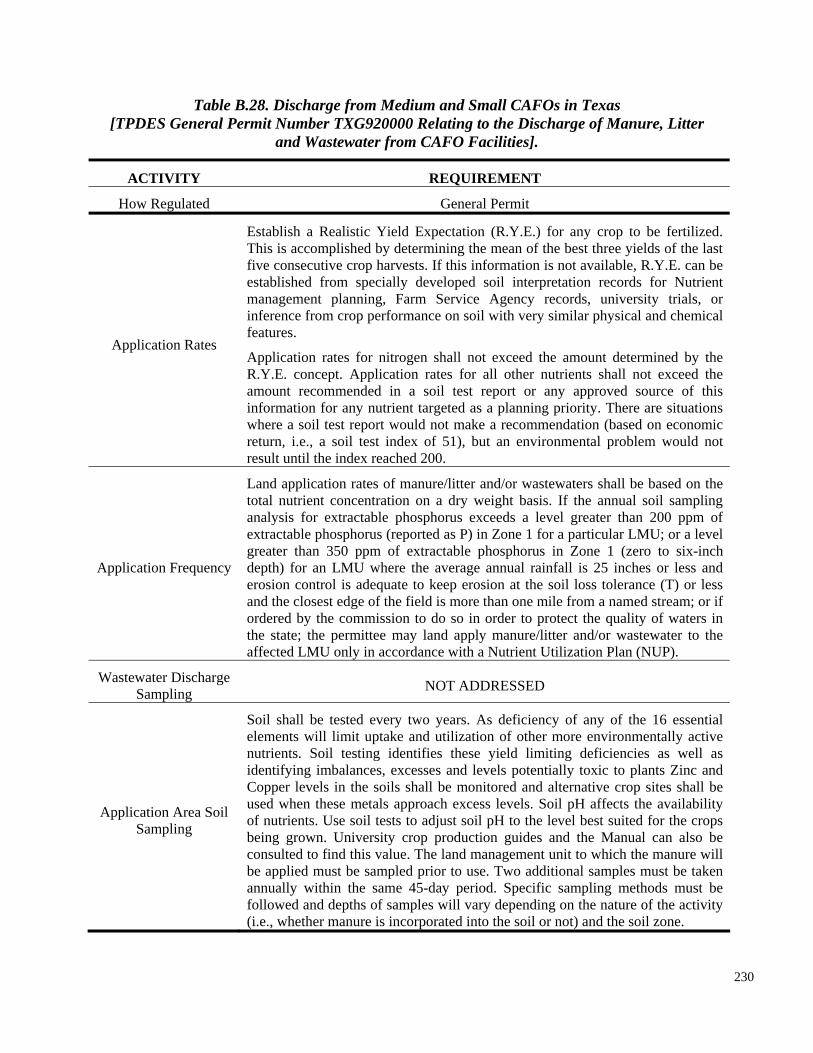
management planning, Farm Service Agency records, university trials, or inference from crop performance on soil with very similar physical and chemical features.
Application rates for nitrogen shall not exceed the amount determined by the R.Y.E. concept. Application rates for all other nutrients shall not exceed the amount recommended in a soil test report or any approved source of this information for any nutrient targeted as a planning priority. There are situations where a soil test report would not make a recommendation (based on economic return, i.e., a soil test index of 51), but an environmental problem would not result until the index reached 200.
Application Frequency
Land application rates of manure/litter and/or wastewaters shall be based on the total nutrient concentration on a dry weight basis. If the annual soil sampling analysis for extractable phosphorus exceeds a level greater than 200 ppm of extractable phosphorus (reported as P) in Zone 1 for a particular LMU; or a level greater than 350 ppm of extractable phosphorus in Zone 1 (zero to six-inch depth) for an LMU where the average annual rainfall is 25 inches or less and erosion control is adequate to keep erosion at the soil loss tolerance (T) or less and the closest edge of the field is more than one mile from a named stream; or if ordered by the commission to do so in order to protect the quality of waters in the state; the permittee may land apply manure/litter and/or wastewater to the affected LMU only in accordance with a Nutrient Utilization Plan (NUP).
Wastewater Discharge Sampling NOT ADDRESSED
Table B.28. Discharge from Medium and Small CAFOs in Texas [TPDES General Permit Number TXG920000 Relating to the Discharge of Manure, Litter
and Wastewater from CAFO Facilities].
ACTIVITY REQUIREMENT
How Regulated General Permit
Application Rates
Application Area Soil Sampling
Establish a Realistic Yield Expectation (R.Y.E.) for any crop to be fertilized. This is accomplished by determining the mean of the best three yields of the last five consecutive crop harvests. If this information is not available, R.Y.E. can be established from specially developed soil interpretation records for Nutrient
Soil shall be tested every two years. As deficiency of any of the 16 essential elements will limit uptake and utilization of other more environmentally active nutrients. Soil testing identifies these yield limiting deficiencies as well as identifying imbalances, excesses and levels potentially toxic to plants Zinc and Copper levels in the soils shall be monitored and alternative crop sites shall be used when these metals approach excess levels. Soil pH affects the availability of nutrients. Use soil tests to adjust soil pH to the level best suited for the crops being grown. University crop production guides and the Manual can also be consulted to find this value. The land management unit to which the manure will be applied must be sampled prior to use. Two additional samples must be taken annually within the same 45-day period. Specific sampling methods must be followed and depths of samples will vary depending on the nature of the activity (i.e., whether manure is incorporated into the soil or not) and the soil zone.
230
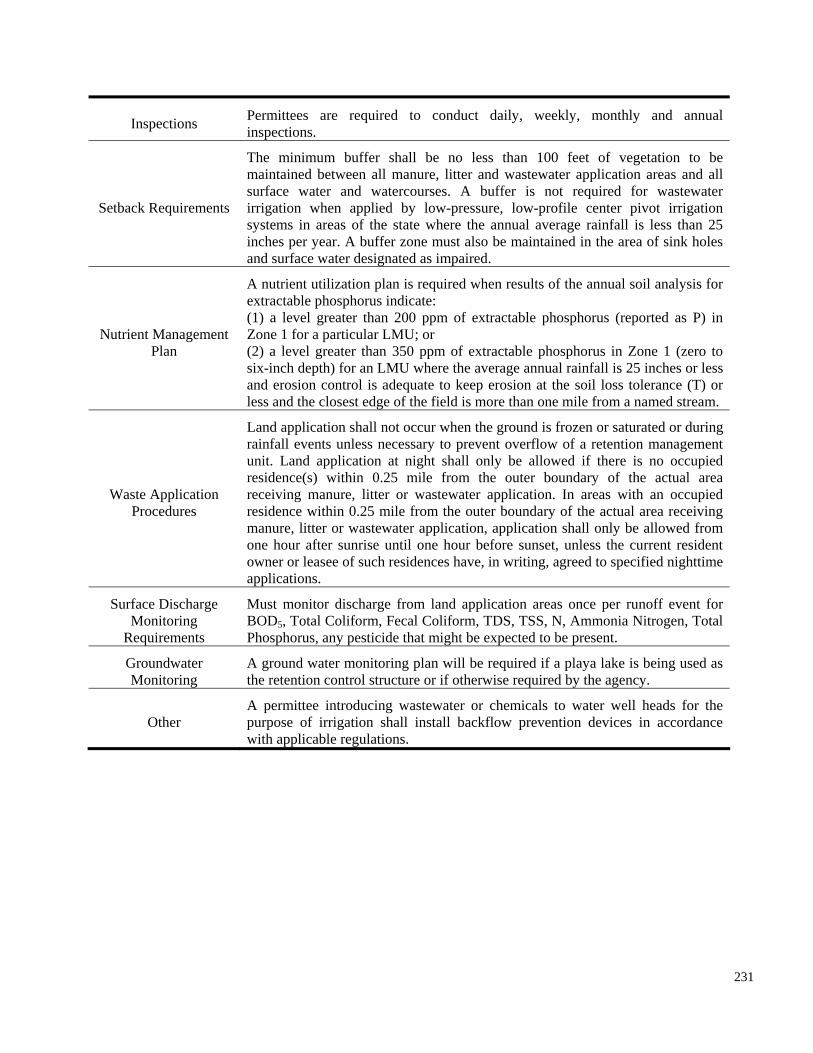
Surface Discharge Monitoring
Requirements
Must monitor discharge from land application areas once per runoff event for BOD5, Total Coliform, Fecal Coliform, TDS, TSS, N, Ammonia Nitrogen, Total Phosphorus, any pesticide that might be expected to be present.
Groundwater Monitoring
A ground water monitoring plan will be required if a playa lake is being used as the retention control structure or if otherwise required by the agency.
Other A permittee introducing wastewater or chemicals to water well heads for the purpose of irrigation shall install backflow prevention devices in accordance with applicable regulations.
Inspections Permittees are required to conduct daily, weekly, monthly and annual inspections.
Setback Requirements
The minimum buffer shall be no less than 100 feet of vegetation to be maintained between all manure, litter and wastewater application areas and all surface water and watercourses. A buffer is not required for wastewater irrigation when applied by low-pressure, low-profile center pivot irrigation systems in areas of the state where the annual average rainfall is less than 25 inches per year. A buffer zone must also be maintained in the area of sink holes and surface water designated as impaired.
A nutrient utilization plan is required when results of the annual soil analysis for extractable phosphorus indicate: (1) a level greater than 200 ppm of extractable phosphorus (reported as P) in
Nutrient Management Zone 1 for a particular LMU; or Plan (2) a level greater than 350 ppm of extractable phosphorus in Zone 1 (zero to
231
six-inch depth) for an LMU where the average annual rainfall is 25 inches or less and erosion control is adequate to keep erosion at the soil loss tolerance (T) or less and the closest edge of the field is more than one mile from a named stream.
Waste Application Procedures
Land application shall not occur when the ground is frozen or saturated or during rainfall events unless necessary to prevent overflow of a retention management unit. Land application at night shall only be allowed if there is no occupied residence(s) within 0.25 mile from the outer boundary of the actual area receiving manure, litter or wastewater application. In areas with an occupied residence within 0.25 mile from the outer boundary of the actual area receiving manure, litter or wastewater application, application shall only be allowed from one hour after sunrise until one hour before sunset, unless the current resident owner or leasee of such residences have, in writing, agreed to specified nighttime applications.
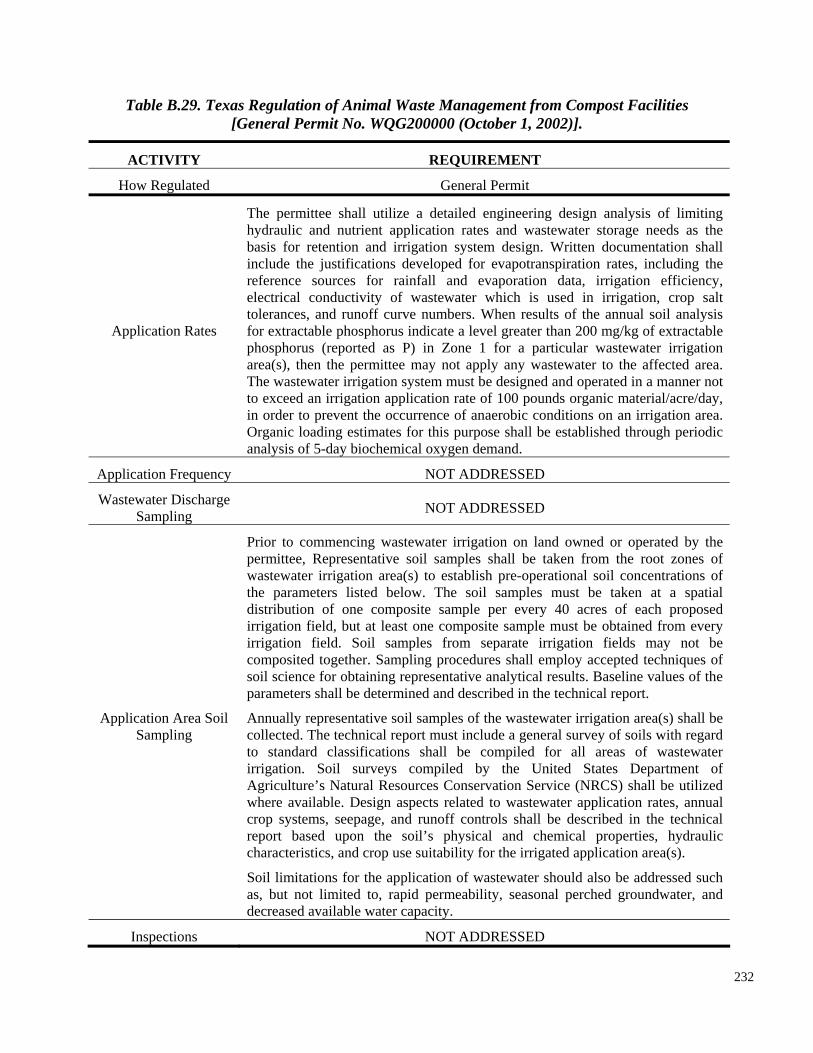
Table B.29. Texas Regulation of Animal Waste Management from Compost Facilities [General Permit No. WQG200000 (October 1, 2002)].
ACTIVITY REQUIREMENT
How Regulated General Permit
Application Rates
The permittee shall utilize a detailed engineering design analysis of limiting hydraulic and nutrient application rates and wastewater storage needs as the basis for retention and irrigation system design. Written documentation shall include the justifications developed for evapotranspiration rates, including the reference sources for rainfall and evaporation data, irrigation efficiency, electrical conductivity of wastewater which is used in irrigation, crop salt tolerances, and runoff curve numbers. When results of the annual soil analysis for extractable phosphorus indicate a level greater than 200 mg/kg of extractable phosphorus (reported as P) in Zone 1 for a particular wastewater irrigation area(s), then the permittee may not apply any wastewater to the affected area. The wastewater irrigation system must be designed and operated in a manner not to exceed an irrigation application rate of 100 pounds organic material/acre/day, in order to prevent the occurrence of anaerobic conditions on an irrigation area. Organic loading estimates for this purpose shall be established through periodic analysis of 5-day biochemical oxygen demand.
Application Frequency NOT ADDRESSED
Wastewater Discharge Sampling NOT ADDRESSED
Application Area Soil Sampling
Prior to commencing wastewater irrigation on land owned or operated by the permittee, Representative soil samples shall be taken from the root zones of wastewater irrigation area(s) to establish pre-operational soil concentrations of the parameters listed below. The soil samples must be taken at a spatial distribution of one composite sample per every 40 acres of each proposed irrigation field, but at least one composite sample must be obtained from every irrigation field. Soil samples from separate irrigation fields may not be composited together. Sampling procedures shall employ accepted techniques of soil science for obtaining representative analytical results. Baseline values of the parameters shall be determined and described in the technical report.
Annually representative soil samples of the wastewater irrigation area(s) shall be collected. The technical report must include a general survey of soils with regard to standard classifications shall be compiled for all areas of wastewater irrigation. Soil surveys compiled by the United States Department of Agriculture’s Natural Resources Conservation Service (NRCS) shall be utilized where available. Design aspects related to wastewater application rates, annual crop systems, seepage, and runoff controls shall be described in the technical report based upon the soil’s physical and chemical properties, hydraulic characteristics, and crop use suitability for the irrigated application area(s).
Soil limitations for the application of wastewater should also be addressed such as, but not limited to, rapid permeability, seasonal perched groundwater, and decreased available water capacity.
Inspections NOT ADDRESSED
232
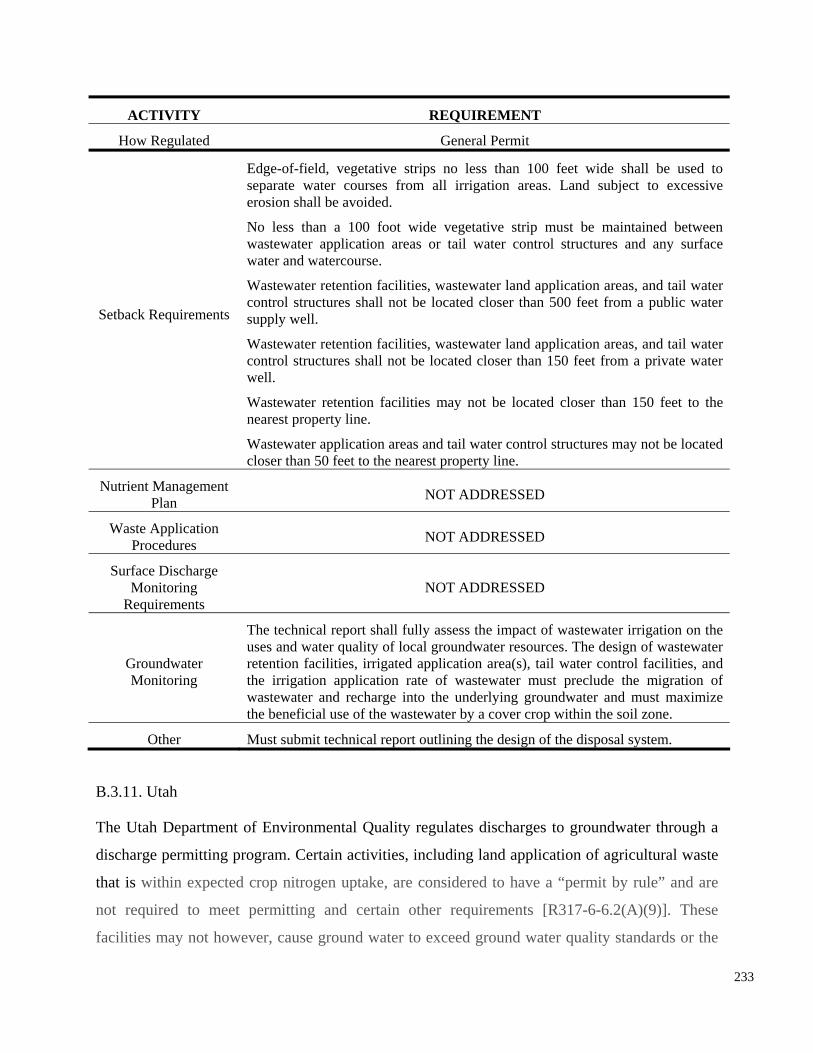
ACTIVITY REQUIREMENT
How Regulated General Permit
Setback Requirements
Edge-of-field, vegetative strips no less than 100 feet wide shall be used to separate water courses from all irrigation areas. Land subject to excessive erosion shall be avoided.
No less than a 100 foot wide vegetative strip must be maintained between wastewater application areas or tail water control structures and any surface water and watercourse.
Wastewater retention facilities, wastewater land application areas, and tail water control structures shall not be located closer than 500 feet from a public water supply well.
Wastewater retention facilities, wastewater land application areas, and tail water control structures shall not be located closer than 150 feet from a private water well.
Wastewater retention facilities may not be located closer than 150 feet to the nearest property line.
Wastewater application areas and tail water control structures may not be located closer than 50 feet to the nearest property line.
Nutrient Management Plan NOT ADDRESSED
Waste Application Procedures NOT ADDRESSED
Surface Discharge Monitoring
Requirements NOT ADDRESSED
Groundwater Monitoring
The technical report shall fully assess the impact of wastewater irrigation on the uses and water quality of local groundwater resources. The design of wastewater retention facilities, irrigated application area(s), tail water control facilities, and the irrigation application rate of wastewater must preclude the migration of wastewater and recharge into the underlying groundwater and must maximize the beneficial use of the wastewater by a cover crop within the soil zone.
Other Must submit technical report outlining the design of the disposal system.
B.3.11. Utah
The Utah Department of Environmental Quality regulates discharges to groundwater through a
discharge permitting program. Certain activities, including land application of agricultural waste
that is within expected crop nitrogen uptake, are considered to have a “permit by rule” and are
not required to meet permitting and certain other requirements [R317-6-6.2(A)(9)]. These
facilities may not however, cause ground water to exceed ground water quality standards or the
233
applicable class TDS limits. If the background concentration for affected ground water exceeds
the ground water quality standard, the facility may not cause an increase over background
[R317-6-6.2(B)]. The ground water standards include limits for nitrates (10 mg/L), nitrites (1
mg/L) and total nitrate/nitrite as N (10 mg/L), metals, organics, radionuclides, and volatile
organic compounds, but do not include a limit for P [R317-6-6.2.1].
Utah has also issued a General Permit for certain animal feeding operations, which includes a
requirement to prepare a Nutrient Management Plan if waste is to be managed through land
application. The NPM must be prepared by a certified planner and must be reviewed by the Utah
Natural Resource Conservation Service [General Permit No. UTG080000 (2000)]. The permit
expressly provides “[t]here shall be no discharge of wastewater and/or manure to waters of the
manure shall be conducted in a manner to prevent any pollution of waters of the State. Manure
shall be land applied in accordance with the [Comprehensive Nutrient Management Plan]
(CNMP) developed for the operation” [Permit III.F]. The CNMP must be prepared in accordance
with NRCS Technical Guidance, which is Standard Practice 590.
The Permit also specifies the Best Management Practices must be included in the CNMP [Permit
III.B.5]. These requirements relate to the production areas of the facility and will not be
summarized here. The permit also requires the permittee to include a “nutrient management
plan” in the CNMP, which “shall ensure protection of surface and ground water when utilizing
application of manure for the purpose of growing crops [Permit III.B.6].
State from land application activities under the control of the CAFO owner/operator” [Permit
I.F.2]. In Utah, waters of the state” includes groundwater. The permit also states “[d]isposal of
234
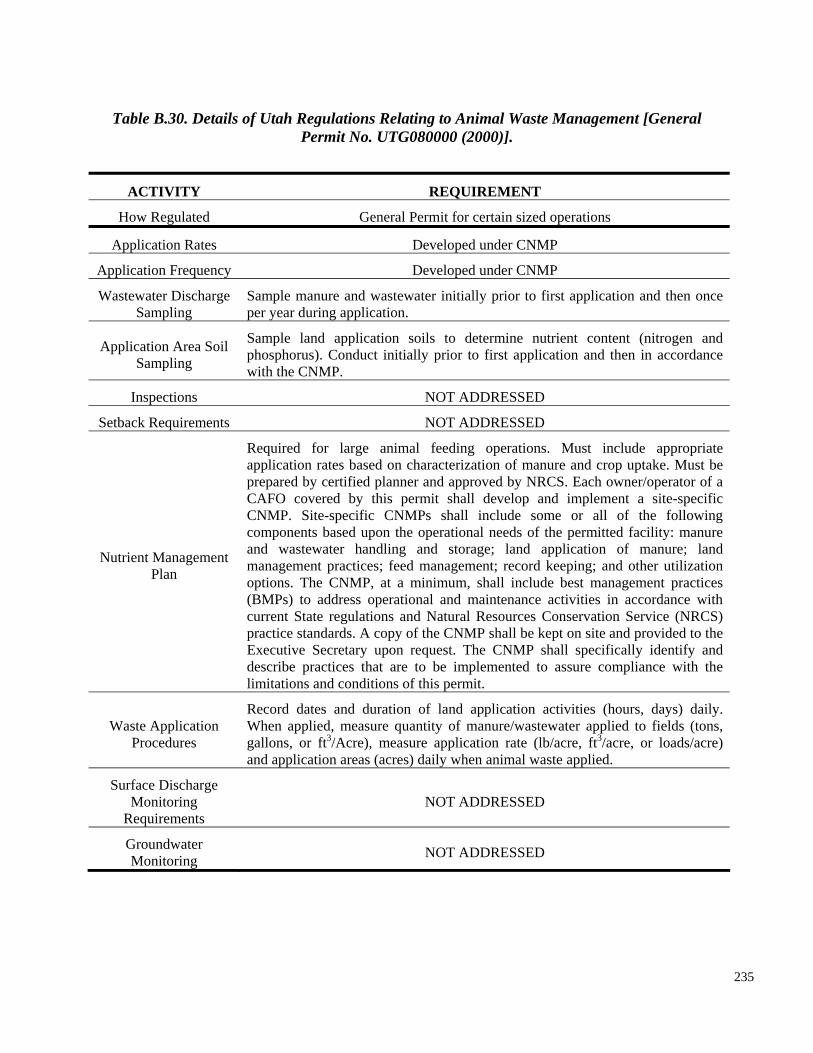
Table B.30. Details of Utah Regulations Relating to Animal Waste Management [General Permit No. UTG080000 (2000)].
ACTIVITY REQUIREMENT
How Regulated General Permit for certain sized operations
Application Rates Developed under CNMP
Application Frequency Developed under CNMP
Sample manure and wastewater initially prior to first application and then once per year during application.
limitations and conditions of this permit.
Record dates and duration of land application activities (hours, days) daily. When applied, measure quantity of manure/wastewater applied to fields (tons, gallons, or ft3/Acre), measure application rate (lb/acre, ft3/acre, or loads/acre) and application areas (acres) daily when animal waste applied.
Surface Discharge Monitoring NOT ADDRESSED
Requirements
Groundwater NOT ADDRESSEDMonitoring
Wastewater Discharge Sampling
Application Area Soil Sampling
Inspections
Setback Requirements
Nutrient Management Plan
Waste Application Procedures
with the CNMP.
235
Sample land application soils to determine nutrient content (nitrogen and phosphorus). Conduct initially prior to first application and then in accordance
NOT ADDRESSED
NOT ADDRESSED
Required for large animal feeding operations. Must include appropriate application rates based on characterization of manure and crop uptake. Must be prepared by certified planner and approved by NRCS. Each owner/operator of a CAFO covered by this permit shall develop and implement a site-specific CNMP. Site-specific CNMPs shall include some or all of the following components based upon the operational needs of the permitted facility: manure and wastewater handling and storage; land application of manure; land management practices; feed management; record keeping; and other utilization options. The CNMP, at a minimum, shall include best management practices (BMPs) to address operational and maintenance activities in accordance with current State regulations and Natural Resources Conservation Service (NRCS) practice standards. A copy of the CNMP shall be kept on site and provided to the Executive Secretary upon request. The CNMP shall specifically identify and describe practices that are to be implemented to assure compliance with the
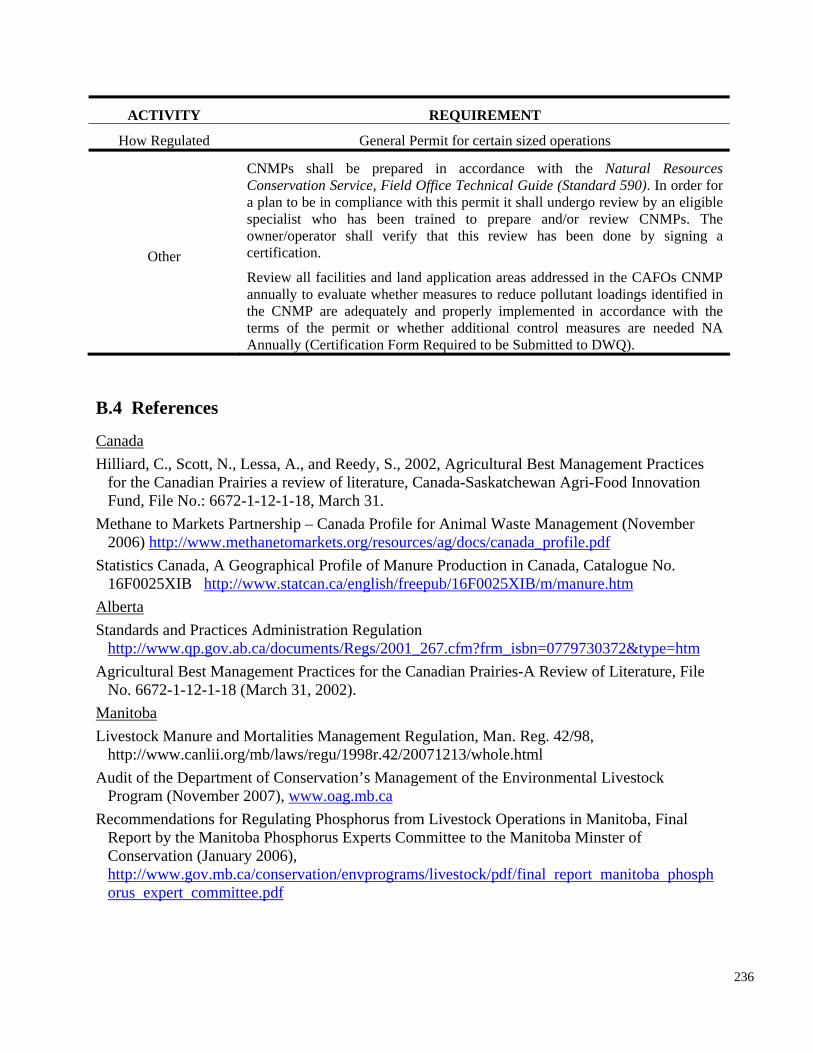
ACTIVITY REQUIREMENT
How Regulated General Permit for certain sized operations
CNMPs shall be prepared in accordance with the Natural Resources Conservation Service, Field Office Technical Guide (Standard 590). In order for a plan to be in compliance with this permit it shall undergo review by an eligible specialist who has been trained to prepare and/or review CNMPs. The owner/operator shall verify that this review has been done by signing a certification.Other Review all facilities and land application areas addressed in the CAFOs CNMP annually to evaluate whether measures to reduce pollutant loadings identified in the CNMP are adequately and properly implemented in accordance with the terms of the permit or whether additional control measures are needed NA Annually (Certification Form Required to be Submitted to DWQ).
B.4 References
Canada Hilliard, C., Scott, N., Lessa, A., and Reedy, S., 2002, Agricultural Best Management Practices
for the Canadian Prairies a review of literature, Canada-Saskatchewan Agri-Food Innovation Fund, File No.: 6672-1-12-1-18, March 31.
Methane to Markets Partnership – Canada Profile for Animal Waste Management (November 2006) http://www.methanetomarkets.org/resources/ag/docs/canada_profile.pdf
Statistics Canada, A Geographical Profile of Manure Production in Canada, Catalogue No. 16F0025XIB http://www.statcan.ca/english/freepub/16F0025XIB/m/manure.htm
Alberta Standards and Practices Administration Regulation
http://www.qp.gov.ab.ca/documents/Regs/2001_267.cfm?frm_isbn=0779730372&type=htm Agricultural Best Management Practices for the Canadian Prairies-A Review of Literature, File
No. 6672-1-12-1-18 (March 31, 2002). Manitoba Livestock Manure and Mortalities Management Regulation, Man. Reg. 42/98,
http://www.canlii.org/mb/laws/regu/1998r.42/20071213/whole.html Audit of the Department of Conservation’s Management of the Environmental Livestock
Program (November 2007), www.oag.mb.ca Recommendations for Regulating Phosphorus from Livestock Operations in Manitoba, Final
Report by the Manitoba Phosphorus Experts Committee to the Manitoba Minster of Conservation (January 2006), http://www.gov.mb.ca/conservation/envprograms/livestock/pdf/final report manitoba phosph orus expert committee.pdf
236
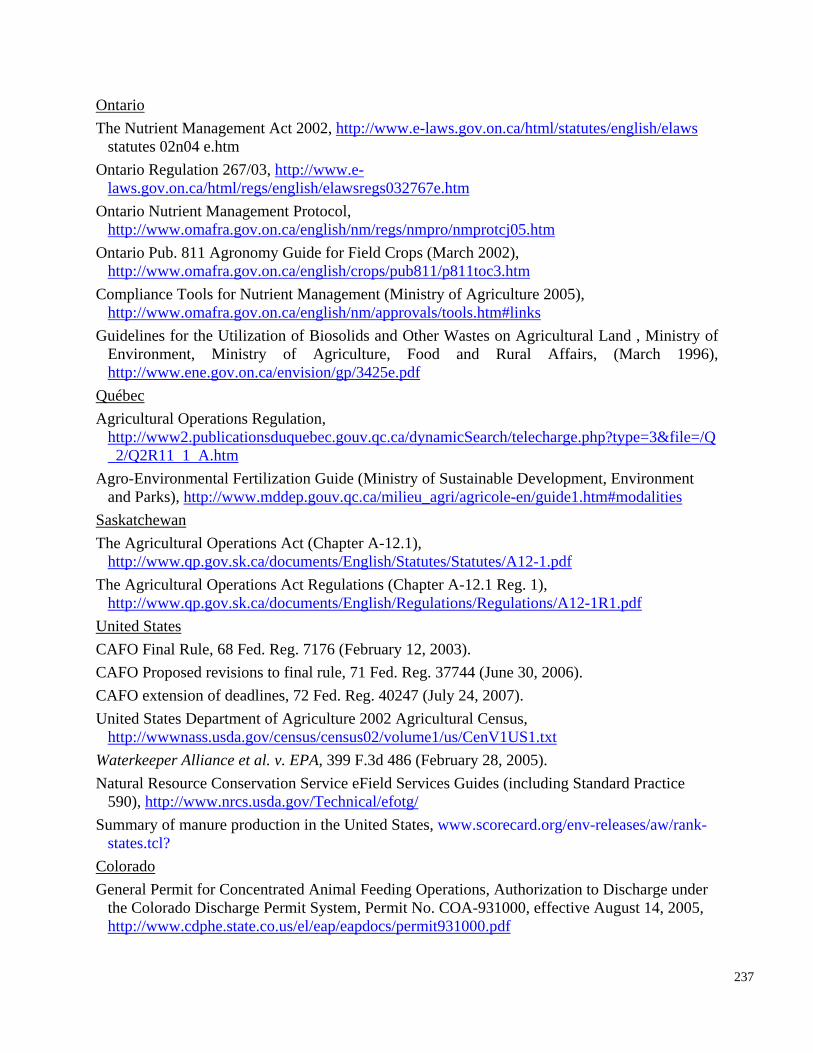
CAFO extension of deadlines, 72 Fed. Reg. 40247 (July 24, 2007). United States Department of Agriculture 2002 Agricultural Census,
Ontario The Nutrient Management Act 2002, http://www.e-laws.gov.on.ca/html/statutes/english/elaws
statutes 02n04 e.htm Ontario Regulation 267/03, http://www.e
laws.gov.on.ca/html/regs/english/elawsregs032767e.htm Ontario Nutrient Management Protocol,
http://www.omafra.gov.on.ca/english/nm/regs/nmpro/nmprotcj05.htm Ontario Pub. 811 Agronomy Guide for Field Crops (March 2002),
http://www.omafra.gov.on.ca/english/crops/pub811/p811toc3.htm Compliance Tools for Nutrient Management (Ministry of Agriculture 2005),
and Rural
http://www2.publicationsduquebec.gouv.qc.ca/dynamicSearch/telecharge.php?type=3&file=/Q 2/Q2R11 1 A.htm
Agro-Environmental Fertilization Guide (Ministry of Sustainable Development, Environment and Parks), http://www.mddep.gouv.qc.ca/milieu_agri/agricole-en/guide1.htm#modalities
Saskatchewan The Agricultural Operations Act (Chapter A-12.1),
http://www.qp.gov.sk.ca/documents/English/Statutes/Statutes/A12-1.pdf The Agricultural Operations Act Regulations (Chapter A-12.1 Reg. 1),
http://www.qp.gov.sk.ca/documents/English/Regulations/Regulations/A12-1R1.pdf United States CAFO Final Rule, 68 Fed. Reg. 7176 (February 12, 2003). CAFO Proposed revisions to final rule, 71 Fed. Reg. 37744 (June 30, 2006).
http://www.omafra.gov.on.ca/english/nm/approvals/tools.htm#links Guidelines for the Utilization of Biosolids and Other Wastes on Agricultural Land , Ministry of
Environment, Ministry of Agriculture, Food Affairs, (March 1996), http://www.ene.gov.on.ca/envision/gp/3425e.pdf
Québec Agricultural Operations Regulation,
http://wwwnass.usda.gov/census/census02/volume1/us/CenV1US1.txt Waterkeeper Alliance et al. v. EPA, 399 F.3d 486 (February 28, 2005). Natural Resource Conservation Service eField Services Guides (including Standard Practice
590), http://www.nrcs.usda.gov/Technical/efotg/ Summary of manure production in the United States, www.scorecard.org/env-releases/aw/rank
states.tcl? Colorado General Permit for Concentrated Animal Feeding Operations, Authorization to Discharge under
the Colorado Discharge Permit System, Permit No. COA-931000, effective August 14, 2005, http://www.cdphe.state.co.us/el/eap/eapdocs/permit931000.pdf
237
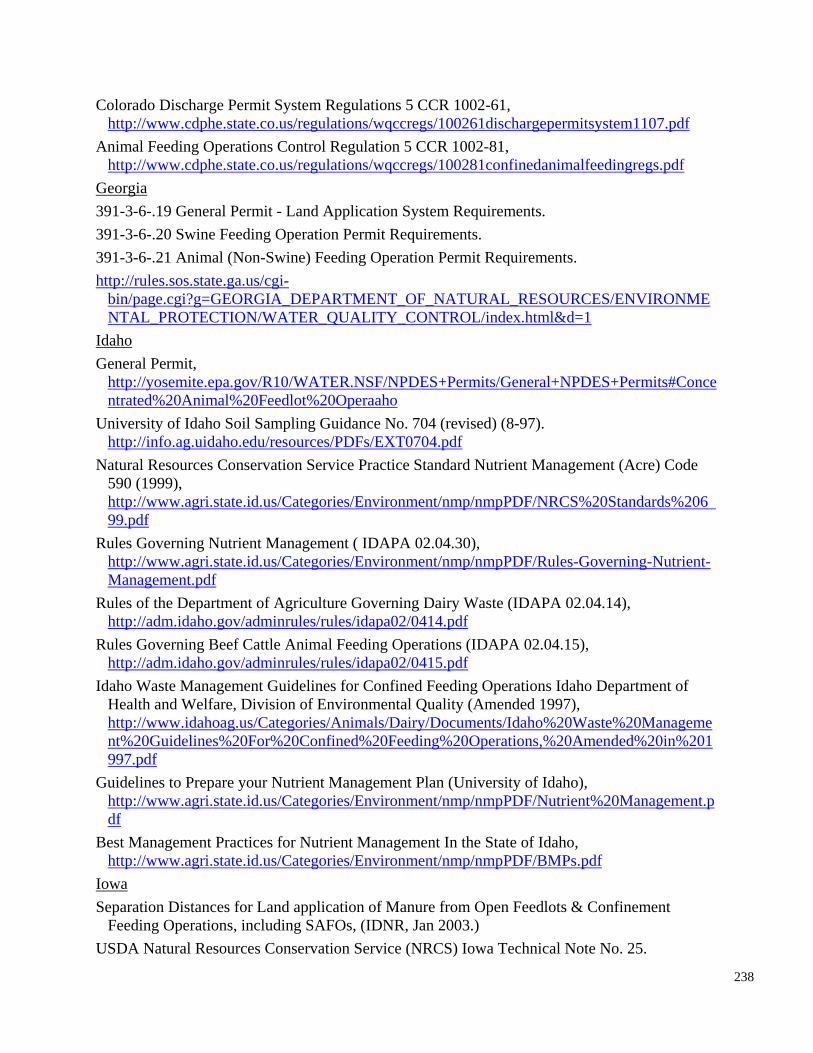
Idaho Waste Management Guidelines for Confined Feeding Operations Idaho Department of Health and Welfare, Division of Environmental Quality (Amended 1997),
Colorado Discharge Permit System Regulations 5 CCR 1002-61, http://www.cdphe.state.co.us/regulations/wqccregs/100261dischargepermitsystem1107.pdf
Animal Feeding Operations Control Regulation 5 CCR 1002-81, http://www.cdphe.state.co.us/regulations/wqccregs/100281confinedanimalfeedingregs.pdf
Georgia 391-3-6-.19 General Permit - Land Application System Requirements. 391-3-6-.20 Swine Feeding Operation Permit Requirements. 391-3-6-.21 Animal (Non-Swine) Feeding Operation Permit Requirements. http://rules.sos.state.ga.us/cgi
99.pdf
http://www.idahoag.us/Categories/Animals/Dairy/Documents/Idaho%20Waste%20Manageme nt%20Guidelines%20For%20Confined%20Feeding%20Operations,%20Amended%20in%201 997.pdf
bin/page.cgi?g=GEORGIA_DEPARTMENT_OF_NATURAL_RESOURCES/ENVIRONME NTAL_PROTECTION/WATER_QUALITY_CONTROL/index.html&d=1
Idaho General Permit,
http://yosemite.epa.gov/R10/WATER.NSF/NPDES+Permits/General+NPDES+Permits#Conce ntrated%20Animal%20Feedlot%20Operaaho
University of Idaho Soil Sampling Guidance No. 704 (revised) (8-97). http://info.ag.uidaho.edu/resources/PDFs/EXT0704.pdf
Natural Resources Conservation Service Practice Standard Nutrient Management (Acre) Code 590 (1999), http://www.agri.state.id.us/Categories/Environment/nmp/nmpPDF/NRCS%20Standards%206
Rules Governing Nutrient Management ( IDAPA 02.04.30), http://www.agri.state.id.us/Categories/Environment/nmp/nmpPDF/Rules-Governing-Nutrient-Management.pdf
Rules of the Department of Agriculture Governing Dairy Waste (IDAPA 02.04.14), http://adm.idaho.gov/adminrules/rules/idapa02/0414.pdf
Rules Governing Beef Cattle Animal Feeding Operations (IDAPA 02.04.15), http://adm.idaho.gov/adminrules/rules/idapa02/0415.pdf
Guidelines to Prepare your Nutrient Management Plan (University of Idaho), http://www.agri.state.id.us/Categories/Environment/nmp/nmpPDF/Nutrient%20Management.p df
Best Management Practices for Nutrient Management In the State of Idaho, http://www.agri.state.id.us/Categories/Environment/nmp/nmpPDF/BMPs.pdf
Iowa Separation Distances for Land application of Manure from Open Feedlots & Confinement
Feeding Operations, including SAFOs, (IDNR, Jan 2003.) USDA Natural Resources Conservation Service (NRCS) Iowa Technical Note No. 25.
238
Kansas Technical Standard – Nutrient Management (revised 12/15/2006), http://www.kdheks.gov/feedlots/index.html#links
USDA NRCS Site Assessment Index-Phosphorus, Series No. 1201, (2004), http://www.nrcs.usda.gov/technical/ECS/nutrient/pindex.html
Michigan Generally Accepted Agricultural and Management Practices for Manure Management and
Utilization (June 2007), http://www.michigan.gov/gamps Michigan Right To Farm Act (Act 93 of 1991),
http://www.legislature.mi.gov/(S(dst5qnbb4ympdb45c3cu4f55))/mileg.aspx?page=getobject& objectname=mcl-act-93-of-1981&queryid=8769063&highlight=
Michigan's Natural Resources and Environmental Protection Act (NREPA), Act 451 of 1994, http://www.michiganlegislature.org/mileg.asp?page=getObject&objName=mcl-Act-451-of-
Separation Distances for Land application of Manure from Open Feedlots & Confinement Feeding Operations, including SAFOs, (IDNR, Jan 2003.)
Regulations for Confined Feeding Operations, Chapter 65, http://www.legis.state.ia.us/Rules/Current/iac/567iac/56765/56765.pdf
Iowa Technical Note 25 - The Phosphorus Index, ftp://ftpfc.sc.ecgov.usda.gov/IA/technical/PIndexFOTGJan01.pdf
Zaines, G.N. and Schultz, R.C., 2002. Phosphorus in Agricultural Watersheds. Iowa State University, 106 pp.
Kansas Confined Animal Feeding Operations Statutes
http://www.kdheks.gov/feedlots/statutes/statutes.htm Animal and Related Waste Control Regulation K.A.R. 28-18-1 et.seq. Swine and Related Waste Control K.A.R. 28-18a -1 et.seq.
http://www.kdheks.gov/feedlots/download/Article_18a_combined_w_index.pdf Environmental Regulatory Guidance for Concentrated Animal Feeding Operations (with
emphasis on Large Dairy Operations) KDHE (Dec. 2003), http://www.kdheks.gov/feedlots/download/DairyGuidance04.pdf
1994&highlight= Manure Management Sheet #2, MSUE Bulletin E-2344 by Jacobs et al. (1992). Nebraska Nebraska Department of Environmental Quality (see Rules and Regulations Livestock Waste
Control Regulations Title 130), http://www.deq.state.ne.us/ North Dakota Control of Pollution from Animal Feeding Operations CHAPTER 33-16-03.1,
http://www.health.state.nd.us/WQ/AnimalFeedingOperations/Final%20Rules/33-1603.1%20Rules.pdf
South Dakota Groundwater Protection Rules, http://legis.state.sd.us/rules/DisplayRule.aspx?Rule=74:54:01
239
General Permit No. SDG-0100000, http://www.state.sd.us/denr/DES/Surfacewater/IPermits/AllAnimalGPermit.pdf
Nutrient Management/Manure Management Tools, http://www.state.sd.us/denr/DES/Surfacewater/ManureMgt/Tools.htm
SDSU Extension Publication EXEX 8009, Quantities of Plant Nutrients Contained in Crops (January 1985), http://agbiopubs.sdstate.edu/articles/ExEx8009.pdf
Texas TPDES General Permit Number TXG920000 Relating to the Discharge of Manure, Litter and
Wastewater from CAFO Facilities, http://www.tceq.state.tx.us/assets/public/permitting/waterquality/attachments/cafo/txg920000.p df
TNRCC General Permit Number WQG200000 Relating to Discharge of Waste Water from Manure Compost Facilities (2000), http://www.tceq.state.tx.us/assets/public/permitting/waterquality/attachments/general/wqg2000 00.pdf
TPDES General Permit Number TXG200000 Relating to the Natural Resource Conservation Practice Standard Nutrient Management Code 590 (June 1998), http://www.soil.ncsu.edu/interagency/attachments/NRCS590.pdf
Utah Regulations relating to Concentrated Animal Feeding Operations,
http://www.rules.utah.gov/publicat/code/r317/r317-006.htm General Permit for Concentrated Animal Feeding Operations Permit No. UTG080000,
http://www.waterquality.utah.gov/updes/cafo_gen_permit.pdf
240
APPENDIX C. OXYGEN IN THE SUBSURFACE AND ITS CONTROLS ON NITRIFICATION AND DENITRIFICATION
Microorganisms catalyze redox reactions. As such, they favour those redox processes that
generate the maximum amount of available energy. Microbial reactions that couple the most
efficient electron donors and acceptors have a competitive advantage [c.f., McMahon and
Chapelle, 2008]. Dissolved organic carbon is the most common electron donor. Electron
acceptors vary considerably. Molecular oxygen produces the most energy per mole of organic
carbon oxidized and, as a result, is preferentially used by bacteria and is the most important
biochemically active oxidant in nature [Stumm and Morgan, 1981]. Once the oxygen is
consumed, the most energetically favourable natural electron acceptor is NO3. Thus, the presence
or absence of O2 is a crucial factor in numerous biological and geologic processes such as soil
microbial respiration, nitrification and denitrification [Chapelle, 2000; Rose and Long, 1988a,b].
In oxygen-rich (oxic) systems, oxygen is present in measurable amounts, while no O2 is
detectable in anoxic systems. The term sub-oxic is sometimes used to describe an anoxic system
that is not sulfate-reducing. Nitrification is limited to oxygenated environments and
denitrification is limited to sub-oxic systems.
C.1. Vadose Zones
Molecular O2 in the Earth’s subsurface and groundwater environments is replenished from the
atmosphere, where the O2 concentration is maintained at 20.9 vol%. O2 is typically present in
vadose zones, or unsaturated zones, which extend from the top of the ground surface to the water
table. This is exemplified by the extensive O2 data bases in Wassenaar and Hendry [2007] who
collected gas data from a variety of study sites with textural differences (sand vs. clay) and
depths to water table (2-40 m below ground) from both natural and disturbed settings. Wassenaar
and Hendry [2007] augmented their data with vadose zone O2 concentrations reported in the
literature. A histogram of all vadose zone O2 data collected by Wassenaar and Hendry [2007] is
presented in Figure C1a. Oxygen gas concentrations range from atmospheric concentration levels
(20.9%) to a low of 2.1%. While the median value of all samples is 19.3%, the majority of
samples are skewed to O2 concentrations well above 18%. The lowest O2 gas concentrations are
reported for disturbed sites (2 to 3%) and from clay-rich soils (5%). The vadose zone O2 data
from Wassenaar and Hendry [2007] suggest nitrification and limited denitrification should occur
241
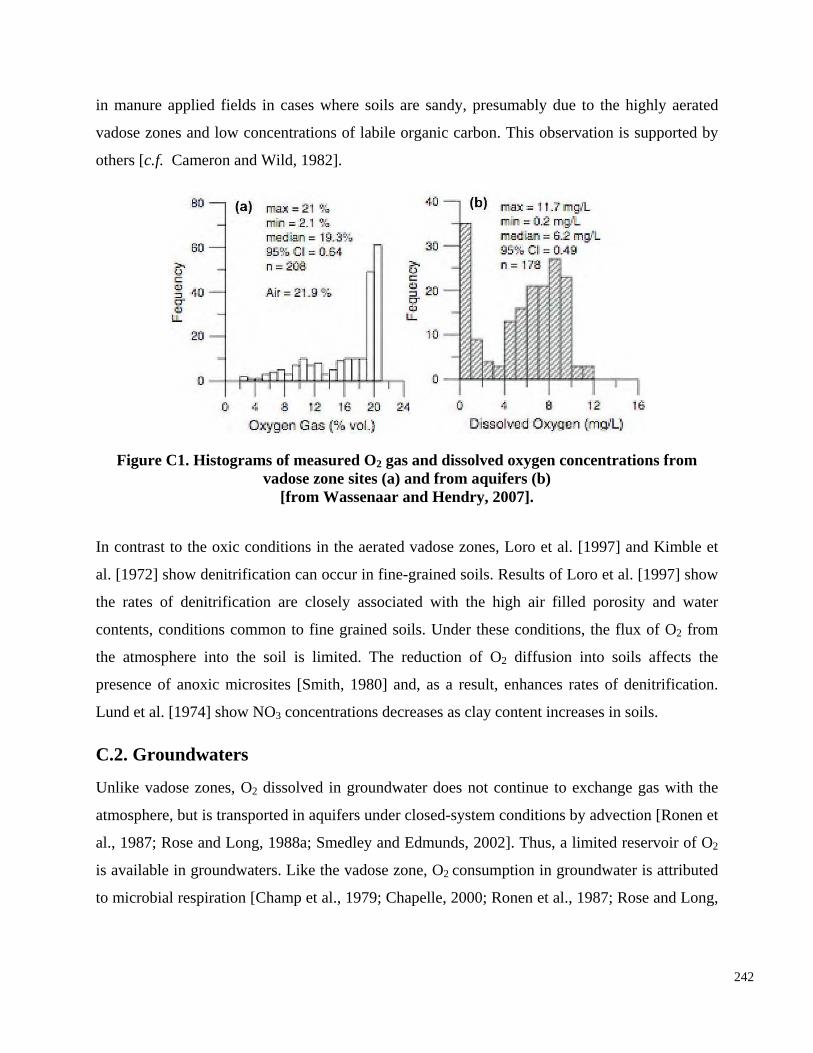
in manure applied fields in cases where soils are sandy, presumably due to the highly aerated
vadose zones and low concentrations of labile organic carbon. This observation is supported by
others [c.f. Cameron and Wild, 1982].
Figure C1. Histograms of measured O gas and dissolved oxygen concentrations from vadose zone sites (a) and from aquifers (b)
[from Wassenaar and Hendry, 2007].
In contrast to the oxic conditions in the aerated vadose zones, Loro et al. [1997] and Kimble et
al. [1972] show denitrification can occur in fine-grained soils. Results of Loro et al. [1997] show
the rates of denitrification are closely associated with the high air filled porosity and water
contents, conditions common to fine grained soils. Under these conditions, the flux of O2 from
the atmosphere into the soil is limited. The reduction of O2 diffusion into soils affects the
presence of anoxic microsites [Smith, 1980] and, as a result, enhances rates of denitrification.
Lund et al. [1974] show NO3 concentrations decreases as clay content increases in soils.
2
C.2. Groundwaters
Unlike vadose zones, O2 dissolved in groundwater does not continue to exchange gas with the
atmosphere, but is transported in aquifers under closed-system conditions by advection [Ronen et
al., 1987; Rose and Long, 1988a; Smedley and Edmunds, 2002]. Thus, a limited reservoir of O2
is available in groundwaters. Like the vadose zone, O2 consumption in groundwater is attributed
to microbial respiration [Champ et al., 1979; Chapelle, 2000; Ronen et al., 1987; Rose and Long,
242
1988a,b]. Consumption of the limited O2 in groundwater by microbes should occur, provided a
source of labile organic carbon is present.
In many groundwater aquifers, measurable dissolved O2 concentrations are often present. This is
exemplified by the O2 database in Wassenaar and Hendry [2007] who collected dissolved O2
data from four phreatic sand and gravel groundwater systems, including two aquifer systems
under intensive agriculture. Histograms of dissolved O2 data from these aquifers are shown in
Figure C1b. Dissolved O2 concentrations range from about 12 to less than 1 mg O2·L-1. These
data, and data from other studies [Chen and Liu, 2003; Ronen et al., 1987], suggest O2 can
persist well below the Earth’s surface to depths greater than 500 m, far below the active soil
organic zone. These data are supported by McMahon and Chapelle [2008] who compiled
dissolved O2 data from sand and gravel aquifers throughout the USA. They determined O2 was
present in about 90% of samples from major sand and gravel aquifers and 45% of aquifers in
As groundwaters migrate along a flow path in an aquifer, an ecological succession in terminal
electron acceptors can create zones in the aquifers in which specific redox processes dominate.
The classical succession is O2 followed by NO3 followed by Mn(IV) followed by Fe(III) and
then SO4. This succession has been described in aquifer systems.
In keeping with the ecological succession, dissimilatory reduction of NO3 is preferentially used
by microorganisms when dissolved O2 levels decrease to less than about 0.2 to 0.3 mg/L [c.f.,
Trudell et al., 1986; Hendry et al., 1983; Tiedje, 1988; Seitzinger et al., 2006]. In most aquifers,
denitrification should occur when the groundwater is oxygen deficient (i.e., under anoxic
conditions), and should not be attenuated in O2 rich groundwaters. In some aquifers, however,
243
glacial deposits. Dissolved O2 has also been measured at near saturation levels in some aquifer
waters greater than 10,000 years old [Rose and Long, 1988a; Winograd and Robertson, 1982]. In
these and other aquifer systems, the long-term persistence of NO3 also reflects oxic conditions in
the aquifers and a lack of electron donors necessary to support anoxic redox processes. This idea
is well supported in the literature. For example, Freeze and Cherry [1979] state that N,
particularly in the form of NO3, is the most common contaminant in aquifer systems. Further, the
presence of NO3 at great depths throughout phreatic aquifers in five regions in the USA reflected
oxic conditions in these aquifers [Hamilton and Helsel, 1995]. In addition, Bhatt [1997] shows
extensive NO3 contamination in a phreatic loam aquifer in South Dakota.
the threshold required for the onset of denitrification could be as great as 2 mg/L [McMahon et
al., 2004]. A review of chemistry data from major aquifers in the USA suggests concentrations of
NO3 are significantly greater in water samples containing greater than 0.5 mg/L O2 [McMahon
and Chapelle, 2008].
As was the case for fine-textured soils in vadose zones, denitrification has also been shown to
occur in shallow groundwaters in fine-textured soils [Gast et al., 1974; Gillham et al., 1974,
1978; Gambrell et al., 1975]. Denitrification in these environments can be attributed to anoxic
reduced conditions. The interface between the two zones is been termed a redoxcline.
Both oxic and anoxic redox conditions have been measured in groundwaters in weathered clay-
rich tills and other clay rich aquitard systems. Schmidt [1998] measured in situ Eh conditions
across the oxidized-unoxidized till interface (Figure C2). In general, the redox potential general
decreases with depth, and becomes negative near the bottom of the fractured till. Fluctuations in
redox conditions in this oxidized till zone were attributed to flooding of the site during spring
melt (end of March 1997). During this event, the redox potential declined sharply at depths of
0.3 to 1.0 m, but increased to near normal levels about one month later. At 1.5 m depth, the
conditions and high concentrations of labile carbon. Data from Rodvang et al. [1998] from
weathered tills suggests dissimilatory reduction of NO3 may occur at dissolved O2 levels of about
5 mg/L, and that denitrification in oxidized zones may be occurring at microsites.
In Chapter 5, glacial tills are described as weathered (or oxidized) and unoxidized (or reduced)
till zones. The former reflects the presence of oxic conditions and the latter the presence of
redox potential decreased in June after the flood. Redox conditions increased to near pre-flood
conditions in July.
Oxic conditions throughout oxidized tills are supported by measurements made by Pike-Glover
[1982]. The presence of both oxic and anoxic conditions in oxidized till, as identified by Schmidt
[1998], is supported by Geyer et al. [1992].
The presence of anoxic conditions in unoxidized till zones, as identified by Schmidt [1998], is
supported by Rodvang and Simpkins [2001] who conclude denitrification does not occur in the
unoxidized till zone (because of a lack of NO3), and by depth profiling of dissolved O2 by
Wassenaar and Hendry [1999].
244
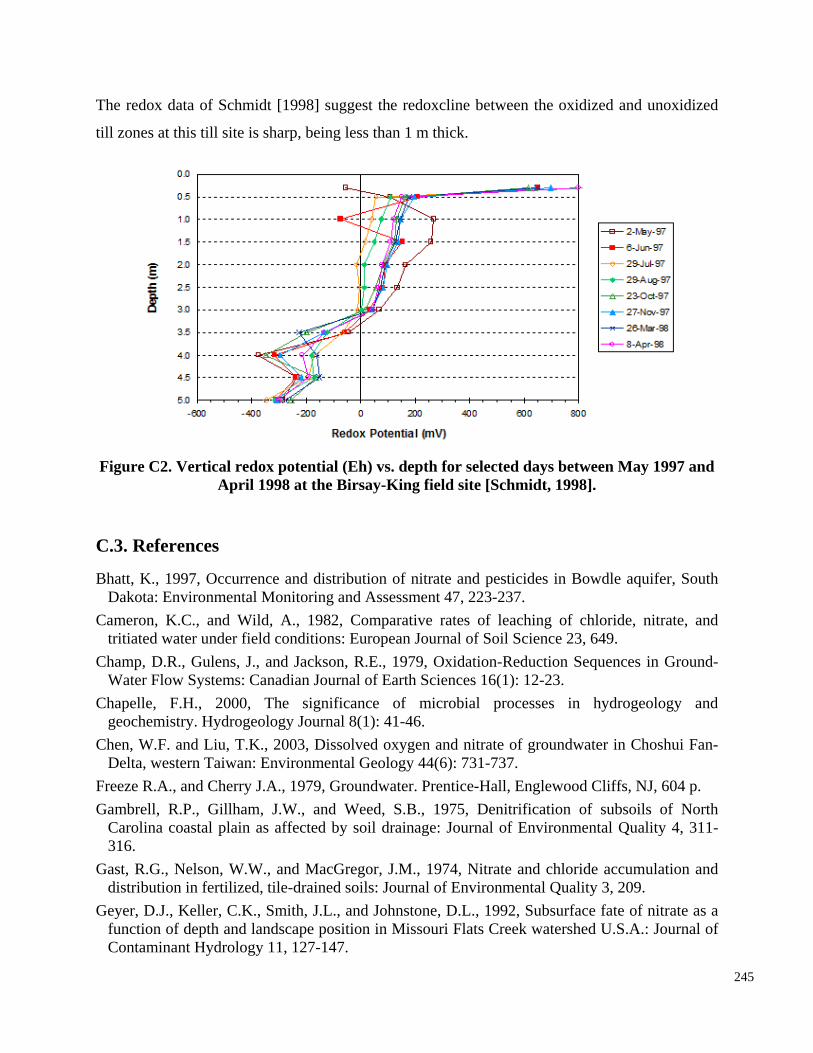
The redox data of Schmidt [1998] suggest the redoxcline between the oxidized and unoxidized
till zones at this till site is sharp, being less than 1 m thick.
Freeze R.A., and Cherry J.A., 1979, Groundwater. Prentice-Hall, Englewood Cliffs, NJ, 604 p. Gambrell, R.P., Gillham, J.W., and Weed, S.B., 1975, Denitrification of subsoils of North
Carolina coastal plain as affected by soil drainage: Journal of Environmental Quality 4, 311316.
Gast, R.G., Nelson, W.W., and MacGregor, J.M., 1974, Nitrate and chloride accumulation and distribution in fertilized, tile-drained soils: Journal of Environmental Quality 3, 209.
Geyer, D.J., Keller, C.K., Smith, J.L., and Johnstone, D.L., 1992, Subsurface fate of nitrate as a function of depth and landscape position in Missouri Flats Creek watershed U.S.A.: Journal of Contaminant Hydrology 11, 127-147.
245
Figure C2. Vertical redox potential (Eh) vs. depth for selected days between May 1997 and April 1998 at the Birsay-King field site [Schmidt, 1998].
C.3. References
Bhatt, K., 1997, Occurrence and distribution of nitrate and pesticides in Bowdle aquifer, South Dakota: Environmental Monitoring and Assessment 47, 223-237.
Cameron, K.C., and Wild, A., 1982, Comparative rates of leaching of chloride, nitrate, and tritiated water under field conditions: European Journal of Soil Science 23, 649.
Champ, D.R., Gulens, J., and Jackson, R.E., 1979, Oxidation-Reduction Sequences in Ground-Water Flow Systems: Canadian Journal of Earth Sciences 16(1): 12-23.
Chapelle, F.H., 2000, The significance of microbial processes in hydrogeology and geochemistry. Hydrogeology Journal 8(1): 41-46.
Chen, W.F. and Liu, T.K., 2003, Dissolved oxygen and nitrate of groundwater in Choshui Fan-Delta, western Taiwan: Environmental Geology 44(6): 731-737.
Research, 23(8): 1554-1560.
Gillham, J.W., Daniels, R.B., and Lutz, J.F., 1974, Nitrogen content in shallow ground water in the North Carolina coastal plain: Journal of Environmental Quality 3, 147.
Gillham, J.W, Dasburg, S., Lund, L.J., and Focht, D.D., 1978, Denitrification in four California soils: Effect of soil profile characteristics: Soil Science Society of America Journal 42, 61-79.
Hamilton, P., and Helsel, D.R., 1995, Effects of agriculture on ground-water quality in five regions of the United States: Ground Water 33(2), 217-226.
Hendry, M.J., Gillham, R.W., and Cherry, J.A., 1983, An integrated approach to the study of groundwater flow - A case study: Journal of Hydrology 63, 211-232.
Kimble, J.M., Bartlett, R.J., McIntosh, J.L., and Varney, K.E., 1972, Fate of nitrate from manure
and paleorecharge conditions along a transect in the Central High Plains Aquifer, southwestern Kansas, U.S.A.: Applied Geochemistry 19(11), 1655-1686.
McMahon, P.B., and Chapelle, F.H., 2008, Redox processes and water quality of selected principal aquifer systems: Ground Water 46(2): 259-271.
Pike-Glover, D., 1982, Hydrochemistry in overburden of southern Alberta: MSc Thesis, University of Alberta, 215 pp.
Rodvang, S.J., and Simpkins, W.W., 2001, Agricultural contaminants in Quaternary aquitards: A review of occurrence and fate in North America: Hydrogeology Journal 9, 44-59.
Rodvang, S.J., Schmidt-Bellach, R., and Wassenaar, L.I., 1998, Nitrate in groundwater below irrigated fields in southern Alberta. Canada-Alberta Environmentally Sustainable Agriculture Agreement Research Program project RES-041-93. Alberta Agriculture, Food and Rural Development, Lethbridge, Alberta, 222 p.
and inorganic nitrogen in clay soil cropped to continuous corn: Journal of Environmental Quality 1, 413-415.
Loro, P.J., Bergstrom, D.W., and Beauchamp, E.G., 1997, Intensity and duration of denitrification following application of manure and fertilizer to soil: Journal of Environmental Quality 26, 706-713.
Lund, L.J., Adriano, D.E., and Pratt, P.F., 1974, Nitrate concentrations in deep soil cores as related to soil profile characteristics: Journal of Environmental Quality 3, 78-82.
McMahon, P.B., Bohlke, J.K., and Christianson, S.C., 2004, Geochemistry, radiocarbon ages,
Ronen, D., Magaritz, M., Almon, E. and Amiel, A.J., 1987, Anthropogenic Anoxification (Eutrophication) of the Water-Table Region of a Deep Phreatic Aquifer: Water Resources
Rose, S., and Long, A., 1988a, Dissolved oxygen systematics in the Tuscon Basin aquifer: Water Resources Research 24(1): 127-136.
Rose, S., and Long, A., 1988b, Monitoring Dissolved-Oxygen in Ground-Water - Some Basic Considerations: Ground Water Monitoring and Remediation 8(1): 93-97.
Schmidt, D.F., 1998, Vertical distribution of microorganisms and carbon dioxide concentrations in the upper five meters of a clay till: MSc Thesis, University of Saskatchewan, 131 pp.
Seitzinger, S., Harrison, J.A., Bohlke, J.K., Bouwman, A.F., Lowrence, R., Peterson, B., Tobias, C., and Van Drecht, G., 2006, Denitrification across landscapes and waterscapes: A synthesis: Eoological Applications 16(6), 2064-2090.
246
Smedley, P.L., and Edmunds, W.M., 2002, Redox patterns and trace-element behavior in the East Midlands Triassic Sandstone Aquifer, UK: Ground Water 40(1): 44-58.
Smith, K.A., 1980, A model of the extent of anaerobic zones in aggregated soils, and its potential application to estimates of denitrification: Journal of Soil Science 31, 263.
Stumm, W., and Morgan, J.J., 1981. Aquatic Chemistry. Wiley-Interscience, New York, 780 pp. Stumm, W., and Morgan, J.J., 1996, Aquatic Chemistry, Chemical Equilibria and Rates in
Natural Waters: 3rd ed. John Wiley & Sons, Inc., New York, 1022p. Tiedje, J.M., 1988, Ecology of denitrification and dissimilatory nitrate reduction to ammonium.
In Biology of Anaerobic Microorganisms, A.J.B. Zehnder, pp. 179-244. New York, John Wiley and Sons.
Trudell M.R., Gillham, R.W., and Cherry, J.A., 1986, An in situ study of the occurrence and rate of dentrification in a shallow unconfined sand aquifer: Journal of Hydrology 83 (3-4), 251-268.
Wassenaar, L.I., and Hendry, M.J., 2007, Dynamics and Stable Isotope Composition of Gaseous and Dissolved Oxygen: Ground Water 45 (4), 447–460.
Wassenaar, L.I., and Hendry, M.J., 1999, Improved piezometer construction and sampling techniques to determine pore water chemistry in aquitards: Journal of Ground Water 35, 17511760.
Winograd, I.J. and Robertson, F.N., 1982, Deep Oxygenated Groundwater - Anomaly or Common Occurrence: Science 216(4551): 1227-1230.
247
APPENDIX D. GEOLOGIC CONTROLS ON THE MIGRATION OF WATER AND CONTAMINANTS
D.1. Clay-rich till and lacustrine deposits
The average thickness of till in the Prairies is about 23 m, but the average thickness of till
increases from west to east [Meyboom, 1967]. The textures of the till matrix generally range
from clay loam to sandy clay loam.
The tills and glacolacustrine deposits can commonly be divided into two hydrogeologic zones:
weathered and unweathered. The designations are based on colour: the weathered zone is a
brown oxidized colour (as a result of mineral and organic matter oxidation) and the unweathered
zone is grey. The uppermost several meters of surficial aquitards are typically weathered. The
weathered zones have been noted to reach thicknesses of 25 m [Rodvang and Simpkins, 2001;
Hendry, 1988, 1983, 1982, 1981; Hendry et al., 1984] and have been observed to be thicker on
and 10-8 m/s
[Rodvang and Simpkins, 2001].
The effect of fracturing on K is exemplified in Figure D1 [Harrington et al., 2007]. The upper 3
m of till at this site is weathered and the underlying 77 m is unweathered. A sand layer is present
at 15 m BG. In Figure D1, the K of the weathered zone is about 10-8 m/s while the nonfractured,
unweathered till is about 10-11 to 10-10 m/s. As a result of fracturing, groundwater flow in the
weathered till is dynamic, responding to spring snow melt and precipitation events. Typically,
the water table ranges in depth from 0 to 3 m below ground (BG) [Shaw and Hendry, 1998].
These fractures can permit significant preferential water and solute migration [c.f. D'Astous et al.
1989; McKay and Fredericia 1995]. Estimates of groundwater velocities in the literature for
these fractured media range from 0.05 to 5 m/year.
248
topographic highs and thinner to not present in depressions [Eidem et al., 1999].
Fractures in the weathered aquitard media can significantly increase the local K, or hydraulic
conductivity, of the zone. As a result of fracturing, the K of till deposits typically range between
10-11 to 10-5 m/s [Rodvang and Simpkins, 2001] with the lower K values, about 10-11 to about 10-
10 m/s, reflecting the K values for nonfractured, unweathered clay-rich tills observed in southern
Alberta and Saskatchewan [Hendry, 1988; Keller et al., 1988a; Shaw and Hendry, 1998].
Similarly, the K of the glaciolacustrine deposits typically range between 10-11
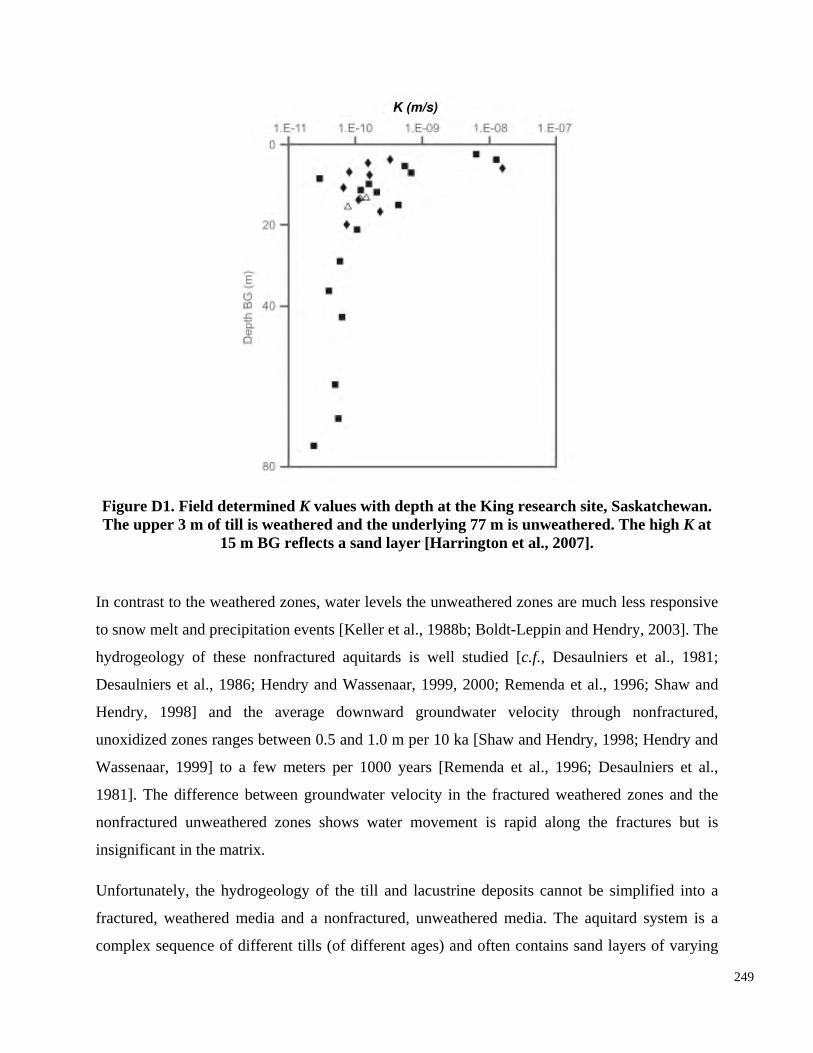
Figure D1. Field determined K values with depth at the King research site, Saskatchewan. The upper 3 m of till is weathered and the underlying 77 m is unweathered. The high K at
15 m BG reflects a sand layer [Harrington et al., 2007].
In contrast to the weathered zones, water levels the unweathered zones are much less responsive
to snow melt and precipitation events [Keller et al., 1988b; Boldt-Leppin and Hendry, 2003]. The
hydrogeology of these nonfractured aquitards is well studied [c.f., Desaulniers et al., 1981;
Desaulniers et al., 1986; Hendry and Wassenaar, 1999, 2000; Remenda et al., 1996; Shaw and
Hendry, 1998] and the average downward groundwater velocity through nonfractured,
unoxidized zones ranges between 0.5 and 1.0 m per 10 ka [Shaw and Hendry, 1998; Hendry and
Wassenaar, 1999] to a few meters per 1000 years [Remenda et al., 1996; Desaulniers et al.,
1981]. The difference between groundwater velocity in the fractured weathered zones and the
nonfractured unweathered zones shows water movement is rapid along the fractures but is
insignificant in the matrix.
Unfortunately, the hydrogeology of the till and lacustrine deposits cannot be simplified into a
fractured, weathered media and a nonfractured, unweathered media. The aquitard system is a
complex sequence of different tills (of different ages) and often contains sand layers of varying
249
thicknesses and sand streaks. Sand layers in the tills are common as evidenced by their use for
domestic water supply. In 1967, Meyboom [1967] estimated about 60% of all farm water
supplies in the Prairie Provinces obtained their water from tills, thus reflecting their permeable
nature. Further, due to the deposition of multiple glacial till sheets deposited over the Prairies
since the Pre-Illinoian, cycles of weathered and unweathered zones, representing individual till
sheets, have been documented. In addition, fracturing may occur in the unweathered till zone. In
some cases, hydraulically conductive fractures extend many meters below the visibly weathered
zone [Keller et al., 1988b; McKay and Fredericia, 1995; Ruland et al., 1991; Boldt-Leppin and
active zone, or by field observations of hydraulic responses [McKay and Fredericia, 1995; Boldt-
Leppin and Hendry, 2003] or high resolution δD and δ18O profiles [Hendry et al., 2004].
The effect of fracturing on increasing the K of unweathered till is exemplified by Keller et al.
[1988b] and Boldt-Leppin and Hendry [2003]. Keller et al. [1988b] show fracturing, as
evidenced by elevated in situ K values, extended throughout the full thickness of an 18 m thick
till and well below the depth of weathering of 8 to 12 m BG (Figure D2). Boldt-Leppin and
Hendry [2003] also show the effects of fracturing, by determining measurable vertical K values
at the site studied by Harrington et al. [2007] (Figure D1) extending to about 15 m BG, well
Hendry, 2003].
Assessing the extent of fracturing is difficult because frequently little or no evidence exists
regarding fractures below the visibly weathered zone. The K of fractured media is typically
inferred from additional evidence, such as detectable tritium levels at depths greater than the
below the weathered-unweathered interface.
Fracture spacing has been shown to decrease with increasing depth below ground surface
[McKay and Fredericia, 1995].
250
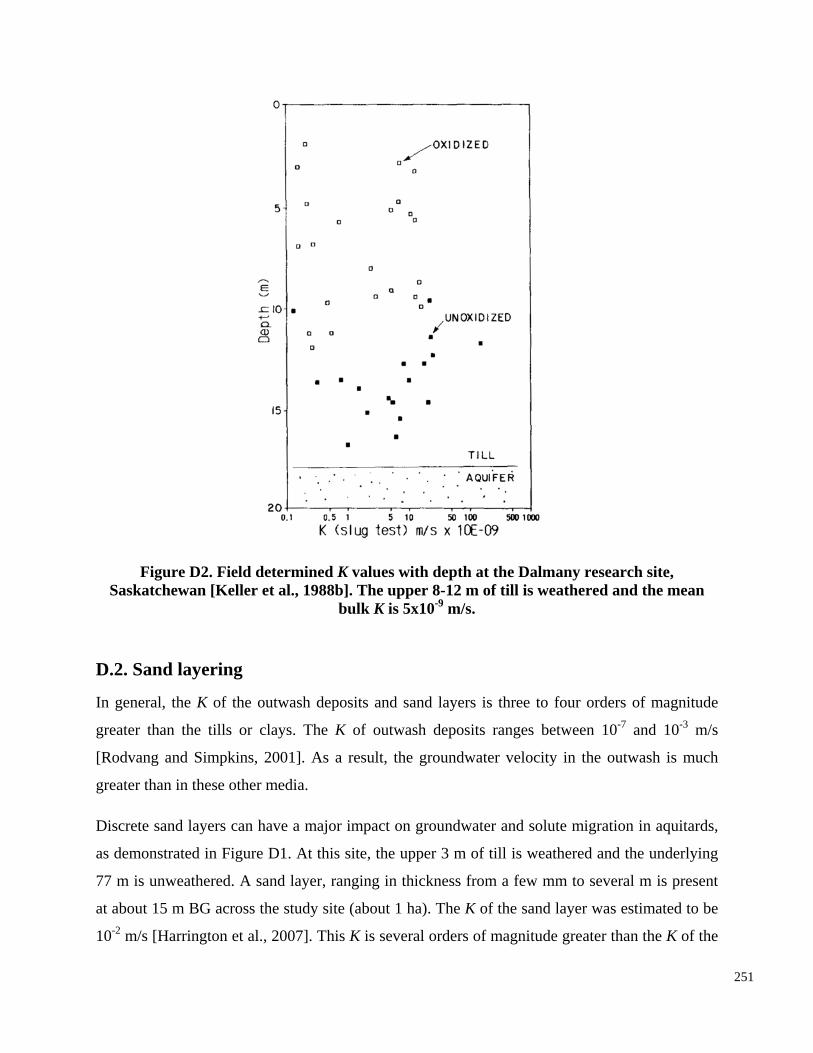
D.2. Sand layering
Figure D2. Field determined K values with depth at the Dalmany research site, Saskatchewan [Keller et al., 1988b]. The upper 8-12 m of till is weathered and the mean
bulk K is 5x10⁻⁹ m/s.
In general, the K of the outwash deposits and sand layers is three to four orders of magnitude
greater than the tills or clays. The K of outwash deposits ranges between 10-7 and 10-3 m/s
[Rodvang and Simpkins, 2001]. As a result, the groundwater velocity in the outwash is much
greater than in these other media.
Discrete sand layers can have a major impact on groundwater and solute migration in aquitards,
as demonstrated in Figure D1. At this site, the upper 3 m of till is weathered and the underlying
77 m is unweathered. A sand layer, ranging in thickness from a few mm to several m is present
at about 15 m BG across the study site (about 1 ha). The K of the sand layer was estimated to be
10-2 m/s [Harrington et al., 2007]. This K is several orders of magnitude greater than the K of the
251
weathered zone (10-8 m/s) and the nonfractured, unweathered till (10-11 to 10-10 m/s). On the
basis of the K of the sand layer and the measured hydraulic gradient, the velocities of
groundwater and solutes in the sand were estimated to be about 1000 m/year [Harrington et al.,
2007]. This calculation demonstrates contaminants entering a sand layer can migrate great
distances in a short time frame.
D.3. Topographic effects on water and solute transport
Closed topographic depressions are common features in many landscapes. They vary in diameter
from centimetres to tens of kilometres, and collect runoff water from the surrounding areas
during snowmelt and heavy rains. Small depressions, with surface areas in the range of 10
1000 m2, are common within agricultural areas [Hayashi et al., 2003]. These depressions can be
subtle small-scale topographic variations, on the order of a few cm to tens of cm, and can be
superimposed on the regional relief [Keller et al., 1988b].
for a brief period of time before infiltrating at a rate comparable to saturated soil K. Similar
observations were made by Sharratt [2001] under a depression in a fallow field in Minnesota.
Derby and Knighton [2001] show depression-focused recharge occurs through partially frozen
soil. Geochemical observations support the focused migration of water through depressions
because considerable differences are observed between the chemical leaching characteristics
beneath topographic ridges and their adjacent uplands [Zebarth et al., 1989; Keller et al., 1991;
Hayashi et al., 1998; Berthold et al., 2004]. This leaching effect reinforces the fact that small-
scale depressions are very effective at transmitting recharge water to the water table.
252
Studies of groundwater recharge in the glaciated plains of North American show recharge is
focused in these depressions. Depression-focused recharge has been noted as an important source
of groundwater in the interior Great Plains [e.g., Lissey, 1971]. Because of the high density of
depressions on the Prairies, van der Kamp and Hayashi [1998] suggest the numerous wetland
and ponds that form in the depressions are the dominant source of recharge of shallow
groundwater. Other studies clearly show depression-focused recharge of snowmelt water is
especially important. Baker and Spaans [1997] studied snowmelt infiltration in an agricultural
field in Minnesota, USA, and noted much of snowmelt water flowed to a depression and ponded
D.4. Effects of diffusion vs. advection of solutes in fractured media
Solute transport in permeable deposits such as outwash is controlled by advection. In the case of
non-fractured, low K, unweathered tills and clays, solute transport is dominated by diffusion
[Hendry and Wassenaar, 1999; Remenda et al., 1996; Desaulniers et al., 1981] when
groundwater velocity is less than 1 cm/year [Boldt-Leppin et al., unpublished data]. In fractured
weathered and unweathered tills, solute transport is controlled by advection along the fractures
(high K) and by diffusion (low K) in the adjoining matrix. The application of equivalent porous
media approaches, which are valid in nonfractured porous media, is commonly used to simulate
The relative rate of contaminant migration (via advection vs. diffusion) is controlled by the
interrelationship between solute migration in the fractures and matrix as defined by the fracture
spacing and aperture, measured K, porosity, and coefficients of diffusion. Analysis of these
parameters can be used in Equivalent Porous Media (EPM) calculations to determine if solute
transport is dominated by fracture flow or advection. The criteria used to define EPM conditions
were proposed by van der Kamp [1992] to determine a potential range of EPM conditions for
various groundwater flow rates and transport distances.
An example of this evaluation, prepared for fractured tills, is provided in Figure D3. In this
contaminant transport in fractured deposits. This approach is attractive because it is conceptually
simpler than discrete fracture network approaches, which require much more data and many
more fitting parameters. However, under what conditions using an equivalent porous media
approach is appropriate is often not clear.
graph, assumed or measured fracture spacing is plotted against K with fracture aperture estimated
from the equations proposed by Snow [1968]. The advection transport rate through an EPM is
estimated from an assumed vertical hydraulic gradient of 1 and a porosity of 0.3. The rate of
diffusion into the matrix between the fractures is based on an assumed coefficient of diffusion of
0.01 m2/y.
253
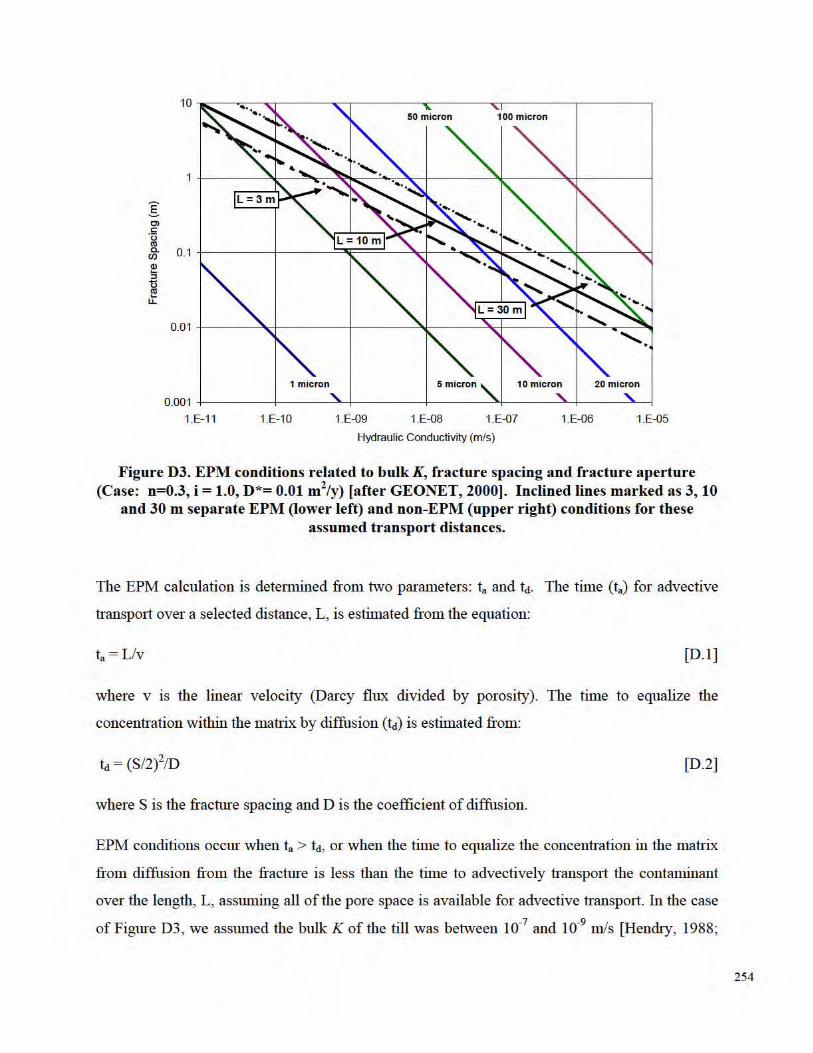
Keller et al., 1988b; McKay et al., 1993; Harrington et al., 2007], fracture aperture widths of 20
to 50 µm [Grisak and Cherry, 1975; Hendry et al., 1986; McKay et al., 1993], and fracture
spacing of 0.1 to 0.4 m [McKay et al., 1993 and references therein]. Based on these data, EPM
conditions are likely to exist for most fractured aquitards, specifically for transport distances of
10 m or greater (for high bulk K) to less than 3 m and greater (for low bulk K). Note these
calculations are conservative as they were determined for a very high hydraulic gradient (1.0). In
most groundwaters on the Prairies, the hydraulic gradient is much lower.
D.5. References
Baker, J.M., and Spaans, E.J.A., 1997, Mechanics of meltwater movement above and within
study of depression-focused groundwater recharge in the Canadian prairies: Water Resources Research 40, W06505, doi:10.1029/2003WR002982.
Boldt-Leppin, B.E.J., and Hendry, M.J., 2003, Application of harmonic analysis of water levels to determine vertical hydraulic conductivities in clay-rich aquitards: Ground Water 41(4), 514-522.
D’Astous, A.Y., Ruland, W.W., Bruce, J.R.G., Cherry, J.A., and Gillham, R.W., 1989, Fracture effects in the shallow groundwater zone in weathered Sarnia-area clay: Canadian Geotechnical Journal: 26, 43-56.
Derby, N.E., and Knighton, R.E., 2001, Field-scale preferential transport of water and chloride tracer by depression-focused recharge: Journal of Environmental Quality 30, 194-199.
Desaulniers, D.E., Cherry, J.A., and Fritz, P., 1981, Origin, age, and movement of pore water in argillaceous Quaternary deposits at four sites in southwestern Ontario: Journal of Hydrology
frozen soil. In: Iskander, I.K., et al. (Eds.), International Symposium on Physics, Chemistry, and Ecology of Seasonally Frozen Soils, US Army Cold Regions Research and Engineering Laboratory, Faribanks, AK, pp. 31–36.
Berthold, S., Bentley, L.R., and Hayashi, M., 2004, Integrated hydrogeological and geophysical
50, 231-237. Desaulniers, D.E., Kaufmann, R.S., Cherry, J.A., and Bentley, H.W., 1986, 37Cl-35Cl variations
in a diffusion-controlled groundwater system: Geochimica Cosmochimica Acta 50, 1757-1764. Eidem, J.M., Simpkins, W.W., and Burkart, M.K., 1999, Geology, groundwater flow, and water
quality in the Walnut Creek watershed: Journal of Environmental Quality 28, 60-69. GEONET Consulting Ltd., 2000, 'Solute Transport from Earthen Manure Storages', prepared for
a Tri-Province Committee on Site Characterization - Alberta Agriculture, Food and Rural Development, Manitoba Agriculture and Food, Saskatchewan Agriculture and Food, March 28, 2000.
Grisak, G.E., and Cherry, J.A., 1975, Hydrologic characteristics and reposne of fractured till and clay confining a shallow aquifer: Canadian Geotechnical Journal 12, 23-43.
Harrington, G.A., Hendry, M.J., and Robinson, N.I., 2007, Impact of permeable conduits on solute transport in aquitards: Mathematical models and their application: Water Resources Research 43, W05441, doi:10.1029/2005WR004144. 16 pp.
255
Hendry, M.J., 1988, Ground water movement in clayey till in the prairie region: Journal of Ground Water 26(5), 607-614.
Hendry, M.J., 1983, Groundwater recharge through a heavy textured soil: Journal of Hydrology 63, 201-209.
Hendry, M.J., 1982, Hydraulic conductivity of a glacial till in Alberta: Journal of Ground Water 20, 162-169.
Hendry, M.J., 1981, Subsurface return flows under irrigated lands in the Bow River Irrigation District: Irrigation Division, Alberta Agriculture, Lethbridge, Alberta, 450 pp.
Hendry, M.J., et al., 1984, Subsurface return flows under irrigated lands in the Taber Irrigation District: Irrigation Division, Alberta Agriculture, Lethbridge, Alberta, 425 pp.
Hendry, M.J., Cherry, J.A., and Wallick, E.I., 1986, Origin and distribution of sulfate in a fractured till in southern Alberta, Canada: Water Resources Research 22(1), 45-61.
Hendry, M.J., Kelln, C.J., Wassenaar, L.I., and Shaw, J., 2004, Characterizing the hydrogeology of a complex clay-rich aquitard system using detailed vertical profiles of the stable isotopes of water: Journal of Hydrology 293, 47-56.
Hendry, M.J., and Wassenaar, L.I., 1999, Implications of transport of δD in pore waters for groundwater flow and the timing of geologic events in a thick aquitard system, Water
tills, I. Fractures, bulk permeability, and spatial variability of downward flow: Journal of Hydrology 101, 97-121.
Lissey, A., 1971, Depression-focused transient groundwater flow patterns in Manitoba: Geological Association of Canada Special Paper 9, 333–341.
McKay, L.D., Cherry, J.A., and Gillham, R.W., 1993, Field experiments in a fractured clay till 1. Hydraulic conductivity and fracture aperture: Water Resources Research 29(4), 1149-1162.
McKay, L.D., and Fredericia, J., 1995, Distribution, origin, and hydraulic influence of fractures in a clay-rich glacial deposit: Canadian Geotechnical Journal 32, 957-975.
Meyboom, P., 1967, Interior plains hydrogeological region. In: I.C. Brown (ed) Groundwater in Canada. Geol. Surv. Can. Econ. Rep. 24, pp 131-158.
Remenda, V.H., van der Kamp, G., and Cherry, J.A., 1996, Use of vertical profiles in delta18O to constrain estimates of hydraulic conductivity in a thick, unfractured till: Water Resources Research 32, 2979-2987.
256
Resources Research 35, 1751-1760. Hendry, M.J., and Wassenaar, L.I., 2000, Controls on the distribution of major ions in
porewaters of a thick surficial aquitard: Water Resources Research 36(2), 285-296. Hayashi, M., van der Kamp, G., and Schmidt, R., 2003, Focused infiltration of snowmelt water
in partially frozen soil under small depressions, Journal of Hydrology 270, 214-229. Hayashi, M., van der Kamp, G., and Rudolph, D.L., 1998, Water and solute transfer between a
prairie wetland and adjacent uplands. 1. Water balance: Journal of Hydrology 207, 42-55. Keller, C.K., van der Kamp, G., and Cherry, J.A., 1991, Hydrochemistry of a clayey till 1.
Spatial variability: Water Resources Research 27(10), 2543-2554. Keller, C.K., van der Kamp, G., and Cherry, J.A., 1988a, A multiscale study of the permeability
of a thick clayey till: Water Resources Research 25(11), 2299-2317. Keller, C.K., van der Kamp, G., and Cherry, J.A., 1988b, Hydrogeology of two Saskatchewan
Rodvang, S. J., and Simpkins, W.W., 2001, Agricultural contaminants in Quaternary aquitards: A review of occurrence and fate in North America: Hydrogeology Journal 9, 44-59.
Ruland, W.W., Cherry, J.A. and Feenstra, S., 1991, The depth of fractures and active groundwater flow in a clayey till plain in southwestern Ontario: Ground Water 29(3), 405-417.
Sharratt, B.S., 2001, Groundwater Recharge During Spring Thaw in the Prairie Pothole Region via Large, Unfrozen Preferential Pathways: Second International Symposium on Preferential Flow, American Society of Agricultural Engineers, Honolulu, HI, pp. 49–52.
Shaw, R.J., and Hendry, M.J., 1998, Hydrogeology of a thick clay till and Cretaceous clay sequence, Saskatchewan, Canada: Canadian Geotechnical Journal 35, 1041-1052.
Snow, D.T., 1968, Rock fracture spacings, openings and porosities: Proc. Amer. Soc. Civil Engineers 94, (SM 1) pp 73-79.
van der Kamp, G., 1992, Evaluating the effects of fractures on solute transport through fractured clayey aquitards: 1992 Conference of International Assoc. of Hydogeologists.
van der Kamp, G., and Hayashi, M., 1998, The groundwater recharge function of small wetlands in the semi-arid Northern Plains: Great Plains Research 8, 39-56.
Zebarth, B.J., de Jong, E., and Henry, J.L., 1989, Water flow in a hummocky landscape in central Saskatchewan, Canada: II. Saturated flow and groundwater recharge: Journal of Hydrology 110(1-1), 181-198.
257
APPENDIX E. SUBSURFACE CONTAMINATION STUDIES
E.1. Studies from Alberta
E.1.1. Materials and Methods
E.1.1.1. Long-term fate of nutrients and effect of irrigation on nutrient migration
The longest running of the Alberta studies, based out of the Lethbridge Research Centre in
Lethbridge, was initiated in 1973 and has continued for more than 35 years. The purpose of the
study is to determine the long-term effects of annual application of cattle manure on the
accumulation and movement of nutrients within the soil and to assess the environmental impacts
of these annual manure applications. The study has been conducted under irrigated and non-
irrigated conditions to determine the effect of irrigation on the transportation and loss of nutrients
[Chang and Entz, 1996; Chang and Janzen, 1996; Chang et al., 2005].
The soils at the study site consist of a medium-textured, Dark Brown Chernozemic clay loam
(Lethbridge series).
To date, the manure spread on the study plots has been one to two years old, and stored in an
unpaved open commercial feedlot prior to spreading. No bedding has been used in this feedlot,
and all of the manure for the study came from the same feedlot. The manure has been applied in
the fall after harvesting the barley crop. The application is done with a tractor-drawn manure
spreader and further distributed manually, then incorporated into the soil shortly thereafter with a
plow, rototiller and cultivator plus disc. The rates of application have been 30, 60 and 90 Mg/ha
on non-irrigated plots and 60, 120 and 180 Mg/ha on irrigated plots (based on wet weights).
These rates represent one, two, and three times the recommended application rates for the non-
irrigated and irrigated plots, respectively, for this soil type.
Figure E1 presents annual precipitation at the study area, averaging 338 mm over the course of
the study, which was less than the 80-year average of 400 mm. The annual precipitation rates
varied considerably from a high of 695 mm in 1978 to as little as 176. The average annual
temperature at the study site was 6.1°C over the study period, which was higher than the 80 year
average of 5.3°C. The (pan) evaporation averaged 1375 mm during the study, which is 15%
above the long-term average of 1201 mm (Figure E1).
258
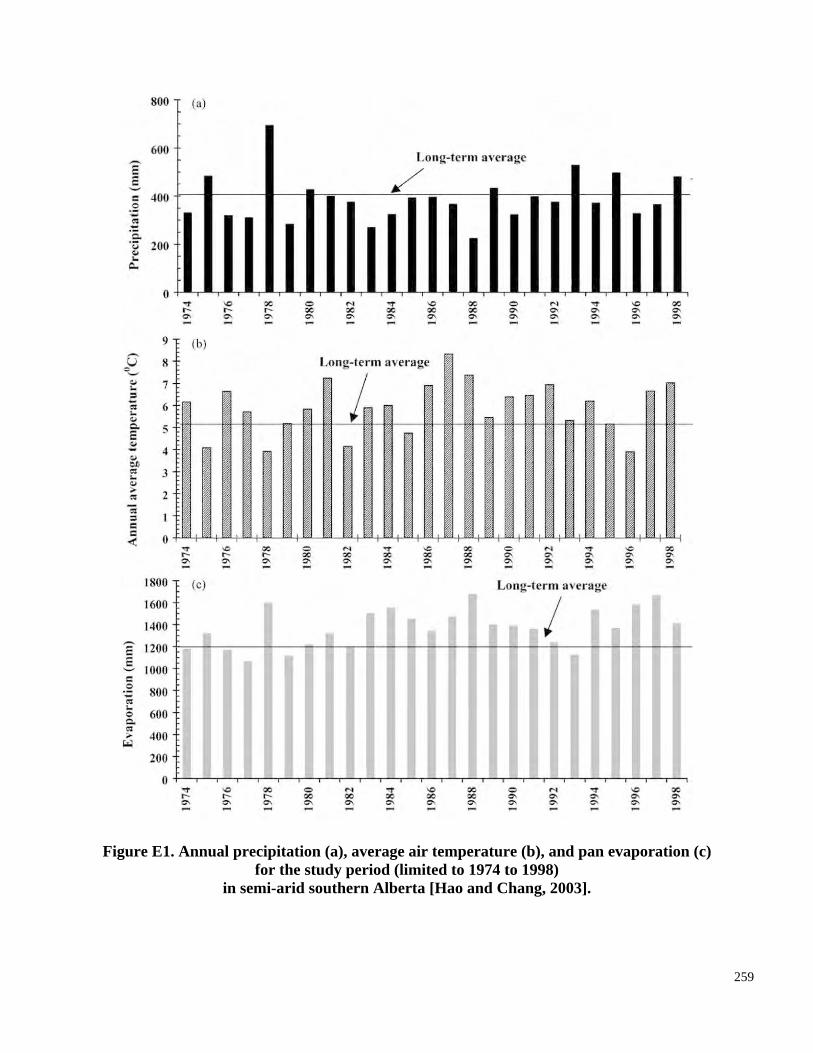
Figure E1. Annual precipitation (a), average air temperature (b), and pan evaporation (c) for the study period (limited to 1974 to 1998)
in semi-arid southern Alberta [Hao and Chang, 2003].
259
Irrigation at the study varied annually with an annual average irrigation of 160 mm and a
maximum of 432 mm and a minimum of 0 mm in 1995 [Hao et al., 2004]. Averaged over the
study period, the combined irrigation plus precipitation of 498 mm is significantly less than the
estimated evapotranspiration rate of greater than 700 mm for this area [Rodvang et al., 2004].
Data collection consisted of extracting two soil columns (1.5 m) from each plot, and dividing
them into segments (0-.15, 0.15-0.3, 0.3-0.6, 0.6-0.9, 0.9-1.2, 1.2-1.5 m). Each segment was
tested for (soluble and total) N, (soluble and total) P, and salt content.
The two soil types were located at two sites within the Lethbridge Northern Irrigation District.
Both sites were contained within the area of study of Rodvang et al. [2002], one on “coarse-
textured” material the other on “medium-textured” soil. The soils at both sites were
predominantly Orthic Dark Brown Chernozemic soils [Olson et al., 1998]. The coarse-textured
soil was formed from coarse-loamy and fine-loamy fluvial material, and the medium-textured
soil was formed from fine-loamy to fine-silty lacustrine material. Both sites were fairly level
with gentle slopes of 2 to 9% and 0.5 to 2.5% at the coarse- and medium-textured sites,
E.1.1.2. Effect of soil texture and permeability on nutrient migration
This study was conducted between 1993 and 2001 to determine the effects of manure application
and commercial (N) fertilizer application on soil and groundwater quality on two different soil
types in southern Alberta under irrigated conditions.
respectively.
The manure application was similar to that presented in Chang and Entz [1996]. Rates of annual
manure application, conducted in the fall after harvest of the barley crop, were 20, 40, 60, and
120 Mg/ha on irrigated sub-plots. The manure was obtained from a local cattle feedlot, and had
an average moisture content of 48.8% in a range of 21.5 to 74.6%. The manure was applied with
a rear-delivery manure spreader and immediately incorporated with discs after application.
Rates of irrigation were established after determining soil moisture from neutron probe
measurements (1994 and 1995) and soil samples (1996 onward), and varied greatly from a low
of about 60 mm in 1995 (a relatively wet year) to greater than 400 mm in 2001. The average
260
groundwater under the agricultural areas in the drainage basin.
annual irrigation was 266 mm at the coarse-textured site and 212 mm at the medium-textured
site.
The long-term average annual precipitation for the area was 387 mm, and over the course of the
study was 375 mm. The annual precipitation ranged from 494 mm in 1995 (corresponding with
the 60 mm irrigation) to 176 mm in 2001 (corresponding with the > 400 mm irrigation).
The average depth to the water table at the coarse-textured site was 2.1 m below the soil surface
and ranged from 1.5 m in August 1999 to 2.7 m in March 1996. The average depth to the water
groundwater sampling on a monthly basis during the growing season.
E.1.1.3. Impact of nutrients on regional groundwaters
In a study conducted from 1995 to 2001, Rodvang et al. [2004] provide the first documentation
of significant long-term changes in regional groundwater quality as a result of manure
application to fields. The study site, termed the Battersea Drainage Basin, is located 25 km north
of Lethbridge, in the Northern Lethbridge Irrigation District. This area contains the greatest
concentration of livestock in Alberta. The objective of the study was to determine whether
groundwater quality within the Battersea Drainage Basin was impacted by manure application
table at the medium-textured site was 2.5 m below the soil surface and ranged from 0.6 m in July
2001 to 4.3 m in May 1997.
Data collection consisted of collecting and analyzing soil samples at six incremental depths to a
total of 1.5 m annually just after the harvest and before the application of manure, as well as
and to investigate the spatial and temporal variations in the nitrate and chloride content of the
The land in the study area was predominantly planted to irrigated forages and cereal grains. As
this study was conducted over a large area, controlled manure application was applied to only
selected sites. The application rates across the majority of the study area were unknown.
Included in this 33,000 ha irrigation district were sixty-three livestock operations consisting of
184,000 beef cattle, 2,160 dairy cattle, 304,300 broiler chickens, 1,150 sheep, 1,900 feeder hogs
and 5,640 farrow/finnish hogs. Following the recommended land-base requirements for nitrogen,
261
these livestock would require 23,322 of the 33,000 ha in the irrigation district for land
application of the resulting manure.
The average annual precipitation in this area was 400 mm/yr, with a potential evapotranspiration
rate of 760 mm/yr. The rates of irrigation in this area generally ranged from 300 to 450 mm/yr,
thus significantly reducing the annual moisture deficit.
The local geology of the study area consists of 45 to 70 m of a dense, sandy-clay loam to clay
textured of glacial till. The till is overlain by up to 15 m of homogeneous glaciolacustrine plastic
silty clay in areas of lower elevation, and by coarse- to fine-grained glaciolacustrine and fluvial
sands in the eastern part of the study area. In this study, the term coarse-textured soil referred to
all coarse- and medium-textured glaciolacustrine and fluvial deposits, and fine-textured soil
referred to all glacial till and fine-textured lacustrine sediments.
The water table over the study area was located at depths less than 3.5 m below ground surface.
Water table levels were 0.7 to 1.3 m higher in May and June. The coarse-textured materials
constituted an unconfined aquifer. The hydraulic conductivity of the coarse sediments was 500
times greater than the shallow fine-textured lacustrine sediments and 104 times greater than the
shallow till.
E.2. Studies from elsewhere in North America
The studies reviewed were conducted in different states with a variety of soil types. Thus, the
studies are presented individually in this literature review; synthesized results are presented in
Chapter 8.
E.2.1. Long-term Fate of N
E.2.1.1. Kimble et al. (1972)
This study characterized the movement and loss of N in selected plots. This study was conducted
at a site in Vermont on Panton clay (Typic Ochraqualfs) starting in 1965. For six years, plots
received annual treatments of both commercial N based fertilizer (NH4NO3) and manure at rates
of 0 kg/ha NH4NO3 plus 66 Mg/ha manure (0-66), 224 kg/ha NH4NO3 plus 0 Mg/ha manure
(224-0), and 224 kg/ha of NH4NO3 plus 66 Mg/ha (244-66); an untreated control plot (0-0) was
also included.
262
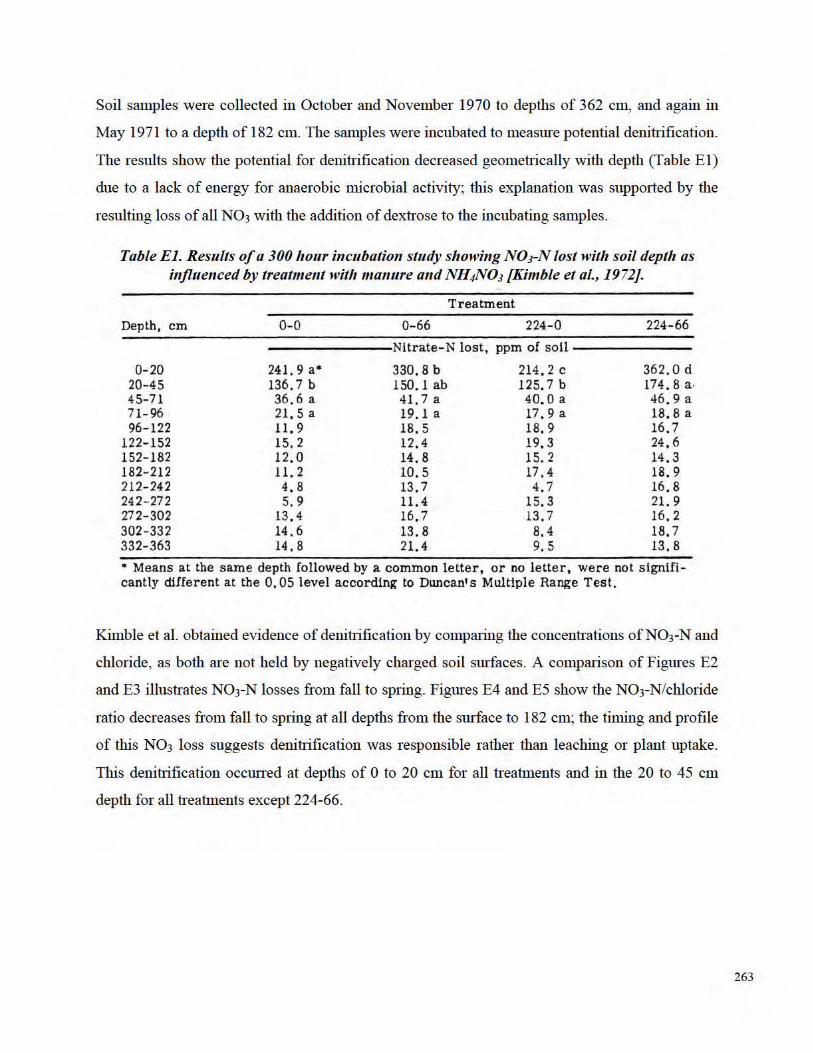
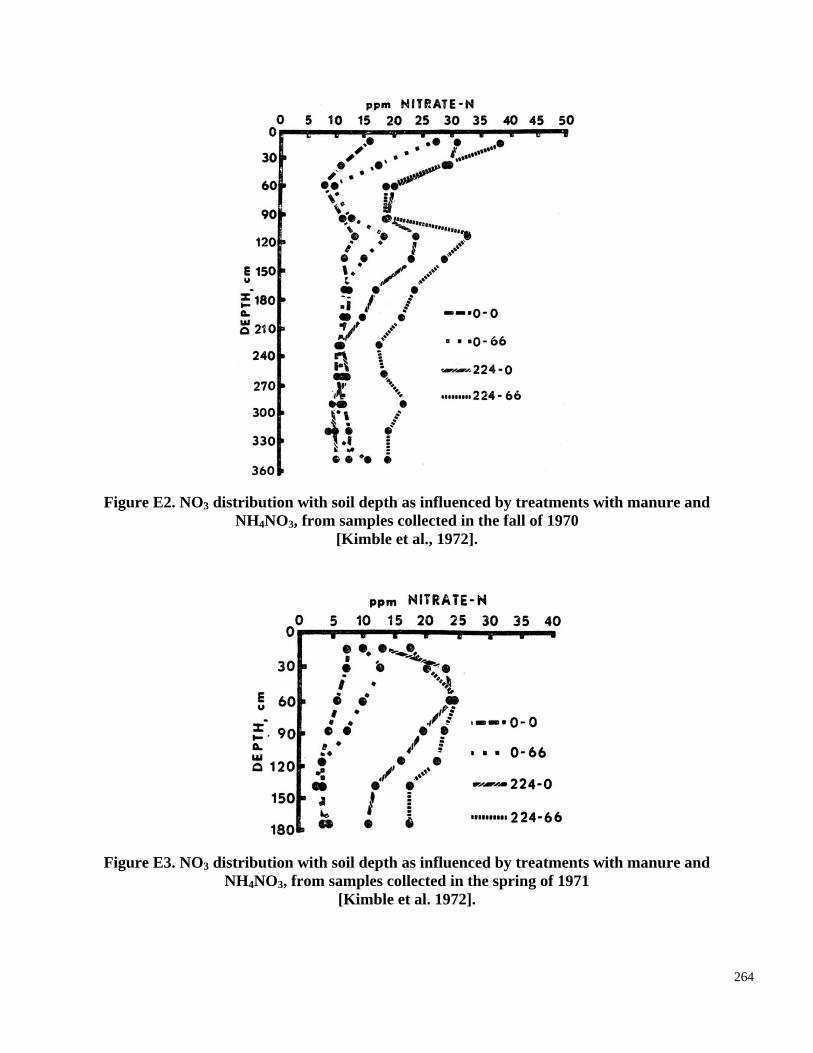
Figure E2. NO3 distribution with soil depth as influenced by treatments with manure and
[Kimble et al., 1972]. NH4NO3, from samples collected in the fall of 1970
Figure E3. NO3 distribution with soil depth as influenced by treatments with manure and NH4NO3, from samples collected in the spring of 1971
[Kimble et al. 1972].
264
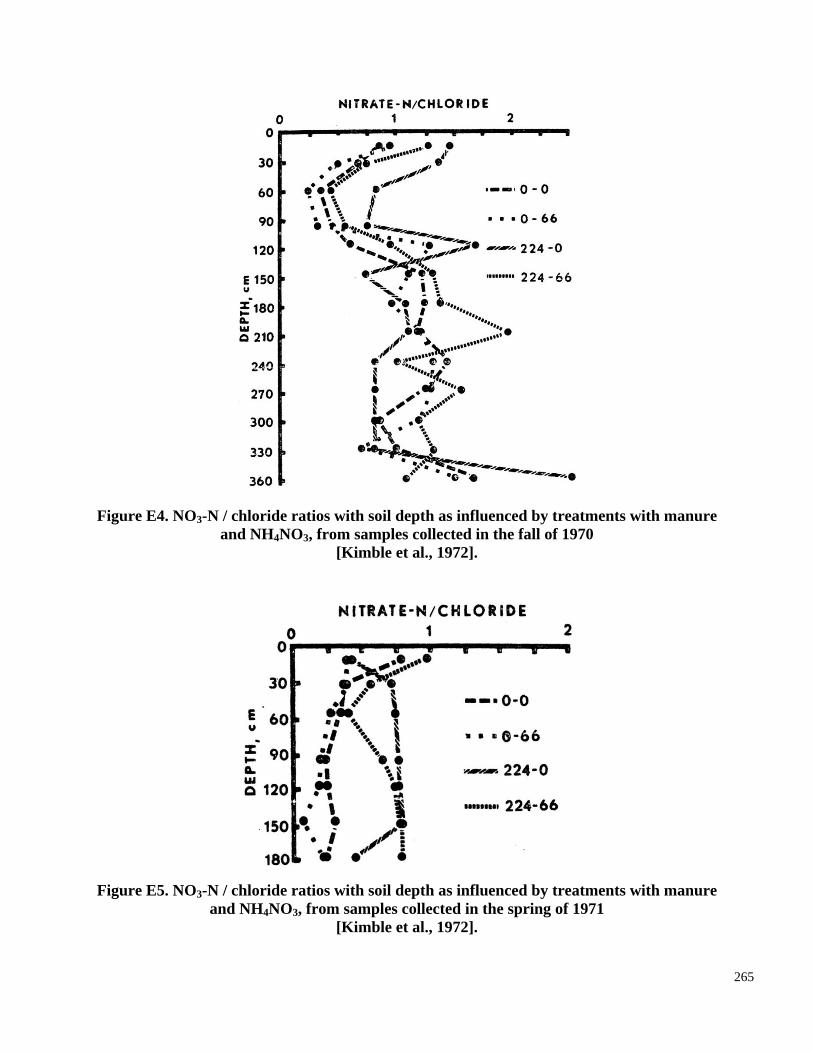
Figure E4. NO3-N / chloride ratios with soil depth as influenced by treatments with manure and NH4NO3, from samples collected in the fall of 1970
[Kimble et al., 1972].
Figure E5. NO3-N / chloride ratios with soil depth as influenced by treatments with manure and NH4NO3, from samples collected in the spring of 1971
[Kimble et al., 1972].
265
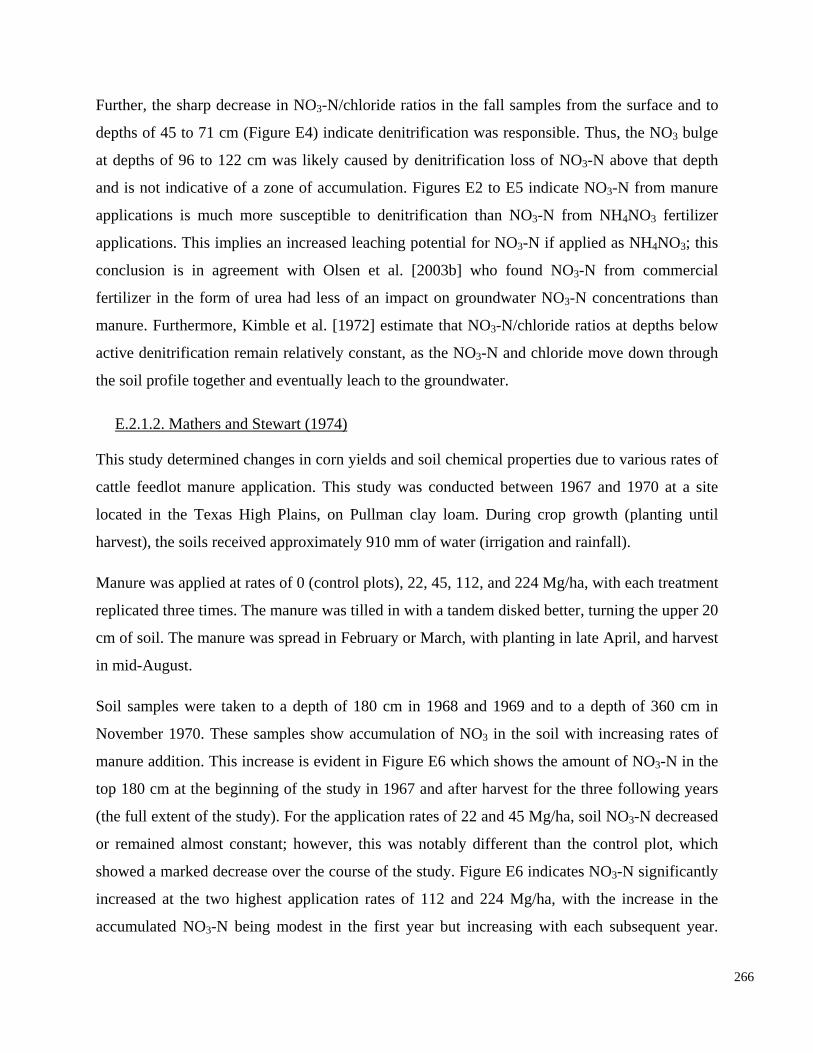
Further, the sharp decrease in NO3-N/chloride ratios in the fall samples from the surface and to
depths of 45 to 71 cm (Figure E4) indicate denitrification was responsible. Thus, the NO3 bulge
at depths of 96 to 122 cm was likely caused by denitrification loss of NO3-N above that depth
and is not indicative of a zone of accumulation. Figures E2 to E5 indicate NO3-N from manure
applications is much more susceptible to denitrification than NO3-N from NH4NO3 fertilizer
applications. This implies an increased leaching potential for NO3-N if applied as NH4NO3; this
conclusion is in agreement with Olsen et al. [2003b] who found NO3-N from commercial
fertilizer in the form of urea had less of an impact on groundwater NO
This study determined changes in corn yields and soil chemical properties due to various rates of
cattle feedlot manure application. This study was conducted between 1967 and 1970 at a site
located in the Texas High Plains, on Pullman clay loam. During crop growth (planting until
harvest), the soils received approximately 910 mm of water (irrigation and rainfall).
Manure was applied at rates of 0 (control plots), 22, 45, 112, and 224 Mg/ha, with each treatment
replicated three times. The manure was tilled in with a tandem disked better, turning the upper 20
cm of soil. The manure was spread in February or March, with planting in late April, and harvest
3-N concentrations than
manure. Furthermore, Kimble et al. [1972] estimate that NO3-N/chloride ratios at depths below
active denitrification remain relatively constant, as the NO3-N and chloride move down through
the soil profile together and eventually leach to the groundwater.
E.2.1.2. Mathers and Stewart (1974)
in mid-August.
Soil samples were taken to a depth of 180 cm in 1968 and 1969 and to a depth of 360 cm in
November 1970. These samples show accumulation of NO3 in the soil with increasing rates of
manure addition. This increase is evident in Figure E6 which shows the amount of NO3-N in the
top 180 cm at the beginning of the study in 1967 and after harvest for the three following years
(the full extent of the study). For the application rates of 22 and 45 Mg/ha, soil NO3-N decreased
or remained almost constant; however, this was notably different than the control plot, which
showed a marked decrease over the course of the study. Figure E6 indicates NO3-N significantly
increased at the two highest application rates of 112 and 224 Mg/ha, with the increase in the
accumulated NO3-N being modest in the first year but increasing with each subsequent year.
266
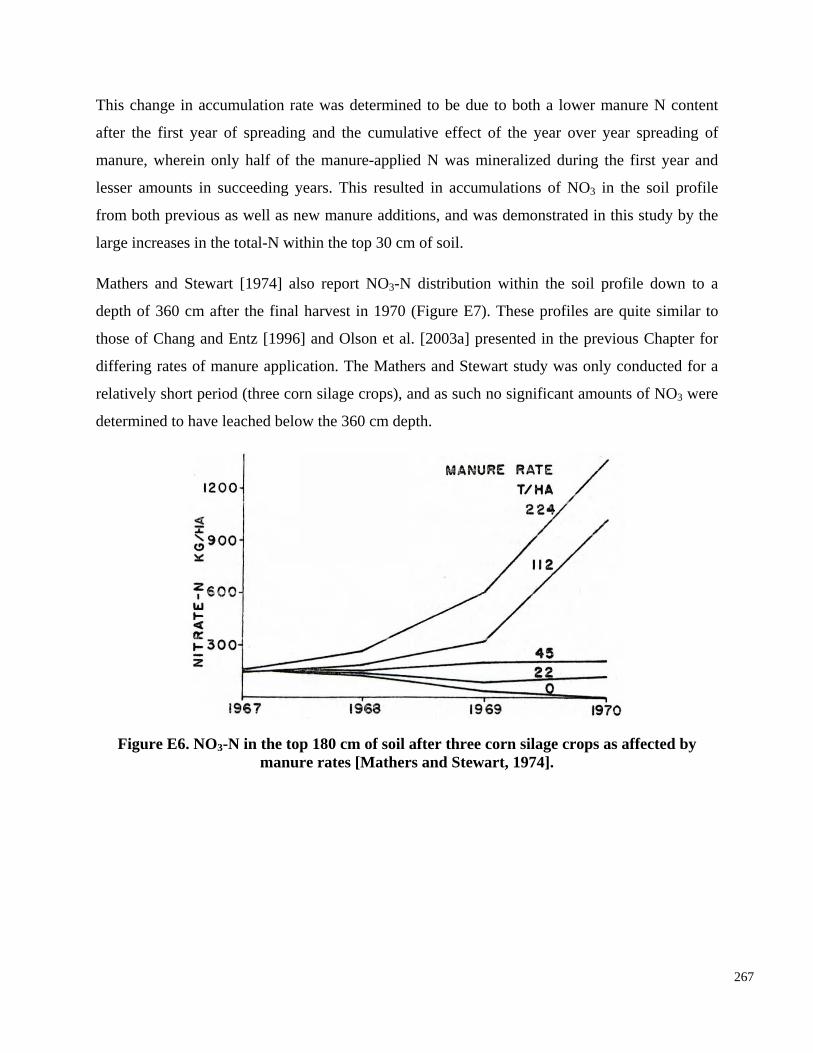
depth of 360 cm after the final harvest in 1970 (Figure E7). These profiles are quite similar to
those of Chang and Entz [1996] and Olson et al. [2003a] presented in the previous Chapter for
differing rates of manure application. The Mathers and Stewart study was only conducted for a
relatively short period (three corn silage crops), and as such no significant amounts of NO3 were
determined to have leached below the 360 cm depth.
Figure E6. NO3-N in the top 180 cm of soil after three corn silage crops as affected by manure rates [Mathers and Stewart, 1974].
This change in accumulation rate was determined to be due to both a lower manure N content
after the first year of spreading and the cumulative effect of the year over year spreading of
manure, wherein only half of the manure-applied N was mineralized during the first year and
lesser amounts in succeeding years. This resulted in accumulations of NO3 in the soil profile
from both previous as well as new manure additions, and was demonstrated in this study by the
large increases in the total-N within the top 30 cm of soil.
Mathers and Stewart [1974] also report NO3-N distribution within the soil profile down to a
267
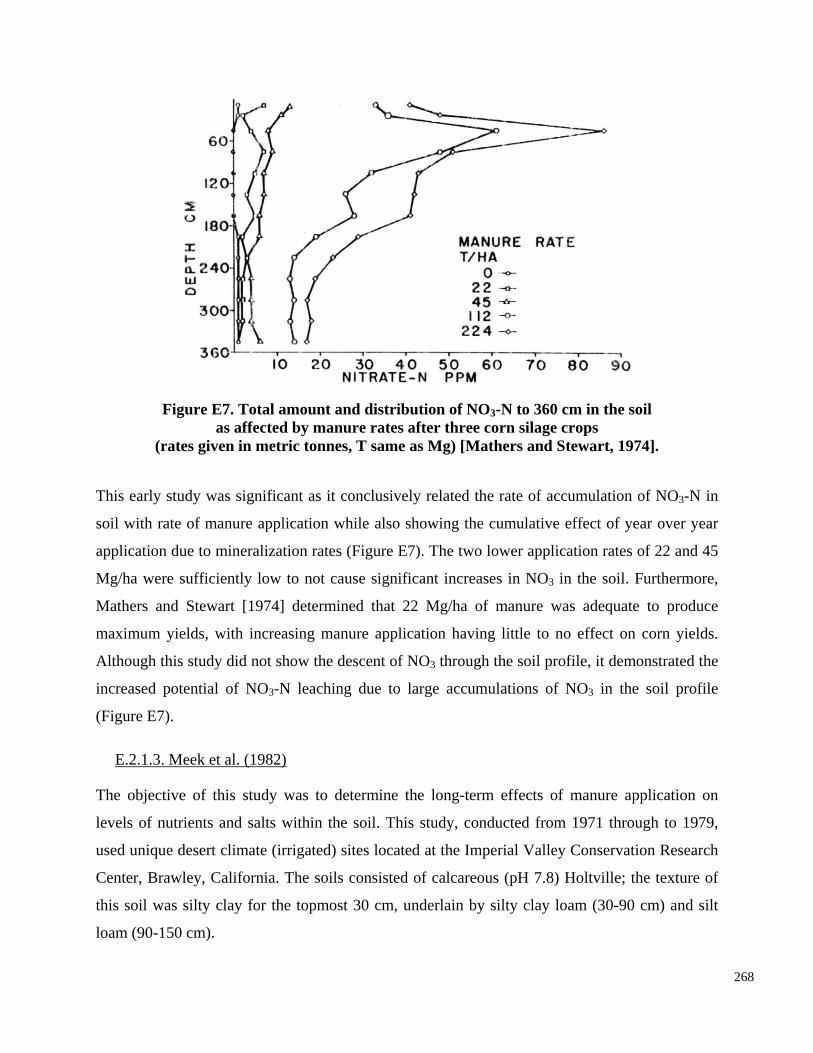
The objective of this study was to determine the long-term effects of manure application on
levels of nutrients and salts within the soil. This study, conducted from 1971 through to 1979,
used unique desert climate (irrigated) sites located at the Imperial Valley Conservation Research
Center, Brawley, California. The soils consisted of calcareous (pH 7.8) Holtville; the texture of
this soil was silty clay for the topmost 30 cm, underlain by silty clay loam (30-90 cm) and silt
loam (90-150 cm).
268
Figure E7. Total amount and distribution of NO3-N to 360 cm in the soil as affected by manure rates after three corn silage crops
(rates given in metric tonnes, T same as Mg) [Mathers and Stewart, 1974].
This early study was significant as it conclusively related the rate of accumulation of NO3-N in
soil with rate of manure application while also showing the cumulative effect of year over year
application due to mineralization rates (Figure E7). The two lower application rates of 22 and 45
Mg/ha were sufficiently low to not cause significant increases in NO3 in the soil. Furthermore,
Mathers and Stewart [1974] determined that 22 Mg/ha of manure was adequate to produce
maximum yields, with increasing manure application having little to no effect on corn yields.
Although this study did not show the descent of NO3 through the soil profile, it demonstrated the
increased potential of NO3-N leaching due to large accumulations of NO3 in the soil profile
(Figure E7).
E.2.1.3. Meek et al. (1982)
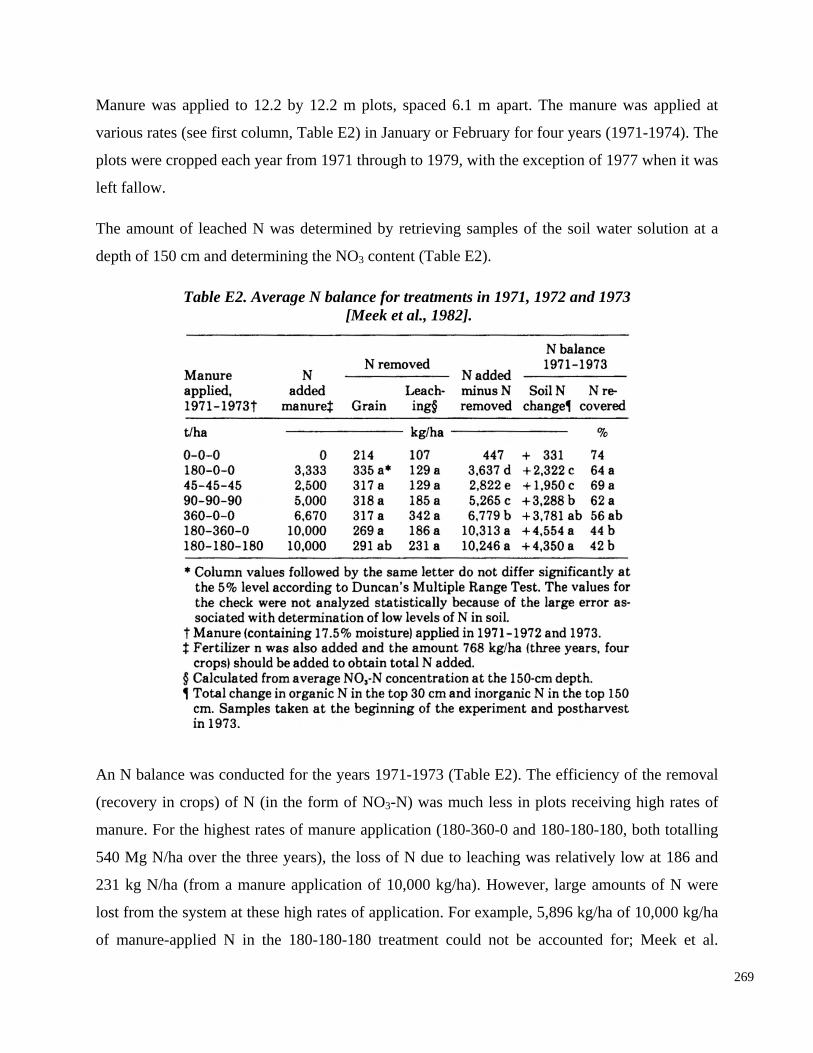
Manure was applied to 12.2 by 12.2 m plots, spaced 6.1 m apart. The manure was applied at
various rates (see first column, Table E2) in January or February for four years (1971-1974). The
plots were cropped each year from 1971 through to 1979, with the exception of 1977 when it was
left fallow.
The amount of leached N was determined by retrieving samples of the soil water solution at a
depth of 150 cm and determining the NO3 content (Table E2).
Table E2. Average N balance for treatments in 1971, 1972 and 1973 [Meek et al., 1982].
An N balance was conducted for the years 1971-1973 (Table E2). The efficiency of the removal
(recovery in crops) of N (in the form of NO3-N) was much less in plots receiving high rates of
manure. For the highest rates of manure application (180-360-0 and 180-180-180, both totalling
540 Mg N/ha over the three years), the loss of N due to leaching was relatively low at 186 and
231 kg N/ha (from a manure application of 10,000 kg/ha). However, large amounts of N were
lost from the system at these high rates of application. For example, 5,896 kg/ha of 10,000 kg/ha
of manure-applied N in the 180-180-180 treatment could not be accounted for; Meek et al.
269
[1982] attribute this loss to volatilization. N mineralization rates were also calculated for this
study, showing 51% of N was available for crop uptake in the first year, and 5% every year
thereafter.
E.2.1.4. Liebhardt et al. (1979)
The objective of this study was to determine the effect of various rates of poultry manure
application on NO3 and NH4 concentrations in the water table. This study was conducted
between 1972 and 1975 in Sussex County, Delaware, where the most concentrated broiler
Plots of 0.402 ha (63.4 x 63.4 m) received 0 (control), 13, 27, 54 and 179 Mg/ha of poultry
manure, corresponding to N application rates of 0, 325, 675, 1,350 and 4,475 kg/ha.
Groundwater samples were taken monthly from wells on each plot to determine concentrations
of NO3-N and NH4-N. Soil samples were also taken in July 1975 and 1976 at 0.3 m increments
from the surface down to the water table.
Table E3 presents the concentration of NO3-N in water samples taken from wells 3.0, 4.5, and
6.0 m deep from plots receiving differing amounts of poultry manure. These data show
concentrations of NO3-N at 3.0 m depth (usually just below the water table) were clearly affected
chicken industry of the time was found in the United States. The soils consisted of Eveboro
loamy sand with some inclusions (5-105) of Elkton sandy loam, clayey, mixed mesic Typic
Orchraquult. The land was planted each year with corn. The water table at the site ranged from 2
to 3 m in depth.
by the amount of poultry manure applied to the surface, with the concentration increasing with
manure application rates. While concentrations at 3.0 m depth from wells in control plots
(receiving no manure) ranged from 1 to 15 ppm, concentrations of up to 65 to 174 ppm were
recorded in plots receiving the highest rate of manure application (179 Mg/ha). In deeper wells
(4.5 and 6.0 m), effects of poultry manure application were also clear, being most notable at the
highest manure application rate.
270
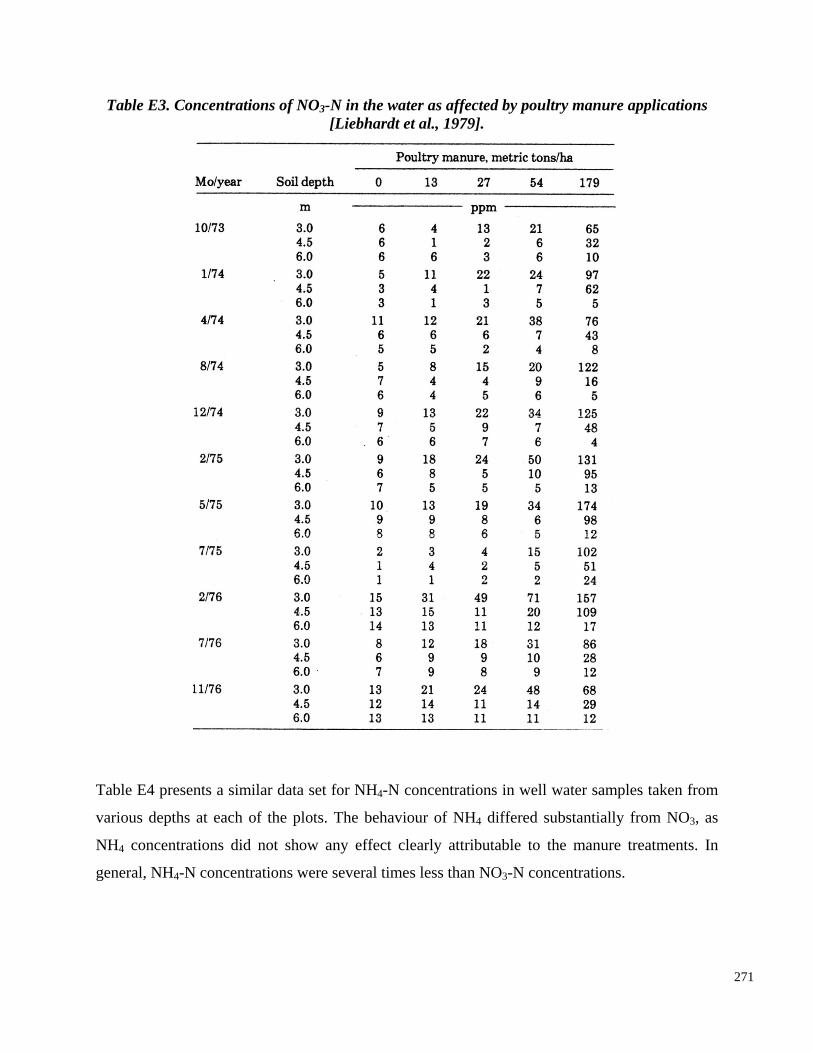
Table E3. Concentrations of NO3-N in the water as affected by poultry manure applications [Liebhardt et al., 1979].
Table E4 presents a similar data set for NH4-N concentrations in well water samples taken from
various depths at each of the plots. The behaviour of NH4 differed substantially from NO3, as
NH4 concentrations did not show any effect clearly attributable to the manure treatments. In
general, NH4-N concentrations were several times less than NO3-N concentrations.
271
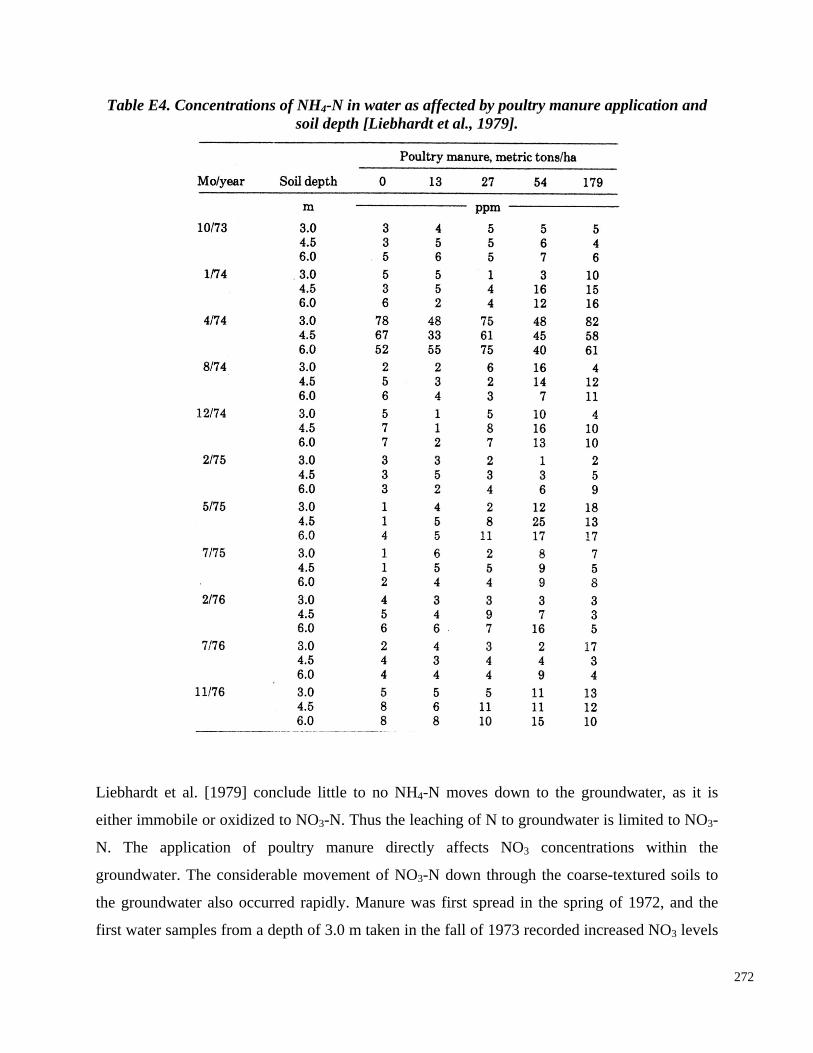
Table E4. Concentrations of NH4-N in water as affected by poultry manure application and soil depth [Liebhardt et al., 1979].
Liebhardt et al. [1979] conclude little to no NH4-N moves down to the groundwater, as it is
either immobile or oxidized to NO3-N. Thus the leaching of N to groundwater is limited to NO3
N. The application of poultry manure directly affects NO3 concentrations within the
groundwater. The considerable movement of NO3-N down through the coarse-textured soils to
the groundwater also occurred rapidly. Manure was first spread in the spring of 1972, and the
first water samples from a depth of 3.0 m taken in the fall of 1973 recorded increased NO3 levels
272
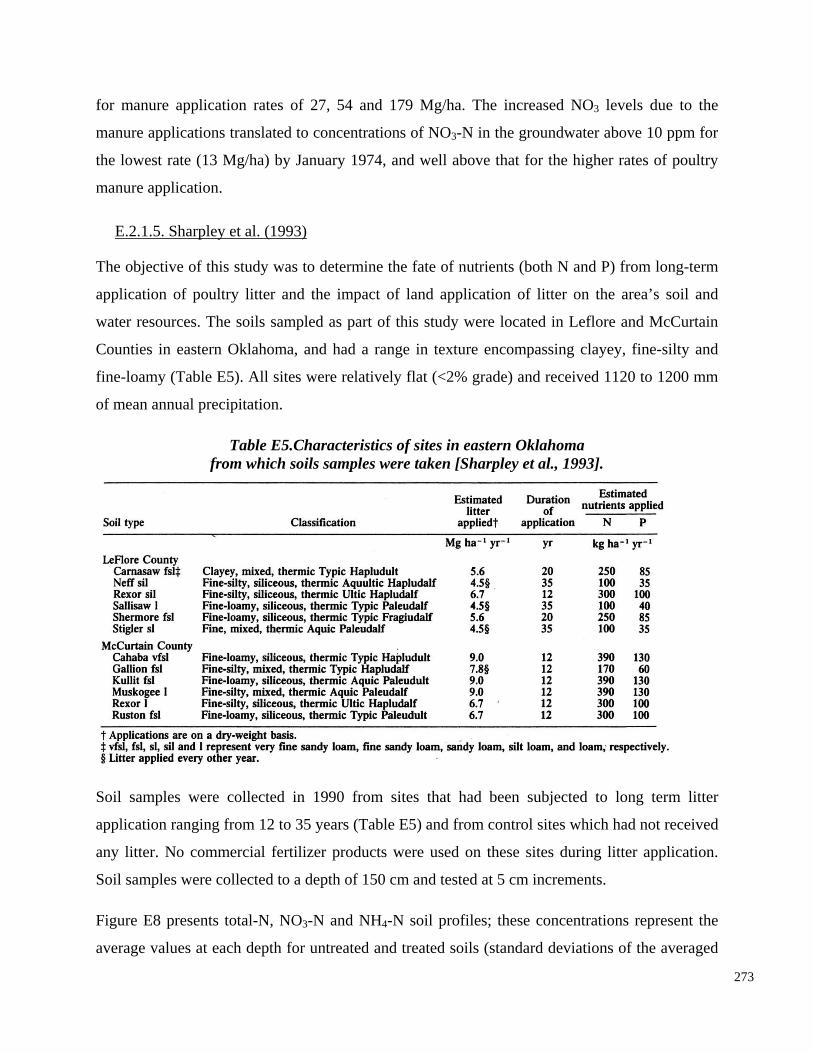
for manure application rates of 27, 54 and 179 Mg/ha. The increased NO3 levels due to the
manure applications translated to concentrations of NO3-N in the groundwater above 10 ppm for
the lowest rate (13 Mg/ha) by January 1974, and well above that for the higher rates of poultry
manure application.
E.2.1.5. Sharpley et al. (1993)
The objective of this study was to determine the fate of nutrients (both N and P) from long-term
application of poultry litter and the impact of land application of litter on the area’s soil and
water resources. The soils sampled as part of this study were located in Leflore and McCurtain
Counties in eastern Oklahoma, and had a range in texture encompassing clayey, fine-silty and
fine-loamy (Table E5). All sites were relatively flat (<2% grade) and received 1120 to 1200 mm
of mean annual precipitation.
Table E5.Characteristics of sites in eastern Oklahoma from which soils samples were taken [Sharpley et al., 1993].
Soil samples were collected in 1990 from sites that had been subjected to long term litter
application ranging from 12 to 35 years (Table E5) and from control sites which had not received
any litter. No commercial fertilizer products were used on these sites during litter application.
Soil samples were collected to a depth of 150 cm and tested at 5 cm increments.
Figure E8 presents total-N, NO3-N and NH4-N soil profiles; these concentrations represent the
average values at each depth for untreated and treated soils (standard deviations of the averaged
273
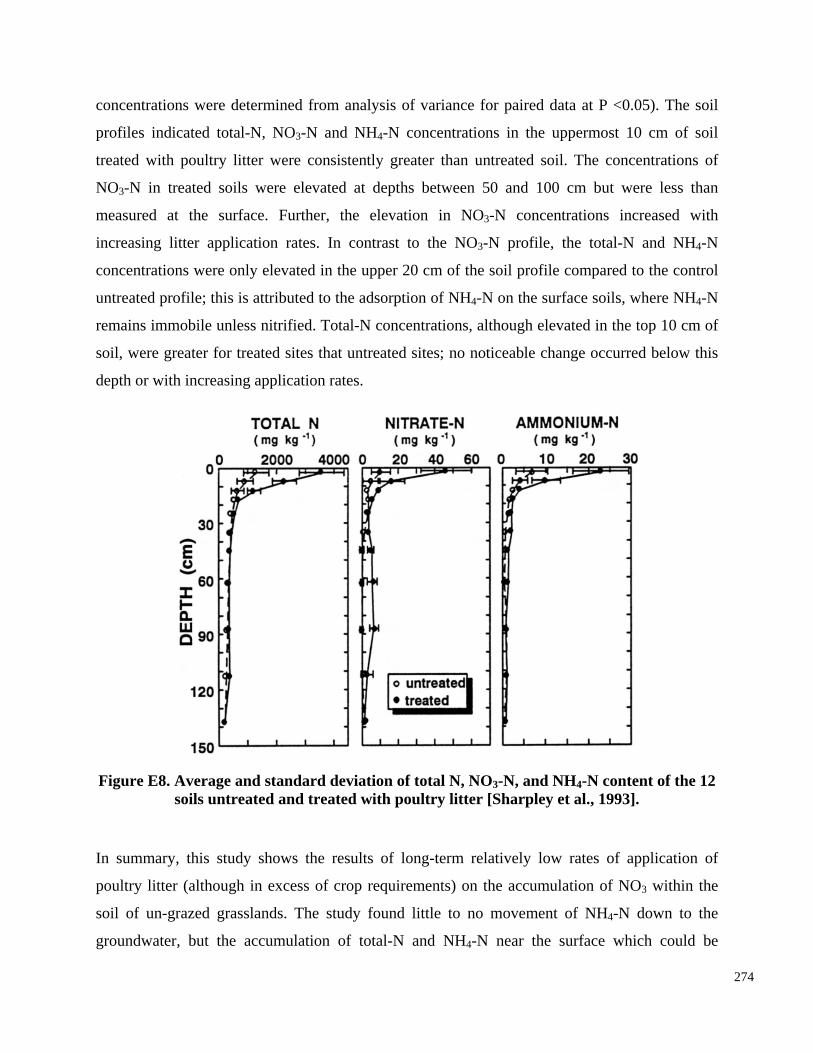
concentrations were determined from analysis of variance for paired data at P <0.05). The soil
profiles indicated total-N, NO3-N and NH4-N concentrations in the uppermost 10 cm of soil
treated with poultry litter were consistently greater than untreated soil. The concentrations of
NO3-N in treated soils were elevated at depths between 50 and 100 cm but were less than
measured at the surface. Further, the elevation in NO3-N concentrations increased with
increasing litter application rates. In contrast to the NO3-N profile, the total-N and NH4-N
concentrations were only elevated in the upper 20 cm of the soil profile compared to the control
untreated profile; this is attributed to the adsorption of NH4-N on the surface soils, where NH4-N
remains immobile unless nitrified. Total-N concentrations, although elevated in the top 10 cm of
soil, were greater for treated sites that untreated sites; no noticeable change occurred below this
depth or with increasing application rates.
Figure E8. Average and standard deviation of total N, NO3-N, and NH4-N content of the 12 soils untreated and treated with poultry litter [Sharpley et al., 1993].
In summary, this study shows the results of long-term relatively low rates of application of
poultry litter (although in excess of crop requirements) on the accumulation of NO3 within the
soil of un-grazed grasslands. The study found little to no movement of NH4-N down to the
groundwater, but the accumulation of total-N and NH4-N near the surface which could be
274
mineralized and subject to nitrification, resulting in increased though steady rates of NO3
leaching through the soil.
E.2.1.6. Basso and Ritchie (2005)
Basso and Ritchie [2005] quantified the effect of animal manure, compost and inorganic N on
crop productivity and NO3 leaching under field conditions in a maize-alfalfa rotation using
lysimeters. This study was conducted from January 1994 to December 1999 at the Kellogg
Biological Station of Michigan State University in southwest Michigan. The soils consisted of
FAO Luvisols or Alfisols (Kalamazoo fine-loamy, mixed mesic Typic Hapludalfs soil with a
high clay content). The crops consisted of three years each of maize and alfalfa. The lysimeters
Table E6 presents the annual precipitation for the six year study period, which varied from a
minimum of 560 mm in 1996 to a maximum of 780 mm in 1995 (mean value of 678 mm). No
reference was found re the use of irrigation to supplement the precipitation.
Table E6. Annual precipitation (mm) for the period 1994-1999 [Basso and Ritchie, 2005].
were installed to preserve an intact soil column within them, to provide as accurate as possible a
measure of the movement of the water and NO3-N through the soil column. The lysimeters
enclosed a 150 cm diameter by 210 cm deep soil column.
Four treatments were applied to the lysimeters: a control (no N added), manure, compost, and
inorganic fertilizer (urea). Each fertilizer treatment was applied to supply 120 kg of total N/ha
per year; this required annual applications of 260 kg/ha of urea, 30 Mg/ha of compost and 18
Mg/ha of manure.
275
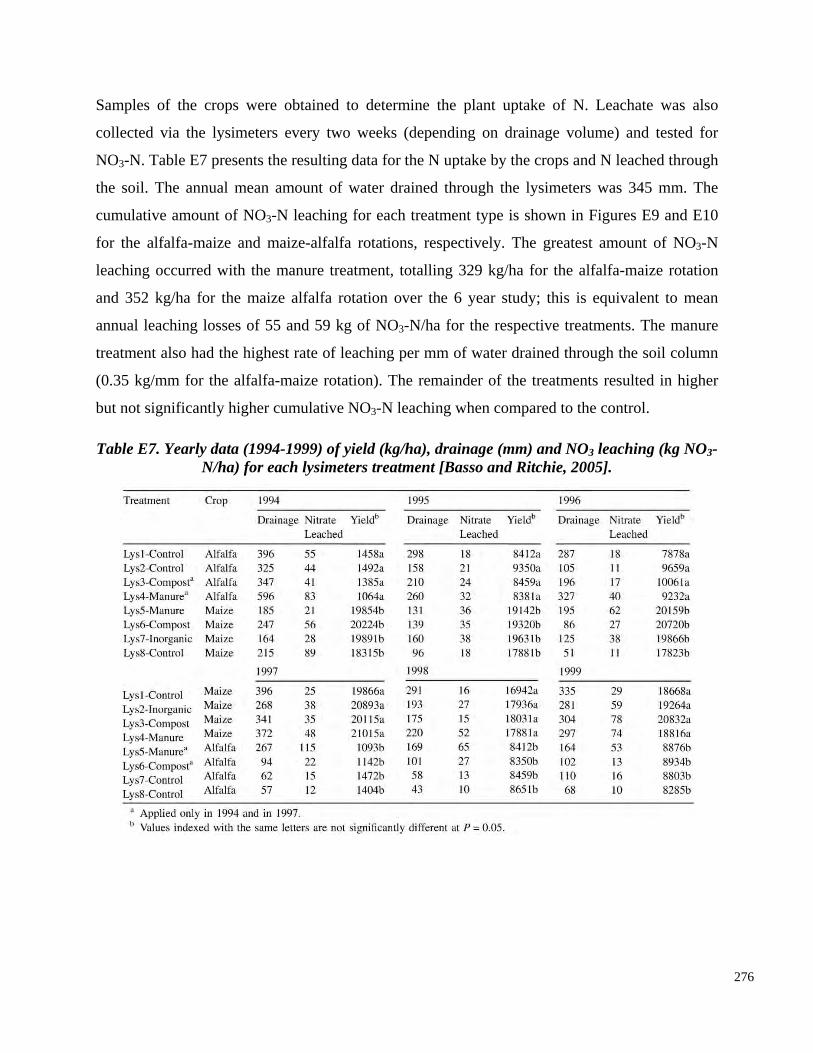
Samples of the crops were obtained to determine the plant uptake of N. Leachate was also
collected via the lysimeters every two weeks (depending on drainage volume) and tested for
NO3-N. Table E7 presents the resulting data for the N uptake by the crops and N leached through
the soil. The annual mean amount of water drained through the lysimeters was 345 mm. The
cumulative amount of NO3-N leaching for each treatment type is shown in Figures E9 and E10
for the alfalfa-maize and maize-alfalfa rotations, respectively. The greatest amount of NO3-N
leaching occurred with the manure treatment, totalling 329 kg/ha for the alfalfa-maize rotation
and 352 kg/ha for the maize alfalfa rotation over the 6 year study; this is equivalent to mean
annual leaching losses of 55 and 59 kg of NO3-N/ha for the respective treatments. The manure
treatment also had the highest rate of leaching per mm of water drained through the soil column
(0.35 kg/mm for the alfalfa-maize rotation). The remainder of the treatments resulted in higher
but not significantly higher cumulative NO3-N leaching when compared to the control.
Table E7. Yearly data (1994-1999) of yield (kg/ha), drainage (mm) and NO3 leaching (kg NO3-N/ha) for each lysimeters treatment [Basso and Ritchie, 2005].
276
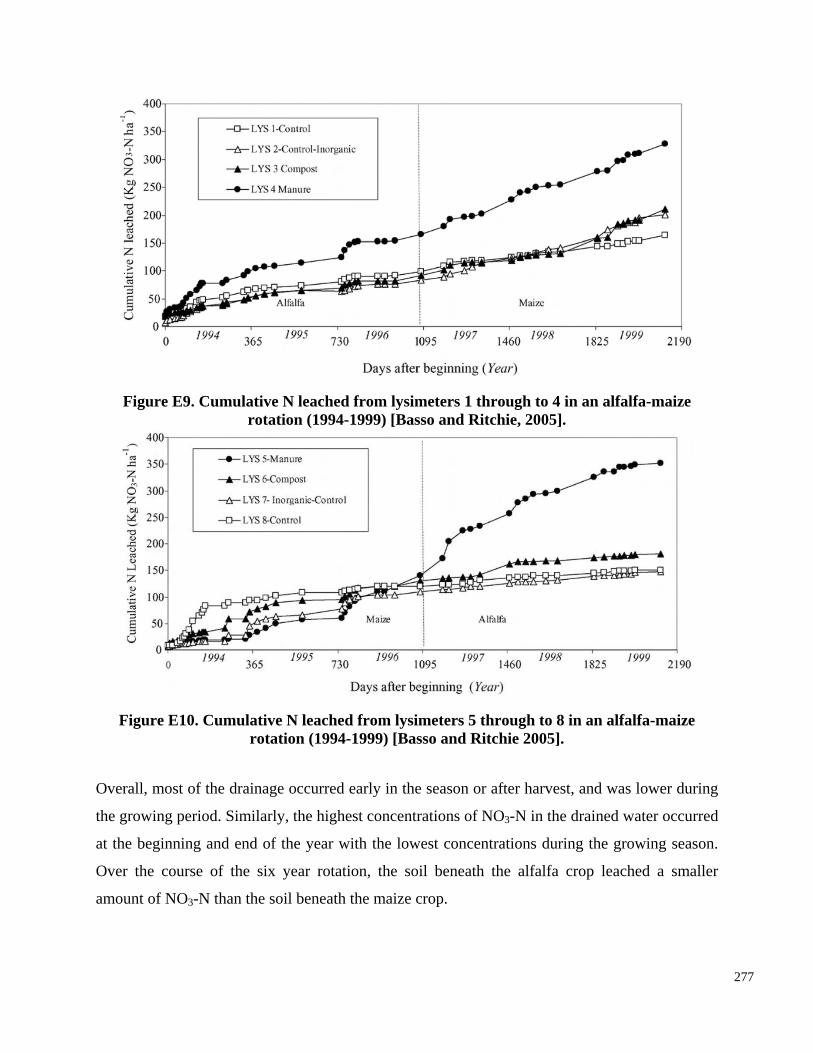
Figure E9. Cumulative N leached from lysimeters 1 through to 4 in an alfalfa-maize rotation (1994-1999) [Basso and Ritchie, 2005].
Figure E10. Cumulative N leached from lysimeters 5 through to 8 in an alfalfa-maize rotation (1994-1999) [Basso and Ritchie 2005].
Overall, most of the drainage occurred early in the season or after harvest, and was lower during
the growing period. Similarly, the highest concentrations of NO3-N in the drained water occurred
at the beginning and end of the year with the lowest concentrations during the growing season.
Over the course of the six year rotation, the soil beneath the alfalfa crop leached a smaller
amount of NO3-N than the soil beneath the maize crop.
277
major changes in feed rations and manure handling methods.
E.2.2. Long-term Fate of P
The studies included in this section demonstrate the long-term fate of the P from spread manure
within the soil profile. The results presented here correlate strongly with those presented in
Chapter 7. P is for the most part immobile within the upper layers of the soil profile. Penetration
of P deeper within the soil profile is possible with long-term over-application (saturation) of P,
coarse grained soils with lower sorption capacity, and via preferential flow in macropores.
E.2.2.1. Eghball et al. (1996)
The objective of this study was to determine the extent of P movement in a coarse-textured soil
feedlot manure and commercial fertilizers. The soil consists of a Tripp very fine sandy loam
(coarse-silty, mixed mesic Typic Haplustolls); the soil was alkaline between 0.3 and 0.7 m
depths and accumulated calcium carbonate between depths of 0.75 and 1.1 m. Irrigation was
applied depending on crop water needs.
The site was subject to continuous corn production with no application of fertilizer or manure
from 1912 through to 1941. In 1942 the site was split, with the two halves receiving 0 and 27
Mg/ha of cattle feedlot manure, respectively. In 1953, both the manure and non-manure plots
were each split into six, with each sub-plot receiving either 0, 45, 90, 135, 180 kg N/ha or 135 kg
N/ha plus 80 kg P/ha. The manure used at the site was broadcast and disked in each year in the
receiving long-term manure or N and P fertilizers. This study was conducted in 1993 but used a
site in western Nebraska near Mitchell which had been used since 1912 for the continuous study
of cropping systems, and since 1953 for the study of the effects of annual applications of cattle
spring before planting. All manure for the last 25 years has come from the same feedlot with no
Soil samples were taken in the spring of 1993 from all plots to a depth of 1.8 m. Samples were
divided into seven increments and tested for plant available P using the sodium bicarbonate
method (sodium bicarbonate P) (Figure E11).
278
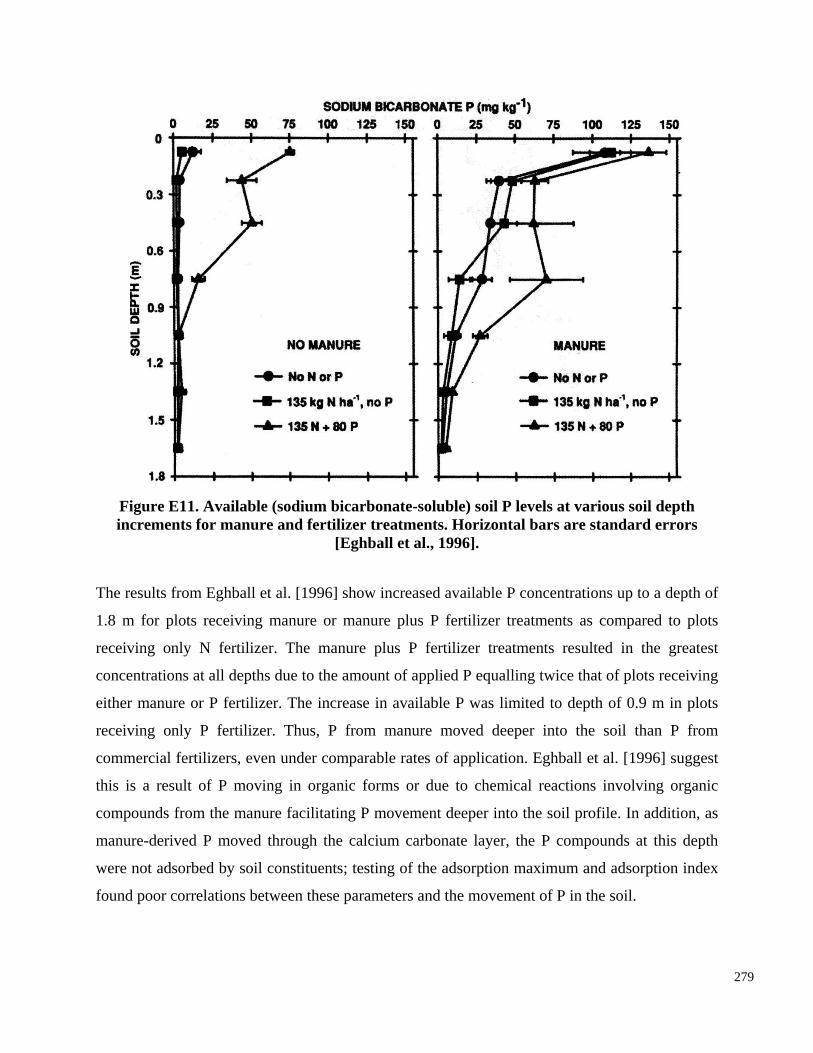
either manure or P fertilizer. The increase in available P was limited to depth of 0.9 m in plots
receiving only P fertilizer. Thus, P from manure moved deeper into the soil than P from
commercial fertilizers, even under comparable rates of application. Eghball et al. [1996] suggest
this is a result of P moving in organic forms or due to chemical reactions involving organic
compounds from the manure facilitating P movement deeper into the soil profile. In addition, as
manure-derived P moved through the calcium carbonate layer, the P compounds at this depth
were not adsorbed by soil constituents; testing of the adsorption maximum and adsorption index
found poor correlations between these parameters and the movement of P in the soil.
279
Figure E11. Available (sodium bicarbonate-soluble) soil P levels at various soil depth increments for manure and fertilizer treatments. Horizontal bars are standard errors
[Eghball et al., 1996].
The results from Eghball et al. [1996] show increased available P concentrations up to a depth of
1.8 m for plots receiving manure or manure plus P fertilizer treatments as compared to plots
receiving only N fertilizer. The manure plus P fertilizer treatments resulted in the greatest
concentrations at all depths due to the amount of applied P equalling twice that of plots receiving
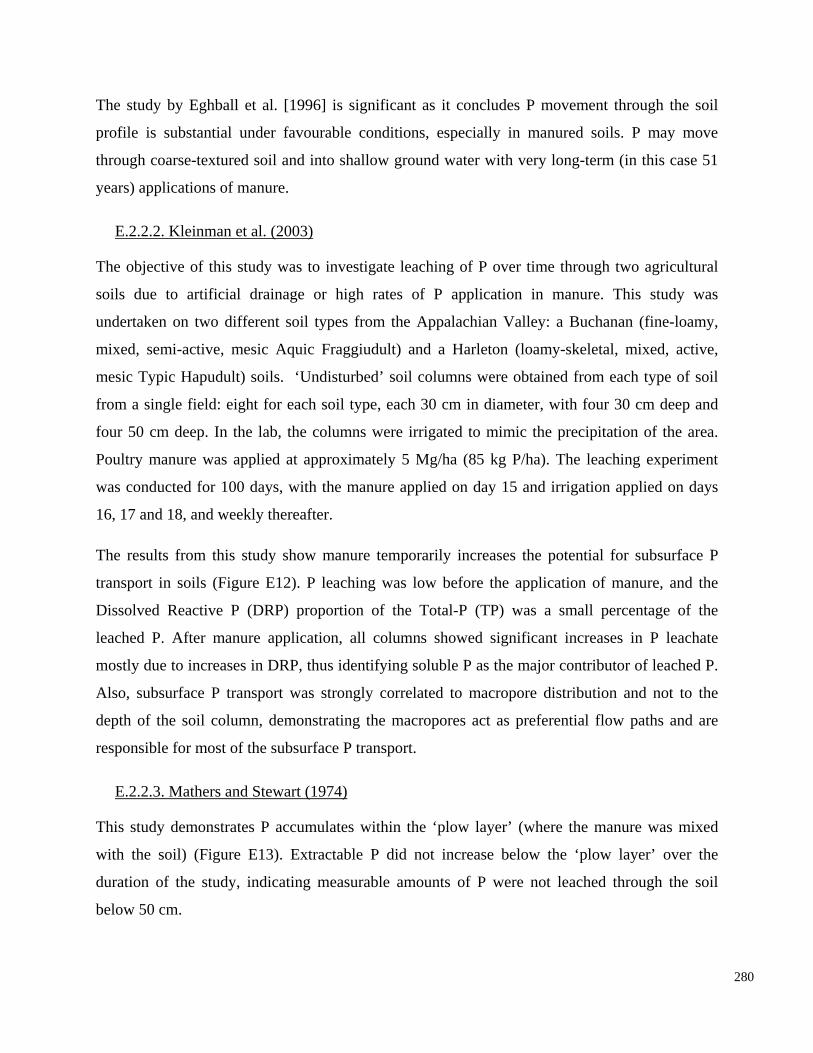
The study by Eghball et al. [1996] is significant as it concludes P movement through the soil
profile is substantial under favourable conditions, especially in manured soils. P may move
through coarse-textured soil and into shallow ground water with very long-term (in this case 51
years) applications of manure.
E.2.2.2. Kleinman et al. (2003)
The objective of this study was to investigate leaching of P over time through two agricultural
soils due to artificial drainage or high rates of P application in manure. This study was
Poultry manure was applied at approximately 5 Mg/ha (85 kg P/ha). The leaching experiment
was conducted for 100 days, with the manure applied on day 15 and irrigation applied on days
16, 17 and 18, and weekly thereafter.
The results from this study show manure temporarily increases the potential for subsurface P
transport in soils (Figure E12). P leaching was low before the application of manure, and the
Dissolved Reactive P (DRP) proportion of the Total-P (TP) was a small percentage of the
leached P. After manure application, all columns showed significant increases in P leachate
mostly due to increases in DRP, thus identifying soluble P as the major contributor of leached P.
undertaken on two different soil types from the Appalachian Valley: a Buchanan (fine-loamy,
mixed, semi-active, mesic Aquic Fraggiudult) and a Harleton (loamy-skeletal, mixed, active,
mesic Typic Hapudult) soils. ‘Undisturbed’ soil columns were obtained from each type of soil
from a single field: eight for each soil type, each 30 cm in diameter, with four 30 cm deep and
four 50 cm deep. In the lab, the columns were irrigated to mimic the precipitation of the area.
Also, subsurface P transport was strongly correlated to macropore distribution and not to the
depth of the soil column, demonstrating the macropores act as preferential flow paths and are
responsible for most of the subsurface P transport.
E.2.2.3. Mathers and Stewart (1974)
This study demonstrates P accumulates within the ‘plow layer’ (where the manure was mixed
with the soil) (Figure E13). Extractable P did not increase below the ‘plow layer’ over the
duration of the study, indicating measurable amounts of P were not leached through the soil
below 50 cm.
280
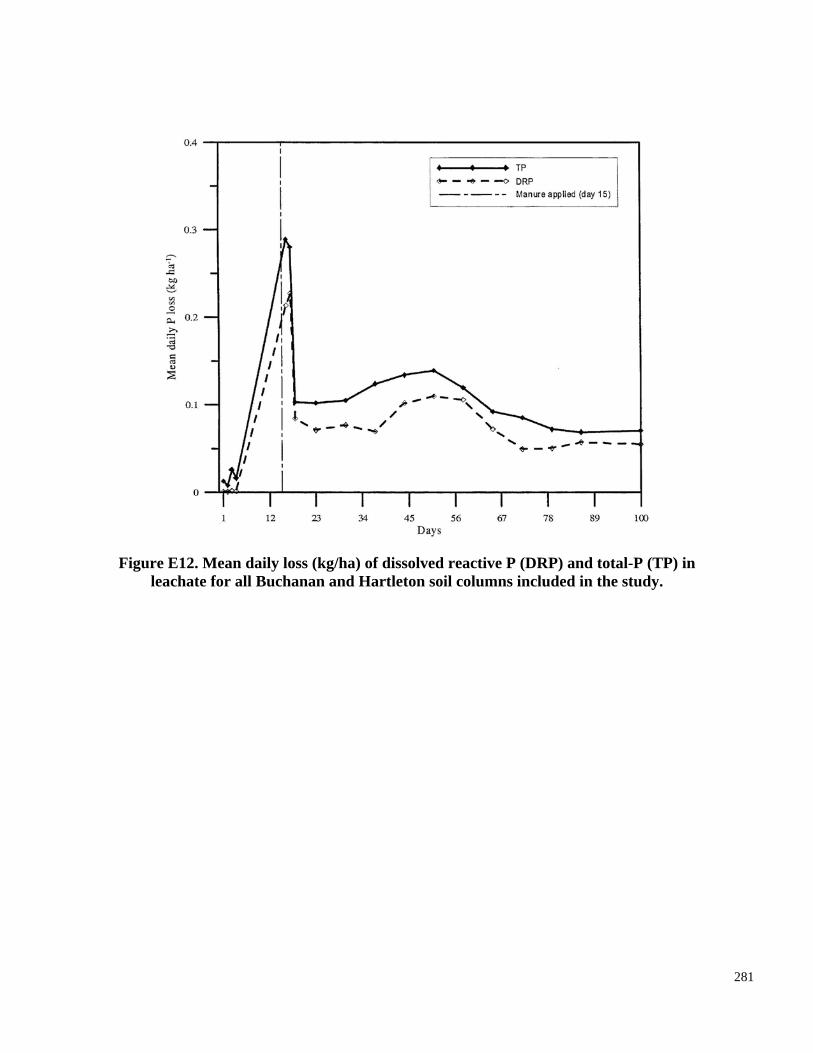
Figure E12. Mean daily loss (kg/ha) of dissolved reactive P (DRP) and total-P (TP) in leachate for all Buchanan and Hartleton soil columns included in the study.
281
Figure E13. Sodium bicarbonate extractable P after three corn silage crops as affected by
E.2.2.4. Meek et al. (1982)
manure rates [Mathers and Stewart, 1974].
180-180, which both total 540 Mg/ha for three years). NAHCO3-extractable P amounts in the 60
to 90 cm depth in soils treated with manure were the same as the control. This indicates a deeper
penetration of soluble P (to 30 to 60 cm depths) for high rates of manure application but no
further leaching within the three years of the study. Meek et al. [1982] approximated cumulative
total-P for the lowest manure application rate would have been 1,366 kg/ha, of which only 280
kg/ha would have been removed in the harvested crops.
282
This study identified large variability in NAHCO3-extractable P in samples from the upper 30 cm
of the soil (Table E8). Treatments receiving manure only in 1971 (180-0-0-0) had more than
double the NAHCO3-extractable P in 1979 compared to a control; higher applications of manure
yielded more than five times the NAHCO3-extractable P in the 0 to 30 cm depth (Table E8). In
the 30 to 60 cm range, the corresponding NAHCO3-extractable P increase was only 25% for the
180-0-0-0 treatment, and just over double for the highest application rates (180-360-0 and 180-
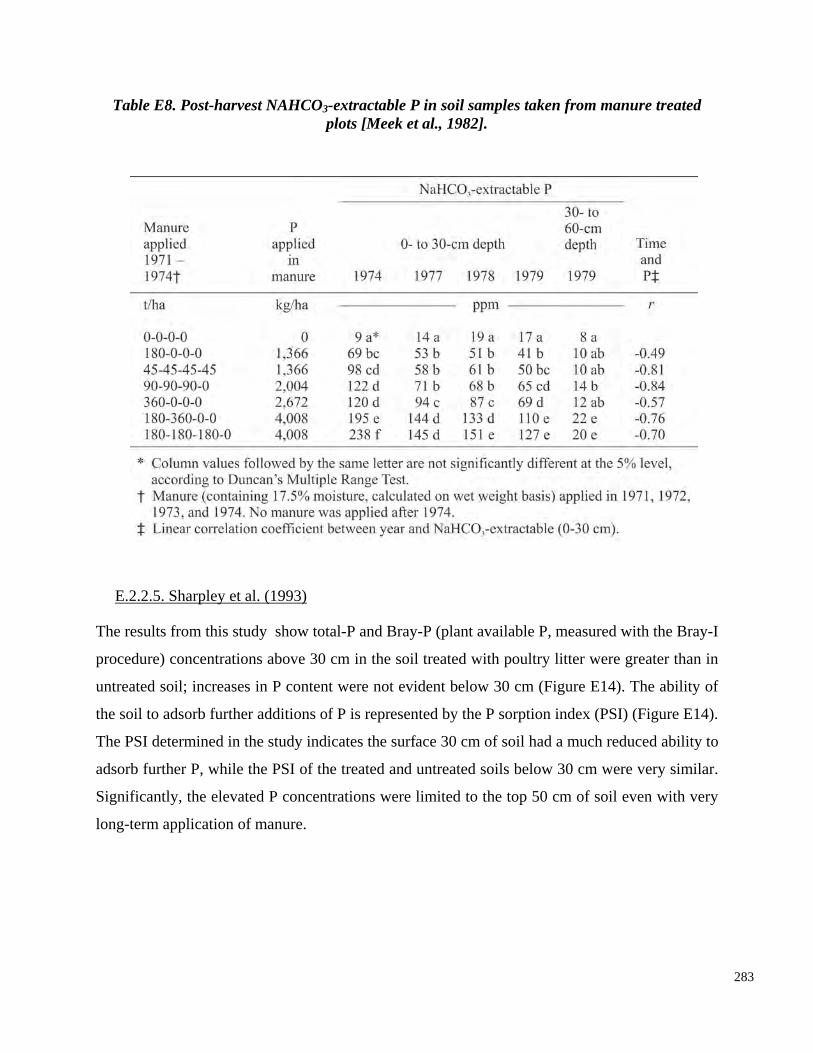
Table E8. Post-harvest NAHCO3-extractable P in soil samples taken from manure treated plots [Meek et al., 1982].
E.2.2.5. Sharpley et al. (1993)
The results from this study show total-P and Bray-P (plan
procedure) concentrations above 30 cm in the soil treated
untreated soil; increases in P content were not evident be
the soil to adsorb further additions of P is represented by t
The PSI determined in the study indicates the surface 30 c
adsorb further P, while the PSI of the treated and untreate
Significantly, the elevated P concentrations were limited
long-term application of manure.
t available P, measu
with poultry litter w
low 30 cm (Figure
he P sorption index
m of soil had a muc
d soils below 30 cm
to the top 50 cm of
red with the Bray-I
ere greater than in
E14). The ability of
(PSI) (Figure E14).
h reduced ability to
were very similar.
soil even with very
283
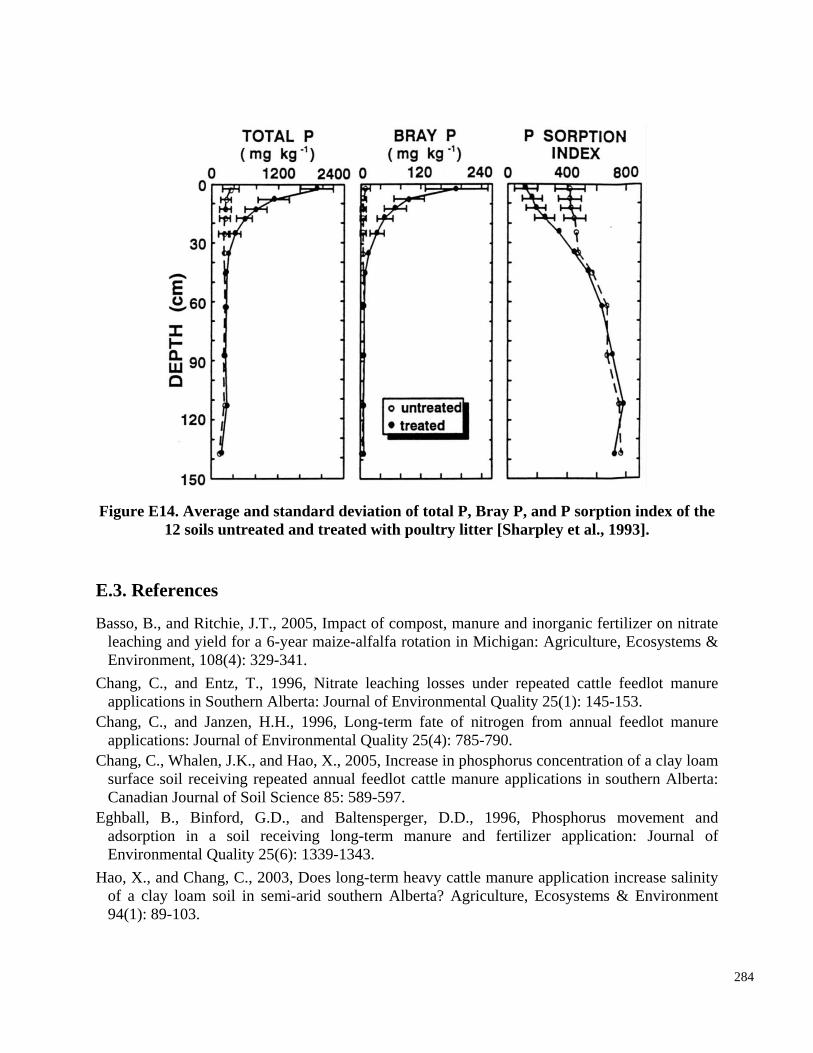
Figure E14. Average and standard deviation of total P, Bray P, and P sorption index of the 12 soils untreated and treated with poultry litter [Sharpley et al., 1993].
E.3. References
Basso, B., and Ritchie, J.T., 2005, Impact of compost, manure and inorganic fertilizer on nitrate leaching and yield for a 6-year maize-alfalfa rotation in Michigan: Agriculture, Ecosystems & Environment, 108(4): 329-341.
Chang, C., and Entz, T., 1996, Nitrate leaching losses under repeated cattle feedlot manure applications in Southern Alberta: Journal of Environmental Quality 25(1): 145-153.
Chang, C., and Janzen, H.H., 1996, Long-term fate of nitrogen from annual feedlot manure applications: Journal of Environmental Quality 25(4): 785-790.
Chang, C., Whalen, J.K., and Hao, X., 2005, Increase in phosphorus concentration of a clay loam surface soil receiving repeated annual feedlot cattle manure applications in southern Alberta: Canadian Journal of Soil Science 85: 589-597.
Eghball, B., Binford, G.D., and Baltensperger, D.D., 1996, Phosphorus movement and adsorption in a soil receiving long-term manure and fertilizer application: Journal of Environmental Quality 25(6): 1339-1343.
Hao, X., and Chang, C., 2003, Does long-term heavy cattle manure application increase salinity of a clay loam soil in semi-arid southern Alberta? Agriculture, Ecosystems & Environment 94(1): 89-103.
284
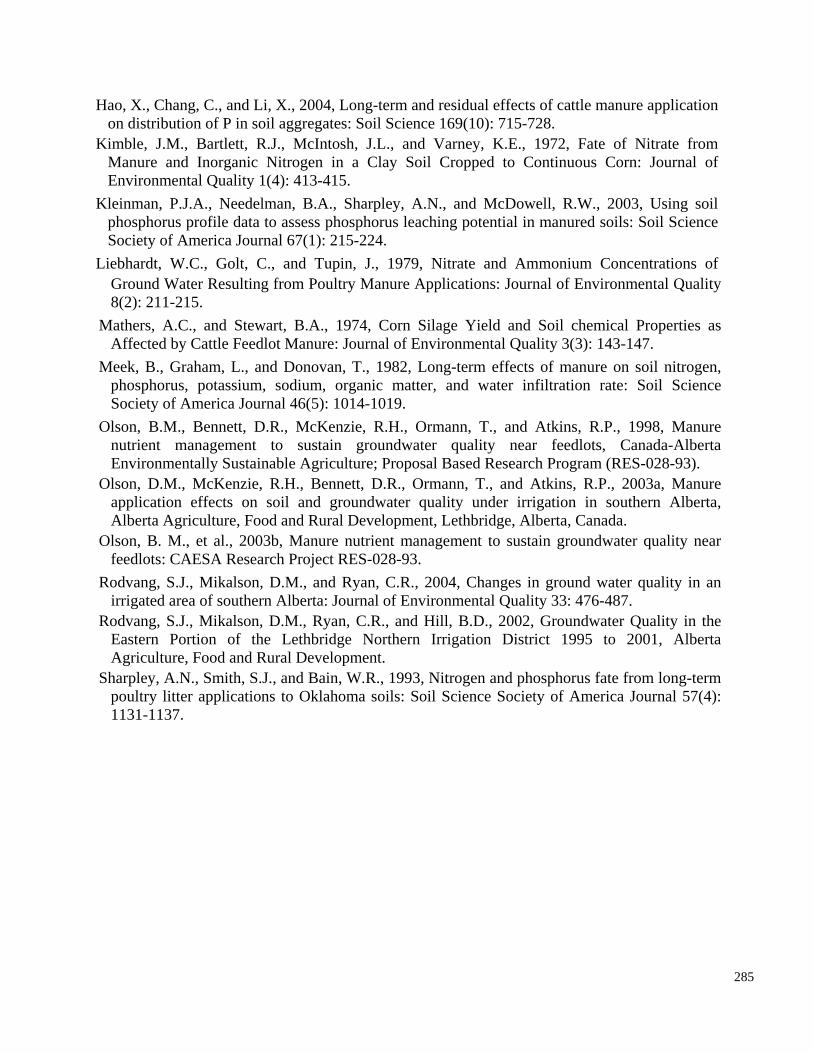
Hao, X., Chang, C., and Li, X., 2004, Long-term and residual effects of cattle manure application on distribution of P in soil aggregates: Soil Science 169(10): 715-728.
Kimble, J.M., Bartlett, R.J., McIntosh, J.L., and Varney, K.E., 1972, Fate of Nitrate from Manure and Inorganic Nitrogen in a Clay Soil Cropped to Continuous Corn: Journal of Environmental Quality 1(4): 413-415.
Kleinman, P.J.A., Needelman, B.A., Sharpley, A.N., and McDowell, R.W., 2003, Using soil phosphorus profile data to assess phosphorus leaching potential in manured soils: Soil Science Society of America Journal 67(1): 215-224.
Liebhardt, W.C., Golt, C., and Tupin, J., 1979, Nitrate and Ammonium Concentrations of
285
Ground Water Resulting from Poultry Manure Applications: Journal of Environmental Quality 8(2): 211-215.
Mathers, A.C., and Stewart, B.A., 1974, Corn Silage Yield and Soil chemical Properties as Affected by Cattle Feedlot Manure: Journal of Environmental Quality 3(3): 143-147.
Meek, B., Graham, L., and Donovan, T., 1982, Long-term effects of manure on soil nitrogen, phosphorus, potassium, sodium, organic matter, and water infiltration rate: Soil Science Society of America Journal 46(5): 1014-1019.
Olson, B.M., Bennett, D.R., McKenzie, R.H., Ormann, T., and Atkins, R.P., 1998, Manure nutrient management to sustain groundwater quality near feedlots, Canada-Alberta Environmentally Sustainable Agriculture; Proposal Based Research Program (RES-028-93).
Olson, D.M., McKenzie, R.H., Bennett, D.R., Ormann, T., and Atkins, R.P., 2003a, Manure application effects on soil and groundwater quality under irrigation in southern Alberta, Alberta Agriculture, Food and Rural Development, Lethbridge, Alberta, Canada.
Olson, B. M., et al., 2003b, Manure nutrient management to sustain groundwater quality near feedlots: CAESA Research Project RES-028-93.
Rodvang, S.J., Mikalson, D.M., and Ryan, C.R., 2004, Changes in ground water quality in an irrigated area of southern Alberta: Journal of Environmental Quality 33: 476-487.
Rodvang, S.J., Mikalson, D.M., Ryan, C.R., and Hill, B.D., 2002, Groundwater Quality in the Eastern Portion of the Lethbridge Northern Irrigation District 1995 to 2001, Alberta Agriculture, Food and Rural Development.
Sharpley, A.N., Smith, S.J., and Bain, W.R., 1993, Nitrogen and phosphorus fate from long-term poultry litter applications to Oklahoma soils: Soil Science Society of America Journal 57(4): 1131-1137.