Embed Size (px)
Citation preview

Journal of the Royal Society INTERFACE 8, 117-126 (2011)
1
Modelling the relationship between environmental factors, transcriptional genes anddeoxynivalenol mycotoxin production by strains of two Fusarium species
Schmidt-Heydt, M., Parra, R*., Geisen, R. & Magan, N.
Applied Mycology Group, Cranfield Health, Cranfield University, Bedford MK43 0AL, U.K.and Max-Rubner Institute, Karlsruhe, Germany
Corresponding author: Prof. N. Magan, Applied Mycology Group, Cranfield Health,Cranfield University, Bedford MK43 0AL, U.K. Tel: +44 1234 758308; Fax: +44 1234758380; email: [email protected]
Key words: environmental factors, temperature, trichothecene genes, microarray,deoxynivalenol, multiple regression analyses
*Present address: Centro del Agua para America Latina y el Caribe (CAALCA), Escuelade Ingeniería y Tecnologías de Información, ITESM Campus Monterrey, NL 64849,Mexico.
AbstractThe effect of changes in temperature/water activity (aw) on growth, deoxynivalenol (DON)production and trichothecene gene cluster expression (18 genes) for strains of Fusariumculmorum and Fusarium graminearum was studied. The expression data for 6 keytranscription genes (TRI4, TRI5, TRI6, TRI10, TRI12 and TRI13) were analysed usingmultiple regression analyses to model the relationship between these various factors for thefirst time. Changes in aw and temperature significantly (P=0.05) affected growth and DON.Microarray data on expression of these genes were significantly related to DON productionfor both strains. Multi-regression analysis was done and polynomial models found to best fitthe relationship between actual/predicted DON production relative to the expression of theseTRI genes and environmental factors. This allowed prediction of the amounts of DONproduced in two dimensional contour maps to relate expression of these genes to either aw ortemperature. These results suggest complex interactions between gene expression (TRIgenes), environmental factors and mycotoxin production. This is a powerful tool forunderstanding the role of these genes in relation to environmental factors and enables moreeffective targeted control strategies to be developed.
1. INTRODUCTION
Fusarium culmorum (W.G.Sm.) Sacc. and Fusarium graminearum Schw. (Giberella zeae(Schein.) Petch are the two most important Fusaria responsible for wheat scab in Europe andNorth America and responsible for the contamination of cereal grain with trichothecenes,especially deoxynivalenol (DON). This has resulted in legislative limits being set in raw andprocessed cereals for human food and animal feed for DON in many countries. Thussignificant effort has gone into development of prevention strategies for minimisingcontamination of such commodities with DON (Aldred & Magan 2004).
The key environmental factors which influence germination, growth and thebiosynthesis of DON and other trichothecenes have been demonstrated to include wateravailability and temperature (Magan et al. 2006). Indeed, detailed profiles have beendeveloped for the effect of aw, temperature and time on both DON and Nivalenol (NIV)production by strains of these species (Hope & Magan 2003; Hope et al. 2005). The

Journal of the Royal Society INTERFACE 8, 117-126 (2011)
2
biochemical and genetic control of the biosynthetic pathways for these trichothecenes havebeen studied (Dejardins 2007; Alexander et al. 2009). This suggests that some of the keyregulatory and transcriptional genes involved in trichothecene biosynthesis includes Tri4 (acytochrome P450 multifunctional monooxygenase which catalyses four steps in theconversion of trichodiene to isotrichodermin and trichothecene), TRI5 (trichodiene synthasewhich catalyses isomerisation of farnesyl pyrophosphate to form trichodiene), TRI6 (a zincfinger protein which is a transcription factor and positive regulator of the trichothecenepathway genes), TRI10 (regulates transcription of TRI6), TRI12 (trichothecene efflux pumpwhich transports the metabolites out of the cell) and TRI13 (a cytochrome P450 oxygenase).While a significant amount of work has been done on examining the TRI5 gene in relation tobiotic and abiotic factors (Dejardins 2007) practically no information is available on theeffect of environmental stress on these other key genes in F. culmorum and F. graminaerum.A systems approach to try and relate the different parameters from a molecular to aphenotypic production of the secondary metabolite in relation to environmental factors hasnot been previously attempted.
A few studies have examined the influence of some abiotic stress factors in relationto the actual biosynthetic genes involved in mycotoxin biosynthesis (Feng & Leonhard 1998;Geisen 2004; Llorens et al. 2004; O’Brian et al. 2007; Schmidt-Heydt et al. 2007; Jurado etal. 2008; Schmidt-Heydt et al. 2008). These studies have confirmed that environmentalfactors do have an influence on gene activation and transcription. Complex relationshipsoccur between such abiotic environmental factors and mycotoxin biosynthesis at thetranscriptional level and that obtained when phenotypic mycotoxin production is quantified.
The recent development of a microarray which has sub-arrays for the gene clusters ofkey mycotoxigenic fungi has provided an excellent tool for examining in more detail theimpact that changes in interacting environmental factors may have on relative expression ofthese gene clusters and relating this to phenotypic mycotoxin production (Schmidt-Heydtand Geisen 2007; Gardiner et al. 2009). Thus, the objectives of this study were to (a)examine the effect of aw x temperature interactions on growth, DON production and relativegene expression of six key genes (TRI4, TRI5, TRI6, TRI10, TRI12, TRI13) in the TRI genecluster using a mycotoxin gene microarray and (b) attempt to model the relationship betweenthese TRI genes, environmental factors and DON production for represenatative strains oftwo species, F. culmorum and F. graminearum.
2. MATERIALS AND METHODS
2.1 Fungal strainsThe strains used were from the culture collection of the Max Rubner-Institute, Karlsruhe,Germany. Fusarium culmorum strain BFE928 produces both DON and NIV and a strain ofF. graminearum BFE1006, was a DON producer. They were both isolated from infectedwheat grain. These were routinely maintained on a conducive yeast extract sucrose medium(YES, 20 g yeast extract l-1, 150 g sucrose l-l, 15 g agar l-1 in water) and incubated at 25oCfor seven days before use in experiments.
2.2 Modification of water activity of media, incubation and growth assessment.
The YES medium (0.995 aw) was modified with glycerol/water solutions to different wateractivity levels (% w/v of YES medium: 0.98/13.1; 0.95/19.9; 0.93/24.5). The media wereprepared in 9 cm Petri plates and allowed to cool. All treatments and replicate agar mediawere overlayed with sterile cellophane sheets (8.5 cm, P400, Cannings Ltd., Bristol, U.K.)before inoculation with a 3 mm agar disc from the growing margin of 7 day old cultures of

Journal of the Royal Society INTERFACE 8, 117-126 (2011)
3
each species. This facilitated both growth measurements and removal of the fungal biomassfor RNA extractions.
For measurement of the diametric mycelial growth rate, the diameter of the colonywas measured in two directions at right angles to each other. The temporal increase in colonyradius was plotted and the linear regression lines for the linear phase were used to obtain therelative growth rates (mm day-1).
The plates were incubated at 15, 20, 25 and 30ºC for 9 days, and the experimentconsisted of a fully replicated set of treatments with 3-4 replicates per treatment. Theexperiments were carried out twice to confirm results and also to ensure that enough biomasswas available for RNA extraction and microarray analyses.
2.3 Isolation of RNA from samples.
To perform microarray and real time PCR experiments RNA was isolated using theRNAeasy Plant Mini kit (Qiagen, Hilden, Germany). An amount of 1 g of the mycelium wasground with a mortar and pestle in liquid nitrogen. About 250 mg of the resulting powderwas used for isolation of total RNA. The powder was resuspended in 750 µl lysis buffer,mixed with 7.5 µl β-mercaptoethanol and 10 glass beads with a diameter of 1 mm (B. BraunBiotech International GmbH, Melsungen, Germany) in a 2 ml RNase free micro reactiontube. The extracts were mixed thoroughly and incubated for 15 min at 55 °C and 42 kHz in aS10H ultrasonic bath (Elma, Singen, Germany). All further procedures were essentially thesame as suggested by the manufacturer of the kit.
cDNA synthesis. For cDNA synthesis 12 µl of the DNase I treated total RNA wereused along with the Omniscript Reverse Transcription kit (Qiagen). The reaction mixturewas essentially as described by the manufacturer (Qiagen, Hilden, Germany) and incubatedat 37 °C for 1 h. The cDNA was stored at –20 °C.
Microarray experiments.The microarray used in this study has the mycotoxin genesfor a number of fungi and includes two sub-arrays with the TRI genes for Gibberella zeaeand F. sporotrichoides. This has been recently described in detail by Schmidt-Heydt andGeisen (2007). For labelling of cDNA an amount of 10 - 50 µg of the DNase I treated totalRNA was used according to the specifications of the manufacturer of the Micromax cDNADirect Labeling kit (Perkin Elmer Life and Analytical Sciences, Inc. Boston, USA). AftercDNA synthesis and labelling, the cDNA was purified with a QiaQuick MinElute-97 Kit(Qiagen, Hilden, Germany). The labelled and purified cDNA was brought to dryness in aSpeed Vac concentrator (Savant Instruments, Farmingdale, USA), suspended in 60 µlhybridization buffer (Scienion, Berlin, Germany), heated for 2 min. at 95 °C and hybridizedfor 18 h at 42°C to the microarray by using an automatic hybridization station (PerkinElmer). After hybridization the array was scanned with a confocal laser scanner system(Scanarray lite, Perkin Elmer) at a resolution of 5 µm. The analysis of the results wasperformed using the Scanarray software (Perkin Elmer, Boston, USA). The results werenormalized using the Lowess algorithm (locally weighted scatter plot smoothing) and thesubtraction of the background signal intensity. As control, the constitutively expressedβ-tubulin gene was used.
2.4 Quantitative determination of deoxynivalenol (DON) by HPLC.
Mycotoxin extraction and analyses was performed using a modified method of Cooney et al.(2001). Each sample (10 g) was homogenised and mixed well. The sample was extracted bymixing with acetonitrile/methanol (14:1; 40 ml) shaken for 2 h and then filtered throughWhatman No. 1 (Whatman International Ltd, Maidstone, U.K.) filter paper. For analysis a 2-
Journal of the Royal Society INTERFACE 8, 117-126 (2011)
4
ml aliquot was passed through a cleanup cartridge consisting of a 2-ml syringe (Fisher Ltd,3Loughborough) packed with a disc of Whatman filter paper No. 1;, a 5-ml luger of glasswool and 300 mg of alumina/activated carbon (20:1, 500 mg). The column was washed withacetonitrile/methanol/water (80:5:15; 500 ml), and the combined eluate was evaporated(compressed air, 50oC) to dryness and then resuspended in methanol/water (5:95; 500 µl).
Quantification of DON was performed using a Luna C18 reversed phase column(100 x 4.6 mm; 5 µm particle size; Phenomenex, Macclesfield, UK) connected to a guardcolumn SecurityGuard (4 x 3 mm) filled with the same stationary phase. Separation wasachieved using an isocratic mobile phase of methanol/water (12:88, v/v) at a flow rate of 1.5ml min-1). Eluates (injection volume of 50 μl) were detected using a UV detector (Gilson117, Anachem, Luton, U.K.) set at 220 nm with an attenuation of 0.01 AUFS. The retentiontime for DON was 13.3 min. Quantification was relative to external standards of 1 to 8 μgml-1) in methanol/water (5:95). The quantification limit was 5 ng g-1.
2.5 Multiple regression analyses and statistical analyses.
The analysis was performed using a multiple regression analysis for the expression of sixkey TRI genes which are involved in the trichothecene biosynthetic pathway (TRI6, TRI10,TRI4, TRI5, TRI12 and TRI13), temperature and aw conditions with DON concentrationconsidered as the selected dependent variable. The microarray expression data for each genewere used to obtain a normalised relative expression value by dividing the actual copynumber by the maximum recorded expression values for a particular gene (e.g. normalisedTRI4 expression = actual TRI4/maximum TRI4 over all conditions).
These were used to examine the relationship between several independent orpredictor variables and the dependent variable, in this case, DON concentration. The analysiswhich was applied to predict DON concentration based on the independent factors was agood tool to obtain vectors showing the significance of each factor on the independentvariables. The model was used to predict the dependent Y-variable or response as a functionof n > 1 independent of X-variables or predictors. STATISTICA software (version 6.0,StatSoft Inc., Tulsa, USA) was used for response surface regression of the data obtained. Thestatistical analysis of the model was performed in the form of an analysis of variance(ANOVA). This analysis included the Fisher’s test (overall model significance), itsassociated probability P(F), correlation coefficient R, and determination of the R2 coefficientmeasure the goodness of fit of the regression model. It also included the t-value for theestimated coefficients and associated probabilities. Non-linear models were examined butthey did not provide a good fit to the data. The use of less parametres, e.g. 2-5 geneexpression data were also evaluated and gave a worse fit.
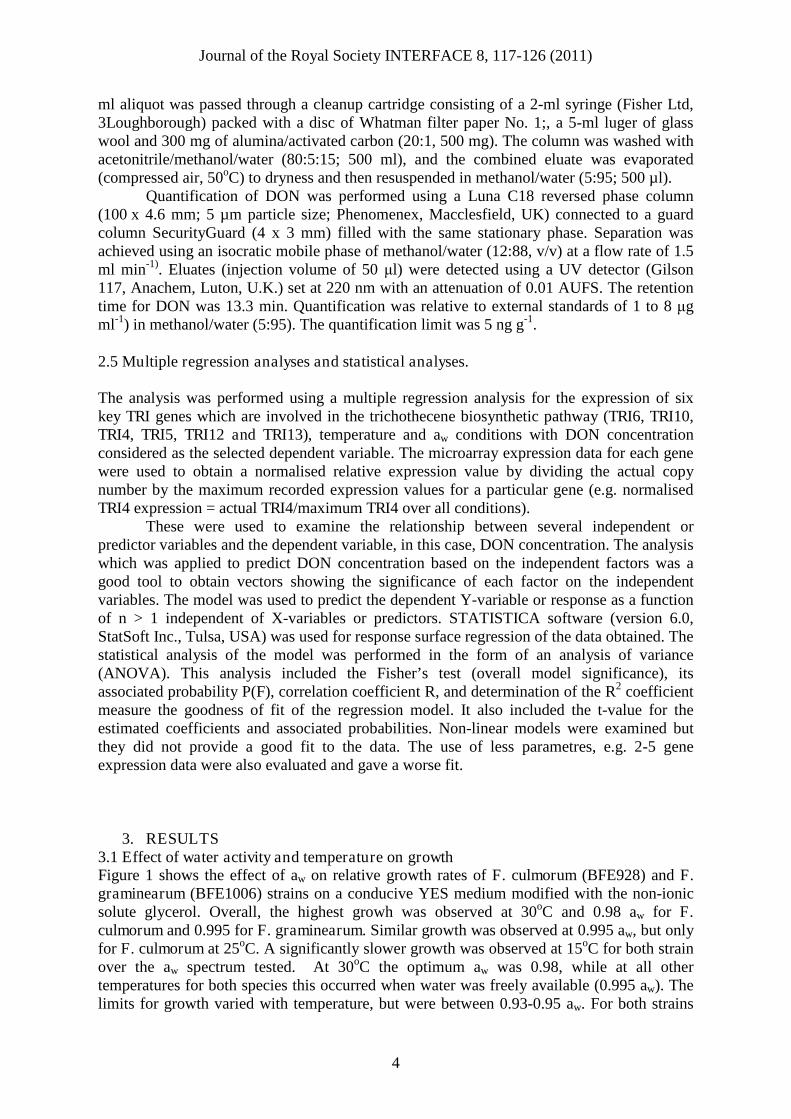
3. RESULTS3.1 Effect of water activity and temperature on growthFigure 1 shows the effect of aw on relative growth rates of F. culmorum (BFE928) and F.graminearum (BFE1006) strains on a conducive YES medium modified with the non-ionicsolute glycerol. Overall, the highest growh was observed at 30oC and 0.98 aw for F.culmorum and 0.995 for F. graminearum. Similar growth was observed at 0.995 aw, but onlyfor F. culmorum at 25oC. A significantly slower growth was observed at 15oC for both strainover the aw spectrum tested. At 30oC the optimum aw was 0.98, while at all othertemperatures for both species this occurred when water was freely available (0.995 aw). Thelimits for growth varied with temperature, but were between 0.93-0.95 aw. For both strains

Journal of the Royal Society INTERFACE 8, 117-126 (2011)
5
some growth was observed at 0.93 aw and temperatures >15oC, but not at 0.90 aw over theexperimental period.
3.2 Phenotypic deoxynivalenol production and environmental factorsThe effect of aw x temperature conditions on DON production showed that there weredifferences between the two strains over the 9 day time scale (Figure 2). F. culmorumproduced no DON at 15oC during this period but overall this strain produced significantlymore than the F. graminearum strain used. For the latter species, although less DON wasproduced, the toxin was produced at 15oC and 0.995 aw. Optimum DON production was at20 and 25oC for F. culmorum and F. graminearum respectively. This was different from thatfor growth.
3.3 TRI gene expression in relation to environmental factorsFigure 3 summarises the relative expression of the six genes (TRI4, TRI5, TRI6, TRI10,TRI12 and TRI13) under the different environmental treatments used. This shows that therewere different patterns of gene expression depending on abiotic conditions and species.Furthermore, the expression data for the strain of F. culmorum were relatively much higherthan for the F. graminearum one reflecting the lower DON levels produced by the latterstrain. The TRI5 gene, a key one in the biosynthetic pathway of trichothecenes, wasexpressed over all the conditions examined. The expression data for all six key genes (TRI4,TRI5, TRI6, TRI10, TRI12, TRI13) were used for modelling the impact of environmentalinteractions on phenotypic DON production.
3.4 Modelling of the relationship between gene expression and DON production(i) F. culmorum strain: In order to find the statistically significant interactions betweenfactors, a model based on a polynomial equation fitting the experimental data for DONproduction in relation to the expression of the 6 TRI genes and the environmental parameterswas developed. The determination co-efficient (R2) was 0.9709. The regressed model ispresented below:
13Tri12Tri5Tri4Tri
10Tri6TriC)T(a-1
6.42X10.8X-X01.23.16X
X03.4X5.21.1.216X085.5)ggDON( ow
XEq. 1
Where X = coded factor and the subscript name the factor in each term of the model. For the
gene expression a standardised value was used defined asvalueMaximum
valueActualX gen _
_
therefore the gene expression will be in the range of 0<X<1. The coded values fortemperature and water activiy are the coded levels tested from the lowest (1) to the higest (4)values.
(ii) F. graminearum strain: The gene expression data for this species was also used fordevelopment of a model based on a polynomial equation which fitted the experimental datafor DON production by F. graminearum. This had a multiple correlation coefficient (R2) of0.9542 . The regressed model is presented below:
13Tri12Tri5Tri4Tri
10Tri6TriC)T(a-1
8.22X-2.35X-11.0X11.28X
7.8X0.283X1.054X1.262X-5.16)ggDON( ow
Eq. 2

Journal of the Royal Society INTERFACE 8, 117-126 (2011)
6
Using these models the observed versus predicted DON concentration in relation tothe expression of the 6 genes and aw and temperature are shown in Figures 4a and b. ThisFigure suggests that while there is some under and over prediction the model does generallyfit the experimental data, especially with the F. culmorum strain.
Table 1 shows the overall statistical fit of the model and the significance of thefactors (TRI genes, aw, temperature) in relation to DON production for the F. culmorumstrain. This Table shows that DON production was statistically related to the experession ofa number of TRI genes (e.g. TRI5, TRI12, TRI13). For the F. graminearum strain thereappeared to be a much more co-ordinated expression of these TRI genes with both aw andtemperature, and expression of TRI4, TRI5, TRI10 and TRI13 all being statisticallysignificant factors (Table 2a, b).
Figure 5 shows examples of two dimensional contour plots relating specific geneexpression and aw levels for both species to predicted DON production for TRI5, TRI6 andTRI13 as examples using the developed models. This shows clearly that under both aw
optimum and minima there is an increased expression of these genes and this can be relateddirectly to predicted DON production levels. This shows that environmental stress can resultin increased gene expression which in turn relates to phenotypic secondary metaboliteproduction. For the F. culmorum strain (Figure 5, a, b, c) this is clear while for the F.graminearum one (Figure 5 d, e, f) less so, although there is a pattern for conditionsconducive and non-conducive to DON production. The lower DON production by the strainof F. graminearum used in our experiments is reflected in the relationship between theexpression of these three genes used as examples and the predicted DON production. Similarpatterns were obtained with regard to the other TRI genes and for temperature (data notshown).
Figure 6 shows the predicted contour maps for relative DON production based onthe available data and the model in relation to the key environmental factors of temperatureand aw. For both strains optimum was at 20-25oC and >0.98 aw.
4. DISCUSSION
This study is one of the first to attempt to relate phenotypic mycotoxin production to key TRIcluster gene expression in relation to a matrix of interacting environmental factors for strainsof mycotoxigenic fungi. The growth of both strains was shown to be optimum at 30oC andbetween 0.98-0.995 aw. However, DON production was optimum at 20-25oC over the 9 dayexperimental period. This is consistent with some of the previous studies relating aw xtemperature effects to growth and DON production for F. culmorum amd F. graminearumstrains from Europe and Argentina (Hope & Magan 2003; Hope et al. 2005; Ramirez et al.2006). Marin et al. (2004) showed that the temperature x aw profiles for germination, growthand phenotypic fumonisin production by strains of F. verticillioides and F. proliferatumwere also different. Similarly, for mycotoxigenic fungi such as Aspergillus carbonarius andochratoxin A production differences were observed with optimum growth at 30-35oC and0.98 aw while toxin production was optimum at 15-20oC and 0.98-0.95 aw (Belli et al. 2004;Mitchell et al. 2004). However, none of these previous studies attempted to relate specificexpression profiles of key genes involved in the biosynthesis of the toxins to growth orphenotypic mycotoxin production. The only studies of this type were those recently reportedfor the effects of osmotic and matric potential on the kinetics of FUM1 gene expression byF. verticillioides (Jurado et al. 2008), on otapksPV expression by Penicillium verrucosum inrelation to suboptimal preservatives and environmental factors (Schmidt-Heydt et al. 2007)and the recent study which showed the effect of aw x temperature conditions on mycotoxin

Journal of the Royal Society INTERFACE 8, 117-126 (2011)
7
gene cluster activities for P. nordicum, F. culmorum and A. parasiticus using the microarrayused in the present study (Schmidt-Heydt et al. 2008).
This study has shown that some of the key genes in the biosynthetic pathway fortrichothecene production (TRI4, TRI5, TRI6, TRI10, TRI12 and TRI13) are markedlyincreased and influenced by interacting environmental conditions of temperature x aw. Theincreased activity of the TRI5 (sesquiterpene cyclase) and TRI4 (cytochrome P450) isparticularly important as they are key genes involved in the initial biosynthetic pathway fortrichodiene synthase and trichodiene oxygenase. Other important genes downstream fromthese are those involved in regulation and transport (e.g. TRI6 transcription factor; TRI12,superfamily transporter; TRI10 regulatory gene) in both species (Desjardins 2007). Indeed,studies by Peplow et al. (2003) showed that the TRI10 is a regulatory gene for fourtrichothecene pathway-specific genes in F. sporotrichioides. This may also be relevant to theF. culmorum strain used in our study as it also produces nivalenol.
In the present study we have only focussed on these 6 genes although the data for allthe TRI genes were obtained using the microarray (data not shown). However, there arecomplex interactions between gene expression and phenotypic mycotoxin production whenone considers the whole cluster of genes involved. A lack of correlation between relativegene expression and toxin production for some genes has been observed previously. Forexample, this has been found with the relationship for some genes involved in aflatoxinproduction (Scherm et al. 2005). They showed that expression of only a small number ofaflatoxin biosynthetic pathway genes were directly coupled with aflatoxin biosynthesis. Thiscomplexity was recently demonstrated in work with a mycotoxin microarray (Schmidt-Heydtet al. 2009) which showed that there are two clusters of genes which were expressed inclusters and this was influenced by water availability. However, in the studies by Scherm etal. (2005) the effect of environmental factors was not considered.
The polynomial models were useful tools to try and unravel the complex correlationsbetween these specific genes in the cluster and the range of interacting environmentalparameters studied. The analysis showed that models can be developed to relate geneexpression to secondary metabolite production and subsequently used to successfully predictDON production. Moreover, the models show that there may well be strain and perhapsspecies differences in terms of the patterns of expression of these 6 genes in relation tointeracting environmental factors and phenotypic mycotoxin production. This would confirmthe differences previously found for both temporal growth and DON production by strains ofF. culmorum and F. graminearum (Hope et al. 2004). The next step will be to try andvalidate this model by using RT-PCR data for these specific genes and relate their expressionto the predicted DON production we have observed in this study and then use other data setsto test the model.
Because of the nature of this type of study samples were taken after a specific time of9 days as initial experiments suggested that this was the optimum for TRI5 gene expressionat 0.98 aw. However, it may well be that as environmental stress is imposed there is a longerlag time before exponential growth occurs. Thus a wider time frame might need to beincluded for more detailed kinetic studies. Indeed, work with the FUM1 gene expression byF. verticillioides suggests that under ionic water stress there was a decrease in growth but asignificant increase in gene expression as aw was reduced to 0.95 and 0.93 aw over a 15 dayperiod (Jurado et al. 2008).
We believe that a systems approach by integrating related molecular, ecological andsecondary metabolite data can be a powerful tool for more targeted functional studies on therelationship between gene expression and phenotypic mycotoxin production in relation tointeracting environmental conditions. Furthermore, it may enable more rapid studies to becarried out in identifying anti-fungal compounds which may inhibit specific key biosynthetic

Journal of the Royal Society INTERFACE 8, 117-126 (2011)
8
and regulatory genes in these clusters which can be used for the development of improvedprevention strategies to minimise mycotoxins in the food chain.
Acknowledgements: We are grateful to Mrs. E.S. Baxter for technical assistance.
REFERENCES
Aldred, D. & Magan, N. 2004 Prevention strategies for tricothecenes. Toxicol. Letts.153, 165-171.
Alexander, N. J., Proctor, R.H., McCormick, S.P. 2009 Genes, gene clusters, andbiosynthesis of trichothecenes and fumonisins in Fusarium. Toxins Reviews 28, 198-215.
Belli, N., Marin, S., Sanchis, V., & Ramos A.J. 2004 Influence of water activity andtemperature on growth of isolates of Aspergillus section Nigri obtained from grapes.Int. J. Food Microbiol. 96, 19-27.
Cooney, J.M., Lauren, D.R., & di Menna, M.E. 2001 Impact of competitive fungi ontrichothecene production by Fusarium graminearum. J. Agric. Food Chem. 49, 522–526.
Desjardins, A.E. 2007 Fusarium mycotoxins: chemistry, genetics and biology. APS Press,St Pauls, Minnesota, St Paul, USA. Pp. 260.
Feng, G.H., & Leonhard, T.J. 1998. Culture conditions control expression of the genes foraflatoxin and sterigmatocystin biosynthesis in Aspergillus parasiticus and A.nidulans. Appl. Environ. Microbiol. 64, 2275-2277.
Gardiner D.M., Kazan, K., Manners, J.M. 2009 Nutrient profiling reveals potent inducers oftrichothecene biosynthesis in Fusarium graminearum. Fungal Gen. Biol. 46, 604-613.
Geisen, R. 2004 Molecular monitoring of environmental conditions influencing theinduction of ochratoxin A biosynthesis genes in Penicillium nordicum. Mol. Nut.Food Res. 48, 532-540
Hope, R. & Magan, N. 2003 Two dimensional environmental profiles of growth,deoxynivalenol and nivalenol production by Fusarium culmorum on a wheat-basedsubstrate. Letts. Appl. Microbiol. 37, 70-74.
Hope, R., Aldred, D. & Magan, N. 2005 Comparison of the effect of environmental factorson deoxynivalenol production by F. culmorum and F. graminearum on wheat grain.Letts. Appl. Microbiol. 40, 295-300.
Jurado, M., Marín, P., Magan, N. & Gonzalez-Jaén, M.T. 2008 Relationship betweensolute and matric potential stress, temperature, growth and FUM1 gene expression intwo Fusarium verticillioides strains from Spain. Appl. Environ. Microbiol. 74, 2032-2036.
Llorens, A., Mateo, R., Hinojo, M.J., Valle-Algarra, F.M. & Jiménez, M. 2004 Influenceof environmental factors on the biosynthesis of type B trichothecenes by isolates ofFusarium spp. from Spanish crops. Int. J. Food Microbiol. 94, 43-54.
Magan, N., Hope, R. & Aldred, D. 2006 Ecophysiology of Fusarium culmorum andmycotoxin production. In Advances in Food Mycology. Eds. Hocking, A.D. Pitt, J.I.,Samson, R. & Thrane, U. Springer. Pp. 123-136.
Mitchell, D., Parra, R., Aldred, D. & Magan, N. 2004 Water and temperature relations ofgrowth and ochratoxin A production by Aspergillus carbonarius strains from grapesin Europe and Israel. J. Appl. Microbiol. 97, 439-445.
Marin, S., Magan, N., Ramos, A.J. & Sanchis, V. 2004 Fumonisin-producing strains ofFusarium: a review of their ecophysiology. J. Food Prot. 67, 1792-1805.

Journal of the Royal Society INTERFACE 8, 117-126 (2011)
9
O’Brian, G.R., Georgianna, D.R., Wilkinson, J.R., Yu, J., Abbas, H.K., Bhatnagar, D.,Cleveland, T.E., Nierman, W. & Payne, G.A. 2007 The effect of elevatedtemperature on gene transcription and aflatoxin biosynthesis. Mycologia 99, 232-239.
Ramirez, M.L., Chulze, S. & Magan, N. 2006 Interacting environmental factors, growthand temporal deoxynivalenol production by strains of Fusarium graminearum fromArgentina on wheat grain. Int. J. Food Microbiol. 106, 291-296.
Peplow, A.W., Tag, A.G., Garifullina, G.F. & Boremand, M.N. 2003 Identification ofnew genes positively regulated by Tri10 and a regulatory network for trichothecenemycotoxin production. Appl. Environ. Microbiol. 69, 2731-2736.
Price, M.S., Conners, S.B., Tachdjian, S., Kelly, R.M. & Payne, G.A. 2005 Aflatoxinconducive and non-conducive growth conditions reveal new gene associations withaflatoxin production. Fungal Gen. Biol. 42, 506-518.
Scherm, B., Palomba, M., Serra, D., Marcello, A. & Migheli, Q. 2005 Detection oftranscripts of the aflatoxin genes aflD, aflO and aflP by reversed-transcription-polymerase chain reaction allows differentiation of aflatoxin producing and non-producing isolates of Aspergillus flavus and Aspergillus parasiticus. Int. J. FoodMicrobiol. 98, 201-210
Schmidt-Heydt, M. & Geisen, R. 2007 A microarray for monitoring the production ofmycotoxins in food. Int. J. Food Microbiol. 117, 131-140.
Schmidt-Heydt., M., Baxter, E.S., Geisen, R. & Magan, N. 2007 Physiological relationshipbetween food preservatives, environmental factors, ochratoxin and otapksPv geneexpression by Penicillium verrucosum. Int J Food Microbiol 119: 277-283.
Schmidt-Heydt, M., Magan, N. & Geisen, R. 2008 Stress induction of mycotoxinbiosynthesis genes in relation to abiotic factors. FEMS Microbiol. Letts. 284, 142-149.
Schmidt-Heydt, M., Abdel-Hadi,A., Magan, N. & Geisen R. 2009 Complex regulation of theaflatoxin biosynthesis gene cluster of A. flavus in relation to various combinations ofwater activity and temperature. Int. J. Food Microbiol. 135, 231-237.

Journal of the Royal Society INTERFACE 8, 117-126 (2011)
10
Table 1. Regression analyses summary of (a) model fit and (b) statistically significant effectof interactions with DON as the dependent variable and the individual six genes and the twoenvironmental factors for F. culmorum. The numbers in bold represent significant factors.(a)________________________________________________________________________
SS Df Mean F P-levelRegression 21.02170 8 2.627712 16.47913 0.000326Residual 1.27566 18 0.159457Total 22.29735_________________________________________________________________________
(b)
B (regressed model coefficient) Std Error P-level
Intercept 5.8499 1.181035 0.001116
Water activity 0.216 0.143956 0.172016
Temperature (oC) -1.0774 0.301641 0.007276
Tri 6 -2.5075 0.787163 0.012891
Tri 10 4.0330 1.263693 0.012775
Tri 4 3.1598 1.066495 0.018068
Tri 5 -2.0096 0.576268 0.008232
Tri 12 -10.8186 1.657092 0.000183
Tri 13 6.4161 0.914918 0.000111

Journal of the Royal Society INTERFACE 8, 117-126 (2011)
11
Table 2. The regression analyses summary of (a) model fit and (b) the statistically significanteffect of interactions with DON as the dependent variable and the individual genes and thetwo environmental conditions for F. graminearum. Numbers in bold are statisticallysignificant.(a)________________________________________________________________________
SS Df Mean F P-levelRegression 232.8808 8 29.11010 22.89857 0.00033Residual 22.8827 18 1.27126Total 225.7636__________________________________________________________________________(b)
B (regressed model coefficient) Std Error P-level
Intercept -5.15931 0.990765 0.000059
Water activity 1.262 0.313627 0.000798
Temperature (oC) 1.05426 0.323034 0.004314
Tri 6 0.28255 1.872558 0.881742
Tri 10 -7.79699 1.425399 0.000034
Tri 4 11.27672 1.387046 0.000000
Tri 5 11.00253 2.094076 0.000054
Tri 12 -2.34974 1.179510 0.061748
Tri 13 -8.21629 1.378790 0.000012
Journal of the Royal Society INTERFACE 8, 117-126 (2011)
12
Figure 1. Effect of water activity and temperature on growth rates (mm day-1) of Fusariumculmorum and F. graminearum strains on YES medium. Bars indicate Least significantdifferences (P=0.05).
Figure 2. Bar chart of the effect of different water activity and temperature levels ondeoxynivalenol production (µg g-1) by (a) F. culmorum and (b) F. graminearum on aconducive YES medium after 9 days growth. Bars indicate Least significant difference(P=0.05). Key: ND, not detected.

Journal of the Royal Society INTERFACE 8, 117-126 (2011)
13
Figure 3. Relative TRI gene expression of the six genes analysed in relation to water activityand temperature treatments for (a) F. culmorum and (b) F. graminearum grown on YESmedium for 9 days. The data is relative to the house keeping β-tubulin gene.

Journal of the Royal Society INTERFACE 8, 117-126 (2011)
14
Figure 4. The correlations between the observed and predicted values based on the modelsdeveloped for deoxynivalenol (µg g-1) (a) F. culmorum and (b) F. graminearum. The brokenlines indicate the 95% confidence limits. Points above or below the diagonal line representareas of over or under prediction.

Journal of the Royal Society INTERFACE 8, 117-126 (2011)
15
Figure 5. Two dimensional contour maps of the predicted DON (µg g-1) production inrelation to expression of (a) and (d) for TRI5, (b) and (e) for TRI6 and (c) and (f) for Tri13genes and water activity conditions for F. culmorum and F. graminearum respectively, basedon the polynomial model. The numbers on the contour maps refer to concentrations of DON(µg g-1) based on the relationship between specific gene expression and a range of wateractivity levels.

Journal of the Royal Society INTERFACE 8, 117-126 (2011)
16
Figure 6. Predicted DON (µg g-1) contour maps of production in relation to temperature andwater activity by (a) F. culmorum and (b) F. graminearum based on the polynomial modeldeveloped in this study. Numbers on the contour lines refer to predicted DONconcentrations.


![Deoxynivalenol (Vomitoxin) Nivalenol - FAMIC · Deoxynivalenol (Vomitoxin) Nivalenol [Methods listed in the Feed Analysis Standards] 1 Simultaneous analysis of mycotoxins by liquid](https://img.pdfslide.us/doc/110x75/5e2972e79268725bcf18f42b/deoxynivalenol-vomitoxin-nivalenol-deoxynivalenol-vomitoxin-nivalenol-methods.jpg)