Embed Size (px)
Citation preview

University of Pennsylvania University of Pennsylvania
ScholarlyCommons ScholarlyCommons
Departmental Papers (Dental) Penn Dental Medicine
6-2014
Role of Fas and Treg Cells in Fracture Healing as Characterized in Role of Fas and Treg Cells in Fracture Healing as Characterized in
the Fas-Deficient (lpr) Mouse Model of Lupus the Fas-Deficient (lpr) Mouse Model of Lupus
Maisa O. Al-Sebaei
Dana M. Daukss
Anna C. Belkina
Sanjeev Kakar
Nathan A. Wigner
See next page for additional authors
Follow this and additional works at: https://repository.upenn.edu/dental_papers
Part of the Dentistry Commons
Recommended Citation Recommended Citation Al-Sebaei, M. O., Daukss, D. M., Belkina, A. C., Kakar, S., Wigner, N. A., Crusher, D., Graves, D. T., Einhorn, T., Morgan, E., & Gerstenfeld, L. C. (2014). Role of Fas and Treg Cells in Fracture Healing as Characterized in the Fas-Deficient (lpr) Mouse Model of Lupus. Journal of Bone and Mineral Research, 29 (6), 1478-1491. http://dx.doi.org/10.1002/jbmr.2169
This paper is posted at ScholarlyCommons. https://repository.upenn.edu/dental_papers/16 For more information, please contact [email protected].

Role of Fas and Treg Cells in Fracture Healing as Characterized in the Fas-Role of Fas and Treg Cells in Fracture Healing as Characterized in the Fas-Deficient (lpr) Mouse Model of Lupus Deficient (lpr) Mouse Model of Lupus
Abstract Abstract Previous studies showed that loss of tumor necrosis factor α (TNFα) signaling delayed fracture healing by delaying chondrocyte apoptosis and cartilage resorption. Mechanistic studies showed that TNFα induced Fas expression within chondrocytes; however, the degree to which chondrocyte apoptosis is mediated by TNFα alone or dependent on the induction of Fas is unclear. This question was addressed by
assessing fracture healing in Fas-deficient B6.MRL/Faslpr/J mice. Loss of Fas delayed cartilage resorption but also lowered bone fraction in the calluses. The reduced bone fraction was related to
elevated rates of coupled bone turnover in the B6.MRL/Faslpr/J calluses, as evidenced by higher osteoclast numbers and increased osteogenesis. Analysis of the apoptotic marker caspase 3 showed
fewer positive chondrocytes and osteoclasts in calluses of B6.MRL/Faslpr/J mice. To determine if an active autoimmune state contributed to increased bone turnover, the levels of activated T cells and Treg
cells were assessed. B6.MRL/Faslpr/J mice had elevated Treg cells in both spleens and bones of
B6.MRL/Faslpr/J but decreased percentage of activated T cells in bone tissues. Fracture led to ∼30% to
60% systemic increase in Treg cells in both wild-type and B6.MRL/Faslpr/J bone tissues during the period of cartilage formation and resorption but either decreased (wild type) or left unchanged (B6.MRL/
Faslpr/J) the numbers of activated T cells in bone. These results show that an active autoimmune state is inhibited during the period of cartilage resorption and suggest that iTreg cells play a functional role in this process. These data show that loss of Fas activity specifically in chondrocytes prolonged the life span of chondrocytes and that Fas synergized with TNFα signaling to mediate chondrocyte apoptosis. Conversely, loss of Fas systemically led to increased osteoclast numbers during later periods of fracture healing and increased osteogenesis. These findings suggest that retention of viable chondrocytes locally inhibits osteoclast activity or matrix proteolysis during cartilage resorption.
Keywords Keywords Chondrocytes, osteoclasts, fas, apoptosis, treg cells
Disciplines Disciplines Dentistry
Author(s) Author(s) Maisa O. Al-Sebaei, Dana M. Daukss, Anna C. Belkina, Sanjeev Kakar, Nathan A. Wigner, Daniel Crusher, Dana T. Graves, Thomas Einhorn, Elise Morgan, and Louis C. Gerstenfeld
This journal article is available at ScholarlyCommons: https://repository.upenn.edu/dental_papers/16

Role of Fas and Treg Cells in Fracture Healing asCharacterized in the Fas‐Deficient (lpr) MouseModel of Lupusy
Maisa O Al‐Sebaei,1,2 Dana M Daukss,1 Anna C Belkina,3 Sanjeev Kakar,1 Nathan A Wigner,1 Daniel Cusher,1
Dana Graves,4 Thomas Einhorn,1 Elise Morgan,1,5 and Louis C Gerstenfeld1,3
1Orthopaedic Research Laboratory, Boston University School of Medicine, Boston, MA, USA2King Abdul Aziz University, Faculty of Dentistry, Department of Oral and Maxillofacial Surgery, Jeddah, Saudi Arabia3Flow Cytometry Core Facility, Boston University School of Medicine, Boston, MA, USA4University of Pennsylvania School of Dental Medicine, Philadelphia, PA, USA5Department of Biomedical Engineering, Boston University School of Engineering, Boston, MA, USA
ABSTRACTPrevious studies showed that loss of tumornecrosis factora (TNFa) signalingdelayed fracture healingbydelaying chondrocyte apoptosisand cartilage resorption. Mechanistic studies showed that TNFa induced Fas expression within chondrocytes; however, the degree towhich chondrocyte apoptosis ismediated by TNFa alone or dependent on the inductionof Fas is unclear. This questionwas addressed byassessing fracture healing in Fas‐deficient B6.MRL/Faslpr/J mice. Loss of Fas delayed cartilage resorption but also lowered bone fraction inthe calluses. The reduced bone fraction was related to elevated rates of coupled bone turnover in the B6.MRL/Faslpr/J calluses, asevidenced by higher osteoclast numbers and increased osteogenesis. Analysis of the apoptotic marker caspase 3 showed fewer positivechondrocytes and osteoclasts in calluses of B6.MRL/Faslpr/J mice. To determine if an active autoimmune state contributed to increasedbone turnover, the levels of activated T cells and Treg cellswere assessed. B6.MRL/Faslpr/Jmice had elevated Treg cells in both spleens andbones of B6.MRL/Faslpr/J but decreased percentage of activated T cells in bone tissues. Fracture led to�30% to 60% systemic increase inTreg cells in bothwild‐type and B6.MRL/Faslpr/J bone tissues during the period of cartilage formation and resorption but either decreased(wild type) or left unchanged (B6.MRL/Faslpr/J) the numbers of activated T cells in bone. These results show that an active autoimmunestate is inhibited during the period of cartilage resorption and suggest that iTreg cells play a functional role in this process. These datashow that loss of Fas activity specifically in chondrocytes prolonged the life span of chondrocytes and that Fas synergized with TNFasignaling tomediate chondrocyte apoptosis. Conversely, loss of Fas systemically led to increased osteoclast numbers during later periodsof fracture healing and increased osteogenesis. These findings suggest that retention of viable chondrocytes locally inhibits osteoclastactivity or matrix proteolysis during cartilage resorption. © 2014 The Authors. Journal of Bone and Mineral Research published by WileyPeriodicals, Inc. on behalf of the American Society for Bone and Mineral Research. This is an open access article under the terms of theCreative Commons Attribution‐NonCommercial‐NoDerivs License, which permits use and distribution in any medium, provided theoriginal work is properly cited, the use is non‐commercial and no modifications or adaptations are made.
KEY WORDS: CHONDROCYTES; OSTEOCLASTS; FAS; APOPTOSIS; TREG CELLS
Introduction
Studies of the role of TNFa in fracture healing have demons-trated that the expression of TNFa acutely increases during
the inflammatory period (within the first 3 days after injury).Subsequently during the initial periods of active cartilageformation, the expression of TNFa and its receptors are almostabsent, but then they reemerge as the cartilage undergoesresorption. As resorption proceeds, the key regulatory factors inosteoclastogenesis, receptor activator of NF‐kB ligand (RANKL)and osteoprotegerin (OPG) (two other members in the TNFsuperfamily), as well as macrophage colony‐stimulating factor(M‐CSF) all become elevated.(1,2) We have also shown that TNF
receptor signaling appeared to coordinate aspects of cartilageresorption and primary bone remodeling with angiogenesis.(3)
Studies assessing the functional role of TNFa signaling in fracturehealing using transgenic mice deficient in TNFRSF1A andTNFRSF1B knockout mice demonstrated that there are threebiological processes by which the absence of TNF signalingaffects the progression of fracture healing: 1) a delay in the initialhealing phase, in either recruitment of mesenchymal cells or theinitiation of these cells to undergo skeletogenic cell differentia-tion; 2) a delay in chondrocyte apoptosis during the period ofendochondral bone formation; and 3) a delay in the resorption inthe mineralized cartilage during the endochondral period.(2) Insummary, a comparison of these various data sets suggests that
Received in original form July 20, 2013; revised form December 10, 2013; accepted December 28, 2013. Accepted manuscript online February 20, 2014.Address correspondence to: Louis C Gerstenfeld, PhD, Orthopaedic Research Laboratory, Department of Orthopaedic Surgery, Boston University School ofMedicine E243, 72 East Concorde Street, Boston, MA 02118, USA. E‐mail: [email protected] Supporting Information may be found in the online version of this article.yThe copyright line in this article was changed on August 26, 2014 after original online publication.
ORIGINAL ARTICLE JJBMR
Journal of Bone and Mineral Research, Vol. 29, No. 6, June 2014, pp 1478–1491DOI: 10.1002/jbmr.21692014 American Society for Bone and Mineral Research
1478

TNFa signaling plays a crucial role in promoting postnatal bonerepair through the recruitment or induction of skeletal cellprogenitors,(4,5) carries out a primary role in the regulation ofchondrocyte apoptosis,(2,6) and plays a role in regulating theproduction of factors that control the resorption and vasculari-zation of mineralized cartilage.(3)
In our analysis of the mechanisms by which TNF receptorsignaling affected fracture healing, we showed that TNFRsinduced the expression of multiple members of the larger TNFfamily of ligands and TNF receptors, including Fas, TRAIL, VEGI, andOPG.(6) Fas ligand (FasL) is unique among these family membersbecause it binds only to Fas receptor and appears to be primarilyinvolved in mediating apoptosis.(7) Although Fas and FasL playspecific functional roles in immune cell differentiation,(8,9) Fas alsohas been shown to mediate osteoclast apoptosis and loss ofestrogen leads to prolongation of an osteoclast’s life span, whichcontributes to sex hormone–dependent osteoporosis.(10,11)
Interestingly, the Fas receptor and its ligand were found to beuniquely expressed during chondrocyte hypertrophy.(12,13) Fashas been found in osteoarthritic cartilage, and treatment ofhuman articular chondrocytes with Fas ligand in vitro causesapoptosis.(14) During development, Fas system has been shownto be present in growth plate chondrocytes in vivo(13,15) whichhas led to the suggestion that Fas plays a role in chondrocyteapoptosis during endochondral development. We have shownthat within the fracture callus, chondrocytes express Fas(2) andthat TNFa will induce Fas expression in both repair and articularchondrocytes.(6,13,16,17) Thus, both TNFa and Fas have beenimplicated in providing death signals to chondrocytes. TNFapromotes apoptosis of both hypertrophic and nonhypertrophicchondrocyte populations through both Fas‐ and TNFa‐mediatedsignaling, whereas articular chondrocytes undergo apoptosis inresponse to TNFa.(6,17)
The aforementioned studies on the role of TNFa in fracturehealing and in articular cartilage suggested that TNFa facilitatesapoptosis of chondrocytes through two distinct processes, adirect induction of apoptosis by TNFa itself and an indirect effectproduced by the upregulation of Fas expression.(6,17) Becauseboth TNFRs and Fas can mediate apoptosis and their ligandswork in a complex microenvironment in which hematopoieticand mesenchymal cell populations interact with each other, amechanistic understanding of these two proteins’ function willonly come from sorting out how TNF and Fas receptorscoordinate their activities to keep in balance the progressionof apoptosis while promoting skeletal tissue repair after injury. Toassess the effects of Fas separate from TNF receptor signalingduring fracture healing, we examined fracture healing in B6.MRL/Faslpr/J mice, which have an inactivating mutation in Fas. Thesemice develop a generalized lymphoproliferative syndrome andhave been used as a model of Systemic Lupus Erythematosus(SLE) because they both produce auto‐antibodies and immune‐mediated glomerulonephritis.(18–20) Thus, our studies will alsopresent an opportunity to assess how a systemic autoimmuneSLE like pathology will effect fracture healing.
Materials and Methods
Mouse strain
All animal research was conducted under an IACUC‐approvedprotocol in conformity with all federal and USDA guidelines. Forthese studies, we used mice in which the lpr mutation had beenbred onto the C57/BL/6 strain (B6.MRL‐Faslpr/J) (Jackson Research
Laboratories, Bar Harbor, ME, USA). The choice of strainbackgrounds was based on two separate considerations. Thefirst was that a C57/BL/6 background allowed direct comparisonswith our previous studies of the TNFRSF1A‐/‐ TNFRSF1B‐/‐mice.(2) The second consideration was that the lpr mutation inthe MRL background manifests a much greater severity oflymphadenopathy(21) with an onset as early as 8 weeks, whichcould confound our fracture studies. In contrast, the B6.MRL‐Faslpr/J show onset of the lupus‐like syndrome after 15 weeks.(22)
Generation of femur fractures
All studies were performed on male 8‐ to 10‐week‐old mice.Unilateral midshaft femoral fractures were produced in the leftfemur as previously described.(23) The location and quality offractures as well as the position of the intramedullary spinalneedle that was used to fix the fracture were assessed whileanimals were still anesthetized using a standard X‐ray machine.(Sirona, Inc., Charlotte, NC, USA). Fractures that were found to beprofoundly displaced or comminuted were excluded.
Specimen harvests and sample sizes
Animals were euthanized by CO2 asphyxiation. Six fracturedfemora from each strain were harvested on each of days 0, 3, 5,10, 14, 21, and 28 for RNA extraction and molecular analysis.Three calluses were used to make duplicate pools of mRNAs foranalysis. Eight to 11 fractured femora from each strain werecollected on days 21 and 35 for micro‐computed tomography(CT) and mechanical testing. Five fractured femora from eachstrain were harvested on days 14 and 21 for histologicalassessment. Samples for each type of analysis were harvestedand prepared as previously described.(23) Five fractured andnonfractured femora from each strain were harvested on days 0and 10 for flow cytometric analysis.
Quantitative micro‐CT
Immediately before scanning, individual femora were removedfrom storage and allowed to thaw to room temperature. Boneswere then prepared for scanning by removal of the intra-medullary pins. Scans were preformed using a Scanco mCT 40system (Scanco Medical, Bruttisellen, Switzerland). Calluses werescanned ex vivo at a resolution of 12m/voxel. Scanning protocolsand initial image‐processing methods (reconstruction, noisereduction) were as described previously.(24) The phenotypicproperties that were quantified were total callus volume (TV),total mineralized callus volume (BV), mineralized callus volumefraction (BV/TV), average tissue mineral density (TMD), standarddeviation of the tissue mineral density (TMD), and callus mineralcontent (BMC). Calculation of TMD, TMD, and BMC were madepossible by density calibration data obtained from scans of ahydroxyapatite phantom provided by the CT system manufac-turer. Based on prior studies, both TMD and TMD were calculatedusing only the image voxels whose intensity (gray value)exceeded a 45% threshold that distinguishes mineralized tissuefrom unmineralized and poorly mineralized tissue.(24)
Mechanical testing
After CT scanning, calluses were subjected to biomechanicaltesting at the specified days as previously described.(24) Allspecimen preparation and testing was performed blind. Speci-mens were kept frozen at –20°C until right before they wereprepared for torsional testing. Just before testing, the proximal
Journal of Bone and Mineral Research ROLE OF FAS AND TREG CELLS IN FRACTURE HEALING 1479

and distal ends of the bone were potted in polymethylmetha-crylate (PMMA). The gage length (exposed length between thepotted ends) wasmeasured at 90° intervals around the specimencircumference. Torque (torsional moment) was applied to thespecimen, via the aluminum casings, at a rate of 1°/s to failureusing amicrotorsion testing system (55MT1; Instron Corporation,Canton, MA, USA) equipped with 0.225 N‐m torque transducer tomeasure torque and a high‐resolution (0.168 arc‐min) internalRVDT to measure angular displacement (twist). Data from bothtransducers were recorded at a rate of 50 Hz. From the resultingtorque‐twist curve, the maximum torque, torsional rigidity, andwork to failure were calculated.(24)
Demineralized histomorphometry andimmunohistochemistry analysis
Tissue retrieval, fixation, demineralization, and sectioning wereas previously described.(25) The histomorphometric assessmentof osteoclast numbers was based on tartrate‐resistant acidphosphatase (TRAP) staining with osteoclast cell counts per mm2
surface area.(26) Antibody staining was carried out at the BostonUniversity Immuno‐histochemistry Core facility using an auto-mated slide stainer (IntelliPATH FLX System, BioCare Medical,Inc., Concord, CA, USA). Antigen retrieval was done with trypsinfor 15minutes, and the slides were blockedwith 10% goat serumand Rodent M blocking IgG for 2 hours. For immunohistochem-istry, sections were incubated with rabbit polyclonal primaryantibodies against Caspase 3 obtained from Cell SignalingTechnology Inc. (Danvers, MA, USA) at 1:200 dilution for 2 hoursat 4°C. Secondary reactions were carried out using Alexa Fluor488 Goat Anti‐Rabbit IgG (Hþ L) from Invitrogen Inc. (Carlsbad,CA, USA) at a dilution of 1:500, and reactions were for 1 hour atroom temperature. DAPI was obtained as ProLong Gold reagentliquid mountant from Invitrogen Inc. Slides were then washed inTBST for 2 minutes. All photomicrograph images were taken andcollected on an Olympus Microscopy System (Olympus AmericaInc., 3500 Corporate Pkwy, Center Valley, PA, USA) using a Blue(DAPI): Chroma 31000v2 Green (Immunofluorescense): Chroma41028 Red (TRAP): Chroma 49005 filter.
Messenger RNA analysis
Total RNA samples were assessed in a duplicate set of pooledsamples prepared from three to four fractured calluses harvestedon 3, 5, 10, 14, 21, and 28 days after fracture. Reference RNA wasprepared from a duplicate set of pooled samples prepared fromthree to four 5‐mm segments of unfractured mid‐diaphysealfemurs. Total RNA was extracted and purified as described byWang and colleagues.(27) The two pools of mRNA samples werethen used for each mRNA analysis, which was carried out threetimes for each pool of RNA. Ribonuclease protection assays (RPA)were carried out as described by Cho and colleagues,(28) using3mg to 10mg of total mRNA dependent on the template set. Alltemplate sets included GAPDH and L32 probes as internalstandards. RNA samples were compared via autoradiographicanalysis and normalized to the L32 housekeeping gene to ensurethat the samples were intact and uniformly loaded. All reagentsfor the qRT‐PCR analysis were from Applied Biosystems, Inc.(Foster City, CA, USA), and plate assays were read on an ABI 7700Sequence Detector (Applied Biosystems). A summary of probeinformation for each primer is provided in SupplementalTable S1. Two micrograms of total RNA was used for eachpreparation of cDNA. All cDNA preparations were generated byrandom hexamer priming. Reverse transcription reactions and
PCR conditions were as previously reported.(27) The18S rRNA wasused for normalization of each target sequence. Each pooledRNA sample was run 3 times. The fractional cycle number atwhich the fluorescence passes the fixed threshold (CT values) wasused for quantification by using a comparative CT method. Meanexpression values were determined from the six measurements.
FACS analysis
For phenotypic analysis of the T‐ and B‐cell complements,spleens, femora, and callus tissues were isolated from 10‐week‐old wild‐type B6 and B6.MRL/Faslpr/J mice for baseline measure-ments (before fracture) and 10 days after fracture (n¼ 5 mice pergroup). Femora and adjacent callus tissues were crushed toliberate cells into DMEM medium supplemented with 10% fetalbovine serum, penicillin, and streptomycin. Bone fragments wereremoved by sterile filtration with 70‐mm strainers (BD Bio-sciences, San Jose, CA, USA). Splenocytes were prepared bymechanical disruption of the spleens. For all samples, eryth-rocytes were removedwith red blood cell lysis buffer (BioLegend,San Diego, CA, USA), and resulting cell pellets were resuspendedin FACS staining buffer (eBioscience, San Diego, CA, USA). Cellswere stained with the following monoclonal antibodies inpresence of Fc Block (eBioscience): CD4 FITC and CD25 PE (MouseRegulatory T Cell Staining Kit, eBioscience), CD19 APC‐Cy7, CD3PerCP, and CD69 Pacific Blue (BioLegend). For intracellularstaining with anti‐Foxp3 APC antibodies, the cells were firstwashed, fixed, and permeabilized according to the manufac-turer’s protocol. Dead cells were excluded based on the stainingwith Zombie Aqua fixable dye (BioLegend). Data were acquiredon BD LSR II SORP (BD Biosciences). At least 100,000 single‐cellevents were acquired and analyzed with FlowJo 10.0.6 (TreeStar,Ashland, OR, USA) for all samples. Gating determinations wereperformed with the use of FMO (Fluorescence Minus One) andisotype controls (Supplemental Fig. S1).
Statistical analysis
The data for both the control and experimental groups werepresented as means� standard deviation. The difference be-tween the two groups at each time point was evaluated byStudent’s t test, at a level of significance of p< 0.05 for the RNAand histological analysis. For themicro‐CT assessments, the effectof time and strain and their interactionwas established using two‐factor ANOVAs. For the results of the torsion tests, three‐factorANOVAs with time, strain, condition (fractured or unfracturedfemur), and the interaction between these effects wereperformed. For the results of FACs analysis, three‐factor ANOVAswith time, strain, condition (fractured or unfractured femur), andthe interaction between these effects were performed. Whenapplicable, a Tukey post hoc test was used to identify pairwisedifferences. A significance level of p¼ 0.05 was used in all cases.
Results
Quantitative micro‐CT
Representative three‐dimensional reconstructions of longitudi-nal half‐sections of the fracture callus are presented in Fig. 1. Themost striking feature of these comparisons was the increasedporosity in the bony calluses from the B6.MRL‐Faslpr/J mice.Quantitative measurements of the structural and mineralcompositions of the calluses’ tissues are presented in Fig. 1B.Both the total volume of the callus and the volume ofmineralized
1480 AL‐SEBAEI ET AL. Journal of Bone and Mineral Research

tissue in the callus were smaller in the day 35 time pointcompared with the day 21 day time point and did not differbetween strains (p< 0.0001). On the other hand, the overall ratioof volume of mineralized tissue to total callus volume was lowerin the B6.MRL‐Faslpr/J mice than in the controls at day 35(p¼ 0.007). The tissue mineral density of the callus increasedover time, whereas the total mineral content decreased overtime in both strains (p� 0.0005). The standard deviation of thetissue mineral density decreased over time only in the controlmice (p¼ 0.0161). Identical findings were observed in the gldmouse strain in which Fas has been completely deleted incontrast to the lpr strain in which it is functionally defective(Supplemental Fig. S2).
Mechanical testing
Results of the torsion tests are summarized in Fig. 2. Thefractured control femora withstood a higher maximum torque
than the B6.MRL‐Faslpr/J strain (p¼ 0.0051) (Fig. 2). None ofthe other torsional properties differed between strains,between time points, or between fractured versus contralat-eral bones, although the fractured bones always showedstatically (p¼ 0.05) less torsional strength than the unfrac-tured contralateral femora. The latter result suggested that by21 days these other properties have all been regained in thefractured bones.
Histomorphometric analysis
Callus tissues at 14 and 21 days after fracture were examinedbecause these time points are representative of key transition-al points in the resorption of the mineralized cartilage (day 14)and the maximal period of primary bone formation (day 21).Qualitatively, the B6.MRL‐Faslpr/J calluses looked larger andhad more cartilage tissues present at 14 days after facture withsmall remnants of cartilage tissue still observed at 21 days after
Fig. 1. Callus microstructure at 21 and 35 days after fracture as assessed bymicro‐CT. (A) Representative renderings on days 21 and 35 days after fracture.The reconstructed images were cut longitudinally to show the internal microstructure. (B) Graphical analysis of the structural micro‐CT measurements offracture calluses at 21 and 35 days after fracture. (C) Graphs showing characteristics of differences based on mineral content. The error bar is� SD.a¼ significance by time; b¼ significant interaction by time and strain; c¼difference by strain at a single time point; d¼difference by time for a singlestrain. Significance was at p< 0.05.
Journal of Bone and Mineral Research ROLE OF FAS AND TREG CELLS IN FRACTURE HEALING 1481

fracture compared with the control specimens (Fig. 3A). Highermagnification of regions of trabecular tissues at 21 days afterfracture provided corroborating data to the micro‐CT findings,showing that there was less trabecular tissue at this time(Fig. 3B). Quantitative measures of the total callus cross‐sectional areas for both control and B6.MRL‐Faslpr/J strain werehigher in day 14 after fracture calluses (p< 0.0001) than day 21calluses, whereas calluses from the B6.MRL‐Faslpr/J strain had agreater area than the control calluses at both time points(p< 0.0001). The measured area of bone in the calluses did notchange between days 14 and 21; however, it was significantlyless in the B6.MRL‐Faslpr/J strain regardless of the time point(p< 0.0013). In contrast, the amount of cartilage tissue wasgreater in the B6.MRL‐Faslpr/J strain (Fig. 3C) at both timepoints. Separate assessments based on the percentages oftissue compositions are presented in Table 1, and a summary ofthe statistical analysis of interaction between time and strainfor each of the separate measurements is presented in thistable.
Analysis of cartilage and bone cell mRNA expression
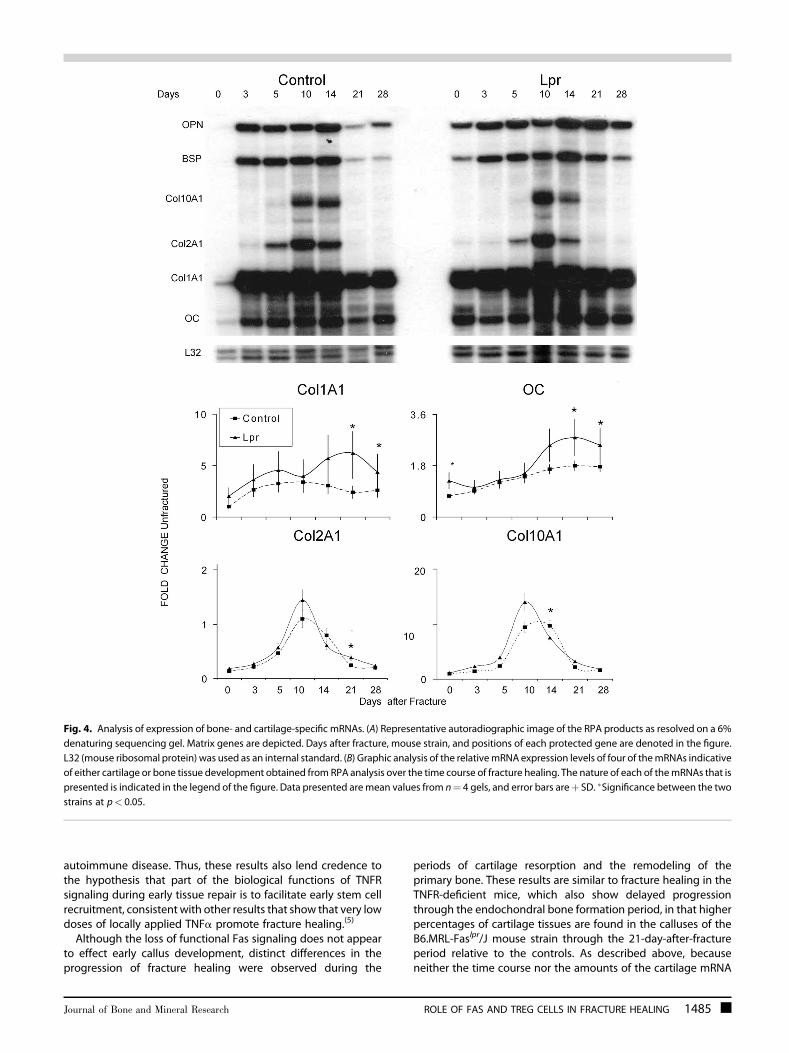
Molecular assessments of mRNA expression for a number offamilies of different genes were carried out to further determinehow the lpr mutation led to the changes in tissue compositionsthat were seen in the fracture specimens. The mRNA expressionthat encodes a group of extracellular matrix proteins, whichwould be indicative of both cartilage and bone development anddifferentiation, were assessed by RPA. A representative autora-diograph of an RPA of selected extracellular matrix proteinmRNAs across the time course of fracture healing is seen in Fig. 4.The graphic results for four of the expressed mRNAs that wereexamined by the RPA are shown at the bottom of the figure. Theexpression of all four bone‐associated mRNAs (type I collagen,osteocalcin, bone sialoprotein, and osteopontin) all showedincreased expression in B6.MRL‐Faslpr/J mice, with all of themhaving statistically higher levels of expression at 21 and 28 days
after fracture (p¼ 0.045). Intermediate‐ and early‐late‐stagemarkers of osteogenesis as determined by expression ofosteopontin and BSP also showed both an early (day 3) andlater peaks in expression (day 14) and also showed higher levelsof expression in the B6.MRL‐Faslpr/J on days 21 and 28.Chondrogenesis was assessed by examining the expression ofcollagen type II (Col2A1) and collagen type X (Col10A1). Both ofthese mRNAs peaked at day 10 in the control calluses, whereasthe Col10A1 peak was broader and lagged that of Col2A1 in theB6.MRL‐Faslpr/J calluses.
Assessment of tissue resorption and remodeling
Osteoclast numbers in the calluses were next examined as ameasure of tissue resorption and remodeling. Low‐magnificationimages of the total cross‐sectional areas of the callus provide aglobal qualitative assessment of number of osteoclasts withinthe tissue (Fig. 5A, upper panels). Although callus tissues fromboth the control and B6.MRL‐Faslpr/J strain had observableamounts of TRAP‐positive cells, the B6.MRL‐Faslpr/J strainappeared to show more activity. Higher magnifications showedindividual TRAP‐positive multinucleated cells both on surfaces ofnew primary bone as well as on the surfaces of mineralizedcartilage (Fig. 5B). Consistent with our previous studies, thegreatest number of osteoclasts were seen during the period ofresorption of the mineralized cartilage (day 14) and decreasedwith time (p< 0.0001), and this interaction between time andstrain was significant (p< 0.0024). The Tukey post hoc testshowed that the day 14 B6.MRL‐Faslpr/J strain had a higherosteoclast count than any of the other specimens that had beenanalyzed (Fig. 5C). An overall summary of all of the histomor-phometric measurements and indices and their statisticalsignificance is presented in Table 1.
A selected set of markers associated with the regulation andprogression of osteoclast differentiation were measured(Fig. 5D). The ratio of RANKL to OPG was determined becausethis ratio is the central factor that controls osteoclastogenesis.
Fig. 2. Results of the torsion tests. (Left panel) Comparison of torsional strength (in Nm) of the calluses from control and B6.MRL‐Faslpr/J mice at 21 and35 days after fracture and of contralateral femora from the two genotypes at matching time points. (Right panel) Comparison of torsional rigidity (inNmm2/rad) among these same groups. e¼ significance by strain. The error bar is� SD. Significance was at p< 0.05.
1482 AL‐SEBAEI ET AL. Journal of Bone and Mineral Research

During the initial periods of endochondral bone formation,there was no difference for the mRNA expression ratio in thetwo strains, but by day 10 the B6.MRL‐Faslpr/J showed a higherratio than observed in the controls and this higher ratio thenpersisted throughout the period of coupled remodeling ofprimary bone at 21 and 28 days after fracture. An assessment ofM‐CSF, the other major regulator of osteoclast development,showed a more prolonged period of later expression slightlypreceding and then paralleling the higher RANKL/OPG ratio.The fold change in both TRAP and calcitonin receptorexpression for both strains sharply increased at day 10, afterwhich the levels of expression remained elevated until day 21,when they began to return to its baseline. Although TRAPexpression levels were greater at 14 days in the B6.MRL‐Faslpr/Jthan the control, this difference was not significant. On theother hand, calcitonin receptor expression peaked earlier andwas lower in the control samples and was statistically higher atboth 21 and 28 days after fracture in the B6.MRL‐Faslpr/J strain(p< 0.05). It is interesting to note that because calcitoninreceptor expression is associated with fully mature osteoclasts,its more prolonged levels of expression would be suggestive
that these cells have a longer life span in the B6.MRL‐Faslpr/Jstrain.
Assessment of the inflammatory state and T‐cell activityduring endochondral bone formation
To assess if the autoimmune phenotype of the B6.MRL‐Faslpr/Jstrain affected endochondral bone formation or bone turnoverduring fracture healing, several different pro‐ and anti‐inflammatory cytokines that have been shown to have alteredexpression during an active autoimmune state were assessed(Fig. 6A). As expected, these data showed that the expressionof TNF‐a, IL‐1b, and IL‐17F all were constitutively higher in theB6.MRL‐Faslpr/J. In contrast, cytokines that would prevent the Tcells from progressing to a Th1 phenotype (IL‐10, IL‐17A) wereelevated in the mutant mice, whereas those that have beenshown to inhibit Th17 development toward an iTreg (IL‐6 IL‐23) also showed diminished initial induction after fracture inthe B6.MRL‐Faslpr/J mice.(29) Using CD4 as a general assess-ment of T cell numbers also showed lower levels of CD4 mRNAinitially after fracture in the wild‐type mice. A comparison of
Fig. 3. Histological analysis of fracture calluses at days 14 and 21 days after fracture (safranin‐O and fast green). (A) Representative micrographs from 14and 21 days after fracture. (Top panel) Composite images of fracture calluses (�100 magnification). (B) Representative micrographs of trabecular andmedullary tissues at 21 days after fracture (�200magnification). (C) Graphic analysis showing the total callus area, total cartilage area, and total bone areasinmm2 as calculated from the histomorphometric analysis for the control and B6.MRL‐Faslpr/J strains at days 14 and 21 days after fracture. Themean valuefrom 5 representative sections per callus (a total of 5 calluses were used per time point) are shown. The error bar is� SD. Group differences are as denotedin Fig. 1. Statistical comparisons between strains times and interactions are as denoted by letters and are as presented in Figure legends 1 and 2.Significance was at p< 0.05.
Journal of Bone and Mineral Research ROLE OF FAS AND TREG CELLS IN FRACTURE HEALING 1483

these cytokine patterns across the time course of fracturehealing further showed that there was reciprocal down-regulation and upregulation of the cytokines that drive Th1and iTreg differentiation, respectively, during the period ofcartilage formation in both B6.MRL‐Faslpr/J and wild‐typecallus tissues.
As a second assessment of the autoimmune state, FACSanalysis was performed to determine the T‐cell subsetdistribution in the spleen and femora at both the baselinebefore fracture and at 10 days after fracture. At the later timepoint, contralateral femora were further compared with thecallus tissues of the fractured bones. These results revealed thatB6.MRL‐Faslpr/J mice had higher levels of Treg cells within boththe bone and spleen at baseline before fracture (Fig. 6B, C). Inboth wild‐type mice and B6.MRL‐Faslpr/J mice, fractureappeared to systemically increase Treg percentages, �60%and �30%, respectively, within both the fractured andcontralateral femur (Fig. 6B) while having no effect on thenumbers of these cells in the spleen (Fig. 6C, SupplementalFig. S1). The percentage of activated T cells in the bone at thebaseline was less in B6.MRL‐Faslpr/J mice than in wild‐typemice.After fracture, the Treg levels decreased in the callus tissues ofthe wild‐type mice within the callus tissues while remainingunchanged in the B6.MRL‐Faslpr/J mice. Unlike Treg cells thatshowed systemic changes in the contralateral bones, thepercentage of activated T cells, as determined by CD69expression, remained unchanged for both wild‐type and B6.MRL‐Faslpr/J mice within the unfractured femur. Further, withinthe spleen, the percentage of activated T cells was alwayshigher in the B6.MRL‐Faslpr/J mice both at the baseline and at10 days after facture, and these levels are unchanged inresponse to fracture. Analysis of the percentage B cells in bonetissues showed no changes either between strains of mice or inresponse to fracture. In contrast, the percentage of these cells inthe spleen was less in the B6.MRL‐Faslpr/J mice at both thebaseline and after fracture (data not shown).
Assessment of tissue apoptosis
In the last analysis that is presented, a qualitative assessment ofthe number of cells that were primed to undergo apoptosis wascarried out using immunohistological staining for the expressionof caspase 3. We examined the callus tissues at 14 days afterfracture because both cartilage tissue and high levels ofosteoclasts were observed at this time (Fig. 7). An examinationof comparable areas of cartilage tissue in the B6.MRL‐Faslpr/J andwild‐type mice showed that there were many more chondro-cytes showing strong green fluorescent‐staining cells for thepresence of the capsase 3 in the wild‐type callus tissues than inthe B6.MRL‐Faslpr/J tissues. These images are depicted in theupper panels of the figure. We next carried out sequentialreactions first for TRAP and then with caspase 3. Thoseosteoclasts that showed colocalization with caspase 3 stainorange and are those osteoclasts that would be primed tounderage apoptosis. Like the chondrocytes, many more positiveosteoclasts were seen in the control samples. These images aredepicted in the lower panels of Fig. 7.
Discussion
Both similar and different features in the progression of fracturehealing were observed in mice deficient in Fas (B6.MRL‐Faslpr/J)in comparison to mice lacking TNFR signaling. Unlike fracturehealing in the absence of TNFR signaling, no delays in theinitiation of chondrogenesis was observed. These conclusionsare based on two findings: 1) there was no change in thetemporal expression of both chondrogenic and osteogenicmRNA expression levels found in the callus tissues of B6.MRL‐Faslpr/J mice at the earliest times points, suggestive that stem cellrecruitment was normal during the initial periods of fracturehealing; and 2) the callus tissues at day 14 in the B6.MRL‐Faslpr/Jmice were larger, which suggests that the formation of the initialtissue analogue was unaffected by this type of systemic
Table 1. Mean Values for the Histomorphometric Measurements and Indices
Measurement or index Control Day 14 Lpr Day 14 Control Day 21 Lpr Day 21
Total callus area (mm2)Mean 8.68 12.7 6.98 9.51SD 3.45 2.87 3.07 2.62Time p< 0.00001�
Strain p< 0.0001�
Time� strain p¼ 0.2040Percentage of bone per callusMean 0.123 0.062 0.236 0.076SD 0.071 0.0052 0.0403 0.0058Time 0.1292Strain 0.0096�
Time� strain 0.2389Percentage of cartilage per callusMean 0.065 0.224 0.002 0.007SD 0.011 0.011 0.0006 0.001Time p< 0.0001�
Strain p< 0.0001�
Time� Strain p< 0.0001�
The p values are shown for two‐way ANOVA with the effects of time, strain, and the interaction of time and strain.�Statistical significance at p< 0.05.SD¼ standard deviation; Control¼C57BL/B6; lpr¼ B6.MRL/Faslpr/J.
1484 AL‐SEBAEI ET AL. Journal of Bone and Mineral Research
autoimmune disease. Thus, these results also lend credence tothe hypothesis that part of the biological functions of TNFRsignaling during early tissue repair is to facilitate early stem cellrecruitment, consistent with other results that show that very lowdoses of locally applied TNFa promote fracture healing.(5)
Although the loss of functional Fas signaling does not appearto effect early callus development, distinct differences in theprogression of fracture healing were observed during the
periods of cartilage resorption and the remodeling of theprimary bone. These results are similar to fracture healing in theTNFR‐deficient mice, which also show delayed progressionthrough the endochondral bone formation period, in that higherpercentages of cartilage tissues are found in the calluses of theB6.MRL‐Faslpr/J mouse strain through the 21‐day‐after‐fractureperiod relative to the controls. As described above, becauseneither the time course nor the amounts of the cartilage mRNA
Fig. 4. Analysis of expression of bone‐ and cartilage‐specific mRNAs. (A) Representative autoradiographic image of the RPA products as resolved on a 6%denaturing sequencing gel. Matrix genes are depicted. Days after fracture, mouse strain, and positions of each protected gene are denoted in the figure.L32 (mouse ribosomal protein) was used as an internal standard. (B) Graphic analysis of the relativemRNA expression levels of four of themRNAs indicativeof either cartilage or bone tissue development obtained from RPA analysis over the time course of fracture healing. The nature of each of themRNAs that ispresented is indicated in the legend of the figure. Data presented aremean values from n¼ 4 gels, and error bars areþ SD. �Significance between the twostrains at p< 0.05.
Journal of Bone and Mineral Research ROLE OF FAS AND TREG CELLS IN FRACTURE HEALING 1485

expression were initially different, the greater accumulation incartilage tissues was not the result of greater levels of cartilagedevelopment. The statistically higher levels of type X collagenmRNA expression at day 14 after fracture also suggest that thechondrocyte remained in a viable hypertrophic state for a longerperiod. These results are similar to our previous finding for micelacking TNFR signaling that showed that increased cartilagecontents were the result of delayed cartilage resorption. Suchresults are consistent with the results that showed a smallernumber of chondrocyets stained for caspase 3, which correlateswith the suggestion that loss of Fas leads to delayed cartilageapoptosis. Although loss of Fas signaling delayed cartilageresorption, these tissues were eventually removed, suggestingthat Fas independently acts in parallel with TNFa to mediateapoptosis, which would be consistent with the persistent higherlevels of TNFa expression found in the B6.MRL‐Faslpr/J mousestrain. Alternatively, both these extrinsic death receptors may beworking in tandemwith other intrinsicmechanisms thatmediatechondrocyte apoptosis. In this regard, it is of interest to note thatchondrocyte apoptosis during hypertrophic development also
appears to be mediated by activation of intrinsic mitochondriamechanisms(30) in which mitochondrial DNA damage andintrinsic activation of apoptosis is caused by pro‐inflammatorycytokines in human OA chondrocytes.(31)
In contrast to the delayed resorption of the cartilage tissueswithin the callus, both histological and micro‐CT analysis of thecallus tissues at later times showed statistically decreasedamounts of accumulated mineralized bone tissues. The assess-ment of the biological mechanisms that mediated the dimin-ished accumulation of bone showed that this was attributable toincreased bone turnover. This conclusion was based both on thesignificantly higher numbers of TRAP‐positive multinucleatedcells that lined the bone and mineralized cartilage surfaces in B6.MRL‐Faslpr/J fracture calluses and the greater levels of expressedosteoclast mRNAs. Because themeasured area of bonewas lowerin the B6.MRL‐Faslpr/J strain, the amount of osteoclasts per areaof bone and cartilage was even more exaggerated in B6.MRL‐Faslpr/J than control calluses. These results suggest that optimalmineralized cartilage resorption must either be linked tochondrocyte apoptosis or be inhibited by viable chondrocytes.
Fig. 5. Analysis of osteoclast activity in fracture calluses. (A) Panoramic histological assessments of local osteoclast activity within callus tissues based onTRAP 5b staining within 14‐ and 21‐day callus tissues. Composite images of fracture calluses (�40 magnification). (B) Osteoclast morphology on bone/cartilage surface for each strain of mouse (�400 magnification). (C) Osteoclast counts per unit total callus area. Osteoclast counts were determined asdescribed inMaterials andMethods. Numbers are presented per average area of entire callus and per area of bone surface. (D) Analysis of the expression ofosteoclast and proresorptive cytokinemRNAs. Graphical representation of the temporal patterns and relative levels ofmRNA expression for variousmRNAsassociated with osteoclasts and the regulation of their expression. mRNA expression levels were determined by qRT‐PCR. Days after fracture is denoted,and strain of mice is the same as denoted in the legend in Fig. 4. The nature of eachmRNA that is assessed is indicated in the figure. The overall expressionof RANKL andOPG are not presented, rather the ratio of the expression of thesemRNAs. Data presented aremean values from n¼ 6 replicates determinedfrom two pools of mRNAs per time point. The error bars areþ SD. �Significance between the two strains at p< 0.05.
1486 AL‐SEBAEI ET AL. Journal of Bone and Mineral Research

This conclusion is consistent with recent findings that show thatcartilage destruction in polychondritis is induced not only byperichondral inflammation but also by the expression ofproteolytic enzymes by the chondrocytes themselves inassociation with the induction of apoptosis.(32) Our results wouldalso be consistent with this finding and further suggest thatproteolytic completion of the mineralized cartilage resorptiontakes place only when the chondrocytes undergo theirapoptosis. In addition, these results suggest that mineralizedcartilage resorption must be only partially mediated byosteoclasts given that these cells show no delay in theirrecruitment in the B6.MRL‐Faslpr/J fracture calluses and areactually present in greater numbers in themutant mouse tissues.The comparison of the control and B6.MRL‐Faslpr/J mice
fracture suggests that the remodeling phases in which primarybone was being replaced were greatly elevated. This conclusionwas based both on multiple findings, including the histologicalanalysis of the trabecular bone parameters in B6.MRL‐Faslpr/Jcalluses, which had fewer trabeculae that were thinner with anoverall greater spacing (more porous); the diminished bio-
mechanical competency of the B6.MRL‐Faslpr/J calluses at35 days after fracture; and the elevated numbers of TRAP‐positivemultinucleated cells that were found at later times in thecallus tissues. It is interesting to note that the increased numbersof TRAP‐positive cells were accompanied by a consistentlyelevated level of mRNA expression for all of the osteoblastmarkers that we assayed, including those for both early (Col1a1,OPN) and later (BSP, OC) marker genes for osteoblast differenti-ation. There was no evidence, though, of increased osteoidproduction, suggesting that either the osteogenic cells areexpressing higher levels of their gene products or that these cellsare rapidly turning over and do not form substantial amounts ofnew osteoid. This later conclusion is consistent with recentstudies that have shown that most osteoblast cells are relativelyshort lived and that they arise from an actively mitotic stem cell/progenitor pool.(33)
Separatemechanisms effecting both initial osteoclastogenesisand prolongation of osteoclast activity and life span may beevoked for the greater numbers of osteoclasts, which wereobserved in the B6.MRL‐Faslpr/J mouse. Data consistent with
Fig. 6. Assessments of inflammatory state and T‐cell activity. (A) Graphical representation of the expression of the temporal patterns and relative levels ofmRNA expression of select pro‐ inflammatory and T‐cell regulatory cytokines as determined by qRT‐PCR. Days after fracture are denoted, and strain ofmiceis the same as denoted in Fig. 4. The nature of each mRNA that is assessed is indicated in the figure. Data presented are mean values from n¼ 6 replicatesdetermined from two pools of mRNAs per time point. The error bars areþ SD of the 6 replicates from the two pools. �Significance between the two strainsfor that time point p< 0.05 based on the comparisons of the replicates. (B) Flow cytometric analysis of Tregs and activated T cells in femoral bones atbaseline before fracture and in both the contralateral (Cntl) unfractured and fracture (Fx) bone at 10 days after fracture. Tregs were identified as thepercentage of CD25þ Foxp3þ of all live CD3þCD4þ cells, and activated T cells were percentage CD69þ of all CD3þCD4þ cells. Intragroup:�difference (p< 0.05) at day 0 and after‐fracture day 10 in either WT or LPR strains. Intergroup: #difference in mice between WT and LPR strains. (C) Flowcytometric analysis of Tregs and activated T cells in spleens at baseline before fracture and at 10 days after fracture in both WT and LPR strains. Gatingstrategy and labeling are the same as in (B). A complete summary of the findings for the ANOVA statistical analysis of these data is presented inSupplemental Tables S3–S5.
Journal of Bone and Mineral Research ROLE OF FAS AND TREG CELLS IN FRACTURE HEALING 1487

greater levels of initial osteoclastogenesis are related to both theearlier and higher levels of TRAP mRNA expression that wereobserved in the callus tissues for the B6.MRL‐Faslpr/J mouse. It isinteresting to note as well the consistent and statistically higherlevels of TNFa mRNA expression and RANKL to OPG ratios thatwere observed in mutant mice. Mechanistic studies have shownthat TNFa is a proresorption cytokine that leads to bonedestruction,(34) with some studies showing TNFa inducing boneresorption via its indirect stimulation of both RANKL and M‐CSFwith commensurate downregulation in OPG expression.(35–37)
Other mechanisms have shown that pathologically high TNFalevels lead to direct induction of osteoclastogenesis at the levelof blood osteoclast precursors (OCP),(38) whereas other studieshave shown that high levels of TNFa directly increases TRAP‐positive cells in vitro.(39,40) In context of themouse lprmutation, itis interesting to note that loss of Fas antigen receptor leads to thedevelopment of toxic shock syndrome much faster than innormal mice,(41) with increased expression of TNFa and anumber of other pro‐inflammatory cytokines.(42) The direct roleof Fas/FasL system in osteoclastogenesis and in mediation ofosteoclast apoptosis has now been shown in numerous studies.The interaction of FasL and Fas on osteoclast precursors wasshown to increase osteoclastogenesis.(43) In many other studies,the role of Fas/FasL system has been shown to be crucial inmediating apoptosis in osteoclasts and controlling the longevityof osteoclasts,(44,45) whereas other studies have shown thatinduction of Fas by estrogen is a central protective elementagainst the development of bone loss in female animals.(10,46)
Abnormalities in the immune cell function have long beenassociated with osteolytic bone conditions such as rheumatoidarthritis. An assessment of both T‐cell activation and T regulatorycells in the wild‐type and B6.MRL‐Faslpr/J mice was carried out toelucidate the role of T‐cell subsets during cartilage resorptionand bone remodeling. The findings of this study suggest B6.MRL‐Faslpr/J mice have an active autoimmune state based on thehigher percentage of activated T cells and Treg cells in both thespleen and bones at the baseline before fracture. It is interestingto note, however, during the period of active cartilage tissueformation after fracture that the percentage of Treg cells wassystemically increased specifically in bone tissues based on theirincreased numbers within both fractured and unfractured bones.In contrast, the percentage of these cells remained unchanged inthe spleen. These findings taken together with the 100‐ to 200‐fold induction of IL‐17A suggest that these cells are specificallyiTreg cells and that cartilage formation produces factors thatpromote their formation within bone tissues. This interpretationis further consistent with the decreased or unchanged numbersof activated T cells in callus tissues in the either wild‐type or B6.MRL‐Faslpr/J mice, respectively. In this context, these results aresimilar to the paradoxical findings showing diminished cartilagedestruction in a collagen‐induced arthritis (CIA) model compar-ing DBA‐lpr/lpr with DBA wild‐type mice, even though thesemice have a more robust inflammatory state. These authorsconcluded that the lack of the expected severe disease in DBA‐lpr/lpr mice is because of a local attenuating effect of the Fasmutation in pathological processes involving resident joint cells.They further attributed this to alterations in either synovial cellsor T‐cell populations in the joint and not to the role that Fas playsin mediation of chondrocyte apoptosis.(47) Such findings inconjunction with ours suggest that within cartilage tissues, iTregcells are protective to cartilage tissue destruction.
Our results also match most of the findings of Nam andcolleagues,(48) who examined fracture healing in Rag1‐/‐ mice
Fig. 7. Immunohistological analyses of chondrocyte and osteoclastswithin 14‐day callus tissues that show caspase 3 reactivity. Underfluorescent excitation, caspase antibody staining is bright green and redblood cells are autofluorescent and appear as small bright green cells,whereas backgrounds appear as defuse light green. DAPI staining isbright blue and stains the nuclei of cells. Under fluorescent excitation,TRAP staining is red and double‐stained cells with caspase stain orange.Under light field, TRAP cells appear as pink‐red cells. (Upper panels)Sequential set of micrographs showing fluorescent images of chon-drocytes that are reactive with anti‐caspase 3 antibody in control (CON)and Lpr strain of mice (LPR). A low‐magnification fluorescent image andhigher‐magnification image from the same field superimposing thefluorescent on light level photomicrograph are presented. Cells were co‐reacted with DAPI to identify the nuclei of the individual cells in themicrographs. (Lower panels) Sequential set of micrographs showing lightlevel and fluorescent images of TRAP‐positive osteoclasts. Those cellsthat are reactive with anti‐caspase 3 antibody are stained orange, andborders of these cells show a green edge. Cells were co‐stainedwith DAPIto identify the individual cells in the micrographs. Magnification isindicated in each image.
1488 AL‐SEBAEI ET AL. Journal of Bone and Mineral Research

that have deficient T‐ and B‐cell function. Although our resultsshowed similar increases in the expression of IL‐6, IL‐23, and IL‐10in the wild‐type mice immediately after fracture, we did not seeinitial elevation in IL‐17F at 3 days after fracture. With theexception of TNFa, our findings showed decreased expressionfor these pro‐inflammatory cytokines in B6.MRL‐Faslpr/J similar tothat seen in the Rag1‐/‐ mice. Although these results wouldappear contradictory in relationship to an active autoimmunestate, they would be consistent with the increased percentagesof iTreg cells and be suggestive of a compensatory response tothe systemic autoimmunity during cartilage tissue formation. Inthis regard, recent studies by Adamik and colleagues(49) showedthat PGE2 and IL‐23 plus IL‐1b differentially regulate Th17cytokine expression and synergize to induce IL‐17A but not IL‐17F, whereas IL‐23 plus IL‐1b in the absence of PGE2preferentially induce IL‐17F expression. Consistent with theseobserved combinations of cytokines that differentially regulatethe expression of IL‐17A and IL‐17F are the findings from ourprior studies that have shown that both Cox2 expression levelsand PGE2 levels in the callus are induced during the period ofcartilage tissue formation.(50,51)
It is interesting to note that one of the major complications inSLE patients is osteoporosis.(52) The data from our studies areconsistent with human studies that have shown significanttrabecular and cortical bone loss,(53) as well as other studies thathave shown osteoporotic vertebral fractures in up to 20% ofpatients with SLE.(54) Other studies have found an associationbetween SLE disease damage and low bone mineral density(BMD) T‐scores.(55) Although many of these studies are carriedout in patients with prolonged SLE, a question of the etiology ofthe osteoporotic disease is related to the use of glucocorticoidsand cyclophosphamide to manage these diseases that bythemselves lead to bone loss.(52) In light of the question of theactions of these therapeutics on bone loss independent of theprimary actions of SLE, our animal studies would suggest thatthe systemic SLE pathology itself leads to elevated turnover ofbone because our animals do not receive any type ofpharmacological treatments during the course of their bonehealing. In this regard, our findings, as they relate to the elevatedexpression of IL‐17F at later periods after cartilage resorptionwhen only coupled bone remodeling is taking place, areconsistent with a high turnover state of osteoporosis. This isbased on recent findings of Nam and colleagues,(48) whoshowed that IL‐17F is highly stimulatory of osteogenesis, as wellas other studies that show that it supports osteoclastogenesis bythe stimulation of mesenchymal and osteoblast production ofRANKL and M‐CSF.(56) This conclusion is also consistent with anumber of recent studies that have shown that patients whohave never received glucocorticoids were observed to have alower hip bone mineral density than controls, suggesting thatSLE per se might induce bone loss.(53) Finally, similar conclusionsas ours on the primary actions of the SLE on loss were reached indevelopmental studies within this same mouse model (B6.MRL‐Faslpr/J) as we are using, which showed that these animalsdeveloped low bone mass index phenotype,(57) although themolecular mechanism that led to low bone mass had not beenidentified in these early studies.In conclusion, our data show that loss of Fas activity does not
effect endochondral bone formation. Although the number ofTRAP‐positive cells per area of bone and cartilage was greater inthe B6.MRL‐Faslpr/J, the rate of cartilage resorption wascodependent on chondrocyte apoptosis. During the later periodsof coupled remodeling of the primary bone, the B6.MRL‐Faslpr/J
fracture calluses are weaker andmore porous. This correspondedto a higher ratio of RANKL/OPG at after‐fracture days 21 and 28.We determined there were both higher osteoclast activity in theB6.MRL‐Faslpr/J and more osteoblast activity based on moreexpression of extracellular matrix proteins at later stages in thefracture repair. We conclude from these data that there was astate of high‐turnover osteoporosis occurring in the B6.MRL‐Faslpr/J mouse.
Disclosures
All authors state that they have no conflicts of interest.
Acknowledgments
The authors thank Lee Silkman and Zachary Mason for theirexcellent technical assistance in the postoperative care of miceand in assistance in micro‐CT analysis. We acknowledge theassistance of the Flow Cytometry Core Facility at the BU School ofMedicine, where the flow cytometry analysis reported in thisarticle was performed. We also thank Dr Amira Hussien forassistance with the statistical analysis.
Research reported in this publication was supported by theNational Institute of Arthritis and Musculoskeletal and SkinDiseases of the National Institutes of Health under award no. AR47045 (LCG) and PO1 AR049920 (TAE). The content is solely theresponsibility of the authors and does not necessarily representthe official views of the National Institutes of Health. Institutionalsupport was provided by the Department of OrthopaedicSurgery of Boston University School of Medicine and by BostonUniversity School of Medicine.
Authors’ roles: Study design: LCG, DG, ACB, TEA, and EFM. Datacollection: MAS, DD, ACB, DC, NAW, and SK. Data analysis: MAS,DC, DG, and ACB. Data interpretation: MAS, ACB, DG, EFM, andLCG. Drafting manuscript: MAS and LCG. Revising manuscript:EFM, ACB, and LCG. Study conduct: LCG and EFM. Approving finalversion: EFM and LCG.
References
1. Kon T, Cho TJ, Aizawa T, et al. Expression of osteoprotegerin, receptoractivator of NF‐kappaB ligand (osteoprotegerin ligand) and relatedproinflammatory cytokines during fracture healing. J BoneMiner Res.2001;16(6):1004–14.
2. Gerstenfeld LC, Cho TJ, Kon T, et al. Impaired fracture healing in theabsence of TNF‐alpha signaling: the role of TNF‐alpha in endochon-dral cartilage resorption. J Bone Miner Res. 2003;18(9):1584–92.
3. Lehmann W, Edgar CM, Wang K, et al. Tumor necrosis factor alpha(TNF‐alpha) coordinately regulates the expression of specific matrixmetalloproteinases (MMPS) and angiogenic factors during fracturehealing. Bone. 2005;36(2):300–10.
4. Gerstenfeld LC, Cho TJ, Kon T, et al. Impaired intramembranous boneformation during bone repair in the absence of tumor necrosis factor‐alpha signaling. Cells Tissues Organs. 2001;169(3):285–94.
5. Glass GE, Chan JK, Freidin A, Feldmann M, Horwood NJ, Nanchahal J.TNF‐alpha promotes fracture repair by augmenting the recruitmentand differentiation ofmuscle‐derived stromal cells. Proc Natl Acad SciUSA. 2011;108(4):1585–90.
6. Cho TJ, Lehmann W, Edgar C, et al. Tumor necrosis factor alphaactivation of the apoptotic cascade in murine articular chondrocytesis associated with the induction of metalloproteinases and specificpro‐resorptive factors. Arthritis Rheum. 2003;48(10):2845.
7. Wallach D, Varfolomeev EE, Malinin NL, Goltsev YV, Kovalenko AV,Boldin MP. Tumor necrosis factor receptor and Fas signalingmechanisms. Annu Rev Immunol. 1999;17:331–3367.
Journal of Bone and Mineral Research ROLE OF FAS AND TREG CELLS IN FRACTURE HEALING 1489

8. Bazzoni F, Beutler B. The tumor necrosis factor ligand and receptorfamilies. N Engl J Med. 1996;334(26):1717–25.
9. Eugster HP, Muller M, LeHir M. Immunodeficiency of tumor necrosisfactor and lymphotoxin‐alpha double deficient mice. In: Durum S,Muegge K, editors. Cytokine knockouts. Totowa (NJ): Humana Press;p. 103–27. 1998.
10. Nakamura T, Imai Y, Matsumoto T, et al. Estrogen prevents bone lossvia estrogen receptor alpha and induction of Fas ligand inosteoclasts. Cell. 2007;130(5):811–23.
11. Wu X, Pan G, McKenna MA, Zayzafoon M, Xiong WC, McDonald JM.RANKL regulates Fas expression and Fas‐mediated apoptosis inosteoclasts. J Bone Miner Res. 2005;20(1):107–16.
12. Gibson G. Active role of chondrocyte apoptosis in endochondralossification. Microsc Res Tech. 1998;43(2):191–204.
13. Roach HI, Erenpreisa J, Aigner T. Osteogenic differentiation ofhypertrophic chondrocytes involves asymmetric cell divisions andapoptosis. J Cell Biol. 1995;131(2):483–94.
14. Hashimoto S, Setareh M, Ochs RL, Lotz M. Fas/Fas ligand expressionand induction of apoptosis in chondrocytes. Arthritis Rheum.1997;40(10):1749–55.
15. Aizawa T, Kokubun S, Tanaka Y. Apoptosis and proliferation ofgrowth plate chondrocytes in rabbits. J Bone Joint Surg Br. 1997;79(3):483–6.
16. Lee FY, Choi YW, Behrens FF, DeFouw DO, Einhorn TA. Programmedremoval of chondrocytes during endochondral fracture healing. JOrthop Res. 1998;16(1):144–50.
17. Aizawa T, Kon T, Einhorn TA, Gerstenfeld LC. Induction of apoptosis inchondrocytes by tumor necrosis factor‐alpha. J Orthop Res.2001;19(5):785–96.
18. Chu JL, Drappa J, Parnassa A, Elkon KB. The defect in Fas mRNAexpression in MRL/lpr mice is associated with insertion of theretrotransposon. ETn. J Exp Med. 1993;178(2):723–30.
19. Watanabe‐Fukunaga R, Brannan CI, CopelandNG, Jenkins NA, NagataS. Lymphoproliferation disorder in mice explained by defects in Fasantigen that mediates apoptosis. Nature. 1992;356(6367):314–7.
20. Furukawa F, Kanauchi H, Wakita H, et al. Spontaneous autoimmuneskin lesions of MRL/n mice: autoimmune disease‐prone geneticbackground in relation to Fas‐defect MRL/1pr mice. J InvestDermatol. 1996;107(1):95–100.
21. Alexander EL, Moyer C, Travlos GS, Roths JB, Murphy ED. Twohistopathologic types of inflammatory vascular disease in MRL/Mpautoimmune mice. Model for human vasculitis in connective tissuedisease. Arthritis Rheum. 1985;28(10):1146–55.
22. Kelley VE, Roths JB. Interaction of mutant lpr gene with backgroundstrain influences renal disease. Clin Immunol Immunopathol.1985;37(2):220–9.
23. Jepsen KJ, Price C, Silkman LJ, et al. Genetic variation in the patternsof skeletal progenitor cell differentiation and progression duringendochondral bone formation affects the rate of fracture healing. JBone Miner Res. 2008;23(8):1204–16.
24. Morgan EF, Mason ZD, Chien KB, et al. Micro‐computed tomographyassessment of fracture healing: relationships among callus structure,composition, and mechanical function. Bone. 2009;44(2):335–44.
25. Gerstenfeld LC, Alkhiary YM, Krall EA, et al. Three‐dimensionalreconstruction of fracture callus morphogenesis. J HistochemCytochem. 2006;54(11):1215–28.
26. Parfitt AM, Drezner MK, Glorieux FH, et al. Bone histomorphometry:standardization of nomenclature, symbols, and units. Report of theASBMR Histomorphometry Nomenclature Committee. J Bone MinerRes. 1987;2(6):595–610.
27. Wang K, Vishwanath P, Eichler GS, et al. Analysis of fracture healing bylarge‐scale transcriptional profile identified temporal relationshipsbetween metalloproteinase and ADAMTS mRNA expression. MatrixBiol. 2006;25(5):271–81.
28. Cho TJ, Gerstenfeld LC, Einhorn TA. Differential temporal expressionof members of the transforming growth factor beta superfamilyduring murine fracture healing. J Bone Miner Res. 2002;17(3):513–20.
29. Basu R, Hatton RD, Weaver CT. The Th17 family: flexibility followsfunction. Immunol Rev. 2013;252(1):89–103.
30. Miedlich SU, Zalutskaya A, Zhu ED, Demay MB. Phosphate‐inducedapoptosis of hypertrophic chondrocytes is associated with adecrease in mitochondrial membrane potential and is dependentupon Erk1/2 phosphorylation. J Biol Chem. 2010;285(24):18270–5.
31. Kim J, Xu M, Xo R, et al. Mitochondrial DNA damage is involved inapoptosis caused by pro‐inflammatory cytokines in human OAchondrocytes. Osteoarthritis Cartilage. 2010;18(3):424–32.
32. Ouchi N, Uzuki M, Kamataki A, Miura Y, Sawai T. Cartilage destructionis partly induced by the internal proteolytic enzymes and apoptoticphenomenon of chondrocytes in relapsing polychondritis. JRheumatol. 2011;38(4):730–7.
33. Park D, Spencer JA, Koh BI, et al. Endogenous bone marrowMSCs aredynamic, fate‐restricted participants in bone maintenance andregeneration. Cell Stem Cell. 2012;10(3):259–72.
34. Iqbal J. Does TNF have anti‐osteoclastogenic actions? Ann NY AcadSci. 2006;1068:234–9.
35. Kaplan DL, Eielson CM, Horowitz MC, Insogna KL, Weir EC. Tumornecrosis factor‐alpha induces transcription of the colony‐stimulatingfactor‐1 gene inmurineosteoblasts. J Cell Physiol. 1996;168(1):199–208.
36. Cenci S, Weitzmann MN, Roggia C, et al. Estrogen deficiency inducesbone loss by enhancing T‐cell production of TNF‐alpha. J Clin Invest.2000;106(10):1229–37.
37. Zhang YH, Heulsmann A, Tondravi MM, Mukherjee A, Abu‐Amer Y.Tumor necrosis factor‐alpha (TNF) stimulates RANKL‐inducedosteoclastogenesis via coupling of TNF type 1 receptor and RANKsignaling pathways. J Biol Chem. 2001;276(1):563–8.
38. Yao Z, Li P, Zhang Q, et al. Tumor necrosis factor‐alpha increasescirculating osteoclast precursor numbers by promoting theirproliferation and differentiation in the bone marrow through up‐regulation of c‐Fms expression. J Biol Chem. 2006;281(17):11846–55.
39. Lam J, Takeshita S, Barker JE, Kanagawa O, Ross FP, Teitelbaum SL.TNF‐alpha induces osteoclastogenesis by direct stimulation ofmacrophages exposed to permissive levels of RANK ligand. J ClinInvest. 2000;106(12):1481–8.
40. Li P, Schwarz EM, O’Keefe RJ, et al. Systemic tumor necrosis factoralpha mediates an increase in peripheral CD11b high osteoclastprecursors in tumor necrosis factor alpha‐transgenic mice. ArthritisRheum. 2004;50(1):265–76.
41. Cullen CM, Bonventre PF, Heeg H, Bluethmann H, Mountz JD,Edwards CK 3rd. A fas antigen receptor mutation allowsdevelopment of toxic shock syndrome toxin‐1‐induced lethal shockin V beta 8.2 T‐cell receptor transgenic mice. Pathobiology. 1995;63(6):293–304.
42. Anam K, Amare M, Naik S, Szabo KA, Davis TA. Severe tissue traumatriggers the autoimmune state systemic lupus erythematosus in theMRL/þþ lupus‐prone mouse. Lupus. 2009;18(4):318–31.
43. Park H, Jung YK, Park OJ, Lee YJ, Choi JY, Choi Y. Interaction of Fasligand and Fas expressed on osteoclast precursors increasesosteoclastogenesis. J Immunol. 2005;175(11):7193–201.
44. Roux S, Lambert‐Comeau P, Saint‐Pierre C, LepineM, Sawan B, ParentJL. Death receptors, Fas and TRAIL receptors are involved in humanosteoclast apoptosis. Biochem Biophys Res Commun. 2005;333(1):42–50.
45. Imai Y, Youn MY, Kondoh S, et al. Estrogens maintain bone massby regulating expression of genes controlling function and life span inmature osteoclasts. Ann NY Acad Sci. 2009;1173(Suppl 1):E31–9.
46. Krum SA, Miranda‐Carboni GA, Hauschka PV, Carroll JS, Lane TF,Freedman LP, Brown M. Estrogen protects bone by inducing Fasligand in osteoblasts to regulate osteoclast survival. EMBO J. 2008;6;27(3):535–45.
47. Hoang Tu‐Rapp H, Hammermüller A, Mix E, et al. Aproinflammatoryrole for Fas in joints of mice with collagen‐induced arthritis. ArthritisRes Ther. 2004;6(5):R404–14.
48. Nam D, Mau E, Wang Y, et al. T‐lymphocytes enable osteoblastmaturation via IL‐17F during the early phase of fracture repair. PLoSOne. 2012;7(6):e40044.
49. Adamik J, Henkel M, Ray A, Auron PE, Duerr R, Barrie A. The IL17A andIL17F loci have divergent histone modifications and are differentiallyregulated by prostaglandin E2 in Th17 cells. Cytokine. 2013;64(1):404–12.
1490 AL‐SEBAEI ET AL. Journal of Bone and Mineral Research

50. Gerstenfeld LC, Thiede M, Seibert K, et al. Differential inhibition offracture healing by non‐selective and cyclooxygenase‐2 selectivenon‐steroidal anti‐inflammatory drugs. J Orthop Res. 2003;21(4):670–5.
51. Gerstenfeld LC, Al‐Ghawas M, Alkhiary YM, et al. Selective andnonselective cyclooxygenase‐2 inhibitors and experimental fracture‐healing. Reversibility of effects after short‐term treatment J BoneJoint Surg Am. 2007;89(1):114–25.
52. Lane NE. Therapy insight: osteoporosis and osteonecrosis in systemiclupus erythematosus. Nat Clin Pract Rheumatol. 2006;2(10):562–9.
53. Houssiau FA, Lefebvre C, Depresseux G, et al. Trabecular and corticalbone loss in systemic lupus erythematosus. Br J Rheumatol. 1996;35(3):244–7.
54. Bultink IE, Lems WF, Kostense PJ, Dijkmans BA, Voskuyl AE.Prevalence of and risk factors for low bone mineral density andvertebral fractures in patients with systemic lupus erythematosus.Arthritis Rheum. 2005;52(7):2044–50.
55. Lee C, Almagor O, Dunlop DD, et al. Disease damage and low bonemineral density: an analysis of women with systemic lupuserythematosus ever and never receiving corticosteroids. Rheumatol-ogy (Oxford). 2006;45(1):53–60.
56. Lee Y. The role of interleukin‐17 in bone metabolism andinflammatory skeletal diseases. BMB Rep. 2013;46(10):479–83.
57. Wu X, McKenna MA, Feng X, Nagy TR, McDonald JM. Osteoclastapoptosis: the role of Fas in vivo and in vitro. Endocrinology.2003;144(12):5545–55.
Journal of Bone and Mineral Research ROLE OF FAS AND TREG CELLS IN FRACTURE HEALING 1491