Embed Size (px)
Citation preview
Report No. CDOT-DTD-R-2005-6 Final Report DENSITY PROFILING OF ASPHALT PAVEMENTS Scott Shuler
June 2005 COLORADO DEPARTMENT OF TRANSPORTATION RESEARCH BRANCH

i
The contents of this report reflect the views of the author(s), who is (are) responsible for the
facts and accuracy of the data presented herein. The contents do not necessarily reflect the
official views of the Colorado Department of Transportation or the Federal Highway
Administration. This report does not constitute a standard, specification, or regulation.
ii
Technical Report Documentation Page
1. Report No. CDOT-DTD-R-2005-6
2. Government Accession No.
3. Recipient's Catalog No. 5. Report Date June 2005
4. Title and Subtitle DENSITY PROFILING OF ASPHALT PAVEMENTS
6. Performing Organization Code
7. Author(s) Scott Shuler
8. Performing Organization Report No. CDOT-DTD-R-2005-6
10. Work Unit No. (TRAIS)
9. Performing Organization Name and Address Colorado State University Ft. Collins, CO 80523-1584
11. Contract or Grant No. OE HAA 04HQ0000271
13. Type of Report and Period Covered Final Report
12. Sponsoring Agency Name and Address Colorado Department of Transportation - Research 4201 East Arkansas Ave. Denver, CO 80222 14. Sponsoring Agency Code
10.33 15. Supplementary Notes Prepared in cooperation with the US Department of Transportation, Federal Highway Administration
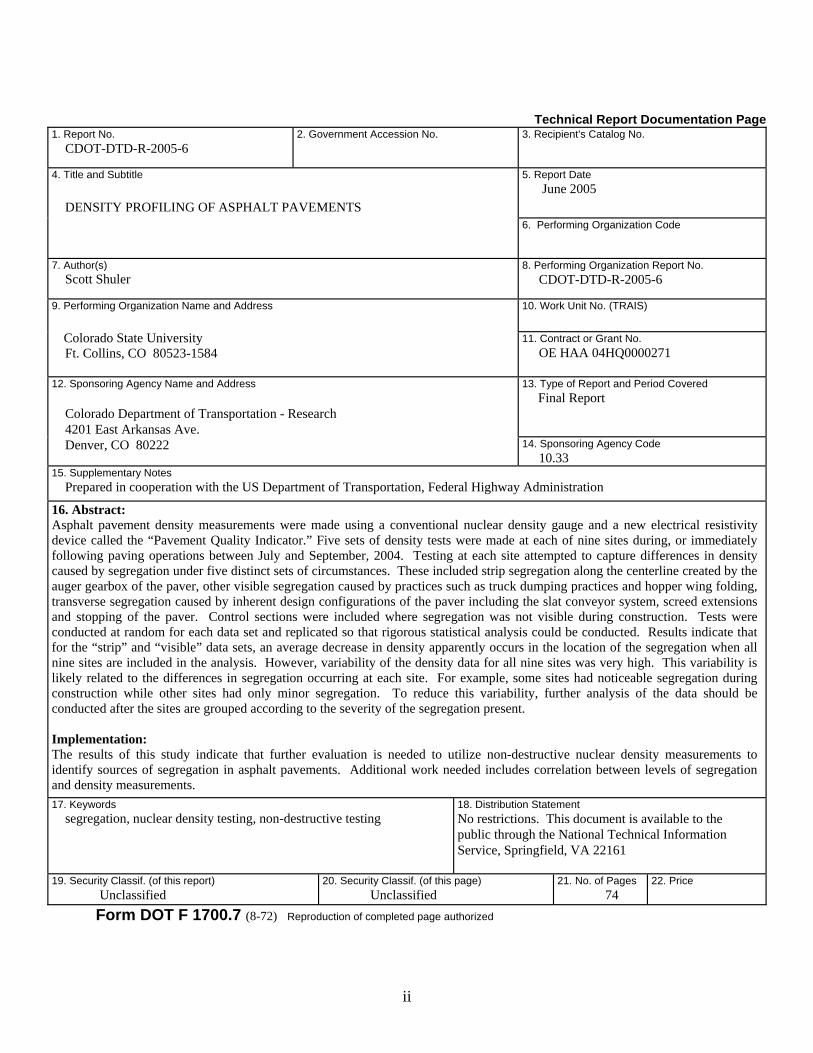
16. Abstract: Asphalt pavement density measurements were made using a conventional nuclear density gauge and a new electrical resistivity device called the “Pavement Quality Indicator.” Five sets of density tests were made at each of nine sites during, or immediately following paving operations between July and September, 2004. Testing at each site attempted to capture differences in density caused by segregation under five distinct sets of circumstances. These included strip segregation along the centerline created by the auger gearbox of the paver, other visible segregation caused by practices such as truck dumping practices and hopper wing folding, transverse segregation caused by inherent design configurations of the paver including the slat conveyor system, screed extensions and stopping of the paver. Control sections were included where segregation was not visible during construction. Tests were conducted at random for each data set and replicated so that rigorous statistical analysis could be conducted. Results indicate that for the “strip” and “visible” data sets, an average decrease in density apparently occurs in the location of the segregation when all nine sites are included in the analysis. However, variability of the density data for all nine sites was very high. This variability is likely related to the differences in segregation occurring at each site. For example, some sites had noticeable segregation during construction while other sites had only minor segregation. To reduce this variability, further analysis of the data should be conducted after the sites are grouped according to the severity of the segregation present. Implementation: The results of this study indicate that further evaluation is needed to utilize non-destructive nuclear density measurements to identify sources of segregation in asphalt pavements. Additional work needed includes correlation between levels of segregation and density measurements. 17. Keywords segregation, nuclear density testing, non-destructive testing
18. Distribution Statement No restrictions. This document is available to the public through the National Technical Information Service, Springfield, VA 22161
19. Security Classif. (of this report) Unclassified
20. Security Classif. (of this page) Unclassified
21. No. of Pages 74
22. Price
Form DOT F 1700.7 (8-72) Reproduction of completed page authorized
iii
DENSITY PROFILING OF ASPHALT PAVEMENTS
by
Scott Shuler, Colorado State University
Report No. CDOT-DTD-R-2005-6
Sponsored by the Colorado Department of Transportation
In Cooperation with the U.S. Department of Transportation Federal Highway Administration
June 2005
Colorado Department of Transportation Research Branch
4201 E. Arkansas Ave. Denver, CO 80222
(303) 757-9506

iv
ACKNOWLEDGEMENTS
The Colorado Department of Transportation and the Federal Highway Administration provided
funding for this study. Nuclear density testing was conducted by David Weld of the Research
Branch with help from Andrew Creteau of CSU Construction Management. Donna Harmelink
of CDOT Research was the original project manager providing much useful assistance in setting
up the project and guiding the field data collection until her retirement from CDOT in June,
2004. Substantial support was also provided by Roberto DeDios who took over the project upon
the departure of Donna Harmelink. Thank you all.
v
EXECUTIVE SUMMARY Segregation of aggregates in asphalt pavements is a common workmanship deficiency. When
segregation appears on the surface of the pavement, the texture of the paving mixture appears
more open with larger voids in the segregated areas. The result of this differential in voids is
often more infiltration of air and moisture into the pavement leading to premature raveling and
potholes.
This study was conducted to determine if nuclear density tests can be used to identify
segregation in asphalt pavements. The basis for this hypothesis is that the density of the asphalt
pavement in the area of the segregation is lower than the surrounding pavement. If this is true,
the nuclear density meter may be able to detect this lower density. Then, if the lower density of
the affected pavement areas are statistically different than surrounding areas, a specification may
be developed that utilizes the nuclear density meter to quantitatively detect segregation. This
specification would provide a measuring tool for an inspector so that qualitative judgment and
opinion are removed from the process for controlling paving quality with respect to segregation.
Asphalt pavement density measurements were made using a conventional nuclear density gauge
and a new type of non-destructive density meter called the “Pavement Quality Indicator.” Five
sets of density tests were made at each of the nine sites during, or immediately following paving
operations between July and September, 2004. Testing at each site attempted to capture
differences in density caused by segregation under five distinct sets of circumstances. These
included: strip segregation along the centerline created by the auger gearbox of the paver; other
visible segregation caused by practices such as truck dumping practices and hopper wing
folding; transverse segregation caused by inherent design configurations of the paver including
the slat conveyor system and screed extensions; and stopping of the paver. Control sections were
included where segregation was not visible during construction. Tests were conducted at random
for each data set and replicated so that statistical analysis could be conducted. Results indicate
that for the “strip” and “visible” data sets, an average decrease in density apparently occurs in the
location of the segregation when all nine sites are included in the analysis. However, variability
of the density data for all nine sites was high. This variability is likely related to the differences
in segregation occurring at each site. For example, some sites had noticeable segregation during
construction while other sites had only minor segregation which was difficult to detect visually.
vi
Analysis of variance (ANOVA) of the data indicates that statistically significant differences exist
in density for eight of nine locations of “strip” segregation, five of nine “visible” locations, six of
nine “stop” locations and all nine of the “paver” data sets. In addition, four of the nine “control”
data sets had statistically significant differences. Further analysis of the data should be
conducted after the sites are grouped according to the severity of the segregation present. If after
this re-analysis is conducted and the variability remains too high to develop a specification, a
controlled field experiment should be constructed where segregation can be generated at
differing levels and correlated to nuclear density measurements.
Implementation Statement This research should be considered preliminary. No implementation is recommended at this
time.
vii
TABLE OF CONTENTS 1.0 INTRODUCTION .............................................................................................................. 1 2.0 EXPERIMENT DESIGN.................................................................................................... 2 3.0 PROJECT LOCATIONS.................................................................................................... 5 4.0 MATERIALS...................................................................................................................... 6 5.0 PAVING EQUIPMENT ..................................................................................................... 7 6.0 TEST RESULTS................................................................................................................. 8 7.0 ANALYSIS......................................................................................................................... 8 8.0 CONCLUSIONS............................................................................................................... 22 9.0 RECOMMENDATIONS.................................................................................................. 23 10.0 REFERENCES ……………………………………………………………………….….24 Appendix A - Nuclear Density Test Results................................................................................ 25 Appendix B – ANOVA Nuclear Density Tests ............................................................................ 35 Appendix C – Averages of Test Results ....................................................................................... 51
viii
LIST OF FIGURES Figure 1. Density Groups Evaluated.............................................................................................. 3
Figure 2. Average of “Strip” Density Data for All Sites ............................................................... 9
Figure 3. Average of “Visible” Density Data for All Sites............................................................ 9
Figure 4. Average of “Control” Density Data for All Sites......................................................... 10
Figure 5. Average of “Stop” Density Data for All Sites.............................................................. 10
Figure 6. Average of “Paver” Density Data for All Sites ............................................................ 11
LIST OF TABLES
Table 1. Test Sites.......................................................................................................................... 5
Table 2. Materials ......................................................................................................................... 6
Table 3. Paving Equipment............................................................................................................ 7
Table 4. Summary of ANOVA for Each Project ......................................................................... 12
Table 5. Density Differences for Statistically Significant Sites ................................................. 13
1
1.0 INTRODUCTION Segregation of aggregates in asphalt pavements is a common workmanship deficiency. When
segregation appears on the surface of the pavement the texture of the paving mixture appears more
open with larger voids in the segregated areas. The result of this differential in voids is often more
infiltration of air and moisture into the pavement leading to premature raveling and potholes. Current
specifications (1) verify the presence of segregation by stating that “…when the percent passing the
4.75 mm (No. 4) sieve varies from the percent specified in the job-mix formula on the CDOT Form 43
by more than nine percent.” A Special Provision to be utilized in 2003 extended this requirement to
the No. 8 and No. 4 sieves for S and SX gradations. However, levels of segregation vary and since
removal of a portion of the allegedly affected pavement area is required for verification, which slows
construction and creates the potential for a discontinuous patch in the new pavement surface, many
inspectors are reluctant to take this course of action. Therefore, only the most obvious severe
segregation is likely to be removed and replaced. This means that low to moderate levels of
segregation continue to occur and continue to cause premature asphalt pavement failures.
This study was conducted to determine if nuclear density tests can be used to identify segregation in
asphalt pavements. The basis for this hypothesis assumes the density of the asphalt pavement in the
area of the segregation is lower than the surrounding pavement. If this is true, the nuclear density
meter may be able to detect this lower density. Then, if the lower density of the affected pavement
areas are statistically different than surrounding areas, a specification may be developed that utilizes
the nuclear density meter to quantitatively detect segregation. This specification would provide a
measuring tool for an inspector so that qualitative judgment and opinion are removed from the process
for controlling paving quality with respect to segregation. This study was conducted to determine if
results obtained by Willoughby, et al in similar experiments linking temperature differential to
segregation and pavement density could be utilized to develop a specification to measure segregation.
2
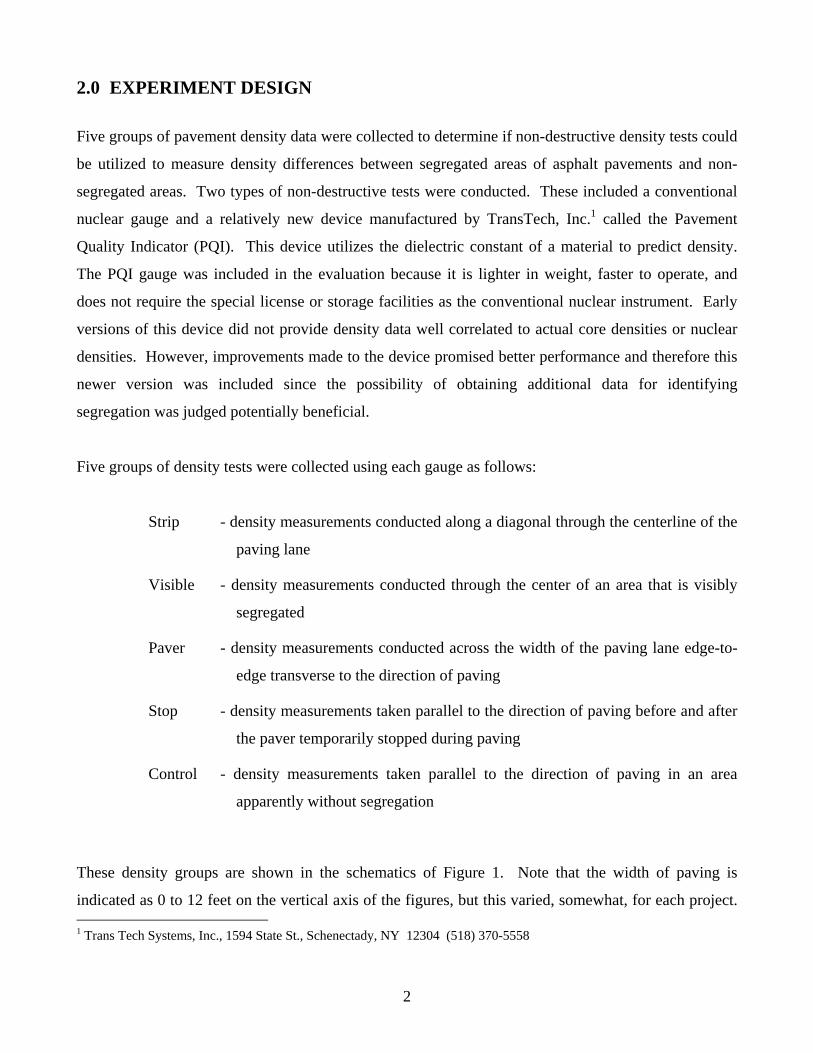
2.0 EXPERIMENT DESIGN Five groups of pavement density data were collected to determine if non-destructive density tests could
be utilized to measure density differences between segregated areas of asphalt pavements and non-
segregated areas. Two types of non-destructive tests were conducted. These included a conventional
nuclear gauge and a relatively new device manufactured by TransTech, Inc.1 called the Pavement
Quality Indicator (PQI). This device utilizes the dielectric constant of a material to predict density.
The PQI gauge was included in the evaluation because it is lighter in weight, faster to operate, and
does not require the special license or storage facilities as the conventional nuclear instrument. Early
versions of this device did not provide density data well correlated to actual core densities or nuclear
densities. However, improvements made to the device promised better performance and therefore this
newer version was included since the possibility of obtaining additional data for identifying
segregation was judged potentially beneficial.
Five groups of density tests were collected using each gauge as follows:
Strip - density measurements conducted along a diagonal through the centerline of the
paving lane
Visible - density measurements conducted through the center of an area that is visibly
segregated
Paver - density measurements conducted across the width of the paving lane edge-to-
edge transverse to the direction of paving
Stop - density measurements taken parallel to the direction of paving before and after
the paver temporarily stopped during paving
Control - density measurements taken parallel to the direction of paving in an area
apparently without segregation
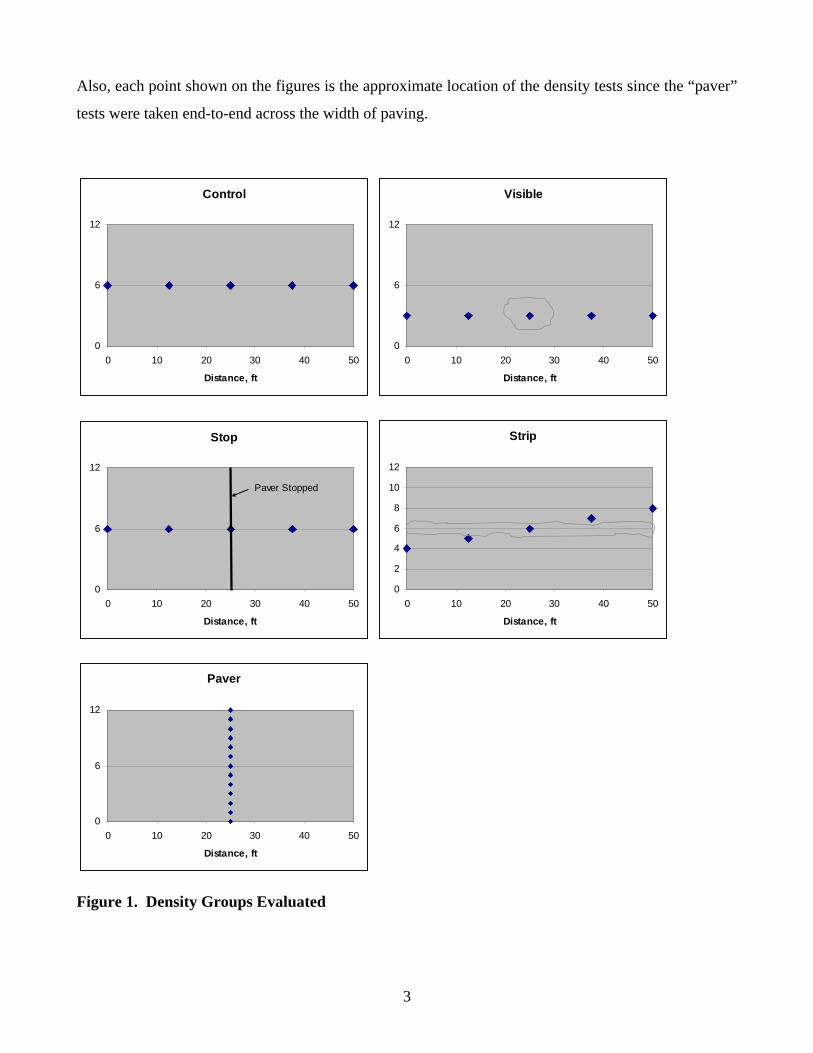
These density groups are shown in the schematics of Figure 1. Note that the width of paving is
indicated as 0 to 12 feet on the vertical axis of the figures, but this varied, somewhat, for each project. 1 Trans Tech Systems, Inc., 1594 State St., Schenectady, NY 12304 (518) 370-5558
3
Also, each point shown on the figures is the approximate location of the density tests since the “paver”
tests were taken end-to-end across the width of paving.
Control
0
6
12
0 10 20 30 40 50
Distance, ft
Visible
0
6
12
0 10 20 30 40 50
Distance, ft
Stop
0
6
12
0 10 20 30 40 50
Distance, ft
Paver Stopped
Strip
0
2
4
6
8
10
12
0 10 20 30 40 50
Distance, ft
Paver
0
6
12
0 10 20 30 40 50
Distance, ft
Figure 1. Density Groups Evaluated
4
Each point shown in Figure 1 was evaluated for insitu pavement density using the Troxler and
TransTech devices. Each device was operated by a separate technician. Testing was conducted by
marking each location, then randomly evaluating density with the non-destructive devices. Two
replicate density tests were conducted by each operator. Each replicate for the Troxler device
consisted of taking two readings at each spot marked on the pavement. This consisted of a total of four
readings to obtain an average of the two replicate density readings. Each replicate for the TransTech
device consisted of taking two sets of five readings at each spot marked on the pavement. This
consisted of a total of twenty readings to obtain an average of the two replicate density readings. The
resulting experiment can be analyzed by conventional analysis of variance (ANOVA) techniques to
determine if a significant difference exists between the test locations evaluated for each density group.
The model for the ANOVA is as follows:
yij = µ + τi + εij where,
yij = density readings, pcf µ = the overall mean density, pcf τi = the effect of density gauge location on the pavement εij = the random error component i = 1, 2, … a is the number of gauge locations being tested j = 2, is the number of replicates
5
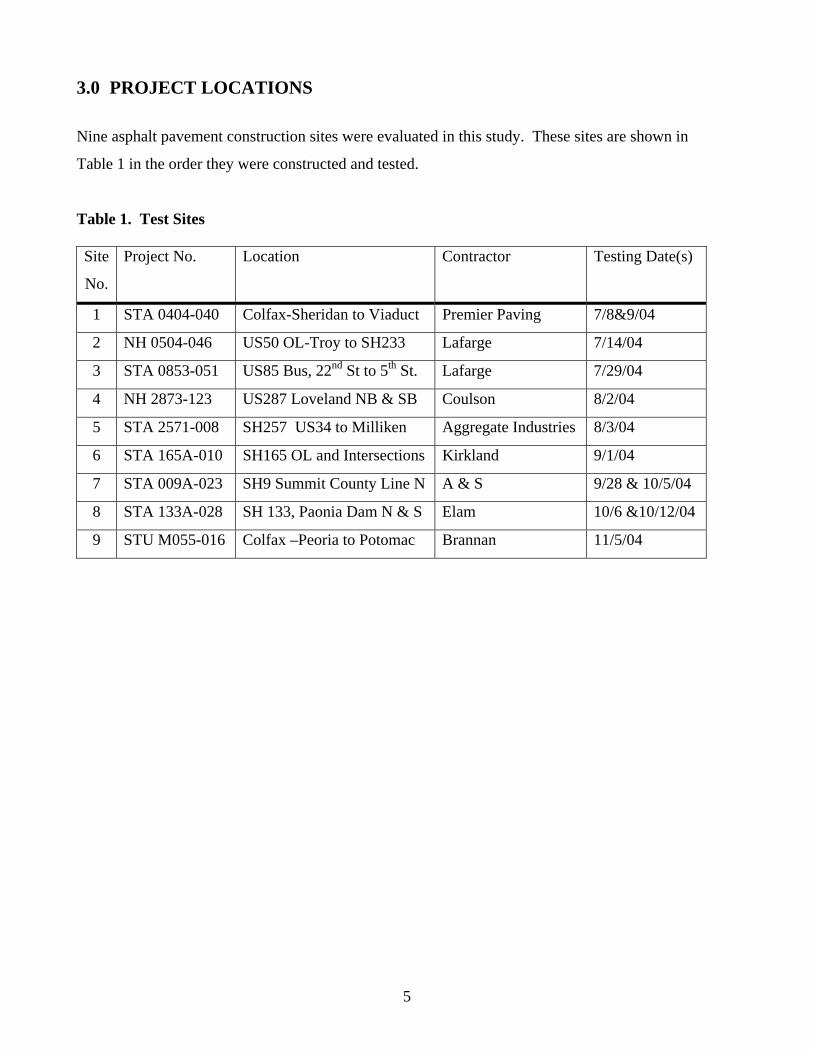
3.0 PROJECT LOCATIONS Nine asphalt pavement construction sites were evaluated in this study. These sites are shown in
Table 1 in the order they were constructed and tested.
Table 1. Test Sites Site
No.
Project No. Location Contractor Testing Date(s)
1 STA 0404-040 Colfax-Sheridan to Viaduct Premier Paving 7/8&9/04
2 NH 0504-046 US50 OL-Troy to SH233 Lafarge 7/14/04
3 STA 0853-051 US85 Bus, 22nd St to 5th St. Lafarge 7/29/04
4 NH 2873-123 US287 Loveland NB & SB Coulson 8/2/04
5 STA 2571-008 SH257 US34 to Milliken Aggregate Industries 8/3/04
6 STA 165A-010 SH165 OL and Intersections Kirkland 9/1/04
7 STA 009A-023 SH9 Summit County Line N A & S 9/28 & 10/5/04
8 STA 133A-028 SH 133, Paonia Dam N & S Elam 10/6 &10/12/04
9 STU M055-016 Colfax –Peoria to Potomac Brannan 11/5/04
6
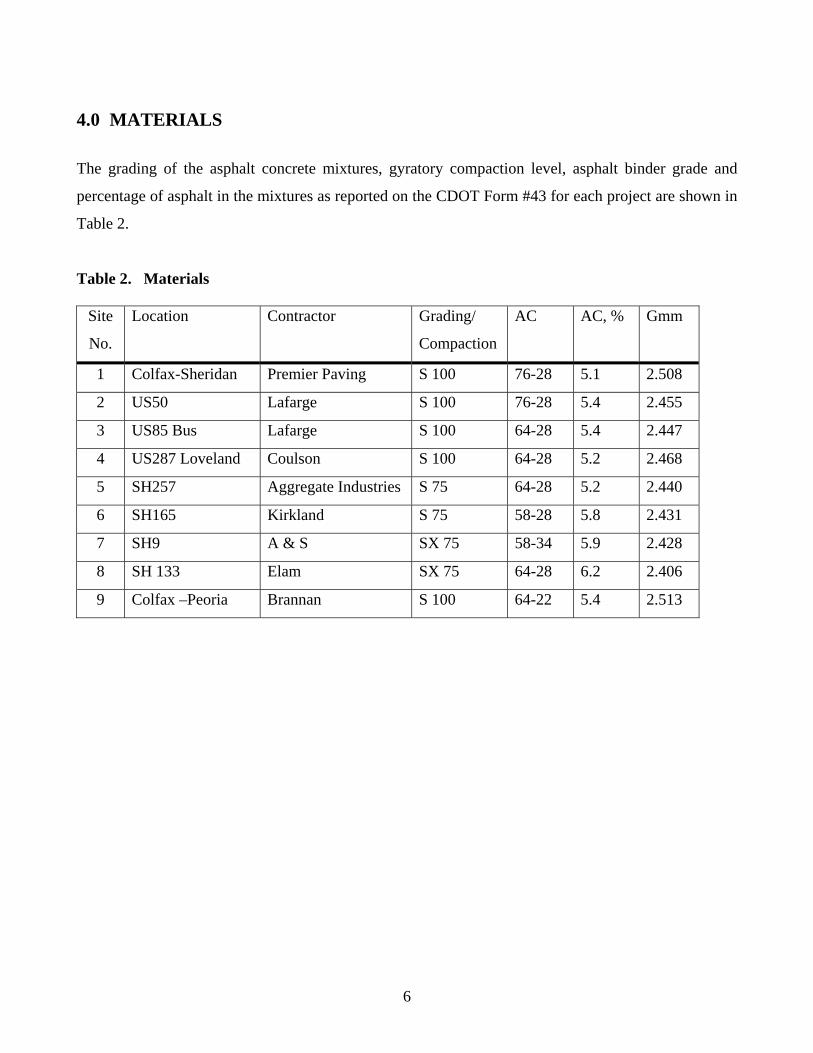
4.0 MATERIALS The grading of the asphalt concrete mixtures, gyratory compaction level, asphalt binder grade and
percentage of asphalt in the mixtures as reported on the CDOT Form #43 for each project are shown in
Table 2.
Table 2. Materials
Site
No.
Location Contractor Grading/
Compaction
AC AC, % Gmm
1 Colfax-Sheridan Premier Paving S 100 76-28 5.1 2.508
2 US50 Lafarge S 100 76-28 5.4 2.455
3 US85 Bus Lafarge S 100 64-28 5.4 2.447
4 US287 Loveland Coulson S 100 64-28 5.2 2.468
5 SH257 Aggregate Industries S 75 64-28 5.2 2.440
6 SH165 Kirkland S 75 58-28 5.8 2.431
7 SH9 A & S SX 75 58-34 5.9 2.428
8 SH 133 Elam SX 75 64-28 6.2 2.406
9 Colfax –Peoria Brannan S 100 64-22 5.4 2.513
7
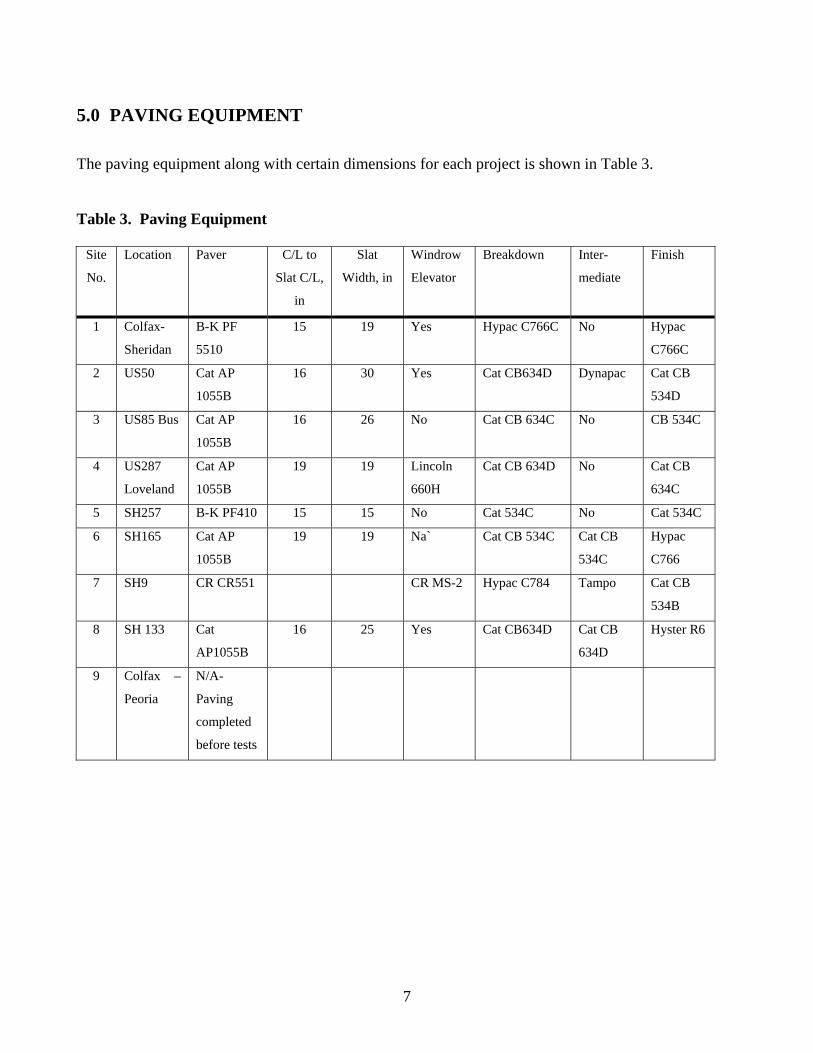
5.0 PAVING EQUIPMENT The paving equipment along with certain dimensions for each project is shown in Table 3.
Table 3. Paving Equipment
Site
No.
Location Paver C/L to
Slat C/L,
in
Slat
Width, in
Windrow
Elevator
Breakdown Inter-
mediate
Finish
1 Colfax-
Sheridan
B-K PF
5510
15 19 Yes Hypac C766C No Hypac
C766C
2 US50 Cat AP
1055B
16 30 Yes Cat CB634D Dynapac Cat CB
534D
3 US85 Bus Cat AP
1055B
16 26 No Cat CB 634C No CB 534C
4 US287
Loveland
Cat AP
1055B
19 19 Lincoln
660H
Cat CB 634D No Cat CB
634C
5 SH257 B-K PF410 15 15 No Cat 534C No Cat 534C
6 SH165 Cat AP
1055B
19 19 Na` Cat CB 534C Cat CB
534C
Hypac
C766
7 SH9 CR CR551 CR MS-2 Hypac C784 Tampo Cat CB
534B
8 SH 133 Cat
AP1055B
16 25 Yes Cat CB634D Cat CB
634D
Hyster R6
9 Colfax –
Peoria
N/A-
Paving
completed
before tests
8
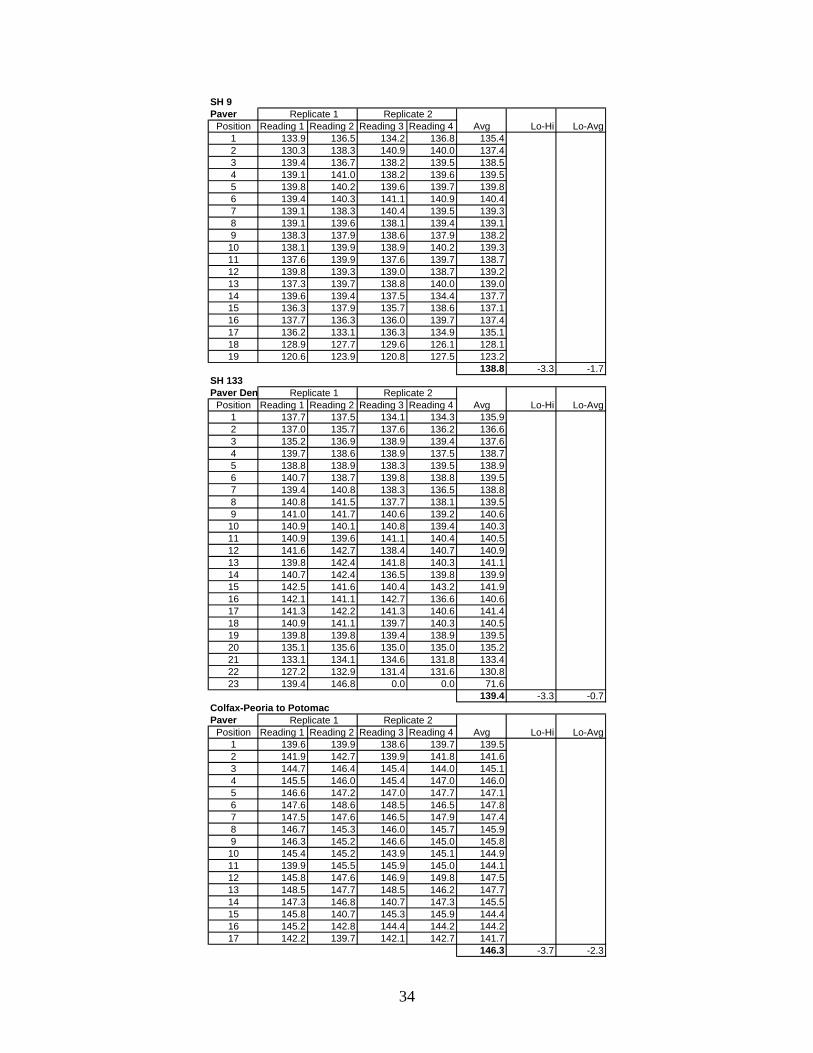
6.0 TEST RESULTS Each test conducted as part of this study appears in Appendix A. Appendix B is a summary of the
ANOVA conducted for each data set. Appendix C includes graphs showing the averages of both the
nuclear and PQI density test results for each density data set location on each project.
The data suggests that pavement density in areas where segregation occurred is lower than surrounding
pavement areas where segregation did not occur. The following section describes these differences in
detail.
7.0 ANALYSIS The relative density of the pavement for each of the five density data sets is analyzed in the following
section. Each density data set will be discussed separately.
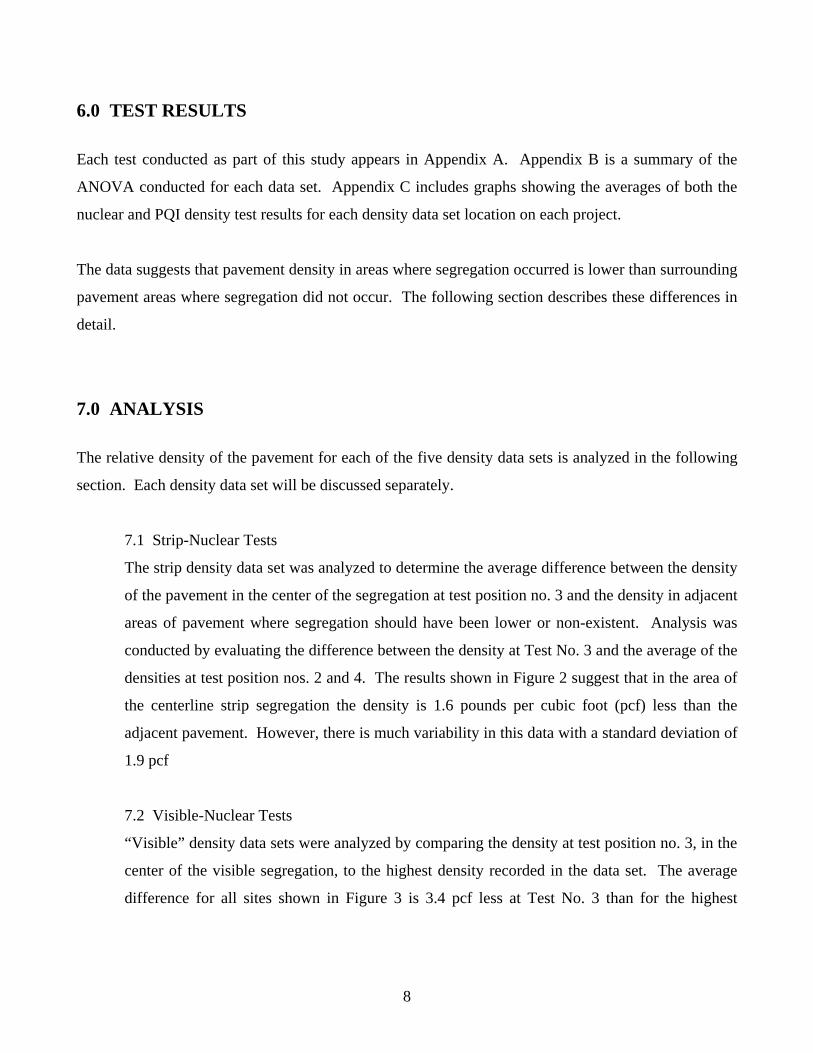
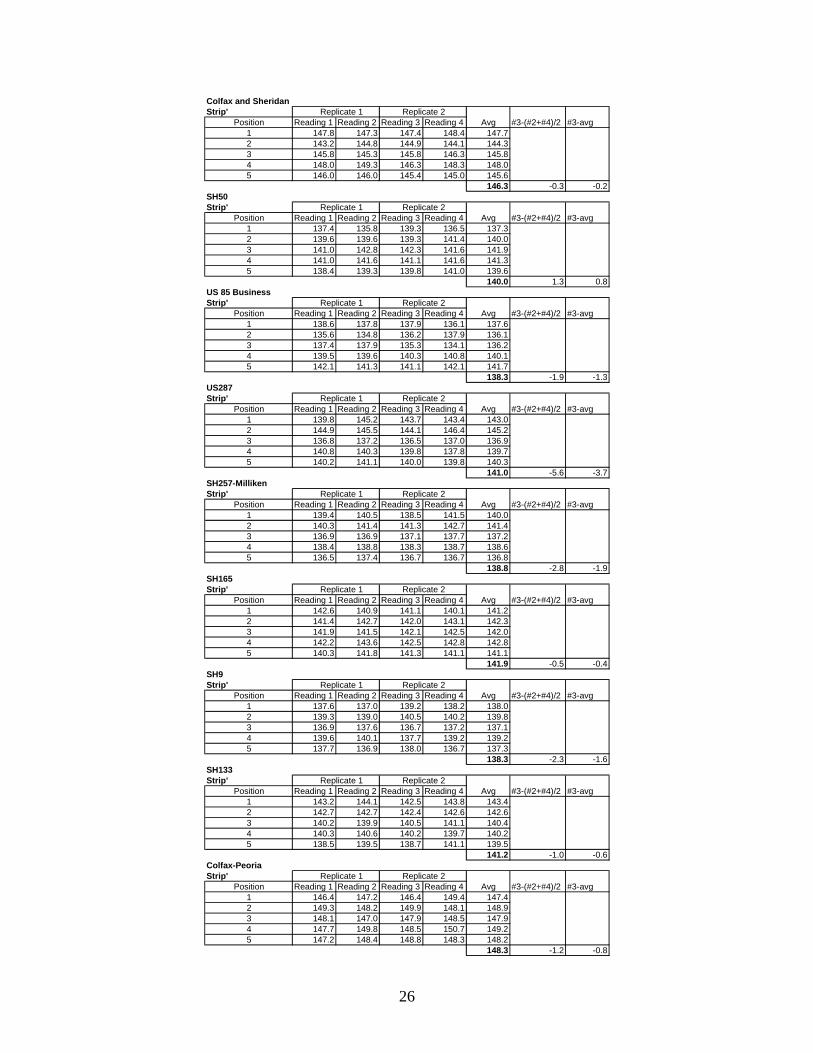
7.1 Strip-Nuclear Tests
The strip density data set was analyzed to determine the average difference between the density
of the pavement in the center of the segregation at test position no. 3 and the density in adjacent
areas of pavement where segregation should have been lower or non-existent. Analysis was
conducted by evaluating the difference between the density at Test No. 3 and the average of the
densities at test position nos. 2 and 4. The results shown in Figure 2 suggest that in the area of
the centerline strip segregation the density is 1.6 pounds per cubic foot (pcf) less than the
adjacent pavement. However, there is much variability in this data with a standard deviation of
1.9 pcf
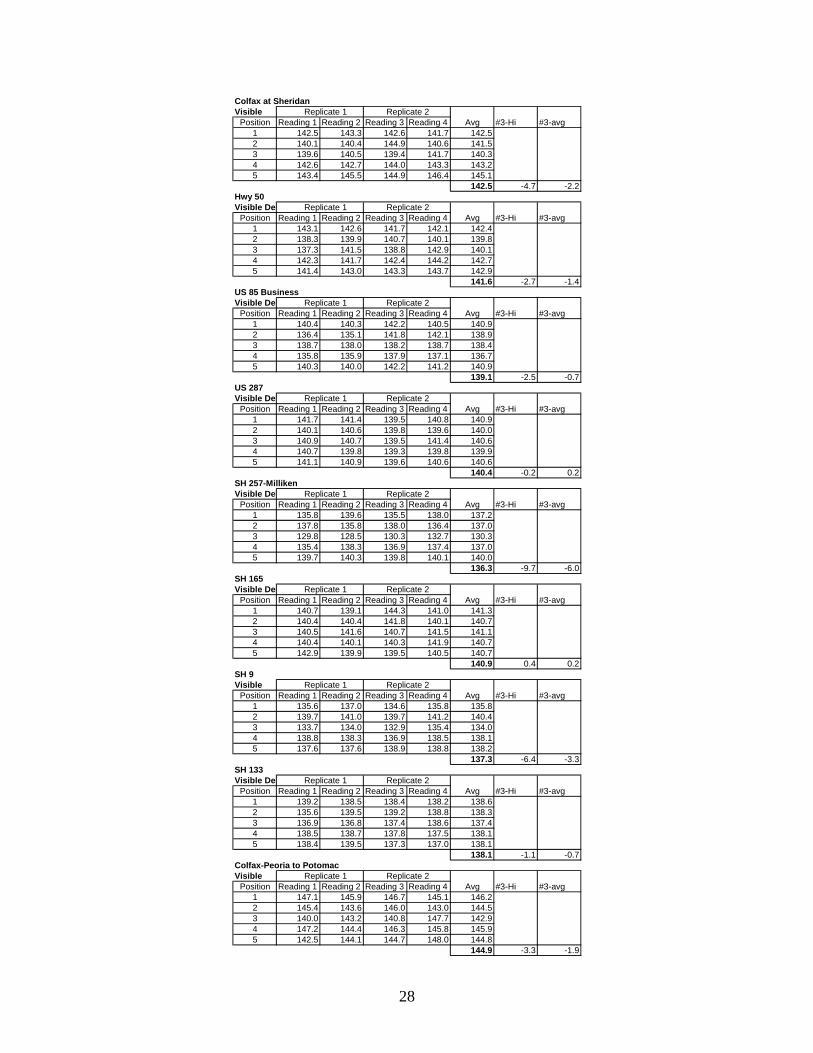
7.2 Visible-Nuclear Tests
“Visible” density data sets were analyzed by comparing the density at test position no. 3, in the
center of the visible segregation, to the highest density recorded in the data set. The average
difference for all sites shown in Figure 3 is 3.4 pcf less at Test No. 3 than for the highest
9
density recorded in the set of five tests. However, again, the variability between sites is high at
3.2 pcf.
#3-(#2+#4)/2Colfax and Sheridan -0.3SH50 1.3US 85 Business -1.9US287 -5.6SH257-Milliken -2.8SH165 -0.5SH9 -2.3SH133 -1.0Colfax-Peoria -1.2
Avg = -1.6Stdev = 1.9
Strip Data
-6.0-5.0-4.0-3.0-2.0-1.00.01.02.0
Colfaxand
Sheridan
SH50 US 85Business
US287 SH257-Milliken
SH165 SH9 SH133 Colfax-Peoria
#3 -
((#2+
#4)/2
)
Figure 2. Average of “Strip” Density Data for All Sites
#3-Hi
Colfax at Sheridan -4.7Hwy 50 -2.7US 85 Business -2.5US 287 -0.2SH 257-Milliken -9.7SH 165 0.4SH 9 -6.4SH 133 -1.1Colfax-Peoria to Potomac -3.3
Avg = -3.4Stdev = 3.2
Visible Data
-12.0
-10.0
-8.0
-6.0
-4.0
-2.0
0.0
2.0
Colfax atSheridan
Hwy 50 US 85Business
US 287 SH 257-Milliken
SH 165 SH 9 SH 133 Colfax-Peoria toPotomac
#3 -
Hi
Figure 3. Average of “Visible” Density Data for All Sites
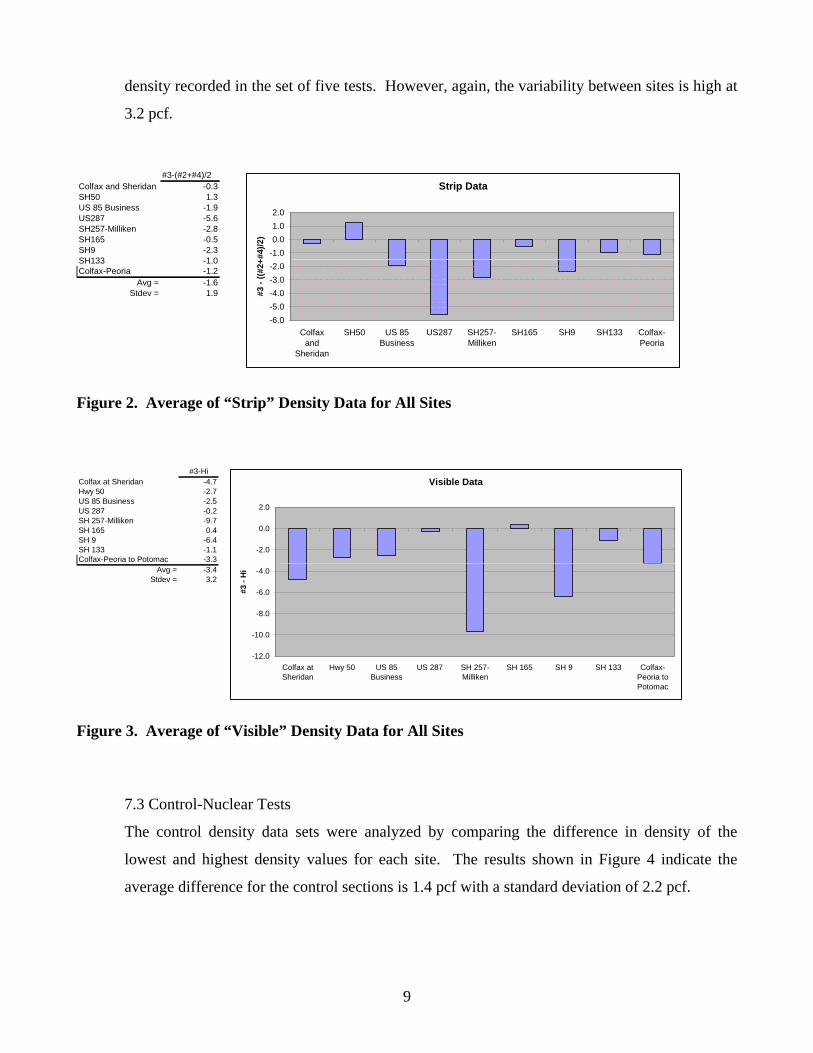
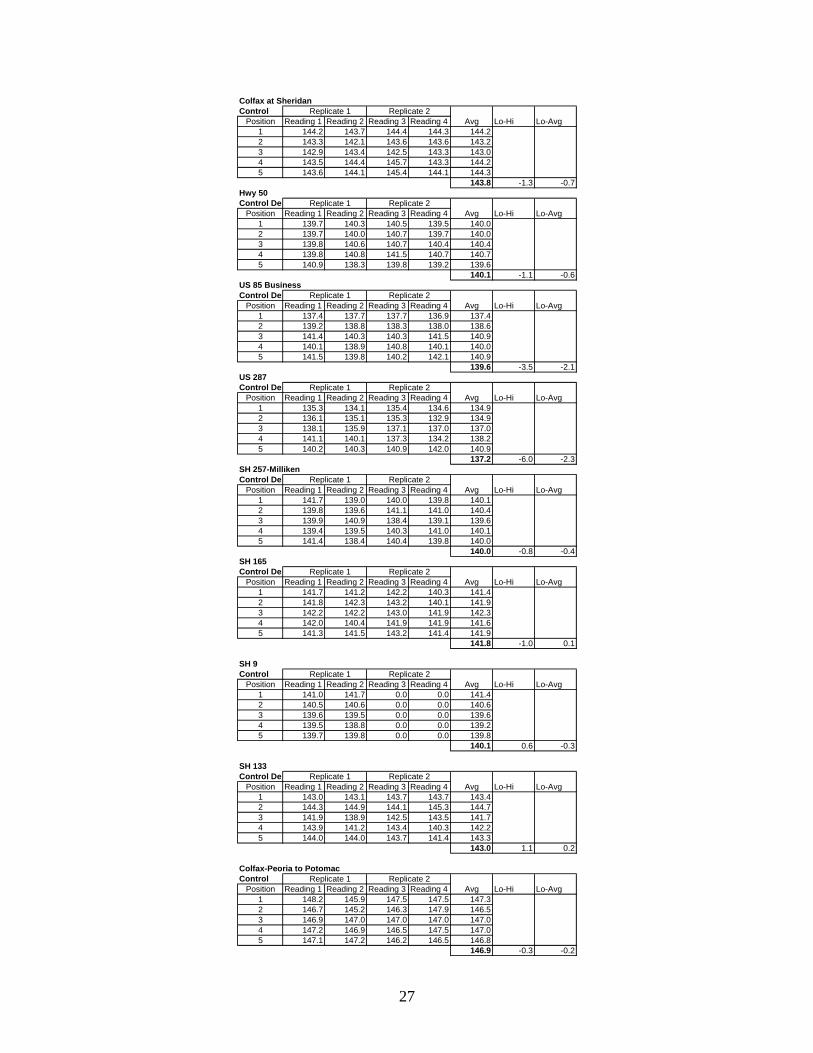
7.3 Control-Nuclear Tests
The control density data sets were analyzed by comparing the difference in density of the
lowest and highest density values for each site. The results shown in Figure 4 indicate the
average difference for the control sections is 1.4 pcf with a standard deviation of 2.2 pcf.
10
Lo - HiColfax at Sheridan -1.3Hwy 50 -1.1US 85 Business -3.5US 287 -6.0SH 257-Milliken -0.8SH 165 -1.0SH 9 0.6SH 133 1.1Colfax-Peoria to Potomac -0.3
Avg = -1.4Stdev = 2.2
Control Data
-7.0
-6.0
-5.0
-4.0
-3.0
-2.0
-1.0
0.0
1.0
2.0
Colfax atSheridan
Hwy 50 US 85Business
US 287 SH 257-Milliken
SH 165 SH 9 SH 133 Colfax-Peoria toPotomac
Lo -
Hi
Figure 4. Average of “Control” Density Data for All Sites
7.4 Stop-Nuclear Tests
The stop density data sets were evaluated by comparing the density of the pavement where the
paver stopped to the highest density recorded for that set. The results shown in Figure 5
suggest that a 2.4 pcf difference exists for the average of all sites with a standard deviation of
1.8 pcf.
Stop - Hi
Colfax at Sheridan 0.0Hwy 50 -3.3US 85 Business -5.9US 287 -1.5SH 257-Milliken -2.0SH 165 -2.1SH 9 -3.3SH 133 -1.0Colfax-Peoria to Potomac na
Avg = -2.4Stdev = 1.8
Stop Data
-7.0
-6.0
-5.0
-4.0
-3.0
-2.0
-1.0
0.0
Colfax atSheridan
Hwy 50 US 85Business
US 287 SH 257-Milliken
SH 165 SH 9 SH 133 Colfax-Peoria toPotomac
'Sto
p' -
Hi
Figure 5. Average of “Stop” Density Data for All Sites
11
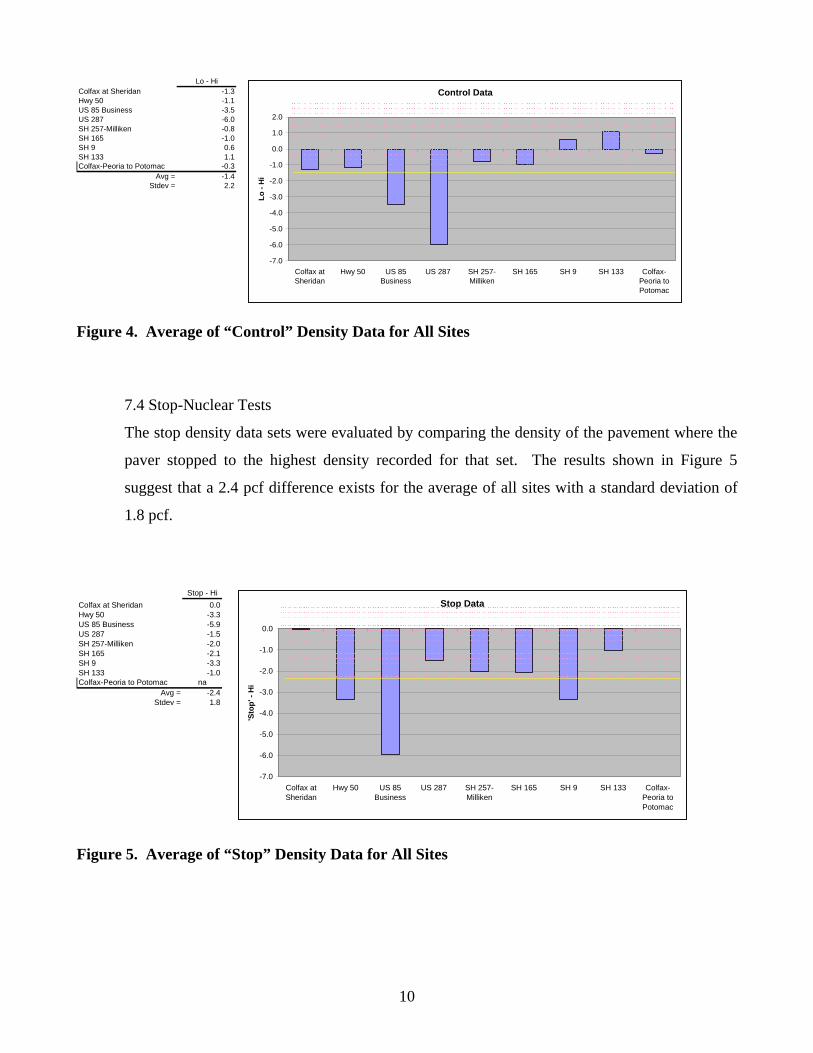
7.5 Paver-Nuclear Tests
The paver density data sets were evaluated after removing a portion of the test results from the
analysis. The tests removed prior to analysis were located 24 inches from the edge of the paver
width. These tests were removed from the analysis because of noticeably lower densities
within these zones, possibly due to an apparent difficulty in achieving compaction at the edge
of the paving width. The results shown in Figure 6 indicate a differential of 5.4 pcf across the
paving width with a standard deviation of 2.1 pcf.
Lo - Hi
Colfax at Sheridan -7.2Hwy 50 -8.4US 85 Business -5.8US 287 -4.1SH 257-Milliken -8.2SH 165 -4.4SH 9 -3.3SH 133 -3.3Colfax-Peoria to Potomac -3.7Avg = -5.4Stdev = 2.1
Paver
-9.0
-8.0
-7.0
-6.0
-5.0
-4.0
-3.0
-2.0
-1.0
0.0
Colfax atSheridan
Hwy 50 US 85Business
US 287 SH 257-Milliken
SH 165 SH 9 SH 133 Colfax-Peoria toPotomac
Lo -
Hi
Figure 6. Average of “Paver” Density Data for All Sites
Appendix C shows the graphs of all the average test results recorded for both the nuclear and PQI
density gauges for each project. The position of the paver centerline and position of the slat conveyors
is superimposed on each graph for dimensions that were recorded. A difference in density due to the
presence of the centerline gearbox is not apparent, however, a decrease in density is evident for certain
projects at the outside edge of the slat conveyor, consistent with findings of Harmelink and
Aschenbrener (3) regarding paver-created segregation.
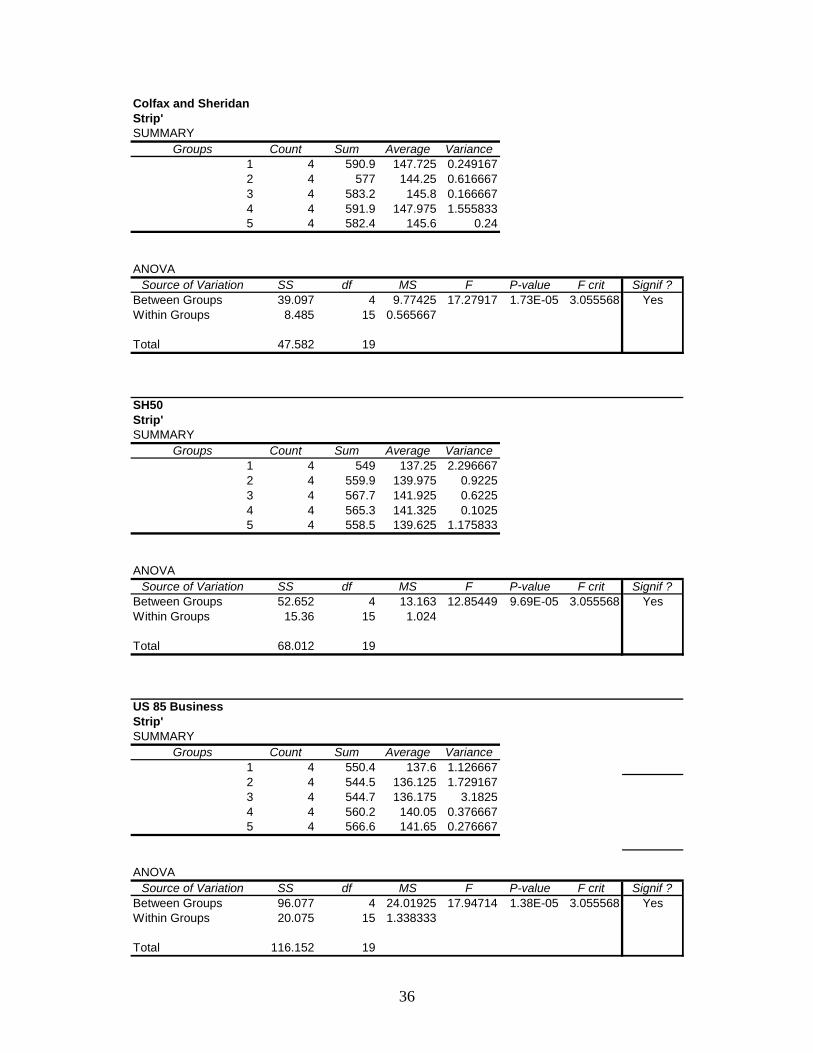
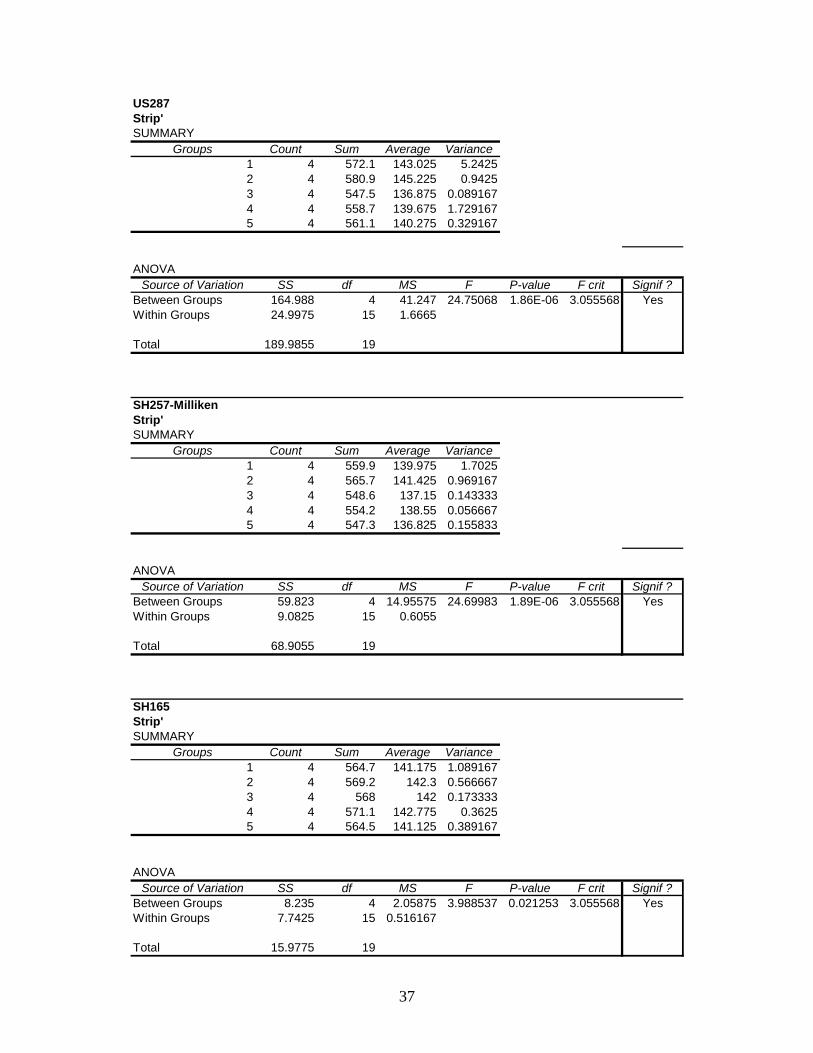
7.6 Analysis of Variance
The variability discussed above is likely due to variations in conditions between sites such as
testing error, materials, moisture content, construction methods and levels or degrees of
segregation. Therefore, an analysis of variance (ANOVA) was conducted on each site for each
density data set collected. The results appear in Appendix B and are summarized in Table 4.
12
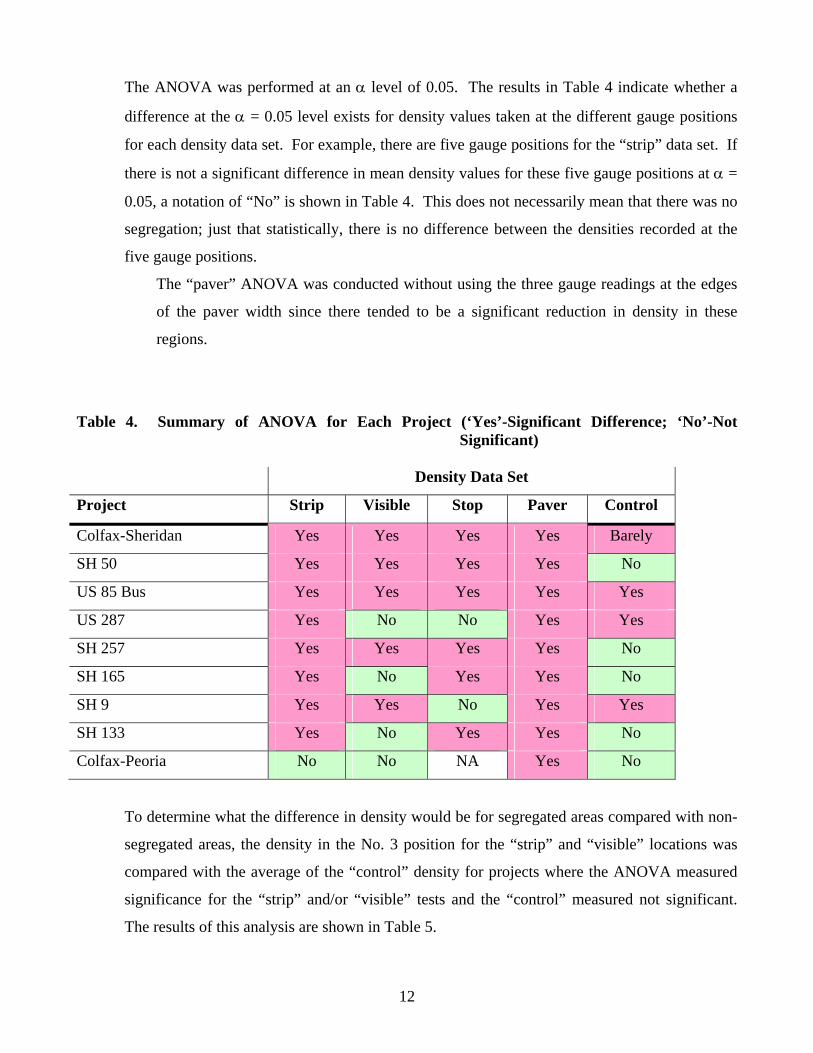
The ANOVA was performed at an α level of 0.05. The results in Table 4 indicate whether a
difference at the α = 0.05 level exists for density values taken at the different gauge positions
for each density data set. For example, there are five gauge positions for the “strip” data set. If
there is not a significant difference in mean density values for these five gauge positions at α =
0.05, a notation of “No” is shown in Table 4. This does not necessarily mean that there was no
segregation; just that statistically, there is no difference between the densities recorded at the
five gauge positions.
The “paver” ANOVA was conducted without using the three gauge readings at the edges
of the paver width since there tended to be a significant reduction in density in these
regions.
Table 4. Summary of ANOVA for Each Project (‘Yes’-Significant Difference; ‘No’-Not Significant)
Density Data Set
Project Strip Visible Stop Paver Control
Colfax-Sheridan Yes Yes Yes Yes Barely
SH 50 Yes Yes Yes Yes No
US 85 Bus Yes Yes Yes Yes Yes
US 287 Yes No No Yes Yes
SH 257 Yes Yes Yes Yes No
SH 165 Yes No Yes Yes No
SH 9 Yes Yes No Yes Yes
SH 133 Yes No Yes Yes No
Colfax-Peoria No No NA Yes No
To determine what the difference in density would be for segregated areas compared with non-
segregated areas, the density in the No. 3 position for the “strip” and “visible” locations was
compared with the average of the “control” density for projects where the ANOVA measured
significance for the “strip” and/or “visible” tests and the “control” measured not significant.
The results of this analysis are shown in Table 5.
13
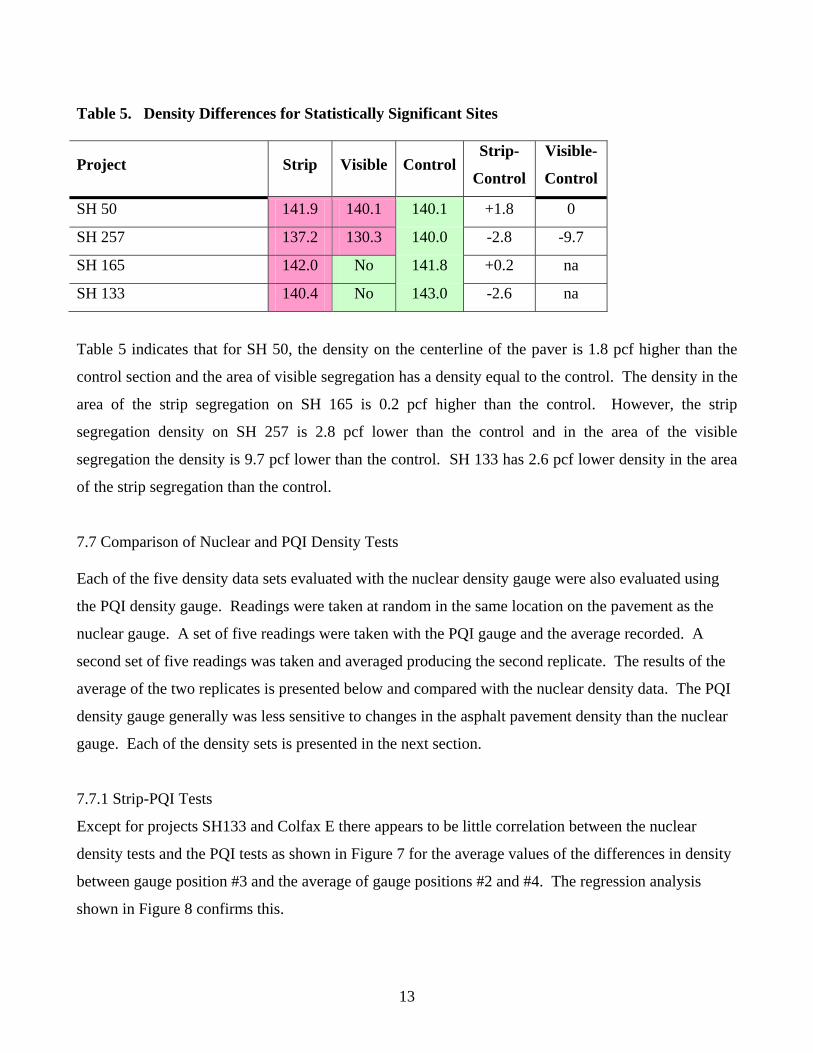
Table 5. Density Differences for Statistically Significant Sites
Project Strip Visible ControlStrip-
Control
Visible-
Control
SH 50 141.9 140.1 140.1 +1.8 0
SH 257 137.2 130.3 140.0 -2.8 -9.7
SH 165 142.0 No 141.8 +0.2 na
SH 133 140.4 No 143.0 -2.6 na
Table 5 indicates that for SH 50, the density on the centerline of the paver is 1.8 pcf higher than the
control section and the area of visible segregation has a density equal to the control. The density in the
area of the strip segregation on SH 165 is 0.2 pcf higher than the control. However, the strip
segregation density on SH 257 is 2.8 pcf lower than the control and in the area of the visible
segregation the density is 9.7 pcf lower than the control. SH 133 has 2.6 pcf lower density in the area
of the strip segregation than the control.
7.7 Comparison of Nuclear and PQI Density Tests Each of the five density data sets evaluated with the nuclear density gauge were also evaluated using
the PQI density gauge. Readings were taken at random in the same location on the pavement as the
nuclear gauge. A set of five readings were taken with the PQI gauge and the average recorded. A
second set of five readings was taken and averaged producing the second replicate. The results of the
average of the two replicates is presented below and compared with the nuclear density data. The PQI
density gauge generally was less sensitive to changes in the asphalt pavement density than the nuclear
gauge. Each of the density sets is presented in the next section.
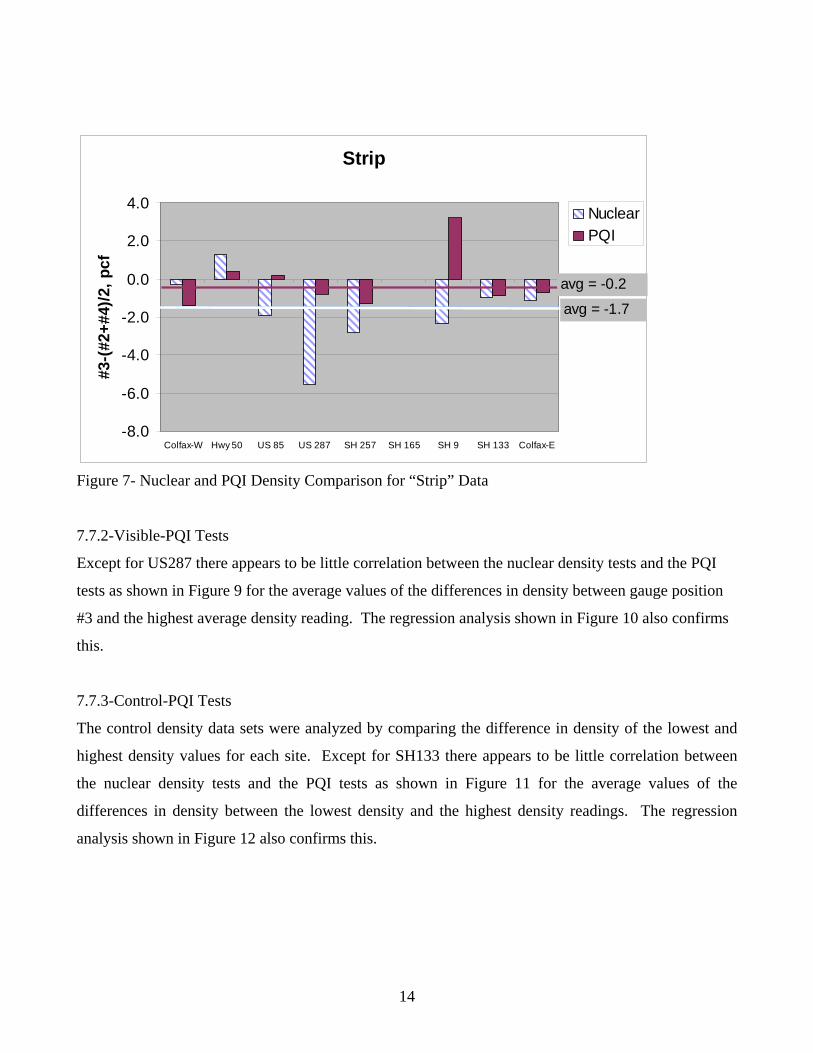
7.7.1 Strip-PQI Tests
Except for projects SH133 and Colfax E there appears to be little correlation between the nuclear
density tests and the PQI tests as shown in Figure 7 for the average values of the differences in density
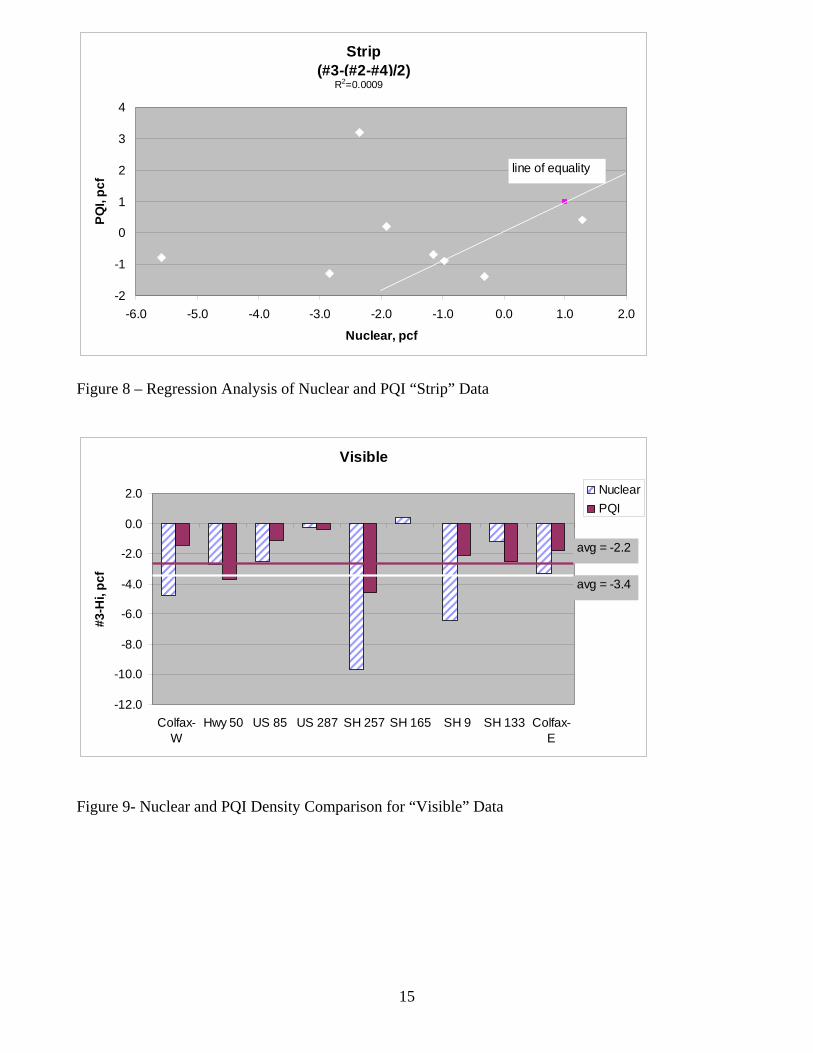
between gauge position #3 and the average of gauge positions #2 and #4. The regression analysis
shown in Figure 8 confirms this.
14
Figure 7- Nuclear and PQI Density Comparison for “Strip” Data
7.7.2-Visible-PQI Tests Except for US287 there appears to be little correlation between the nuclear density tests and the PQI
tests as shown in Figure 9 for the average values of the differences in density between gauge position
#3 and the highest average density reading. The regression analysis shown in Figure 10 also confirms
this.
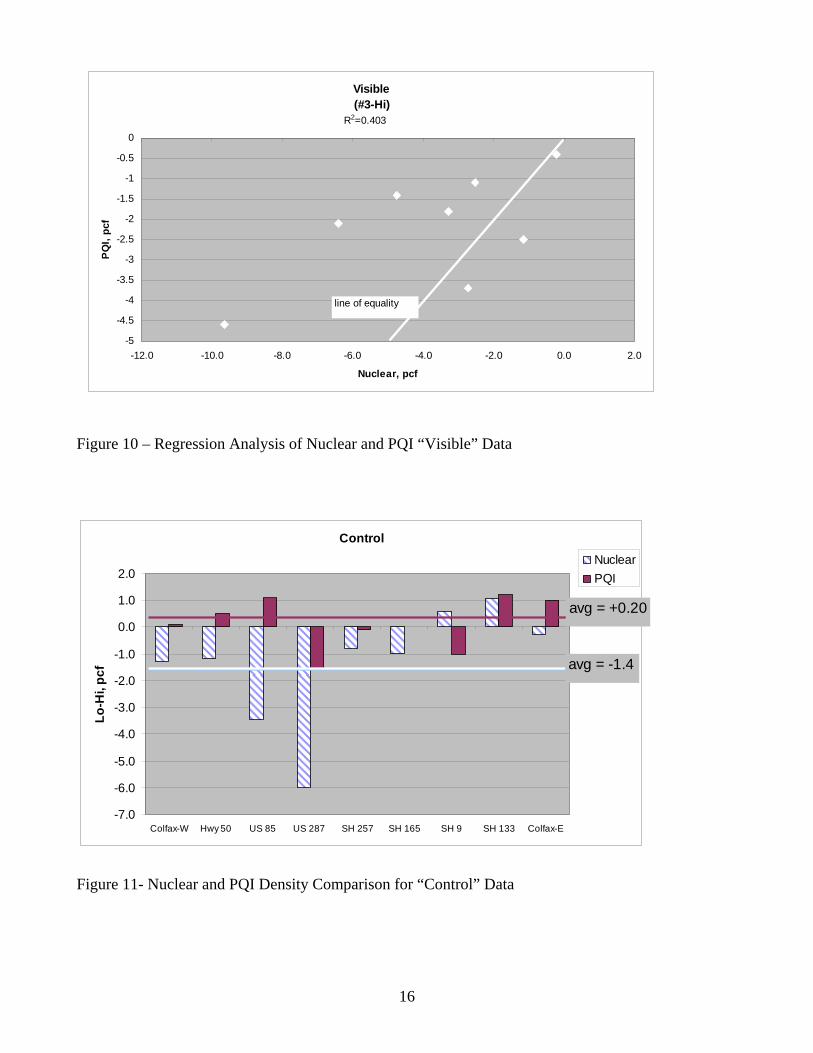
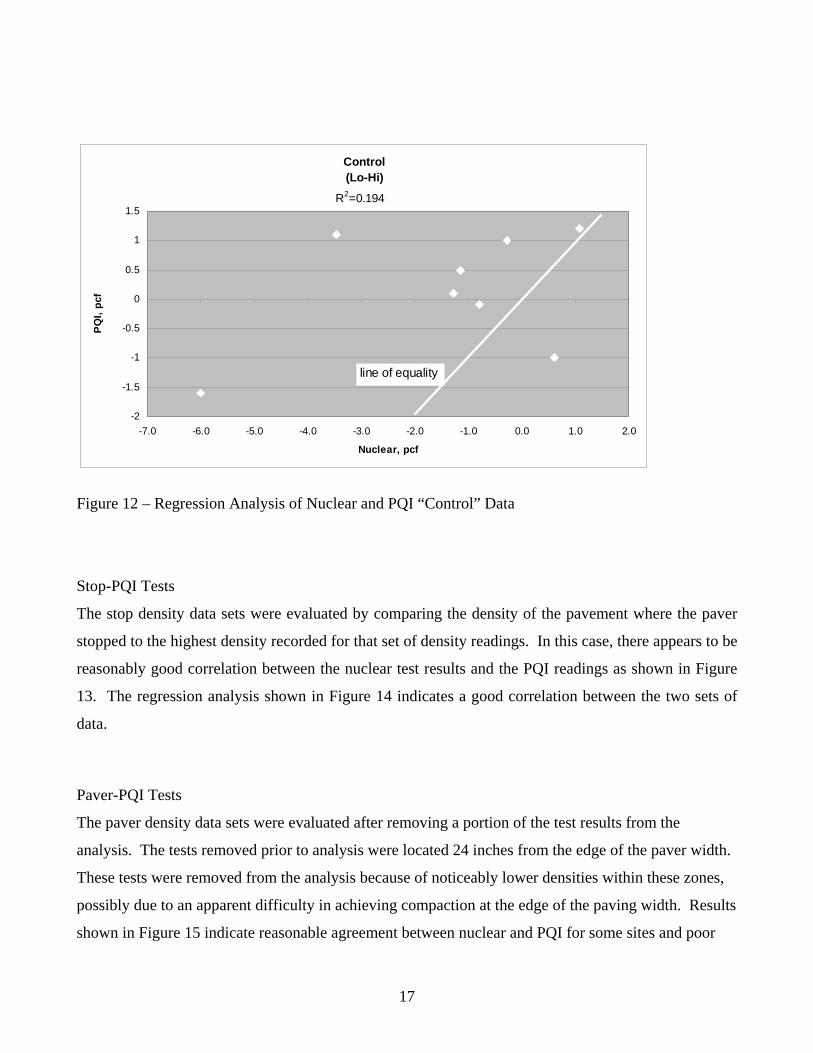
7.7.3-Control-PQI Tests
The control density data sets were analyzed by comparing the difference in density of the lowest and
highest density values for each site. Except for SH133 there appears to be little correlation between
the nuclear density tests and the PQI tests as shown in Figure 11 for the average values of the
differences in density between the lowest density and the highest density readings. The regression
analysis shown in Figure 12 also confirms this.
Strip
-8.0
-6.0
-4.0
-2.0
0.0
2.0
4.0
Colfax-W Hwy 50 US 85 US 287 SH 257 SH 165 SH 9 SH 133 Colfax-E
#3-(
#2+#
4)/2
, pcf
NuclearPQI
avg = -1.7
avg = -0.2
15
Figure 8 – Regression Analysis of Nuclear and PQI “Strip” Data
Visible
-12.0
-10.0
-8.0
-6.0
-4.0
-2.0
0.0
2.0
Colfax-W
Hwy 50 US 85 US 287 SH 257 SH 165 SH 9 SH 133 Colfax-E
#3-H
i, pc
f
NuclearPQI
avg = -2.2
avg = -3.4
Figure 9- Nuclear and PQI Density Comparison for “Visible” Data
Strip(#3-(#2-#4)/2)
-2
-1
0
1
2
3
4
-6.0 -5.0 -4.0 -3.0 -2.0 -1.0 0.0 1.0 2.0
Nuclear, pcf
PQI,
pcf
line of equality
R2=0.0009
16
Figure 10 – Regression Analysis of Nuclear and PQI “Visible” Data
Figure 11- Nuclear and PQI Density Comparison for “Control” Data
Control
-7.0
-6.0
-5.0
-4.0
-3.0
-2.0
-1.0
0.0
1.0
2.0
Colfax-W Hwy 50 US 85 US 287 SH 257 SH 165 SH 9 SH 133 Colfax-E
Lo-H
i, pc
f
NuclearPQI
avg = -1.4
avg = +0.20
Visible(#3-Hi)
-5
-4.5
-4
-3.5
-3
-2.5
-2
-1.5
-1
-0.5
0
-12.0 -10.0 -8.0 -6.0 -4.0 -2.0 0.0 2.0
Nuclear, pcf
PQ
I, pc
fR2=0.403
line of equality
17
Figure 12 – Regression Analysis of Nuclear and PQI “Control” Data
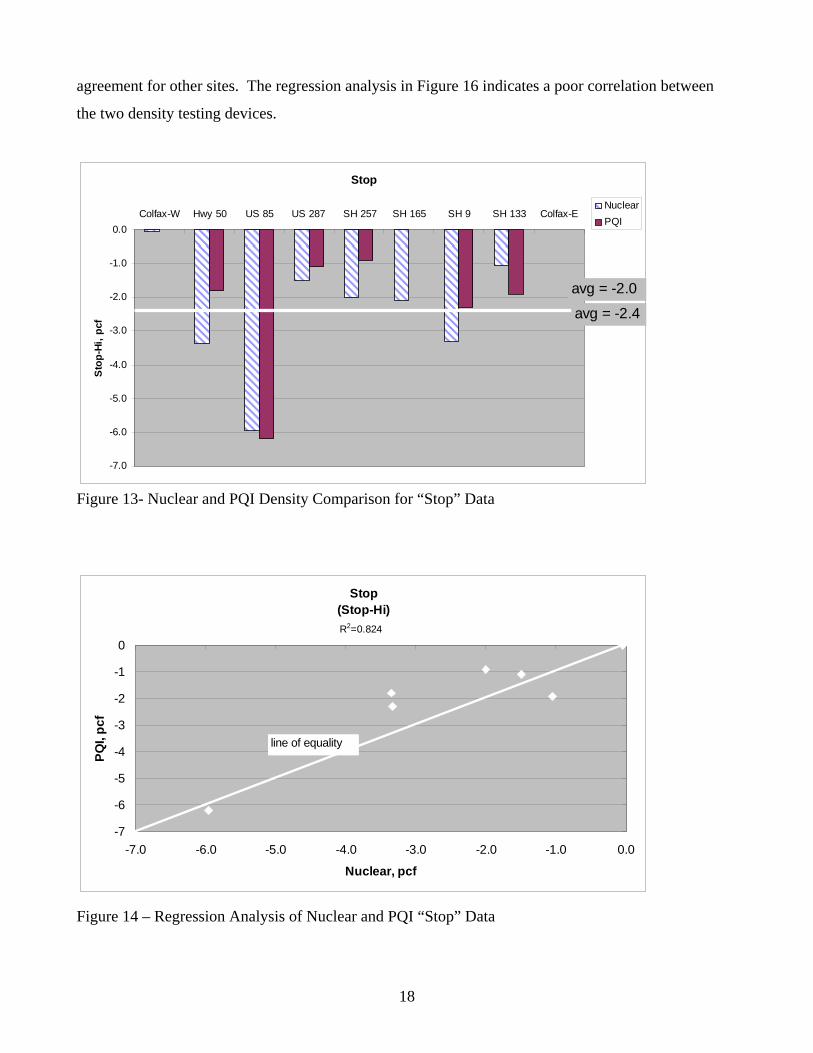
Stop-PQI Tests
The stop density data sets were evaluated by comparing the density of the pavement where the paver
stopped to the highest density recorded for that set of density readings. In this case, there appears to be
reasonably good correlation between the nuclear test results and the PQI readings as shown in Figure
13. The regression analysis shown in Figure 14 indicates a good correlation between the two sets of
data.
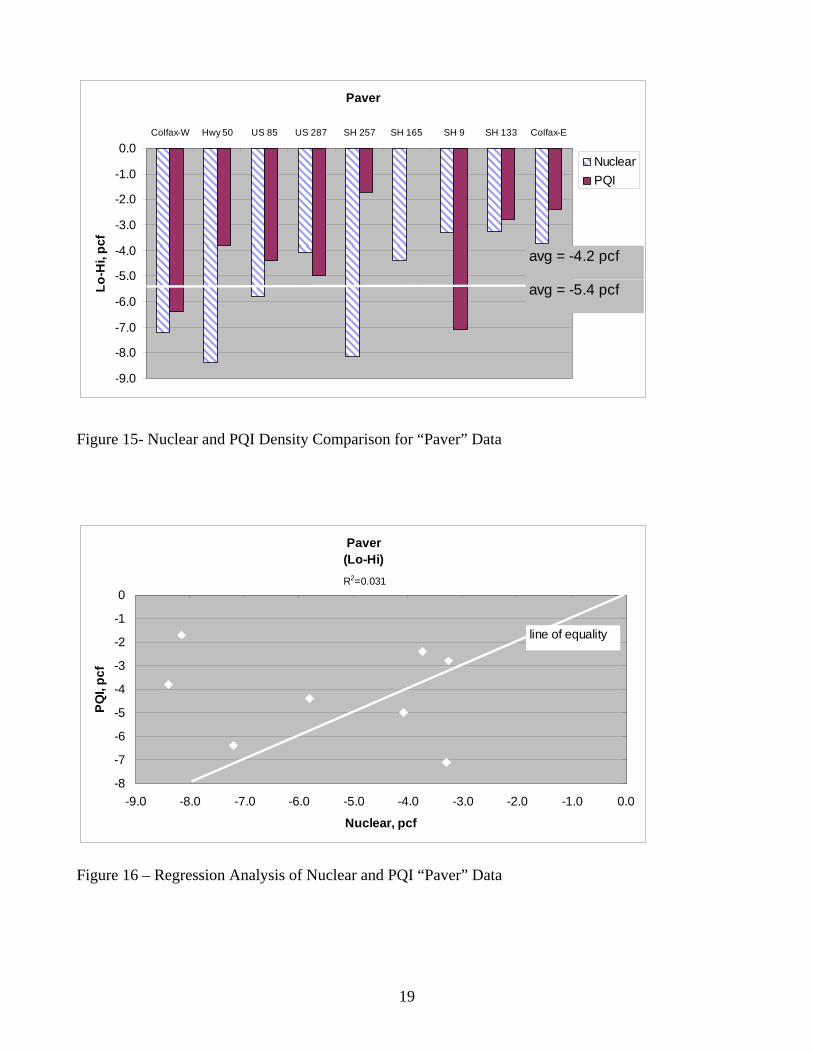
Paver-PQI Tests
The paver density data sets were evaluated after removing a portion of the test results from the
analysis. The tests removed prior to analysis were located 24 inches from the edge of the paver width.
These tests were removed from the analysis because of noticeably lower densities within these zones,
possibly due to an apparent difficulty in achieving compaction at the edge of the paving width. Results
shown in Figure 15 indicate reasonable agreement between nuclear and PQI for some sites and poor
Control(Lo-Hi)
-2
-1.5
-1
-0.5
0
0.5
1
1.5
-7.0 -6.0 -5.0 -4.0 -3.0 -2.0 -1.0 0.0 1.0 2.0
Nuclear, pcf
PQ
I, pc
f
R2=0.194
line of equality
18
agreement for other sites. The regression analysis in Figure 16 indicates a poor correlation between
the two density testing devices.
Figure 13- Nuclear and PQI Density Comparison for “Stop” Data
Figure 14 – Regression Analysis of Nuclear and PQI “Stop” Data
Stop
-7.0
-6.0
-5.0
-4.0
-3.0
-2.0
-1.0
0.0Colfax-W Hwy 50 US 85 US 287 SH 257 SH 165 SH 9 SH 133 Colfax-E
Sto
p-Hi
, pcf
NuclearPQI
avg = -2.0
avg = -2.4
Stop(Stop-Hi)
-7
-6
-5
-4
-3
-2
-1
0
-7.0 -6.0 -5.0 -4.0 -3.0 -2.0 -1.0 0.0
Nuclear, pcf
PQI,
pcf
line of equality
R2=0.824
19
Figure 15- Nuclear and PQI Density Comparison for “Paver” Data
Figure 16 – Regression Analysis of Nuclear and PQI “Paver” Data
Paver
-9.0
-8.0
-7.0
-6.0
-5.0
-4.0
-3.0
-2.0
-1.0
0.0Colfax-W Hwy 50 US 85 US 287 SH 257 SH 165 SH 9 SH 133 Colfax-E
Lo-H
i, pc
f
NuclearPQI
avg = -5.4 pcf
avg = -4.2 pcf
Paver(Lo-Hi)
-8
-7
-6
-5
-4
-3
-2
-1
0
-9.0 -8.0 -7.0 -6.0 -5.0 -4.0 -3.0 -2.0 -1.0 0.0
Nuclear, pcf
PQI,
pcf
R2=0.031
line of equality
20
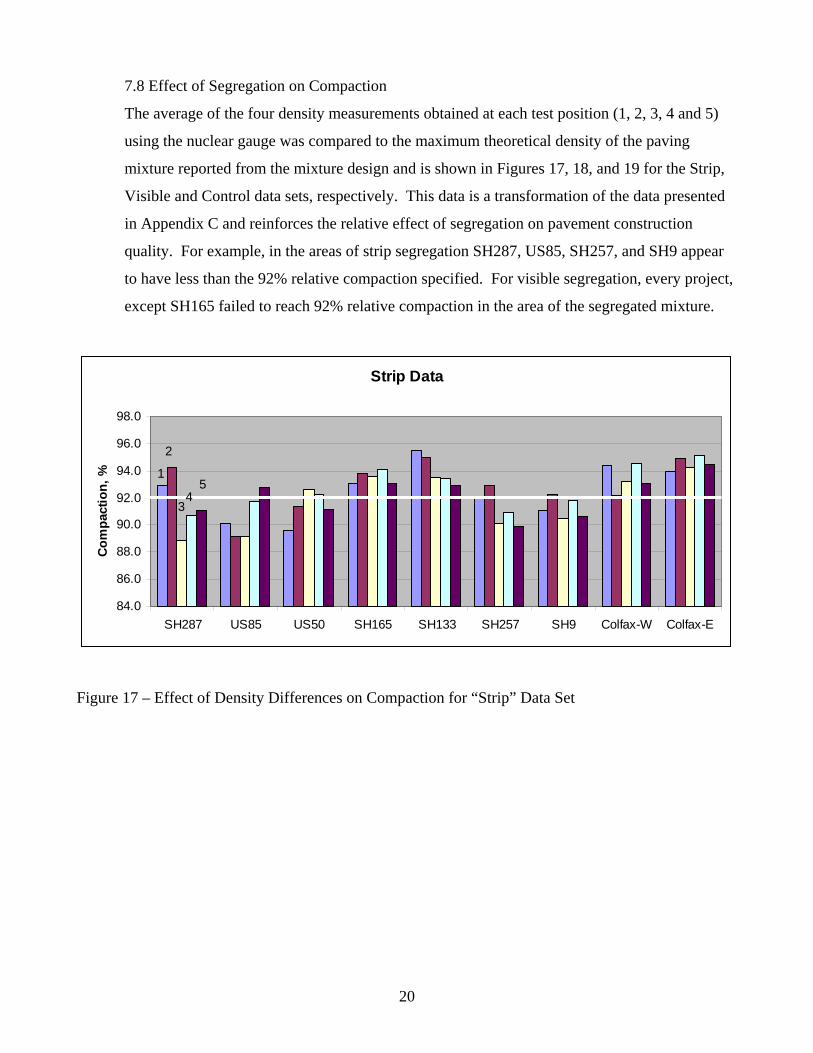
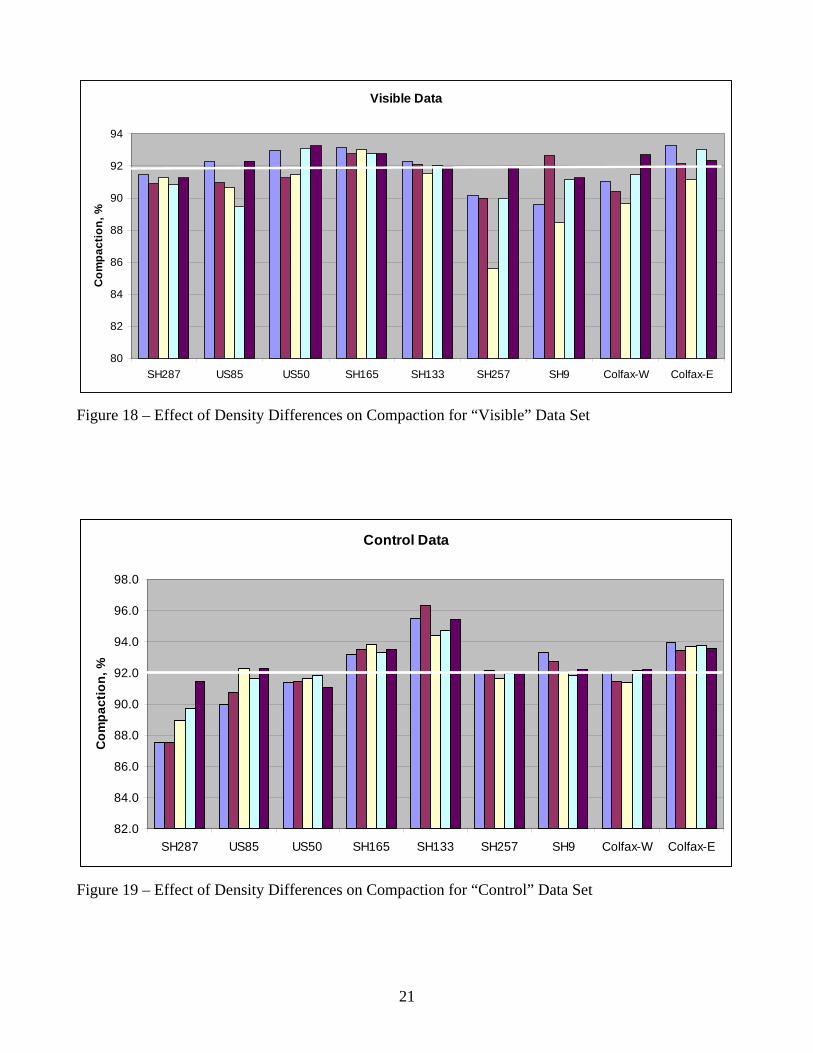
7.8 Effect of Segregation on Compaction
The average of the four density measurements obtained at each test position (1, 2, 3, 4 and 5)
using the nuclear gauge was compared to the maximum theoretical density of the paving
mixture reported from the mixture design and is shown in Figures 17, 18, and 19 for the Strip,
Visible and Control data sets, respectively. This data is a transformation of the data presented
in Appendix C and reinforces the relative effect of segregation on pavement construction
quality. For example, in the areas of strip segregation SH287, US85, SH257, and SH9 appear
to have less than the 92% relative compaction specified. For visible segregation, every project,
except SH165 failed to reach 92% relative compaction in the area of the segregated mixture.
Strip Data
84.0
86.0
88.0
90.0
92.0
94.0
96.0
98.0
SH287 US85 US50 SH165 SH133 SH257 SH9 Colfax-W Colfax-E
Com
pact
ion,
% 1
2
34
5
Figure 17 – Effect of Density Differences on Compaction for “Strip” Data Set
21
Visible Data
80
82
84
86
88
90
92
94
SH287 US85 US50 SH165 SH133 SH257 SH9 Colfax-W Colfax-E
Com
pact
ion,
%
Figure 18 – Effect of Density Differences on Compaction for “Visible” Data Set
Control Data
82.0
84.0
86.0
88.0
90.0
92.0
94.0
96.0
98.0
SH287 US85 US50 SH165 SH133 SH257 SH9 Colfax-W Colfax-E
Com
pact
ion,
%
Figure 19 – Effect of Density Differences on Compaction for “Control” Data Set
22
8.0 CONCLUSIONS
1. The nuclear density gauge can detect differences in density due to mixture segregation.
2. Nine construction projects were tested using the nuclear gauge to detect segregation. Variability in density readings was high between sites and probably is due to differences in segregation between sites, as was expected.
3. A statistically significant difference in density was measured at all sites for the transverse
“paver” density sets. The average difference in density was 5.4 pcf or approximately 3.8% of the pavement maximum unit weight.
4. A statistically significant difference in density was measured at eight of nine sites for the
“strip” density sets. The average difference in density was 1.7 pcf or approximately 1.1% of the pavement maximum unit weight. Four of the nine sites had less than 92% compaction in the location of the strip segregation.
5. A statistically significant difference in density was measured at five of nine sites for the
“visible” density sets. The average difference in density was 5.2 pcf or approximately 3.7% of the pavement maximum unit weight. Eight of the nine sites had less than 92% compaction in the location of the visible segregation.
6. A correlation between the nuclear density gauge and the PQI gauge was not apparent for the
“strip,” “visible,” “control,” or “paver” data sets. A relatively good relationship (R2 = 0.82) was observed for the “stop” data set.
23
9.0 RECOMMENDATIONS
No effort was made to collect density data relative to the level of segregation observed and it
is possible that in some cases, minimal or no segregation was present. Consequently, there is
relatively high variability in the data relative to a correlation between presumed segregated
areas and density differences.
The locations of the “strip” and “visible” segregation should be revisited. The level of
segregation observed at each site should be recorded. The data should be re-analyzed to
determine whether a correlation can be established between density differences and
segregation.
A full-scale test pavement should be constructed with differing levels of segregation.
Density tests should be conducted in the areas of segregation and compared with areas that
are not segregated. A relationship should be developed between the levels of segregation and
the density differences recorded.
24
REFERENCES
1. Colorado Department of Transportation Standard Specifications for Road and Bridge Construction, 1999.
2. Willoughby, Kim A., Mahoney, Joe P., Pierce, Linda M., Uhlmeyer, Jeff S., Anderson, Keith
W., Read, Steven A., Muench, Stephen T., Thompson, Travis R., and Moore, Robyn, “Construction-Related Asphalt Concrete Pavement Temperature Differentials and the Corresponding Density Differentials”, Washington State DOT, Report No. WA-RD 476.1, July 2001.
3. Harmelink, Donna, and Aschenbrener, Tim, “Extent of Top-Down Cracking in Colorado”,
Colorado DOT Report No. CDOT-DTD-R-2003-7, July 2003.

25
Appendix A - Nuclear Density Test Results
26
Colfax and SheridanStrip' Replicate 1 Replicate 2
Position Reading 1 Reading 2 Reading 3 Reading 4 Avg #3-(#2+#4)/2 #3-avg1 147.8 147.3 147.4 148.4 147.72 143.2 144.8 144.9 144.1 144.33 145.8 145.3 145.8 146.3 145.84 148.0 149.3 146.3 148.3 148.05 146.0 146.0 145.4 145.0 145.6
146.3 -0.3 -0.2SH50Strip' Replicate 1 Replicate 2
Position Reading 1 Reading 2 Reading 3 Reading 4 Avg #3-(#2+#4)/2 #3-avg1 137.4 135.8 139.3 136.5 137.32 139.6 139.6 139.3 141.4 140.03 141.0 142.8 142.3 141.6 141.94 141.0 141.6 141.1 141.6 141.35 138.4 139.3 139.8 141.0 139.6
140.0 1.3 0.8US 85 BusinessStrip' Replicate 1 Replicate 2
Position Reading 1 Reading 2 Reading 3 Reading 4 Avg #3-(#2+#4)/2 #3-avg1 138.6 137.8 137.9 136.1 137.62 135.6 134.8 136.2 137.9 136.13 137.4 137.9 135.3 134.1 136.24 139.5 139.6 140.3 140.8 140.15 142.1 141.3 141.1 142.1 141.7
138.3 -1.9 -1.3US287Strip' Replicate 1 Replicate 2
Position Reading 1 Reading 2 Reading 3 Reading 4 Avg #3-(#2+#4)/2 #3-avg1 139.8 145.2 143.7 143.4 143.02 144.9 145.5 144.1 146.4 145.23 136.8 137.2 136.5 137.0 136.94 140.8 140.3 139.8 137.8 139.75 140.2 141.1 140.0 139.8 140.3
141.0 -5.6 -3.7SH257-MillikenStrip' Replicate 1 Replicate 2
Position Reading 1 Reading 2 Reading 3 Reading 4 Avg #3-(#2+#4)/2 #3-avg1 139.4 140.5 138.5 141.5 140.02 140.3 141.4 141.3 142.7 141.43 136.9 136.9 137.1 137.7 137.24 138.4 138.8 138.3 138.7 138.65 136.5 137.4 136.7 136.7 136.8
138.8 -2.8 -1.9SH165Strip' Replicate 1 Replicate 2
Position Reading 1 Reading 2 Reading 3 Reading 4 Avg #3-(#2+#4)/2 #3-avg1 142.6 140.9 141.1 140.1 141.22 141.4 142.7 142.0 143.1 142.33 141.9 141.5 142.1 142.5 142.04 142.2 143.6 142.5 142.8 142.85 140.3 141.8 141.3 141.1 141.1
141.9 -0.5 -0.4SH9Strip' Replicate 1 Replicate 2
Position Reading 1 Reading 2 Reading 3 Reading 4 Avg #3-(#2+#4)/2 #3-avg1 137.6 137.0 139.2 138.2 138.02 139.3 139.0 140.5 140.2 139.83 136.9 137.6 136.7 137.2 137.14 139.6 140.1 137.7 139.2 139.25 137.7 136.9 138.0 136.7 137.3
138.3 -2.3 -1.6SH133Strip' Replicate 1 Replicate 2
Position Reading 1 Reading 2 Reading 3 Reading 4 Avg #3-(#2+#4)/2 #3-avg1 143.2 144.1 142.5 143.8 143.42 142.7 142.7 142.4 142.6 142.63 140.2 139.9 140.5 141.1 140.44 140.3 140.6 140.2 139.7 140.25 138.5 139.5 138.7 141.1 139.5
141.2 -1.0 -0.6Colfax-PeoriaStrip' Replicate 1 Replicate 2
Position Reading 1 Reading 2 Reading 3 Reading 4 Avg #3-(#2+#4)/2 #3-avg1 146.4 147.2 146.4 149.4 147.42 149.3 148.2 149.9 148.1 148.93 148.1 147.0 147.9 148.5 147.94 147.7 149.8 148.5 150.7 149.25 147.2 148.4 148.8 148.3 148.2
148.3 -1.2 -0.8
27
Colfax at SheridanControl Replicate 1 Replicate 2
Position Reading 1 Reading 2 Reading 3 Reading 4 Avg Lo-Hi Lo-Avg1 144.2 143.7 144.4 144.3 144.22 143.3 142.1 143.6 143.6 143.23 142.9 143.4 142.5 143.3 143.04 143.5 144.4 145.7 143.3 144.25 143.6 144.1 145.4 144.1 144.3
143.8 -1.3 -0.7Hwy 50Control Den Replicate 1 Replicate 2
Position Reading 1 Reading 2 Reading 3 Reading 4 Avg Lo-Hi Lo-Avg1 139.7 140.3 140.5 139.5 140.02 139.7 140.0 140.7 139.7 140.03 139.8 140.6 140.7 140.4 140.44 139.8 140.8 141.5 140.7 140.75 140.9 138.3 139.8 139.2 139.6
140.1 -1.1 -0.6US 85 BusinessControl Den Replicate 1 Replicate 2
Position Reading 1 Reading 2 Reading 3 Reading 4 Avg Lo-Hi Lo-Avg1 137.4 137.7 137.7 136.9 137.42 139.2 138.8 138.3 138.0 138.63 141.4 140.3 140.3 141.5 140.94 140.1 138.9 140.8 140.1 140.05 141.5 139.8 140.2 142.1 140.9
139.6 -3.5 -2.1US 287 Control Den Replicate 1 Replicate 2
Position Reading 1 Reading 2 Reading 3 Reading 4 Avg Lo-Hi Lo-Avg1 135.3 134.1 135.4 134.6 134.92 136.1 135.1 135.3 132.9 134.93 138.1 135.9 137.1 137.0 137.04 141.1 140.1 137.3 134.2 138.25 140.2 140.3 140.9 142.0 140.9
137.2 -6.0 -2.3SH 257-MillikenControl Den Replicate 1 Replicate 2
Position Reading 1 Reading 2 Reading 3 Reading 4 Avg Lo-Hi Lo-Avg1 141.7 139.0 140.0 139.8 140.12 139.8 139.6 141.1 141.0 140.43 139.9 140.9 138.4 139.1 139.64 139.4 139.5 140.3 141.0 140.15 141.4 138.4 140.4 139.8 140.0
140.0 -0.8 -0.4SH 165Control Den Replicate 1 Replicate 2
Position Reading 1 Reading 2 Reading 3 Reading 4 Avg Lo-Hi Lo-Avg1 141.7 141.2 142.2 140.3 141.42 141.8 142.3 143.2 140.1 141.93 142.2 142.2 143.0 141.9 142.34 142.0 140.4 141.9 141.9 141.65 141.3 141.5 143.2 141.4 141.9
141.8 -1.0 0.1
SH 9Control Replicate 1 Replicate 2
Position Reading 1 Reading 2 Reading 3 Reading 4 Avg Lo-Hi Lo-Avg1 141.0 141.7 0.0 0.0 141.42 140.5 140.6 0.0 0.0 140.63 139.6 139.5 0.0 0.0 139.64 139.5 138.8 0.0 0.0 139.25 139.7 139.8 0.0 0.0 139.8
140.1 0.6 -0.3
SH 133Control Den Replicate 1 Replicate 2
Position Reading 1 Reading 2 Reading 3 Reading 4 Avg Lo-Hi Lo-Avg1 143.0 143.1 143.7 143.7 143.42 144.3 144.9 144.1 145.3 144.73 141.9 138.9 142.5 143.5 141.74 143.9 141.2 143.4 140.3 142.25 144.0 144.0 143.7 141.4 143.3
143.0 1.1 0.2
Colfax-Peoria to PotomacControl Replicate 1 Replicate 2
Position Reading 1 Reading 2 Reading 3 Reading 4 Avg Lo-Hi Lo-Avg1 148.2 145.9 147.5 147.5 147.32 146.7 145.2 146.3 147.9 146.53 146.9 147.0 147.0 147.0 147.04 147.2 146.9 146.5 147.5 147.05 147.1 147.2 146.2 146.5 146.8
146.9 -0.3 -0.2
28
Colfax at SheridanVisible Replicate 1 Replicate 2
Position Reading 1 Reading 2 Reading 3 Reading 4 Avg #3-Hi #3-avg1 142.5 143.3 142.6 141.7 142.52 140.1 140.4 144.9 140.6 141.53 139.6 140.5 139.4 141.7 140.34 142.6 142.7 144.0 143.3 143.25 143.4 145.5 144.9 146.4 145.1
142.5 -4.7 -2.2Hwy 50Visible De Replicate 1 Replicate 2
Position Reading 1 Reading 2 Reading 3 Reading 4 Avg #3-Hi #3-avg1 143.1 142.6 141.7 142.1 142.42 138.3 139.9 140.7 140.1 139.83 137.3 141.5 138.8 142.9 140.14 142.3 141.7 142.4 144.2 142.75 141.4 143.0 143.3 143.7 142.9
141.6 -2.7 -1.4US 85 BusinessVisible De Replicate 1 Replicate 2
Position Reading 1 Reading 2 Reading 3 Reading 4 Avg #3-Hi #3-avg1 140.4 140.3 142.2 140.5 140.92 136.4 135.1 141.8 142.1 138.93 138.7 138.0 138.2 138.7 138.44 135.8 135.9 137.9 137.1 136.75 140.3 140.0 142.2 141.2 140.9
139.1 -2.5 -0.7US 287 Visible De Replicate 1 Replicate 2
Position Reading 1 Reading 2 Reading 3 Reading 4 Avg #3-Hi #3-avg1 141.7 141.4 139.5 140.8 140.92 140.1 140.6 139.8 139.6 140.03 140.9 140.7 139.5 141.4 140.64 140.7 139.8 139.3 139.8 139.95 141.1 140.9 139.6 140.6 140.6
140.4 -0.2 0.2SH 257-MillikenVisible De Replicate 1 Replicate 2
Position Reading 1 Reading 2 Reading 3 Reading 4 Avg #3-Hi #3-avg1 135.8 139.6 135.5 138.0 137.22 137.8 135.8 138.0 136.4 137.03 129.8 128.5 130.3 132.7 130.34 135.4 138.3 136.9 137.4 137.05 139.7 140.3 139.8 140.1 140.0
136.3 -9.7 -6.0SH 165Visible De Replicate 1 Replicate 2
Position Reading 1 Reading 2 Reading 3 Reading 4 Avg #3-Hi #3-avg1 140.7 139.1 144.3 141.0 141.32 140.4 140.4 141.8 140.1 140.73 140.5 141.6 140.7 141.5 141.14 140.4 140.1 140.3 141.9 140.75 142.9 139.9 139.5 140.5 140.7
140.9 0.4 0.2SH 9Visible Replicate 1 Replicate 2
Position Reading 1 Reading 2 Reading 3 Reading 4 Avg #3-Hi #3-avg1 135.6 137.0 134.6 135.8 135.82 139.7 141.0 139.7 141.2 140.43 133.7 134.0 132.9 135.4 134.04 138.8 138.3 136.9 138.5 138.15 137.6 137.6 138.9 138.8 138.2
137.3 -6.4 -3.3SH 133Visible De Replicate 1 Replicate 2
Position Reading 1 Reading 2 Reading 3 Reading 4 Avg #3-Hi #3-avg1 139.2 138.5 138.4 138.2 138.62 135.6 139.5 139.2 138.8 138.33 136.9 136.8 137.4 138.6 137.44 138.5 138.7 137.8 137.5 138.15 138.4 139.5 137.3 137.0 138.1
138.1 -1.1 -0.7Colfax-Peoria to PotomacVisible Replicate 1 Replicate 2
Position Reading 1 Reading 2 Reading 3 Reading 4 Avg #3-Hi #3-avg1 147.1 145.9 146.7 145.1 146.22 145.4 143.6 146.0 143.0 144.53 140.0 143.2 140.8 147.7 142.94 147.2 144.4 146.3 145.8 145.95 142.5 144.1 144.7 148.0 144.8
144.9 -3.3 -1.9
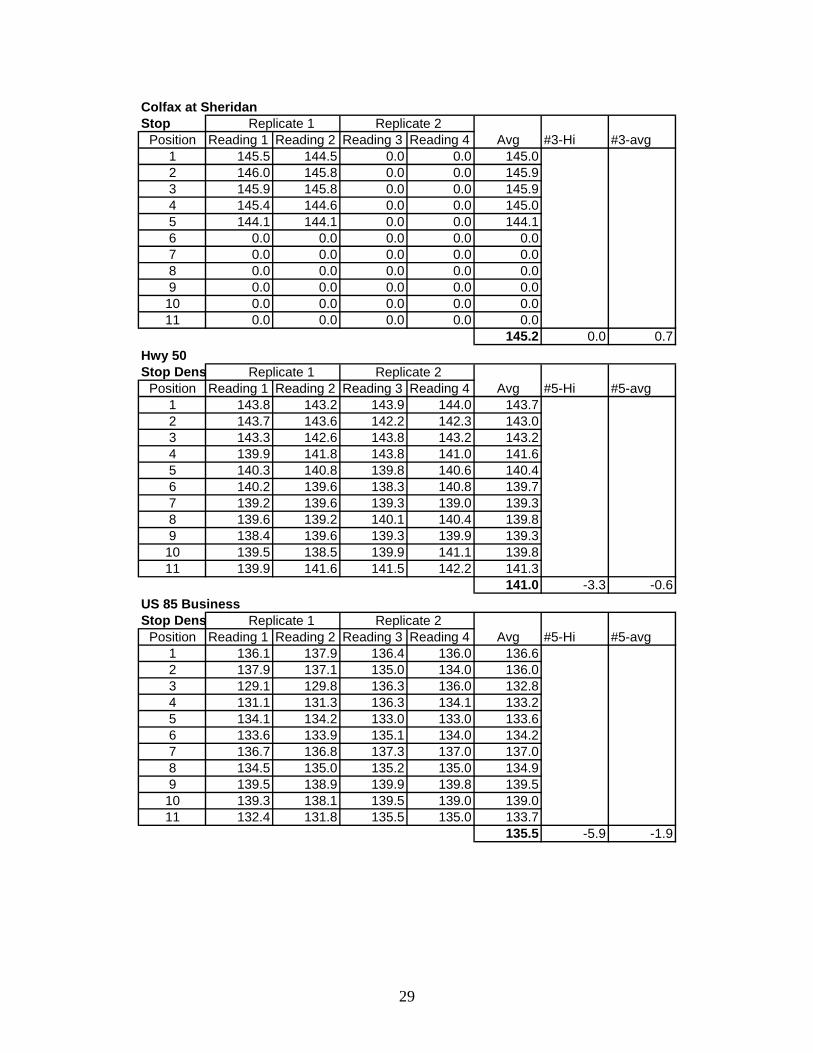
29
Colfax at SheridanStop Replicate 1 Replicate 2
Position Reading 1 Reading 2 Reading 3 Reading 4 Avg #3-Hi #3-avg1 145.5 144.5 0.0 0.0 145.02 146.0 145.8 0.0 0.0 145.93 145.9 145.8 0.0 0.0 145.94 145.4 144.6 0.0 0.0 145.05 144.1 144.1 0.0 0.0 144.16 0.0 0.0 0.0 0.0 0.07 0.0 0.0 0.0 0.0 0.08 0.0 0.0 0.0 0.0 0.09 0.0 0.0 0.0 0.0 0.010 0.0 0.0 0.0 0.0 0.011 0.0 0.0 0.0 0.0 0.0
145.2 0.0 0.7Hwy 50Stop Dens Replicate 1 Replicate 2
Position Reading 1 Reading 2 Reading 3 Reading 4 Avg #5-Hi #5-avg1 143.8 143.2 143.9 144.0 143.72 143.7 143.6 142.2 142.3 143.03 143.3 142.6 143.8 143.2 143.24 139.9 141.8 143.8 141.0 141.65 140.3 140.8 139.8 140.6 140.46 140.2 139.6 138.3 140.8 139.77 139.2 139.6 139.3 139.0 139.38 139.6 139.2 140.1 140.4 139.89 138.4 139.6 139.3 139.9 139.310 139.5 138.5 139.9 141.1 139.811 139.9 141.6 141.5 142.2 141.3
141.0 -3.3 -0.6US 85 BusinessStop Dens Replicate 1 Replicate 2
Position Reading 1 Reading 2 Reading 3 Reading 4 Avg #5-Hi #5-avg1 136.1 137.9 136.4 136.0 136.62 137.9 137.1 135.0 134.0 136.03 129.1 129.8 136.3 136.0 132.84 131.1 131.3 136.3 134.1 133.25 134.1 134.2 133.0 133.0 133.66 133.6 133.9 135.1 134.0 134.27 136.7 136.8 137.3 137.0 137.08 134.5 135.0 135.2 135.0 134.99 139.5 138.9 139.9 139.8 139.510 139.3 138.1 139.5 139.0 139.011 132.4 131.8 135.5 135.0 133.7
135.5 -5.9 -1.9
30
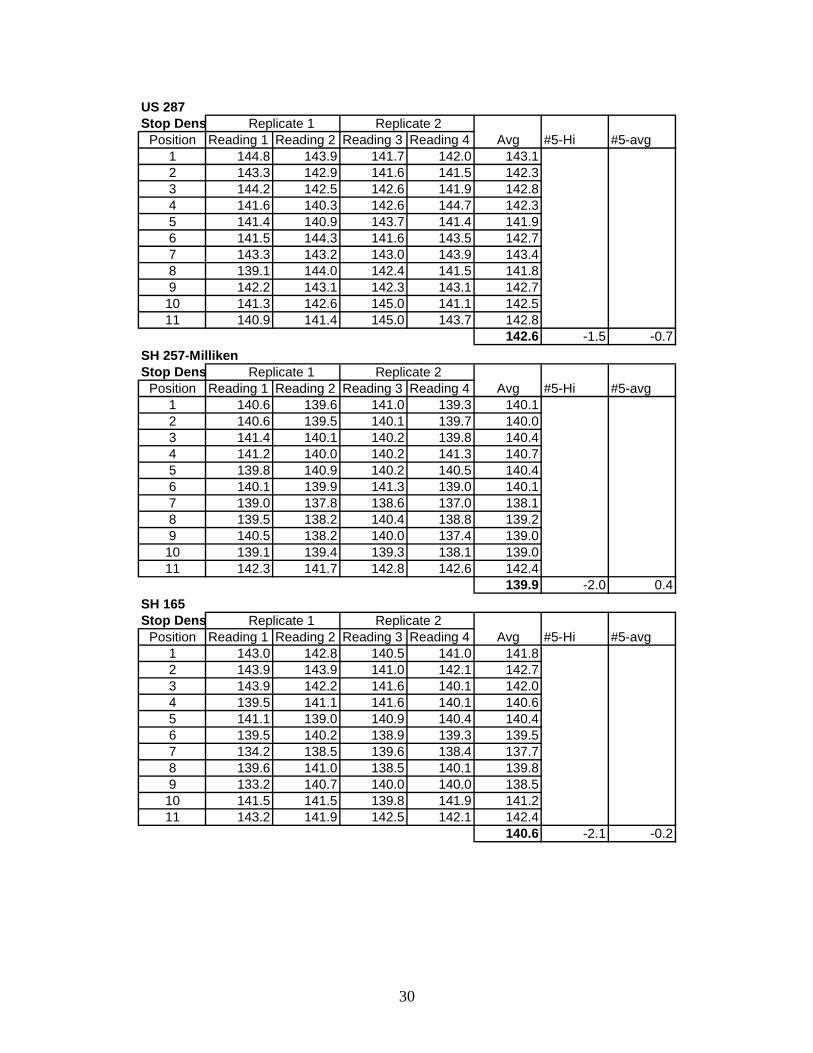
US 287 Stop Dens Replicate 1 Replicate 2
Position Reading 1 Reading 2 Reading 3 Reading 4 Avg #5-Hi #5-avg1 144.8 143.9 141.7 142.0 143.12 143.3 142.9 141.6 141.5 142.33 144.2 142.5 142.6 141.9 142.84 141.6 140.3 142.6 144.7 142.35 141.4 140.9 143.7 141.4 141.96 141.5 144.3 141.6 143.5 142.77 143.3 143.2 143.0 143.9 143.48 139.1 144.0 142.4 141.5 141.89 142.2 143.1 142.3 143.1 142.710 141.3 142.6 145.0 141.1 142.511 140.9 141.4 145.0 143.7 142.8
142.6 -1.5 -0.7SH 257-MillikenStop Dens Replicate 1 Replicate 2
Position Reading 1 Reading 2 Reading 3 Reading 4 Avg #5-Hi #5-avg1 140.6 139.6 141.0 139.3 140.12 140.6 139.5 140.1 139.7 140.03 141.4 140.1 140.2 139.8 140.44 141.2 140.0 140.2 141.3 140.75 139.8 140.9 140.2 140.5 140.46 140.1 139.9 141.3 139.0 140.17 139.0 137.8 138.6 137.0 138.18 139.5 138.2 140.4 138.8 139.29 140.5 138.2 140.0 137.4 139.010 139.1 139.4 139.3 138.1 139.011 142.3 141.7 142.8 142.6 142.4
139.9 -2.0 0.4SH 165Stop Dens Replicate 1 Replicate 2
Position Reading 1 Reading 2 Reading 3 Reading 4 Avg #5-Hi #5-avg1 143.0 142.8 140.5 141.0 141.82 143.9 143.9 141.0 142.1 142.73 143.9 142.2 141.6 140.1 142.04 139.5 141.1 141.6 140.1 140.65 141.1 139.0 140.9 140.4 140.46 139.5 140.2 138.9 139.3 139.57 134.2 138.5 139.6 138.4 137.78 139.6 141.0 138.5 140.1 139.89 133.2 140.7 140.0 140.0 138.510 141.5 141.5 139.8 141.9 141.211 143.2 141.9 142.5 142.1 142.4
140.6 -2.1 -0.2
31
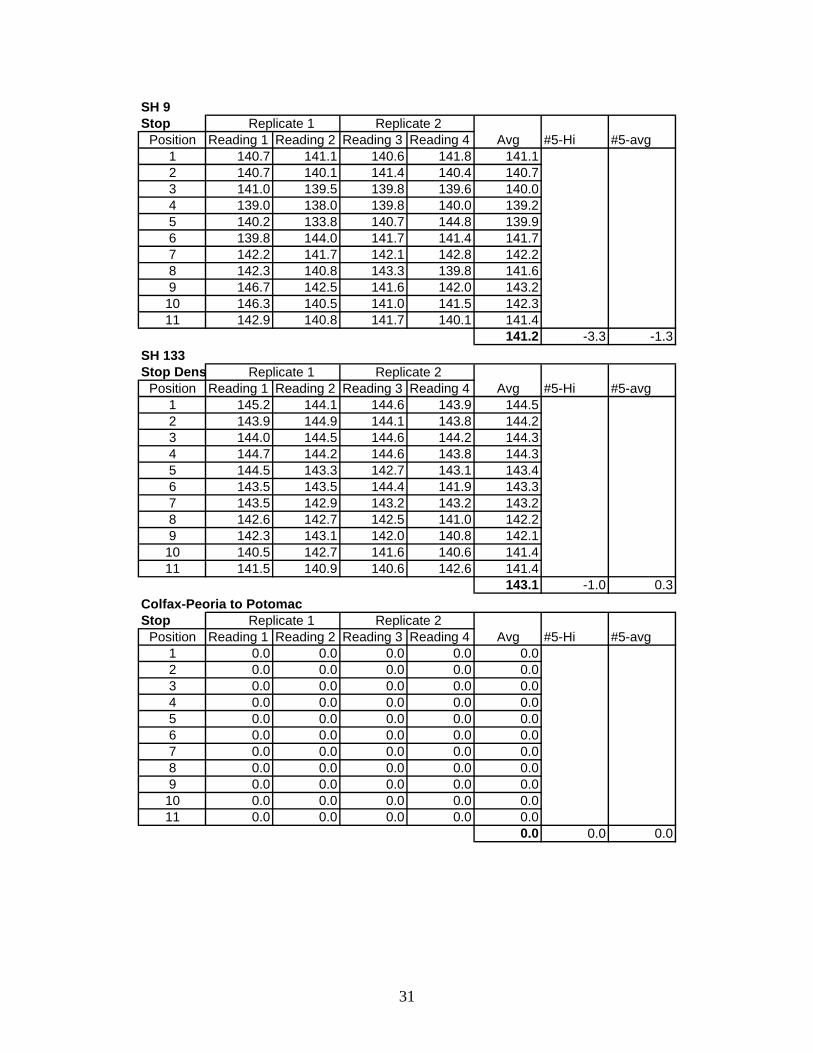
SH 9Stop Replicate 1 Replicate 2
Position Reading 1 Reading 2 Reading 3 Reading 4 Avg #5-Hi #5-avg1 140.7 141.1 140.6 141.8 141.12 140.7 140.1 141.4 140.4 140.73 141.0 139.5 139.8 139.6 140.04 139.0 138.0 139.8 140.0 139.25 140.2 133.8 140.7 144.8 139.96 139.8 144.0 141.7 141.4 141.77 142.2 141.7 142.1 142.8 142.28 142.3 140.8 143.3 139.8 141.69 146.7 142.5 141.6 142.0 143.210 146.3 140.5 141.0 141.5 142.311 142.9 140.8 141.7 140.1 141.4
141.2 -3.3 -1.3SH 133Stop Dens Replicate 1 Replicate 2
Position Reading 1 Reading 2 Reading 3 Reading 4 Avg #5-Hi #5-avg1 145.2 144.1 144.6 143.9 144.52 143.9 144.9 144.1 143.8 144.23 144.0 144.5 144.6 144.2 144.34 144.7 144.2 144.6 143.8 144.35 144.5 143.3 142.7 143.1 143.46 143.5 143.5 144.4 141.9 143.37 143.5 142.9 143.2 143.2 143.28 142.6 142.7 142.5 141.0 142.29 142.3 143.1 142.0 140.8 142.110 140.5 142.7 141.6 140.6 141.411 141.5 140.9 140.6 142.6 141.4
143.1 -1.0 0.3Colfax-Peoria to PotomacStop Replicate 1 Replicate 2
Position Reading 1 Reading 2 Reading 3 Reading 4 Avg #5-Hi #5-avg1 0.0 0.0 0.0 0.0 0.02 0.0 0.0 0.0 0.0 0.03 0.0 0.0 0.0 0.0 0.04 0.0 0.0 0.0 0.0 0.05 0.0 0.0 0.0 0.0 0.06 0.0 0.0 0.0 0.0 0.07 0.0 0.0 0.0 0.0 0.08 0.0 0.0 0.0 0.0 0.09 0.0 0.0 0.0 0.0 0.010 0.0 0.0 0.0 0.0 0.011 0.0 0.0 0.0 0.0 0.0
0.0 0.0 0.0
32
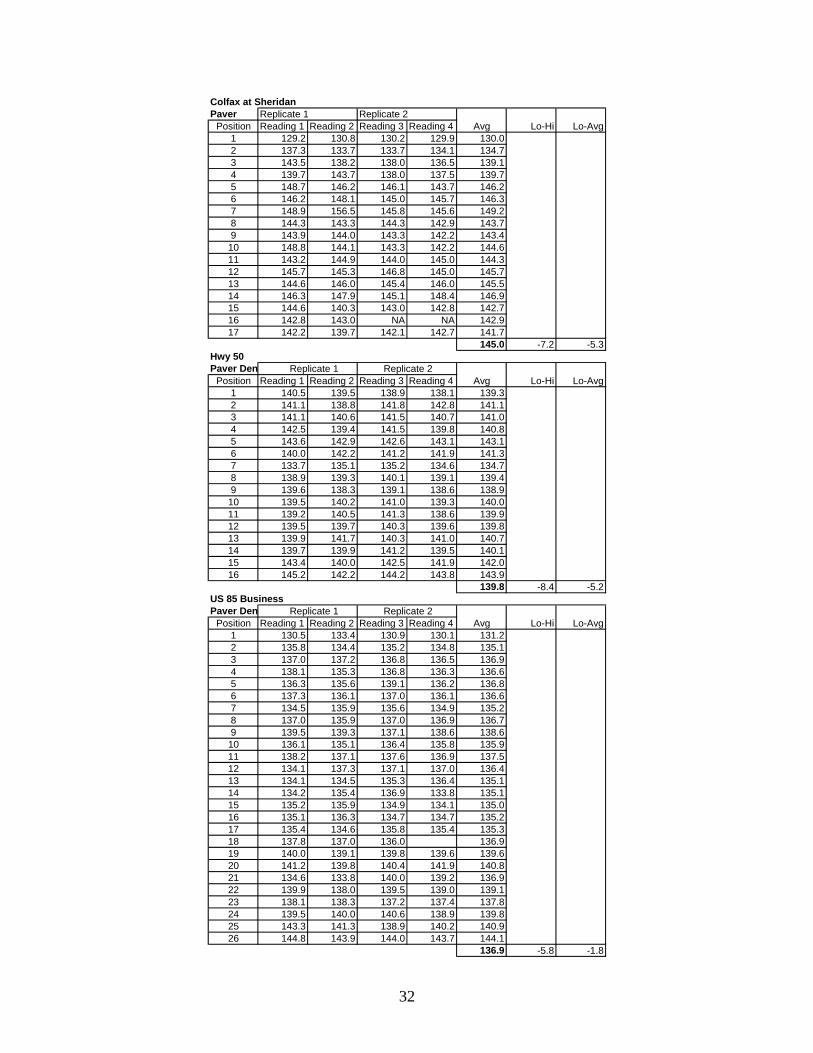
Colfax at SheridanPaver Replicate 1 Replicate 2
Position Reading 1 Reading 2 Reading 3 Reading 4 Avg Lo-Hi Lo-Avg1 129.2 130.8 130.2 129.9 130.02 137.3 133.7 133.7 134.1 134.73 143.5 138.2 138.0 136.5 139.14 139.7 143.7 138.0 137.5 139.75 148.7 146.2 146.1 143.7 146.26 146.2 148.1 145.0 145.7 146.37 148.9 156.5 145.8 145.6 149.28 144.3 143.3 144.3 142.9 143.79 143.9 144.0 143.3 142.2 143.4
10 148.8 144.1 143.3 142.2 144.611 143.2 144.9 144.0 145.0 144.312 145.7 145.3 146.8 145.0 145.713 144.6 146.0 145.4 146.0 145.514 146.3 147.9 145.1 148.4 146.915 144.6 140.3 143.0 142.8 142.716 142.8 143.0 NA NA 142.917 142.2 139.7 142.1 142.7 141.7
145.0 -7.2 -5.3Hwy 50Paver Den Replicate 1 Replicate 2
Position Reading 1 Reading 2 Reading 3 Reading 4 Avg Lo-Hi Lo-Avg1 140.5 139.5 138.9 138.1 139.32 141.1 138.8 141.8 142.8 141.13 141.1 140.6 141.5 140.7 141.04 142.5 139.4 141.5 139.8 140.85 143.6 142.9 142.6 143.1 143.16 140.0 142.2 141.2 141.9 141.37 133.7 135.1 135.2 134.6 134.78 138.9 139.3 140.1 139.1 139.49 139.6 138.3 139.1 138.6 138.9
10 139.5 140.2 141.0 139.3 140.011 139.2 140.5 141.3 138.6 139.912 139.5 139.7 140.3 139.6 139.813 139.9 141.7 140.3 141.0 140.714 139.7 139.9 141.2 139.5 140.115 143.4 140.0 142.5 141.9 142.016 145.2 142.2 144.2 143.8 143.9
139.8 -8.4 -5.2US 85 BusinessPaver Den Replicate 1 Replicate 2
Position Reading 1 Reading 2 Reading 3 Reading 4 Avg Lo-Hi Lo-Avg1 130.5 133.4 130.9 130.1 131.22 135.8 134.4 135.2 134.8 135.13 137.0 137.2 136.8 136.5 136.94 138.1 135.3 136.8 136.3 136.65 136.3 135.6 139.1 136.2 136.86 137.3 136.1 137.0 136.1 136.67 134.5 135.9 135.6 134.9 135.28 137.0 135.9 137.0 136.9 136.79 139.5 139.3 137.1 138.6 138.6
10 136.1 135.1 136.4 135.8 135.911 138.2 137.1 137.6 136.9 137.512 134.1 137.3 137.1 137.0 136.413 134.1 134.5 135.3 136.4 135.114 134.2 135.4 136.9 133.8 135.115 135.2 135.9 134.9 134.1 135.016 135.1 136.3 134.7 134.7 135.217 135.4 134.6 135.8 135.4 135.318 137.8 137.0 136.0 136.919 140.0 139.1 139.8 139.6 139.620 141.2 139.8 140.4 141.9 140.821 134.6 133.8 140.0 139.2 136.922 139.9 138.0 139.5 139.0 139.123 138.1 138.3 137.2 137.4 137.824 139.5 140.0 140.6 138.9 139.825 143.3 141.3 138.9 140.2 140.926 144.8 143.9 144.0 143.7 144.1
136.9 -5.8 -1.8
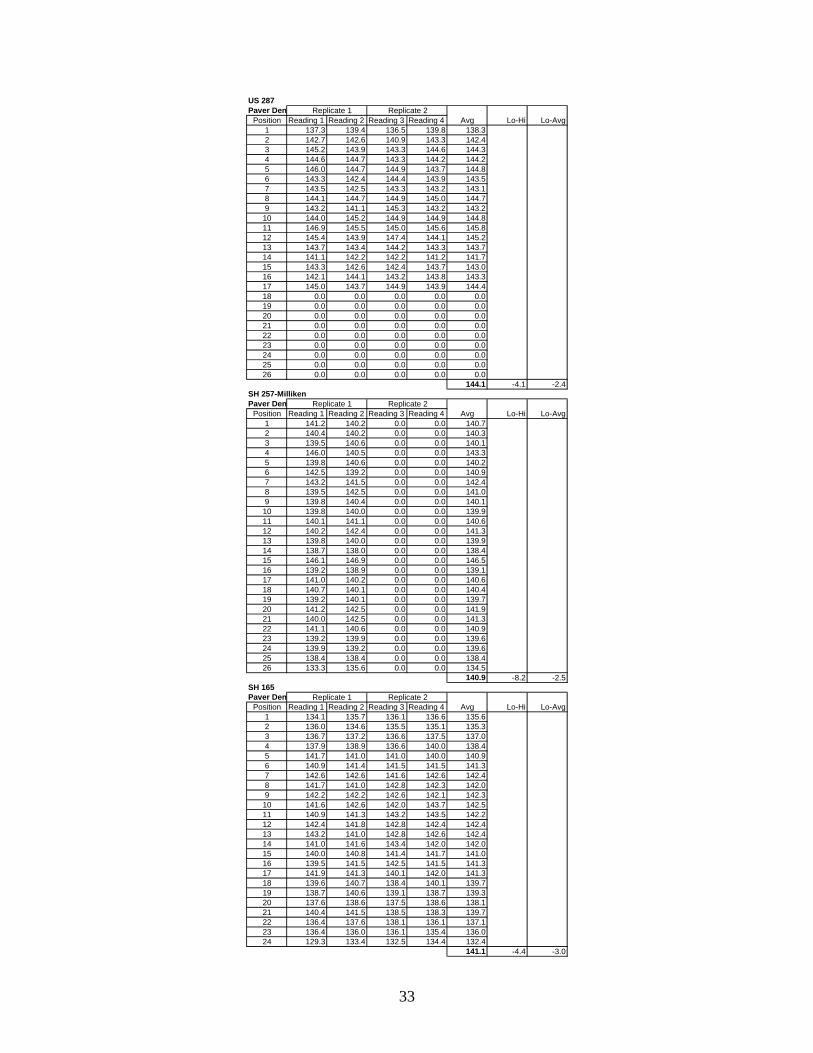
33
US 287 Paver Den Replicate 1 Replicate 2
Position Reading 1 Reading 2 Reading 3 Reading 4 Avg Lo-Hi Lo-Avg1 137.3 139.4 136.5 139.8 138.32 142.7 142.6 140.9 143.3 142.43 145.2 143.9 143.3 144.6 144.34 144.6 144.7 143.3 144.2 144.25 146.0 144.7 144.9 143.7 144.86 143.3 142.4 144.4 143.9 143.57 143.5 142.5 143.3 143.2 143.18 144.1 144.7 144.9 145.0 144.79 143.2 141.1 145.3 143.2 143.2
10 144.0 145.2 144.9 144.9 144.811 146.9 145.5 145.0 145.6 145.812 145.4 143.9 147.4 144.1 145.213 143.7 143.4 144.2 143.3 143.714 141.1 142.2 142.2 141.2 141.715 143.3 142.6 142.4 143.7 143.016 142.1 144.1 143.2 143.8 143.317 145.0 143.7 144.9 143.9 144.418 0.0 0.0 0.0 0.0 0.019 0.0 0.0 0.0 0.0 0.020 0.0 0.0 0.0 0.0 0.021 0.0 0.0 0.0 0.0 0.022 0.0 0.0 0.0 0.0 0.023 0.0 0.0 0.0 0.0 0.024 0.0 0.0 0.0 0.0 0.025 0.0 0.0 0.0 0.0 0.026 0.0 0.0 0.0 0.0 0.0
144.1 -4.1 -2.4SH 257-MillikenPaver Den Replicate 1 Replicate 2
Position Reading 1 Reading 2 Reading 3 Reading 4 Avg Lo-Hi Lo-Avg1 141.2 140.2 0.0 0.0 140.72 140.4 140.2 0.0 0.0 140.33 139.5 140.6 0.0 0.0 140.14 146.0 140.5 0.0 0.0 143.35 139.8 140.6 0.0 0.0 140.26 142.5 139.2 0.0 0.0 140.97 143.2 141.5 0.0 0.0 142.48 139.5 142.5 0.0 0.0 141.09 139.8 140.4 0.0 0.0 140.1
10 139.8 140.0 0.0 0.0 139.911 140.1 141.1 0.0 0.0 140.612 140.2 142.4 0.0 0.0 141.313 139.8 140.0 0.0 0.0 139.914 138.7 138.0 0.0 0.0 138.415 146.1 146.9 0.0 0.0 146.516 139.2 138.9 0.0 0.0 139.117 141.0 140.2 0.0 0.0 140.618 140.7 140.1 0.0 0.0 140.419 139.2 140.1 0.0 0.0 139.720 141.2 142.5 0.0 0.0 141.921 140.0 142.5 0.0 0.0 141.322 141.1 140.6 0.0 0.0 140.923 139.2 139.9 0.0 0.0 139.624 139.9 139.2 0.0 0.0 139.625 138.4 138.4 0.0 0.0 138.426 133.3 135.6 0.0 0.0 134.5
140.9 -8.2 -2.5SH 165Paver Den Replicate 1 Replicate 2
Position Reading 1 Reading 2 Reading 3 Reading 4 Avg Lo-Hi Lo-Avg1 134.1 135.7 136.1 136.6 135.62 136.0 134.6 135.5 135.1 135.33 136.7 137.2 136.6 137.5 137.04 137.9 138.9 136.6 140.0 138.45 141.7 141.0 141.0 140.0 140.96 140.9 141.4 141.5 141.5 141.37 142.6 142.6 141.6 142.6 142.48 141.7 141.0 142.8 142.3 142.09 142.2 142.2 142.6 142.1 142.3
10 141.6 142.6 142.0 143.7 142.511 140.9 141.3 143.2 143.5 142.212 142.4 141.8 142.8 142.4 142.413 143.2 141.0 142.8 142.6 142.414 141.0 141.6 143.4 142.0 142.015 140.0 140.8 141.4 141.7 141.016 139.5 141.5 142.5 141.5 141.317 141.9 141.3 140.1 142.0 141.318 139.6 140.7 138.4 140.1 139.719 138.7 140.6 139.1 138.7 139.320 137.6 138.6 137.5 138.6 138.121 140.4 141.5 138.5 138.3 139.722 136.4 137.6 138.1 136.1 137.123 136.4 136.0 136.1 135.4 136.024 129.3 133.4 132.5 134.4 132.4
141.1 -4.4 -3.0
34
SH 9Paver Replicate 1 Replicate 2
Position Reading 1 Reading 2 Reading 3 Reading 4 Avg Lo-Hi Lo-Avg1 133.9 136.5 134.2 136.8 135.42 130.3 138.3 140.9 140.0 137.43 139.4 136.7 138.2 139.5 138.54 139.1 141.0 138.2 139.6 139.55 139.8 140.2 139.6 139.7 139.86 139.4 140.3 141.1 140.9 140.47 139.1 138.3 140.4 139.5 139.38 139.1 139.6 138.1 139.4 139.19 138.3 137.9 138.6 137.9 138.2
10 138.1 139.9 138.9 140.2 139.311 137.6 139.9 137.6 139.7 138.712 139.8 139.3 139.0 138.7 139.213 137.3 139.7 138.8 140.0 139.014 139.6 139.4 137.5 134.4 137.715 136.3 137.9 135.7 138.6 137.116 137.7 136.3 136.0 139.7 137.417 136.2 133.1 136.3 134.9 135.118 128.9 127.7 129.6 126.1 128.119 120.6 123.9 120.8 127.5 123.2
138.8 -3.3 -1.7SH 133Paver Den Replicate 1 Replicate 2
Position Reading 1 Reading 2 Reading 3 Reading 4 Avg Lo-Hi Lo-Avg1 137.7 137.5 134.1 134.3 135.92 137.0 135.7 137.6 136.2 136.63 135.2 136.9 138.9 139.4 137.64 139.7 138.6 138.9 137.5 138.75 138.8 138.9 138.3 139.5 138.96 140.7 138.7 139.8 138.8 139.57 139.4 140.8 138.3 136.5 138.88 140.8 141.5 137.7 138.1 139.59 141.0 141.7 140.6 139.2 140.6
10 140.9 140.1 140.8 139.4 140.311 140.9 139.6 141.1 140.4 140.512 141.6 142.7 138.4 140.7 140.913 139.8 142.4 141.8 140.3 141.114 140.7 142.4 136.5 139.8 139.915 142.5 141.6 140.4 143.2 141.916 142.1 141.1 142.7 136.6 140.617 141.3 142.2 141.3 140.6 141.418 140.9 141.1 139.7 140.3 140.519 139.8 139.8 139.4 138.9 139.520 135.1 135.6 135.0 135.0 135.221 133.1 134.1 134.6 131.8 133.422 127.2 132.9 131.4 131.6 130.823 139.4 146.8 0.0 0.0 71.6
139.4 -3.3 -0.7Colfax-Peoria to PotomacPaver Replicate 1 Replicate 2
Position Reading 1 Reading 2 Reading 3 Reading 4 Avg Lo-Hi Lo-Avg1 139.6 139.9 138.6 139.7 139.52 141.9 142.7 139.9 141.8 141.63 144.7 146.4 145.4 144.0 145.14 145.5 146.0 145.4 147.0 146.05 146.6 147.2 147.0 147.7 147.16 147.6 148.6 148.5 146.5 147.87 147.5 147.6 146.5 147.9 147.48 146.7 145.3 146.0 145.7 145.99 146.3 145.2 146.6 145.0 145.8
10 145.4 145.2 143.9 145.1 144.911 139.9 145.5 145.9 145.0 144.112 145.8 147.6 146.9 149.8 147.513 148.5 147.7 148.5 146.2 147.714 147.3 146.8 140.7 147.3 145.515 145.8 140.7 145.3 145.9 144.416 145.2 142.8 144.4 144.2 144.217 142.2 139.7 142.1 142.7 141.7
146.3 -3.7 -2.3

35
Appendix B – ANOVA Nuclear Density Tests
36
Colfax and SheridanStrip'SUMMARY
Groups Count Sum Average Variance1 4 590.9 147.725 0.2491672 4 577 144.25 0.6166673 4 583.2 145.8 0.1666674 4 591.9 147.975 1.5558335 4 582.4 145.6 0.24
ANOVASource of Variation SS df MS F P-value F crit Signif ?
Between Groups 39.097 4 9.77425 17.27917 1.73E-05 3.055568 YesWithin Groups 8.485 15 0.565667
Total 47.582 19
SH50Strip'SUMMARY
Groups Count Sum Average Variance1 4 549 137.25 2.2966672 4 559.9 139.975 0.92253 4 567.7 141.925 0.62254 4 565.3 141.325 0.10255 4 558.5 139.625 1.175833
ANOVASource of Variation SS df MS F P-value F crit Signif ?
Between Groups 52.652 4 13.163 12.85449 9.69E-05 3.055568 YesWithin Groups 15.36 15 1.024
Total 68.012 19
US 85 BusinessStrip'SUMMARY
Groups Count Sum Average Variance1 4 550.4 137.6 1.1266672 4 544.5 136.125 1.7291673 4 544.7 136.175 3.18254 4 560.2 140.05 0.3766675 4 566.6 141.65 0.276667
ANOVASource of Variation SS df MS F P-value F crit Signif ?
Between Groups 96.077 4 24.01925 17.94714 1.38E-05 3.055568 YesWithin Groups 20.075 15 1.338333
Total 116.152 19
37
US287Strip'SUMMARY
Groups Count Sum Average Variance1 4 572.1 143.025 5.24252 4 580.9 145.225 0.94253 4 547.5 136.875 0.0891674 4 558.7 139.675 1.7291675 4 561.1 140.275 0.329167
ANOVASource of Variation SS df MS F P-value F crit Signif ?
Between Groups 164.988 4 41.247 24.75068 1.86E-06 3.055568 YesWithin Groups 24.9975 15 1.6665
Total 189.9855 19
SH257-MillikenStrip'SUMMARY
Groups Count Sum Average Variance1 4 559.9 139.975 1.70252 4 565.7 141.425 0.9691673 4 548.6 137.15 0.1433334 4 554.2 138.55 0.0566675 4 547.3 136.825 0.155833
ANOVASource of Variation SS df MS F P-value F crit Signif ?
Between Groups 59.823 4 14.95575 24.69983 1.89E-06 3.055568 YesWithin Groups 9.0825 15 0.6055
Total 68.9055 19
SH165Strip'SUMMARY
Groups Count Sum Average Variance1 4 564.7 141.175 1.0891672 4 569.2 142.3 0.5666673 4 568 142 0.1733334 4 571.1 142.775 0.36255 4 564.5 141.125 0.389167
ANOVASource of Variation SS df MS F P-value F crit Signif ?
Between Groups 8.235 4 2.05875 3.988537 0.021253 3.055568 YesWithin Groups 7.7425 15 0.516167
Total 15.9775 19
38
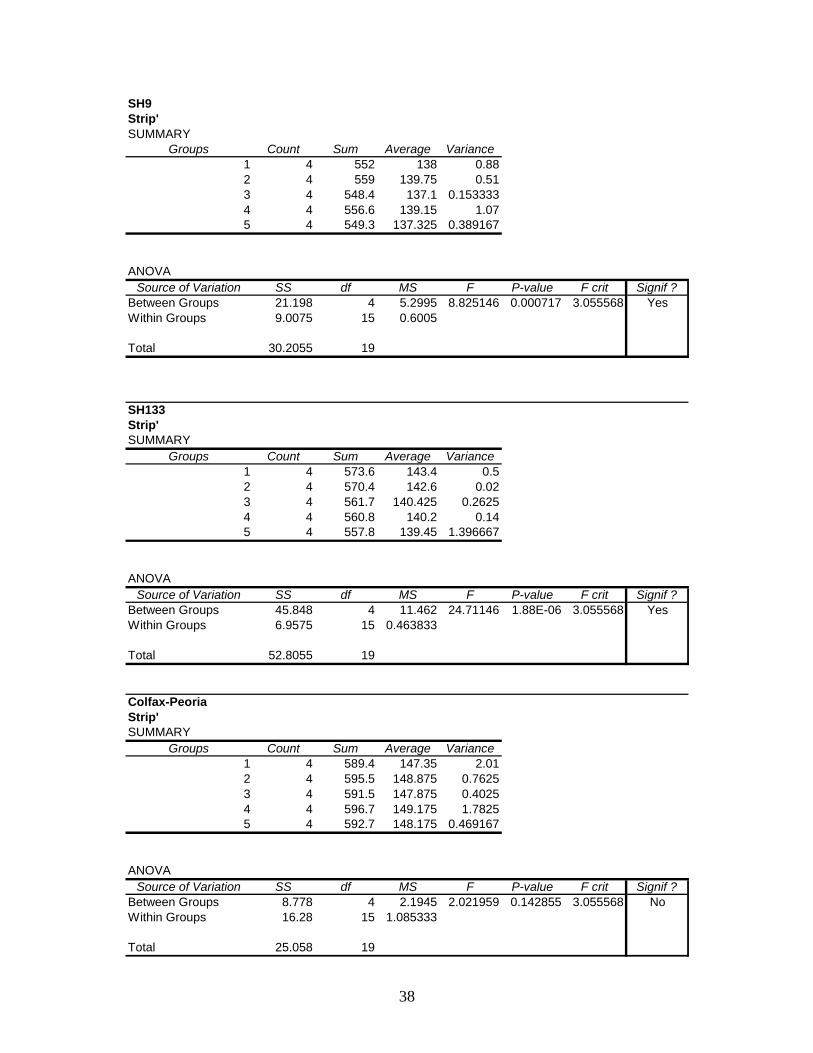
SH9Strip'SUMMARY
Groups Count Sum Average Variance1 4 552 138 0.882 4 559 139.75 0.513 4 548.4 137.1 0.1533334 4 556.6 139.15 1.075 4 549.3 137.325 0.389167
ANOVASource of Variation SS df MS F P-value F crit Signif ?
Between Groups 21.198 4 5.2995 8.825146 0.000717 3.055568 YesWithin Groups 9.0075 15 0.6005
Total 30.2055 19
SH133Strip'SUMMARY
Groups Count Sum Average Variance1 4 573.6 143.4 0.52 4 570.4 142.6 0.023 4 561.7 140.425 0.26254 4 560.8 140.2 0.145 4 557.8 139.45 1.396667
ANOVASource of Variation SS df MS F P-value F crit Signif ?
Between Groups 45.848 4 11.462 24.71146 1.88E-06 3.055568 YesWithin Groups 6.9575 15 0.463833
Total 52.8055 19
Colfax-PeoriaStrip'SUMMARY
Groups Count Sum Average Variance1 4 589.4 147.35 2.012 4 595.5 148.875 0.76253 4 591.5 147.875 0.40254 4 596.7 149.175 1.78255 4 592.7 148.175 0.469167
ANOVASource of Variation SS df MS F P-value F crit Signif ?
Between Groups 8.778 4 2.1945 2.021959 0.142855 3.055568 NoWithin Groups 16.28 15 1.085333
Total 25.058 19

39
Colfax at SheridanControlSUMMARY
Groups Count Sum Average Variance1 4 576.6 144.15 0.0966672 4 572.6 143.15 0.513 4 572.1 143.025 0.1691674 4 576.9 144.225 1.1958335 4 577.2 144.3 0.593333
ANOVASource of Variation SS df MS F P-value F crit Signif ?
Between Groups 6.287 4 1.57175 3.06384 0.049603 3.055568 BarelyWithin Groups 7.695 15 0.513
Total 13.982 19
Hwy 50Control DensitiesSUMMARY
Groups Count Sum Average Variance1 4 560 140 0.2266672 4 560.1 140.025 0.22253 4 561.5 140.375 0.16254 4 562.8 140.7 0.4866675 4 558.2 139.55 1.19
ANOVASource of Variation SS df MS F P-value F crit Signif ?
Between Groups 2.997 4 0.74925 1.637109 0.216688 3.055568 NoWithin Groups 6.865 15 0.457667
Total 9.862 19
US 85 BusinessControl DensitiesSUMMARY
Groups Count Sum Average Variance1 4 549.7 137.425 0.14252 4 554.3 138.575 0.28253 4 563.5 140.875 0.44254 4 559.9 139.975 0.62255 4 563.6 140.9 1.166667
ANOVASource of Variation SS df MS F P-value F crit Signif ?
Between Groups 36.9 4 9.225 17.36198 1.69E-05 3.055568 YesWithin Groups 7.97 15 0.531333
Total 44.87 19
40
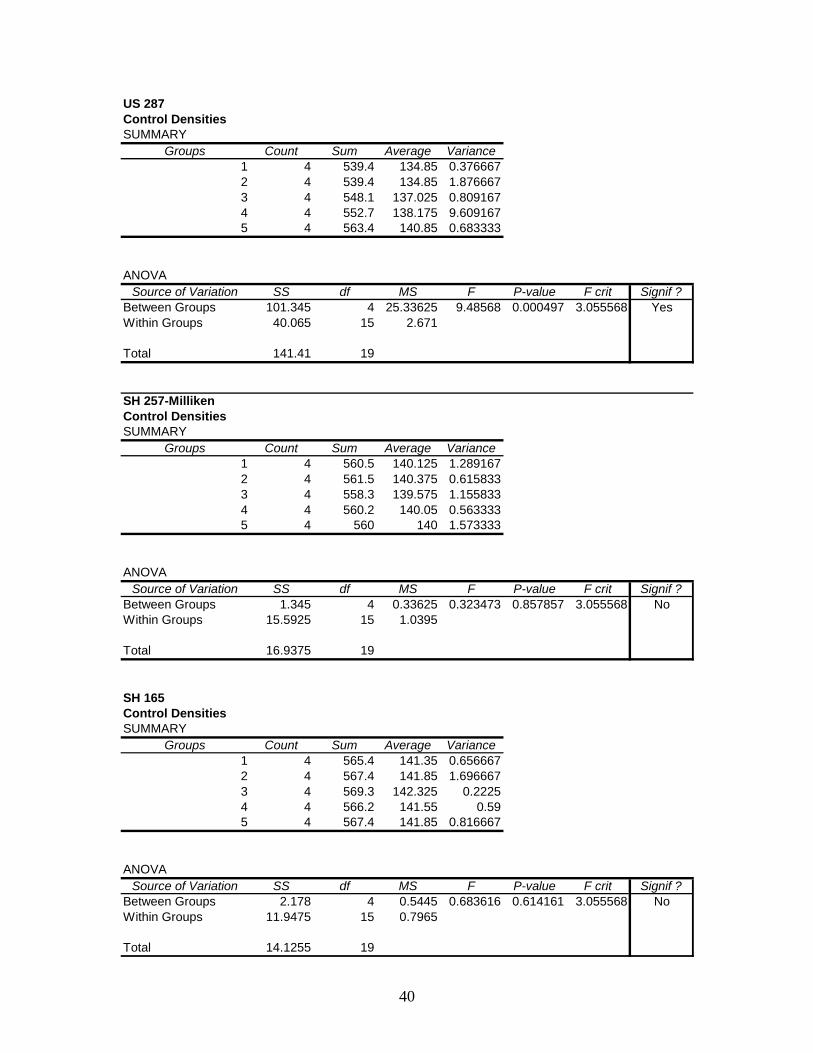
US 287 Control DensitiesSUMMARY
Groups Count Sum Average Variance1 4 539.4 134.85 0.3766672 4 539.4 134.85 1.8766673 4 548.1 137.025 0.8091674 4 552.7 138.175 9.6091675 4 563.4 140.85 0.683333
ANOVASource of Variation SS df MS F P-value F crit Signif ?
Between Groups 101.345 4 25.33625 9.48568 0.000497 3.055568 YesWithin Groups 40.065 15 2.671
Total 141.41 19
SH 257-MillikenControl DensitiesSUMMARY
Groups Count Sum Average Variance1 4 560.5 140.125 1.2891672 4 561.5 140.375 0.6158333 4 558.3 139.575 1.1558334 4 560.2 140.05 0.5633335 4 560 140 1.573333
ANOVASource of Variation SS df MS F P-value F crit Signif ?
Between Groups 1.345 4 0.33625 0.323473 0.857857 3.055568 NoWithin Groups 15.5925 15 1.0395
Total 16.9375 19
SH 165Control DensitiesSUMMARY
Groups Count Sum Average Variance1 4 565.4 141.35 0.6566672 4 567.4 141.85 1.6966673 4 569.3 142.325 0.22254 4 566.2 141.55 0.595 4 567.4 141.85 0.816667
ANOVASource of Variation SS df MS F P-value F crit Signif ?
Between Groups 2.178 4 0.5445 0.683616 0.614161 3.055568 NoWithin Groups 11.9475 15 0.7965
Total 14.1255 19
41
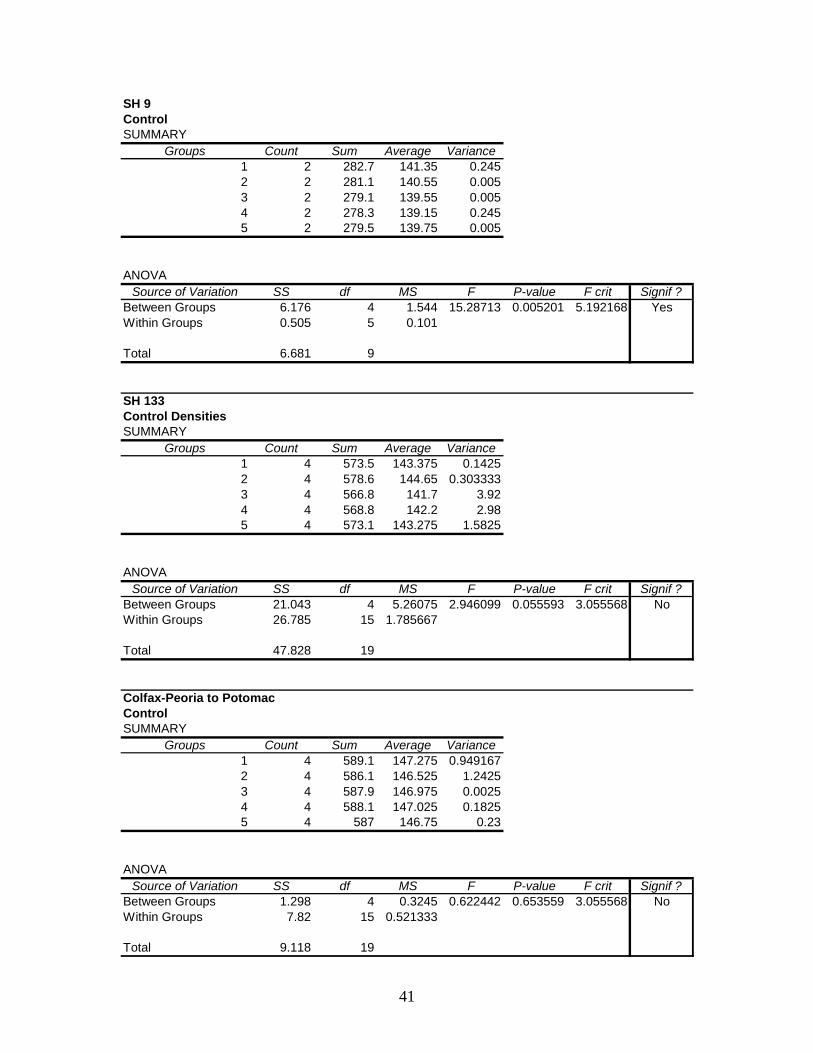
SH 9ControlSUMMARY
Groups Count Sum Average Variance1 2 282.7 141.35 0.2452 2 281.1 140.55 0.0053 2 279.1 139.55 0.0054 2 278.3 139.15 0.2455 2 279.5 139.75 0.005
ANOVASource of Variation SS df MS F P-value F crit Signif ?
Between Groups 6.176 4 1.544 15.28713 0.005201 5.192168 YesWithin Groups 0.505 5 0.101
Total 6.681 9
SH 133Control DensitiesSUMMARY
Groups Count Sum Average Variance1 4 573.5 143.375 0.14252 4 578.6 144.65 0.3033333 4 566.8 141.7 3.924 4 568.8 142.2 2.985 4 573.1 143.275 1.5825
ANOVASource of Variation SS df MS F P-value F crit Signif ?
Between Groups 21.043 4 5.26075 2.946099 0.055593 3.055568 NoWithin Groups 26.785 15 1.785667
Total 47.828 19
Colfax-Peoria to PotomacControlSUMMARY
Groups Count Sum Average Variance1 4 589.1 147.275 0.9491672 4 586.1 146.525 1.24253 4 587.9 146.975 0.00254 4 588.1 147.025 0.18255 4 587 146.75 0.23
ANOVASource of Variation SS df MS F P-value F crit Signif ?
Between Groups 1.298 4 0.3245 0.622442 0.653559 3.055568 NoWithin Groups 7.82 15 0.521333
Total 9.118 19
42
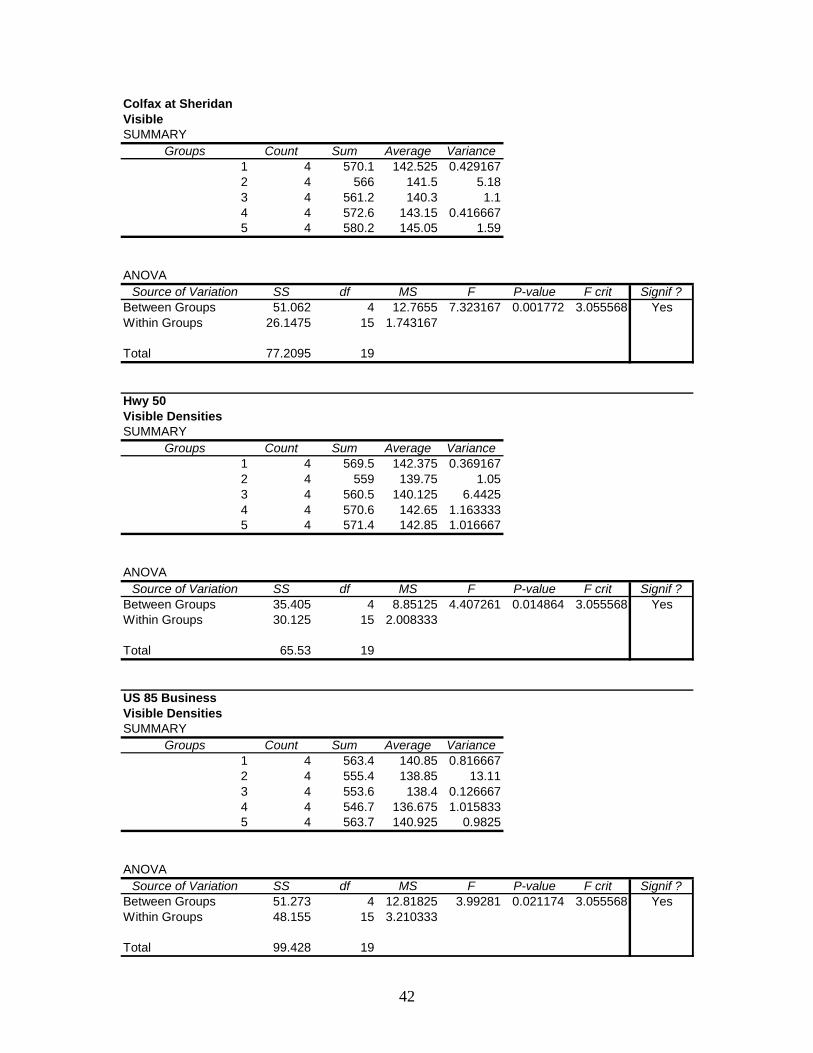
Colfax at SheridanVisibleSUMMARY
Groups Count Sum Average Variance1 4 570.1 142.525 0.4291672 4 566 141.5 5.183 4 561.2 140.3 1.14 4 572.6 143.15 0.4166675 4 580.2 145.05 1.59
ANOVASource of Variation SS df MS F P-value F crit Signif ?
Between Groups 51.062 4 12.7655 7.323167 0.001772 3.055568 YesWithin Groups 26.1475 15 1.743167
Total 77.2095 19
Hwy 50Visible DensitiesSUMMARY
Groups Count Sum Average Variance1 4 569.5 142.375 0.3691672 4 559 139.75 1.053 4 560.5 140.125 6.44254 4 570.6 142.65 1.1633335 4 571.4 142.85 1.016667
ANOVASource of Variation SS df MS F P-value F crit Signif ?
Between Groups 35.405 4 8.85125 4.407261 0.014864 3.055568 YesWithin Groups 30.125 15 2.008333
Total 65.53 19
US 85 BusinessVisible DensitiesSUMMARY
Groups Count Sum Average Variance1 4 563.4 140.85 0.8166672 4 555.4 138.85 13.113 4 553.6 138.4 0.1266674 4 546.7 136.675 1.0158335 4 563.7 140.925 0.9825
ANOVASource of Variation SS df MS F P-value F crit Signif ?
Between Groups 51.273 4 12.81825 3.99281 0.021174 3.055568 YesWithin Groups 48.155 15 3.210333
Total 99.428 19
43
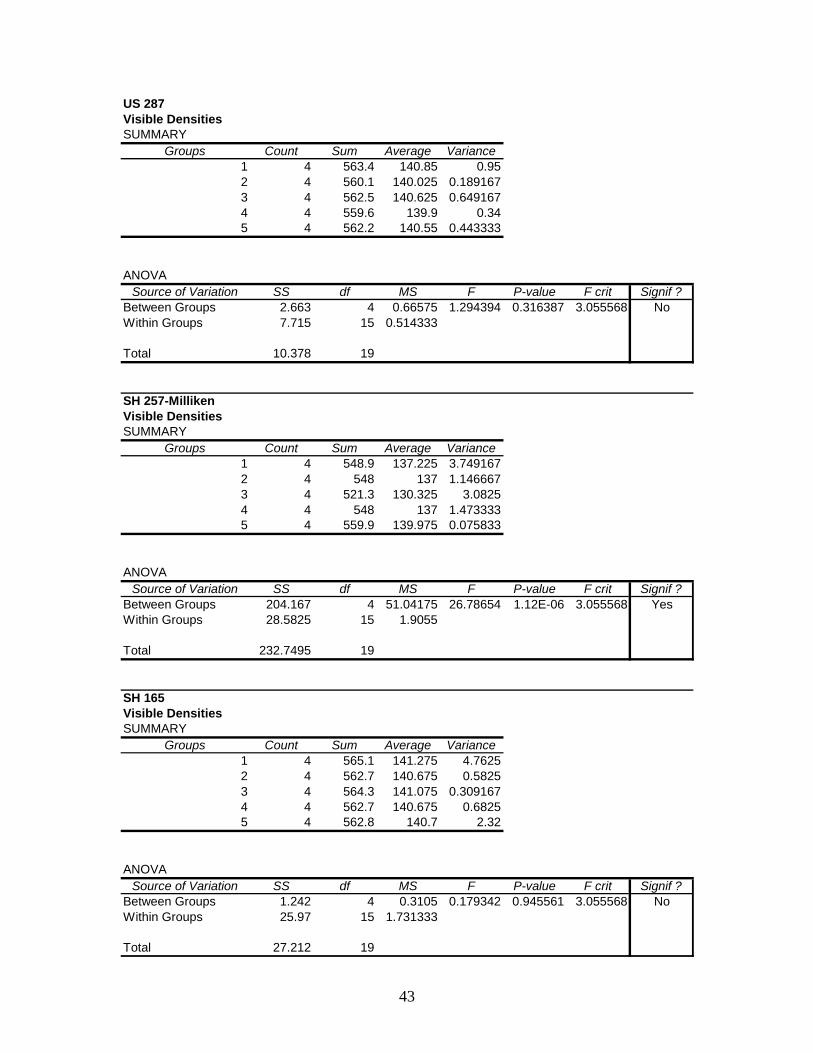
US 287 Visible DensitiesSUMMARY
Groups Count Sum Average Variance1 4 563.4 140.85 0.952 4 560.1 140.025 0.1891673 4 562.5 140.625 0.6491674 4 559.6 139.9 0.345 4 562.2 140.55 0.443333
ANOVASource of Variation SS df MS F P-value F crit Signif ?
Between Groups 2.663 4 0.66575 1.294394 0.316387 3.055568 NoWithin Groups 7.715 15 0.514333
Total 10.378 19
SH 257-MillikenVisible DensitiesSUMMARY
Groups Count Sum Average Variance1 4 548.9 137.225 3.7491672 4 548 137 1.1466673 4 521.3 130.325 3.08254 4 548 137 1.4733335 4 559.9 139.975 0.075833
ANOVASource of Variation SS df MS F P-value F crit Signif ?
Between Groups 204.167 4 51.04175 26.78654 1.12E-06 3.055568 YesWithin Groups 28.5825 15 1.9055
Total 232.7495 19
SH 165Visible DensitiesSUMMARY
Groups Count Sum Average Variance1 4 565.1 141.275 4.76252 4 562.7 140.675 0.58253 4 564.3 141.075 0.3091674 4 562.7 140.675 0.68255 4 562.8 140.7 2.32
ANOVASource of Variation SS df MS F P-value F crit Signif ?
Between Groups 1.242 4 0.3105 0.179342 0.945561 3.055568 NoWithin Groups 25.97 15 1.731333
Total 27.212 19
44
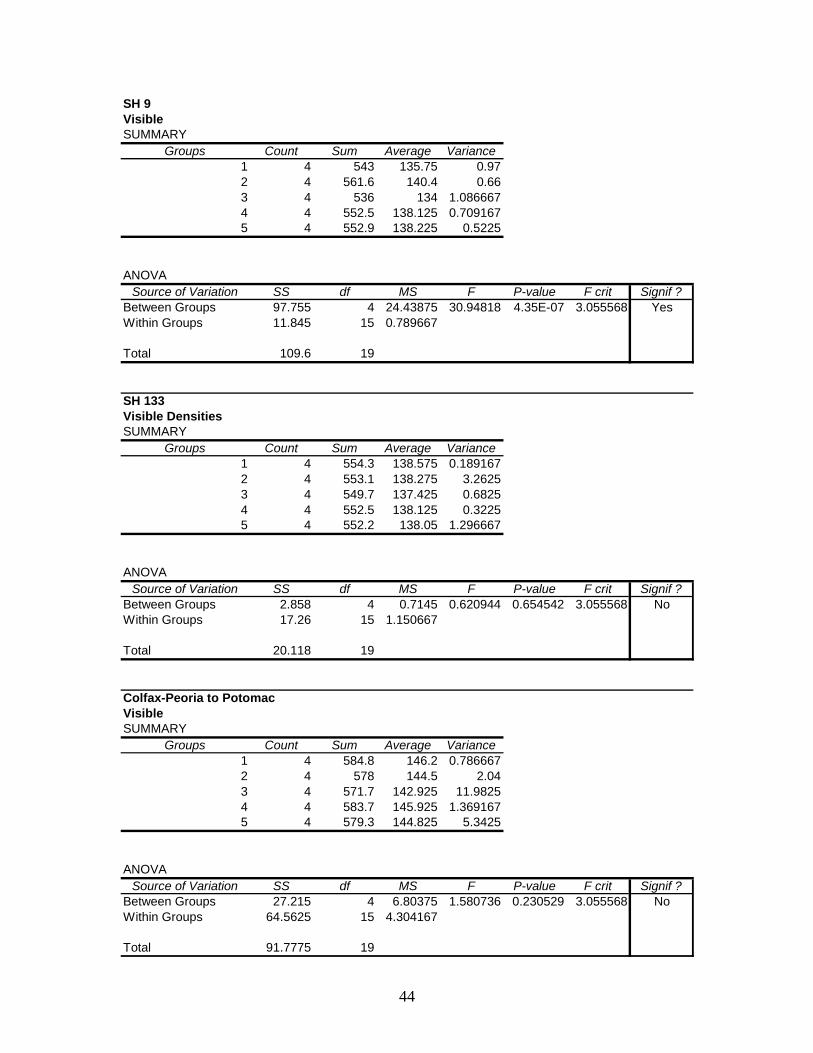
SH 9VisibleSUMMARY
Groups Count Sum Average Variance1 4 543 135.75 0.972 4 561.6 140.4 0.663 4 536 134 1.0866674 4 552.5 138.125 0.7091675 4 552.9 138.225 0.5225
ANOVASource of Variation SS df MS F P-value F crit Signif ?
Between Groups 97.755 4 24.43875 30.94818 4.35E-07 3.055568 YesWithin Groups 11.845 15 0.789667
Total 109.6 19
SH 133Visible DensitiesSUMMARY
Groups Count Sum Average Variance1 4 554.3 138.575 0.1891672 4 553.1 138.275 3.26253 4 549.7 137.425 0.68254 4 552.5 138.125 0.32255 4 552.2 138.05 1.296667
ANOVASource of Variation SS df MS F P-value F crit Signif ?
Between Groups 2.858 4 0.7145 0.620944 0.654542 3.055568 NoWithin Groups 17.26 15 1.150667
Total 20.118 19
Colfax-Peoria to PotomacVisibleSUMMARY
Groups Count Sum Average Variance1 4 584.8 146.2 0.7866672 4 578 144.5 2.043 4 571.7 142.925 11.98254 4 583.7 145.925 1.3691675 4 579.3 144.825 5.3425
ANOVASource of Variation SS df MS F P-value F crit Signif ?
Between Groups 27.215 4 6.80375 1.580736 0.230529 3.055568 NoWithin Groups 64.5625 15 4.304167
Total 91.7775 19
45
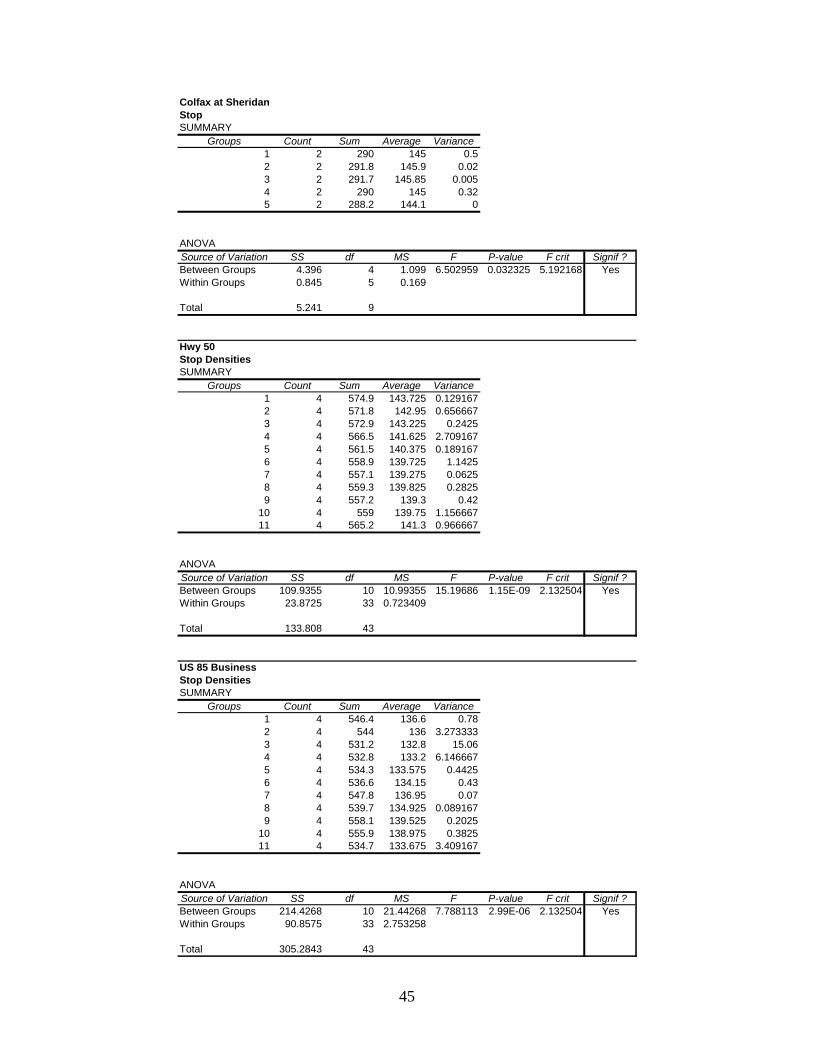
Colfax at SheridanStopSUMMARY
Groups Count Sum Average Variance1 2 290 145 0.52 2 291.8 145.9 0.023 2 291.7 145.85 0.0054 2 290 145 0.325 2 288.2 144.1 0
ANOVASource of Variation SS df MS F P-value F crit Signif ?Between Groups 4.396 4 1.099 6.502959 0.032325 5.192168 YesWithin Groups 0.845 5 0.169
Total 5.241 9
Hwy 50Stop DensitiesSUMMARY
Groups Count Sum Average Variance1 4 574.9 143.725 0.1291672 4 571.8 142.95 0.6566673 4 572.9 143.225 0.24254 4 566.5 141.625 2.7091675 4 561.5 140.375 0.1891676 4 558.9 139.725 1.14257 4 557.1 139.275 0.06258 4 559.3 139.825 0.28259 4 557.2 139.3 0.42
10 4 559 139.75 1.15666711 4 565.2 141.3 0.966667
ANOVASource of Variation SS df MS F P-value F crit Signif ?Between Groups 109.9355 10 10.99355 15.19686 1.15E-09 2.132504 YesWithin Groups 23.8725 33 0.723409
Total 133.808 43
US 85 BusinessStop DensitiesSUMMARY
Groups Count Sum Average Variance1 4 546.4 136.6 0.782 4 544 136 3.2733333 4 531.2 132.8 15.064 4 532.8 133.2 6.1466675 4 534.3 133.575 0.44256 4 536.6 134.15 0.437 4 547.8 136.95 0.078 4 539.7 134.925 0.0891679 4 558.1 139.525 0.2025
10 4 555.9 138.975 0.382511 4 534.7 133.675 3.409167
ANOVASource of Variation SS df MS F P-value F crit Signif ?Between Groups 214.4268 10 21.44268 7.788113 2.99E-06 2.132504 YesWithin Groups 90.8575 33 2.753258
Total 305.2843 43
46
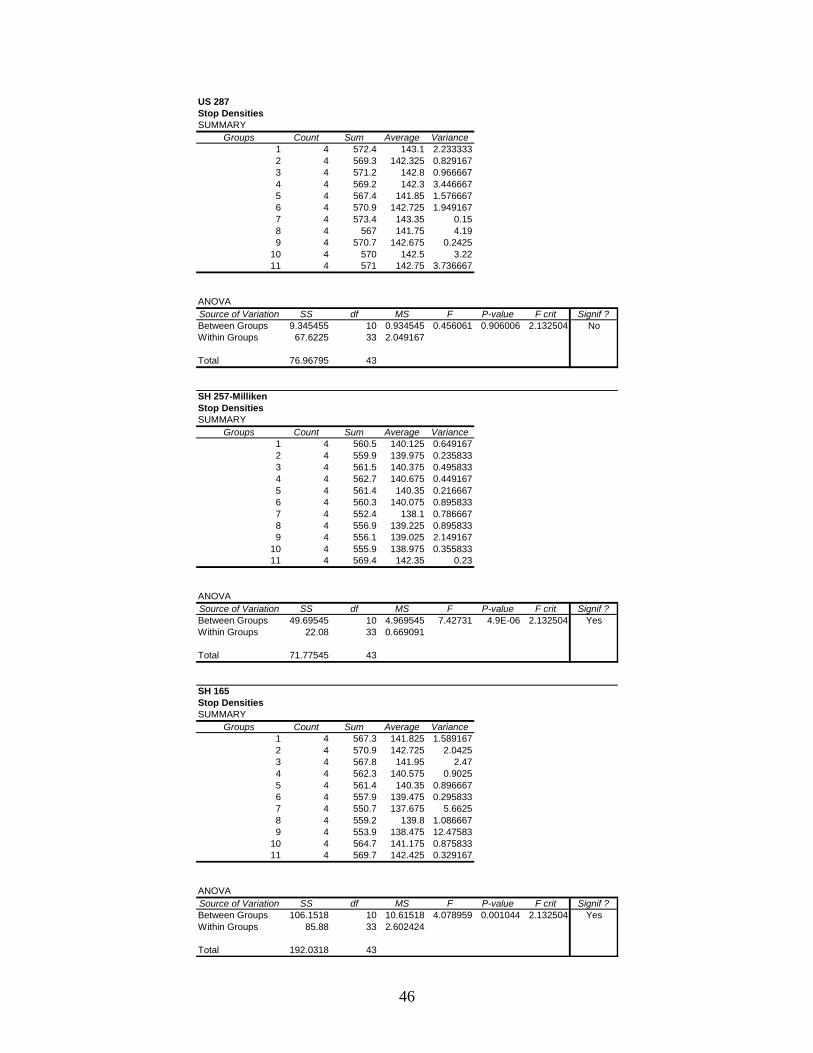
US 287 Stop DensitiesSUMMARY
Groups Count Sum Average Variance1 4 572.4 143.1 2.2333332 4 569.3 142.325 0.8291673 4 571.2 142.8 0.9666674 4 569.2 142.3 3.4466675 4 567.4 141.85 1.5766676 4 570.9 142.725 1.9491677 4 573.4 143.35 0.158 4 567 141.75 4.199 4 570.7 142.675 0.2425
10 4 570 142.5 3.2211 4 571 142.75 3.736667
ANOVASource of Variation SS df MS F P-value F crit Signif ?Between Groups 9.345455 10 0.934545 0.456061 0.906006 2.132504 NoWithin Groups 67.6225 33 2.049167
Total 76.96795 43
SH 257-MillikenStop DensitiesSUMMARY
Groups Count Sum Average Variance1 4 560.5 140.125 0.6491672 4 559.9 139.975 0.2358333 4 561.5 140.375 0.4958334 4 562.7 140.675 0.4491675 4 561.4 140.35 0.2166676 4 560.3 140.075 0.8958337 4 552.4 138.1 0.7866678 4 556.9 139.225 0.8958339 4 556.1 139.025 2.149167
10 4 555.9 138.975 0.35583311 4 569.4 142.35 0.23
ANOVASource of Variation SS df MS F P-value F crit Signif ?Between Groups 49.69545 10 4.969545 7.42731 4.9E-06 2.132504 YesWithin Groups 22.08 33 0.669091
Total 71.77545 43
SH 165Stop DensitiesSUMMARY
Groups Count Sum Average Variance1 4 567.3 141.825 1.5891672 4 570.9 142.725 2.04253 4 567.8 141.95 2.474 4 562.3 140.575 0.90255 4 561.4 140.35 0.8966676 4 557.9 139.475 0.2958337 4 550.7 137.675 5.66258 4 559.2 139.8 1.0866679 4 553.9 138.475 12.47583
10 4 564.7 141.175 0.87583311 4 569.7 142.425 0.329167
ANOVASource of Variation SS df MS F P-value F crit Signif ?Between Groups 106.1518 10 10.61518 4.078959 0.001044 2.132504 YesWithin Groups 85.88 33 2.602424
Total 192.0318 43
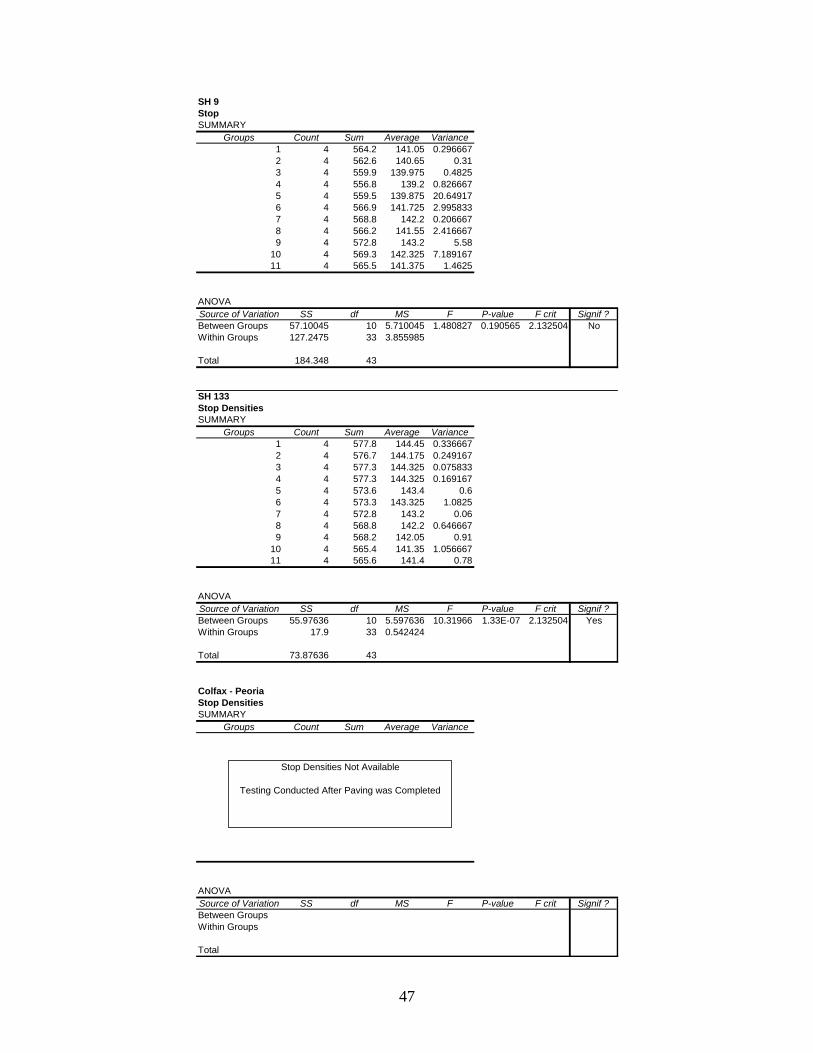
47
SH 9StopSUMMARY
Groups Count Sum Average Variance1 4 564.2 141.05 0.2966672 4 562.6 140.65 0.313 4 559.9 139.975 0.48254 4 556.8 139.2 0.8266675 4 559.5 139.875 20.649176 4 566.9 141.725 2.9958337 4 568.8 142.2 0.2066678 4 566.2 141.55 2.4166679 4 572.8 143.2 5.58
10 4 569.3 142.325 7.18916711 4 565.5 141.375 1.4625
ANOVASource of Variation SS df MS F P-value F crit Signif ?Between Groups 57.10045 10 5.710045 1.480827 0.190565 2.132504 NoWithin Groups 127.2475 33 3.855985
Total 184.348 43
SH 133Stop DensitiesSUMMARY
Groups Count Sum Average Variance1 4 577.8 144.45 0.3366672 4 576.7 144.175 0.2491673 4 577.3 144.325 0.0758334 4 577.3 144.325 0.1691675 4 573.6 143.4 0.66 4 573.3 143.325 1.08257 4 572.8 143.2 0.068 4 568.8 142.2 0.6466679 4 568.2 142.05 0.91
10 4 565.4 141.35 1.05666711 4 565.6 141.4 0.78
ANOVASource of Variation SS df MS F P-value F crit Signif ?Between Groups 55.97636 10 5.597636 10.31966 1.33E-07 2.132504 YesWithin Groups 17.9 33 0.542424
Total 73.87636 43
Colfax - PeoriaStop DensitiesSUMMARY
Groups Count Sum Average Variance
ANOVASource of Variation SS df MS F P-value F crit Signif ?Between GroupsWithin Groups
Total
Stop Densities Not Available
Testing Conducted After Paving was Completed
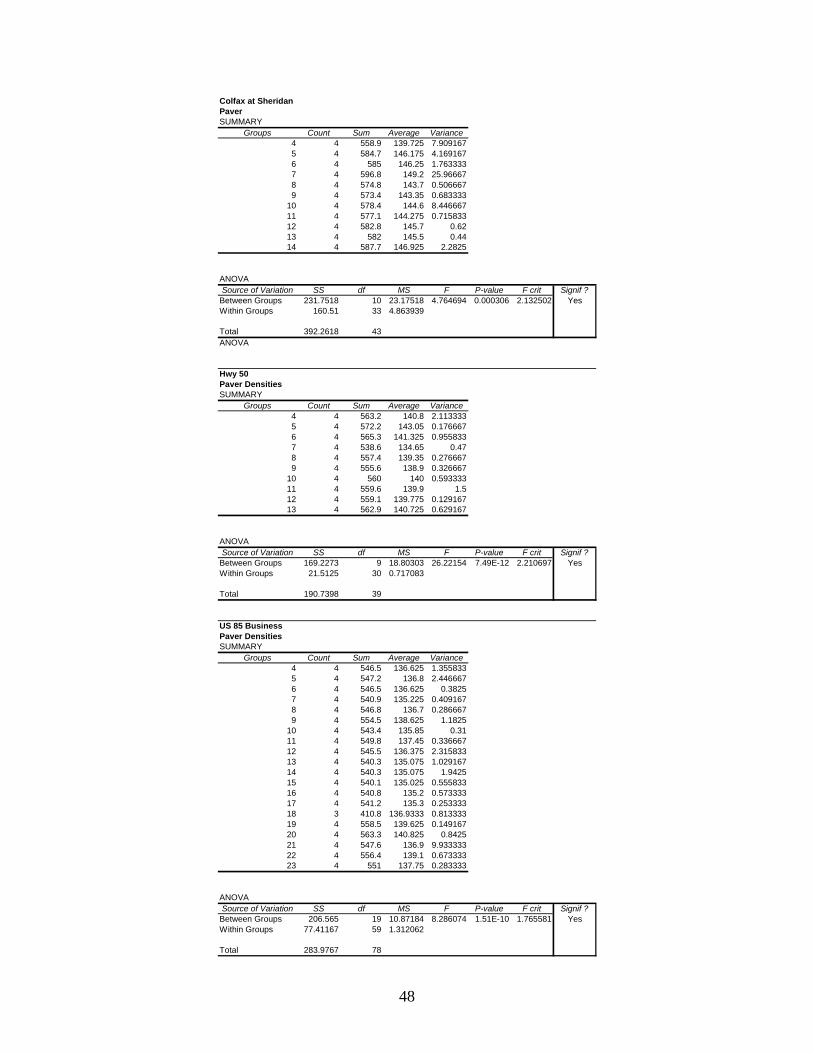
48
Colfax at SheridanPaverSUMMARY
Groups Count Sum Average Variance4 4 558.9 139.725 7.9091675 4 584.7 146.175 4.1691676 4 585 146.25 1.7633337 4 596.8 149.2 25.966678 4 574.8 143.7 0.5066679 4 573.4 143.35 0.683333
10 4 578.4 144.6 8.44666711 4 577.1 144.275 0.71583312 4 582.8 145.7 0.6213 4 582 145.5 0.4414 4 587.7 146.925 2.2825
ANOVASource of Variation SS df MS F P-value F crit Signif ?
Between Groups 231.7518 10 23.17518 4.764694 0.000306 2.132502 YesWithin Groups 160.51 33 4.863939
Total 392.2618 43ANOVA
Hwy 50Paver DensitiesSUMMARY
Groups Count Sum Average Variance4 4 563.2 140.8 2.1133335 4 572.2 143.05 0.1766676 4 565.3 141.325 0.9558337 4 538.6 134.65 0.478 4 557.4 139.35 0.2766679 4 555.6 138.9 0.326667
10 4 560 140 0.59333311 4 559.6 139.9 1.512 4 559.1 139.775 0.12916713 4 562.9 140.725 0.629167
ANOVASource of Variation SS df MS F P-value F crit Signif ?
Between Groups 169.2273 9 18.80303 26.22154 7.49E-12 2.210697 YesWithin Groups 21.5125 30 0.717083
Total 190.7398 39
US 85 BusinessPaver DensitiesSUMMARY
Groups Count Sum Average Variance4 4 546.5 136.625 1.3558335 4 547.2 136.8 2.4466676 4 546.5 136.625 0.38257 4 540.9 135.225 0.4091678 4 546.8 136.7 0.2866679 4 554.5 138.625 1.1825
10 4 543.4 135.85 0.3111 4 549.8 137.45 0.33666712 4 545.5 136.375 2.31583313 4 540.3 135.075 1.02916714 4 540.3 135.075 1.942515 4 540.1 135.025 0.55583316 4 540.8 135.2 0.57333317 4 541.2 135.3 0.25333318 3 410.8 136.9333 0.81333319 4 558.5 139.625 0.14916720 4 563.3 140.825 0.842521 4 547.6 136.9 9.93333322 4 556.4 139.1 0.67333323 4 551 137.75 0.283333
ANOVASource of Variation SS df MS F P-value F crit Signif ?
Between Groups 206.565 19 10.87184 8.286074 1.51E-10 1.765581 YesWithin Groups 77.41167 59 1.312062
Total 283.9767 78
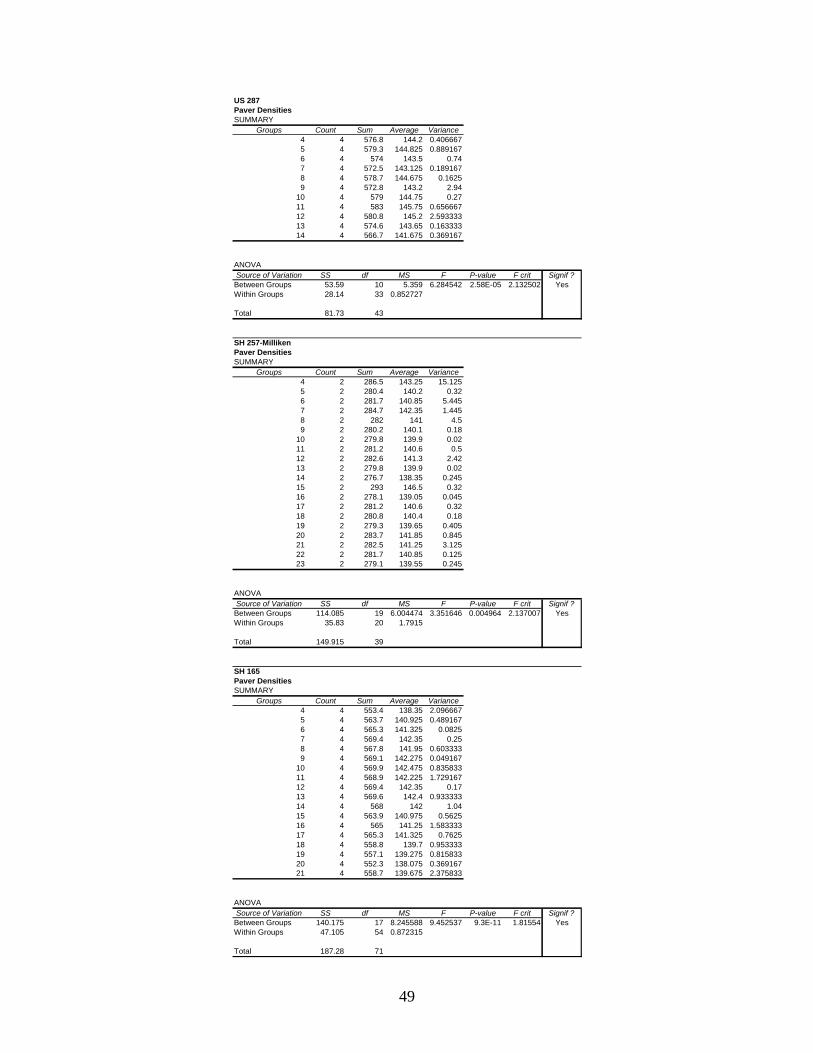
49
US 287 Paver DensitiesSUMMARY
Groups Count Sum Average Variance4 4 576.8 144.2 0.4066675 4 579.3 144.825 0.8891676 4 574 143.5 0.747 4 572.5 143.125 0.1891678 4 578.7 144.675 0.16259 4 572.8 143.2 2.94
10 4 579 144.75 0.2711 4 583 145.75 0.65666712 4 580.8 145.2 2.59333313 4 574.6 143.65 0.16333314 4 566.7 141.675 0.369167
ANOVASource of Variation SS df MS F P-value F crit Signif ?
Between Groups 53.59 10 5.359 6.284542 2.58E-05 2.132502 YesWithin Groups 28.14 33 0.852727
Total 81.73 43
SH 257-MillikenPaver DensitiesSUMMARY
Groups Count Sum Average Variance4 2 286.5 143.25 15.1255 2 280.4 140.2 0.326 2 281.7 140.85 5.4457 2 284.7 142.35 1.4458 2 282 141 4.59 2 280.2 140.1 0.18
10 2 279.8 139.9 0.0211 2 281.2 140.6 0.512 2 282.6 141.3 2.4213 2 279.8 139.9 0.0214 2 276.7 138.35 0.24515 2 293 146.5 0.3216 2 278.1 139.05 0.04517 2 281.2 140.6 0.3218 2 280.8 140.4 0.1819 2 279.3 139.65 0.40520 2 283.7 141.85 0.84521 2 282.5 141.25 3.12522 2 281.7 140.85 0.12523 2 279.1 139.55 0.245
ANOVASource of Variation SS df MS F P-value F crit Signif ?
Between Groups 114.085 19 6.004474 3.351646 0.004964 2.137007 YesWithin Groups 35.83 20 1.7915
Total 149.915 39
SH 165Paver DensitiesSUMMARY
Groups Count Sum Average Variance4 4 553.4 138.35 2.0966675 4 563.7 140.925 0.4891676 4 565.3 141.325 0.08257 4 569.4 142.35 0.258 4 567.8 141.95 0.6033339 4 569.1 142.275 0.049167
10 4 569.9 142.475 0.83583311 4 568.9 142.225 1.72916712 4 569.4 142.35 0.1713 4 569.6 142.4 0.93333314 4 568 142 1.0415 4 563.9 140.975 0.562516 4 565 141.25 1.58333317 4 565.3 141.325 0.762518 4 558.8 139.7 0.95333319 4 557.1 139.275 0.81583320 4 552.3 138.075 0.36916721 4 558.7 139.675 2.375833
ANOVASource of Variation SS df MS F P-value F crit Signif ?
Between Groups 140.175 17 8.245588 9.452537 9.3E-11 1.81554 YesWithin Groups 47.105 54 0.872315
Total 187.28 71
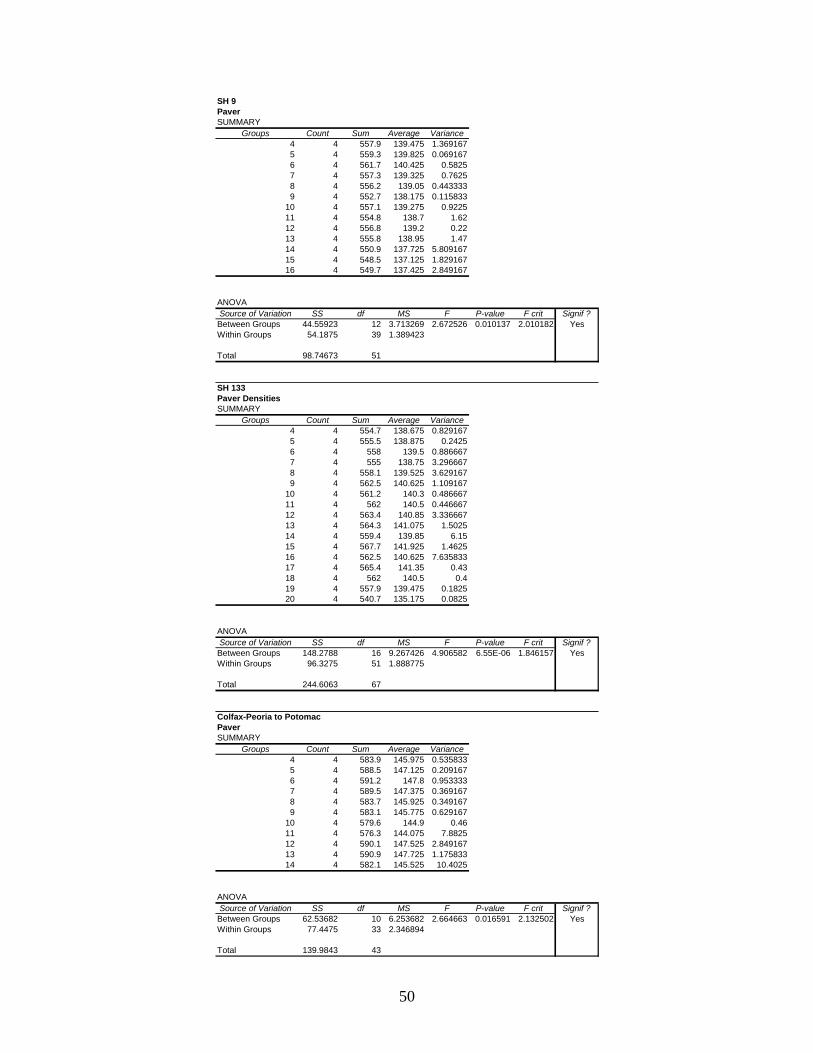
50
SH 9PaverSUMMARY
Groups Count Sum Average Variance4 4 557.9 139.475 1.3691675 4 559.3 139.825 0.0691676 4 561.7 140.425 0.58257 4 557.3 139.325 0.76258 4 556.2 139.05 0.4433339 4 552.7 138.175 0.115833
10 4 557.1 139.275 0.922511 4 554.8 138.7 1.6212 4 556.8 139.2 0.2213 4 555.8 138.95 1.4714 4 550.9 137.725 5.80916715 4 548.5 137.125 1.82916716 4 549.7 137.425 2.849167
ANOVASource of Variation SS df MS F P-value F crit Signif ?Between Groups 44.55923 12 3.713269 2.672526 0.010137 2.010182 YesWithin Groups 54.1875 39 1.389423
Total 98.74673 51
SH 133Paver DensitiesSUMMARY
Groups Count Sum Average Variance4 4 554.7 138.675 0.8291675 4 555.5 138.875 0.24256 4 558 139.5 0.8866677 4 555 138.75 3.2966678 4 558.1 139.525 3.6291679 4 562.5 140.625 1.109167
10 4 561.2 140.3 0.48666711 4 562 140.5 0.44666712 4 563.4 140.85 3.33666713 4 564.3 141.075 1.502514 4 559.4 139.85 6.1515 4 567.7 141.925 1.462516 4 562.5 140.625 7.63583317 4 565.4 141.35 0.4318 4 562 140.5 0.419 4 557.9 139.475 0.182520 4 540.7 135.175 0.0825
ANOVASource of Variation SS df MS F P-value F crit Signif ?Between Groups 148.2788 16 9.267426 4.906582 6.55E-06 1.846157 YesWithin Groups 96.3275 51 1.888775
Total 244.6063 67
Colfax-Peoria to PotomacPaverSUMMARY
Groups Count Sum Average Variance4 4 583.9 145.975 0.5358335 4 588.5 147.125 0.2091676 4 591.2 147.8 0.9533337 4 589.5 147.375 0.3691678 4 583.7 145.925 0.3491679 4 583.1 145.775 0.629167
10 4 579.6 144.9 0.4611 4 576.3 144.075 7.882512 4 590.1 147.525 2.84916713 4 590.9 147.725 1.17583314 4 582.1 145.525 10.4025
ANOVASource of Variation SS df MS F P-value F crit Signif ?Between Groups 62.53682 10 6.253682 2.664663 0.016591 2.132502 YesWithin Groups 77.4475 33 2.346894
Total 139.9843 43

51
Appendix C – Averages of Test Results
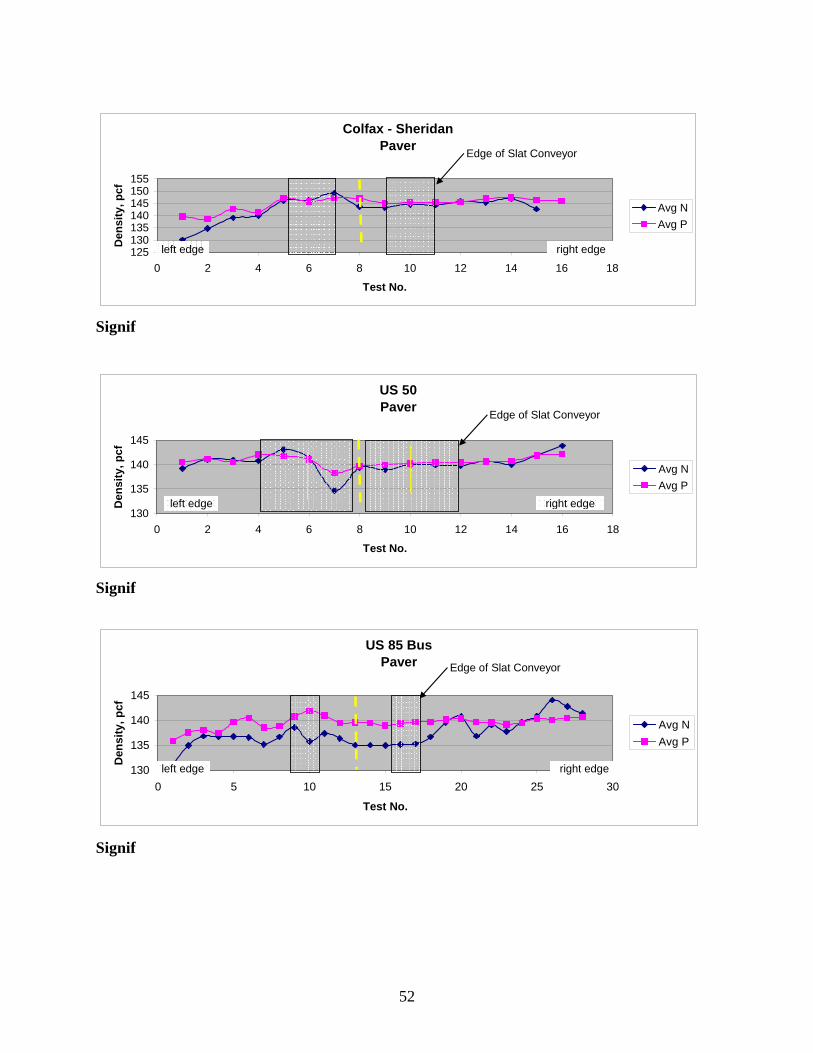
52
Colfax - SheridanPaver
125130135140145150155
0 2 4 6 8 10 12 14 16 18
Test No.
Den
sity
, pcf
Avg NAvg P
left edge right edge
Edge of Slat Conveyor
Signif
US 50Paver
130
135
140
145
0 2 4 6 8 10 12 14 16 18
Test No.
Den
sity
, pcf
Avg NAvg P
left edge right edge
Edge of Slat Conveyor
Signif
US 85 BusPaver
130
135
140
145
0 5 10 15 20 25 30
Test No.
Den
sity
, pcf
Avg NAvg P
left edge right edge
Edge of Slat Conveyor
Signif
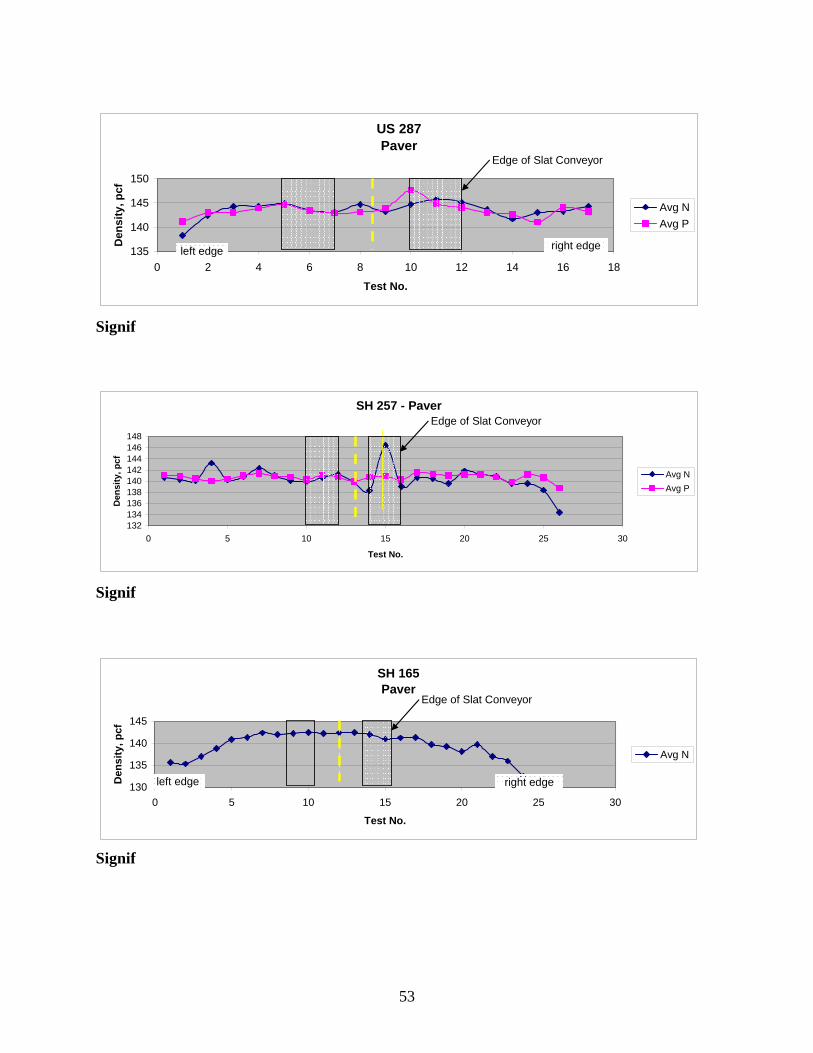
53
US 287Paver
135
140
145
150
0 2 4 6 8 10 12 14 16 18
Test No.
Den
sity
, pcf
Avg NAvg P
left edge right edge
Edge of Slat Conveyor
Signif
SH 257 - Paver
132134136138140142144146148
0 5 10 15 20 25 30
Test No.
Den
sity
, pcf
Avg NAvg P
Edge of Slat Conveyor
Signif
SH 165Paver
130
135
140
145
0 5 10 15 20 25 30
Test No.
Den
sity
, pcf
Avg N
left edge right edge
Edge of Slat Conveyor
Signif
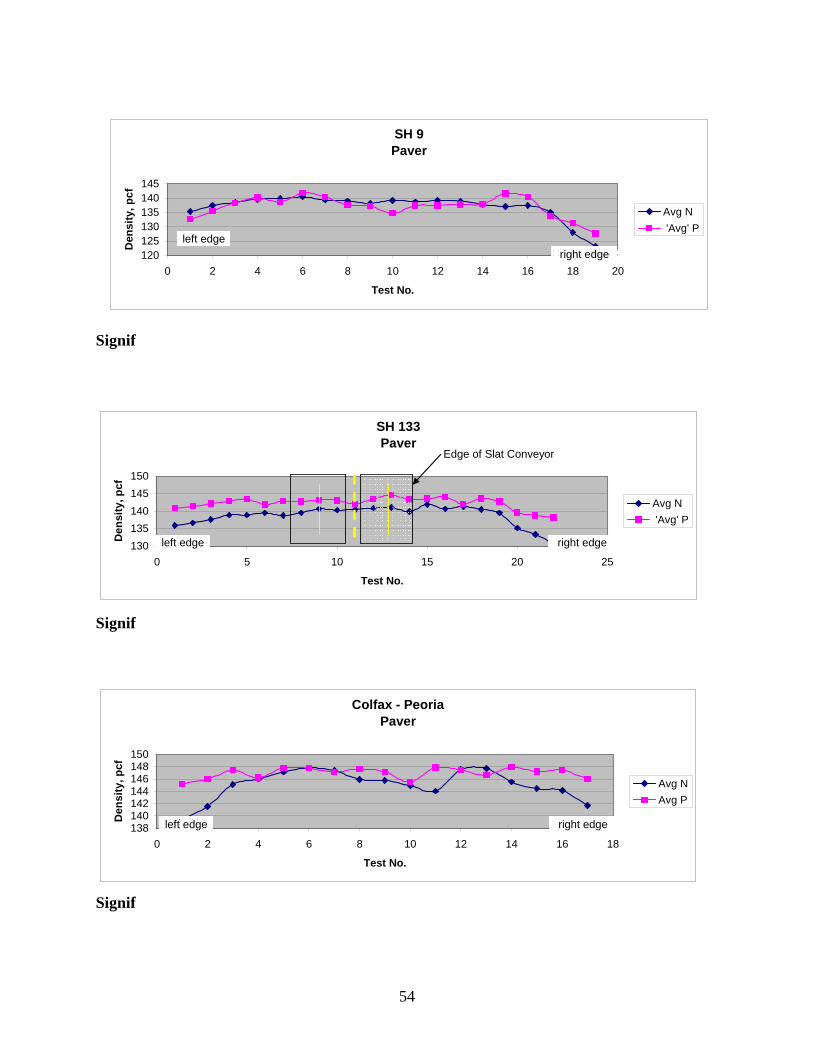
54
SH 9Paver
120125130135140145
0 2 4 6 8 10 12 14 16 18 20
Test No.
Den
sity
, pcf
Avg N 'Avg' P
left edgeright edge
Signif
SH 133Paver
130135140145150
0 5 10 15 20 25
Test No.
Den
sity
, pcf
Avg N 'Avg' P
left edge right edge
Edge of Slat Conveyor
Signif
Colfax - PeoriaPaver
138140142144146148150
0 2 4 6 8 10 12 14 16 18
Test No.
Den
sity
, pcf
Avg NAvg P
left edge right edge
Signif
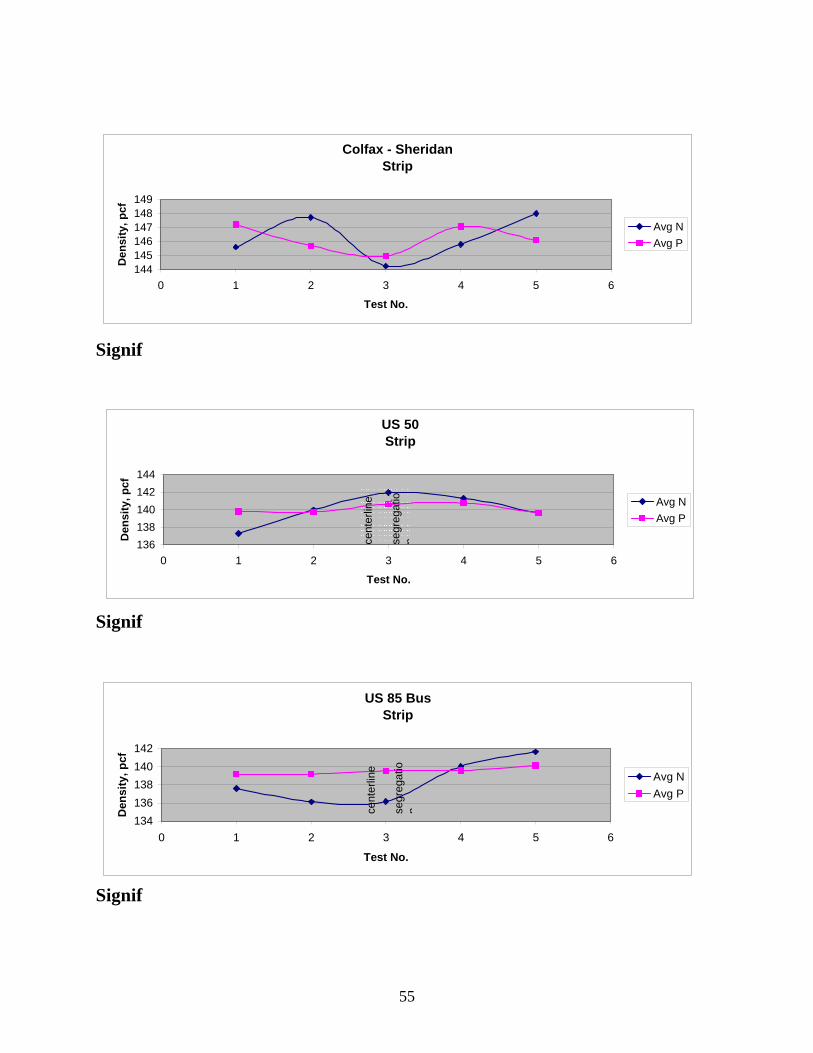
55
Colfax - SheridanStrip
144145146147148149
0 1 2 3 4 5 6
Test No.
Den
sity
, pcf
Avg NAvg P
Signif
US 50Strip
136138140142144
0 1 2 3 4 5 6
Test No.
Den
sity
, pcf
Avg NAvg P
cent
erlin
e se
greg
atio
n
Signif
US 85 BusStrip
134136138140142
0 1 2 3 4 5 6
Test No.
Den
sity
, pcf
Avg NAvg P
cent
erlin
e se
greg
atio
n
Signif
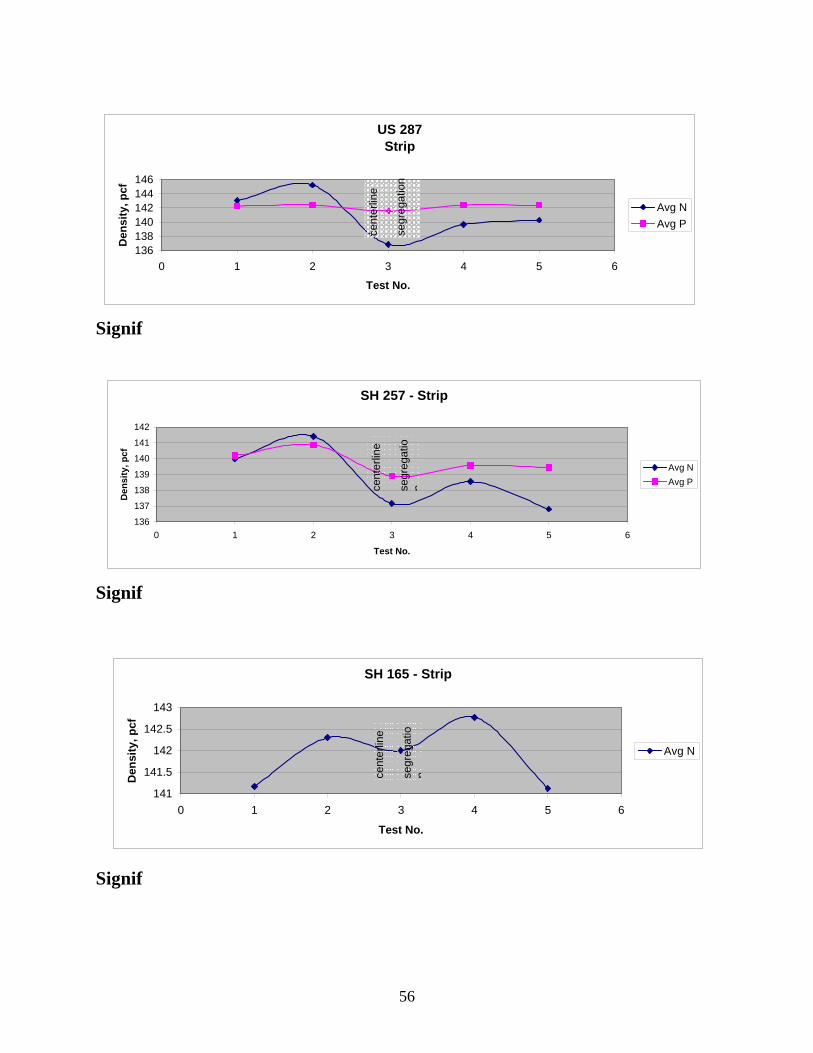
56
US 287Strip
136138140142144146
0 1 2 3 4 5 6
Test No.
Den
sity
, pcf
Avg NAvg P
cent
erlin
e se
greg
atio
n
Signif
SH 257 - Strip
136
137
138
139
140
141
142
0 1 2 3 4 5 6
Test No.
Den
sity
, pcf
Avg NAvg Pce
nter
line
segr
egat
ion
Signif
SH 165 - Strip
141
141.5
142
142.5
143
0 1 2 3 4 5 6
Test No.
Den
sity
, pcf
Avg N
cent
erlin
e se
greg
atio
n
Signif
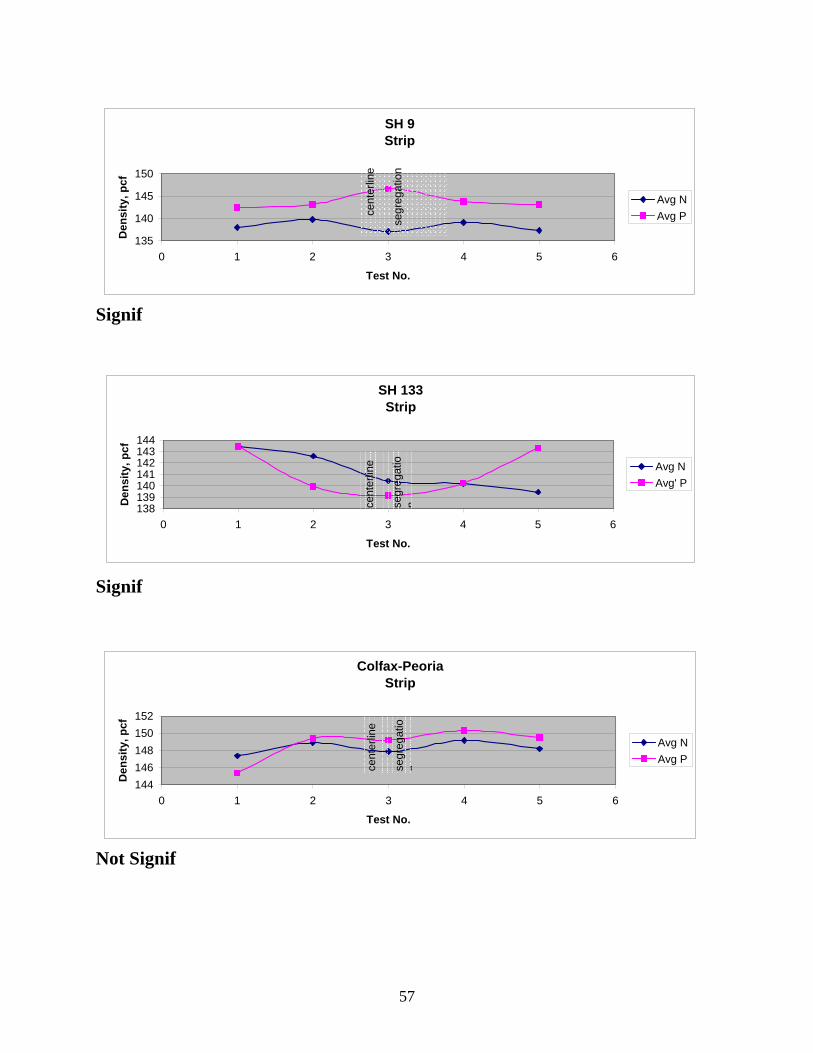
57
SH 9Strip
135
140
145
150
0 1 2 3 4 5 6
Test No.
Den
sity
, pcf
Avg NAvg Pce
nter
line
segr
egat
ion
Signif
SH 133Strip
138139140141142143144
0 1 2 3 4 5 6
Test No.
Den
sity
, pcf
Avg NAvg' P
cent
erlin
e se
greg
atio
n
Signif
Colfax-PeoriaStrip
144146148150152
0 1 2 3 4 5 6
Test No.
Den
sity
, pcf
Avg NAvg P
cent
erlin
e se
greg
atio
n
Not Signif
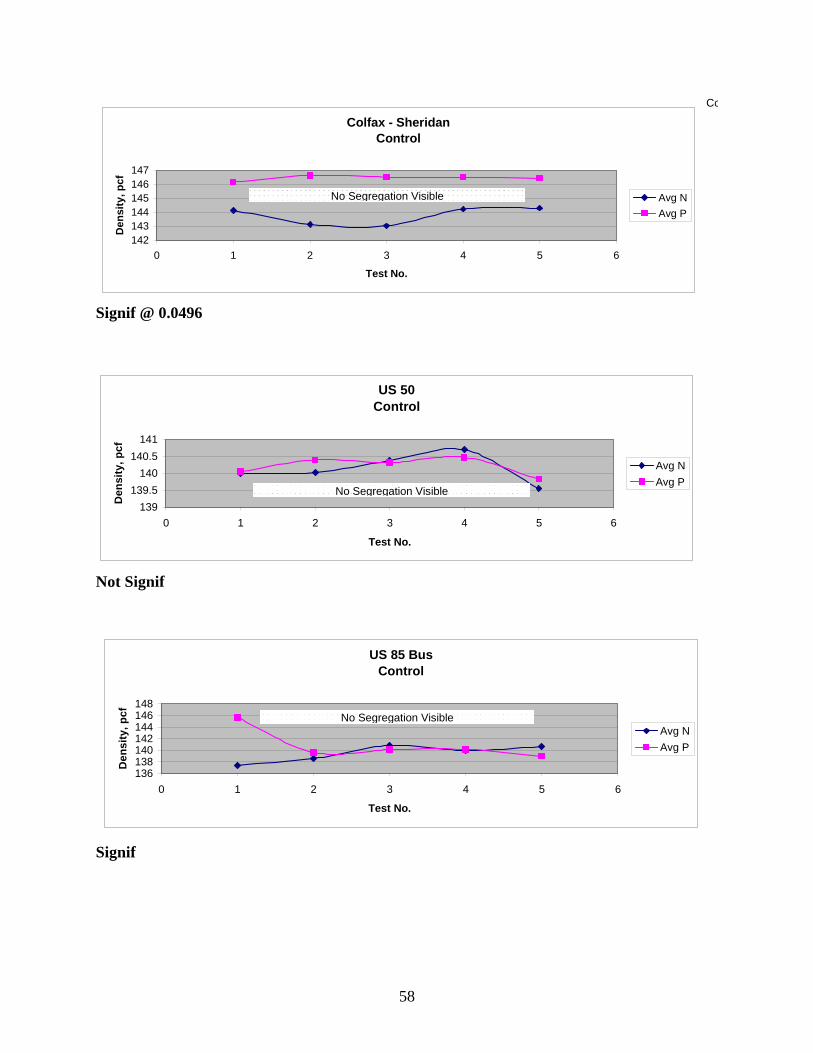
58
Co
Colfax - SheridanControl
142143144145146147
0 1 2 3 4 5 6
Test No.
Den
sity
, pcf
Avg NAvg P
No Segregation Visible
Signif @ 0.0496
US 50Control
139139.5
140140.5
141
0 1 2 3 4 5 6
Test No.
Den
sity
, pcf
Avg NAvg P
No Segregation Visible
Not Signif
US 85 BusControl
136138140142144146148
0 1 2 3 4 5 6
Test No.
Den
sity
, pcf
Avg NAvg P
No Segregation Visible
Signif
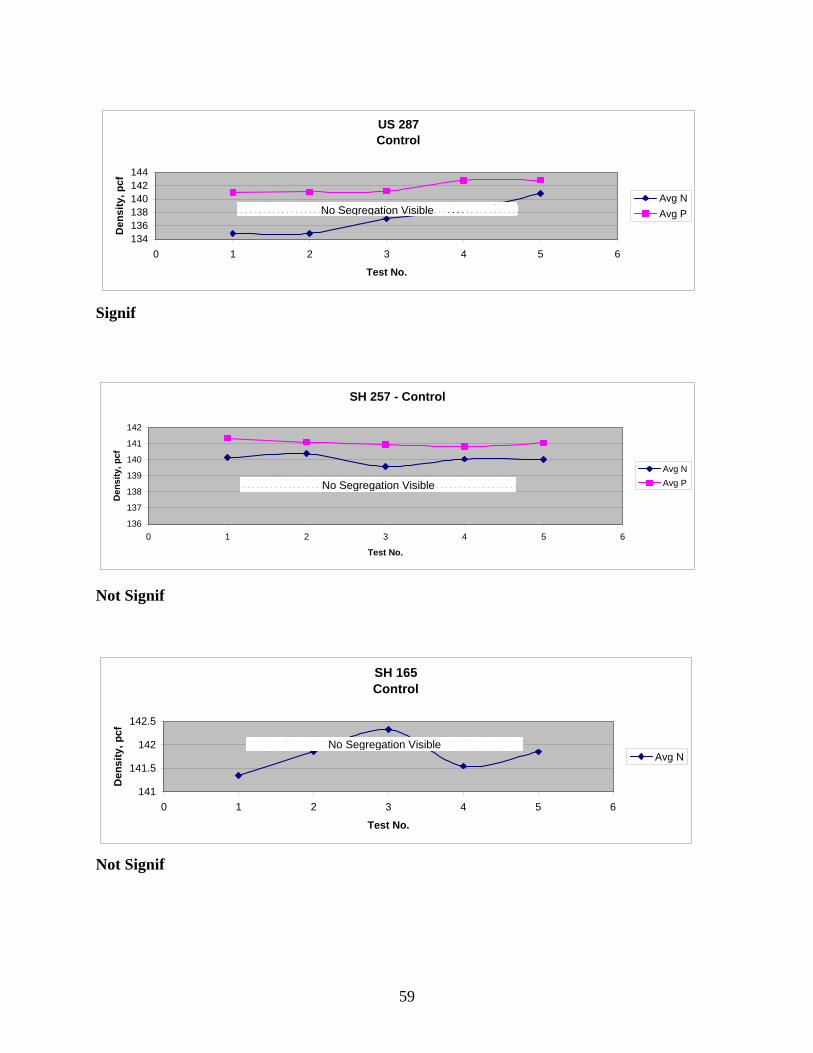
59
US 287Control
134136138140142144
0 1 2 3 4 5 6
Test No.
Den
sity
, pcf
Avg NAvg PNo Segregation Visible
Signif
SH 257 - Control
136
137
138
139
140
141
142
0 1 2 3 4 5 6
Test No.
Den
sity
, pcf
Avg NAvg PNo Segregation Visible
Not Signif
SH 165Control
141
141.5
142
142.5
0 1 2 3 4 5 6
Test No.
Den
sity
, pcf
Avg NNo Segregation Visible
Not Signif
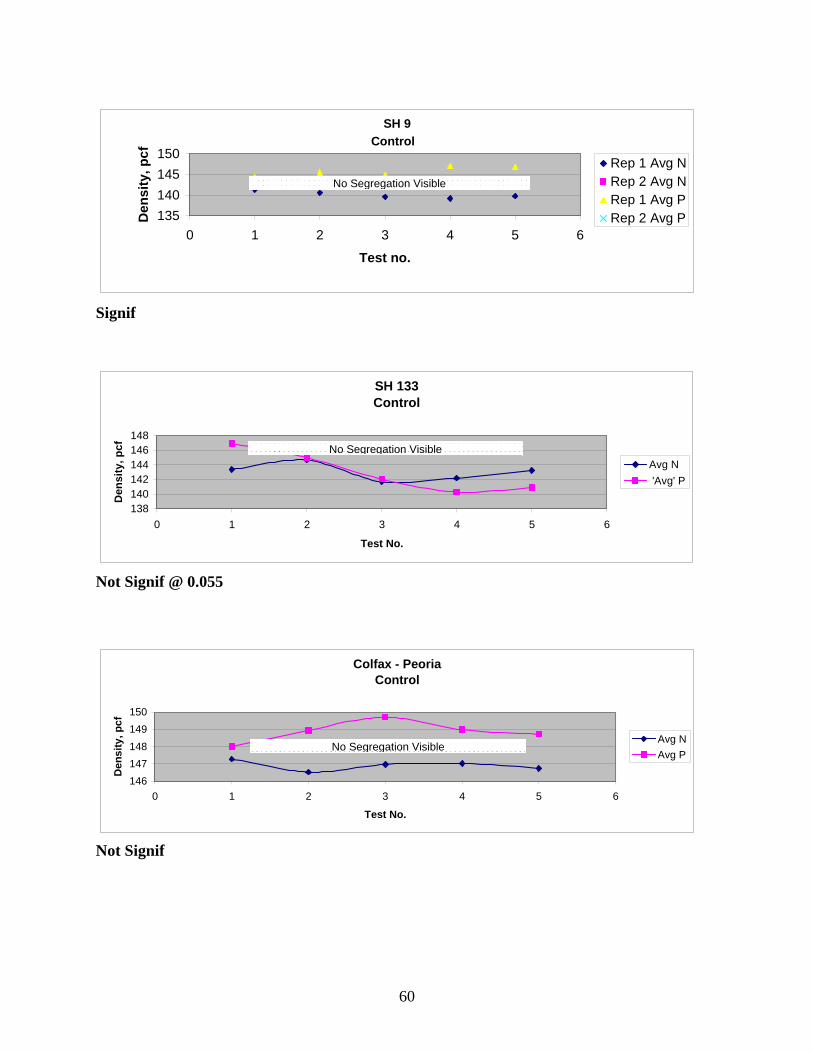
60
SH 9
135140145150
0 1 2 3 4 5 6
Test no.
Den
sity
, pcf
Rep 1 Avg NRep 2 Avg NRep 1 Avg PRep 2 Avg P
Control
No Segregation Visible
Signif
SH 133Control
138140142144146148
0 1 2 3 4 5 6
Test No.
Den
sity
, pcf
Avg N 'Avg' P
No Segregation Visible
Not Signif @ 0.055
Colfax - PeoriaControl
146147148149150
0 1 2 3 4 5 6
Test No.
Den
sity
, pcf
Avg NAvg P
No Segregation Visible
Not Signif
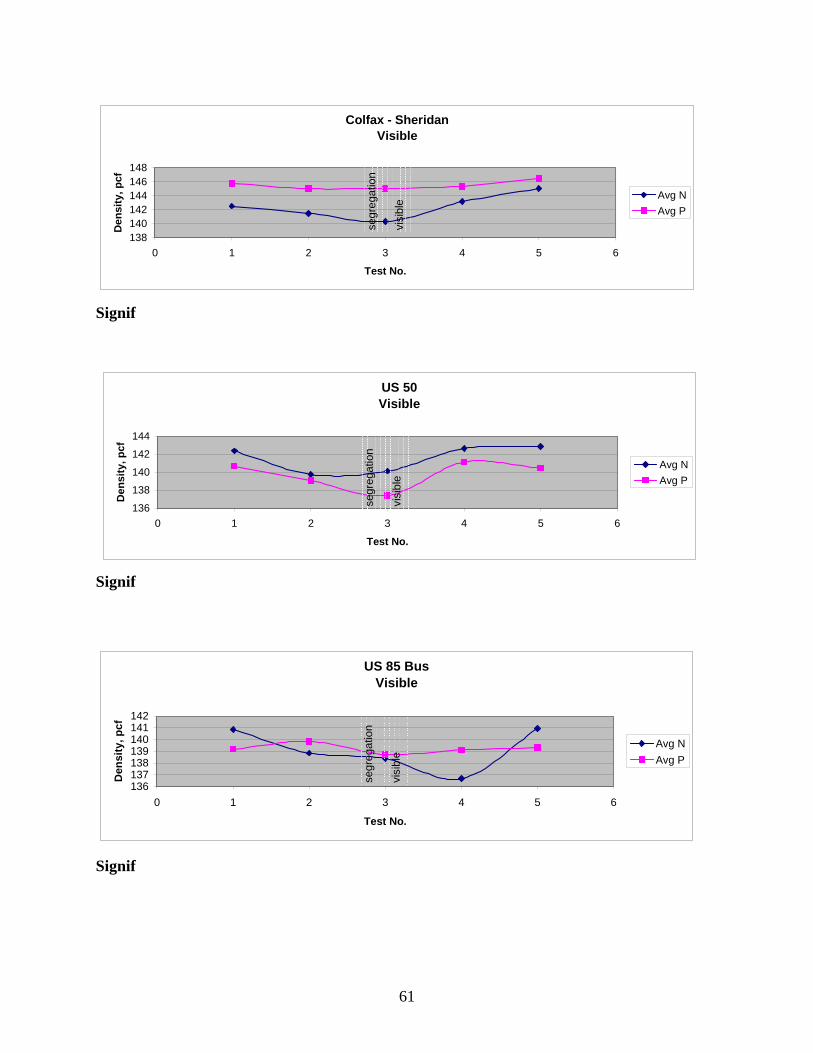
61
Colfax - SheridanVisible
138140142144146148
0 1 2 3 4 5 6
Test No.
Den
sity
, pcf
Avg NAvg P
segr
egat
ion
visi
ble
Signif
US 50Visible
136
138
140
142
144
0 1 2 3 4 5 6
Test No.
Den
sity
, pcf
Avg NAvg P
segr
egat
ion
visi
ble
Signif
US 85 BusVisible
136137138139140141142
0 1 2 3 4 5 6
Test No.
Den
sity
, pcf
Avg NAvg P
segr
egat
ion
visi
ble
Signif
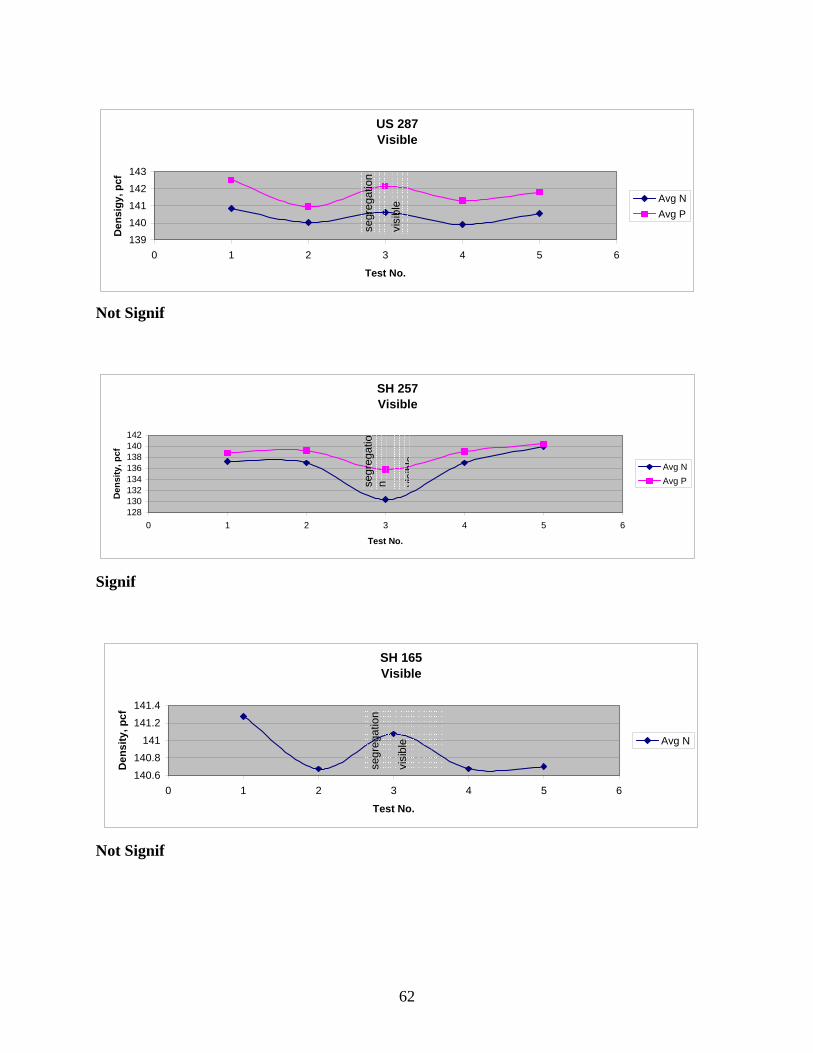
62
US 287Visible
139140141142
143
0 1 2 3 4 5 6
Test No.
Den
sigy
, pcf
Avg NAvg P
segr
egat
ion
visi
ble
Not Signif
SH 257Visible
128130132134136138140142
0 1 2 3 4 5 6
Test No.
Den
sity
, pcf
Avg NAvg Pse
greg
atio
n visi
ble
Signif
SH 165Visible
140.6140.8
141141.2141.4
0 1 2 3 4 5 6
Test No.
Den
sity
, pcf
Avg N
segr
egat
ion
visi
ble
Not Signif
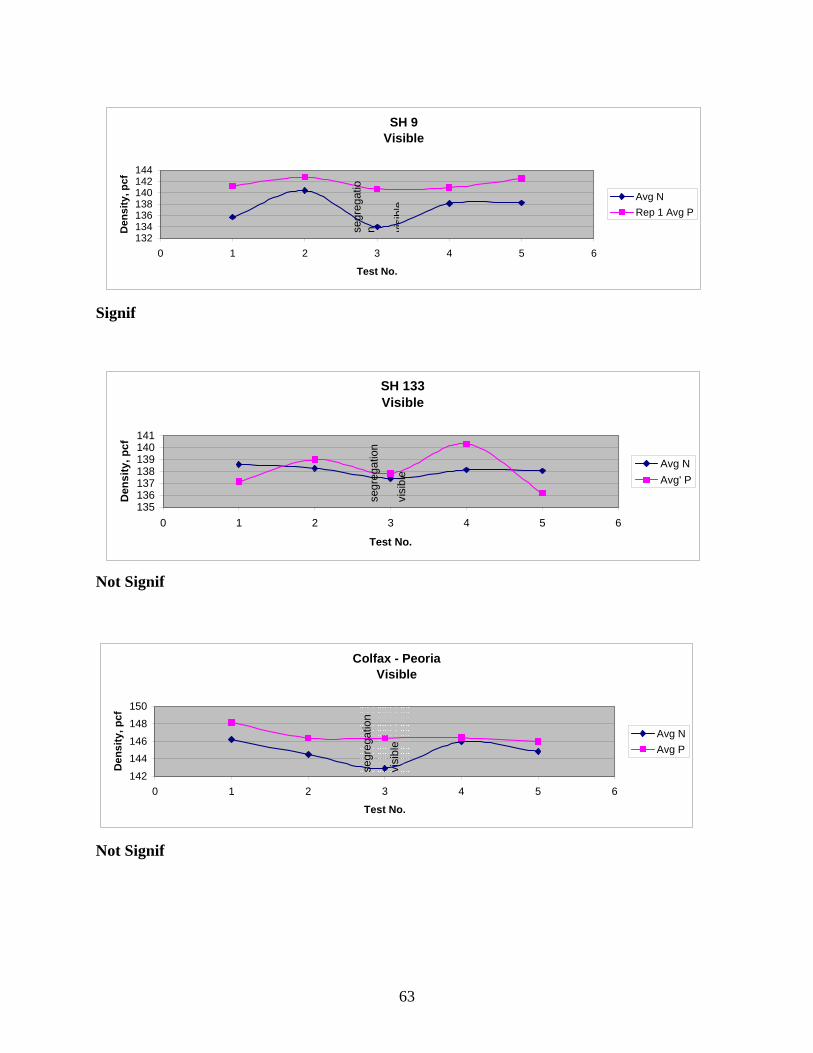
63
SH 9Visible
132134136138140142144
0 1 2 3 4 5 6
Test No.
Den
sity
, pcf
Avg NRep 1 Avg P
segr
egat
ion vi
sibl
e
Signif
SH 133Visible
135136137138139140141
0 1 2 3 4 5 6
Test No.
Den
sity
, pcf
Avg NAvg' P
segr
egat
ion
visi
ble
Not Signif
Colfax - PeoriaVisible
142144146148150
0 1 2 3 4 5 6
Test No.
Den
sity
, pcf
Avg NAvg P
segr
egat
ion
visi
ble
Not Signif
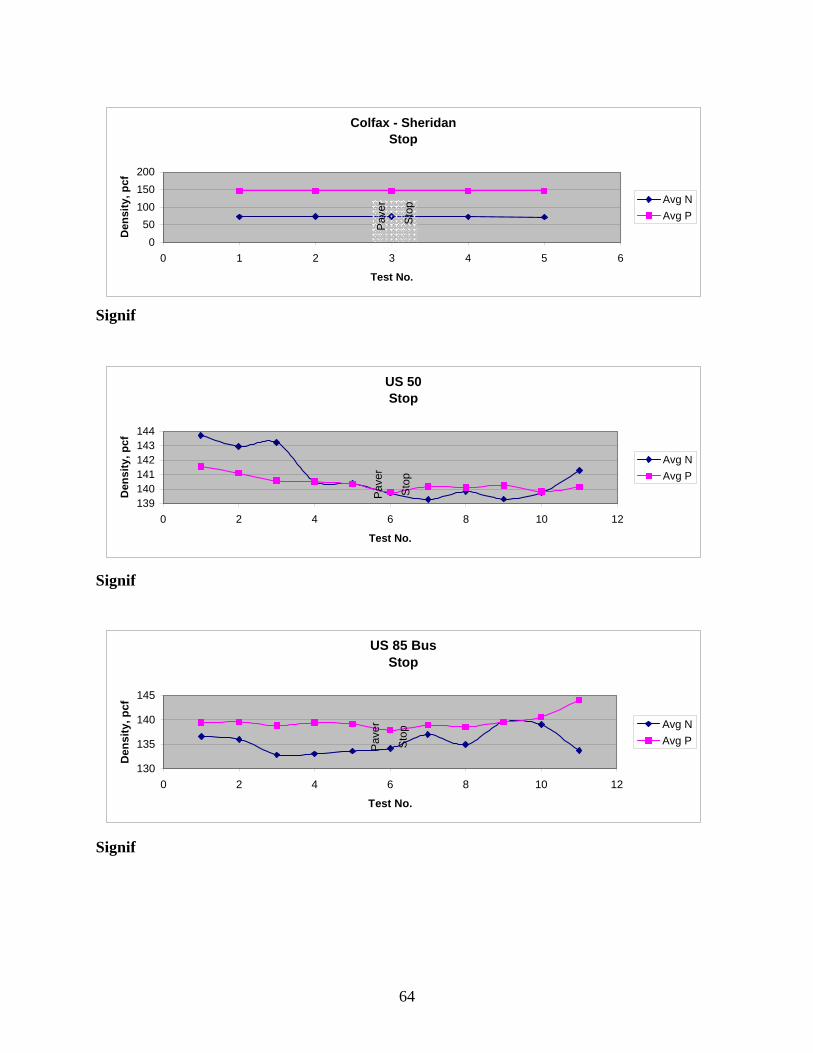
64
Colfax - SheridanStop
050
100150200
0 1 2 3 4 5 6
Test No.
Den
sity
, pcf
Avg NAvg P
Pave
r
Sto
p
Signif
US 50Stop
139140141142143144
0 2 4 6 8 10 12
Test No.
Den
sity
, pcf
Avg NAvg P
Pave
r
Sto
p
Signif
US 85 BusStop
130
135
140
145
0 2 4 6 8 10 12
Test No.
Den
sity
, pcf
Avg NAvg PPa
ver
Sto
p
Signif
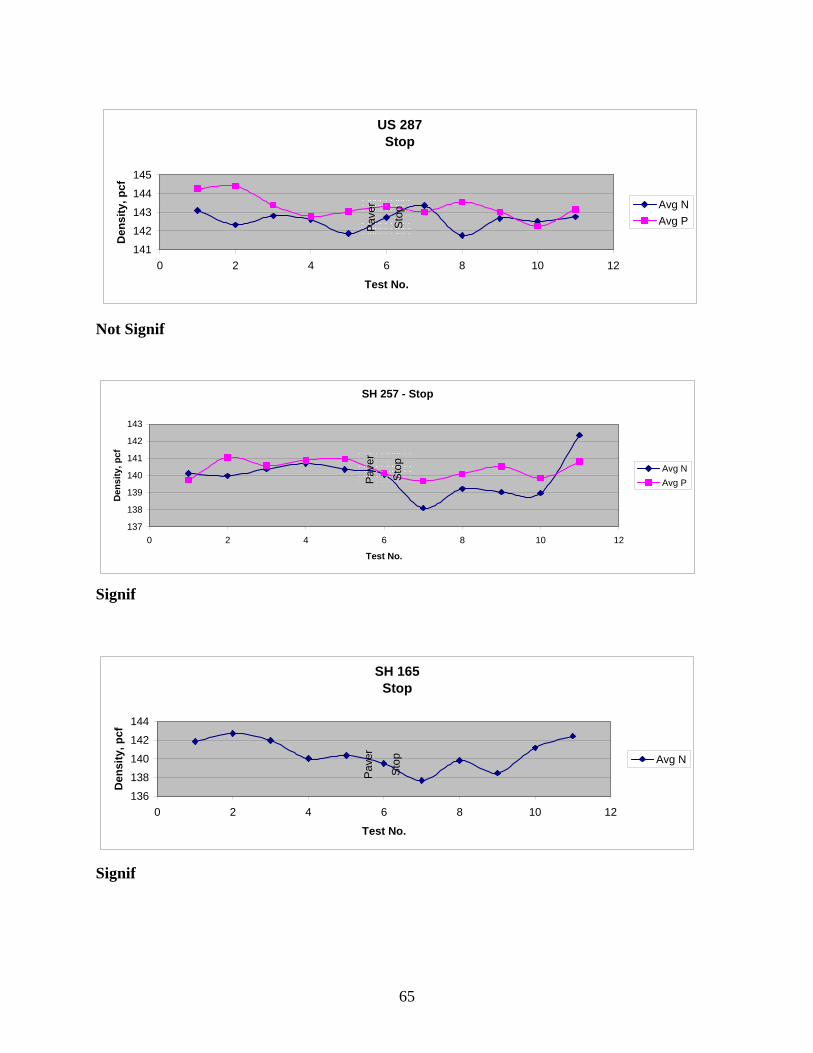
65
US 287Stop
141
142
143
144
145
0 2 4 6 8 10 12
Test No.
Den
sity
, pcf
Avg NAvg PPa
ver
Sto
p
Not Signif
SH 257 - Stop
137
138
139
140
141
142
143
0 2 4 6 8 10 12
Test No.
Den
sity
, pcf
Avg NAvg PPa
ver
Sto
p
Signif
SH 165Stop
136
138
140
142
144
0 2 4 6 8 10 12
Test No.
Den
sity
, pcf
Avg N
Pave
r
Sto
p
Signif
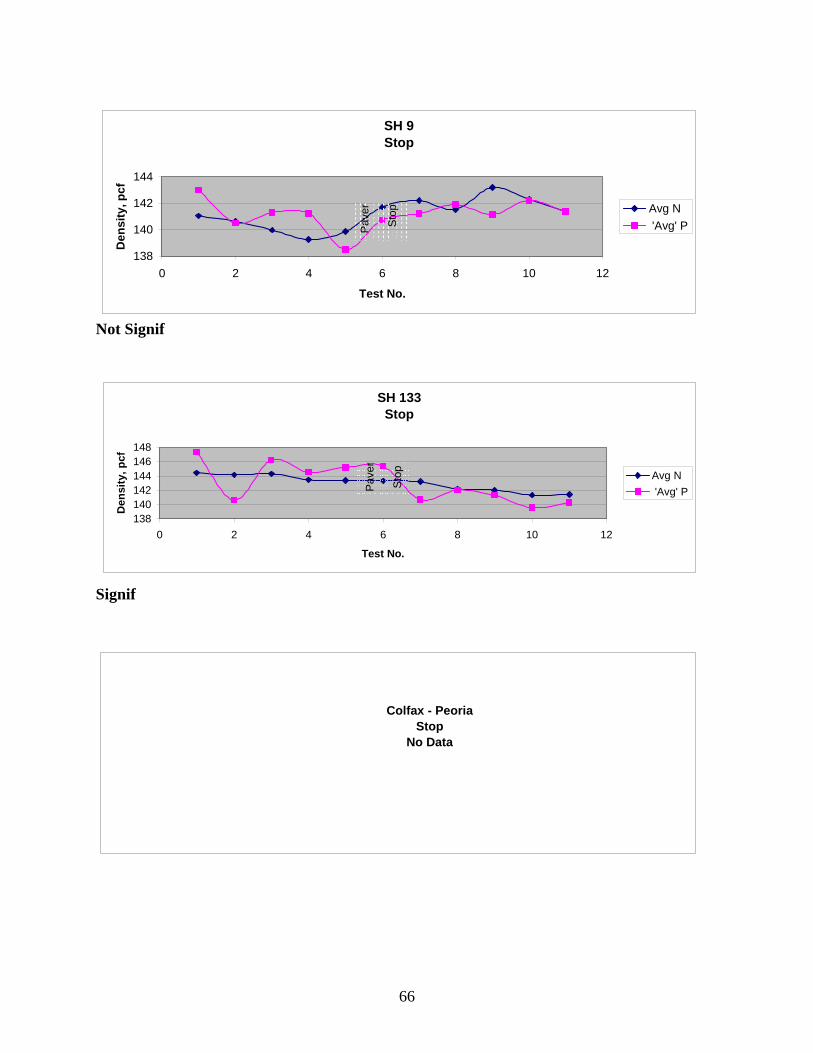
66
SH 9Stop
138
140
142
144
0 2 4 6 8 10 12
Test No.
Den
sity
, pcf
Avg N 'Avg' PP
aver
Sto
p
Not Signif
SH 133Stop
138140142144146148
0 2 4 6 8 10 12
Test No.
Den
sity
, pcf
Avg N 'Avg' PPa
ver
Sto
p
Signif
Colfax - PeoriaStop
No Data