Embed Size (px)
Citation preview
0
Density, movements and hunting of feral cats
in relation to fire and grazing
in northern Australia
Hugh McGregor
A thesis submitted for the degree of Doctor of Philosophy of the University of Tasmania
March 2015
1
Declarations
This thesis contains no material which has been accepted for a degree or diploma by the
University or any other institution, except by way of background information and duly
acknowledged in the thesis, and to the best of the m y knowledge and belief no material
previously published or written by another person except where due acknowledgement is
made in the text of the thesis, nor does the thesis contain any material that infringes
copyright.
Signed:
Hugh McGregor
Date: 24/02/2015
Data collection fulfilled all legal requirements in Australia, and has been approved by
University of Tasmania Animal Ethics Committee (A0011661) and Western Australian
Department of Parks and Wildlife Animal Ethics Committee (2010/35), with a Western
Australian Government Regulation 17 licence to research animals (SF009379). All research
was conducted with permission on three pastoral leases: Mornington Wildlife Sanctuary,
Marion Downs, and Glenroy Station.
Signed:
Hugh McGregor
Date: 24/02/2015
2
Abstract
Vegetation structure plays a pivotal role in predator-prey interactions, because it influences
the effectiveness with which predators are able to detect, pursue or ambush their prey, and
determines the opportunities for prey to avoid being exposed to predators. Therefore, changes
in vegetation structure may alter the impacts of predation on populations of prey species.
In recent decades, populations of small mammals have collapsed across much of the
savannah biome of northern Australia. The causes of this decline are not known, but
predation by feral cats, intensification of fire regimes, and intensified grazing by introduced
herbivores have all been implicated as possible causes by correlative and circumstantial
evidence. However, we do not understand the mechanisms by which these factors, alone or in
combination, affect population size in small mammals. Without this mechanistic
understanding it is difficult to prescribe management interventions that will protect small
mammals from further declines and allow recovery.
I investigated interactions between predation by feral cats and vegetation structure in a study
area in the central Kimberley region of northwestern Australia, to test whether one effect of
fire and grazing regimes is to amplify the impacts on small mammals of predation by feral
cats. I addressed three specific objectives. First, I measured population density of cats
differed in areas with contrasting fire and grazing regimes. The second objective was to test
how the movements of individual cats were influenced by vegetation and habitat structure,
and especially to show whether cats preferentially hunted in burnt or grazed areas. The third
objective was to derive direct measures of kill rates of feral cats, to show how these were
influenced by habitat characteristics.
To determine cat density, I deployed six arrays of infrared cameras across the study area
during 2012 and 2013. The arrays were allocated evenly to areas with and without large
introduced herbivores, and ranged across areas with differing fire histories. Each array
consisted of 15 or more cameras deployed for one month. All cats ‘captured’ on camera were
individually identified, and density was estimated using spatially-explicit mark-recapture
3
analyses. Density at all six arrays was generally similar (mean 0.18 cats per km2, with SE of
0.08). There was no significant difference in density between grazed and un-grazed arrays,
despite a five-fold difference in small mammal abundance. These results demonstrate that
cats occur at low density in the Kimberley compared to other parts of Australia, and that
population density does not increase when small-mammal abundance increases in ungrazed
areas.
To investigate movement behaviour and fine-scale habitat selection by cats, I deployed GPS
collars on 32 cats in landscapes with contrasting fire and grazing treatments, and used
discrete-choice modelling in relation to detailed habitat measures to reveal the movement
decisions that underlie habitat selection by individual cats. Cats selected areas with more
open grass cover, heavily grazed areas, and areas close to standing water. Mild fire scars were
avoided, but cats strongly selected for areas recently burnt by intense fires in habitats with
high abundance of small mammals. Not only was this the strongest influence on movement
decisions made by cats within their home ranges, but cats also predictably journeyed up to 15
km to temporarily exploit areas recently burnt at high intensity outside the borders of their
home range.
I deployed collar-borne video cameras on cats to record hunting events and to measure the
effects of habitat on hunting success. In this way I obtained 98 hours of cat activity, during
which 101 hunting events were observed. The success or failure of cats in killing prey at a
hunting event was strongly affected by habitat. For hunting events in which prey were in a
grass tussock or a rocky refuge, the kill rate was four times lower (18 %) than in open areas
(76 %). That is, cats enjoyed higher hunting success in the habitat types that they preferred to
enter.
This research demonstrates how a relatively sparse population of cats can have major impacts
on prey populations if disturbance regimes are not managed appropriately. In particular, cats
respond well to the conditions created by intense fire and grazing, increase their hunting in
such areas, and accomplish higher hunting success. Vegetation structure is pivotal to creating
ideal landscapes for predators to hunt, or conversely, to providing refuges for prey to avoid
predation. Intense fires are likely to become more prevalent with climate change, and this
could increase the impacts of many species of small to medium sized predators. A useful

4
broad principle to reduce the impacts of this predation could be to increase the spatial and
temporal cover of ground vegetation wherever possible.
5
Table of Contents
Declarations ............................................................................................................................... 1 Abstract ...................................................................................................................................... 2 Acknowledgements .................................................................................................................... 7
CHAPTER 1 .............................................................................................................................. 9 General introduction .................................................................................................................. 9
Era of global extinctions ..................................................................................................... 9 Mammalian extinctions in Australia................................................................................... 9 Declines of mammals in northern Australia ..................................................................... 10
Aims.................................................................................................................................. 14 References ............................................................................................................................ 16
Thesis structure ........................................................................................................................ 20 Photos of study area and methods ............................................................................................ 21
CHAPTER 2 ............................................................................................................................ 25 Density and home range of feral cats in north-western Australia ............................................ 25
Abstract ................................................................................................................................ 26 Introduction .......................................................................................................................... 27 Methods ................................................................................................................................ 30
Study area ......................................................................................................................... 30 Camera trapping ............................................................................................................... 32 Density estimation ............................................................................................................ 34
Home range estimation and interaction ............................................................................ 36 Results .................................................................................................................................. 38
Population density ............................................................................................................ 38 Home range ....................................................................................................................... 40
Discussion ............................................................................................................................ 43
References ............................................................................................................................ 47
CHAPTER 3 ............................................................................................................................ 51 Landscape management of fire and grazing regimes alters the fine-scale habitat selection by
feral cats ................................................................................................................................... 51
Abstract ................................................................................................................................ 52 Introduction .......................................................................................................................... 53 Materials and methods ......................................................................................................... 56
Study area ......................................................................................................................... 56
Cat capture and tracking ................................................................................................... 58 Habitat variables ............................................................................................................... 58 Data analysis ..................................................................................................................... 62
Results .................................................................................................................................. 64 Discussion ............................................................................................................................ 70
Conclusions ...................................................................................................................... 72 Reference list ........................................................................................................................ 74
6
CHAPTER 4 ............................................................................................................................ 79
Long-distance hunting expeditions to intense fire scars by feral cats ..................................... 79 Abstract ................................................................................................................................ 80 Introduction .......................................................................................................................... 81 Methods ................................................................................................................................ 83
Study area ......................................................................................................................... 83 GPS tracking of cats ......................................................................................................... 83 Characteristics of movements by cats .............................................................................. 83
Results .................................................................................................................................. 86 Discussion ............................................................................................................................ 90 References ............................................................................................................................ 93
CHAPTER 5 ............................................................................................................................ 96 Hunting behaviour of feral cats in a tropical savannah, revealed by animal-borne video-
collars ....................................................................................................................................... 96
Abstract ................................................................................................................................ 97 Introduction .......................................................................................................................... 98 Methods .............................................................................................................................. 102
Study area ....................................................................................................................... 102 Camera design ................................................................................................................ 102 Deployment .................................................................................................................... 104 Footage review ............................................................................................................... 104
Results ................................................................................................................................ 107 Discussion .......................................................................................................................... 112
i) Analysis of kill rate ..................................................................................................... 112 ii) Hunting during different behaviours .......................................................................... 114 iii) Factors affecting predation success .......................................................................... 114 Conclusions .................................................................................................................... 115
Reference list ...................................................................................................................... 117
CHAPTER 6 .......................................................................................................................... 122 Overall summary and discussion ........................................................................................... 122
Implications for the northern mammal declines ............................................................. 124 Implications for Australia ............................................................................................... 125
Global implications......................................................................................................... 127 References .......................................................................................................................... 130
Supplementary material ......................................................................................................... 136 Appendix 1. Details on the creation of the dynamic grass cover map ............................... 136
Appendix 2. Introduction to the footage obtained from the cat video collars .................... 139
7
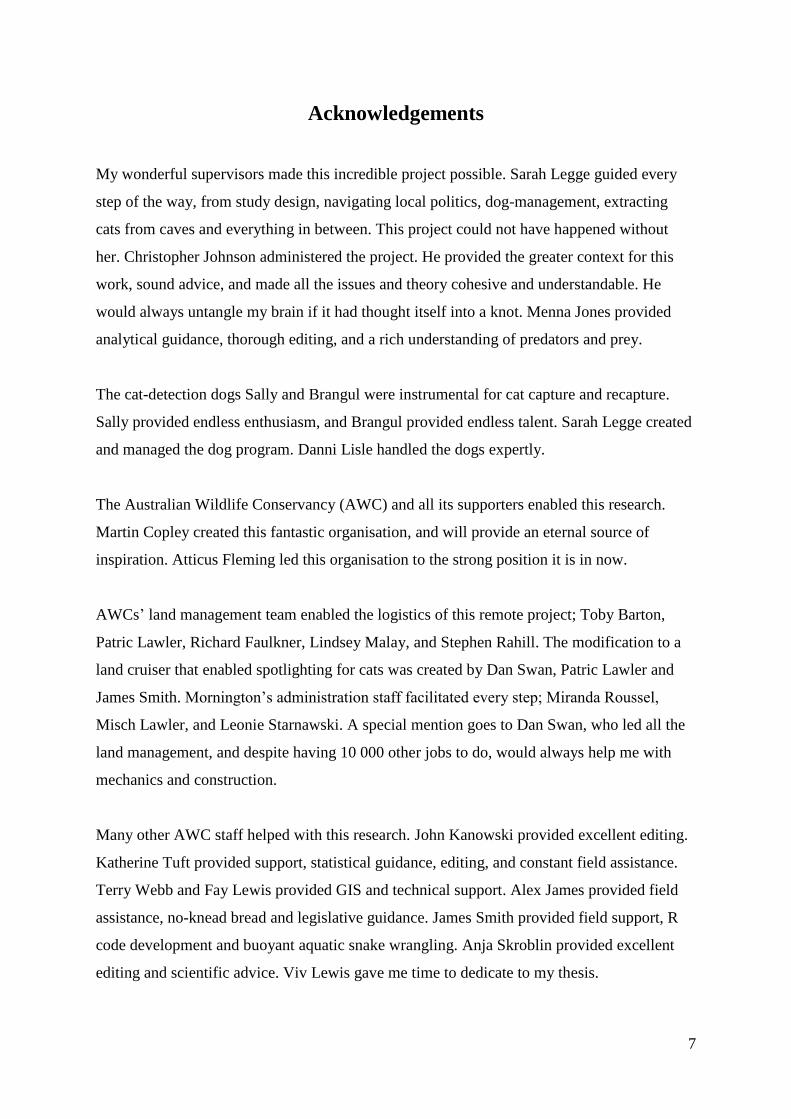
Acknowledgements
My wonderful supervisors made this incredible project possible. Sarah Legge guided every
step of the way, from study design, navigating local politics, dog-management, extracting
cats from caves and everything in between. This project could not have happened without
her. Christopher Johnson administered the project. He provided the greater context for this
work, sound advice, and made all the issues and theory cohesive and understandable. He
would always untangle my brain if it had thought itself into a knot. Menna Jones provided
analytical guidance, thorough editing, and a rich understanding of predators and prey.
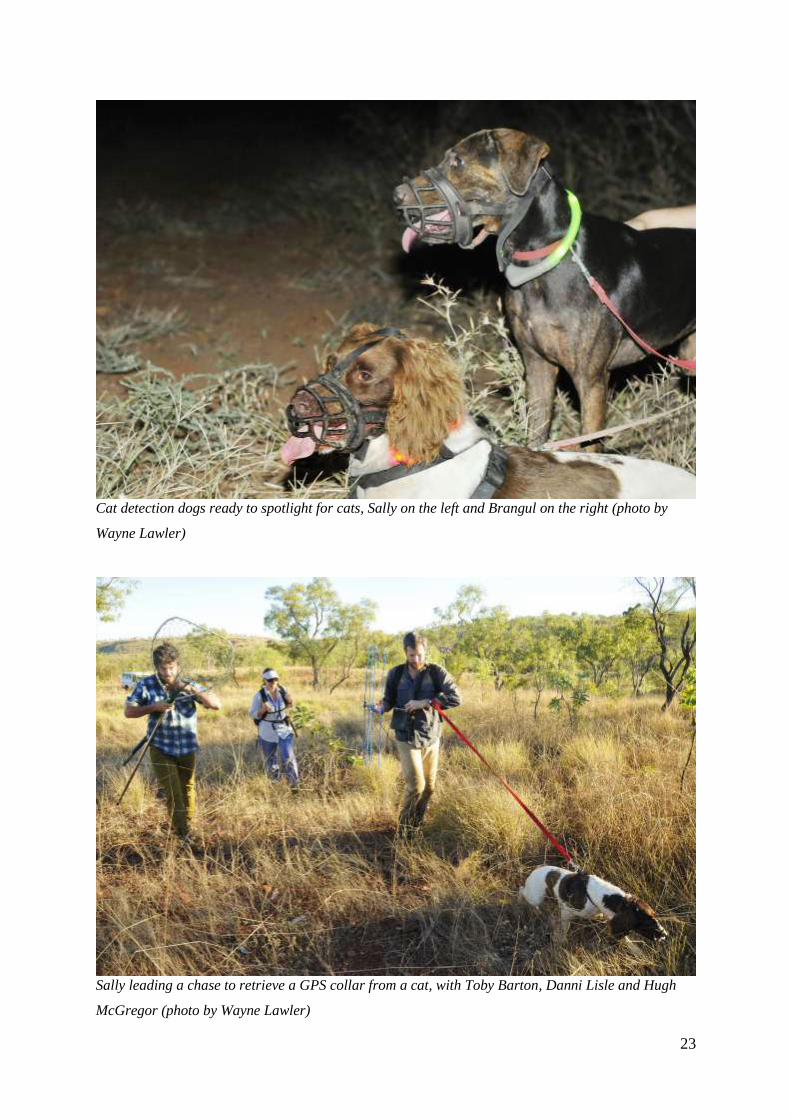
The cat-detection dogs Sally and Brangul were instrumental for cat capture and recapture.
Sally provided endless enthusiasm, and Brangul provided endless talent. Sarah Legge created
and managed the dog program. Danni Lisle handled the dogs expertly.
The Australian Wildlife Conservancy (AWC) and all its supporters enabled this research.
Martin Copley created this fantastic organisation, and will provide an eternal source of
inspiration. Atticus Fleming led this organisation to the strong position it is in now.
AWCs’ land management team enabled the logistics of this remote project; Toby Barton,
Patric Lawler, Richard Faulkner, Lindsey Malay, and Stephen Rahill. The modification to a
land cruiser that enabled spotlighting for cats was created by Dan Swan, Patric Lawler and
James Smith. Mornington’s administration staff facilitated every step; Miranda Roussel,
Misch Lawler, and Leonie Starnawski. A special mention goes to Dan Swan, who led all the
land management, and despite having 10 000 other jobs to do, would always help me with
mechanics and construction.
Many other AWC staff helped with this research. John Kanowski provided excellent editing.
Katherine Tuft provided support, statistical guidance, editing, and constant field assistance.
Terry Webb and Fay Lewis provided GIS and technical support. Alex James provided field
assistance, no-knead bread and legislative guidance. James Smith provided field support, R
code development and buoyant aquatic snake wrangling. Anja Skroblin provided excellent
editing and scientific advice. Viv Lewis gave me time to dedicate to my thesis.

8
Outside of AWC, Joanne Potts provided statistical guidance and editing, and is a co-author on
one of my papers. Wayne Kelly provided computer and logistic support. Barrie Wells
provided advice and guidance for animal care and welfare. Peter Jennings of Cam-do.com
provided both the technology and technical support for creating the GoPro cat collars. Nigel
and Cate Westlake allowed access to Glenroy, and also provided landscape advice and
helicopter assistance.
My field assistants helped no end. Monica Griffith gave over a year of her life, helping in
almost every way possible. Lily Leahy gave field and data assistance, and then went on to
conduct a study on small mammal ecology that provided critical support to this research.
Marc McConnell volunteered for a month, and helped with trapping and many cat chases.
Issie Connell reviewed hours of cat footage, and helped many of the cat chases at a moment’s
notice.
Many volunteers came out spotlighting or chasing cats; Bryony Palmer, Mel Jensen, Ethan
Page, Hannah Cliff, Warrick Walkerbea, Tim Gentles, JoJo Heathcote, Samuel McGregor,
Terry Webb, Peter Tuft, Nicola Palmer, Emily Mowat, Colin Tuft, Billy Ross, Kade Malay,
Andrew Morton, Jack Ashby, Joey Clarke, Carolyn Larcombe, Adam Meltcalfe, Michelle
Hall, Alex Hartshorne, Jessica Bolton, Cassie Parker, Natasha Hoffmann, Elsie Percival,
Erika Roper, Robyn Tuft, Rosie Hohnen, Samantha Bowden, Jake Loughridge, Trish Blann,
Tina Schroeder, Rosie Willacy, Corey Malay, Iris Bleach, Dean Smith, Kimberley Smith, Ian
Dudgeon, Richard Whatley, Leila Brook, Angus McNabb, Laura Smelter, Tegan May, and
Anke Frank.
I am forever grateful to be a part of my family, and love them all very dearly. My mother
Helen Noble. My brother Samuel McGregor, along with Sarah Jans. My father William
McGregor. My new family-in-law; Peter Tuft, Robyn Tuft and Colin Tuft, The loves of my
life, my wife Katherine McGregor and son Robert McGregor.
9
CHAPTER 1
General introduction
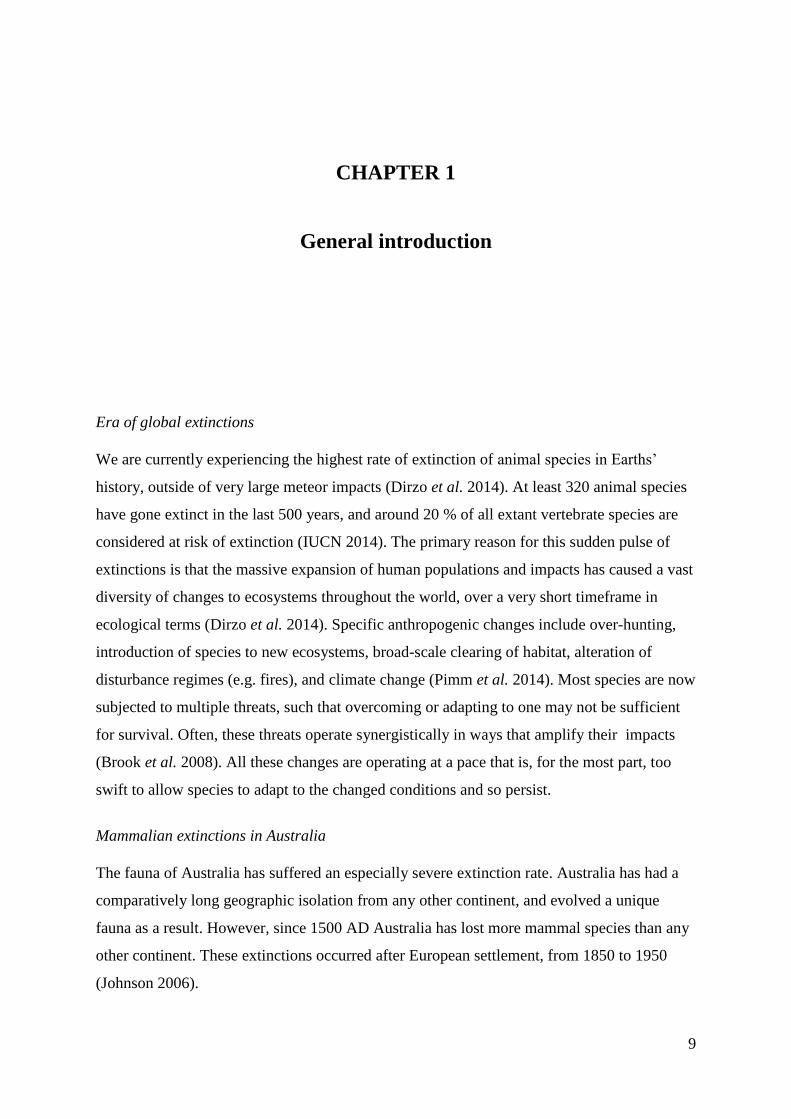
Era of global extinctions
We are currently experiencing the highest rate of extinction of animal species in Earths’
history, outside of very large meteor impacts (Dirzo et al. 2014). At least 320 animal species
have gone extinct in the last 500 years, and around 20 % of all extant vertebrate species are
considered at risk of extinction (IUCN 2014). The primary reason for this sudden pulse of
extinctions is that the massive expansion of human populations and impacts has caused a vast
diversity of changes to ecosystems throughout the world, over a very short timeframe in
ecological terms (Dirzo et al. 2014). Specific anthropogenic changes include over-hunting,
introduction of species to new ecosystems, broad-scale clearing of habitat, alteration of
disturbance regimes (e.g. fires), and climate change (Pimm et al. 2014). Most species are now
subjected to multiple threats, such that overcoming or adapting to one may not be sufficient
for survival. Often, these threats operate synergistically in ways that amplify their impacts
(Brook et al. 2008). All these changes are operating at a pace that is, for the most part, too
swift to allow species to adapt to the changed conditions and so persist.
Mammalian extinctions in Australia
The fauna of Australia has suffered an especially severe extinction rate. Australia has had a
comparatively long geographic isolation from any other continent, and evolved a unique
fauna as a result. However, since 1500 AD Australia has lost more mammal species than any
other continent. These extinctions occurred after European settlement, from 1850 to 1950
(Johnson 2006).
10
The dominant cause of mammalian extinctions in Australia was the introduction of exotic
predators, the red fox Vulpes vulpes and the feral cat Felis catus (Woinarski et al. 2014).
Other factors such as hunting, vegetation clearing and competition with rabbits have
contributed to the declines of mammals, but their impacts have not been as profound
(Burbidge and McKenzie 1989; Johnson 2006; Smith and Quin 1996) and cannot explain the
complete extirpation of formerly widespread species. Different landscapes across Australia
were affected to differing degrees. South-eastern Australia and the arid and semi-arid regions
were especially hard hit, losing almost all their terrestrial small to medium sized mammals
(50 g to 4,400 g). Many species also declined and went extinct in eastern and south-western
Australia (Burbidge and McKenzie 1989). Some species went extinct soon after European
expansion into inland Australia (Johnson 2006), whilst others lingered at low densities until
the 1960s (Burbidge et al. 1988), when indigenous people left the land. In contrast, the fauna
of Australia’s northern monsoon tropics was largely spared, with only a small subset of
mammals being lost (Cramb and Hocknull 2010; Start et al. 2012). This was possibly due to
the absence of the red fox, and the lack of broadscale land clearing in northern Australia.
Even as late as the 1980s, mammal surveys were still capturing largely intact mammal
assemblages in the north (e.g. Churchill 1997; Dunlop and Begg 1981).
Declines of mammals in northern Australia
Our picture of an intact mammal fauna across northern Australia has recently changed, as
there have been population declines of all small to medium sized terrestrial mammals
recorded in the last 20 years (Woinarski et al. 2011a). This includes dramatic crashes of
abundance and diversity of small mammals in seemingly intact ecosystems, such as Kakadu
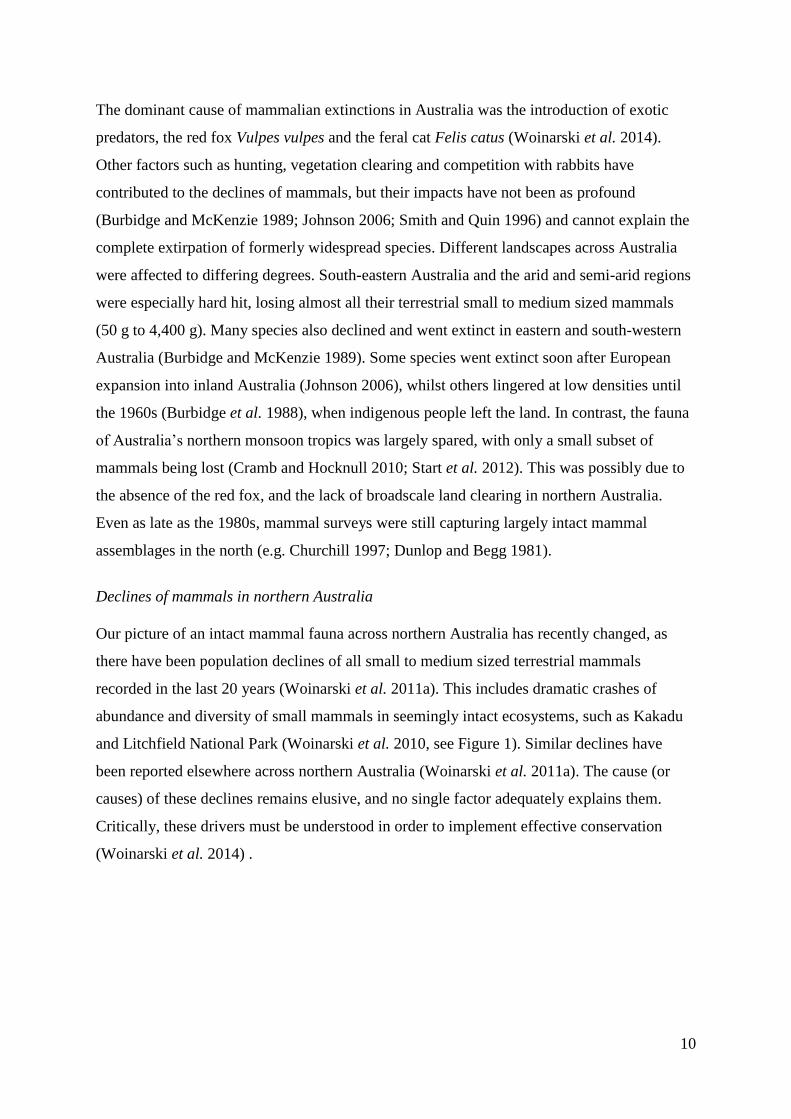
and Litchfield National Park (Woinarski et al. 2010, see Figure 1). Similar declines have
been reported elsewhere across northern Australia (Woinarski et al. 2011a). The cause (or
causes) of these declines remains elusive, and no single factor adequately explains them.
Critically, these drivers must be understood in order to implement effective conservation
(Woinarski et al. 2014) .
11
Figure 1. Change over time in Kakadu National Park at 15 plots of the number of individual
mammals trapped (left) and species richness per plot (right). Columns show the mean and
standard error (reproduced from Woinarski et al. 2010).
There is evidence that predation by feral cats is at least in part responsible for this decline of
small mammals. This is suggested by three lines of evidence. First, populations of mammals
in complex rocky habitats have been less affected than those in more productive woodlands
and savannas. Complex rocky topography would provide additional shelter from predation,
yet no extra food for most species, suggesting that top-down impacts are driving the declines
(Oakwood 2000; Radford et al. 2014). Second, the declining species fall within the preferred
prey-size range of cats (Dickman 1996; Fisher et al. 2013). Finally, populations of declining
mammal species are more stable in the absence of cats, on islands or in large enclosures
(Frank et al. 2014; Woinarski et al. 2011b). However, the declines cannot be attributed solely
to the introduction of cats. There is a temporal mismatch between the arrival of cats in
northern Australia (up to 170 ya in some places; Abbott 2002) and declines of mammals
observed in the last 50 to 20 years (Woinarski et al. 2011a).
Other environmental factors have changed over the last 50 to 20 years. Fire regimes have
changed substantially, shifting from frequent small-scale fires lit by indigenous Australians
(Hall et al. 2009), to large-scale uncontrolled wildfires that burn more extensively, are more
intense, and consume a higher proportion of vegetation (Russell-Smith et al. 2003). An
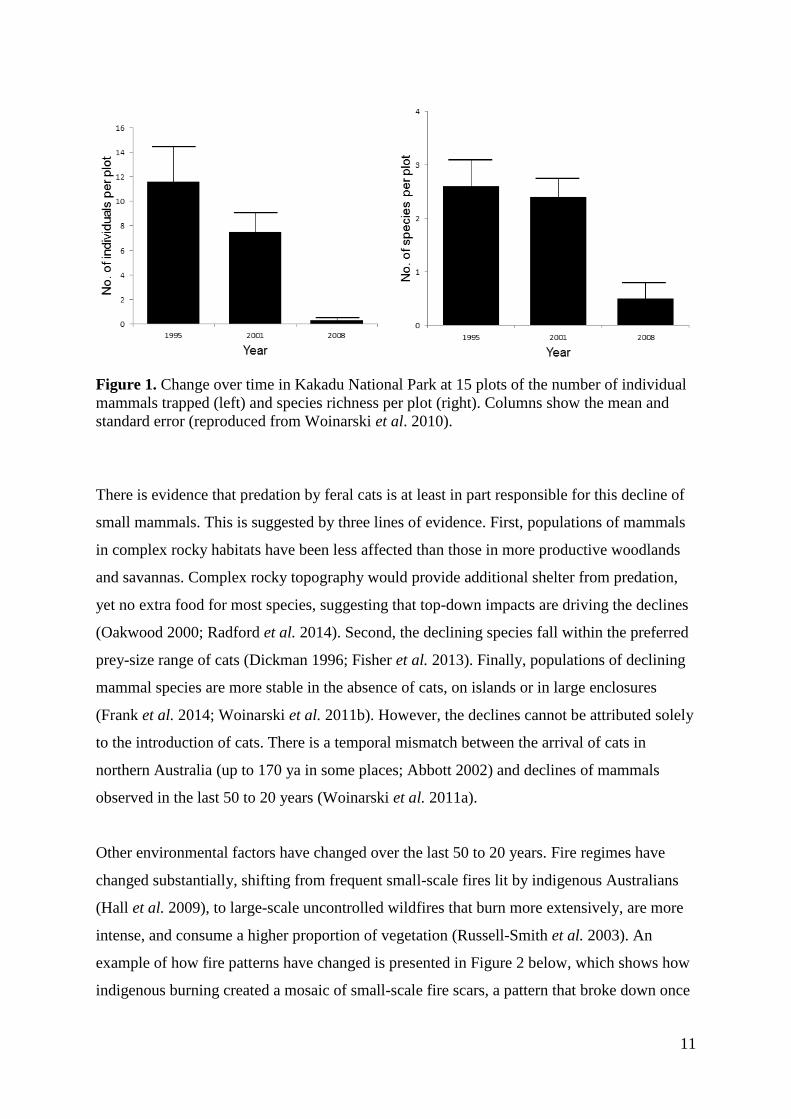
example of how fire patterns have changed is presented in Figure 2 below, which shows how
indigenous burning created a mosaic of small-scale fire scars, a pattern that broke down once
12
indigenous people left the landscape. Similar patterns are well documented elsewhere across
northern Australia.
Figure 2. Fire patterns (grey) inferred from aerial photographs in the Great Sandy Deserts
from 1953, when indigenous Australians, the Pintupi people, still inhabited the landscape,
compared to fire patterns in 1988 after the area was vacated (reproduced from Burrows et al.
2004).
Grazing by large feral herbivores has also have increased in some areas over recent decades,
although the extent of change is unlikely to be as pronounced as for fire regimes. The first
settlers brought cattle Bos taurus and horses Equus caballus, and by the 1900s much of
northern Australia supported herds of domestic or feral herbivores. Densities of large
introduced herbivores may have increased in certain areas, as cattle species more adept to the
north-Australian climate were introduced (Bos indicus) to replace the original Bos taurus
stock which was less resilient to hot and dry conditions. Populations of other large feral
herbivores, such as feral horses, donkeys Equus asinus and buffalo Bubalus bubalis, may
have increased as well. Also, intensification of pastoralism is likely to have increased the size
of managed herds, in turn increasing grazing pressures.
13
In general, small mammals show greater declines in areas where fires are larger and more
intense (Andersen et al. 2005; Kutt and Woinarski 2007; Legge et al. 2008), and where the
impact of grazing is greatest (Kutt and Woinarski 2007; Legge et al. 2011; Woinarski and
Ash 2002). However, as for cats, the patterns and magnitude of decline cannot be solely
attributed to fire and grazing regime changes. Intense fires are not always detrimental to
populations of small mammals. Studies on Marchinbar and Melville Island have both
reported that fire events appear to be beneficial for declining native mammals (Davies and
Murphy 2014; Southgate et al. 1996). Also, declines have continued even in areas where
large herbivore populations have probably decreased, such as Kakadu National Park
(Woinarski et al. 2010). Thus neither cat predation, intensification of fires, nor increased
grazing pressure explain the declines in northern mammals alone. However, it is possible that
all these mechanisms are operating in concert.
The following hypothesis has been put forward to explain the recent mammal declines: that
the impacts of cat predation become greater when it interact with certain fire and grazing
regimes (Johnson 2006; Woinarski et al. 2011a; Ziembicki et al. 2013). This could explain
the apparent mismatch in timing between the arrival of cats and these declines, along with
inconsistencies of the impacts of fire and grazing regimes. Reduction of structural complexity
of vegetation and increased openness due to fire and grazing might increase the exposure of
small mammals to predators, making prey easier to detect and capture. Small mammals are
cats’ preferred prey (Dickman 1996; Kutt 2012). If cats preferentially use the open and
relatively simple habitats created by fire and grazing, the result could be higher predation
impacts on small mammals. This has been suggested as a possible mechanism for these
declines (Johnson 2006; Woinarski et al. 2011a; Ziembicki et al. 2013), however, there is
currently no evidence that can be used to test whether this mechanism is operating, and
whether its effects are powerful enough to explain the observed declines of small mammals.
There is strong basis for this hypothesis in ecological theory. Fire and grazing regimes shape
vegetation structure, which plays a major role in predator hunting success (e.g. Hebblewhite
et al. 2005). Low vegetative cover (less than 1 m high) is especially important for most small
to medium sized terrestrial vertebrates, as it comprises the bulk of biomass at their height,
and contains the dominant food sources for them or their prey. Vegetation at this height is
also especially susceptible to changes in disturbance regimes, even at very small temporal
14
scales. Such changes ultimately affect the overall abundance of prey in habitats with different
fire and grazing regimes, which in turn can alter the populations and movement decisions of
prey (Sinclair et al. 1998).
Low vegetation can also affect the process of actual hunting events. Many animals require
cover to either hide from predators or stalk and ambush prey, while others depend on open
vegetation structure to allow vigilance for predators. Also, complex vegetation can provide a
medium in which one species is able to move at a speed and/or tortuosity that the other
cannot. The impact of this is especially pronounced where there is a large discrepancy
between the size of the predator and the size of the prey, as the smaller animals may be able
to move quickly through dense and complex vegetation while the larger are impeded. For this
reason, vegetation structure is likely to be of greatest importance to prey populations when
predators are larger than their prey, and may be less so if predator and prey are either
similarly sized or prey are larger. In such cases more species-specific factors such as
locomotor skills and capacity to mount a defence would become more important (Orsdol
1984). With such a wide variety of potential interactions, the manner in which vegetation
affects hunting events depends on the predator, prey and ecological context.
Given these considerations, there are numerous mechanisms by which intensification of fire
and grazing regimes could increase predation rates imposed by feral cats. Fire and grazing
might reduce habitat suitability for some small mammals, which could in turn reduce
recruitment to a threshold at which cat predation becomes overwhelming. Such changes may
also alter the movement patterns of cats, so they are more likely to hunt in burnt or grazed
habitats. Hunting by feral cats could be enhanced, as small animals become easier to hunt.
Cats have one of the largest ratios between their own size and that of their prey of any
carnivore, approximately 1:0.03 (Kitchener 1991; Vézina 1985), so it is likely that their prey
can move quickly through complex low vegetation (e.g. spinifex tussocks) while they cannot.
Therefore, if changes in fire and grazing regimes were to reduce the spatial and temporal
cover of vegetation, then their predatory impacts may be greater.
Aims
The aims of this thesis were to test the hypothesis that predation impacts of feral cats are
more pronounced under intensifying fire and grazing regimes, to an extent that could explain
15
recent declines in the north-Australian mammal fauna. This was achieved by analysing cat
impacts at different scales in monsoon savanna landscapes with contrasting fire and grazing
patterns in the central Kimberley region of Western Australia. First, I measured population
densities of feral cats at six sites with contrasting fire and grazing regimes, to determine if
population density responded to the differences in vegetation caused by fire and grazing.
Second, I assessed fine-scale movements of feral cats, to test whether individual cats
preferentially hunted in burnt or grazed areas within their home ranges. Third, I assessed
large-scale movements of feral cats to determine whether they would travel outside of their
home ranges to hunt in such areas. Fourth, I used animal-borne video cameras to observe the
hunting of feral cats to determine whether open or grassed habitats either increased or
decreased their success rate. Finally, I assessed all this together in context, to provide a
synthesis of evidence bearing on the hypothesis, and to estimate the magnitude of the impacts
of the hypothesised process on populations of small mammals.
16
References
Abbott, I. (2002) Origin and spread of the cat, Felis catus, on mainland Australia, with a
discussion of the magnitude of its early impact on native fauna. Wildlife Research 29, 51–74.
Andersen, A.N., Cook, G.D., Corbett, L.K., Douglas, M.M., Eager, R.W., Russell-Smith, J.,
Setterfield, S.A., Williams, R.J., and Woinarski, J.C.Z. (2005) Fire frequency and
biodiversity conservation in Australian tropical savannas: implications from the Kapalga fire
experiment. Austral Ecology 30(2), 155–167.
Brook, B.W., Sodhi, N.S., and Bradshaw, C.J.A. (2008) Synergies among extinction drivers
under global change. Trends in Ecology & Evolution 23(8), 453–460.
Burbidge, A.A., Johnson, K.A., Fuller, P.J., and Southgate, R.I. (1988) Aboriginal knowledge
of the mammals of the central deserts of Australia. Wildlife Research 15(1), 9–39.
Burbidge, A.A., and McKenzie, N.L. (1989) Patterns in the modern decline of Western
Australia's vertebrate fauna: causes and conservation implications. Biological Conservation
50, 143–198.
Burrows, N.D., Burbidge, A.A., and Fuller, P.J. Integrating Indigenous knowledge of
wildland fire and western technology to conserve biodiversity in an Australian desert. In
'Bridging Scales and Epistemologies: Linking Local Knowledge and Global Science in
Multiscale Assessments Conference, Alexandria, Egypt', 2004,
Churchill, S. (1997) Habitat use, distribution and conservation status of the Nabarlek, P.
concinna, and sympatric rock-dwelling mammals, in the Northern Territory. Australian
Mammalogy 19, 297–308.
Cramb, J., and Hocknull, S. (2010) New Quaternary records of Conilurus (Rodentia:
Muridae) from eastern and northern Australia with the description of a new species. Zootaxa
2634, 41–56.
Davies, H., and Murphy, B.P. (2014) Fire and small mammals on the Tiwi Islands. In
'Australian Mammal Society.' (Ed. EG Ritchie): Melbourne, Vic)
Dickman, C.R. (1996) Overview of the impacts of feral cats on Australian native fauna.
University of Sydney, Sydney.
Dirzo, R., Young, H.S., Galetti, M., Ceballos, G., Isaac, N.J.B., and Collen, B. (2014)
Defaunation in the Anthropocene. Science 345(6195), 401–406.
Dunlop, C.R., and Begg, R.J. (1981) The Small Mammals of Little Nourlangie Rock, N. T I.
Description of Study Site. Wildlife Research 8(1), 51–56.
Fisher, D.O., Johnson, C.N., Lawes, M.J., Fritz, S.A., McCallum, H.I., Blomberg, S.P., Van
Der Wal, J., Abbott, B., Frank, A., Legge, S., Letnic, M., Thomas, C.R., Fisher, A., Gordon,
I.J., and Kutt, A.S. (2013) The current decline of tropical marsupials in Australia: is history
repeating? Global Ecology and Biogeography 23(2), 181–190.
17
Frank, A.S.K., Johnson, C.N., Potts, J., Alaric, F., Lawes, M.J., Woinarski, J.C.Z., Tuft, K.,
Radford, I., Gordon, I.J., Collis, M.-A., and Legge, S. (2014) Experimental evidence that
feral cats cause local extirpation of small mammals in Australia's tropical savanna. Journal of
Applied Ecology 51(6), 1486–1493.
Hall, L.S., Kasparian, M.A., Van Vuren, D., and Kelt, D.A. (2009) Spatial organization and
habitat use of feral cats (Felis catus L.) in Mediterranean California. Mammalia 64(1), 19–28.
Hebblewhite, M., Merrill, E.H., and McDonald, T.L. (2005) Spatial decomposition of
predation risk using resource selection functions: an example in a wolf-elk predator-prey
system. Oikos 111, 101–111.
IUCN (2014) The IUCN Red List of Threatened Species. In '. Vol. 2014.')
Johnson, C.N. (2006) 'Australia's mammal extinctions: a 50 000 year history.' (Cambridge
University Press: Cambridge)
Kitchener, A.C. (1991) 'A natural history of the wild cats.' (Cornell University Press: Ithaca,
New York)
Kutt, A.S. (2012) Feral cat (Felis catus) prey size and selectivity in north‐eastern Australia:
implications for mammal conservation. Journal of Zoology 287(4), 292–300.
Kutt, A.S., and Woinarski, J.C.Z. (2007) The effects of grazing and fire on vegetation and the
vertebrate assemblage in a tropical savanna woodland in north-eastern Australia. Journal of
Tropical Ecology 23(1), 95–106.
Legge, S., Kennedy, M.S., Lloyd, R., Murphy, S.A., and Fisher, A. (2011) Rapid recovery of
mammal fauna in the central Kimberley, northern Australia, following the removal of
introduced herbivores. Austral Ecology 36, 791–799.
Legge, S., Murphy, S., Heathcote, J., Flaxman, E., Augusteyn, J., and Crossman, M. (2008)
The short-term effects of an extensive and high-intensity fire on vertebrates in the tropical
savannas of the central Kimberley, northern Australia. Wildlife Research 35, 33–43.
Oakwood, M. (2000) Reproduction and demography of the northern quoll, Dasyurus
hallucatus, in the lowland savanna of northern Australia. Australian Journal of Zoology 48,
519–539.
Orsdol, K.G. (1984) Foraging behaviour and hunting success of lions in Queen Elizabeth
National Park, Uganda. African Journal of Ecology 22(2), 79–99.
Pimm, S.L., Jenkins, C.N., Abell, R., Brooks, T.M., Gittleman, J.L., Joppa, L.N., Raven,
P.H., Roberts, C.M., and Sexton, J.O. (2014) The biodiversity of species and their rates of
extinction, distribution, and protection. Science 344(6187), 1246752.
Radford, I.J., Dickman, C.R., Start, A.N., Palmer, C., Carnes, K., Everitt, C., Fairman, R.,
Graham, G., Partridge, T., and Thomson, A. (2014) Mammals of Australia's tropical
savannas: A conceptual model of assemblage structure and regulatory factors in the
Kimberley region. PLos ONE 9(3), e92341.
18
Russell-Smith, J., Yates, C.J., Edwards, A., Allan, G.E., Cook, G.D., Cooke, P., Craig, R.,
Heath, B., and Smith, R. (2003) Contemporary fire regimes of northern Australia, 1997–
2001: change since Aboriginal occupancy, challenges for sustainable management.
International Journal of Wildland Fire 12, 283–297.
Sinclair, A.R.E., Pech, P.R., Dickman, C.R., D., H., Mahon, P., and Newsom, A.E. (1998)
Predicting effects of predation on conservation of endangered prey. Conservation Biology
12(3), 564–575.
Smith, A.P., and Quin, D.G. (1996) Patterns and causes of extinction and decline in
Australian conilurine rodents. Biological Conservation 77(2), 243–267.
Southgate, R., Palmer, C., Adams, M.A., Masters, P., Triggs, B., and Woinarski, J.C.Z.
(1996) Population and habitat characteristics of the Golden Bandicoot (Isoodon auratus) on
Marchinbar Island, Northern Territory. Wildlife Research 23, 647–664.
Start, A.N., Burbidge, A.A., McDowell, M.C., and McKenzie, N.L. (2012) The status of non-
volant mammals along a rainfall gradient in the south-west Kimberley, Western Australia.
Australian Mammalogy 34(1), 36–48.
Vézina, A.F. (1985) Empirical relationships between predator and prey size among terrestrial
vertebrate predators. Oecologia 67(4), 555–565.
Woinarski, J.C.Z., Armstrong, M., Brennan, K., Fisher, A., Griffiths, A.D., Hill, B., Milne,
D.J., Palmer, C., Ward, S., Watson, M., Winderlich, S., and Young, S. (2010) Monitoring
indicates rapid and severe decline of native small mammals in Kakadu National Park,
northern Australia. Wildlife Research 37, 116–126.
Woinarski, J.C.Z., and Ash, A.J. (2002) Responses of vertebrates to pastoralism, military
land use and landscape position in an Australian tropical savanna. Austral Ecology 27(3),
311–323.
Woinarski, J.C.Z., Burbidge, A.A., and Harrison, P. (2014) 'Action plan for Australian
mammals 2012.' (CSIRO: Melbourne)
Woinarski, J.C.Z., Legge, S., Fitzsimons, J.A., Traill, B.J., Burbidge, A.A., Fisher, A., Firth,
R.S.C., Gordon, I.J., Griffiths, A.D., Johnson, C.N., McKenzie, N.L., Palmer, C., Radford, I.,
Rankmore, B., Ritchie, E.G., Ward, S., and Ziembicki, M. (2011a) The disappearing mammal
fauna of northern Australia: context, cause, and response. Conservation Letters 4(3), 1–10.
Woinarski, J.C.Z., Ward, S., Mahney, T., Bradley, J., Brennan, K., Ziembicki, M., and Fisher,
A. (2011b) The mammal fauna of the Sir Edward Pellew island group, Northern Territory,
Australia: refuge and death-trap. Wildlife Research 38, 307–322.
Ziembicki, M.R., Woinarski, J.C.Z., and Mackey, B. (2013) Evaluating the status of species
using Indigenous knowledge: Novel evidence for major native mammal declines in northern
Australia. Biological Conservation 157, 78–92.

19
20
Thesis structure
Each chapter of the thesis is written as a separate article for publication in a different journal,
so there is some repetition of background material and description of study areas to establish
the context for each paper. Formatting remained consistent between chapters, however, this
will be altered for publication. For all chapters, I am the lead author. My supervisors were co-
authors on all papers. For chapter 2, Joanne Potts is a co-author as she provided the design
and framework for the data analysis.
Chapter 2 - Density and home range of feral cats in north-western Australia.
This has been submitted to Wildlife Research, and is awaiting decision.
Chapter 3 - Landscape management of fire and grazing regimes alters the fine-scale
habitat utilisation by feral cats.
This has been accepted in PlosOne, and will be published online soon.
Chapter 4 - Long-distance hunting expeditions to intense fire scars by feral cats.
This has been prepared for submission in Nature Communications. As this paper draws
heavily on the previous two chapters, I am awaiting their acceptance for publication before I
submit this.
Chapter 5 - Hunting behaviour of feral cats in a tropical savannah, revealed by animal-
borne video-collars.
This has been prepared for submission in Journal of Applied Ecology. Before submission, I
shall alter the figures to be in greyscale.
21
Photos of study area and methods
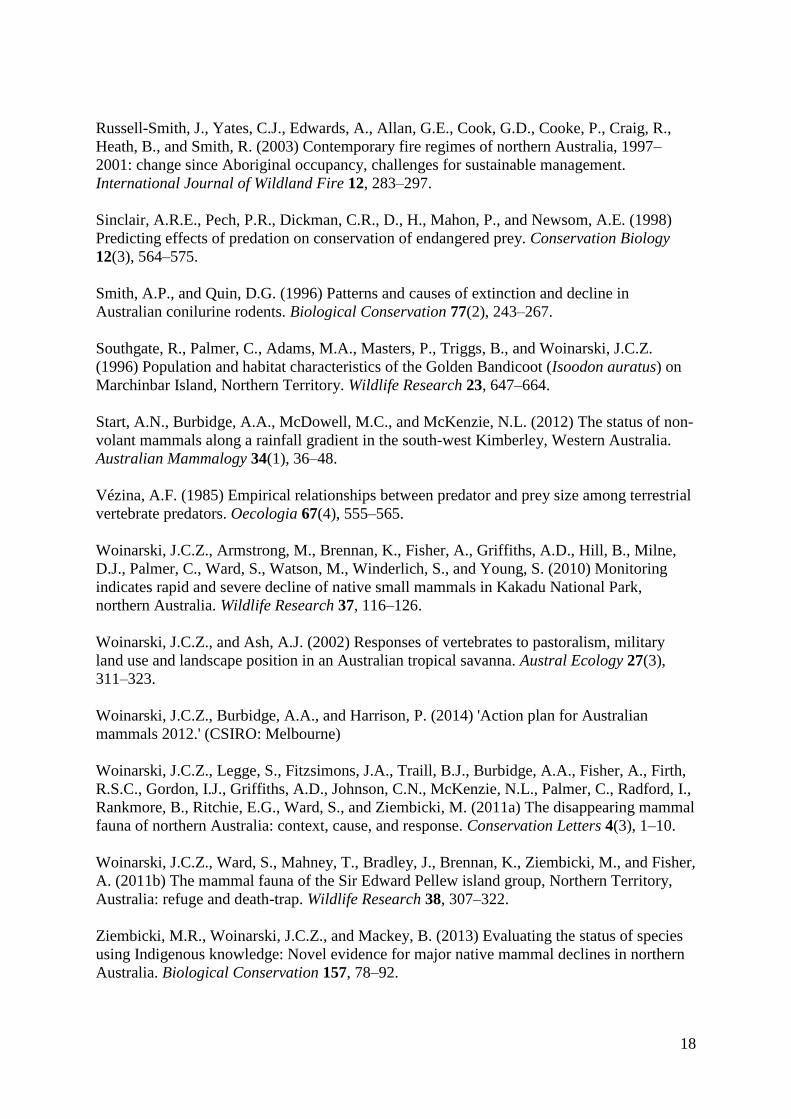
A short photo essay is presented below to facilitate an understanding of the landscapes this
study was undertaken in, and the methods involved.
Typical habitat of the study area, with a dense grass understorey and open eucalyptus woodland
interspersed with boab trees.
22
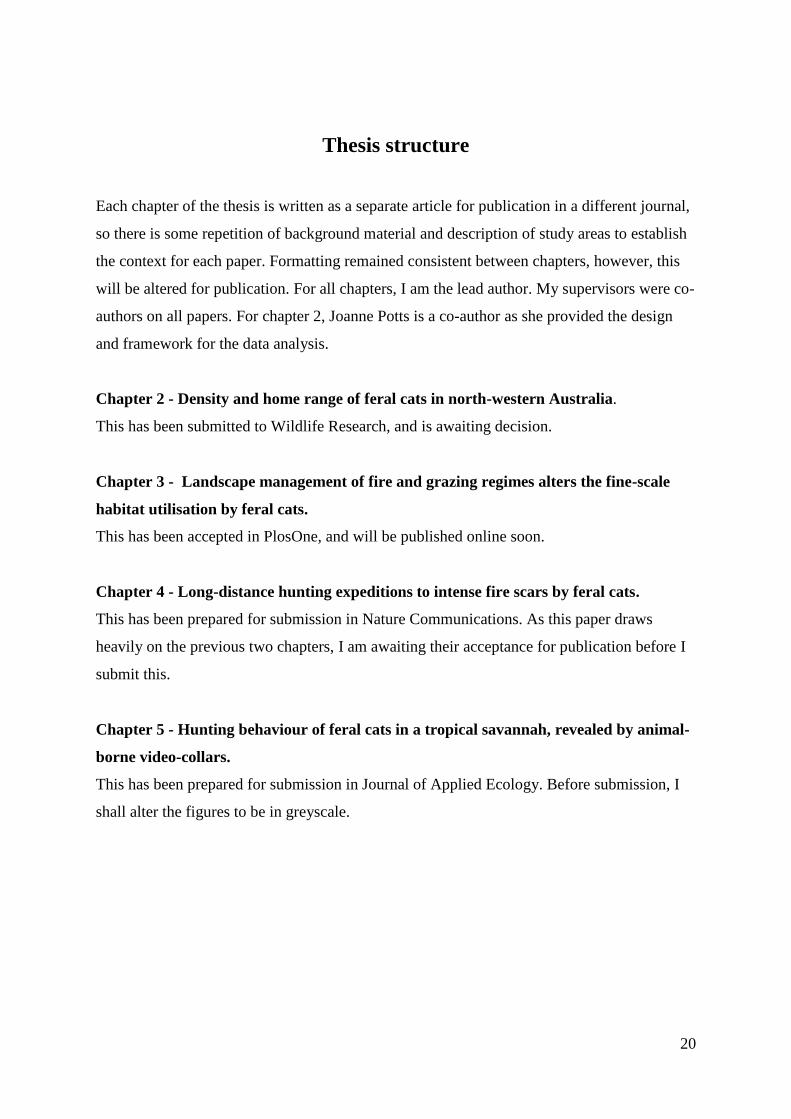
Fires are a major feature of the landscape. Early in the year, fires are small in scale and trickle
through the landscape (photo by Katherine Tuft)
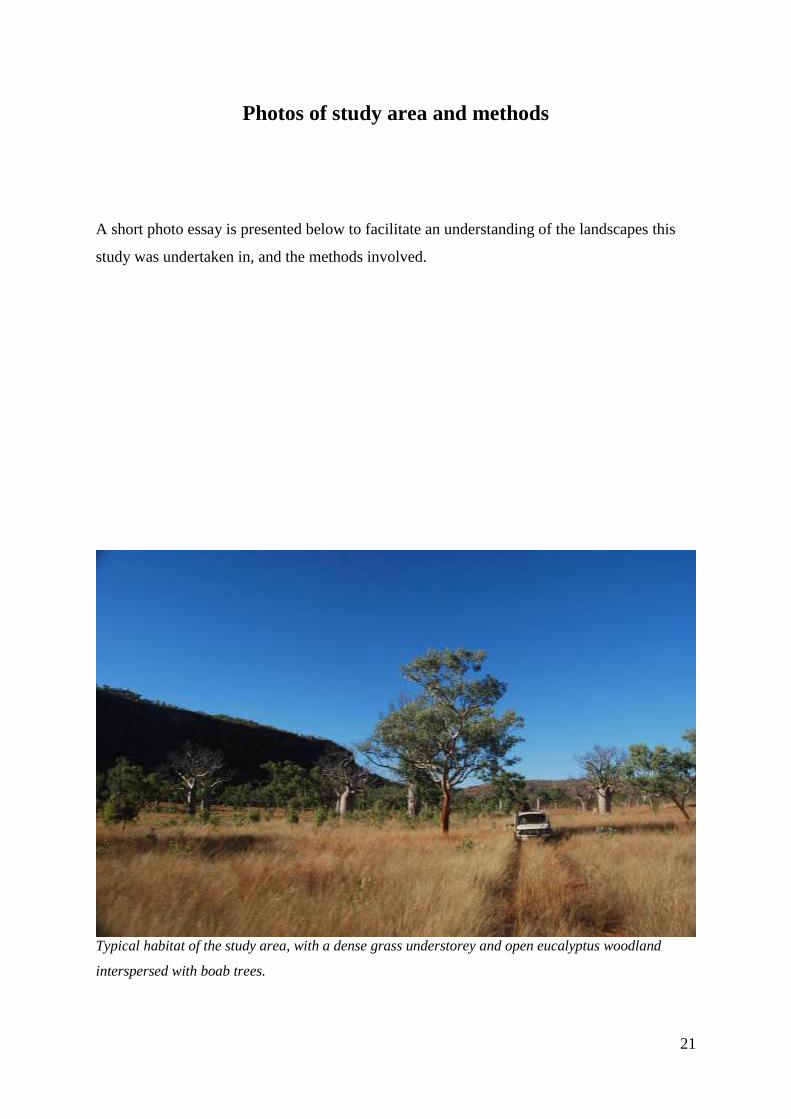
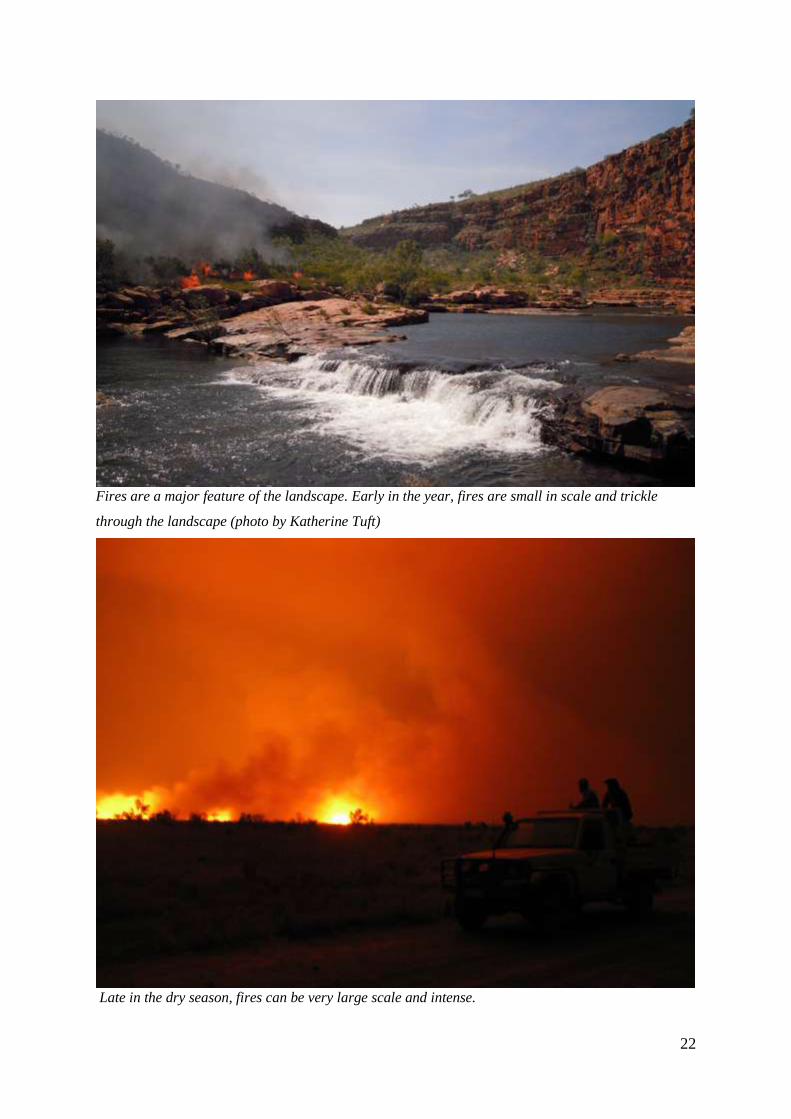
Late in the dry season, fires can be very large scale and intense.
23
Cat detection dogs ready to spotlight for cats, Sally on the left and Brangul on the right (photo by
Wayne Lawler)
Sally leading a chase to retrieve a GPS collar from a cat, with Toby Barton, Danni Lisle and Hugh
McGregor (photo by Wayne Lawler)
24
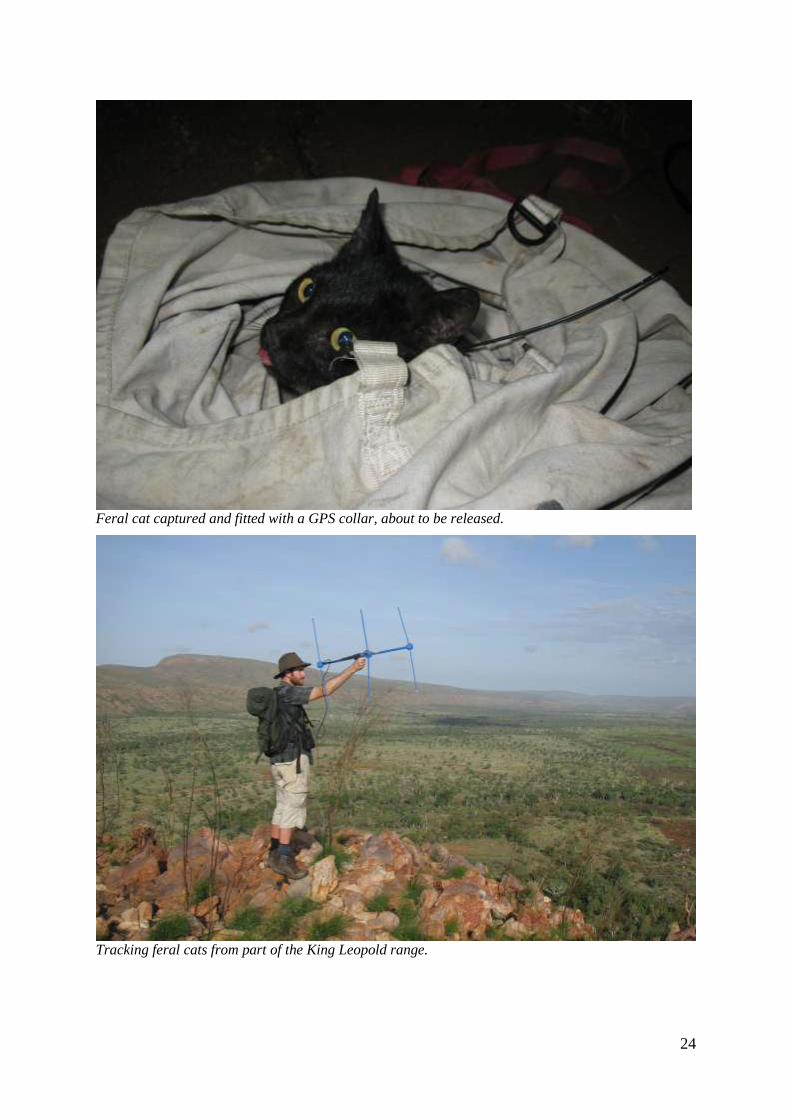
Feral cat captured and fitted with a GPS collar, about to be released.
Tracking feral cats from part of the King Leopold range.
25
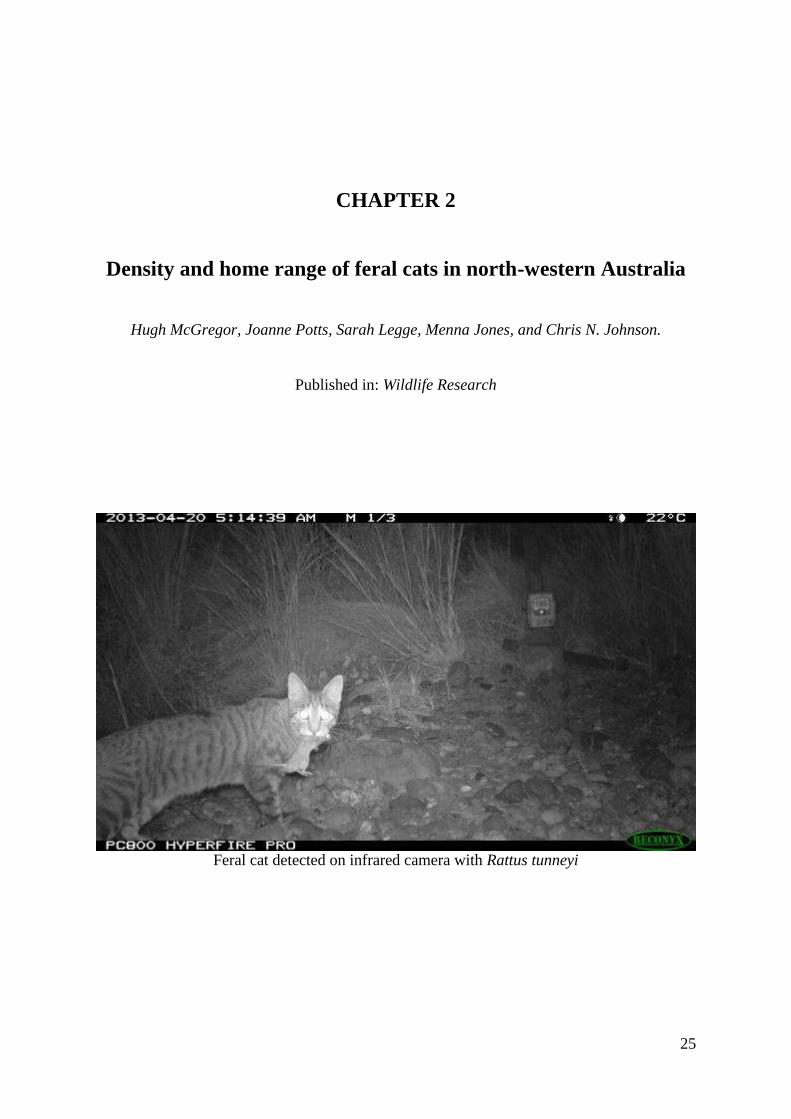
CHAPTER 2
Density and home range of feral cats in north-western Australia
Hugh McGregor, Joanne Potts, Sarah Legge, Menna Jones, and Chris N. Johnson.
Published in: Wildlife Research
Feral cat detected on infrared camera with Rattus tunneyi
26
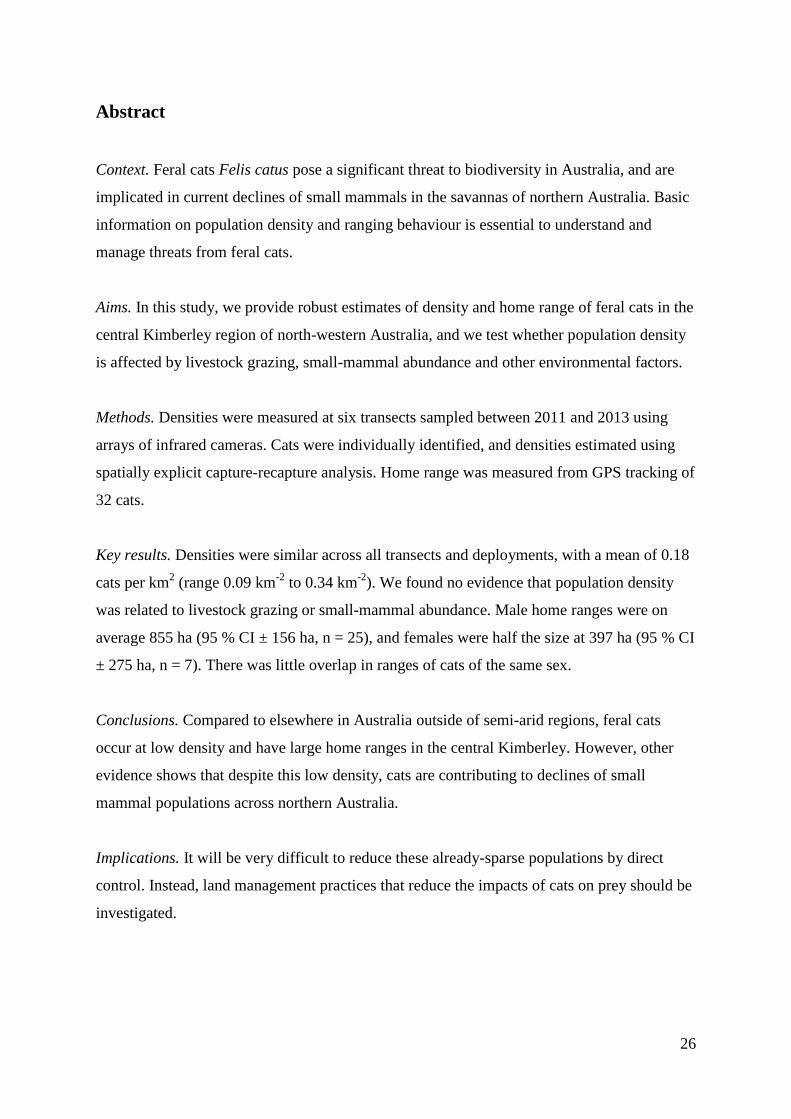
Abstract
Context. Feral cats Felis catus pose a significant threat to biodiversity in Australia, and are
implicated in current declines of small mammals in the savannas of northern Australia. Basic
information on population density and ranging behaviour is essential to understand and
manage threats from feral cats.
Aims. In this study, we provide robust estimates of density and home range of feral cats in the
central Kimberley region of north-western Australia, and we test whether population density
is affected by livestock grazing, small-mammal abundance and other environmental factors.
Methods. Densities were measured at six transects sampled between 2011 and 2013 using
arrays of infrared cameras. Cats were individually identified, and densities estimated using
spatially explicit capture-recapture analysis. Home range was measured from GPS tracking of
32 cats.
Key results. Densities were similar across all transects and deployments, with a mean of 0.18
cats per km2 (range 0.09 km
-2 to 0.34 km
-2). We found no evidence that population density
was related to livestock grazing or small-mammal abundance. Male home ranges were on
average 855 ha (95 % CI ± 156 ha, n = 25), and females were half the size at 397 ha (95 % CI
± 275 ha, n = 7). There was little overlap in ranges of cats of the same sex.
Conclusions. Compared to elsewhere in Australia outside of semi-arid regions, feral cats
occur at low density and have large home ranges in the central Kimberley. However, other
evidence shows that despite this low density, cats are contributing to declines of small
mammal populations across northern Australia.
Implications. It will be very difficult to reduce these already-sparse populations by direct
control. Instead, land management practices that reduce the impacts of cats on prey should be
investigated.
27
Introduction
Feral cats Felis catus are a major threat to biodiversity conservation in Australia (Dickman
1996) and the primary threat to many extant mammals (Woinarski et al. 2014). While there
are numerous examples of cats causing localised population declines and extirpations of prey
species (Christensen 1980; Fancourt 2014; Risbey et al. 1999), little is known about the full
extent of their impacts, especially compared to less cryptic introduced mammals like foxes
Vulpes vulpes. Quantifying the potential impacts of feral cats, and devising management
strategies to reduce those impacts, requires information on population density and ecology of
feral cats. Such information is generally not available in many habitats and regions across
Australia.
Acquiring density estimates for cats in Australia is difficult, as cats are challenging to capture
and detect (Short et al. 2003). They are typically solitary, cryptic, and display little interest in
bait. To date, cats have mostly been monitored using passive activity indices (Kennedy et al.
2012; Lazenby and Dickman 2013; Read and Bowen 2001). While such measures may
capture changes in relative abundance at local scales, they do not provide estimates of
absolute abundance. In a few instances, abundance has been estimated from spotlight counts
in the arid zone (e.g. Read and Bowen 2001; Short and Turner 2005) and the temperate south-
east (see Denny and Dickman 2010 for full list; Jones and Coman 1982). However, the wary
nature of cats means that they are likely to have low detectability by spotlight counting, and
sighting transects are therefore likely to underestimate true abundance (Mahon et al. 1998;
Read and Eldridge 2010). Bengsen et al. (2012) estimated cat densities outside of townships
on Kangaroo Island to be 0.7 km-2
, but this was an area without sympatric foxes or dingoes
Canis familiaris dingo, so is unlikely to be representative of mainland Australia. In tropical
Australia, basic information on density and home range remains unknown. Understanding the
density and home range of feral cats is important to interpreting their full impacts in these
ecosystems.
Currently, cats appear to be threatening many native mammals in tropical Australia
(Woinarski et al. 2011a; Woinarski et al. 2014). Feral cats are the only introduced
mesopredator in tropical Australia, and across most of the north they have no similar-sized
native counterpart. Most species of terrestrial small mammals in this region have been
28
declining, and there is evidence that this is due, at least in part, to predation by feral cats
(Fisher et al. 2013; Frank et al. 2014; Woinarski et al. 2011b). However, all available
evidence suggests that densities of cats in the north are low. Indices from track counts on
sandpads have recorded cat tracks on between 0.06 % and 22 % of pads per night (Catling et
al. 1999; Ibbett 2010; Kennedy et al. 2012), which is generally lower than elsewhere in
Australia. Spotlight surveys in Kakadu National Park at different areas suggested densities of
0.7 km-2
, 0.2 km-2
(Ibbett 2010) and 0.03 km-2
(Braithwaite et al. 1984, in Ibbett 2010). These
low estimates could either reflect genuinely low abundance, or an abundant yet cryptic
population. Both interpretations have vastly different implications for how the impacts of
feral cats could be managed.
Densities of feral cats are likely to vary between habitat types and management regimes. In
particular, we expect density to increase with small-mammal abundance, as this predicts
activity elsewhere in Australia (Short and Turner 2005). Density may also vary with water
availability, as wetter areas may have greater concentrations of prey and potentially higher
densities of cats (Braithwaite and Griffiths 1994). Different management regimes may also
alter cat densities, as grazing by domestic stock would open up the ground layer, potentially
improving hunting effectiveness. Declines of native mammals are strongest in areas with
intense grazing pressure by introduced herbivores (Legge et al. 2011a), raising the question
of whether cat densities are also higher in such areas.
Home range and spacing of individuals are important considerations for the impacts of feral
cats on prey, along with helping to devise effective management strategies. As density
estimates generally have large confidence intervals, variations in densities at finer spatial
scales can be inferred from measuring home range size (Liberg et al. 2000). In this study, we
provide the first robust estimate of density and home range size of feral cats in north
Australia. Density was estimated using spatially explicitly capture-recapture analysis
(Borchers and Efford 2008), from data gathered by motion-triggered infrared cameras to
uniquely identify cats. This method can provide density estimates with an appropriate spatial
reference, unlike traditional mark-recapture analysis. To determine the spatial distribution of
cats, we compared cat density between areas with different riparian habitat characteristics and
grazing by feral herbivores. We did not consider effects of fire as there was insufficient
variation at a landscape scale to compare between transects, however, such impacts are

29
considered at a finer scale (Chapter 3). Finally, since we were limited by the sample-size of
landscape-scale density estimates, we investigated habitats likely to affect cat density at a
smaller spatial scale by analysing variations in their home range size using GPS collars.
Smaller home ranges generally indicate a greater localised density (Barratt 1997; Wolff
1985), so smaller home ranges for feral cats, relative to their size and sex, should be linked to
higher cat densities.
30
Methods
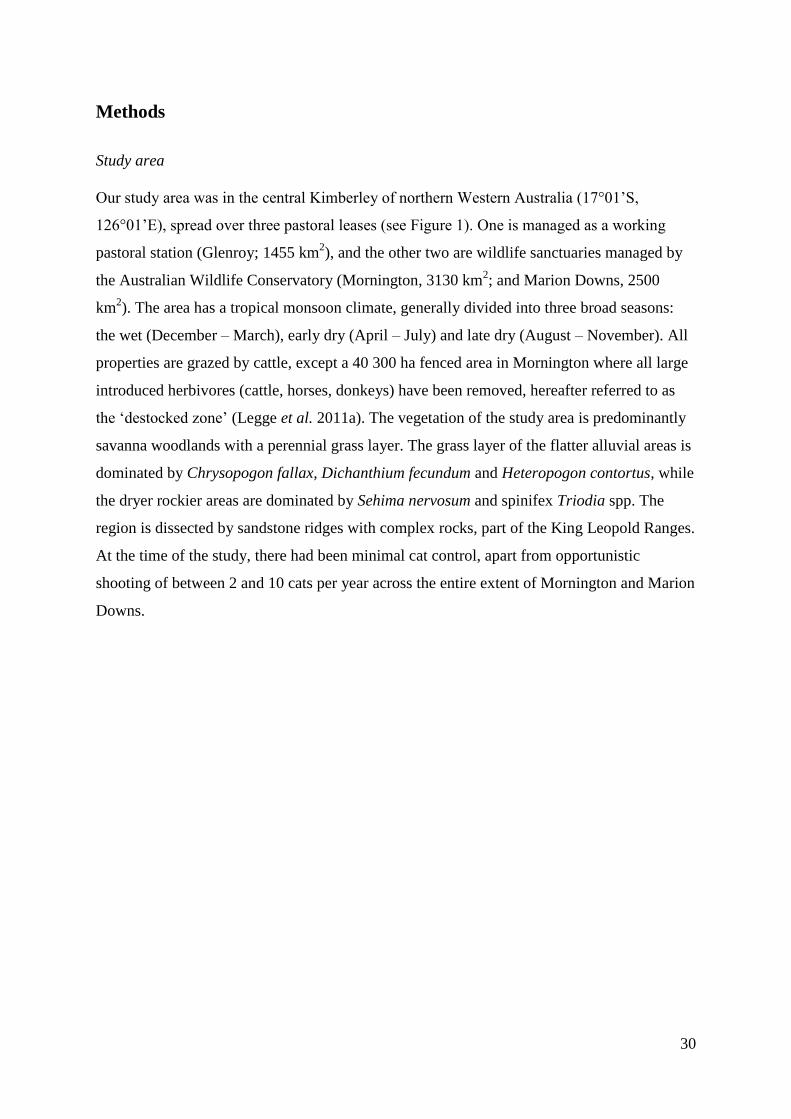
Study area
Our study area was in the central Kimberley of northern Western Australia (17°01’S,
126°01’E), spread over three pastoral leases (see Figure 1). One is managed as a working
pastoral station (Glenroy; 1455 km2), and the other two are wildlife sanctuaries managed by
the Australian Wildlife Conservatory (Mornington, 3130 km2; and Marion Downs, 2500
km2). The area has a tropical monsoon climate, generally divided into three broad seasons:
the wet (December – March), early dry (April – July) and late dry (August – November). All
properties are grazed by cattle, except a 40 300 ha fenced area in Mornington where all large
introduced herbivores (cattle, horses, donkeys) have been removed, hereafter referred to as
the ‘destocked zone’ (Legge et al. 2011a). The vegetation of the study area is predominantly
savanna woodlands with a perennial grass layer. The grass layer of the flatter alluvial areas is
dominated by Chrysopogon fallax, Dichanthium fecundum and Heteropogon contortus, while
the dryer rockier areas are dominated by Sehima nervosum and spinifex Triodia spp. The
region is dissected by sandstone ridges with complex rocks, part of the King Leopold Ranges.
At the time of the study, there had been minimal cat control, apart from opportunistic
shooting of between 2 and 10 cats per year across the entire extent of Mornington and Marion
Downs.
31
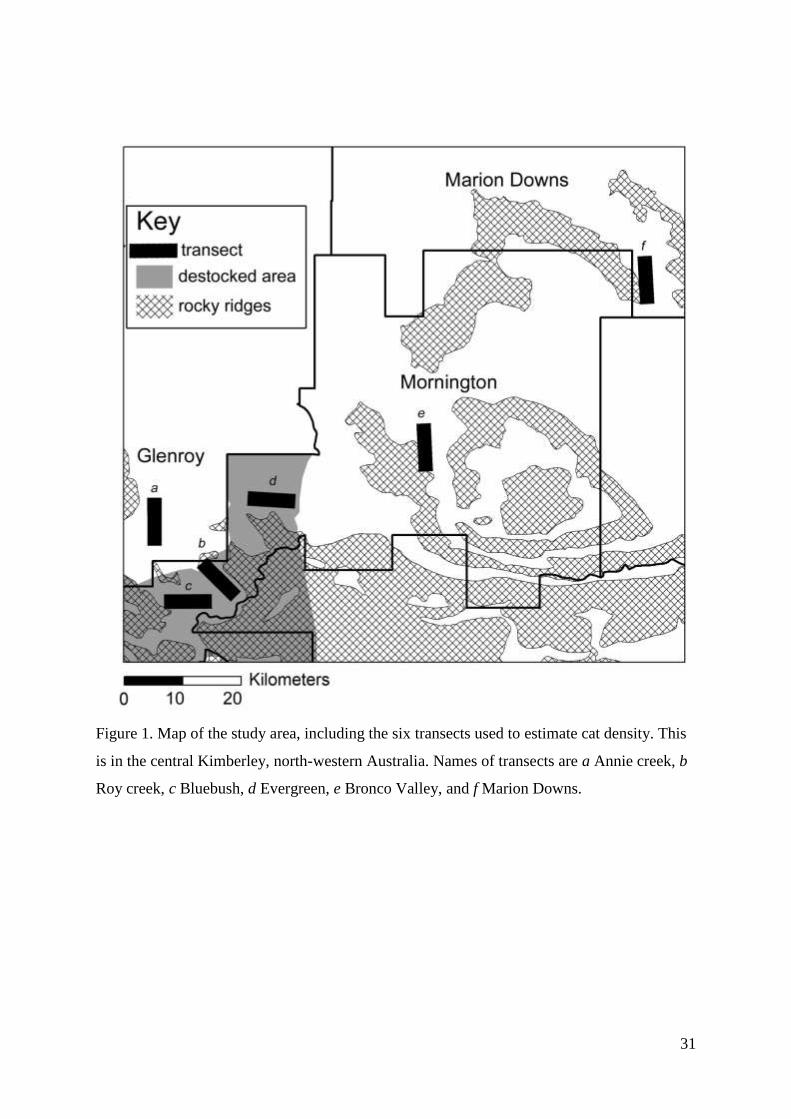
Figure 1. Map of the study area, including the six transects used to estimate cat density. This
is in the central Kimberley, north-western Australia. Names of transects are a Annie creek, b
Roy creek, c Bluebush, d Evergreen, e Bronco Valley, and f Marion Downs.
32
Camera trapping
We placed six transects across the study area (Figure 1). Three transects were in areas grazed
by introduced herbivores, and three where in the destocked zone. Two transects were
sampled in 2011 (Roy Creek and Annie Creek), and all transects were sampled each year in
2012 and 2013. Transects were sampled between May and September each year, and in
haphazard order. Each transect was based along a road, and approximately 7.5 km long.
Fifteen infrared camera traps were placed along each transect at intervals of 300 – 700 m.
This spacing was chosen based on GPS tracking, showing that male cats had a maximum
home range width of 3.5 km and females of 1.2 km, suggesting that all cats with a home
range dissecting the transect should be able to be detected on at least two cameras (Foster and
Harmsen 2012). Cameras were positioned such that probability of detection of cats would be
maximised, for example by placing them on dry creek-lines and in naturally open areas.
Although cats in the study area did not have strong preferences for such habitats (Chapter 3),
they would typically walk along such areas for short distances if they encountered them (H.
McGregor, unpublished data). Every fourth camera site had two cameras, to increase the
incidence of passes where both sides of cats could be revealed. In order to keep detection
probabilities as consistent as possible over the duration of each deployment, we did not use
baits or lures. Cameras were deployed for between three to six weeks in each survey. Infrared
cameras used were Reconyx Rapidfire Professional 600c, chosen because of their fast trigger-
time (0.2 seconds). Cameras were programed to take three images per trigger, with fast
shutter speed, favouring photo resolution over flash distance. They were set between 20 and
40 cm high (cat body height), facing directly into the road or creek, with the angle refined
until a ‘walktest’ would detect our hands moving at the height of a cat along the walkway.
The probability of detection was likely consistent between cameras settings, as 100 % of cat
passes on paired cameras were detected by both cameras. However, it is likely cats would not
be detected on any camera on warm days where ambient and cat temperatures are identical.
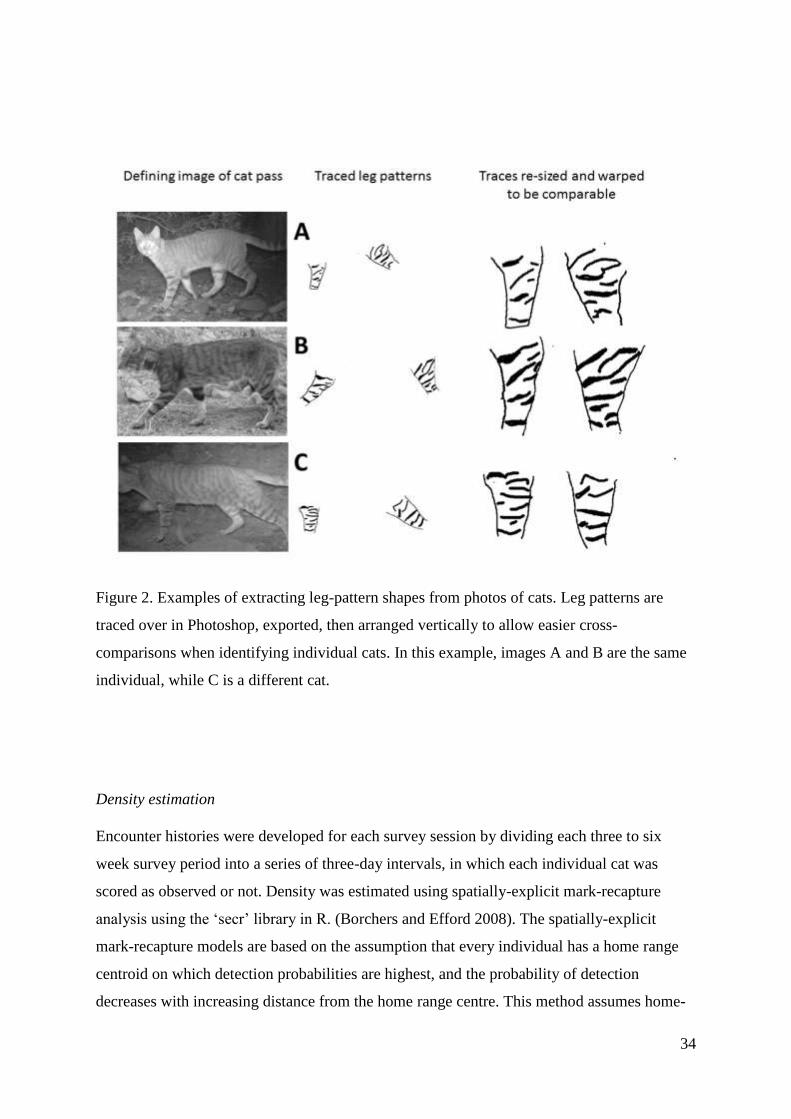
Each pass of a cat in front of a camera was examined in detail. Passes that did not contain
sufficient information to identify cats were discarded. From all cat passes where markings
were visible, the majority were tabbies (83 %), all of which had distinct markings. For each
pass of a tabby without an obviously recognisable feature (e.g. a white splotch), the clearest
photo of the left-flank, right flank and head (if applicable) were extracted. The patterns at key
visible identifiable areas (legs, flanks and forehead) were traced in Photoshop, the trace was
33
saved as a separate image, and then stretched in a manner to allow consistent comparisons
with other images (see Figure 2). Once all such cat passes had these traces, they were
reviewed and matches made for those likely to belong to the same individual. Once all legs
were linked, these were then linked to bodies and heads until all passes from each session
were arranged into folders of each possible individual. Each folder was reviewed for
inconsistences, and misidentified passes were reassigned. Once all folders had been reviewed
by H. McGregor, the process was reiterated until a full review was made with no
inconsistences (between two and four reviews per session). Then, all folders were
independently reviewed by another identifier (S. Legge), at which stage there was 98 %
agreement. After a final revision, we came to a complete agreement. Of the remaining black
(8 %) and ginger cats (9 %), the majority (75 %, or 13 % of total) had some identifiable
feature - either a mange mark, white splotch, telemetry collar, damaged ear - or were the
single detection of a cat with that pelage type during the session. However, the remaining 4 %
of cats could be assigned as an individual based only on a subjective assessment of head and
body shape. Such cats were present in four sessions.
34
Figure 2. Examples of extracting leg-pattern shapes from photos of cats. Leg patterns are
traced over in Photoshop, exported, then arranged vertically to allow easier cross-
comparisons when identifying individual cats. In this example, images A and B are the same
individual, while C is a different cat.
Density estimation
Encounter histories were developed for each survey session by dividing each three to six
week survey period into a series of three-day intervals, in which each individual cat was
scored as observed or not. Density was estimated using spatially-explicit mark-recapture
analysis using the ‘secr’ library in R. (Borchers and Efford 2008). The spatially-explicit
mark-recapture models are based on the assumption that every individual has a home range
centroid on which detection probabilities are highest, and the probability of detection
decreases with increasing distance from the home range centre. This method assumes home-
35
ranges centres to be independent, which is unlikely for cats of the same sex. However, such
biases are generally evened out when access to traps is independent, i.e. locations of camera
traps are not biases towards or away from home-range centres (Borchers and Efford 2008).
To aid estimation of model parameters, a buffer has to be chosen as the likely maximum
distance at which detection of an individual away from its home range centre is essentially
zero (Balme et al. 2009). We chose a buffer width of consideration of 3500 m, as this is the
estimated average maximum width of home ranges of male cats from simultaneous GPS data
from cats.
To estimate the detection function, we first assessed which functional form (e.g., half-normal,
hazard or exponential) best fit the observed data. Since cats have varied space-use patterns
within their home range, all possible detection functions were considered. In these models,
detection probabilities at the home range centre (referred to as ‘g0’), and the shoulder of the
detection function (‘sigma’) were constant. Models were compared using AIC values, and
the detection function with the lowest AIC was used as the basis for further modelling. Next,
we created a set of models with different covariates influencing ‘g0’ or ‘sigma’ (see above).
They were modelled as either two unique sub-populations identified by a finite-mixture
model with two classes (‘h2’, assuming this would capture differences between sexes),
interacting with time (‘t’), a learned response to cameras (‘b’), and specific to the
microhabitat of detectors (‘g’, either dry creek-bed, road or open habitat). We assessed the
parameters (‘g0’ and ‘sigma’) for each model, and if the likelihood estimation process had
not converged (as evidenced by standard errors being 0) the models were discarded. All
model AICs were compared and from the preferred model we derived the mean density along
with the lower and upper 95 % confidence intervals.
For the four sessions that contained cats subjectively identified based on shape, we ran a
separate mark-resight analysis (White and Burnham 1999). Although this was not inherently
relevant to a spatial scale, we compared the population estimate obtained to that of the
spatially explicit capture-recapture estimate, to provide an indication for the possible scale of
error considering misidentification. For this, all passes of subjectively identified cats were
considered unmarked, all others marked, and detections considered for all cameras per three-
day interval. The analysis was conducted in the program MARK (White and Burnham 1999).
36
To compare densities of cats against landscape-level factors, we used analysis of variance
models with transects as error terms, compared within an information theory framework. Due
to the low sample size, only two explanatory terms were used. We compared grazing regime
(pastoral cattle station, or destocked conservation area), which collates strongly with small-
mammal density in the study area (Legge et al. 2011a). We also compared the percentage of
area with riparian or alluvial habitats (creeks, rivers, alluvial flats or sandseeps; see Chapter
3for details). Fire impacts were not considered, as there was little variation in fire frequency
and timing between transects.
Home range estimation and interaction
Home range area and overlap were measured by capturing and GPS-collaring cats throughout
the study area. Feral cats were captured between November 2010 and June 2013, using three
different methods. First, large wire cage traps (30 x 30 x 90 cm; Mascot Wire Works) were
used with fresh cat litter as a lure. Second, soft-jaw leg-hold traps (Victor soft-jaw size #1.5)
were placed at the side of roads or dry creek-lines, surrounded in a small bower, with fresh
cat-litter and a visual lure (feathers, CD, or metal tag attached 50 cm from ground with
fishing line). These were checked every six hours throughout the night using telemetry trap
checkers (SirTrack, New Zealand). Third, cats were located by spotlighting at night, and
pursued by specially-trained dogs until they took refuge in a tree. To remove the cat from the
tree, we delivered sedative (Zolotil at a rate of 0.5 c / kg) using a dart rifle (Pneu-dart X-
caliber), and caught the cat in a trampoline. Once captured, cats were fitted with GPS collars
(Telemetry Solutions, Quantum 4000 enhanced). Cats weighing between 2 and 3.3 kg were
fitted with a 70 g collar, while those weighing more than 3.3 kg were fitted with a 100 g
collar so that all collars were less than 3 % of body-weight. These GPS collars units were
programmed to record one fix per day at 20:00 western standard time (+8 hrs coordinated
universal time) for two days, alternating with two-day bouts in which fixes were taken every
15 minutes, starting and finishing at 12:00 noon. To replace GPS collars, cats were
recaptured using the dogs.
To calculate home ranges, we used one fix per day that was either at 20:00 pm WST, or the
closest acquired fix to that time from days with fixes recorded every 15 minutes. A kernel
density analysis was used to define home range, using the smooth cross-validation method
37
and creating a shape file around the 95 % isopleth. As some cats that were studied for long
periods shifted their home ranges, we needed a measure of when this shift occurred to create
two or more different home range measures. Shifts were detected by measuring the
cumulative home range centroid, assessing where it plateaued, then noting any subsequent
sudden departure from this point. Only home range shifts are considered here, as long-
distance travels will be examined in a further paper. Area in hectares was calculated for each.
Overlap of home ranges was measured for every pair of neighbouring cats in the study,
defined as any two cats with 200 m or less between the boundaries of their 95 % isopleth.
The percent of area overlap was measured for each male-male and male-female dyad. All
analysis was conducted in R (R Development Core Team 2008) and ArcMap v. 10, using the
program Geospatial Modelling Environment (Beyer 2012).
We used generalised linear models to determine whether home range size varied with
landscape features or traits of individual cats. Spatial variables measured were grazing
regime, percent of riparian or alluvial vegetation within the home range, and small mammal
density. Morphological variables considered were cat gender, weight (average of start and
end weight for duration of deployment), and age class (adult, sub-adult). The resulting 64
models were compared within an information theory framework.
38
Results
Population density
From the six transects and fourteen deployments of camera traps from 2012 to 2013, we
obtained sufficient detections to estimate density in 13 deployments. In total, 863 cat passes
were recorded and individual cats were identifiable in 820 of these, representing a total of 98
individually identified cats. These were spread over 3314 trap nights, with an average of 255
per deployment (min. 175, max 440).
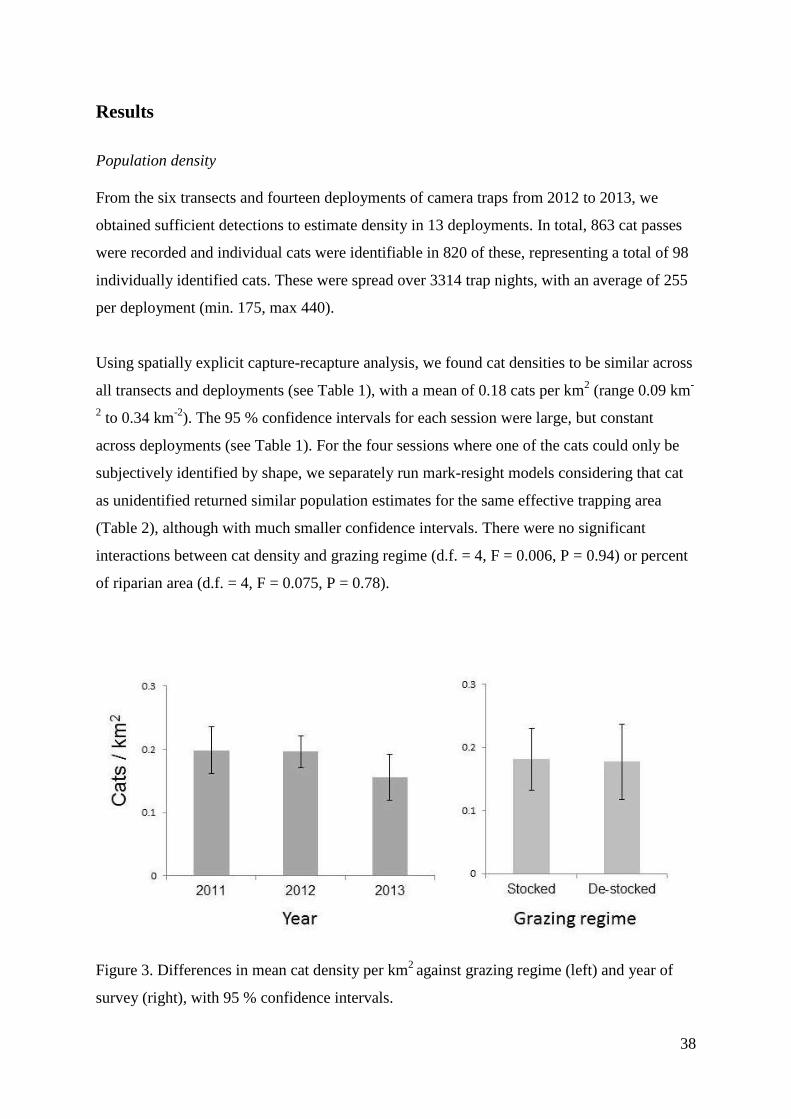
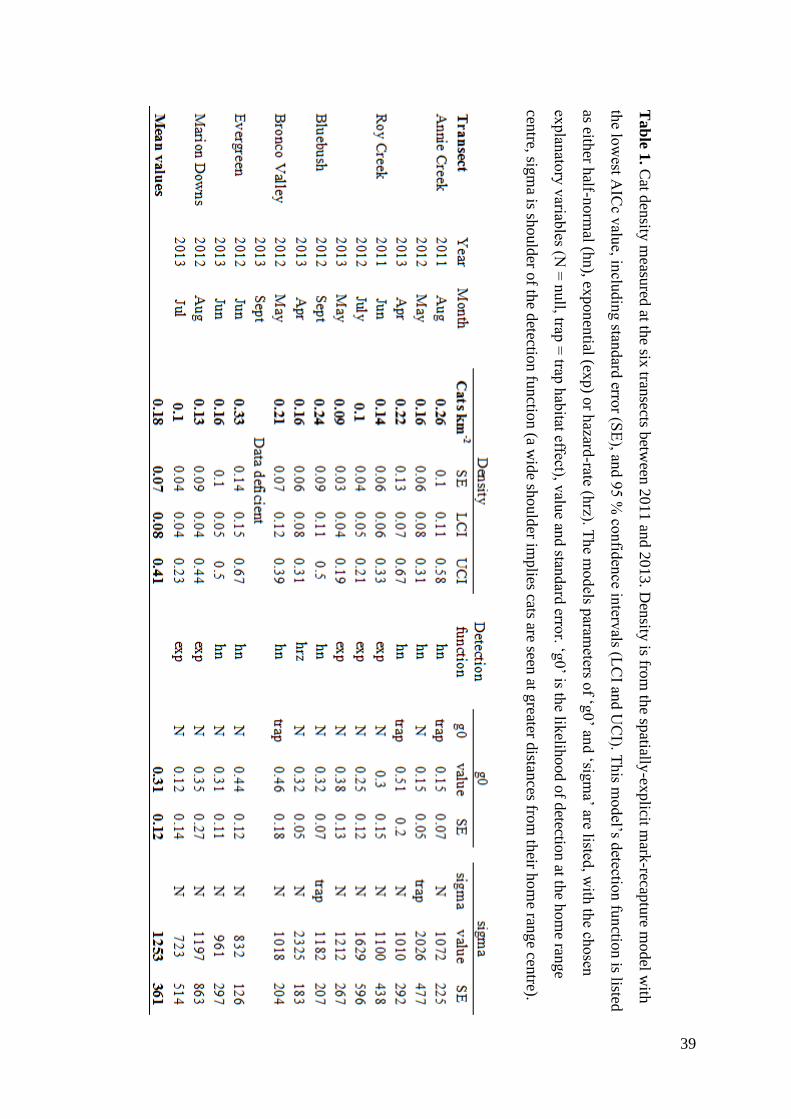
Using spatially explicit capture-recapture analysis, we found cat densities to be similar across
all transects and deployments (see Table 1), with a mean of 0.18 cats per km2 (range 0.09 km
-
2 to 0.34 km
-2). The 95 % confidence intervals for each session were large, but constant
across deployments (see Table 1). For the four sessions where one of the cats could only be
subjectively identified by shape, we separately run mark-resight models considering that cat
as unidentified returned similar population estimates for the same effective trapping area
(Table 2), although with much smaller confidence intervals. There were no significant
interactions between cat density and grazing regime (d.f. = 4, F = 0.006, P = 0.94) or percent
of riparian area (d.f. = 4, F = 0.075, P = 0.78).
Figure 3. Differences in mean cat density per km2
against grazing regime (left) and year of
survey (right), with 95 % confidence intervals.
39
Tab
le 1. C
at den
sity m
easured
at the six
transects b
etween
2011 an
d 2
013. D
ensity
is from
the sp
atially-ex
plicit m
ark-recap
ture m
odel w
ith
the lo
west A
ICc v
alue, in
cludin
g stan
dard
error (S
E), an
d 9
5 %
confid
ence in
tervals (L
CI an
d U
CI). T
his m
odel’s d
etection fu
nctio
n is listed
as either h
alf-norm
al (hn
), exponen
tial (exp) o
r hazard
-rate (hrz). T
he m
od
els param
eters of ‘g
0’ an
d ‘sig
ma’ are listed
, with
the ch
osen
explan
atory
variab
les (N =
null, trap
= trap
hab
itat effect), valu
e and stan
dard
error. ‘g
0’ is th
e likelih
ood o
f detectio
n at th
e hom
e range
centre, sig
ma is sh
ould
er of th
e detectio
n fu
nctio
n (a w
ide sh
ould
er implies cats are seen
at greater d
istances fro
m th
eir ho
me ran
ge cen
tre).
40
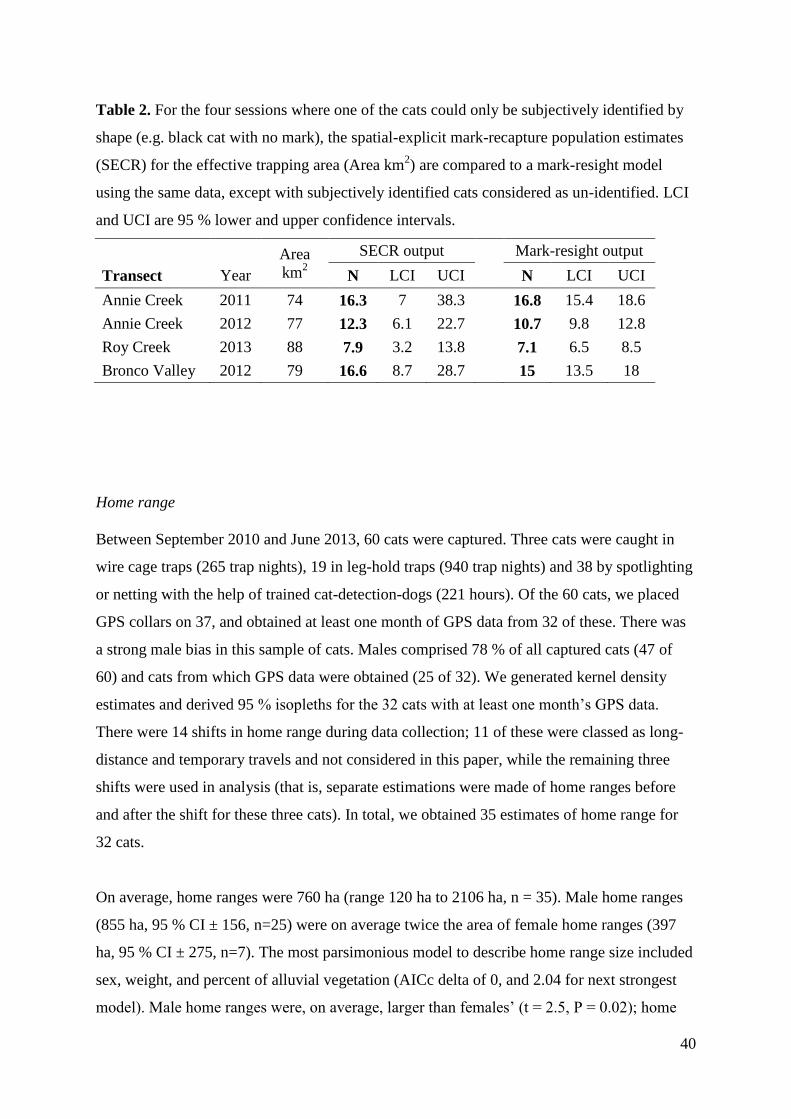
Table 2. For the four sessions where one of the cats could only be subjectively identified by
shape (e.g. black cat with no mark), the spatial-explicit mark-recapture population estimates
(SECR) for the effective trapping area (Area km2) are compared to a mark-resight model
using the same data, except with subjectively identified cats considered as un-identified. LCI
and UCI are 95 % lower and upper confidence intervals.
Area
km2
SECR output
Mark-resight output
Transect Year N LCI UCI
N LCI UCI
Annie Creek 2011 74 16.3 7 38.3
16.8 15.4 18.6
Annie Creek 2012 77 12.3 6.1 22.7
10.7 9.8 12.8
Roy Creek 2013 88 7.9 3.2 13.8
7.1 6.5 8.5
Bronco Valley 2012 79 16.6 8.7 28.7
15 13.5 18
Home range
Between September 2010 and June 2013, 60 cats were captured. Three cats were caught in
wire cage traps (265 trap nights), 19 in leg-hold traps (940 trap nights) and 38 by spotlighting
or netting with the help of trained cat-detection-dogs (221 hours). Of the 60 cats, we placed
GPS collars on 37, and obtained at least one month of GPS data from 32 of these. There was
a strong male bias in this sample of cats. Males comprised 78 % of all captured cats (47 of
60) and cats from which GPS data were obtained (25 of 32). We generated kernel density
estimates and derived 95 % isopleths for the 32 cats with at least one month’s GPS data.
There were 14 shifts in home range during data collection; 11 of these were classed as long-
distance and temporary travels and not considered in this paper, while the remaining three
shifts were used in analysis (that is, separate estimations were made of home ranges before
and after the shift for these three cats). In total, we obtained 35 estimates of home range for
32 cats.
On average, home ranges were 760 ha (range 120 ha to 2106 ha, n = 35). Male home ranges
(855 ha, 95 % CI ± 156, n=25) were on average twice the area of female home ranges (397
ha, 95 % CI ± 275, n=7). The most parsimonious model to describe home range size included
sex, weight, and percent of alluvial vegetation (AICc delta of 0, and 2.04 for next strongest
model). Male home ranges were, on average, larger than females’ (t = 2.5, P = 0.02); home
41
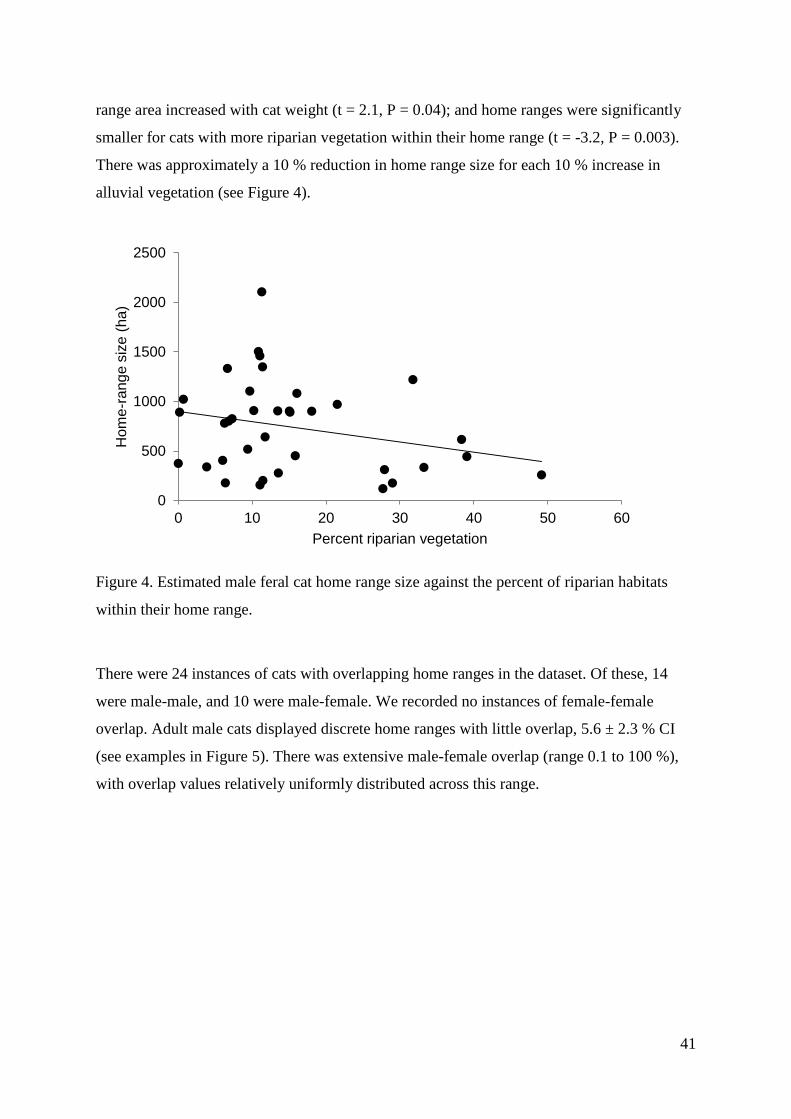
range area increased with cat weight (t = 2.1, P = 0.04); and home ranges were significantly
smaller for cats with more riparian vegetation within their home range (t = -3.2, P = 0.003).
There was approximately a 10 % reduction in home range size for each 10 % increase in
alluvial vegetation (see Figure 4).
Figure 4. Estimated male feral cat home range size against the percent of riparian habitats
within their home range.
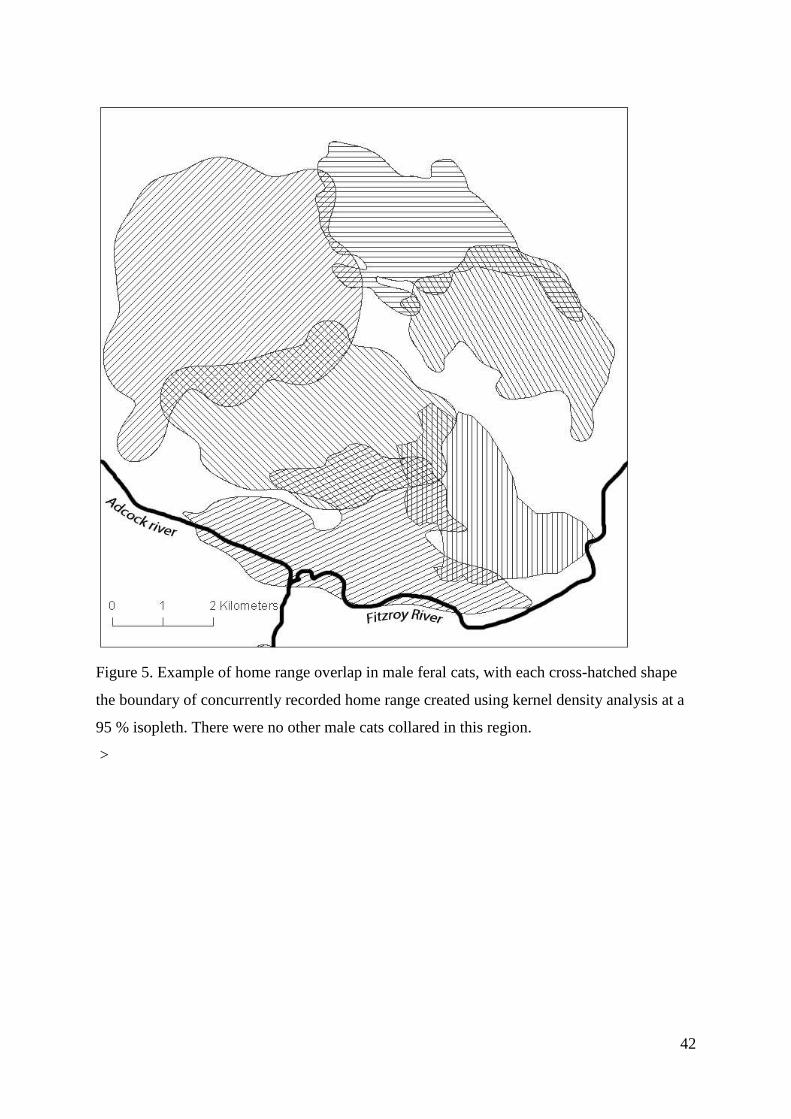
There were 24 instances of cats with overlapping home ranges in the dataset. Of these, 14
were male-male, and 10 were male-female. We recorded no instances of female-female
overlap. Adult male cats displayed discrete home ranges with little overlap, 5.6 ± 2.3 % CI
(see examples in Figure 5). There was extensive male-female overlap (range 0.1 to 100 %),
with overlap values relatively uniformly distributed across this range.
0
500
1000
1500
2000
2500
0 10 20 30 40 50 60
Ho
me
-ra
ng
e s
ize
(h
a)
Percent riparian vegetation
42
Figure 5. Example of home range overlap in male feral cats, with each cross-hatched shape
the boundary of concurrently recorded home range created using kernel density analysis at a
95 % isopleth. There were no other male cats collared in this region.
>
43
Discussion
Feral cats occur at low density in the central Kimberley, with an average of 0.18 cats per km-2
from the 13 sessions measured. Even the highest mean density on any transect (0.34 km-2
)
was lower than the mean densities reported in all other studies outside of the arid zone (0.7
km-2
or more; Bengsen et al. 2012; Denny and Dickman 2010; Jones and Coman 1982). Most
of these other estimates used sighting transects (cats being counted at night from a moving
vehicle and detected with a spotlight), which are likely to underestimates densities of cryptic
animals like cats. Corresponding with low density, home range sizes of cats in our study
region were large compared to those reported in other studies outside the semi-arid zone (e.g.
Bengsen et al. 2012; Buckmaster 2012; Johnston 2012), suggesting they require large areas to
obtain adequate amounts of food. We do not yet know whether many other areas across the
northern Australia also have such low densities, however, this is possible as most known
activity measures report few cat detections (Ibbett 2010; Kennedy et al. 2012). Our study
provides a baseline estimate for the central Kimberley, and an indication of likely densities of
cats elsewhere in northern Australia.
Our modelling of population density hinged on the ability to identify individual cats. While
the vast majority of cat passes were reliably identifiable to an individual (96 %), the
remainder could be assigned only on a subjective assessment of body shape. Such cats were
present in four of the 13 sessions. Whilst this could not be verified, we compared population
estimates of the four sessions affected to estimates from a non-spatial mark-resight model,
and found a strong convergence of estimates. This suggests that errors due to misidentifying
this small portion of cats would not dramatically skew the overall results. While we were
fortunate to study populations in which such a high proportion of cats were identifiable from
photographs, this might not be the case in other populations. In such instances, spatial mark-
resight analysis would be essential (Chandler and Royle 2013).
A useful aspect of the approach in this study was the ability to incorporate the spatial layout
of camera traps into a standardised capture-recapture model. Cats are difficult to attract with
lures when at low densities, and often show strong variations in lure preferences between
areas and times (Edwards et al. 1997; Kilshaw et al. 2014; Short et al. 2003). This method
44
essentially allowed us to place the cameras where the cats would naturally occur along each
of transect, as opposed to drawing the cats towards the cameras with a lure.
Our use of almost-linear transects had both positive and negative effects on analysis.
Deploying cameras for each session was logistically simple, so multiple arrays could be set
with relatively few detectors. Alternatively, a grid pattern would have meant far fewer arrays
could have been operated per year. However, each individual transect had quite large errors,
and 95 % confidence limits were often double or half the mean. These transects would have
had lower errors had we used grids, because for cats detected at the ends of transects there
was high uncertainty in the estimation of location of the home range centre. Nonetheless,
there was strong agreement in densities measured on different transects and in different times.
Therefore, this method appeared robust in its estimation of broad-scale cat densities, but
provided less precise estimates at the transect scale. Future use of this method should adapt a
grid-like form wherever possible.
We did not find any significant spatial or temporal variations in density. However, the large
confidence intervals at each transect would mean only large changes would have been
detected. To assess whether there could have been smaller changes, we compared home range
size in relation to landscape features, because home range size is inversely related to density,
especially in territorial species (Liberg et al. 2000). Home range size was smaller for cats
with greater amounts of riparian vegetation. Home range size in terrestrial mammals is
typically related to resource availability, so riparian areas likely provide a higher
concentration of food (Gittleman 1985). Small mammal abundance is typically higher in such
habitats in the study area (Legge et al. 2011a). However, the effect on home range size was
not large. It is likely that density would also be greater in areas of higher riparian cover, but
the effect size was too small to detect with our camera-trap study.
Contrary to expectations, we did not detect either cat density or home range size to change
with grazing from introduced herbivores, despite substantial variation in small-mammal
abundance between the stocked and destocked zone (Legge et al. 2011a). We suspect that
there was little correlation between grazing regime and cat abundance as small mammals
would be protected from predation by grass cover in ungrazed areas, so cats were less able to
exploit these populations. Whilst fires would have temporality removed such cover, the
45
frequency and extent of such fires was similar between the stocked and destocked zone
(Legge et al. 2011b). Overall, although prey abundance was higher in ungrazed areas, prey
accessibility was not, so perhaps the availability of prey to cats was no higher than in grazed
areas.
Despite their low abundance, cats are contributing to the collapse of small mammal
populations now underway across northern Australia (Fisher et al. 2013; Frank et al. 2014;
Woinarski et al. 2011b). Evidently, even low-density populations of cats can have large
impacts. For example, populations of native Australian rats Rattus villosisimus reintroduced
to Wongalara, in the Northern Territory, were hunted to extinction soon after release by only
one or two individual cats (Frank et al. 2014). Other instances of a seemingly scarce
population of cats causing declines of native animals have been reported (Gibson et al. 1994;
Moseby et al. 2012a; Priddel and Wheeler 2004). Unlike most other threatening species, the
impacts of feral cats need not be driven primarily by their abundance, but by other aspects of
their ecology. It may be in part the ability of cats to selectively hunt in habitats where prey
are vulnerable (Chapter 3), indulge in surplus killing (Peck et al. 2008, Chapter 5), and
specialise on particular prey (Fitzgerald and Turner 2000).
It will be very difficult to accomplish significant reductions of populations of feral cats by
direct control (e.g. hunting), considering the low densities reported here. For direct control in
an open population to be successful, off-take needs to be greater than recruitment (Hone
1999). McCarthy et al. (2013) simulated a population of 200 cats, and found at least 57 %
would need to be removed annually to sustain a 25 % decrease in population size. If we
aimed to reduce population density of cats in the Mornington Wildlife Sanctuary (3200 km2)
by 25 % by removing 57 % annually, we would need to capture approximately 308 of our
estimate of 521 individual cats each year. Considering the capture rate densities reported here
of 1 cat per six hours of spotlighting, we would need to spotlight for almost 1840 hours, or
five hours every night of the year. This does not even consider declining success as density
decreases, learned aversion by cats, and incomplete coverage of the region. While poison
baiting can provide landscape scale reductions of such magnitudes in some circumstances
(Johnston et al. 2011; Moseby et al. 2009), this method is unlikely to be applicable in
northern Australia due to risks to non-target predators such as dingoes and northern quolls
Dasyurus hallucatus.
46
Future improvements in cat control methods could make off-take greater than recruitment,
especially if automated devices could ensure that every cat passively detected could be either
killed or sterilized (Read et al. 2014). Considering the detection rates here of 0.31 over three
nights at home range centre (g0 in Table 1), and that they remain over 0.01 for over a
kilometre from this centre (based on sigma values in Table 1), most cats would be killed by
such a device if left within its home range for around three months. However, such
technology is still not yet available.
Due to the virtual impossibility of landscape scale cat control using existing methods when
densities are low, other methods of reducing their impact on native wildlife will have to be
considered. Maintaining dingo populations may provide top-down control (Kennedy et al.
2012; Moseby et al. 2012b). Cat exclusion could be considered at small scales around critical
habitats, either using fences (Moseby and Read 2006) or guardian dogs (van Bommel and
Johnson 2012). Otherwise, land management practices that reduce the impacts of cats, as
opposed to reducing their densities, should be considered over large scales.
47
References
Balme, G.A., Hunter, L.T.B., and Slotow, R. (2009) Evaluating methods for counting cryptic
carnivores. The Journal of wildlife management 73(3), 433–441.
Barratt, D.G. (1997) Home range size, habitat utilisation and movement patterns of suburban
and farm cats Felis catus. Ecography 20(3), 271–280.
Bengsen, A., Butler, J., and Masters, P. (2012) Estimating and indexing feral cat population
abundances using camera traps. Wildlife Research 38(8), 732–739.
Beyer, H.L. (2012) Geospatial Modelling Environment (Version 0.7.2.0) In
'http://www.spatialecology.com/gme.')
Borchers, D.L., and Efford, M.G. (2008) Spatially explicit maximum likelihood methods for
capture–recapture studies. Biometrics 64(2), 377–385.
Braithwaite, R.W., and Griffiths, A.D. (1994) Demographic variation and range contraction
in the northern quoll, Dasyurus hallucatus (Marsupialia: Dasyuridae). Wildlife Research
21(2), 203–217.
Buckmaster, A.J. (2012) Ecology of the feral cat (Felis catus) in the tall forests of far east
Gippsland. University of Sydney, Sydney
Catling, P.C., Hertog, A., Burt, R.J., Forrester, R.I., and Wombey, J.C. (1999) The short-term
effect of cane toads (Bufo marinus) on native fauna in the Gulf Country of the Northern
Territory. Wildlife Research 26(2), 161–185.
Chandler, R.B., and Royle, J.A. (2013) Spatially explicit models for inference about density
in unmarked or partially marked populations. 7 (2013), no. 2, 936--954. doi:10.1214/12-
AOAS610. http://projecteuclid.org/euclid.aoas/1372338474. The Annals of Applied Statistics
7(2), 936–954.
Christensen, P. (1980) The biology of Bettongia penicillata (Gray, 1837) and Macropus
eugenii (Desmarest 1917) in relation to fire. Forests Department of Western Australia, Perth.
Denny, E.A., and Dickman, C.R. (2010) Review of cat ecology and management strategies in
Australia. Invasive Animals Cooperative Research Centre, Canberra.
Dickman, C.R. (1996) Overview of the impacts of feral cats on Australian native fauna.
University of Sydney, Sydney.
Edwards, G.P., Piddington, K.C., and Paltridge, R.M. (1997) Field evaluation of olfactory
lures for feral cats (Felis catus L.) in Central Australia. Wildlife Research 24, 173–183.
Fancourt, B. (2014) Rapid decline in detections of the Tasmanian bettong (Bettongia
gaimardi) following local incursion of feral cats (Felis catus). Australian Mammalogy 36,
247–253.
48
Fisher, D.O., Johnson, C.N., Lawes, M.J., Fritz, S.A., McCallum, H.I., Blomberg, S.P., Van
Der Wal, J., Abbott, B., Frank, A., Legge, S., Letnic, M., Thomas, C.R., Fisher, A., Gordon,
I.J., and Kutt, A.S. (2013) The current decline of tropical marsupials in Australia: is history
repeating? Global Ecology and Biogeography 23(2), 181–190.
Fitzgerald, B.M., and Turner, D.C. (2000) Hunting behaviour of domestic cats and their
impact on prey populations. In 'The domestic cat: the biology of its behaviour. Vol. 2.' (Eds.
DC Turner and P Bateson) pp. 151–176. (Cambridge University Press: Melbourne, Aus)
Foster, R.J., and Harmsen, B.J. (2012) A critique of density estimation from camera-trap
data. The Journal of Wildlife Management 76(2), 224–236.
Frank, A.S.K., Johnson, C.N., Potts, J., Alaric, F., Lawes, M.J., Woinarski, J.C.Z., Tuft, K.,
Radford, I., Gordon, I.J., Collis, M.-A., and Legge, S. (2014) Experimental evidence that
feral cats cause local extirpation of small mammals in Australia's tropical savanna. Journal of
Applied Ecology 51(6), 1486–1493.
Gibson, D.F., Lundie-Jenkins, G., Langford, D.G., Cole, J.R., Clarke, D.E., and Johnson,
K.A. (1994) Predation by feral cats, Felis catus, on the rufous hare-wallaby, Lagorchestes
hirsutus, in the Tanami Desert. Australian Mammalogy 17, 103–107.
Gittleman, J.L. (1985) Carnivore body size: ecological and taxonomic correlates. Oecologia
67(4), 540–554.
Hone, J. (1999) On rate of increase(r): patterns of variation in Australian mammals and the
implications for wildlife management. Journal of Applied Ecology 36(5), 709–718.
Ibbett, M. (2010) The role of broad-scale, multi-species monitoring for conservation, with
particular reference to small mammals in Kakadu National Park., Charles Darwin University
Darwin
Johnston, M. (2012) Field assessment of the Curiosity® bait for management of feral cats
after fire at Wilsons Promontory National Park: Black Saturday Victoria 2009-Natural values
fire recovery program. Department of Sustainability and Environment, Heidelberg, Victoria,
39.
Johnston, M., Algar, D., O’Donoghue, M., and Morris, J. Field efficacy of the Curiosity feral
cat bait on three Australian islands. In 'Proceedings of the Island Invasives: Eradication and
Management Conference. University of Auckland, New Zealand', 2011,
Jones, E., and Coman, B.J. (1982) Ecology of the feral cat, Felis catus (L.), in south-eastern
Australia III.* Home ranges and population ecology in semi-arid north-west Victoria.
Wildlife Research 9(3), 409–420.
Kennedy, M.S., Phillips, B.L., Legge, S., Murphy, S.A., and Faulkner, R.A. (2012) Do
dingoes suppress the activity of feral cats in northern Australia? Austral Ecology 37(1), 134–
139.
49
Kilshaw, K., Johnson, P.J., Kitchener, A.C., and Macdonald, D.W. (2014) Detecting the
elusive Scottish wildcat Felis silvestris silvestris using camera trapping. Oryx, 1–9.
Lazenby, B.T., and Dickman, C.R. (2013) Patterns of detection and capture are associated
with cohabiting predators and prey. PLos ONE 8(4), e59846.
Legge, S., Kennedy, M.S., Lloyd, R., Murphy, S.A., and Fisher, A. (2011a) Rapid recovery
of mammal fauna in the central Kimberley, northern Australia, following the removal of
introduced herbivores. Austral Ecology 36, 791–799.
Legge, S., Murphy, S., Kingswood, R., Maher, B., and Swan, D. (2011b) EcoFire: restoring
the biodiversity values of the Kimberley region by managing fire. Ecological Management &
Restoration 12(2), 84–92.
Liberg, O., Sandell, M., Pontier, D., and Natoli, E. (2000) Density, spatial organisation and
reproductive tactics in the domestic cat and other felids. In 'The domestic cat: the biology of
its behaviour.' (Eds. DC Turner and P Bateson) pp. 119–147. (Cambridge University Press:
Cambridge)
Mahon, P.S., Bates, P.B., and Dickman, C.R. (1998) Population indices for wild carnivores: a
critical study in sand-dune habitat, south-western Queensland. Wildlife Research 25(2), 217–
217.
McCarthy, R.J., Levine, S.H., and Reed, J.M. (2013) Estimation of effectiveness of three
methods of feral cat population control by use of a simulation model. Journal of the
American Veterinary Medical Association 243(4), 502–511.
Moseby, K.E., Cameron, A., and Crisp, H.A. (2012a) Can predator avoidance training
improve reintroduction outcomes for the greater bilby in arid Australia? Animal Behaviour
83(4), 1011–1021.
Moseby, K.E., Neilly, H., Read, J.L., and Crisp, H.A. (2012b) Interactions between a top
order predator and exotic mesopredators in the Australian rangelands. International Journal
of Ecology 2012(2012), 1–15.
Moseby, K.E., and Read, J.L. (2006) The efficacy of feral cat, fox and rabbit exclusion fence
designs for threatened species protection. Biological Conservation 127, 429–437.
Moseby, K.E., Stott, J., and Crisp, H. (2009) Movement patterns of feral predators in an arid
environment – implications for control through poison baiting. Wildlife Research 36, 422–
435.
Peck, D.R., Faulquier, L., Pinet, P., Jaquemet, S., and Le Corre, M. (2008) Feral cat diet and
impact on sooty terns at Juan de Nova Island, Mozambique Channel. Animal Conservation
11(1), 65–74.
Priddel, D., and Wheeler, R. (2004) An experimental translocation of brush-tailed bettongs
(Bettongia penicillata) to western New South Wales. Wildlife Research 31(4), 421–432.
50
R Development Core Team (2008) R: a language and environment for statistical computing.
In '.' (R Foundation for Statistical Computing: Vienna)
Read, J., and Bowen, Z. (2001) Population dynamics, diet and aspects of the biology of feral
cats and foxes in arid South Australia. Wildlife Research 28(2), 195–203.
Read, J.L., and Eldridge, S. (2010) An optimised rapid detection technique for
simultaneously monitoring activity of rabbits, cats, foxes and dingoes in the rangelands. The
Rangeland Journal 32(4), 389–394.
Read, J.L., Gigliotti, F., Darby, S., and Lapidged, S. (2014) Dying to be clean: pen trials of
novel cat and fox control devices. International Journal of Pest Management 60(3), 166–172.
Risbey, D.A., Calver, M.C., and Short, J. (1999) The impact of cats and foxes on the small
vertebrate fauna of Heirisson Prong, Western Australia. I. Exploring potential impacts using
diet analysis. Wildlife Research 26, 621–630.
Short, J., and Turner, B. (2005) Control of feral cats for nature conservation. IV. Population
dynamics and morphological attributes of feral cats at Shark Bay, Western Australia. Wildlife
Research 32(6), 489–501.
Short, J., Turner, B., and Risbey, D.A. (2003) Control of feral cats for nature conservation.
III. Trapping. Wildlife Research 29(5), 475–487.
van Bommel, L., and Johnson, C.N. (2012) Good dog! Using livestock guardian dogs to
protect livestock from predators in Australia's extensive grazing systems. Wildlife Research
39(3), 220–229.
White, G.C., and Burnham, K.P. (1999) Program MARK: survival estimation from
populations of marked animals. Bird Study 46(S1), S120–S139.
Woinarski, J.C.Z., Burbidge, A.A., and Harrison, P. (2014) 'Action plan for Australian
mammals 2012.' (CSIRO: Melbourne)
Woinarski, J.C.Z., Legge, S., Fitzsimons, J.A., Traill, B.J., Burbidge, A.A., Fisher, A., Firth,
R.S.C., Gordon, I.J., Griffiths, A.D., Johnson, C.N., McKenzie, N.L., Palmer, C., Radford, I.,
Rankmore, B., Ritchie, E.G., Ward, S., and Ziembicki, M. (2011a) The disappearing mammal
fauna of northern Australia: context, cause, and response. Conservation Letters 4(3), 1–10.
Woinarski, J.C.Z., Ward, S., Mahney, T., Bradley, J., Brennan, K., Ziembicki, M., and Fisher,
A. (2011b) The mammal fauna of the Sir Edward Pellew island group, Northern Territory,
Australia: refuge and death-trap. Wildlife Research 38, 307–322.
Wolff, J.O. (1985) The effects of density, food, and interspecific interference on home range
size in Peromyscus leucopus and Peromyscus maniculatus. Canadian Journal of Zoology
63(11), 2657–2662.
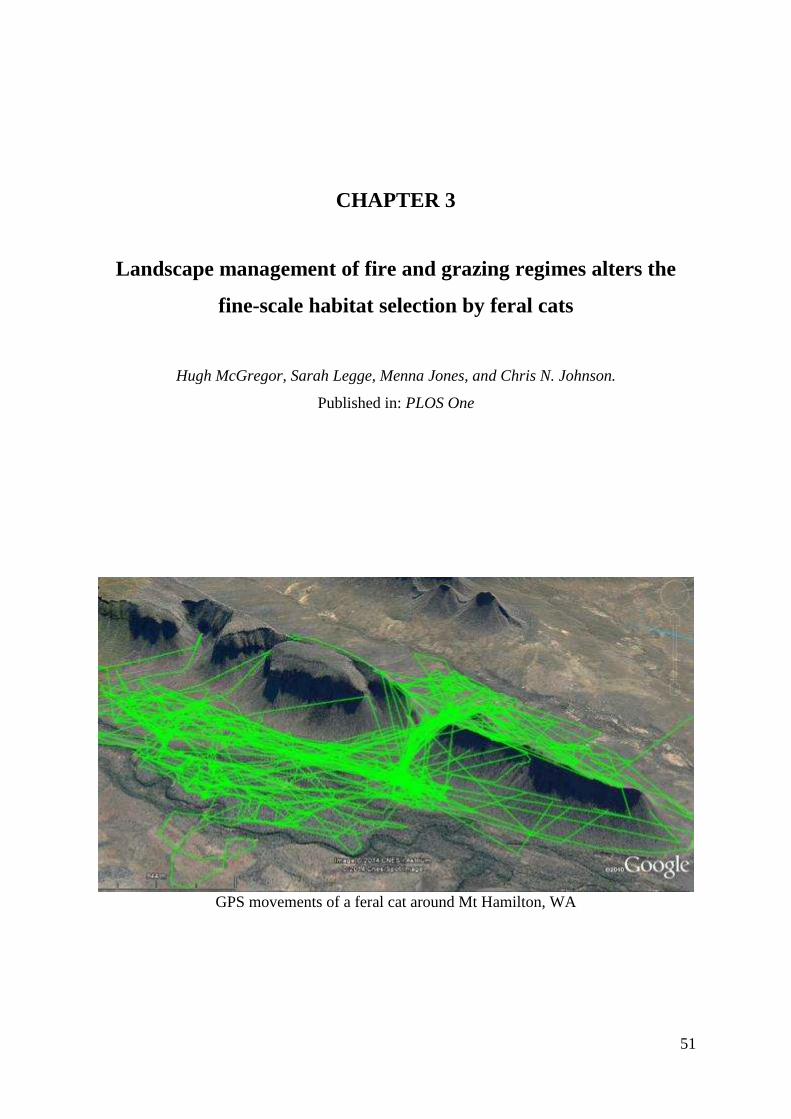
51
CHAPTER 3
Landscape management of fire and grazing regimes alters the
fine-scale habitat selection by feral cats
Hugh McGregor, Sarah Legge, Menna Jones, and Chris N. Johnson.
Published in: PLOS One
GPS movements of a feral cat around Mt Hamilton, WA
52
Abstract
Intensification of fires and grazing by large herbivores has caused population declines in
small vertebrates in many ecosystems worldwide. Impacts are rarely direct, and usually
appear driven via indirect pathways, such as changes to predator-prey dynamics. Fire events
and grazing may improve habitat and/or hunting success for the predators of small mammals,
however, such impacts have not been documented.
To test for such an interaction, we investigated fine-scale habitat selection by feral cats in
relation to fire, grazing and small-mammal abundance. Our study was conducted in north-
western Australia, where small mammal populations are sensitive to changes in fire and
grazing management.
We deployed GPS collars on 32 cats in landscapes with contrasting fire and grazing
treatments. Fine-scale habitat selection was determined using discrete choice modelling of cat
movements.
We found that cats selected areas with open grass cover, including heavily grazed areas. They
strongly selected for areas recently burnt by intense fires, but only in habitats that typically
support high abundance of small mammals.
Intense fires and grazing by introduced herbivores created conditions that are favoured by
cats, probably because their hunting success is improved. This mechanism could explain why
impacts of feral cats on small mammals in northern Australia might have increased. Our
results suggest how the impact of feral cats could be reduced in most ecosystems by
maximising grass cover, minimising the incidence of intense fires, and reducing grazing by
large herbivores.
53
Introduction
Predator-prey relationships are strongly influenced by the structure and quality of habitat,
principally its vegetation (Didham et al. 2007; Griffiths 1975; Lima and Dill 1990).
Variability in vegetation structure may be used by predators to increase hunting success. For
example, lions use dense vegetation to hide their approach from prey (Hopcraft et al. 2005).
Also, it may be used by prey to help them evade predators, such as elk using woodlands as a
refuge from wolves (Hebblewhite et al. 2005). Changes in habitat structure may therefore
shift the relationships between predators and prey (Dickson and Beier 2002; Koenen et al.
1996). Such changes can determine the extent to which some prey are threatened with
extinction by heavy predation (Didham et al. 2007; Gilliam and Fraser 1987).
One of most pervasive impacts on vegetation structure arises from changes to fire and grazing
regimes. While drivers of such changes vary immensely, the impacts on fauna communities
display some general trends. For example, small mammal populations are especially
sensitive, with the vast majority of studies detecting declines in populations in response to
either intense fire events or intense grazing (Banks et al. 2011; Horn et al. 2012; Jones 2000;
Tabeni and Ojeda 2003; Yarnell et al. 2007), unless they occur in ecosystems with few
predators (Conner et al. 2011; Southgate et al. 1996). The underlying mechanisms of these
declines remain elusive, but are likely to be indirect, rather than through direct effects such as
being burnt by the fires or trampled by cattle (Driscoll et al. 2010). Instead, such disturbances
may improve habitat for predators in ways that increases their impacts on prey (Fisher et al.
2013; Sutherland and Dickman 1999; Yarnell et al. 2007), although no field data are
available to confirm this.
Many small mammal species are declining in the savannas of northern Australia, and several
may soon be threatened with extinction (Fisher et al. 2013; Woinarski et al. 2011a). Declines
have been greatest in areas subject to intense fires (Firth et al. 2010; Pardon et al. 2003) and
recent experimental evidence also supports an association of grazing by introduced
herbivores (cattle, horses, donkeys, buffalo) with the magnitude of small-mammal decline
(Legge et al. 2011). Both fire and grazing regimes in northern Australia have intensified
substantially over recent decades in ways that could contribute to the contemporary native
54
mammal decline. These changes to fire and grazing have generally made grass communities
less complex and more open (Liedloff et al. 2001).
Predation by feral cats Felis catus may also be contributing to the declines. This is suggested
by three lines of evidence. First, the declining species fall within the preferred prey-size range
of cats (Dickman 1996; Fisher et al. 2013). Second, mammal populations in complex rocky
habitats have been less affected than those in more productive woodlands and savanna,
suggesting a predation effect (Oakwood 2000; Radford et al. 2014). Finally, populations of
declining mammal species are more stable in the absence of cats, on island or in large
enclosures (Frank et al. 2014; Woinarski et al. 2011b). However, there is a temporal
mismatch between the arrival of cats in northern Australia (up to 170 ya in some places;
Abbott 2002) and mammal declines observed in the last 20 years (Woinarski et al. 2011a).
The apparent mismatch in timing of the early arrival of cats and recent mammal declines
could be explained by the hypothesis that cat predation has its largest impact when it interacts
with fire and grazing regimes established in the more recent past. Reduction of structural
complexity of vegetation and increased openness due to fire and grazing might increase the
exposure of small mammals to predators, making prey easier to detect and capture (Conner et
al. 2011). Small mammals are cats’ preferred prey (Dickman 1996; Kutt 2012). If cats
preferentially use the open and relatively simple habitats created by fire and grazing, the
result could be a higher predation impacts on small mammals. This has been suggested as a
possible mechanism for these declines (Woinarski et al. 2011a; Ziembicki et al. 2013),
however, until now there has been no evidence.
If cats do favour the conditions created by fire and grazing, this should be revealed by the
patterns of movement of individual cats in heterogeneous landscapes with variable effects of
fire and grazing. We tested this hypothesis using intensive GPS tracking of a large sample of
individual cats; both within and outside of a large 40 300 hectare area that has been destocked
of all introduced herbivores (cattle, horses, donkeys) (Legge et al. 2011), and spanning
contrasting fire patterns (mild control fires or intensive wildfires). A dynamic habitat map
was created, so that fire and vegetation attributes at any location or point in time could be
determined. This was used to generate a parsimonious model of fine-scale habitat selection
by cats. We predicted that feral cats would select for open grass cover to improve hunting

55
success. If so, we hypothesise that cats would increase their use of habitats that have been
recently burnt or intensely grazed, and that this relationship would be stronger in areas of
high small-mammal abundance.
56
Materials and methods
Study area
Our study area encompassed three large properties in the central Kimberley of north-western
Australia (17°01’S, 126°01’E, see Figure 1). One property is managed for commercial cattle
production (Glenroy, 1455 km2) and two are ex-pastoral leases managed for conservation by
the Australian Wildlife Conservatory (Mornington and Marion Downs Sanctuaries, 3225 km2
and 2676 km2 respectively). Habitats are mostly savanna woodlands with a perennial grass
layer, dissected by riparian vegetation along the edges of creeks. The region has a tropical
monsoon climate with three broad seasons: the wet (December – March), early dry (April –
July) and late dry (August – November). Fire is managed on all three properties to promote
biodiversity values. This fire management aims to reduce the incidence of extensive, high
intensity uncontrolled fires in the late dry season using strategic prescribed burning in the
early dry season, when fires tend to be small and of low intensity because of weather and
condition of the grass layer. In addition, when uncontrolled late dry season fires occur, they
are suppressed where possible. All large introduced herbivores (cattle, horses, donkeys) have
been removed from a 40,300 ha fenced section of Mornington since 2005 (Legge et al. 2011),
hereafter referred to as the ‘destocked’ zone. Dingos are not persecuted in the study area, and
occurred at a density of ~0.2 individuals per km2 (Legge et al. 2014).
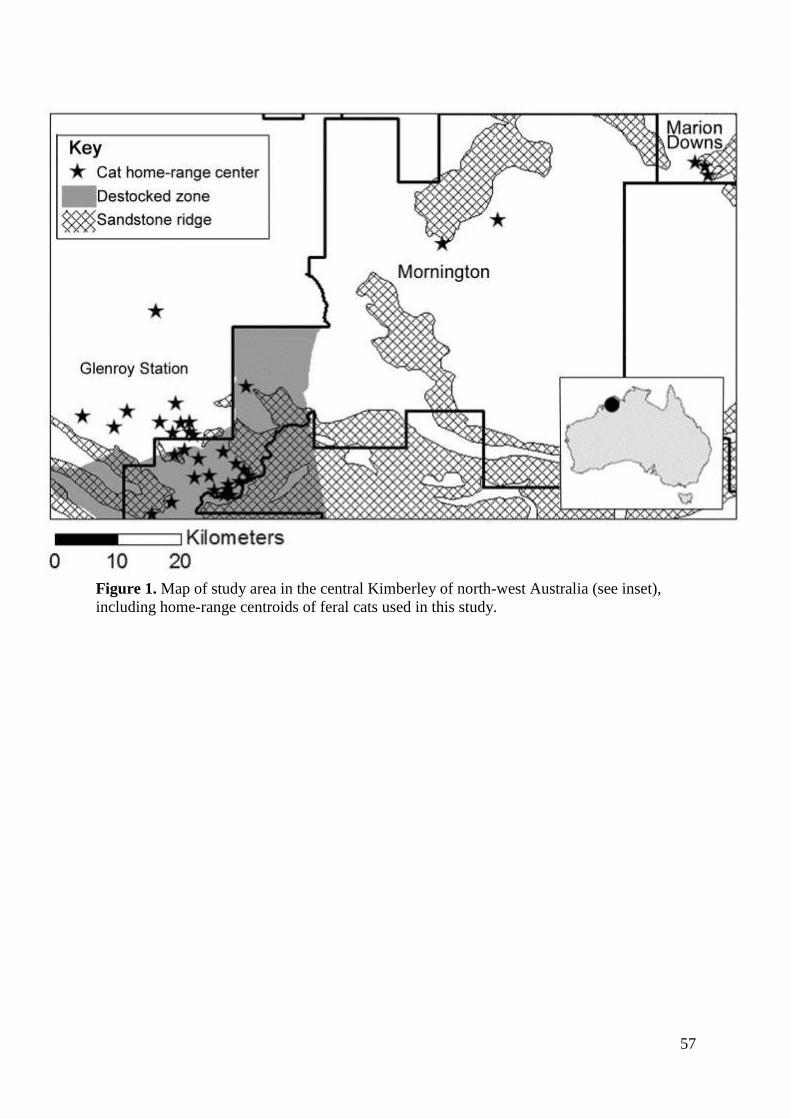
57
Figure 1. Map of study area in the central Kimberley of north-west Australia (see inset),
including home-range centroids of feral cats used in this study.
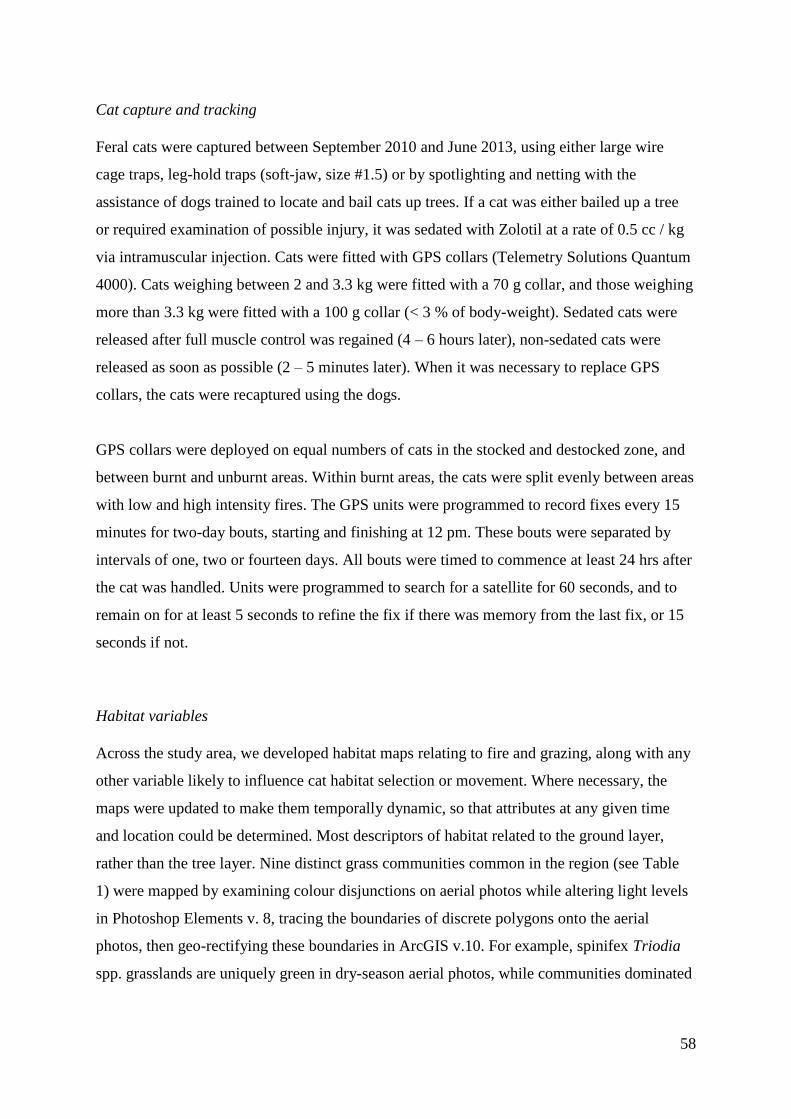
58
Cat capture and tracking
Feral cats were captured between September 2010 and June 2013, using either large wire
cage traps, leg-hold traps (soft-jaw, size #1.5) or by spotlighting and netting with the
assistance of dogs trained to locate and bail cats up trees. If a cat was either bailed up a tree
or required examination of possible injury, it was sedated with Zolotil at a rate of 0.5 cc / kg
via intramuscular injection. Cats were fitted with GPS collars (Telemetry Solutions Quantum
4000). Cats weighing between 2 and 3.3 kg were fitted with a 70 g collar, and those weighing
more than 3.3 kg were fitted with a 100 g collar (< 3 % of body-weight). Sedated cats were
released after full muscle control was regained (4 – 6 hours later), non-sedated cats were
released as soon as possible (2 – 5 minutes later). When it was necessary to replace GPS
collars, the cats were recaptured using the dogs.
GPS collars were deployed on equal numbers of cats in the stocked and destocked zone, and
between burnt and unburnt areas. Within burnt areas, the cats were split evenly between areas
with low and high intensity fires. The GPS units were programmed to record fixes every 15
minutes for two-day bouts, starting and finishing at 12 pm. These bouts were separated by
intervals of one, two or fourteen days. All bouts were timed to commence at least 24 hrs after
the cat was handled. Units were programmed to search for a satellite for 60 seconds, and to
remain on for at least 5 seconds to refine the fix if there was memory from the last fix, or 15
seconds if not.
Habitat variables
Across the study area, we developed habitat maps relating to fire and grazing, along with any
other variable likely to influence cat habitat selection or movement. Where necessary, the
maps were updated to make them temporally dynamic, so that attributes at any given time
and location could be determined. Most descriptors of habitat related to the ground layer,
rather than the tree layer. Nine distinct grass communities common in the region (see Table
1) were mapped by examining colour disjunctions on aerial photos while altering light levels
in Photoshop Elements v. 8, tracing the boundaries of discrete polygons onto the aerial
photos, then geo-rectifying these boundaries in ArcGIS v.10. For example, spinifex Triodia
spp. grasslands are uniquely green in dry-season aerial photos, while communities dominated
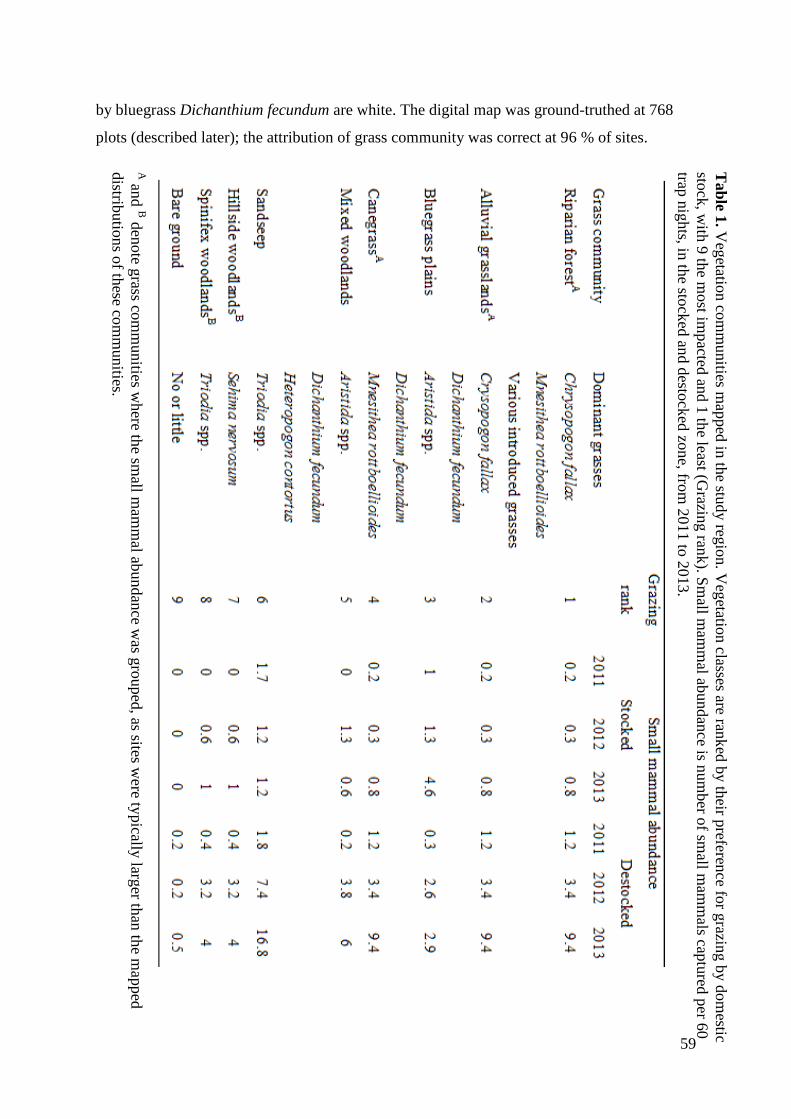
59
by bluegrass Dichanthium fecundum are white. The digital map was ground-truthed at 768
plots (described later); the attribution of grass community was correct at 96 % of sites.
Tab
le 1. V
egetatio
n co
mm
unities m
apped
in th
e study
regio
n. V
egetatio
n classes are ran
ked
by th
eir preferen
ce for g
razing b
y d
om
estic
stock
, with
9 th
e most im
pacted
and 1
the least (G
razing ran
k). S
mall m
amm
al abundan
ce is nu
mber o
f small m
amm
als captu
red p
er 6
0
trap n
ights, in
the sto
cked
and d
estock
ed zo
ne, fro
m 2
011 to
2013.
A an
d B d
enote g
rass com
munities w
here th
e small m
amm
al abundan
ce was g
rouped
, as sites were ty
pically
larger th
an th
e map
ped
distrib
utio
ns o
f these co
mm
unities.
60
Fire extents were initially mapped using monthly Landsat 7 remote-sensing imagery available
from the US Geological Survey (2011–2013), and fire boundaries were then refined using
aerial photography taken from a helicopter flying approximately 300 m above ground. For
each burnt area, we assigned the date of burn and intensity (intense = 100 % tree scorch and
no ground cover remaining unburnt, or mild = all other fires). Relative to the date of each
GPS fix, fire was considered in multiple binary variables at 30, 60, 90, 180, 360 or 600 days
since fire. The Australian Wildlife Conservancy’s stock-proof fence (Legge et al. 2011)
separated the stocked and destocked areas.
A dynamic map was created that estimated grass cover at any given location and time since
fire, based on a series of models of response of the grass layer to fire (given grass
community, stocking status) created from field data. Vegetation attributes were measured at
768 plots (each 10 m2) across the study area and duration, spread equally across grass
communities (see Table 1) and combinations of mild / intense fire, time since fire, and grazed
and destocked areas (total of 96 plots per community). At each plot, we estimated the extent
of grass cover at different heights by adapting a line-intercept method. We inserted a 100 cm
pole (diameter of 1.5 cm) vertically through the grass to the ground at 50 points in a
systematic grid over the plot. The number of grass intercepts was recorded in height intervals
of 0 – 10 cm, 11 – 30 cm, and 31 – 100 cm. This was used to derive grass cover, cover of
dense tussocks, and relative biomass at each plot (see Appendix 1 in supplementary material
for more detail on methods). These variables were modelled against grass community, time
since last fire, intensity of fire, and stocking status. Models were then used to derive values
for all GPS fixes and random points used in discrete choice models (see Appendix 1).
The influence of grazing on grass biomass was measured as the difference in the average total
number of grass intercepts per plot between grass communities in the stocked and destocked
sites. We used only unburnt sites for this comparison. These averages were converted into a
grazing impact rank. However, these variables would be confounded by correlation as the
habitats favourable to cattle would also be favoured by feral cats (e.g. riparian areas),
irrespective of impacts of cattle. Therefore, this score or rank was applied to all fixes, grazed
or not, and the actual impacts of cattle grazing considered as the difference in this variable’s
strength between the destocked zone and outside.
61
Relative small-mammal abundances in different habitats were estimated from the Australian
Wildlife Conservancy’s annual fauna monitoring data, which is carried out across all three
properties (Legge et al. 2014). The sample at each site is based on 20 small mammal box
traps (Elliott traps) set for three nights (60 trap nights), spread over 1 ha. There were 55 to 64
sites sampled each year totalling 176 site-years between 2011 –13. Small mammals were
defined as those weighing between 30 g and 2000 g (based on Dickman 1996; Fisher et al.
2013), and were predominantly Rattus tunneyi and Pseudomys nanus (these species
comprised 87 % of captures). For each year, average rates of capture of individual small
mammals were calculated for each grass community in the grazed and destocked areas (see
Table 1). However, as sites were typically larger than the mapped patterns of these grass
communities, results from some communities were combined (see Table 1). In case cats
altered their response to a threshold of small mammal abundance, we also included three
binary variables of abundance (whether there was more than 1, 2 or 5 small mammal captures
per plot) for each habitat.
We measured other spatial and temporal features likely to be important to cats to provide
context for their movements. As cats may prefer hunting on edges between open and dense
vegetation, we delineated a 25 m buffer either side of any linear boundary where grass cover
was < 25 % on one side and > 50 % on the other (these were most often fire edges). Water
features were mapped in the field, and each assigned a descriptor for the seasons that they
contained water (wet season only, wet and early dry, or year-round). This was used to derive
distance to known standing water at any given time throughout the study. Elevation and slope
were derived from a digital elevation model of 15 m resolution. We created a variable
representing the spatial home-range context for each cat, by making a kernel density estimate
(smooth cross-validation) for all moving fixes of each cat, and delineating kernel isopleths at
50 %, 90 %, 95 % and 99 % contours. Temporal variables included time of day (sun time;
Torre et al. 2007), season (wet, early dry or late dry), number of months since the end of the
wet season, and minimum nightly temperature (HOBO temperature data logger, MicroDAQ).
Finally, a cat’s choice of which habitat to select in successive GPS fixes may be dependent
on the type of habitat it was last in. This spatial correlation might arise when an animal
selects for certain landscape features and tends to remain within them for some time, rather
than making a de novo selection at every 15 min interval of their walk. Therefore, we fitted a
62
binary ‘carry-over’ variable, which described whether the vegetation, grazing and fire values
were equal to the previous fix.
Data analysis
All GPS fixes that were likely to be erroneous, biased or to represent a stationary cat were
removed from the analysis. Erroneous fixes were those representing implausible ‘spikes’ in
movement, presumably caused by GPS error (Bjørneraas et al. 2010). We deemed it unlikely
that a cat would suddenly change course and speed, then return to the same area it was in 15
minutes ago, so spikes were defined where fixes met all the following criteria: distances from
the last fix were > 50 m, difference in distance from the preceding and succeeding fix was <
10 %, and turning angle > 170° (based on Bjørneraas et al. 2010; Recio et al. 2014). The
HDOP values were not used to filter fixes, as a test of six GPS collars found no relationship
between HDOP and distance from the GPS fix to the known location. Fixes that were
potentially biased by human disruption of the behaviour of the cat were removed, being those
within three hours of field VHF tracking (this was occasionally carried out in order to
download data remotely from the cat GPS collar). Fast-moving fixes were also removed, as it
was likely cats were moving away from something, rather than choosing habitat. For this
purpose a filtering speed of greater than 2 km/hr was used, as this was where the histogram of
speeds between fixes reached an asymptote (Recio et al. 2014), representing a shift in
behaviour mode. A test of GPS error within the open savanna found that 95 % of fixes had <
5 m error (from 634 fixes on six different collars), so fixes less than 10 m from the preceding
fix were classed as stationary. We considered only moving fixes, as cats may have different
habitat requirements for resting versus hunting.
Habitat selection by cats was analysed using discrete choice modelling (Cooper and
Millspaugh 1999). The range of ‘available’ habitats was calculated for each fix, and then we
compared the option selected by the cat to the available habitats. To find the available
habitats, we first constructed probability distributions of a cat’s step-length and turn angle
over 15-minute intervals, then used these probability distributions to select five random
points to sample the cat’s options (Cooper and Millspaugh 1999). Each GPS fix and
associated random points were attributed with the habitat variables of interest using the
dynamic vegetation map.

63
We determined resource selection by cats by creating models with all combinations of
variables, including different biologically relevant interaction terms, and comparing them
within an information theory framework (Burnham and Anderson 1998). This produced a
total of 916 models. For each interaction term a model was included with all combinations, or
with only significant combination terms retained. No pairs of variables with Pearson’s
correlation greater than 0.5 were included in the same model. Models for habitat selection
were created using standard case-control logistic regression models, implemented in R (R
Development Core Team 2008), using the ‘clogit’ command from the ‘survival’ library. Each
individual cat was considered as a random effect in the models, using Gaussian frailty
(Therneau et al. 2003). The most parsimonious models of cat habitat selection were chosen as
those with an AIC score within two points of the highest-ranked model (Burnham and
Anderson 1998), and only these are presented in the results. The cat’s selection is measured
as an odds ratio, representing the magnitude of change in the odds of selection for each unit
of the predictor variable. Differences in the odds ratio are relative only to the other habitat
choices immediately available to a cat.
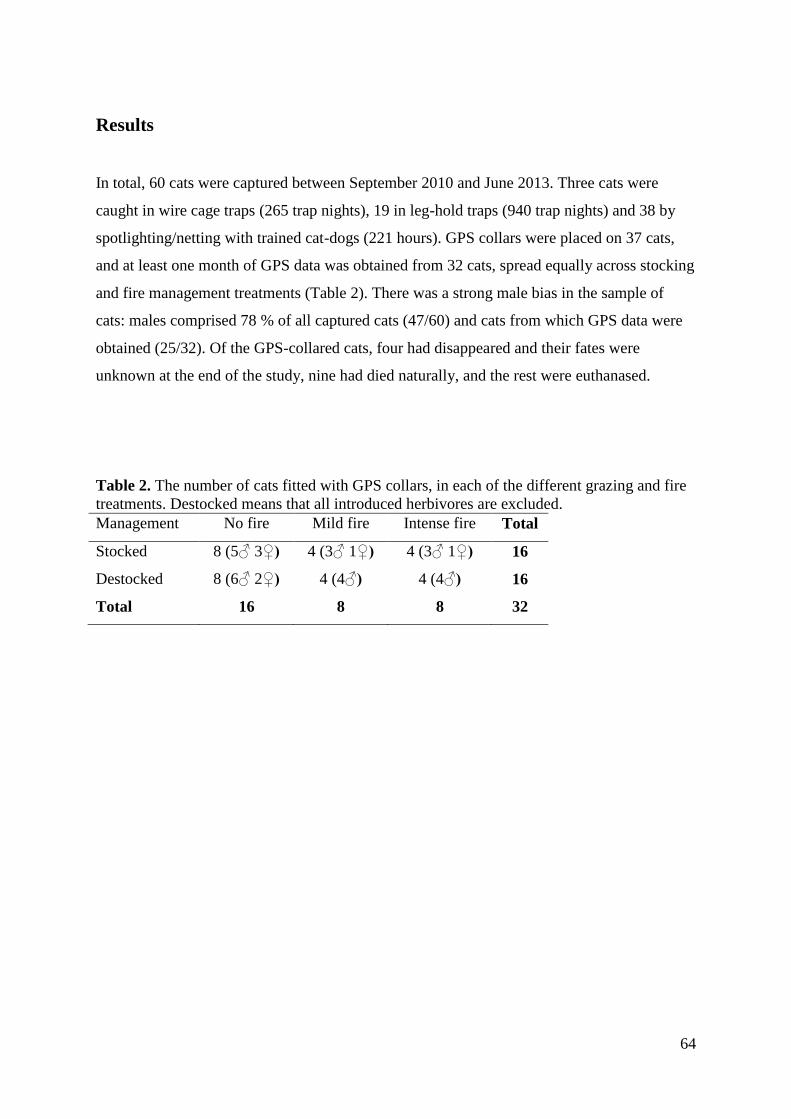
64
Results
In total, 60 cats were captured between September 2010 and June 2013. Three cats were
caught in wire cage traps (265 trap nights), 19 in leg-hold traps (940 trap nights) and 38 by
spotlighting/netting with trained cat-dogs (221 hours). GPS collars were placed on 37 cats,
and at least one month of GPS data was obtained from 32 cats, spread equally across stocking
and fire management treatments (Table 2). There was a strong male bias in the sample of
cats: males comprised 78 % of all captured cats (47/60) and cats from which GPS data were
obtained (25/32). Of the GPS-collared cats, four had disappeared and their fates were
unknown at the end of the study, nine had died naturally, and the rest were euthanased.
Table 2. The number of cats fitted with GPS collars, in each of the different grazing and fire
treatments. Destocked means that all introduced herbivores are excluded.
Management No fire Mild fire Intense fire Total
Stocked 8 (5♂ 3♀) 4 (3♂ 1♀) 4 (3♂ 1♀) 16
Destocked 8 (6♂ 2♀) 4 (4♂) 4 (4♂) 16
Total 16 8 8 32
65
From the 32 cats that provided useable GPS data, we obtained a total of 133 047 GPS fixes.
Cats were moving 56 % of time. Of these moving fixes, 62 % were at night (between sunset
and sunrise). Removal of erroneous or biased fixes and those representing high-speed
movement left 38 472 choices for habitat between successive 15-minute moving fixes.
From the 916 models generated to describe habitat selection by cats, three were ranked within
the candidate model set (the model with the lowest AIC score and two other models within
two AIC scores of the top model). The top model carried 41 % of the weight, compared to 24
% and 20 % for the second and third ranked models. Of these, the second and third ranked
models were almost identical to the top model, but contained interaction terms that did not
decrease the models AIC value. As these terms did not improve the maximum likelihood for
these models, only the top model was considered further (Table 3).
The top model included negative selection for grass cover (equivalently, positive selection for
open areas) and positive selection for edges (see Table 3). Both variables had a significant
interaction with small-mammal density in a binary format (> 2 captures per 100 trap nights),
showing that cats selected particularly strongly for open areas in habitats with higher density
of small mammals.
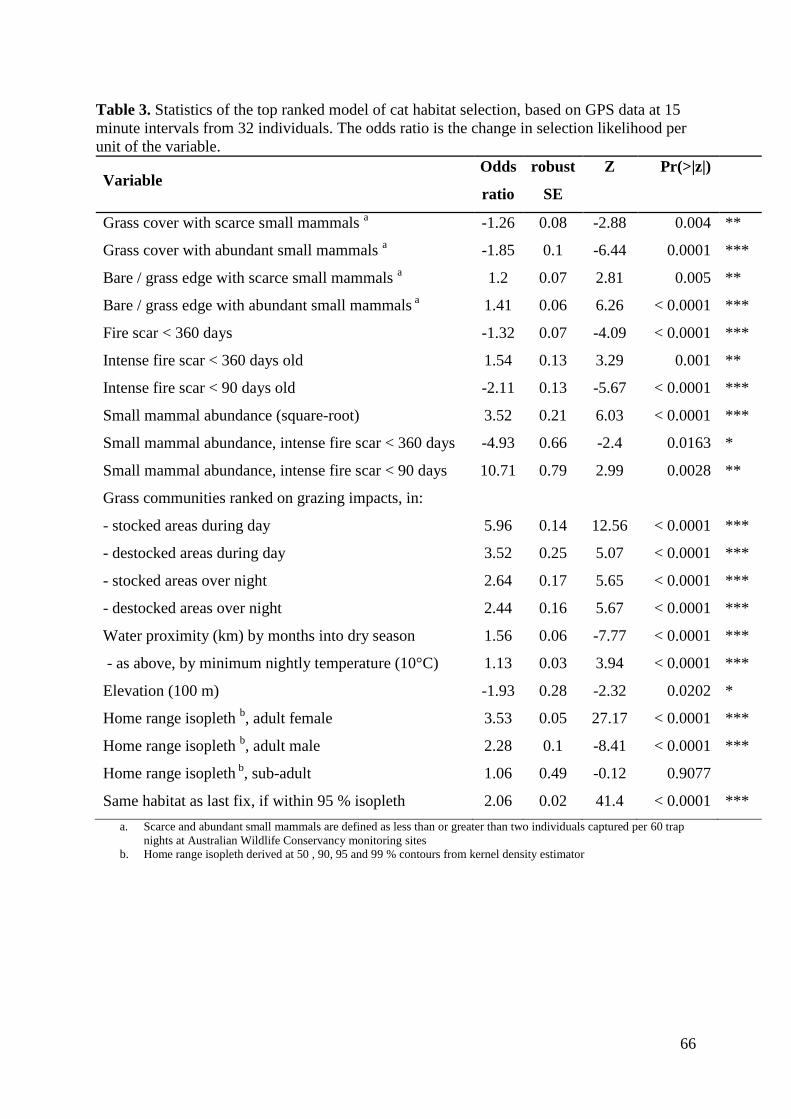
66
Table 3. Statistics of the top ranked model of cat habitat selection, based on GPS data at 15
minute intervals from 32 individuals. The odds ratio is the change in selection likelihood per
unit of the variable.
Variable Odds
ratio
robust
SE
Z Pr(>|z|)
Grass cover with scarce small mammals a
-1.26 0.08 -2.88 0.004 **
Grass cover with abundant small mammals a
-1.85 0.1 -6.44 0.0001 ***
Bare / grass edge with scarce small mammals a
1.2 0.07 2.81 0.005 **
Bare / grass edge with abundant small mammals a
1.41 0.06 6.26 < 0.0001 ***
Fire scar < 360 days -1.32 0.07 -4.09 < 0.0001 ***
Intense fire scar < 360 days old 1.54 0.13 3.29 0.001 **
Intense fire scar < 90 days old -2.11 0.13 -5.67 < 0.0001 ***
Small mammal abundance (square-root) 3.52 0.21 6.03 < 0.0001 ***
Small mammal abundance, intense fire scar < 360 days -4.93 0.66 -2.4 0.0163 *
Small mammal abundance, intense fire scar < 90 days 10.71 0.79 2.99 0.0028 **
Grass communities ranked on grazing impacts, in:
- stocked areas during day 5.96 0.14 12.56 < 0.0001 ***
- destocked areas during day 3.52 0.25 5.07 < 0.0001 ***
- stocked areas over night 2.64 0.17 5.65 < 0.0001 ***
- destocked areas over night 2.44 0.16 5.67 < 0.0001 ***
Water proximity (km) by months into dry season 1.56 0.06 -7.77 < 0.0001 ***
- as above, by minimum nightly temperature (10°C) 1.13 0.03 3.94 < 0.0001 ***
Elevation (100 m) -1.93 0.28 -2.32 0.0202 *
Home range isopleth b, adult female 3.53 0.05 27.17 < 0.0001 ***
Home range isopleth b, adult male 2.28 0.1 -8.41 < 0.0001 ***
Home range isopleth b
, sub-adult 1.06 0.49 -0.12 0.9077
Same habitat as last fix, if within 95 % isopleth 2.06 0.02 41.4 < 0.0001 ***
a. Scarce and abundant small mammals are defined as less than or greater than two individuals captured per 60 trap
nights at Australian Wildlife Conservancy monitoring sites
b. Home range isopleth derived at 50 , 90, 95 and 99 % contours from kernel density estimator
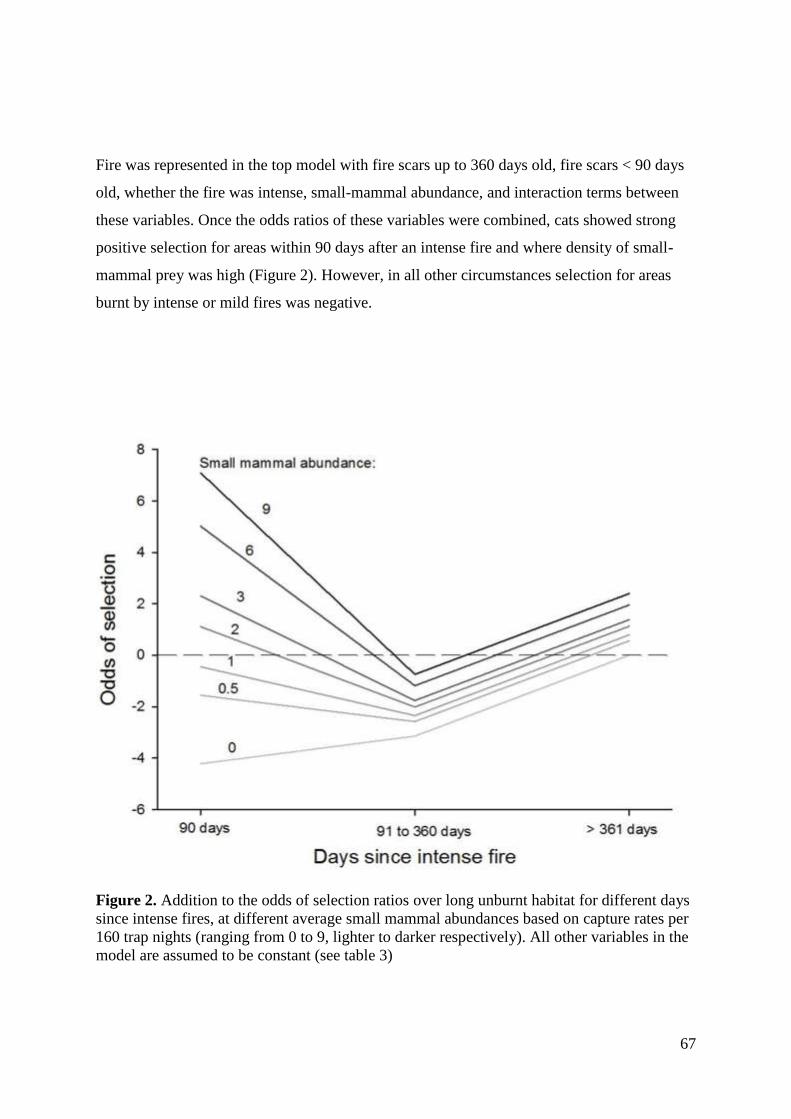
67
Fire was represented in the top model with fire scars up to 360 days old, fire scars < 90 days
old, whether the fire was intense, small-mammal abundance, and interaction terms between
these variables. Once the odds ratios of these variables were combined, cats showed strong
positive selection for areas within 90 days after an intense fire and where density of small-
mammal prey was high (Figure 2). However, in all other circumstances selection for areas
burnt by intense or mild fires was negative.
Figure 2. Addition to the odds of selection ratios over long unburnt habitat for different days
since intense fires, at different average small mammal abundances based on capture rates per
160 trap nights (ranging from 0 to 9, lighter to darker respectively). All other variables in the
model are assumed to be constant (see table 3)
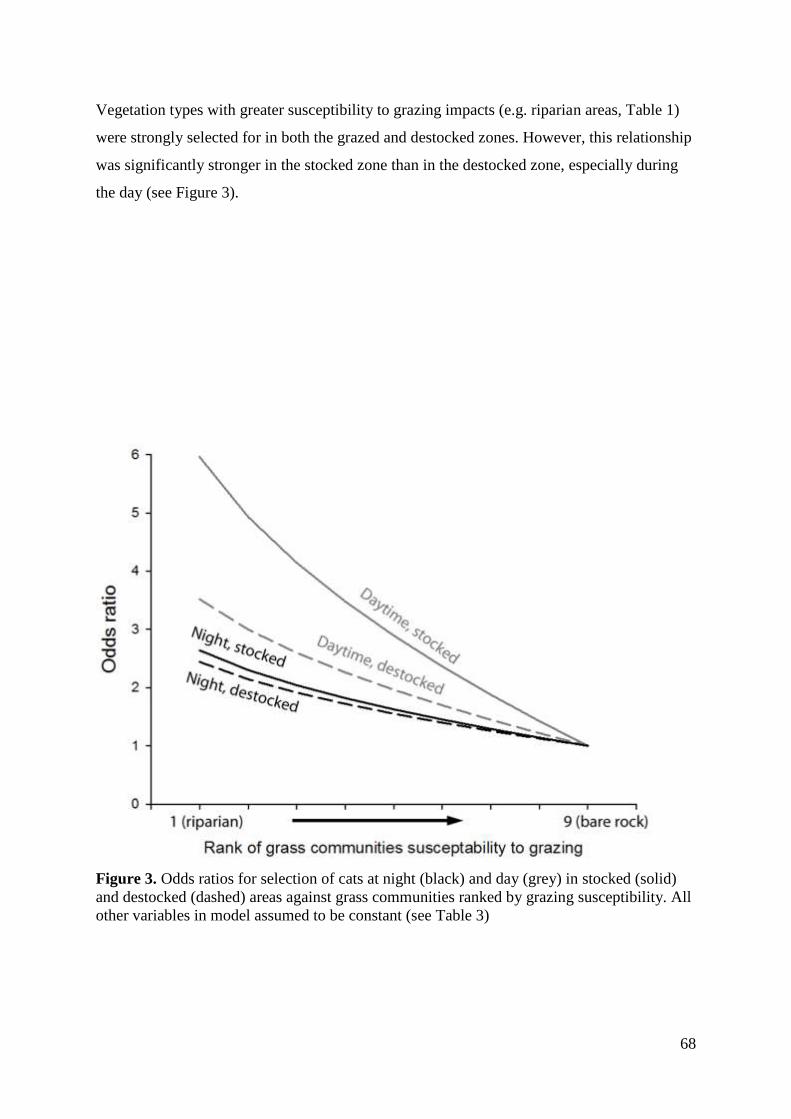
68
Vegetation types with greater susceptibility to grazing impacts (e.g. riparian areas, Table 1)
were strongly selected for in both the grazed and destocked zones. However, this relationship
was significantly stronger in the stocked zone than in the destocked zone, especially during
the day (see Figure 3).
Figure 3. Odds ratios for selection of cats at night (black) and day (grey) in stocked (solid)
and destocked (dashed) areas against grass communities ranked by grazing susceptibility. All
other variables in model assumed to be constant (see Table 3)
69
Several other variables influenced selection by cats. Cats chose to move towards water. The
odds ratio of moving towards water became progressively stronger throughout the dry season
(by 0.56 every month into the dry season) and on days with higher minimum temperature (by
0.13 for each 10° C increase). Cats selected against changes in elevation, with odds declining
by 0.93 every 100 m. Cats tended to move into higher-use areas within their home range
(determined by kernel density estimates), with an interaction with age and sex. Adult females
demonstrated the strongest fidelity to home-range isopleths, while for sub-adults of either sex
this was not significant (P = 0.9). Cats were twice as likely to select for the same habitats as
the previous fix (P < 0.001), assuming the fix was inside a cats’ home range (95 % isopleth).
70
Discussion
Our study provides a detailed analysis of the preferences that underlie movement decisions
by feral cats in a tropical savanna environment in northern Australia. We show that
modifications of habitat produced by grazing and by certain types of fire have strong effects
on cat movement behaviour, with the general result that fire and grazing can create habitat
conditions which are strongly favoured by cats. When faced with choices about where to
move, cats consistently selected sites with a more open grass layer, which had recently been
subject to intense fires, and which were heavily grazed. Further, cats’ habitat selection in
relation to fire was strongly affected by whether the habitats in question supported high
densities of small mammals: sites in mammal-rich habitats that had recently been burnt at
high intensity were especially strongly favoured.
This interaction between cat movements, fire and grazing regimes may help explain the
recent declines in small mammals in northern Australia. The idea that predation by cats might
be driving these declines has been doubted because of the mismatch in timing of the
introduction of cats and small mammal declines, together with the fact that we have no
evidence that small-mammal declines have coincided with increased populations of cats
(Woinarski et al. 2011a). As our results demonstrate, impacts of cats could have become
more severe with the changes in fire and grazing regimes that began around the 1960s, even
if cat density remained constant.
Selection by cats for areas with an open grass layer is a consistent finding from other studies
on habitat selection by small felids (Moseby et al. 2009; Rajaratnam et al. 2007), except in
situations where moving into open areas leaves them exposed to larger predators (Genovesi et
al. 1995) or where prey density is low (Hall et al. 2009). Our cats’ selection for open areas is
almost certainly an expression of hunting preferences, as their selection became stronger in
areas with higher small-mammal abundances. Although grass cover in itself had a large effect
size (odds ratio maximum of 1.8), the effects of grazing and fire patterns on cat movements
were much stronger.
Selection for fire scars was strongly dependent on fire intensity and time since fire. In
general, cats avoided fire scars up to 360 days after fire. The exception was for recent scars of
71
intense fires with high densities of small mammals, which created the greatest increase in the
odds ratio of any variable in this study. Fire opens up the grass layer, leaving prey more
exposed and accessible to predators (Conner et al. 2011). Intense fires would create pulses
where prey would be easy for cats to catch, provided local abundance of prey was high. Cats
did not select for recent mild fire scars, even in habitats with high small-mammal abundance.
Mild fires typically leave pockets of unburnt vegetation (Russell-Smith et al. 2002), which
provide protection for prey (Banks et al. 2011). Also, mild fires are often stopped by riparian
and alluvial areas (Russell-Smith et al. 2003), and such areas act as refugia for small
mammals post-fire (Banks et al. 2011). Our results suggest that cats are not able to capitalise
on vulnerable small mammals after mild fires, but can after intense fires. This can explain
why declines of some threatened native mammals have been so dramatic under regimes of
consecutive high intensity fires (Firth et al. 2010; Pardon et al. 2003).
Grazing by introduced herbivores also affected habitat choice by cats. Certain vegetation
types (with more palatable grasses) were more preferred by introduced herbivores than
others, typically riparian areas and bluegrass plains (Tomkins and O’Reagain 2007). Cats
selected for such habitats even when they had been destocked, but grazing intensified this
preference. Cats may have a stronger selection for these areas in the grazed zone as lower
prey densities (Legge et al. 2011) require them to hunt in areas of relatively higher mammal
density in order to obtain enough food. Daytime movements of cats were especially affected
by grazing, suggesting that grazing creates favourable conditions for hunting of diurnal prey,
such as birds (Brown 1982).
Adult cat movements at small-scale 15 minute segments were dictated by their overall home
range. Females had a stronger home-range fidelity than males, probably due to the
importance of staying near dens that are used for rearing young (Krofel et al. 2013). Sub-
adults displayed no such home range fidelity as they were probably in the process of creating
and defining their home-ranges.
A top-order predator, the dingo Canis familiaris dingo, would also have influenced the
movements of cats. Over the area and duration of the study, the dingo populations was
abundant (0.2 individuals per km2) and stable (Legge et al. 2014), and dingoes would have
been a constant threat to cats (Moseby et al. 2012). A concurrent study in the same area that
72
compared GPS movements of cats and dingoes found that although high use areas of dingoes
and cats overlapped, cats were constantly avoiding the locations of individual dingoes (Brook
2013). This suggests avoidance of dingoes would have affected the timing of behavioural
decisions of cats (Brook et al. 2012), but not necessarily by excluding them from certain
areas (Wang and Fisher 2012). Considering dingoes potential role in tropic regulation
(Radford et al. 2014), further research into the relationship between dingoes, cats, and fire
and grazing is warranted.
Conclusions
We demonstrate increased predator activity after intense fires and with grazing by large
herbivores, which is likely to increase predation rates on small mammals. Small mammals are
the preferred prey of cats, and form a substantial part of the diet of cats in the study region
(55 % of prey volume, from 33 stomach contents; unpublished data). Furthermore, the
preference of cats for open and intensely burned areas was depended on small-mammal
abundance, and was reduced for habitats in which abundance of small mammals was low.
These patterns of habitat selection by cats correspond with patterns of small mammal
populations in mainland northern Australia, outside complex rocky outcrops, where small
mammals decline with intensifying fire and/or grazing regimes (Andersen et al. 2005; Firth et
al. 2010; Kutt and Woinarski 2007; Legge et al. 2011; Legge et al. 2008; Pardon et al. 2003;
Woinarski et al. 2010). Our work supports the hypothesis that the declines in small mammals
across northern Australia are driven by cat predation facilitated by simplification of ground
layer structure. However, this evidence is not direct, and other possible mechanisms
including trophic alterations (Radford et al. 2014) and disease (Woinarski et al. 2011a) may
still have a role. Further research needs to measure whether mortality of prey is greater in
more open areas. Regardless, the magnitude of the impacts of cats globally (Loss et al. 2012)
suggests that our findings provide a general mechanism for prey decline in ecosystems with
grass-dominated understoreys.
The results presented here suggest that manipulation of habitat through careful management
of fire and grazing could be used to reduce impacts of cats over large landscapes. Reducing
the frequency of intense fires and removing introduced herbivores is likely to be beneficial
for small mammals, especially if this management is focussed on naturally mammal-rich

73
habitats, and results in increased ground cover. Vegetation structure is pivotal in creating
ideal landscapes for predators to hunt, and/or refuges for prey to hide.
74
Reference list
Abbott, I. (2002) Origin and spread of the cat, Felis catus, on mainland Australia, with a
discussion of the magnitude of its early impact on native fauna. Wildlife Research 29, 51–74.
Andersen, A.N., Cook, G.D., Corbett, L.K., Douglas, M.M., Eager, R.W., Russell-Smith, J.,
Setterfield, S.A., Williams, R.J., and Woinarski, J.C.Z. (2005) Fire frequency and
biodiversity conservation in Australian tropical savannas: implications from the Kapalga fire
experiment. Austral Ecology 30(2), 155–167.
Banks, S.C., Dujardin, M., McBurney, L., Blair, D., Barker, M., and Lindenmayer, D.B.
(2011) Starting points for small mammal population recovery after wildfire: recolonisation or
residual populations? Oikos 120(1), 26–37.
Bjørneraas, K., van Moorter, B., Rolandsen, C.M., and Herfindal, I. (2010) Screening global
positioning system location data for errors using animal movement characteristics. Journal of
Wildlife Management 74(6), 1361–1366
Brook, L.A. (2013) Predator guild interactions in northern Australia: behaviour and ecology
of an apex predator, the dingo Canis lupus dingo, and an introduced mesopredator, the feral
cat Felis catus., James Cook University, Townsville, QLD
Brook, L.A., Johnson, C.N., and Ritchie, E.G. (2012) Effects of predator control on
behaviour of an apex predator and indirect consequences for mesopredator suppression.
Journal of Applied Ecology 49(6), 1278–1286.
Brown, R.L. (1982) Effects of livestock grazing on Mearns Quail in southeastern Arizona.
Journal of Range Management 35(6), 727–732.
Burnham, K.P., and Anderson, D.R. (1998) 'Model selection and multimodel inference: A
practical information-theoretic approach.' 2 edn. (Springer Science & Business Media, Inc)
Conner, L.M., Castleberry, S.B., and Derrick, A.M. (2011) Effects of mesopredators and
prescribed fire on hispid cotton rat survival and cause-specific mortality. Journal of Wildlife
Management 75(4), 938–944.
Cooper, A.B., and Millspaugh, J.J. (1999) The application of discrete choice models to
wildlife resource selection studies. Ecology 80(2), 566–575.
Dickman, C.R. (1996) Overview of the impacts of feral cats on Australian native fauna.
University of Sydney, Sydney.
Dickson, B.G., and Beier, P. (2002) Home-range and habitat selection by adult Cougars in
Southern California. Journal of Wildlife Management 66(4), 1235–1245.
Didham, R.K., Tylianakis, J.M., Gemmell, N.J., Rand, T.A., and Ewers, R.M. (2007)
Interactive effects of habitat modification and species invasion on native species decline.
TRENDS in Ecology & Evolution 22(9), 490–496.
75
Driscoll, D.A., Lindenmayer, D.B., Bennett, A.F., Bode, M., Bradstock, R.A., Cary, G.J.,
Clarke, M.F., Dexter, N., Fensham, R., and Friend, G.R. (2010) Fire management for
biodiversity conservation: key research questions and our capacity to answer them. Biological
Conservation 143(9), 1928–1939.
Firth, R.S.C., Brook, B.W., Woinarski, J.C.Z., and Fordham, D.A. (2010) Decline and likely
extinction of a northern Australian native rodent, the Brush-tailed Rabbit-rat Conilurus
penicillatus. Biological Conservation 143, 1193–1201.
Fisher, D.O., Johnson, C.N., Lawes, M.J., Fritz, S.A., McCallum, H.I., Blomberg, S.P., Van
Der Wal, J., Abbott, B., Frank, A., Legge, S., Letnic, M., Thomas, C.R., Fisher, A., Gordon,
I.J., and Kutt, A.S. (2013) The current decline of tropical marsupials in Australia: is history
repeating? Global Ecology and Biogeography 23(2), 181–190.
Frank, A.S.K., Johnson, C.N., Potts, J., Alaric, F., Lawes, M.J., Woinarski, J.C.Z., Tuft, K.,
Radford, I., Gordon, I.J., Collis, M.-A., and Legge, S. (2014) Experimental evidence that
feral cats cause local extirpation of small mammals in Australia's tropical savanna. Journal of
Applied Ecology 51(6), 1486–1493.
Genovesi, P., Besa, M., and Toso, S. (1995) Ecology of a feral cat Felis catus population in
an agricultural area of northern Italy. Wildlife Biology 1, 233–237.
Gilliam, J.F., and Fraser, D.F. (1987) Habitat selection under predation hazard: test of a
model with foraging minnows. Ecology 68(6), 1856–1862.
Griffiths, D. (1975) Prey availability and the food of predators. Ecology 56, 1209–1214.
Hall, L.S., Kasparian, M.A., Van Vuren, D., and Kelt, D.A. (2009) Spatial organization and
habitat use of feral cats (Felis catus L.) in Mediterranean California. Mammalia 64(1), 19–28.
Hebblewhite, M., Merrill, E.H., and McDonald, T.L. (2005) Spatial decomposition of
predation risk using resource selection functions: an example in a wolf-elk predator-prey
system. Oikos 111, 101–111.
Hopcraft, J.C.C., Sinclair, A.R.E., and Packer, C. (2005) Planning for success: Serengeti lions
seek prey accessibility rather than abundance. Journal of Animal Ecology 74, 559–566.
Horn, K.J., McMillan, B.R., and St Clair, S.B. (2012) Expansive fire in Mojave Desert
shrubland reduces abundance and species diversity of small mammals. Journal of Arid
Environments 77, 54–58.
Jones, A. (2000) Effects of cattle grazing on North American arid ecosystems: a quantitative
review. Western North American Naturalist 60(2), 155–164.
Koenen, M.T., Leslie, D., and Gregory, M.S. (1996) Habitat changes and success of artificial
nests on an alkaline flat. Wilson Bulletin 108(2), 292–301.
76
Krofel, M., Skrbinšek, T., and Kos, I. (2013) Use of GPS location clusters analysis to study
predation, feeding, and maternal behavior of the Eurasian lynx. Ecological Research 28(1),
103–116.
Kutt, A.S. (2012) Feral cat (Felis catus) prey size and selectivity in north‐eastern Australia:
implications for mammal conservation. Journal of Zoology 287(4), 292–300.
Kutt, A.S., and Woinarski, J.C.Z. (2007) The effects of grazing and fire on vegetation and the
vertebrate assemblage in a tropical savanna woodland in north-eastern Australia. Journal of
Tropical Ecology 23(1), 95–106.
Legge, S., Kennedy, M.S., Lloyd, R., Murphy, S.A., and Fisher, A. (2011) Rapid recovery of
mammal fauna in the central Kimberley, northern Australia, following the removal of
introduced herbivores. Austral Ecology 36, 791–799.
Legge, S., Murphy, S., Heathcote, J., Flaxman, E., Augusteyn, J., and Crossman, M. (2008)
The short-term effects of an extensive and high-intensity fire on vertebrates in the tropical
savannas of the central Kimberley, northern Australia. Wildlife Research 35, 33–43.
Legge, S., Webb, T., Smith, J., Tuft, K., and James, A. (2014) The ecological health of
Mornington and Marion Downs Wildlife Sanctuaries, 2013 Report. Australian Wildlife
Conservancy, Perth, WA.
Liedloff, A.C., Coughenour, M.B., Ludwig, J.A., and Dyer, R. (2001) Modelling the trade-off
between fire and grazing in a tropical savanna landscape, northern Australia. Environment
International 27(2), 173–180.
Lima, S.L., and Dill, L.M. (1990) Behavioural decisions made under the risk of predation: a
review and prospectus. Canadian Journal of Zoology 68, 619–640.
Loss, S.R., Will, T., and Marra, P.P. (2012) The impact of free-ranging domestic cats on
wildlife of the United States. Nature Communications 4, 1396.
Moseby, K.E., Neilly, H., Read, J.L., and Crisp, H.A. (2012) Interactions between a top order
predator and exotic mesopredators in the Australian rangelands. International Journal of
Ecology 2012(2012), 1–15.
Moseby, K.E., Stott, J., and Crisp, H. (2009) Movement patterns of feral predators in an arid
environment – implications for control through poison baiting. Wildlife Research 36, 422–
435.
Oakwood, M. (2000) Reproduction and demography of the northern quoll, Dasyurus
hallucatus, in the lowland savanna of northern Australia. Australian Journal of Zoology 48,
519–539.
Pardon, G., Brook, B.W., Griffiths, A.D., and Braithwaite, R.W. (2003) Determinants of
survival for the northern brown bandicoot under a landscape-scale fire experiment. Journal of
Animal Ecology 72, 106–115.
77
R Development Core Team (2008) R: a language and environment for statistical computing.
In '.' (R Foundation for Statistical Computing: Vienna)
Radford, I.J., Dickman, C.R., Start, A.N., Palmer, C., Carnes, K., Everitt, C., Fairman, R.,
Graham, G., Partridge, T., and Thomson, A. (2014) Mammals of Australia's tropical
savannas: A conceptual model of assemblage structure and regulatory factors in the
Kimberley region. PLos ONE 9(3), e92341.
Rajaratnam, R., Sunquist, M., Rajaratnam, L., and Ambu, L. (2007) Diet and habitat selection
of the leopard cat (Prionailurus bengalensis borneoensis) in an agricultural landscape in
Sabah, Malaysian Borneo. Journal of Tropical Ecology 23(2), 209–217.
Recio, M.R., Mathieu, R., Virgós, E., and Seddon, P.J. (2014) Quantifying fine-scale resource
selection by introduced feral cats to complement management decision-making in
ecologically sensitive areas. Biological Invasions 16, 1–13.
Russell-Smith, J., Ryan, P.G., and Cheal, D.C. (2002) Fire regimes and the conservation of
sandstone heath in monsoonal northern Australia: frequency, interval, patchiness. Biological
Conservation 104(1), 91–106.
Russell-Smith, J., Yates, C.J., Edwards, A., Allan, G.E., Cook, G.D., Cooke, P., Craig, R.,
Heath, B., and Smith, R. (2003) Contemporary fire regimes of northern Australia, 1997–
2001: change since Aboriginal occupancy, challenges for sustainable management.
International Journal of Wildland Fire 12, 283–297.
Southgate, R., Palmer, C., Adams, M.A., Masters, P., Triggs, B., and Woinarski, J.C.Z.
(1996) Population and habitat characteristics of the Golden Bandicoot (Isoodon auratus) on
Marchinbar Island, Northern Territory. Wildlife Research 23, 647–664.
Sutherland, E.F., and Dickman, C.R. (1999) Mechanisms of recovery after fire by rodents in
the Australian environment: a review. Wildlife Research 26, 405–419.
Tabeni, S., and Ojeda, R.A. (2003) Assessing mammal responses to perturbations in
temperate aridlands of Argentina. Journal of Arid Environments 55(4), 715–726.
Therneau, T.M., Grambsch, P.M., and Pankratz, S. (2003) Penalized survival models and
frailty. Journal of Computational and Graphical Statistics 12(1), 156–175.
Tomkins, N., and O’Reagain, P. (2007) Global positioning systems indicate landscape
preferences of cattle in the subtropical savannas. The Rangeland Journal 29(2), 217–222.
Torre, I., Díaz, M., Martínez-Padilla, J., Bonal, R.D., Viñuelae, J., and Fargallof, R.A. (2007)
Cattle grazing, raptor abundance and small mammal communities in Mediterranean
grasslands. Basic and Applied Ecology 8(6), 565–575.
Wang, Y., and Fisher, D.O. (2012) Dingoes affect activity of feral cats, but do not exclude
them from the habitat of an endangered macropod. Wildlife Research 39(7), 611–620.
Woinarski, J.C.Z., Armstrong, M., Brennan, K., Fisher, A., Griffiths, A.D., Hill, B., Milne,
D.J., Palmer, C., Ward, S., Watson, M., Winderlich, S., and Young, S. (2010) Monitoring
78
indicates rapid and severe decline of native small mammals in Kakadu National Park,
northern Australia. Wildlife Research 37, 116–126.
Woinarski, J.C.Z., Legge, S., Fitzsimons, J.A., Traill, B.J., Burbidge, A.A., Fisher, A., Firth,
R.S.C., Gordon, I.J., Griffiths, A.D., Johnson, C.N., McKenzie, N.L., Palmer, C., Radford, I.,
Rankmore, B., Ritchie, E.G., Ward, S., and Ziembicki, M. (2011a) The disappearing mammal
fauna of northern Australia: context, cause, and response. Conservation Letters 4(3), 1–10.
Woinarski, J.C.Z., Ward, S., Mahney, T., Bradley, J., Brennan, K., Ziembicki, M., and Fisher,
A. (2011b) The mammal fauna of the Sir Edward Pellew island group, Northern Territory,
Australia: refuge and death-trap. Wildlife Research 38, 307–322.
Yarnell, R.W., Scott, D.M., Chimimba, C.T., and Metcalfe, D.J. (2007) Untangling the roles
of fire, grazing and rainfall on small mammal communities in grassland ecosystems.
Oecologia 154(2), 387–402.
Ziembicki, M.R., Woinarski, J.C.Z., and Mackey, B. (2013) Evaluating the status of species
using Indigenous knowledge: Novel evidence for major native mammal declines in northern
Australia. Biological Conservation 157, 78–92.
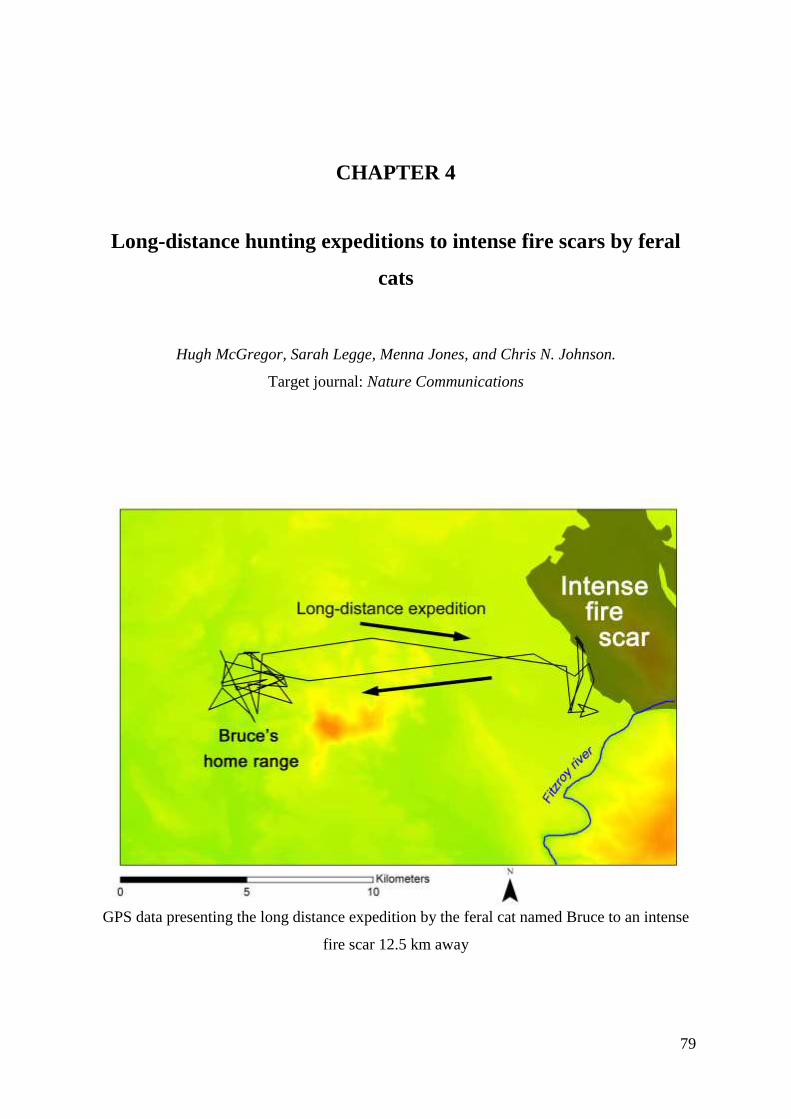
79
CHAPTER 4
Long-distance hunting expeditions to intense fire scars by feral
cats
Hugh McGregor, Sarah Legge, Menna Jones, and Chris N. Johnson.
Target journal: Nature Communications
GPS data presenting the long distance expedition by the feral cat named Bruce to an intense
fire scar 12.5 km away
80
Abstract
Feral cats are normally territorial in Australia’s tropical savannahs, and hunt intensively with
home-ranges only two to three kilometres across. Here we report that they sometimes also
undertake expeditions of up to 12.5 km from their home ranges to hunt for short periods over
recently burned areas. Cats are especially likely to travel to areas burned at high intensity,
evidently in response to vulnerability of prey soon after such fires. The movements of
journeying cats are highly directed to specific destinations, suggesting advanced spatial
comprehension well beyond our current understanding. We argue that the effect of this
behaviour is to increase the aggregate impact of cats on vulnerable prey. This has profound
implications for conservation, considering the ubiquity of feral cats and global trends of
intensified fire regimes.
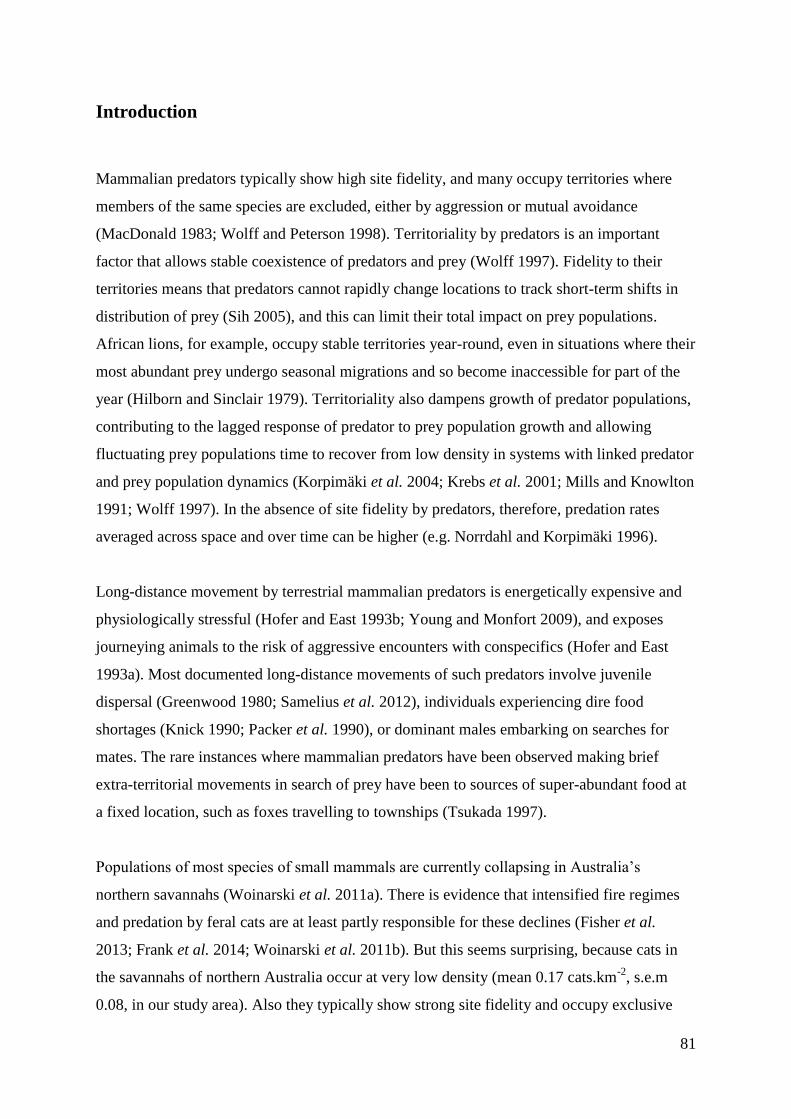
81
Introduction
Mammalian predators typically show high site fidelity, and many occupy territories where
members of the same species are excluded, either by aggression or mutual avoidance
(MacDonald 1983; Wolff and Peterson 1998). Territoriality by predators is an important
factor that allows stable coexistence of predators and prey (Wolff 1997). Fidelity to their
territories means that predators cannot rapidly change locations to track short-term shifts in
distribution of prey (Sih 2005), and this can limit their total impact on prey populations.
African lions, for example, occupy stable territories year-round, even in situations where their
most abundant prey undergo seasonal migrations and so become inaccessible for part of the
year (Hilborn and Sinclair 1979). Territoriality also dampens growth of predator populations,
contributing to the lagged response of predator to prey population growth and allowing
fluctuating prey populations time to recover from low density in systems with linked predator
and prey population dynamics (Korpimäki et al. 2004; Krebs et al. 2001; Mills and Knowlton
1991; Wolff 1997). In the absence of site fidelity by predators, therefore, predation rates
averaged across space and over time can be higher (e.g. Norrdahl and Korpimäki 1996).
Long-distance movement by terrestrial mammalian predators is energetically expensive and
physiologically stressful (Hofer and East 1993b; Young and Monfort 2009), and exposes
journeying animals to the risk of aggressive encounters with conspecifics (Hofer and East
1993a). Most documented long-distance movements of such predators involve juvenile
dispersal (Greenwood 1980; Samelius et al. 2012), individuals experiencing dire food
shortages (Knick 1990; Packer et al. 1990), or dominant males embarking on searches for
mates. The rare instances where mammalian predators have been observed making brief
extra-territorial movements in search of prey have been to sources of super-abundant food at
a fixed location, such as foxes travelling to townships (Tsukada 1997).
Populations of most species of small mammals are currently collapsing in Australia’s
northern savannahs (Woinarski et al. 2011a). There is evidence that intensified fire regimes
and predation by feral cats are at least partly responsible for these declines (Fisher et al.
2013; Frank et al. 2014; Woinarski et al. 2011b). But this seems surprising, because cats in
the savannahs of northern Australia occur at very low density (mean 0.17 cats.km-2
, s.e.m
0.08, in our study area). Also they typically show strong site fidelity and occupy exclusive
82
territories (Chapter 2), meaning that individual cats are widely spaced. We lack a mechanistic
understanding of how sparse populations of this small predator could be having such large
impacts on prey.
We show here that cats make predictable long-distance expeditions to hunt intensively at
recent high intensity fires far outside their home ranges, and then repatriate to the original
home range. These journeys ranged up to 30 km, almost ten times the typical home-range
diameter. We analyse the factors that influence cats’ decisions to travel, durations of
residence at the destination, and finally, the movement rules followed by journeying cats. We
argue that the behavioural capacity of feral cats to undertake long-distance excursions to
exploit transient hunting opportunities results in significantly higher total predator pressure
on prey, and explains how low-density cat populations could have large impacts on small-
mammal abundance at landscape scales. This will also have profound implications for global
trends of intensified fire regimes (Flannigan et al. 2013).
83
Methods
Study area
Our study area was in north-western Australia, at three large properties in the central
Kimberley (17 ° S, 126 ° E). Habitats are savannah woodlands with a perennial grass layer,
dissected by riparian vegetation along the edges of creeks. Fire is managed on all three
properties to promote biodiversity values. This involves reducing the incidence of extensive,
intense fires in the late dry season by lighting strategic prescribed fires with incendiaries in
the early dry season when fires are small-scale and mild.
GPS tracking of cats
We studied movements of 32 cats that were captured and had GPS telemetry collars attached
between 2010 and 2013. Cats were caught using either large wire cage traps, leg-hold traps
(soft-jaw, size #1.5) or by spotlighting and netting with the assistance of dogs trained to
locate and corner cats. Collars were set to record one fix per day at 20:00 pm WST, with
bouts of fifteen minute fixes each of two days duration (Chapter 3). The single fix per day
was used for home range and destination area calculations, while the fifteen-minute fixes
were used to measure the properties of the transit passage. The majority (73 %) of transit
passages were captured in the fifteen-minute fixes.
Characteristics of movements by cats
To investigate expeditions by cats outside their home-range, we created definitions and
‘triggers’ for switching between three movement states: within home-range movements,
transit, and area-restricted movements at destinations. To define the distinction between
within home-range movements and transit, for every fix we determined the distance from the
cumulative mean home-range centroid, kept a running standard deviation, and deemed any
fix greater than two standard deviations away from this range to represent an abrupt move
outside a home-range boundary after at least two weeks of GPS fixes. To differentiate transit
from an area-restricted search, we used first-passage time (Fauchald and Tveraa 2003). For
all fixes within a sequence outside a home-range, we calculated the first passage time for
84
circles of 100 m increments, the log-variance for each increment, selected the circle size with
the greatest log-variance, and used that size circle to determine area-restricted movements
outside a home range. In all instances, home-range movements, transit, and area-restricted
movements at destinations were unambiguous (see Figure 1 for examples).
Once travels had been defined, we used discrete-choice modelling to identify determinants of
the cats’ decisions to travel. Every complete month of active GPS fixes was analysed as a
‘choice’ of whether to stay or travel, and where to choose as the destination. The choice set
was defined as the home range, and five randomly generated possible destinations outside the
home range. As we had too few journeys to generate a probability distribution, these
‘available’ possible destinations were defined using these five randomly placed sites the size
of the average area-restricted destination within a 12.5 km buffer around the home range (the
longest journey of a cat during this study). For cats that travelled to a destination in any
month, the destination was added to the choice set and marked as chosen, even if the cat was
not there for the whole month. The areas and shapes of home ranges and destinations were
defined from a kernel density estimate of all suitable fixes using smooth cross validation,
around a 95 % isotope.
To determine predictors of travel in a spatially and temporally dynamic landscape, we
measured landscape features relevant to cats for each month. Fire extents were mapped using
monthly Landsat 7 remote-sensing imagery available from the US Geological Survey (2011–
2013). For each burnt area, we assigned the date of burn, the intensity (intense = 100 % tree
scorch and no ground cover remaining unburnt, or mild = all other fires). Fire was classed by
intensity in binary variables at one, three, six, nine and twelve months since fire, relative to
the date of each GPS fix. Regions were divided into relative prey abundance based on
average number of small mammals caught per year per area, from an annual dataset (Legge,
Australian Wildlife Conservancy, unpublished data). We also calculated percent cover of
riparian habitats, known to be important to cats (Chapter 3). The percent of each habitat
feature was measured for the home range and five possible destinations for each month of cat
movement data. Standard case-control logistic regression models were implemented in R v. 8
(R Development Core Team 2008) using the ‘survival’ library (Therneau 2014), with a
separate model for every combination of variables. These models were compared within an
information theory framework to select the most parsimonious model.
85
To determine whether journeys consisted of directed movement that efficiently reached a
destination, we compared each actual journey against 100 simulations of correlated random
walks. We detected significant correlation in distances travelled between successive fixes
using Jlung-box tests (Turchin 1998), where cats were more likely to move greater distances
if previous step lengths were longer and turn angles were shorter. This bias was incorporated
into the selection of random step-lengths. Each simulation used the same number of segments
as the corresponding journey, and step-lengths and turn angles were drawn from the same
probability distributions as the actual journeys. We counted how many of the 100 simulations
reached the destination, and compared this against observed values using an analysis of
variance test. To determine whether routes taken were more direct or tortuous than expected,
we calculated the Fractal D (Nams and Bourgeois 2004) for each journey; direct distance
between start and finish divided by the distance of route travelled. We also compared the
bearing of the first three segments of travel against the bearing of destination.
We measured length of time at destination against the months since the intense fire, season,
prey density at destination. Linear models were fitted to every combination of the above
variables. Time at fire was log-transformed to fulfil assumptions of normality. Models were
compared within an information theory framework.
86
Results
We studied movements of 32 cats (25 males and seven females) using GPS tracking between
2010 and 2013 in the Kimberley region of north-western Australia, acquiring a total of 121
cat-months of movement data. Movement paths of cats were profiled into three types: (i)
within home-range movements, (ii) long-range journeys, and (iii) area-restricted movements
at a destination (see Methods). We identified eleven clear instances of long-distance journeys,
ranging from two to more than fifty days at a time. Cats journeyed up to 30 km away from
their home ranges, but all area-restricted movements at distinct destinations were within 12.5
km of the home range. Eight of the eleven expeditions involved arrival at a distinct
destination, defined as a site where a pattern of area-restricted search was initiated (see
Figure 1). One cat died at its destination, so we cannot separate this travel from dispersal
movements. Another was initially caught and collared at what we believe was its destination,
not its home range. Its pelage matched that of a cat from 12 km away, who was known from a
series of infrared camera records at that site over two years. It returned to that site after one
month of GPS tracking. All journeying cats were adult males ranging in weight from 3.2 –
5.1 kg.
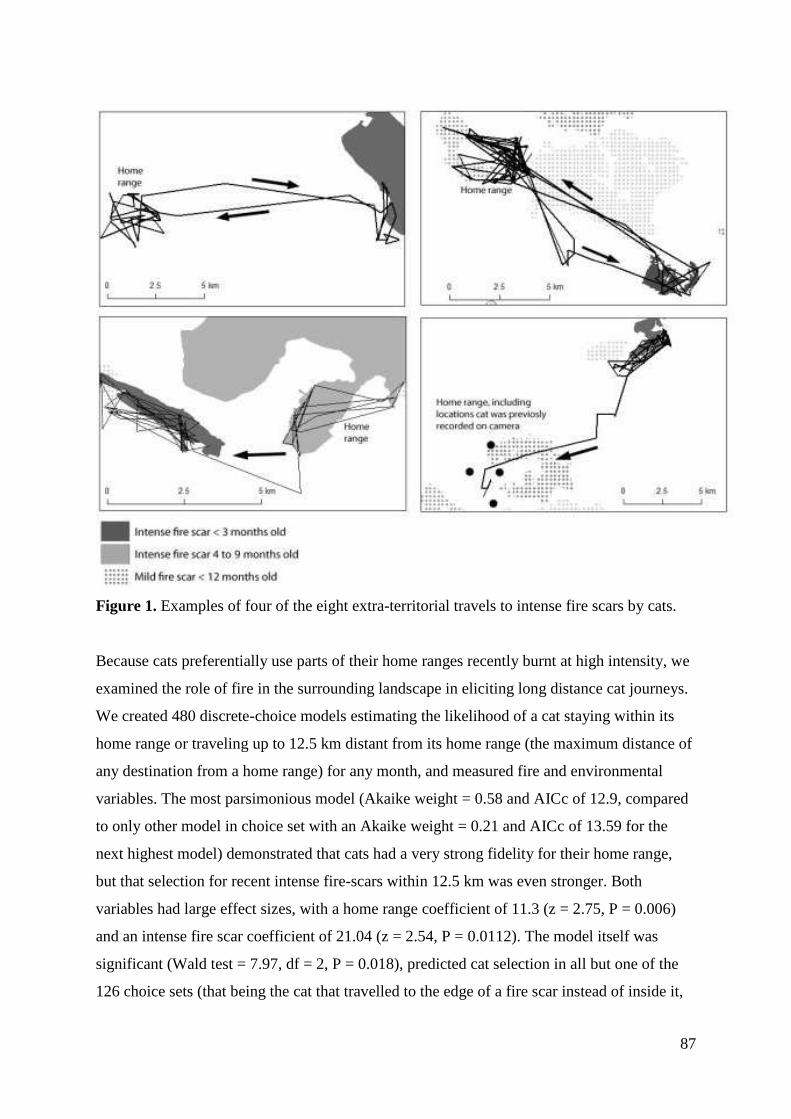
87
Figure 1. Examples of four of the eight extra-territorial travels to intense fire scars by cats.
Because cats preferentially use parts of their home ranges recently burnt at high intensity, we
examined the role of fire in the surrounding landscape in eliciting long distance cat journeys.
We created 480 discrete-choice models estimating the likelihood of a cat staying within its
home range or traveling up to 12.5 km distant from its home range (the maximum distance of
any destination from a home range) for any month, and measured fire and environmental
variables. The most parsimonious model (Akaike weight = 0.58 and AICc of 12.9, compared
to only other model in choice set with an Akaike weight = 0.21 and AICc of 13.59 for the
next highest model) demonstrated that cats had a very strong fidelity for their home range,
but that selection for recent intense fire-scars within 12.5 km was even stronger. Both
variables had large effect sizes, with a home range coefficient of 11.3 (z = 2.75, P = 0.006)
and an intense fire scar coefficient of 21.04 (z = 2.54, P = 0.0112). The model itself was
significant (Wald test = 7.97, df = 2, P = 0.018), predicted cat selection in all but one of the
126 choice sets (that being the cat that travelled to the edge of a fire scar instead of inside it,
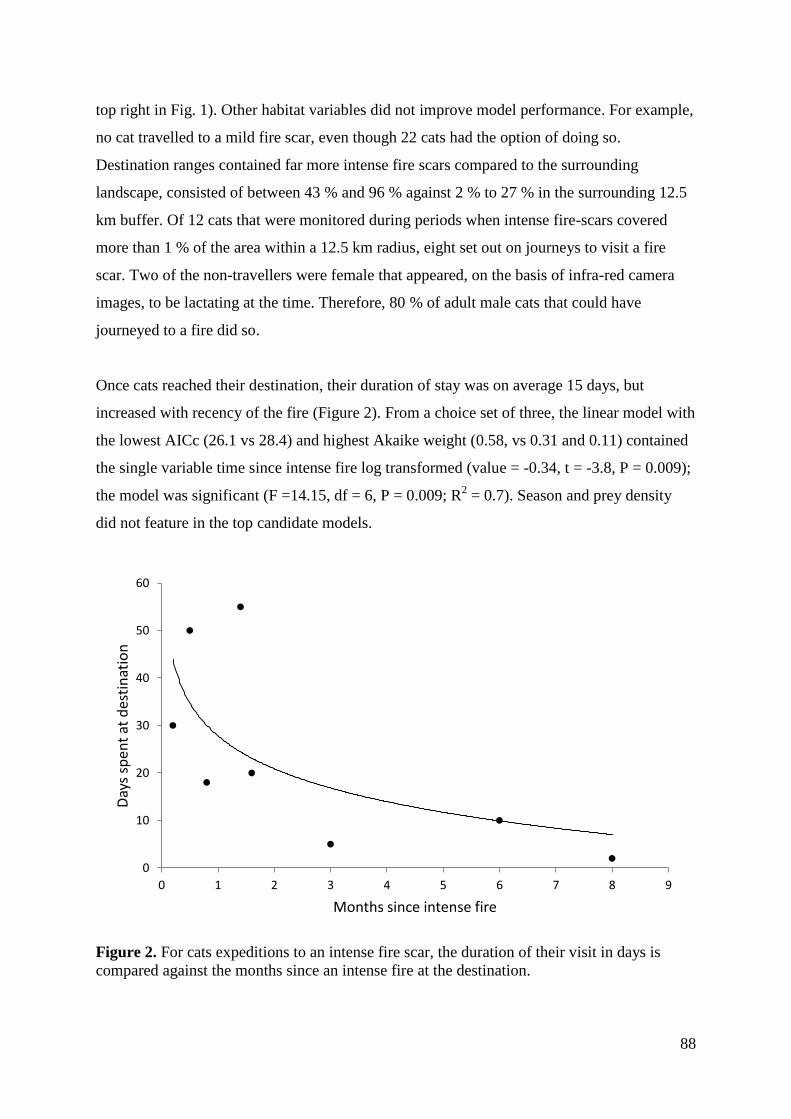
88
top right in Fig. 1). Other habitat variables did not improve model performance. For example,
no cat travelled to a mild fire scar, even though 22 cats had the option of doing so.
Destination ranges contained far more intense fire scars compared to the surrounding
landscape, consisted of between 43 % and 96 % against 2 % to 27 % in the surrounding 12.5
km buffer. Of 12 cats that were monitored during periods when intense fire-scars covered
more than 1 % of the area within a 12.5 km radius, eight set out on journeys to visit a fire
scar. Two of the non-travellers were female that appeared, on the basis of infra-red camera
images, to be lactating at the time. Therefore, 80 % of adult male cats that could have
journeyed to a fire did so.
Once cats reached their destination, their duration of stay was on average 15 days, but
increased with recency of the fire (Figure 2). From a choice set of three, the linear model with
the lowest AICc (26.1 vs 28.4) and highest Akaike weight (0.58, vs 0.31 and 0.11) contained
the single variable time since intense fire log transformed (value = -0.34, t = -3.8, P = 0.009);
the model was significant (F =14.15, df = 6, P = 0.009; R2 = 0.7). Season and prey density
did not feature in the top candidate models.
Figure 2. For cats expeditions to an intense fire scar, the duration of their visit in days is
compared against the months since an intense fire at the destination.
0
10
20
30
40
50
60
0 1 2 3 4 5 6 7 8 9
Day
s sp
ent
at d
esti
nat
ion
Months since intense fire

89
To determine whether cats’ journeys were purposefully directed towards intense fire scars,
we compared each actual journey with 100 correlated random walk simulations using the
same number of segments, and probabilities of turn-angles and distances. Compared to actual
journeys, the simulated random walks reached an intense fire scar far less frequently (11 % of
walks reached the fire, F = 459, P < 0.001), had a far lower tortuosity (Fractal D of 0.7 vs
0.31, F1,8 = 26.4, P < 0.001), and were less likely to begin in the direction of a fire scar (F1,8 =
33.45, P < 0.001).
90
Discussion
This is the first report of long-distance expeditions by a terrestrial mammalian predator to
spontaneous and unpredictable pulses of prey availability. Feral cats made directed
movements over long distances to intense fire scars, even though the animals otherwise held
partially exclusive home ranges (Liberg et al. 2000, Chapter 2). Although the number of
recorded journeys was small (11), the consistent destinations and strongly directed character
of the movements make these data compelling. Even though all travelling cats were male, we
do not believe these journeys had the objective of finding mates. The area-restricted searches
that were initiated at destinations were at too large a spatial and temporal scale to be
consistent with mating. While 80 % of the male cats exposed to an intense fire within 12.5
km of their home range journeyed to it, none of the 22 cats with a mild fire within 12.5 km
journeyed, probably because such fires leave pockets of unburnt grasses that can provide
refuge for prey and make hunting less profitable for cats (Banks et al. 2011; Leahy et al.
2014). We suggest that cats make these journeys to intense fire scars to take advantage of
short pulses of high prey availability, where no such refuges remain (Birtsas et al. 2012,
Chapter 3). Prey of feral cats (e.g. rodents) benefit from grass cover for protection from
predators, and the complete loss of such would create ideal hunting areas for
predators(Crowner and Barrett 1979; Leahy et al. 2014; Morris et al. 2011).
These long-distance journeys by cats create sudden dramatic increases in density of cats at
fire scars, and could have an aggregate effect of driving down the density of small mammals
over whole landscapes. We can estimate the likely local increase in cat density at fire scars
produced by cats’ journeying from the surrounding landscape. Considering a hypothetical fire
of 100 km2 (see Figure 3, A), in an area with a density of 0.17 cats per km
2 (Chapter 2), half
of which are male, and assuming that 80 % of those would travel; that gives a total of 25 cats
whose home-range adjoin the fire scar and an extra 70 cats within 12.5 km of the fire scar
that are likely to visit it (see Figure 3, B). Given that expeditions were on average 15 days
long and within a nine-month post-fire period (Figure 2), we would see on average four extra
cats hunting within the fire scar, peaking with the months after fire (Figure 3, C). This would
create substantial increases in cat density at fire scars, and corresponds with both the four-
fold increase in cat activity and twenty-fold increase in small mammal predation rates
recorded after a fire by Leahy et al. (2014). This estimate demonstrates how a relatively low
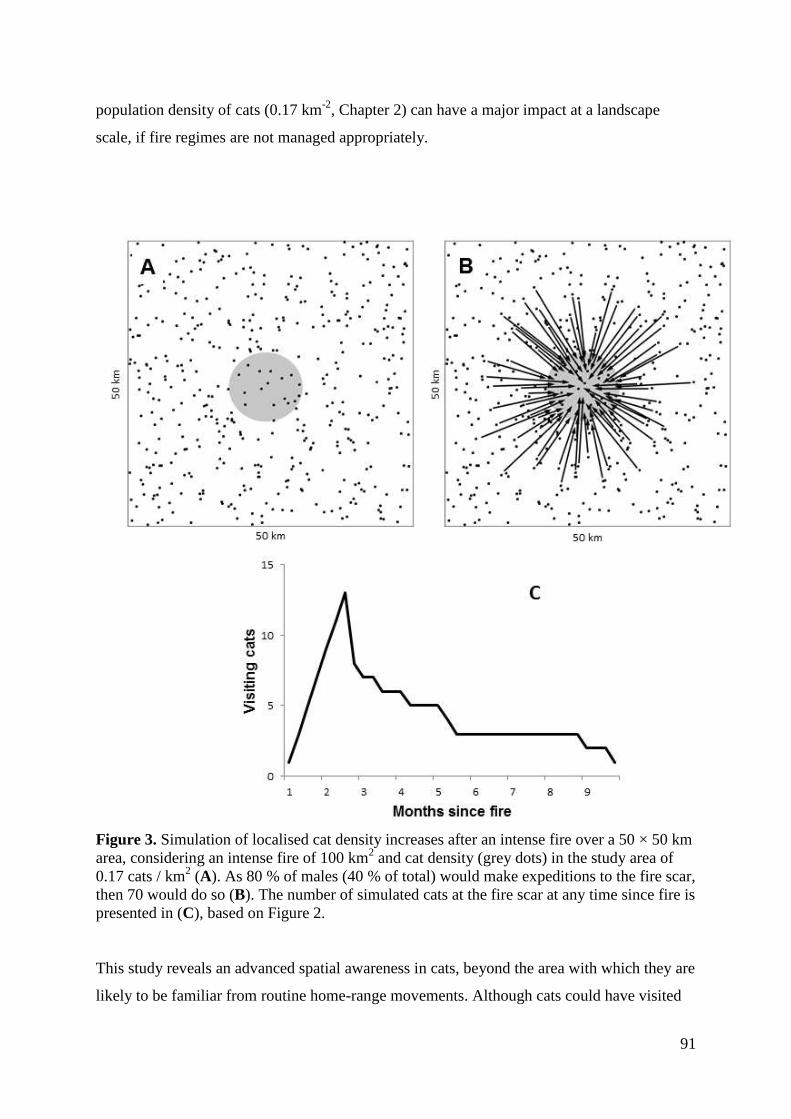
91
population density of cats (0.17 km-2
, Chapter 2) can have a major impact at a landscape
scale, if fire regimes are not managed appropriately.
Figure 3. Simulation of localised cat density increases after an intense fire over a 50 × 50 km
area, considering an intense fire of 100 km2 and cat density (grey dots) in the study area of
0.17 cats / km2 (A). As 80 % of males (40 % of total) would make expeditions to the fire scar,
then 70 would do so (B). The number of simulated cats at the fire scar at any time since fire is
presented in (C), based on Figure 2.
This study reveals an advanced spatial awareness in cats, beyond the area with which they are
likely to be familiar from routine home-range movements. Although cats could have visited
92
these destinations before we placed GPS collars on them, they could not have known there
would be a pulse of prey availability after an intense fire from memory of prior visits alone.
They could have detected fire scars by either the smell of ash, or by observing the glow of
fire from a distance. However, there was a time lag of at least five days between fire and
journeys (average 73 days), so the smell of smoke or fire glow could not have been used as a
direct guide for navigation. Instead, the cats would need to have retained the memory of the
direction of their cues for days and up to several months before they embarked on their
journey. The accuracy of some of the return trips demonstrate exceptionally large spatial
scales for their mental maps, and suggest that the scale of spatial and temporal memory
demonstrated in experimental settings (e.g. Dumas 1992; Goulet 1996) is only a small
fraction of what cats are capable of comprehending.
Two of the greatest threats to wildlife globally are intensifying fire regimes and predation by
invasive predators, and our documented interaction between these has major implications for
conservation (Brook et al. 2008). In general, fire regimes are intensifying due to
anthropogenic land-use change (Russell-Smith et al. 2003), invasions of exotic flammable
grasses (D'Antonio and Vitousek 1992; Pausas and Keeley 2014), and global warming
(Bradstock et al. 2014; Westerling et al. 2006). The latter would have the most profound
long-term impact, as rainfall variability and hence extreme fire conditions will increase in all
modelled scenarios (Flannigan et al. 2013). For wildlife, this means that not only will animals
have to withstand the direct effects of these fires (e.g. Leahy et al. 2014; Morris et al. 2011),
but potentially up to a five-fold increase in predator density as individuals from elsewhere
come in to hunt the exposed animals. Our new understanding of the behaviour of feral cats
provides even stronger grounds for reducing the frequency and extent of intense fires
wherever possible.
93
References
Banks, S.C., Dujardin, M., McBurney, L., Blair, D., Barker, M., and Lindenmayer, D.B.
(2011) Starting points for small mammal population recovery after wildfire: recolonisation or
residual populations? Oikos 120(1), 26–37.
Birtsas, P., Sokos, C., and Exadactylos, S. (2012) Carnivores in burned and adjacent
unburned areas in a Mediterranean ecosystem. Mammalia 76(4), 407–415.
Bradstock, R.A., Penman, T., Boer, M., Price, O., and Clarke, H. (2014) Divergent responses
of fire to recent warming and drying across south‐eastern Australia. Global Change Biology
20(5), 1412–1428.
Brook, B.W., Sodhi, N.S., and Bradshaw, C.J.A. (2008) Synergies among extinction drivers
under global change. Trends in Ecology & Evolution 23(8), 453–460.
Crowner, A.W., and Barrett, G.W. (1979) Effects of fire on the small mammal component of
an experimental grassland community. Journal of Mammalogy 60(4), 803–813.
D'Antonio, C.M., and Vitousek, P.M. (1992) Biological invasions by exotic grasses, the
grass/fire cycle, and global change. Annual Review of Ecology and Systematics 23(1), 63–87.
Dumas, C. (1992) Object permanence in cats (Felis catus): An ecological approach to the
study of invisible displacements Journal of Comparative Psychology 106(4), 404–410.
Fauchald, P., and Tveraa, T. (2003) Using first passage time in the analysis of area-restricted
search and habitat selection. Ecology 84, 282–288.
Fisher, D.O., Johnson, C.N., Lawes, M.J., Fritz, S.A., McCallum, H.I., Blomberg, S.P., Van
Der Wal, J., Abbott, B., Frank, A., Legge, S., Letnic, M., Thomas, C.R., Fisher, A., Gordon,
I.J., and Kutt, A.S. (2013) The current decline of tropical marsupials in Australia: is history
repeating? Global Ecology and Biogeography 23(2), 181–190.
Flannigan, M., Cantin, A.S., de Groot, W.J., Wotton, M., Newbery, A., and Gowman, L.M.
(2013) Global wildland fire season severity in the 21st century. Forest Ecology and
Management 294, 54–61.
Frank, A.S.K., Johnson, C.N., Potts, J., Alaric, F., Lawes, M.J., Woinarski, J.C.Z., Tuft, K.,
Radford, I., Gordon, I.J., Collis, M.-A., and Legge, S. (2014) Experimental evidence that
feral cats cause local extirpation of small mammals in Australia's tropical savanna. Journal of
Applied Ecology 51(6), 1486–1493.
Goulet, S. (1996) Activation of locations in working memory in cats. The Quarterly Journal
of Experimental Psychology Section B 49(1), 81–92.
Greenwood, P.J. (1980) Mating systems, philopatry and dispersal in birds and mammals.
Animal Behaviour 28(4), 1140–1162.
94
Hilborn, R., and Sinclair, A.R.E. (1979) A simulation of wildebeest population, other
ungulates, and their predators. In 'Serengeti: Dynamics of an ecosystem.' (Eds. ARE Sinclair
and M Norton-Griffiths) pp. 287–309 (University of Chicago Press: Chicago)
Hofer, H., and East, M.L. (1993a) The commuting system of Serengeti spotted hyaenas: how
a predator copes with migratory prey. II. Intrusion pressure and commuters' space use.
Animal Behaviour 46, 559–574.
Hofer, H., and East, M.L. (1993b) The commuting system of Serengeti spotted hyaenas: how
a predator copes with migratory prey. III. Attendance and maternal care. Animal Behaviour
46(3), 575–589.
Knick, S.T. (1990) Ecology of Bobcats relative to exploitation and a prey decline in
Southeastern Idaho. Wildlife Monographs 108, 3–42.
Korpimäki, E., Brown, P.R., Jacob, J., and Pech, R.P. (2004) The puzzles of population
cycles and outbreaks of small mammals solved? Bioscience 54(12), 1071–1079.
Krebs, C.J., Boonstra, R., Boutin, S., and Sinclair, A.R.E. (2001) What drives the 10-year
cycle of snowshoe hares? Bioscience 51(1), 25–35.
Leahy, L., Legge, S., Tuft, K., McGregor, H.W., Barmuta, L., Jones, M.H., and Johnson,
C.N. (2014) Amplified predation after fire drives declines of small mammals in Australia’s
tropical savannas. Austral Ecology In review.
Liberg, O., Sandell, M., Pontier, D., and Natoli, E. (2000) Density, spatial organisation and
reproductive tactics in the domestic cat and other felids. In 'The domestic cat: the biology of
its behaviour.' (Eds. DC Turner and P Bateson) pp. 119–147. (Cambridge University Press:
Cambridge)
MacDonald, D.W. (1983) The ecology of carnivore social behaviour. Nature 301(5899),
379–384.
Mills, L.S., and Knowlton, F.F. (1991) Coyote space use in relation to prey abundance.
Canadian Journal of Zoology 69(6), 1516–1521.
Morris, G., Hostetler, J.A., Oli, M.K., and Conner, L.M. (2011) Effects of predation, fire, and
supplemental feeding on populations of two species of Peromyscus mice. Journal of
Mammalogy 92(5), 934–944.
Nams, V.O., and Bourgeois, M. (2004) Fractal analysis measures habitat use at different
spatial scales: an example with American marten. Canadian Journal of Zoology 82, 1738–
1747.
Norrdahl, K., and Korpimäki, E. (1996) Do nomadic avian predators synchronize population
fluctuations of small mammals? A field experiment. Oecologia 107(4), 478–483.
Packer, C., D., S., and Pusey, A.E. (1990) Why lions form groups: food is not enough. The
American Naturalist 136(1), 1–19.
95
Pausas, J.G., and Keeley, J.E. (2014) Abrupt climate-independent fire regime changes.
Ecosystems 17(6), 1109–1120.
R Development Core Team (2008) R: a language and environment for statistical computing.
In '.' (R Foundation for Statistical Computing: Vienna)
Russell-Smith, J., Yates, C.J., Edwards, A., Allan, G.E., Cook, G.D., Cooke, P., Craig, R.,
Heath, B., and Smith, R. (2003) Contemporary fire regimes of northern Australia, 1997–
2001: change since Aboriginal occupancy, challenges for sustainable management.
International Journal of Wildland Fire 12, 283–297.
Samelius, G., Andrén, H., Liberg, O., Linnell, J.D.C., Odden, J., Ahlqvist, P., Segerström, P.,
and Sköld, K. (2012) Spatial and temporal variation in natal dispersal by Eurasian lynx in
Scandinavia. Journal of Zoology 286(2), 120–130.
Sih, A. (2005) Predator-prey space use as an emergent outcome of a behavioral response
race. In 'Ecology of predator-prey interactions.' (Eds. P Barbosa and I Castellanos) pp. 256–
278. (Oxford University Press: Oxford)
Therneau, T.M. (2014) A package for survival analysis in R package. In '.' 2.37-7 edn.)
Tsukada, H. (1997) A division between foraging range and territory related to food
distribution in the red fox. Journal of Ethology 15(1), 27–37.
Turchin, P. (1998) 'Quantitative analysis of movement: measuring and modeling population
redistribution in animals and plants.' (Sinauer Associates Sunderland)
Westerling, A.L., Hidalgo, H.G., Cayan, D.R., and Swetnam, T.W. (2006) Warming and
earlier spring increase western US forest wildfire activity. Science 313(5789), 940–943.
Woinarski, J.C.Z., Legge, S., Fitzsimons, J.A., Traill, B.J., Burbidge, A.A., Fisher, A., Firth,
R.S.C., Gordon, I.J., Griffiths, A.D., Johnson, C.N., McKenzie, N.L., Palmer, C., Radford, I.,
Rankmore, B., Ritchie, E.G., Ward, S., and Ziembicki, M. (2011a) The disappearing mammal
fauna of northern Australia: context, cause, and response. Conservation Letters 4(3), 1–10.
Woinarski, J.C.Z., Ward, S., Mahney, T., Bradley, J., Brennan, K., Ziembicki, M., and Fisher,
A. (2011b) The mammal fauna of the Sir Edward Pellew island group, Northern Territory,
Australia: refuge and death-trap. Wildlife Research 38, 307–322.
Wolff, J.O. (1997) Population regulation in mammals: an evolutionary perspective. Journal
of Animal Ecology 66(1), 1–13.
Wolff, J.O., and Peterson, J.A. (1998) An offspring-defense hypothesis for territoriality in
female mammals. Ethology, Ecology & Evolution 10(3), 227–239.
Young, A.J., and Monfort, S.L. (2009) Stress and the costs of extra-territorial movement in a
social carnivore. Biology Letters 5(4), 439–441
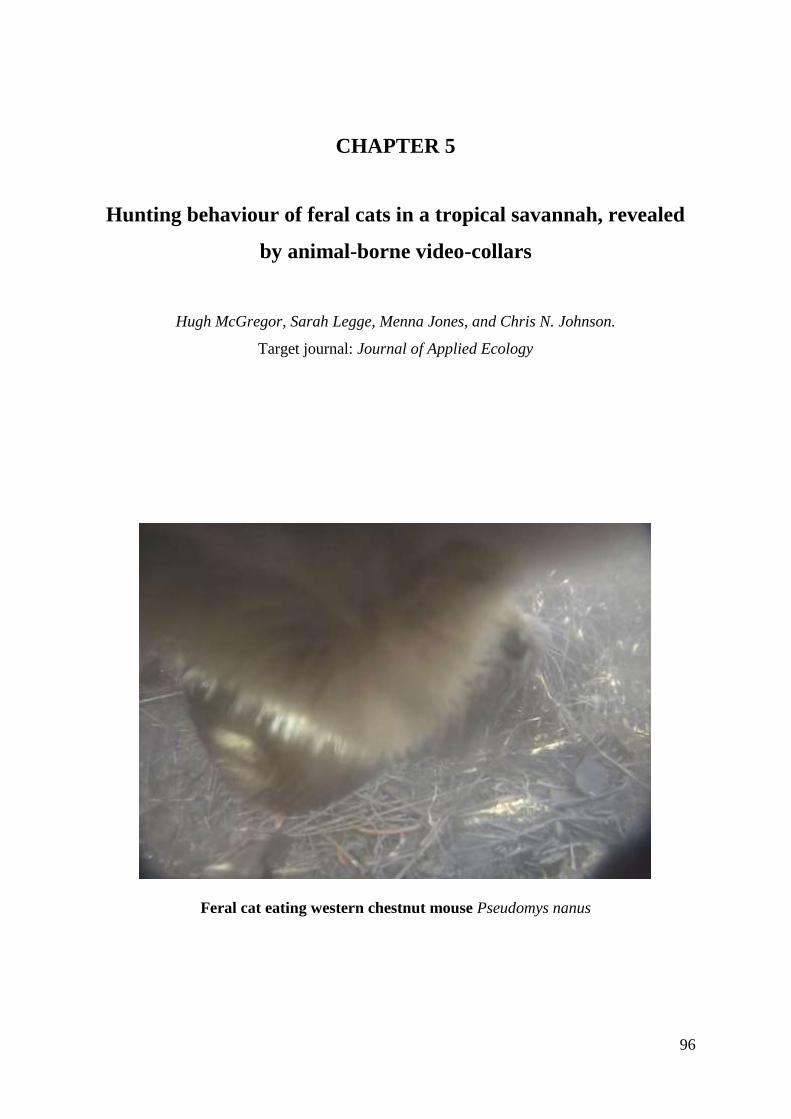
96
CHAPTER 5
Hunting behaviour of feral cats in a tropical savannah, revealed
by animal-borne video-collars
Hugh McGregor, Sarah Legge, Menna Jones, and Chris N. Johnson.
Target journal: Journal of Applied Ecology
Feral cat eating western chestnut mouse Pseudomys nanus
97
Abstract
Predation by invasive predators is a major threat to endangered wildlife. Unfortunately, there
are many gaps in our understanding of this process due to the difficulties in observing
predation events. Using small video cameras, we address three such knowledge gaps; i) kill
rates of feral cats, ii) whether predation impacts are a function of space and/or time, and iii)
variation of predation success between different microhabitats (open areas, dense grass and
complex rocks).
We deployed modified GoPro video collars on 23 feral cats, and acquired 98 hours of footage
of cat behaviour, and 101 hunting events.
Kill rates of feral cats were 7 per day, and 30 % of prey were not eaten. Predation rates were
a function of space, that is, the further a cat travelled, the more hunting events were recorded.
Hunting success was highly dependent on microhabitat structure, significantly increasing
from 17 % in habitats with dense grass or complex rocks to 70 % in open areas.
Our results confirm that feral cats impose high predation rates, and conduct surplus killing.
Predation rates were a function of space, so studies investigating the impacts of cats should
assess their spatial ecology, not time spent in different areas. The greater kill rates in open
micro-habitats has broad implications for management of macro-habitats, as it demonstrates
that maintaining vegetation cover can protect species from cat predation.
98
Introduction
Predation is a dominant driver of prey population dynamics and the behaviour of prey. Shifts
in predator-prey interactions can cause extinction of prey populations (Savidge 1987), with
cascading impacts for entire ecosystems (Ripple et al. 2014). The strength of the effects of a
predator on a prey population is governed by the size of the predator population relative to
the prey, the availability of alternative prey, the preferences of predators for particular prey,
and the hunting success of individual predators. While determining the size of predator
populations might be straightforward, measuring hunting preferences and success is far more
difficult, especially for mammalian predators. This is largely due to the difficulty of directly
observing the behaviour of mammalian predators without disturbing either the predator or
prey and thereby altering their behaviour. Also, when direct observation is possible, it is
typically biased to locations of high visibility. Methods such as snow-tracking can partially
overcome these problems (Helldin et al. 2006; Husseman et al. 2003), yet this method is
limited to certain ecosystems. Predation events can be determined using GPS tracking of
large carnivores that spend long periods at a kill (Hebblewhite et al. 2005; Mattisson et al.
2011), but predation of smaller prey with short consumption time will often be missed. A
promising alternative solution for documenting hunting preferences and success is offered by
animal-borne video-cameras (Moll et al. 2007).
Animal-borne video cameras have been extensively used to measure predator behaviour and
kill-rates in aquatic ecosystems (Arthur et al. 2007; Heithaus et al. 2002), as the large size of
some marine predators and the neutralising effects of buoyancy on weight of animal-borne
cameras enables large camera packages to be used. Recent advances in miniaturising video
cameras have allowed their deployment on terrestrial animals without significantly affecting
behaviour (Moll et al. 2009), and provide an opportunity to directly observe predation from
the predator’s point of view. For example, small packages have been created for the study of
predation rates by domestic cats Felis catus, taking advantage of the fact that the ease with
which the animals can be handled means that batteries can be replaced frequently, so that
small batteries are feasible (Loyd et al. 2013). Deploying comparable cameras on free-living
mammalian predators in terrestrial systems remains a major challenge.
99
Predation by feral cats is a major ecological threat to small vertebrates worldwide (Denny
and Dickman 2010; Loss et al. 2012; Medina et al. 2011; Woods et al. 2003). Woinarski et
al. (2014) identified predation by feral cats as the single greatest contemporary threat to
native mammals in Australia. This problem may currently be particularly severe in northern
Australia, where there is evidence that feral cats are causing severe population declines of
native small mammals (Fisher et al. 2013; Frank et al. 2014; Woinarski et al. 2011). Feral
cats occur at low density in the savannas of northern Australia (Chapter 2) and they are wary
and therefore extremely difficult to observe. The lack of information on the hunting
behaviour of feral cats, and the kill-rates that individual cats are able to accomplish, means
that we have very little capacity to predict or model the impacts of feral cats on populations
of vulnerable prey, and to determine whether particular landscape features (some of which
are created by human manipulation of the environment) aid or hinder hunting success.
The demographic impacts of predation by cats cannot be accurately measured without
knowledge of kill rates. While these can be inferred from stomach contents, the period of
hunting represented by a stomach sample can only be guessed, and many food types, such as
bird eggs, are difficult to detect in stomach contents. Also, stomach contents do not register
surplus killing, where prey are killed but not eaten. Surplus killing has been recorded in
house cats (Barratt 1998; Loyd et al. 2013), and cats on islands with abundant food (Peck et
al. 2008), yet we have no evidence of surplus killing by feral cats in Australia (Short et al.
2002). Surplus killing could cause large increases in kill rates, with profound effects on prey
populations (Kruuk 1972).
Another gap in information on cat hunting is that most studies on the impacts of feral cats
assume that areas of greater activity correspond with highest predatory impacts (Barratt 1997;
Brook et al. 2012, Chapter 3; Jones and Coman 1982; Kennedy et al. 2012; Moseby et al.
2009). This assumption has never been investigated nor substantiated. We do not know
whether cats hunt all the time, or only during specific bouts of hunting activity (e.g. Bailey
and Thompson 2006). Also, we do not know whether hunting impacts are defined by space
use, time, or a product of the two. This is especially important to studies of habitat use by
cats, as different sampling methods and analyses are sensitive to space and/or time. For
example, if an animal moves fast and far over habitat A, but slow and short over habitat B
(see Figure 1), different analysis would come to different conclusions of preference. In this
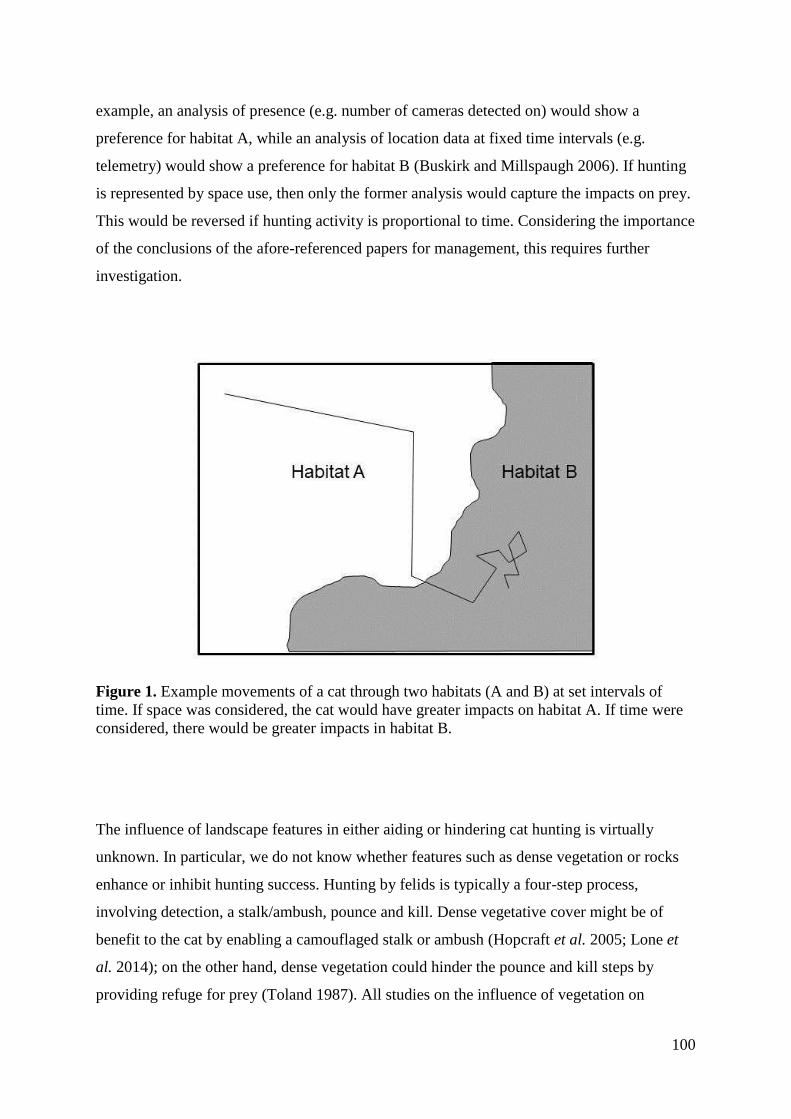
100
example, an analysis of presence (e.g. number of cameras detected on) would show a
preference for habitat A, while an analysis of location data at fixed time intervals (e.g.
telemetry) would show a preference for habitat B (Buskirk and Millspaugh 2006). If hunting
is represented by space use, then only the former analysis would capture the impacts on prey.
This would be reversed if hunting activity is proportional to time. Considering the importance
of the conclusions of the afore-referenced papers for management, this requires further
investigation.
Figure 1. Example movements of a cat through two habitats (A and B) at set intervals of
time. If space was considered, the cat would have greater impacts on habitat A. If time were
considered, there would be greater impacts in habitat B.
The influence of landscape features in either aiding or hindering cat hunting is virtually
unknown. In particular, we do not know whether features such as dense vegetation or rocks
enhance or inhibit hunting success. Hunting by felids is typically a four-step process,
involving detection, a stalk/ambush, pounce and kill. Dense vegetative cover might be of
benefit to the cat by enabling a camouflaged stalk or ambush (Hopcraft et al. 2005; Lone et
al. 2014); on the other hand, dense vegetation could hinder the pounce and kill steps by
providing refuge for prey (Toland 1987). All studies on the influence of vegetation on
101
predation either come from large felids (e.g. lions Panthera leo; Hopcraft et al. 2005; Loarie
et al. 2013) or use inferences from broad patterns of prey mortality in different habitats
(Conner et al. 2011; Moreno et al. 1996). Understanding how vegetation structure affects the
hunting success of cats is essential if we are to determine whether management of vegetation
can change the impacts of cats on populations of vulnerable prey species.
In this study, we first show that animal-borne video cameras can document the behaviour and
hunting success of feral cats, even in cases where footage is acquired within six hours of
release from capture. First, we document the activity budgets of feral cats, Then, we use
video footage to address each of the knowledge gaps discussed above, that is, to:
(i) measure kill rates accomplished by free-ranging feral cats, and test for surplus killing;
(ii) assess whether predatory impacts were a function of space, time, or both. The time spent
moving (a proxy for distance covered) will be compared to the number of predation events. If
impacts are a function of space, we would expect a strong positive correlation with an
intercept around zero (i.e. no movement = no predation impacts), whilst for time we would
expect a weak correlation and an intercept of more than zero (predation impacts relate to
where cats spend the most time);
(iii) compare the hunting success of cats in contrasting open and dense vegetation.
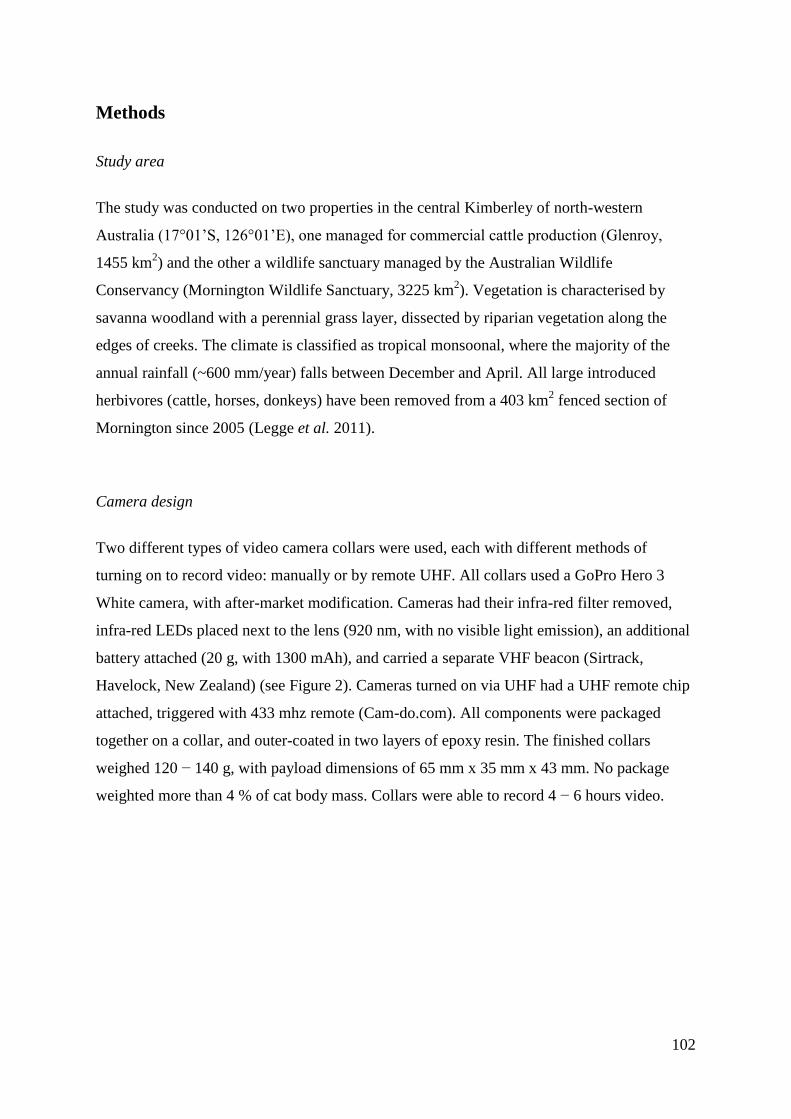
102
Methods
Study area
The study was conducted on two properties in the central Kimberley of north-western
Australia (17°01’S, 126°01’E), one managed for commercial cattle production (Glenroy,
1455 km2) and the other a wildlife sanctuary managed by the Australian Wildlife
Conservancy (Mornington Wildlife Sanctuary, 3225 km2). Vegetation is characterised by
savanna woodland with a perennial grass layer, dissected by riparian vegetation along the
edges of creeks. The climate is classified as tropical monsoonal, where the majority of the
annual rainfall (~600 mm/year) falls between December and April. All large introduced
herbivores (cattle, horses, donkeys) have been removed from a 403 km2 fenced section of
Mornington since 2005 (Legge et al. 2011).
Camera design
Two different types of video camera collars were used, each with different methods of
turning on to record video: manually or by remote UHF. All collars used a GoPro Hero 3
White camera, with after-market modification. Cameras had their infra-red filter removed,
infra-red LEDs placed next to the lens (920 nm, with no visible light emission), an additional
battery attached (20 g, with 1300 mAh), and carried a separate VHF beacon (Sirtrack,
Havelock, New Zealand) (see Figure 2). Cameras turned on via UHF had a UHF remote chip
attached, triggered with 433 mhz remote (Cam-do.com). All components were packaged
together on a collar, and outer-coated in two layers of epoxy resin. The finished collars
weighed 120 − 140 g, with payload dimensions of 65 mm x 35 mm x 43 mm. No package
weighted more than 4 % of cat body mass. Collars were able to record 4 − 6 hours video.
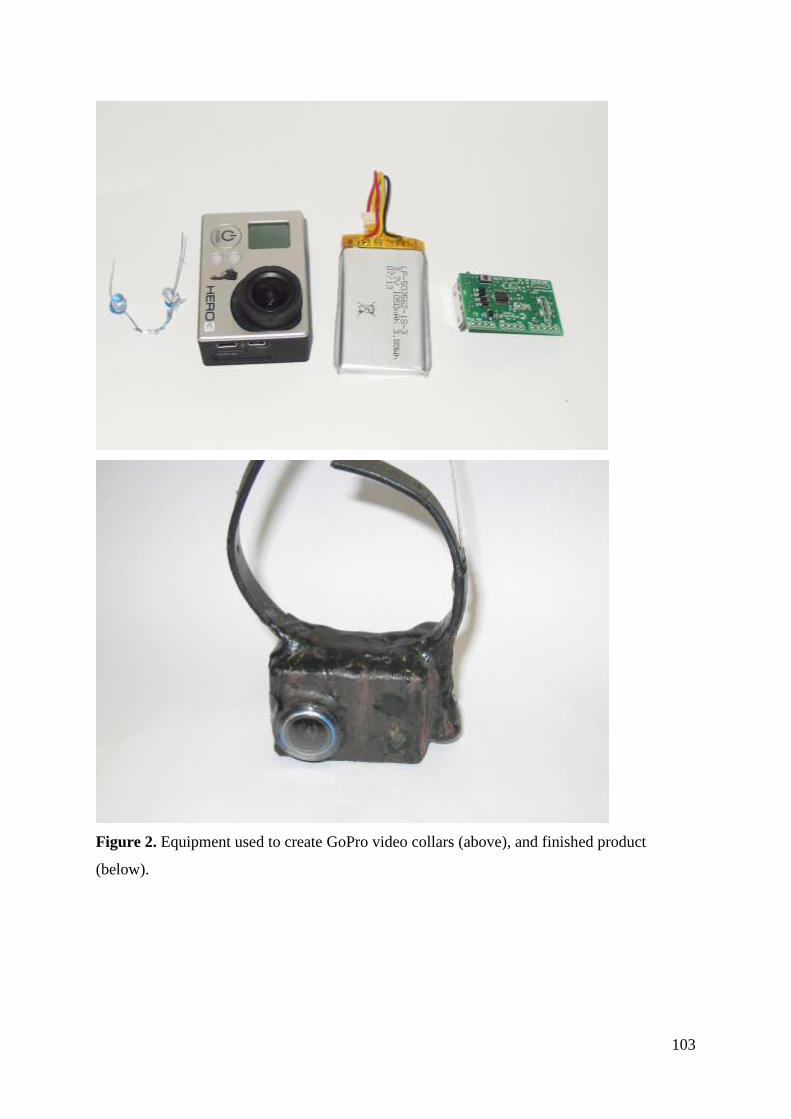
103
Figure 2. Equipment used to create GoPro video collars (above), and finished product
(below).
104
Deployment
Cameras were deployed on cats that had previously been captured for a study on habitat
selection (Chapter 3), and had been carrying a GPS collar weighing 110 g for at least a month
(that is, they were accustomed to wearing a collar of similar weight). Each cat was re-
captured with the assistance of muzzled dogs trained to locate and chase them up a tree. Once
treed, cats were sedated with a dart containing the sedative Zolotil at a rate of 0.5 cc / kg shot
from a Pnue-Dart X-calibre C02 dart-rifle, then caught in a sheet stretched between two
people as they fell from the tree. The GPS collar was removed and the camera-collar
attached, and each cat was released at point of capture once the sedative had worn off (4 − 6
hrs later). In 14 deployments, cameras were turned on just before release. To account for the
possibility that behaviour immediately after release was abnormal, on nine deployments we
used cameras with a switch that could be activated remotely 2 − 10 days after capture. In
such instances, we either approached quietly to 100 m and activated the camera via UHF
remote, or used an automatic switch that was placed within the cat’s home-range, which
activated the camera when it came within 100 m of the station. Cats were re-caught 7 − 30
days later using the same methods to retrieve cameras and download footage.
Footage review
After cats were recaptured and collars retrieved, footage recorded pre-release was discarded.
Post-release footage was scanned and classified into seven behaviour states:
Sleep: No sign of consciousness, only occasional shifts of posture
Rest: No change of position, but signs of alertness and movement.
Grooming: Licking fur or scratching
Drinking
Walking: steady walking of less than two steps per second
Running: vigorous movement of more than two steps per second
Hunting: Any behaviour where a cat appeared to have detected prey, usually
characterised by a still period of stalking followed by a pounce or prey retrieval;
however, some other unambiguous prey hunting behaviour was witnessed (e.g. cat
walking up to birds eggs and eating them).
105
In classifying behaviour, brief switches in behaviour (states that lasted for less than 10
seconds, before reverting to the previous behaviour) were not recorded, because this level of
detail was considered unnecessary. The first 30 minutes post-release was discarded, as cats
were generally running away. To test for other distortions of behaviour due to capture and
release, we compared the proportion of each behaviour from footage acquired less than eight
hours to that obtained from cameras remotely activated more than 2 days post release using a
MANOVA (R Development Core Team 2008).
All successful and unsuccessful predation events were examined in further detail. We
recorded the behaviour state (as above) of the cat at the time the prey was apparently
detected, whether the cat initiated a stalk or pounce, diel period (day, night or 1 hr either side
of sunrise or sunset), the species of prey where possible, success of hunt (whether the prey
was killed), details of prey consumption, and micro-habitat. Micro-habitat was recorded for
the area of the stalk, and approximately 50 cm around the point of predation event, based on
footage from the camera. For both, microhabitat was divided into three categories; open
(little/no grass above 10 cm, no rocks with crevices or caves), grass tussocks (any grass
above 10 cm) and rock area (rocks with noticeable crevices or caves). Only microhabitat
could be considered, as nocturnal footage was limited to the area illuminated by the LED in
front of the camera (~1 m). A demonstration of how microhabitat was assessed in provided in
Appendix 2.
To answer aims (i), (ii) and (iii), we conducted the following analyses:
i) Analysis of kill rates
To measure kill rates, we calculated average hunting per day as the number of kills for each
deployment, and presented this as kills per day. Animals killed but not consumed we
considered as surplus killing.
ii) Predation impacts against movement
To determine whether predation impacts of cats were a function of space and/or time, both
successful and unsuccessful events were considered. Time spent hunting but not moving was
excluded from each hour, so if a cat only rested and hunted, that would count as zero
movement. For every hour of footage we compared the time spent moving (a proxy for
distance covered) against the number of predation events. Both variables were square-root
106
transformed to assume normality. As some individual cats spent more time hunting than
others (Churcher and Lawton 1987; Loyd et al. 2013), data were analysed using a linear
mixed effects model (Pinheiro et al. 2014) with individual cats as the error term.
iii) Predation success and habitat
To measure the influence on predation success of diel period, stalk microhabitat, and prey
location microhabitat, we created multiple generalised linear models with a binomial form.
Instances where food was acquired but no stalk or pounce was initiated (e.g. eating birds
eggs) were not considered in this analysis. We did not include identities of individual cats as
error terms, as unlike the time spent hunting, variation in hunting success between individual
cats contributed very little to the overall variation (< 4 %). Models were created with each
variable and their combinations, and we determined which variables best modelled predation
success within an information theory framework, calculating model weights and the relative
importance of variables on the entire model set included in the analysis.
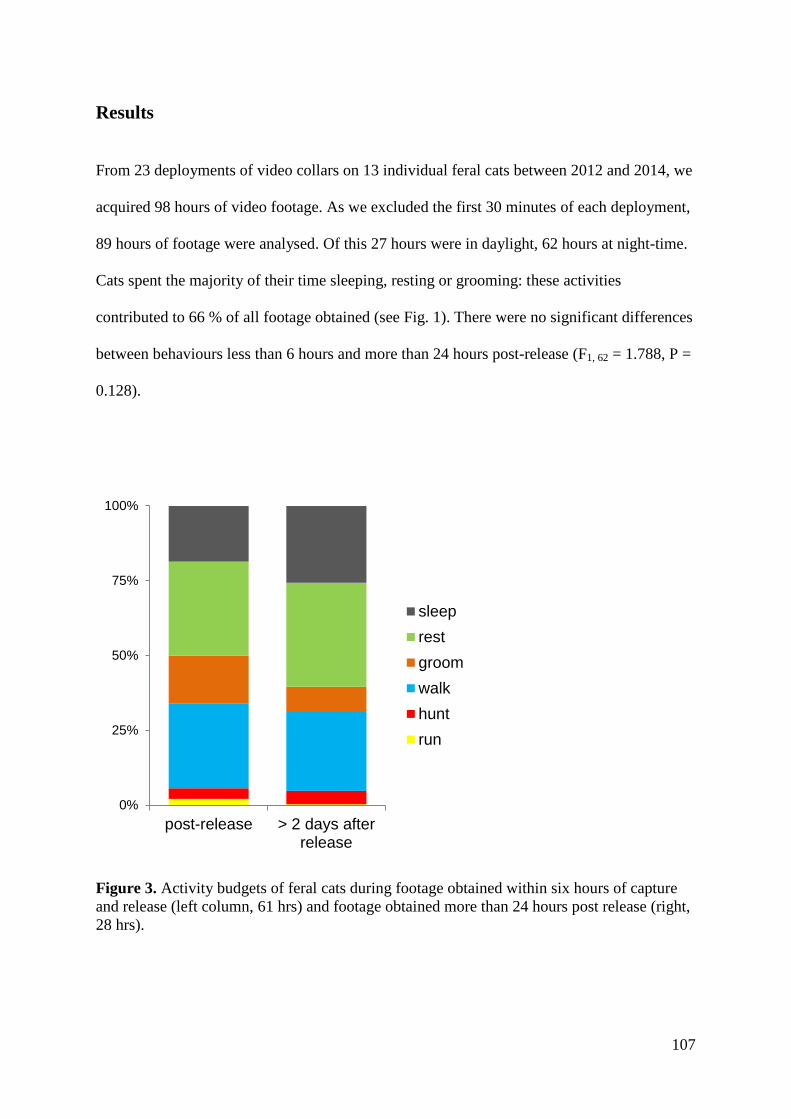
107
Results
From 23 deployments of video collars on 13 individual feral cats between 2012 and 2014, we
acquired 98 hours of video footage. As we excluded the first 30 minutes of each deployment,
89 hours of footage were analysed. Of this 27 hours were in daylight, 62 hours at night-time.
Cats spent the majority of their time sleeping, resting or grooming: these activities
contributed to 66 % of all footage obtained (see Fig. 1). There were no significant differences
between behaviours less than 6 hours and more than 24 hours post-release (F1, 62 = 1.788, P =
0.128).
Figure 3. Activity budgets of feral cats during footage obtained within six hours of capture
and release (left column, 61 hrs) and footage obtained more than 24 hours post release (right,
28 hrs).
0%
25%
50%
75%
100%
post-release > 2 days afterrelease
sleep
rest
groom
walk
hunt
run
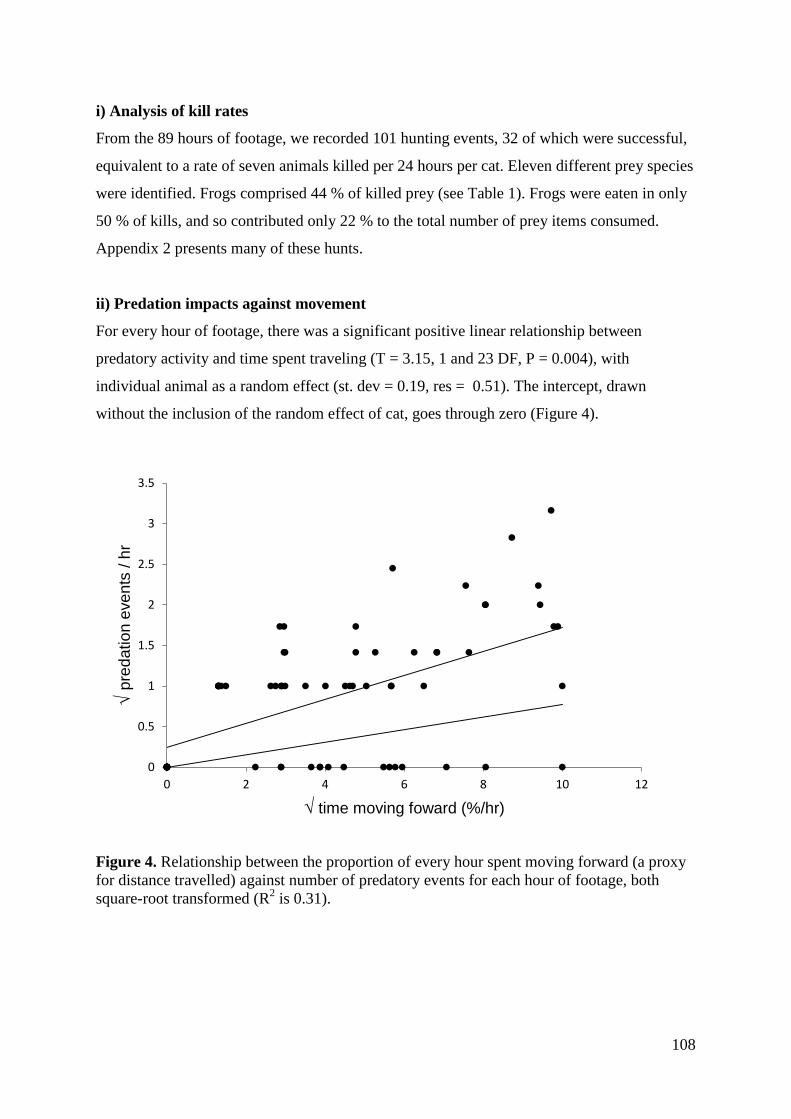
108
i) Analysis of kill rates
From the 89 hours of footage, we recorded 101 hunting events, 32 of which were successful,
equivalent to a rate of seven animals killed per 24 hours per cat. Eleven different prey species
were identified. Frogs comprised 44 % of killed prey (see Table 1). Frogs were eaten in only
50 % of kills, and so contributed only 22 % to the total number of prey items consumed.
Appendix 2 presents many of these hunts.
ii) Predation impacts against movement
For every hour of footage, there was a significant positive linear relationship between
predatory activity and time spent traveling (T = 3.15, 1 and 23 DF, P = 0.004), with
individual animal as a random effect (st. dev = 0.19, res = 0.51). The intercept, drawn
without the inclusion of the random effect of cat, goes through zero (Figure 4).
Figure 4. Relationship between the proportion of every hour spent moving forward (a proxy
for distance travelled) against number of predatory events for each hour of footage, both
square-root transformed (R2 is 0.31).
0
0.5
1
1.5
2
2.5
3
3.5
0 2 4 6 8 10 12
√ p
red
atio
n e
ve
nts
/ h
r
√ time moving foward (%/hr)
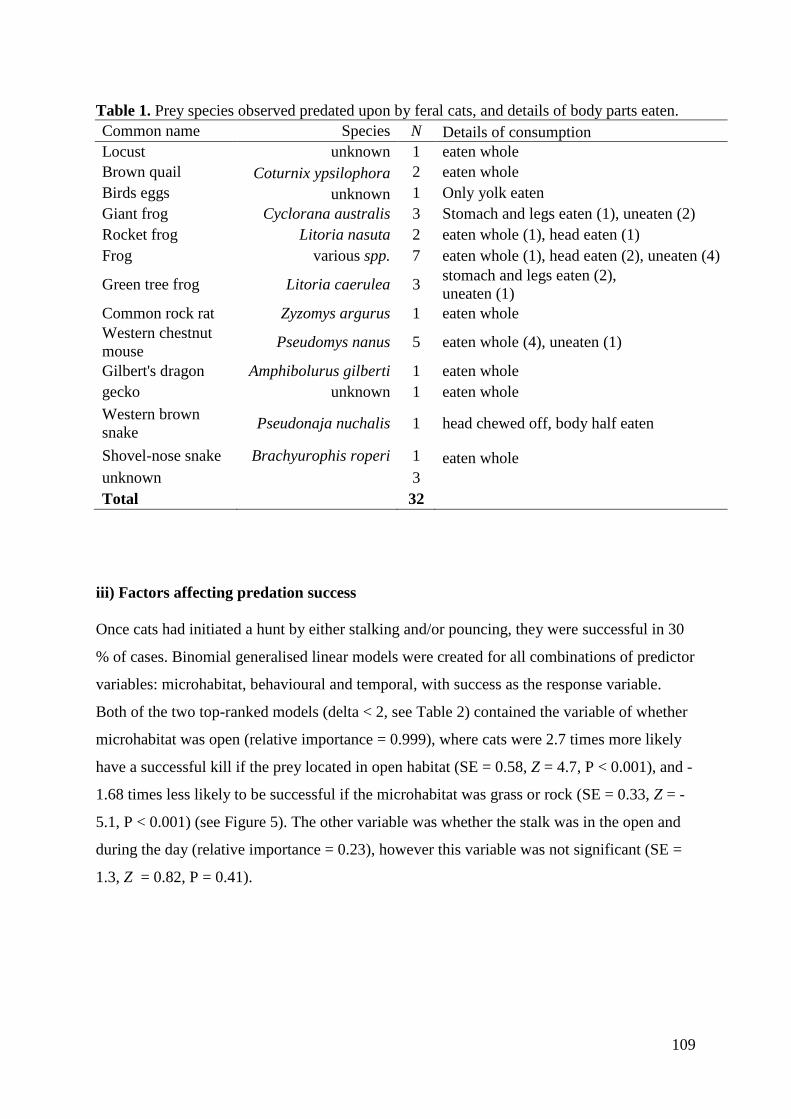
109
Table 1. Prey species observed predated upon by feral cats, and details of body parts eaten.
Common name Species N Details of consumption
Locust unknown 1 eaten whole
Brown quail Coturnix ypsilophora 2 eaten whole
Birds eggs unknown 1 Only yolk eaten
Giant frog Cyclorana australis 3 Stomach and legs eaten (1), uneaten (2)
Rocket frog Litoria nasuta 2 eaten whole (1), head eaten (1)
Frog various spp. 7 eaten whole (1), head eaten (2), uneaten (4)
Green tree frog Litoria caerulea 3 stomach and legs eaten (2),
uneaten (1)
Common rock rat Zyzomys argurus 1 eaten whole
Western chestnut
mouse Pseudomys nanus 5 eaten whole (4), uneaten (1)
Gilbert's dragon Amphibolurus gilberti 1 eaten whole
gecko unknown 1 eaten whole
Western brown
snake Pseudonaja nuchalis 1 head chewed off, body half eaten
Shovel-nose snake Brachyurophis roperi 1 eaten whole
unknown
3
Total 32
iii) Factors affecting predation success
Once cats had initiated a hunt by either stalking and/or pouncing, they were successful in 30
% of cases. Binomial generalised linear models were created for all combinations of predictor
variables: microhabitat, behavioural and temporal, with success as the response variable.
Both of the two top-ranked models (delta < 2, see Table 2) contained the variable of whether
microhabitat was open (relative importance = 0.999), where cats were 2.7 times more likely
have a successful kill if the prey located in open habitat (SE = 0.58, Z = 4.7, P < 0.001), and -
1.68 times less likely to be successful if the microhabitat was grass or rock (SE = 0.33, Z = -
5.1, P < 0.001) (see Figure 5). The other variable was whether the stalk was in the open and
during the day (relative importance = 0.23), however this variable was not significant (SE =
1.3, Z = 0.82, P = 0.41).
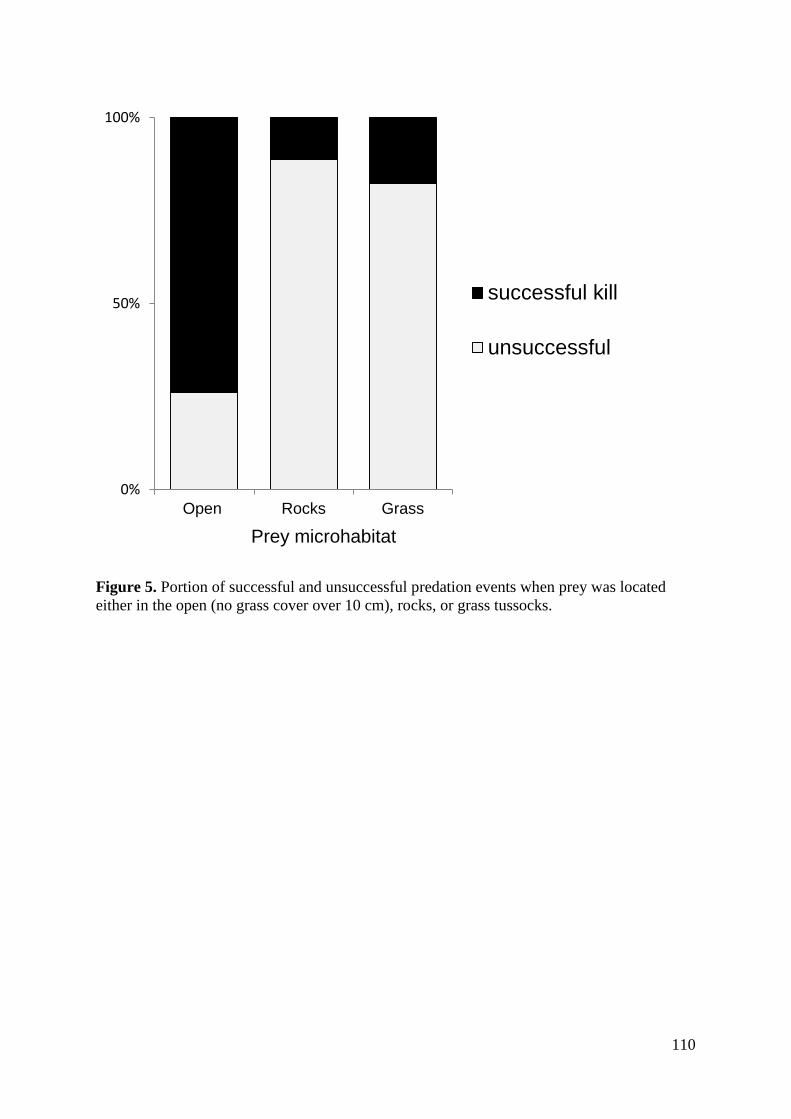
110
Figure 5. Portion of successful and unsuccessful predation events when prey was located
either in the open (no grass cover over 10 cm), rocks, or grass tussocks.
0%
50%
100%
Open Rocks Grass
Prey microhabitat
successful kill
unsuccessful
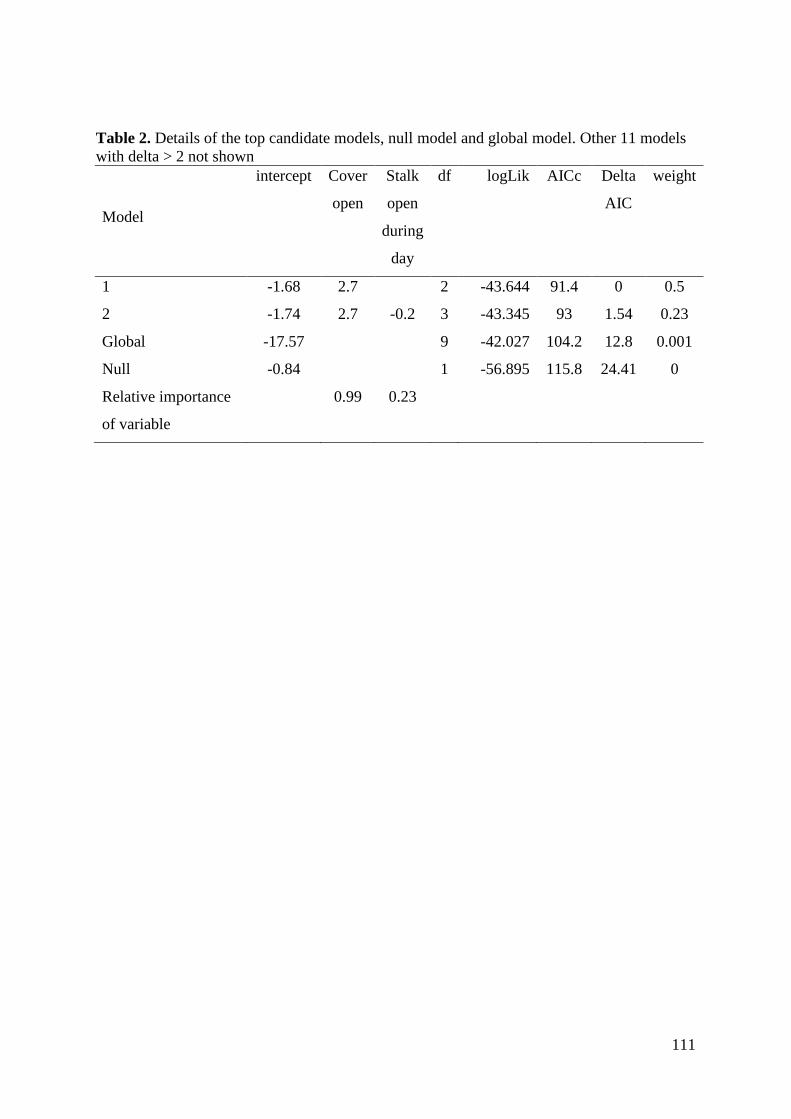
111
Table 2. Details of the top candidate models, null model and global model. Other 11 models
with delta > 2 not shown
Model
intercept Cover
open
Stalk
open
during
day
df logLik AICc Delta
AIC
weight
1 -1.68 2.7 2 -43.644 91.4 0 0.5
2 -1.74 2.7 -0.2 3 -43.345 93 1.54 0.23
Global -17.57 9 -42.027 104.2 12.8 0.001
Null -0.84 1 -56.895 115.8 24.41 0
Relative importance
of variable
0.99 0.23
112
Discussion
Using small video cameras attached to collars, we were able to document and quantify
hunting behaviour of feral cats in Australian savannahs. Cats were frequently observed
predating upon native wildlife, with 101 events observed. Of these, 30 % were successful,
similar to the 32 % success rate observed by the only other known such study on feral cats
(Konecny 1987). Most hunting events were initiated whilst cats were moving. From footage
of these hunting events, we were able to determine the importance of prey microhabitat as a
refuge from cat predation.
Whilst the GoPro camera collars we modified were reliable and adequate for this research,
they were not ideal. GoPro cameras are designed to maximise video footage quality at the
expense of battery life, so the footage acquired per deployment was minimal (4 – 6 hours).
Making the necessary modifications with battery extensions and infra-red capabilities is
delicate and time consuming (~ 7 hrs per camera). Similar and more efficient cameras have
been developed, such as KittyCams (Loyd et al. 2013), however, these were not available at
the time to other researchers. Other small cameras that were commercially available either
lacked the wide-angle lens, video quality, or memory storage capacities. There is enormous
need for further development of such animal-borne video technology and for it to become
more readily available. As we discuss below, even our limited length of footage was able to
provide critical data on gaps in our knowledge of cat hunting dynamics.
i) Analysis of kill rate
We recorded a hunting rate of seven successful kills per day. This demonstrates that feral cats
have a far greater impact on prey populations than domestic free-ranging cats. Loyd et al.
(2013) found kill rates of just 0.34 animals per night using animal-borne video cameras, over
20 times less than our reported kill rate. Kill rate is likely to vary across different regions as it
would be strongly related to prey availability, yet be constrained by the minimum number of
prey needed for a cat to stay alive. Cats are known to kill even when sated (Adamec 1976),
therefore their kill rate is likely to be much higher in areas of greater prey availability than
the rate recorded in this study of 30 %. Our results suggest that inferring kill rates from
stomach contents gives substantial underestimates, because at least 32 % of all recorded kills
113
were either not eaten, or only un-identifiable parts were eaten (e.g. frog intestines, or egg
yolk).
We recorded 11 different species as prey of feral cats. The dominant prey killed by cats were
frogs, contrasting with all other known studies of diets of feral cats in Australia, which
detected few or no frogs (Denny and Dickman 2010; Loyd et al. 2013; Martin et al. 1996).
This difference in results could be explained by the fact that few frogs were eaten whole and
hard parts were often not consumed, in which case predation would not be evident from
analysis of scats or stomach contents. Also, in the current study, many of the deployments
were carried out in the wet season, when frogs are highly abundant even away from standing
water. Snakes, ground-dwelling birds and small mammals were the other dominant prey
species, similar to other studies. Interestingly, feral cats appeared adept at distinguishing
between snake species. When the venomous western brown snake Pseudonaja nuchalis was
eaten, the cat spent almost 10 minutes chewing off the head, which was then discarded,
presumably to avoid ingestion of venom. However, the non-venomous shovel-nose snake
Brachyurophis roperi was eaten quickly whole.
The proportion of animals killed and not eaten (29 %) constituted surplus killing. This has
potentially worrying implications for kill rates in circumstances where prey are unable to
avoid predation, as kill rates appear not to be limited by the food requirements of the cat.
Such examples may include cats hunting small mammals after intense fires, where all ground
cover has been removed (Conner et al. 2011; Leahy et al. 2014). However, all unconsumed
prey bar one were frogs. Therefore, it is possible that the surplus killing recorded in this study
was related to some special feature of frogs, such as low nutritional value, or unpalatability
due to mild toxicity of substances produced by skin glands. Further video evidence will be
required to assess the rate of surplus killing in other prey.
Using results obtained here, we can estimate the kill rates imposed by the cat population of
the study area. Cat density over the two properties where we conducted this study is on
average 0.17 adult cats per km2 (SE 0.08). If each of these cats killed 7 animals a night, the
total kill would sum to over 2 million native animals killed each year across the 4680 km2
study area, making 1.2 animals killed per km2 each night.
114
ii) Hunting during different behaviours
Cats were most likely to hunt while walking, and there was a strong relationship between
distance travelled and number of predatory events. Also, when there was little movement,
there were few predation events. This provides weight for the hypothesis that predatory
impacts are largely a function of space, not time. In other words, the impacts of cats are
related to the distance over which they travel, rather than the time spent in any given spatial
unit. This highlights the need to incorporate behavioural states into studies of cat movements
(Patterson et al. 2008), so that the influence of areas in which cats spend much time but with
little movement is not inflated in analyses of the spatial distribution of predator pressure
(Buskirk and Millspaugh 2006). These findings suggest that the distribution of predation can
be inferred from data on movement and activity of cats (Chapter 3), although we defined
space in this study only as time spent traveling, and did not measure any other spatial aspects
like path tortuosity. Further research into relationships between predatory impacts and
movement characteristics is warranted (Maletzke et al. 2008; Weimerskirch et al. 2007).
iii) Factors affecting predation success
Microhabitat had a strong influence on hunting success. Feral cats were over three times
more likely to make a successful kill in open microhabitats versus grassy or rocky areas, once
a prey animal had been detected. Grass tussocks and rocks are thus highly valuable in
providing refuge for prey, and when present they protected against 80 % of observed
predation events. This corresponds with other studies of small mammal mortality in northern
Australia. Oakwood (2000) found northern quolls Dasyurus hallucatus living in rocky areas
were twice as likely to survive than those in unprotected habitats, whilst Leahy et al (2014)
found pale field rats Rattus tunneyi to be much more likely to be killed by predators if grass
cover had been removed by fire. There are limitations in applying these data solely to small
mammal predation, though, as the identity of the prey species from unsuccessful hunts is not
known. We suspect that there were prey species-specific biases in predation success between
microhabitats. For example, grass may not provide sufficient cover for larger animals (e.g.
snakes) to evade predation as they would be more easily extracted.
While the influence of microhabitat in protecting prey was clear, it requires careful
extrapolation to attribute these results to habitat types or conditions. As spatial movements of
115
cats were not recorded, we could not measure macrohabitat (e.g. whether the hunting was
attempted in spinifex woodland or riparian forests), and were therefore unable test its effects
on hunting success. A simple extrapolation could approximate this. We could estimate the
success rate for a cat (where success is defined as killing a prey individual once it was
detected) as the percent cover of grass and rock cover multiplied by the corresponding
predation success coefficient (-1.7), then adding the percent cover of open substrate
multiplied by its coefficient (2.7). If this were applied to habitats within our study area, it
would explain why cats in our study area selected strongly for recently burnt grasslands with
a high abundance of small mammals (Chapter 3). However, this does not take into account
many other factors, and will need to be field-tested.
The patterns reported here, of ground cover and rocks protecting prey from feral predators,
correspond with habitats that have retained threatened mammal species across Australia. It
suggests why structurally complex habitats that have complete cover of grass and shrubs have
retained threatened species extinct elsewhere on the mainland. One such example is the
Gilbert’s Potoroo Potorous tridaetylus at Two Peoples Bay (Sinclair et al. 1996), that was
once widespread but now only persists in long-unburnt coastal heaths. If this pattern of
greater predation success in open areas applies elsewhere in Australia, it would explain why
native mammal extinctions were more prevalent in regions with more open habitats such as
the arid zone (Johnson 2006; Smith and Quin 1996). These findings have clear implications
for the conservation of species threatened by feral cats: management to maintain the cover
and density of ground vegetation can be used to reduce the impact of feral cats and, perhaps,
allow vulnerable prey to coexist with this predator.
Conclusions
The results from this study contrast with evidence obtained from larger carnivores. Kill rates
are much lower for all recorded large carnivores, with lynx Lynx lynx as low as 0.1 to 0.3 per
day (Mattisson et al. 2011) and lions at 0.4 per day (Orsdol 1984). Capturing prey is a much
more intensive activity, and a single large prey can provide enough food for many days.
Hunting may not only be a function of space use, as some larger predators either spend hours
in ambush for prey (Hart et al. 1996; Orsdol 1984), or will only hunt during specific
behaviours whilst moving (Maletzke et al. 2008). And when predators and prey are roughly
116
the same size, there are very different patterns between predation success and landscape
factors. For example, dense vegetation assists hunting for most African large cats (Balme et
al. 2007; Hayward et al. 2006; Hopcraft et al. 2005), as it enables camouflage during a stalk.
Alternatively, we anticipate most of the patterns observed here are likely to be applicable to
other small predators, as most are opportunistic hunters and preferentially hunt prey much
smaller than themselves (Gittleman 1985). This means that most would require high kill rates
to acquire enough energy to survive (Carbone et al. 1999). Predation pressures would be a
function of space, as few small predators are known to do protracted ambushes where they
would be still for a vast amount of time (Gittleman 1985; Kitchener 1991). And patterns of
decreased predation success in more dense grassy and complex rocky microhabitats are likely
to be consistent, as their prey could move and take refuge in such areas yet the predators
cannot. However, there is little evidence for this at present, and hopefully more researchers in
other systems can have access to animal-borne video for deployment on other terrestrial
predators and further our understanding of hunting dynamics.
117
Reference list
Adamec, R.E. (1976) The interaction of hunger and preying in the domestic cat (Felis catus):
An adaptive hierarchy? Behavioral Biology 18(2), 263–272.
Arthur, K.E., O'Neil, J.M., Limpus, C.J., Abernathy, K.J., and Marshall, G.J. (2007) Using
animal-borne imaging to assess green turtle (Chelonia mydas) foraging ecology in Moreton
Bay, Australia. Marine Technology Society Journal 41(4), 9–13.
Bailey, H., and Thompson, P. (2006) Quantitative analysis of bottlenose dolphin movement
patterns and their relationship with foraging. Journal of Animal Ecology 75, 456–465.
Balme, G., Hunter, L., and Slotow, R. (2007) Feeding habitat selection by hunting leopards
Panthera pardus in a woodland savanna: prey catchability versus abundance. Animal
Behaviour 74(3), 589–598.
Barratt, D.G. (1997) Home range size, habitat utilisation and movement patterns of suburban
and farm cats Felis catus. Ecography 20(3), 271–280.
Barratt, D.G. (1998) Predation by house cats, Felis catus (L.), in Canberra, Australia. II.
Factors affecting the amount of prey caught and estimates of the impact on wildlife. Wildlife
Research 25(5), 475–487.
Brook, L.A., Johnson, C.N., and Ritchie, E.G. (2012) Effects of predator control on
behaviour of an apex predator and indirect consequences for mesopredator suppression.
Journal of Applied Ecology 49(6), 1278–1286.
Buskirk, S.W., and Millspaugh, J.J. (2006) Metrics for studies of resource selection. Journal
of Wildlife Management 70(2), 358–366.
Carbone, C., Mace, G.M., Roberts, S.C., and Macdonald, D.W. (1999) Energetic constraints
on the diet of terrestrial carnivores. Nature 402(6759), 286–288.
Churcher, P.B., and Lawton, J.H. (1987) Predation by domestic cats in an English village.
Journal of Zoology 212(3), 439–455.
Conner, L.M., Castleberry, S.B., and Derrick, A.M. (2011) Effects of mesopredators and
prescribed fire on hispid cotton rat survival and cause-specific mortality. Journal of Wildlife
Management 75(4), 938–944.
Denny, E.A., and Dickman, C.R. (2010) Review of cat ecology and management strategies in
Australia. Invasive Animals Cooperative Research Centre, Canberra.
Fisher, D.O., Johnson, C.N., Lawes, M.J., Fritz, S.A., McCallum, H.I., Blomberg, S.P., Van
Der Wal, J., Abbott, B., Frank, A., Legge, S., Letnic, M., Thomas, C.R., Fisher, A., Gordon,
I.J., and Kutt, A.S. (2013) The current decline of tropical marsupials in Australia: is history
repeating? Global Ecology and Biogeography 23(2), 181–190.
118
Frank, A.S.K., Johnson, C.N., Potts, J., Alaric, F., Lawes, M.J., Woinarski, J.C.Z., Tuft, K.,
Radford, I., Gordon, I.J., Collis, M.-A., and Legge, S. (2014) Experimental evidence that
feral cats cause local extirpation of small mammals in Australia's tropical savanna. Journal of
Applied Ecology 51(6), 1486–1493.
Gittleman, J.L. (1985) Carnivore body size: ecological and taxonomic correlates. Oecologia
67(4), 540–554.
Hart, J.A., Katembo, M., and Punga, K. (1996) Diet, prey selection and ecological relations
of leopard and golden cat in the Ituri Forest, Zaire. African Journal of Ecology 34(4), 364–
379.
Hayward, M.W., Henschel, P., O'brien, J., Hofmeyr, M., Balme, G., and Kerley, G.I.H.
(2006) Prey preferences of the leopard (Panthera pardus). Journal of Zoology 270(2), 298–
313.
Hebblewhite, M., Merrill, E.H., and McDonald, T.L. (2005) Spatial decomposition of
predation risk using resource selection functions: an example in a wolf-elk predator-prey
system. Oikos 111, 101–111.
Heithaus, M., Dill, L.M., Marshall, G.J., and Buhleier, B. (2002) Habitat use and foraging
behavior of tiger sharks (Galeocerdo cuvier) in a seagrass ecosystem. Marine Biology 140(2),
237–248.
Helldin, J.O., Liberg, O., and Glöersen, G. (2006) Lynx (Lynx lynx) killing red foxes (Vulpes
vulpes) in boreal Sweden–frequency and population effects. Journal of Zoology 270(4), 657–
663.
Hopcraft, J.C.C., Sinclair, A.R.E., and Packer, C. (2005) Planning for success: Serengeti
lions seek prey accessibility rather than abundance. Journal of Animal Ecology 74, 559–566.
Husseman, J.S., Murray, D.L., Power, G., Mack, C., Wenger, C.R., and Quigley, H. (2003)
Assessing differential prey selection patterns between two sympatric large carnivores. Oikos
101, 591–601.
Johnson, C.N. (2006) 'Australia's mammal extinctions: a 50 000 year history.' (Cambridge
University Press: Cambridge)
Jones, E., and Coman, B.J. (1982) Ecology of the feral cat, Felis catus (L.), in south-eastern
Australia III.* Home ranges and population ecology in semi-arid north-west Victoria.
Wildlife Research 9(3), 409–420.
Kennedy, M.S., Phillips, B.L., Legge, S., Murphy, S.A., and Faulkner, R.A. (2012) Do
dingoes suppress the activity of feral cats in northern Australia? Austral Ecology 37(1), 134–
139.
Kitchener, A.C. (1991) 'A natural history of the wild cats.' (Cornell University Press: Ithaca,
New York)
119
Konecny, M.J. (1987) Food habits and energetics of feral house cats in the Galapagos
Islands. Oikos 50(1), 24–32.
Kruuk, H. (1972) Surplus killing by carnivores. Journal of Zoology 166(2), 233–244.
Leahy, L., Legge, S., Tuft, K., McGregor, H.W., Barmuta, L., Jones, M.H., and Johnson,
C.N. (2014) Amplified predation after fire drives declines of small mammals in Australia’s
tropical savannas. Austral Ecology In review.
Legge, S., Kennedy, M.S., Lloyd, R., Murphy, S.A., and Fisher, A. (2011) Rapid recovery of
mammal fauna in the central Kimberley, northern Australia, following the removal of
introduced herbivores. Austral Ecology 36, 791–799.
Loarie, S.R., Tambling, C.J., and Asner, G.P. (2013) Lion hunting behaviour and vegetation
structure in an African savanna. Animal Behaviour 85, 899–906.
Lone, K., Loe, L.E., Gobakken, T., Linnell, J.D.C., Odden, J., Remmen , J., and Mysterud, A.
(2014) Living and dying in a multi-predator landscape of fear: roe deer are squeezed by
contrasting pattern of predation risk imposed by lynx and humans. Oikos 123(6), 1–11.
Loss, S.R., Will, T., and Marra, P.P. (2012) The impact of free-ranging domestic cats on
wildlife of the United States. Nature Communications 4, 1396.
Loyd, K.A.T., Hernandez, S.M., Carroll, J.P., Abernathy, K.J., and Marshall, G.J. (2013)
Quantifying free-roaming domestic cat predation using animal-borne video cameras.
Biological Conservation 160, 183–189.
Maletzke, B.T., Koehler, G.M., Wielgus, R.B., Aubry, K.B., and Evans, M.A. (2008) Habitat
conditions associated with lynx hunting behavior during winter in northern Washington. The
Journal of wildlife management 72(7), 1473–1478.
Martin, G.R., Twigg, L.E., and Robinson, D.J. (1996) Comparison of the Diet of Feral Cats
from Rural and Pastoral Western Australia. Wildlife Research 23, 475–484.
Mattisson, J., Odden, J., Nilsen, E.B., Linnell, J.D.C., Persson, J., and Andrén, H. (2011)
Factors affecting Eurasian lynx kill rates on semi-domestic reindeer in northern Scandinavia:
Can ecological research contribute to the development of a fair compensation system?
Biological Conservation 144(12), 3009–3017.
Medina, F.M., Bonnaud, E., Vidal, E., Tershy, B.R., Zavaleta, E.S., Josh, D.C., Keitt, B.S.,
Le Corre, M., Horwath, S.V., and Nogales, M. (2011) A global review of the impacts of
invasive cats on island endangered vertebrates. Global Change Biology 17(11), 3503–3510.
Moll, R.J., Millspaugh, J.J., Beringer, J., Sartwell, J., and He, Z. (2007) A new ‘view’of
ecology and conservation through animal-borne video systems. Trends in Ecology &
Evolution 22(12), 660–668.
Moll, R.J., Millspaugh, J.J., Beringer, J., Sartwell, J., Woods, R.J., and Vercauteren, K.C.
(2009) Physiological stress response of captive white-tailed deer to video collars. The Journal
of wildlife management 73(4), 609–614.
120
Moreno, S., Delibes, M., and Villafuerte, R. (1996) Cover is safe during the day but
dangerous at night: the use of vegetation by European wild rabbits. Canadian Journal of
Zoology 74(9), 1656–1660.
Moseby, K.E., Stott, J., and Crisp, H. (2009) Movement patterns of feral predators in an arid
environment – implications for control through poison baiting. Wildlife Research 36, 422–
435.
Oakwood, M. (2000) Reproduction and demography of the northern quoll, Dasyurus
hallucatus, in the lowland savanna of northern Australia. Australian Journal of Zoology 48,
519–539.
Orsdol, K.G. (1984) Foraging behaviour and hunting success of lions in Queen Elizabeth
National Park, Uganda. African Journal of Ecology 22(2), 79–99.
Patterson, T.A., Thomas, L., Wilcox, C., Ovaskainen, O., and Matthiopoulos, J. (2008) State–
space models of individual animal movement. Trends in Ecology & Evolution 23(2), 87–94.
Peck, D.R., Faulquier, L., Pinet, P., Jaquemet, S., and Le Corre, M. (2008) Feral cat diet and
impact on sooty terns at Juan de Nova Island, Mozambique Channel. Animal Conservation
11(1), 65–74.
Pinheiro, J., Bates, D., DebRoy, S., Sarkar, D., and Team, R.D.C. (2014) nlme: Linear and
nonlinear mixed effects models. In '.' R package version 3.1-117 edn.)
R Development Core Team (2008) R: a language and environment for statistical computing.
In '.' (R Foundation for Statistical Computing: Vienna)
Ripple, W.J., Estes, J.A., Beschta, R.L., Wilmers, C.C., Ritchie, E.G., Hebblewhite, M.,
Berger, J., Elmhagen, B., Letnic, M., and Nelson, M.P. (2014) Status and ecological effects
of the world’s largest carnivores. Science 343(6167), 1241484.
Savidge, J.A. (1987) Extinction of an island forest avifauna by an introduced snake. Ecology
68(3), 660–668.
Short, J., Kinnear, J.E., and Robley, A. (2002) Surplus killing by introduced predators in
Australia—evidence for ineffective anti-predator adaptations in native prey species?
Biological Conservation 103(3), 283–301.
Sinclair, E.A., Danks, A., and Wayne, A.F. (1996) Rediscovery of Gilbert's potoroo,
Potorous tridactylus, in Western Australia. Australian Mammalogy 19, 69–72.
Smith, A.P., and Quin, D.G. (1996) Patterns and causes of extinction and decline in
Australian conilurine rodents. Biological Conservation 77(2), 243–267.
Toland, B.R. (1987) The effect of vegetative cover on foraging strategies, hunting success
and nesting distribution of American Kestrels in central Missouri. Journal of Raptor
Research 21(1), 14–20.

121
Weimerskirch, H., Pinaud, D., Pawlowski, F., and Bost, C.-A. (2007) Does prey capture
induce area-restricted search? A fine-scale study using GPS in a marine predator, the
Wandering Albatross. The American Naturalist 170(5), 734–743.
Woinarski, J.C.Z., Burbidge, A.A., and Harrison, P. (2014) 'Action plan for Australian
mammals 2012.' (CSIRO: Melbourne)
Woinarski, J.C.Z., Ward, S., Mahney, T., Bradley, J., Brennan, K., Ziembicki, M., and
Fisher, A. (2011) The mammal fauna of the Sir Edward Pellew island group, Northern
Territory, Australia: refuge and death-trap. Wildlife Research 38, 307–322.
Woods, M., McDonald, R.A., and Harris, S. (2003) Predation of wildlife by domestic cats
Felis catus in Great Britain. Mammal Review 33(2), 174–188.
122
CHAPTER 6
Overall summary and discussion
I was able to make detailed observation of the ecology of cats Felis catus, and show how
their population density, movements and hunting success are affected by fire and grazing
regimes. Efficient and effective methods were developed for measuring density, catching cats
to study their movements and observe their hunting.
By measuring cat densities at multiple camera-trap arrays across the central Kimberley, I
showed that cat densities were low (around 0.17 km 2) but stable and relatively uniform
across the landscape. No relationship was found with either stocking or long-term fire
histories. This is despite large differences (2-8 fold) in small mammal abundance related to
these variables. This suggests that within those areas, prey were abundant but not necessarily
available to cats.
I then investigated fine-scale habitat selection by feral cats in relation to fire, grazing and
small mammal abundance, using GPS data obtained from 32 feral cats in landscapes with
contrasting fire and grazing patterns. Cats selected areas with less grass cover, including
areas that were heavily grazed or burnt by intense fire. However, they did so only in habitats
that typically support high abundance of small mammals.
Not only were areas burnt by intensive fires selected by cats within the home range, but
males would journey far outside their home ranges in order to hunt in such habitats. Eight
such journeys of up to 12.5 km were recorded, representing 80 % of male cats that had an
intense fire scar within that distance of their home range. The aggregate effect of these
expeditions was to create temporary increases in cat densities at intense firescars, which
would place much greater predation pressure on native wildlife in those places.
In open areas with scant grass or rock cover, hunting attempts by feral cats resulted in a
successful kill more frequently than in closed areas. As fire and grazing simplifies the
123
structure of vegetation at ground level, it is reasonable to conclude that fire and grazing
improve the success rate of cat predation.
Each chapter demonstrated one aspect of cat ecology, pointing to some manner of increased
impacts on prey with intensified fire and grazing regimes. However, these need to be
synthesized in order to estimate the magnitude of this change. I therefore used my results in a
hypothetical scenario for a 50 km x 50 km area with an intense fire that covered 100 km2.
Assuming a density and spacing of feral cats as was found in Chapter 2 (0.17 km-2
), this
entire area would support a population of 425 cats. The fire scar itself would contain the
home-range centroids of 17 cats, and the home-range of a further 8 cats would be adjacent.
Considering the degree to which cats selected for intense fire scars within their home range
(Chapter 3), we can assume that visitation by cats to areas with an intense fire scar within
their existing HR would double. Also, if we consider that 80 % of male cats living within
12.5 km of the edge of this fire scar would travel there (Chapter 4), this means another 70
cats would visit. The visits would take place for at least nine months after fire, with longer
stays initially (within 3 months of fire), and shorter stays over time; however on average
there would be about 4 additional cats at the fire scar in any week. And finally, the success
rate of predation attempts by each cat would increase three fold due to the open-ness of
habitat (Chapter 5). Combining these estimates, there would be a two-fold increase in
resident cat visitation, four-fold increase in cat density, and three-fold increase in likelihood
of a kill if detected, with the ultimate effect that prey would be subject to a 15-fold increase
in cat predation.
In this scenario, movement of cats to fire scars might provide temporary relief from predation
for small mammals at the home ranges of those cats, but because predation risk is lower in
unburnt habitats this relief would not offset the increased mortality at fire scars. The increase
in intensity of predation at fire scars is so great that it could lead to local extirpations of prey,
such as small mammals, that are targeted by cats in those situations (Leahy et al. 2014). It is
possible that if intense fires recur with sufficiently high frequency, these local extirpations
could incrementally spread to affect large areas (Firth et al. 2010; Pardon et al. 2003b). If the
pace of this process exceeded the potential for dispersal and local recruitment to re-establish
populations of small mammals in the wake of intense fires, the result could be regional
124
extinction of many species of small mammals. A process such as this could explain the recent
wave of small-mammal extinctions across northern Australia.
The effect of grazing by large herbivores on the magnitude of the impacts of cats is harder to
discern, especially for their impact on small mammals. Cats’ selection for grazed habitats was
stronger during the day, but this is not when small mammals are most active. However,
grazing by livestock produces a more open structure of ground vegetation, and my data
showed that cats prefer more open areas to hunt it, and make more successful kills in open
areas. Though my evidence is somewhat circumstantial, it does provide a potential
mechanism to explain the results of earlier work in the same area that showed immediate
increases in the richness and abundance of small mammals after removal feral herbivores
(Legge et al. 2011b). There are several alternative mechanisms to explain grazing impacts.
Large herbivores may affect the small mammals directly, by reducing food availability and
hence fecundity, or trampling their burrows. Alternatively, there could be an interaction with
fire, as cattle are known to prefer grass regrowth after fire, amplifying the impacts of intense
fires that were discussed in the previous paragraph.
Implications for the northern mammal declines
The key point from this research is that the impacts of cats can vary dramatically with
changes to fire, and possibly grazing regimes, despite a low cat density. Based on this, the
cat-fire-grazing interaction is a strong candidate mechanism to explain the northern mammal
declines. In this scenario, cats and small mammals coexisted for over 80 – 150 (depending on
the region) years at stable equilibrium 1, where fires were small in scale, and grazing
relatively light. However, the large shifts in fire patterns witnessed over the last 60 to 20
years, along with increased grazing pressure from cattle , horses, donkeys, buffalo, created an
increasing frequency of pulses of high cat impacts, driving major population declines of
native mammals, without necessarily an increase in cat populations. This interaction between
feral cats, small mammals, fire and grazing fits in with most known investigations of small
mammal responses to fire and grazing (Andersen et al. 2005; Kutt and Woinarski 2007;
1 Not all native small mammals coexisted within this equilibrium, and it is likely that some
species went extant almost immediately after European colonisation of northern Australia
(Cramb and Hocknull 2010, Start et al. 2012)
125
Legge et al. 2011a; Legge et al. 2008; Woinarski et al. 2010). However, there are some
anomalies to this pattern in northern Australia. Cats are present on Melville Island to the
north of Darwin, but preliminary evidence suggests small mammals are not declining there
with frequent fires (Burbidge and Manly 2002; Davies and Murphy 2014). Also, in northern
Queensland successful suppression of fire and removal of cattle did not result in increases in
small mammal abundance (Kutt et al. 2012). It is possible that these differences are due to
variations in cat abundances, where certain thresholds create different outcomes. Landscape
variations in cat density should hence become a further avenue for cat research in northern
Australia.
That the cats-fire-grazing interaction is so strong does not mean that other factors are not
important in causing decline of small mammals in northern Australia. Dingo Canis familiaris
dingo persecution likely has had a role, because dingoes suppress cat numbers and/or
behaviour, at least partially excluding them from certain habitats (Brook 2013; Leahy et al.
2014; Wang and Fisher 2012). Cane toads Bufo marinus are contributing to the decline of the
northern quoll Dasyurus hallucatus by direct poisoning (Oakwood 2000), and this may apply
to other carnivores as well (e.g. northern brush-tailed phascogale Phascogale pirata). Cane
toads may also contribute to declines of native rodents like Rattus tunneyi (Ibbett 2010), via
competition for burrows and food. Furthermore, how fire and grazing affect the trophic
regulation of ecosystems as a whole is not understood (Radford et al. 2014).
Implications for Australia
My research also suggests the likely cause of mammal declines in the desert regions of
Australia over the last 100 years. Whilst some of the critical weight range mammals went
extinct soon after European settlement across the centre (Johnson 2006), many persisted in
the period between the 1930s and 1970s (Burbidge et al. 1988; Finlayson 1935; Gibson et al.
1994; Ziembicki et al. 2013). Aboriginal people continued to live in the desert and carried out
their burning practices, creating mosaics of small fire scars, until as late as the 1960s
(Burrows et al. 2004). However, most aboriginal people had moved into settlements by the
1970s, and the fire regimes rapidly changed into a pattern of massive intense fires. Soon
after, many native mammal populations became extinct. These changed fire patterns are often
considered the reason for these extinctions by both scientists (Smith and Quin 1996) and
126
traditional owners (Burbidge et al. 1988; Ziembicki et al. 2013), yet the evidence is scant. I
suggest that the change in fire regimes would have caused prolonged and increased predation
impacts by cats (and possibly red foxes Vulpes vulpes) on critical weight range mammals.
Whilst the contribution of this process compared to others factors (e.g. increase in cat density
caused by the reduction in aboriginal hunting of cats) cannot be assessed, there is strong
evidence that it was at least operating. This suggests the manner in which fire regimes should
be considered in these ecosystems. It is not necessarily that fire-mosaics and ‘pyrodiversity’
in themselves are important. Instead, it is the size and frequency of intense fires that drive
declines in combination with feral predators, and that such mosaics supress the spread of such
fires (Bird et al. 2012). This would explain why few studies report increases in small
mammals in areas with greater pyrodiversity (Parr and Andersen 2006), and why these
patterns were not observed on arid offshore islands in the absence of predators (Short and
Turner 1994). This highlights the importance of ongoing fire management throughout central
Australia to protect the remaining few extant mammals.
This interactive threat is also likely to affect the fauna of southern Australia. It is possible that
foxes, the dominant introduced predator of southern Australia, also have greater predatory
impacts on native mammals after intense fires. Meek and Saunders (2000) found radio-
tracked foxes appear to select for intensely burn areas, and Hradsky et al. (2014) found that
foxes eat more native small-medium sized mammals after fire. Also, small mammal
populations generally decline following intense fires (Arthur et al. 2012; Banks et al. 2011;
Friend 1993; Green and Sanecki 2006; Sutherland and Dickman 1999). At present, refuges
for endangered critical weight-range animals in southern Australia are either long-unburnt
heathland (Sinclair et al. 1996) and rainforest pockets (Bennet 1993; Johnson 2006; Sinclair
et al. 1996), suggesting that the reason for these species persistence is the continuous
protection from predation provided by dense vegetation. This research highlights the
precarious situation that these threatened mammals are in, as one intense fire could create a
feeding frenzy of cats or foxes and increase their predation pressure dramatically.
This pattern of opening up of ground-layer vegetation increasing predatory impacts of small-
medium sized carnivores would be applicable worldwide, however, does not seem to have as
dramatic an impact on prey populations. Other studies in Europe and the Americas find that
small-medium sized predator activity and predation impacts increase after intense fires
127
(Birtsas et al. 2012; Cunningham et al. 2006). As fire and grazing create at least temporary
opening up of ground cover, most species of small-medium sized predators should have
greater hunting success in such areas. Unlike in Australia, populations of small to medium
sized mammals do not appear to be as threatened by such events (Conner et al. 2011; Fisher
and Wilkinson 2005; Izhaki 2012; Morris et al. 2011).
I suggest a hypothesis as to why this pattern is more severe in Australia. The main difference
between Australian versus Eurasian and American mammalian assemblages is the absence of
placental predators (Order Carnivora) over most of Australia’s evolutionary history. Wide-
ranging and flexible predators such as cats and foxes appear to exert a greater predatory force
on prey than Australia’s predators such as quolls Dasyurus spp. and Tasmanian devils
Sarcophilus harrisi, and one of the key evolutionary responses of small mammals of Eurasia
and the Americas was to increase fecundity. The small terrestrial mammals of Australia have
a comparatively lower fecundity, even within the rodents that occur on all three continents
(Watts 1974). As Australian mammals did not evolve with the same predation pressure as
Eurasian and American species, evolutionary traits that put more emphasis into survival in a
nutrient-poor landscape were selected for. After feral cats and red foxes were introduced into
Australia, their anti-predator traits, either physiological or behavioural, were no longer
effective. The only factors that reduced predation rates to sustainable levels for most species
was either a reduction of cat or fox densities (usually by the top-order predator dingo (Ritchie
and Johnson 2009)) or the availability of cover in the form of dense low vegetation or
complex rocks. The presence of dense low cover allowed some species to coexist with
introduced species in some circumstances, namely the northern Australian savannas, semi-
arid spinifex grasslands and southern heathlands. However, even momentary losses of cover
with no nearby refuges (e.g. after intense fires) can drive these species to local extinction.
Global implications
This research demonstrates that two of the greatest threats to wildlife globally, intensifying
fire and grazing, and predation by invasive predators, can interact to create even greater
impacts. In northern Australia, much of the small mammal fauna was seemingly able to
adapt to the introduction of an invasive predator, at least temporarily. However, this fauna
could not remain stable with the interactive effects with intensifying fire regimes and greater
128
grazing pressures. When multiple threats affect whole landscapes, population declines may
be so rapid that it denies animals a chance to adapt to any one threat (Brook et al. 2008).
One of the key implications for conservation is to reduce the frequency and extent of intense
fires wherever possible. Globally, fire regimes are intensifying. The principle reasons are
anthropogenic land-use change (Russell-Smith et al. 2003) and global warming (Bradstock et
al. 2014; Westerling et al. 2006). In the context of reducing the impacts of fires, the most
important consideration is to reduce the frequency and extent of intense fires, not necessarily
any fires. Reducing intensive fires using many smaller controlled (i.e. mild) fires is a valid
option, even if these fires themselves cause damage. For example, while Leahy et al. (2014)
found a five-fold drop in survivorship of Rattus tunneyi after a mild fire, there was a 20-fold
drop after an intense fire. Similar results have been obtained elsewhere (Firth et al. 2010;
Pardon et al. 2003a), suggesting that in general, all fires enable greater hunting by predators,
but intense fires are especially catastrophic. The trade-off must be made in the impacts of
preventative fires against the threat of intensive fires
Cats are a major cause of population declines and extinctions worldwide (Loss et al. 2012;
Medina et al. 2011; Woinarski et al. 2014). My research shows that even at low densities
feral cats can be major threat to wildlife. They are more opportunistic and intelligent hunters
than previously thought, in that they were able to find fire scars far outside their home-ranges
to hunt. Also, their kill-rates are much greater than has been reported for domestic cats
(Barratt 1998; Loss et al. 2012; Loyd et al. 2013), and wild cats are capable of surplus
killing. Cats need to be managed for conservation. Unfortunately, one of the greatest
difficulties in managing cats is that their behaviour, ecology and impacts are so varied across
their range, and solutions that are effective in one place and time are not necessarily
applicable elsewhere. For example, strategies for removing cats on islands, such as the
introduction of cat-flu and intensive trapping (Nogales et al. 2004), are not applicable to
managing cats around cities, where there is high resistance to disease and recruitment would
be far greater than removal (McCarthy et al. 2013). It is critical to modify management
strategies to the locality and conditions.
Populations of feral cats are very difficult to reduce over large scales. For removal of animals
from wild populations to succeed in reducing abundance, the removal rate must exceed the
129
rate at which the population replaces removed animals by recruitment through reproduction
and immigration. The high reproductive potential of feral cats means that a very large portion
of the population must be removed, between 65 % and 95 % of the population per year (Hone
1999; McCarthy et al. 2013). Using current methods of direct control, detecting and killing
the required proportion of the population to deliver an overall population reduction when at
low densities is a virtual impossibility. Poison baiting may be an option for parts of Australia
where risks imposed on native carnivores are low, however, such scenarios are rare (Paul et
al. 2011) and low bait uptake by cats means that success of this method is variable (Johnston
2012; Johnston et al. 2011; Johnston et al. 2014; Moseby et al. 2009). No known feasible
bio-control option has been suggested. Instead, other methods of reducing cat impacts on
native wildlife will have to be considered.
This research suggests that in areas where cat density is low, cat impacts can be reduced by
focussing on management of vegetation to increase ground cover. This could be achieved by
supressing intense fires and reducing populations of feral herbivores. This would reduce the
impacts of cats over large landscapes, especially if this management is focussed on naturally
mammal-rich habitats, and suggests why fire management and cattle removal has had
positive results in the central Kimberley (Legge et al. 2011a). A key question is how changes
to vegetation structure influence predation in different habitats, and in areas where densities
of feral cats are greater. This is where future research must be directed.
130
References
Andersen, A.N., Cook, G.D., Corbett, L.K., Douglas, M.M., Eager, R.W., Russell-Smith, J.,
Setterfield, S.A., Williams, R.J., and Woinarski, J.C.Z. (2005) Fire frequency and
biodiversity conservation in Australian tropical savannas: implications from the Kapalga fire
experiment. Austral Ecology 30(2), 155–167.
Arthur, A.D., Catling, P.C., and Reid, A. (2012) Relative influence of habitat structure,
species interactions and rainfall on the post-fire population dynamics of ground-dwelling
vertebrates. Austral Ecology 37, 958–970.
Banks, S.C., Dujardin, M., McBurney, L., Blair, D., Barker, M., and Lindenmayer, D.B.
(2011) Starting points for small mammal population recovery after wildfire: recolonisation or
residual populations? Oikos 120(1), 26–37.
Barratt, D.G. (1998) Predation by house cats, Felis catus (L.), in Canberra, Australia. II.
Factors affecting the amount of prey caught and estimates of the impact on wildlife. Wildlife
Research 25(5), 475–487.
Bennet, A.F. (1993) Microhabitat use by the long-nosed potoroo, Potorous tridactylus, and
other small mammals in remnant forest vegetation, south-western Victoria. Wildlife Research
20(3), 267–285.
Bird, R.B., Codding, B.F., Kauhanen, P.G., and Bird, D.W. (2012) Aboriginal hunting
buffers climate-driven fire-size variability in Australia’s spinifex grasslands. Proceedings of
the National Academy of Sciences 109(26), 10287–10292.
Birtsas, P., Sokos, C., and Exadactylos, S. (2012) Carnivores in burned and adjacent
unburned areas in a Mediterranean ecosystem. Mammalia 76(4), 407–415.
Bradstock, R.A., Penman, T., Boer, M., Price, O., and Clarke, H. (2014) Divergent responses
of fire to recent warming and drying across south‐eastern Australia. Global Change Biology
20(5), 1412–1428.
Brook, B.W., Sodhi, N.S., and Bradshaw, C.J.A. (2008) Synergies among extinction drivers
under global change. Trends in Ecology & Evolution 23(8), 453–460.
Brook, L.A. (2013) Predator guild interactions in northern Australia: behaviour and ecology
of an apex predator, the dingo Canis lupus dingo, and an introduced mesopredator, the feral
cat Felis catus., James Cook University, Townsville, QLD
Burbidge, A.A., Johnson, K.A., Fuller, P.J., and Southgate, R.I. (1988) Aboriginal knowledge
of the mammals of the central deserts of Australia. Wildlife Research 15(1), 9–39.
Burbidge, A.A., and Manly, B.F.J. (2002) Mammal extinctions on Australian islands: causes
and conservation implications. Journal of Biogeography 29(4), 465–473.
131
Burrows, N.D., Burbidge, A.A., and Fuller, P.J. Integrating Indigenous knowledge of
wildland fire and western technology to conserve biodiversity in an Australian desert. In
'Bridging Scales and Epistemologies: Linking Local Knowledge and Global Science in
Multiscale Assessments Conference, Alexandria, Egypt', 2004,
Conner, L.M., Castleberry, S.B., and Derrick, A.M. (2011) Effects of mesopredators and
prescribed fire on hispid cotton rat survival and cause-specific mortality. Journal of Wildlife
Management 75(4), 938–944.
Cramb, J., and Hocknull, S. (2010) New Quaternary records of Conilurus (Rodentia:
Muridae) from eastern and northern Australia with the description of a new species. Zootaxa
2634, 41–56.
Cunningham, S.C., Kirkendall, L.B., and Ballard, W. (2006) Gray fox and coyote abundance
and diet responses after a wildfire in central Arizona. Western North American Naturalist
66(2), 169–180.
Davies, H., and Murphy, B.P. (2014) Fire and small mammals on the Tiwi Islands. In
'Australian Mammal Society.' (Ed. EG Ritchie): Melbourne, Vic)
Finlayson, H.H. (1935) 'The red center: man and beast in the heart of Australia.' (Angus and
Robertson: Sydney)
Firth, R.S.C., Brook, B.W., Woinarski, J.C.Z., and Fordham, D.A. (2010) Decline and likely
extinction of a northern Australian native rodent, the Brush-tailed Rabbit-rat Conilurus
penicillatus. Biological Conservation 143, 1193–1201.
Fisher, J.T., and Wilkinson, L. (2005) The response of mammals to forest fire and timber
harvest in the North American boreal forest. Mammal review 35(1), 51–81.
Friend, G.R. (1993) Impact of fire on small vertebrates in mallee woodlands and heathlands
of temperate Australia: a review. Biological Conservation 65(2), 99–114.
Gibson, D.F., Lundie-Jenkins, G., Langford, D.G., Cole, J.R., Clarke, D.E., and Johnson,
K.A. (1994) Predation by feral cats, Felis catus, on the rufous hare-wallaby, Lagorchestes
hirsutus, in the Tanami Desert. Australian Mammalogy 17, 103–107.
Green, K., and Sanecki, G. (2006) Immediate and short-term responses of bird and mammal
assemblages to a subalpine wildfire in the Snowy Mountains, Australia. Austral Ecology
31(6), 673–681.
Hone, J. (1999) On rate of increase(r): patterns of variation in Australian mammals and the
implications for wildlife management. Journal of Applied Ecology 36(5), 709–718.
Hradsky, B., Mildwaters, C., Christie, F.J., Ritchie, E.G., and Di Stefano, J. Out of the fire,
into the fox’s mouth: introduced predator responses to planned burning. In 'Australian
Mammal Society', 2014, Melbourne, Vic. (Ed. EG Ritchie),
132
Ibbett, M. (2010) The role of broad-scale, multi-species monitoring for conservation, with
particular reference to small mammals in Kakadu National Park., Charles Darwin University
Darwin
Izhaki, I. (2012) The Impact of Fire on Vertebrates in the Mediterranean Basin: An
Overview. Israel Journal of Ecology & Evolution 58(2-3), 221–233.
Johnson, C.N. (2006) 'Australia's mammal extinctions: a 50 000 year history.' (Cambridge
University Press: Cambridge)
Johnston, M. (2012) Field assessment of the Curiosity® bait for management of feral cats
after fire at Wilsons Promontory National Park: Black Saturday Victoria 2009-Natural values
fire recovery program. Department of Sustainability and Environment, Heidelberg, Victoria,
39.
Johnston, M., Algar, D., O’Donoghue, M., and Morris, J. Field efficacy of the Curiosity feral
cat bait on three Australian islands. In 'Proceedings of the Island Invasives: Eradication and
Management Conference. University of Auckland, New Zealand', 2011,
Johnston, M., Bould, L., O’Donoghue, M., Holdsworth, M., Marmion, P., Bilney, R., Reside,
A.E., Caldwell, D., Gaborov, R., and Gentles, T. (2014) Field efficacy of the Curiosity® bait
for management of a feral cat population at Roxby Downs, South Australia. Arthur Rylah
Institute for Environmental Research Technical Report Series(253).
Kutt, A.S., Vanderduys, E.P., Perry, J.J., Perkins, G.C., Kemp, J.E., Bateman, B.L.,
Kanowski, J., and Jensen, R. (2012) Signals of change in tropical savanna woodland
vertebrate fauna 5 years after cessation of livestock grazing. Wildlife Research 39(5), 386–
396.
Kutt, A.S., and Woinarski, J.C.Z. (2007) The effects of grazing and fire on vegetation and the
vertebrate assemblage in a tropical savanna woodland in north-eastern Australia. Journal of
Tropical Ecology 23(1), 95–106.
Leahy, L., Legge, S., Tuft, K., McGregor, H.W., Barmuta, L., Jones, M.H., and Johnson,
C.N. (2014) Amplified predation after fire drives declines of small mammals in Australia’s
tropical savannas. Austral Ecology In review.
Legge, S., Kennedy, M.S., Lloyd, R., Murphy, S.A., and Fisher, A. (2011a) Rapid recovery
of mammal fauna in the central Kimberley, northern Australia, following the removal of
introduced herbivores. Austral Ecology 36, 791–799.
Legge, S., Murphy, S., Heathcote, J., Flaxman, E., Augusteyn, J., and Crossman, M. (2008)
The short-term effects of an extensive and high-intensity fire on vertebrates in the tropical
savannas of the central Kimberley, northern Australia. Wildlife Research 35, 33–43.
Legge, S., Murphy, S., Kingswood, R., Maher, B., and Swan, D. (2011b) EcoFire: restoring
the biodiversity values of the Kimberley region by managing fire. Ecological Management &
Restoration 12(2), 84–92.
133
Loss, S.R., Will, T., and Marra, P.P. (2012) The impact of free-ranging domestic cats on
wildlife of the United States. Nature Communications 4, 1396.
Loyd, K.A.T., Hernandez, S.M., Carroll, J.P., Abernathy, K.J., and Marshall, G.J. (2013)
Quantifying free-roaming domestic cat predation using animal-borne video cameras.
Biological Conservation 160, 183–189.
McCarthy, R.J., Levine, S.H., and Reed, J.M. (2013) Estimation of effectiveness of three
methods of feral cat population control by use of a simulation model. Journal of the
American Veterinary Medical Association 243(4), 502–511.
Medina, F.M., Bonnaud, E., Vidal, E., Tershy, B.R., Zavaleta, E.S., Josh, D.C., Keitt, B.S.,
Le Corre, M., Horwath, S.V., and Nogales, M. (2011) A global review of the impacts of
invasive cats on island endangered vertebrates. Global Change Biology 17(11), 3503–3510.
Meek, P.D., and Saunders, G. (2000) Home range and movement of foxes (Vulpes vulpes) in
coastal New South Wales, Australia. Wildlife Research 27(6), 663–668.
Morris, G., Hostetler, J.A., Oli, M.K., and Conner, L.M. (2011) Effects of predation, fire, and
supplemental feeding on populations of two species of Peromyscus mice. Journal of
Mammalogy 92(5), 934–944.
Moseby, K.E., Stott, J., and Crisp, H. (2009) Movement patterns of feral predators in an arid
environment – implications for control through poison baiting. Wildlife Research 36, 422–
435.
Nogales, M., Martín, A., Tershy, B.R., Donlan, C.J., Veitch, D., Puerta, N., Wood, B., and
Alonso, J. (2004) A review of feral cat eradication on islands. Conservation Biology 18(2),
310–319.
Oakwood, M. (2000) Reproduction and demography of the northern quoll, Dasyurus
hallucatus, in the lowland savanna of northern Australia. Australian Journal of Zoology 48,
519–539.
Pardon, G., Brook, B.W., Griffiths, A.D., and Braithwaite, R.W. (2003a) Determinants of
survival for the northern brown bandicoot under a landscape-scale fire experiment. Journal of
Animal Ecology 72(106-115).
Pardon, G., Brook, B.W., Griffiths, A.D., and Braithwaite, R.W. (2003b) Determinants of
survival for the northern brown bandicoot under a landscape-scale fire experiment. Journal of
Animal Ecology 72, 106–115.
Parr, C.L., and Andersen, A.N. (2006) Patch mosaic burning for biodiversity conservation: a
critique of the pyrodiversity paradigm. Conservation Biology 20(6), 1610–1619.
Paul, J., Sutherland, D.R., Clarke, J.R., Hill, R.F., Garretson, S.W., Bloomfield, L.,
Strümpher, L., Glen, A.S., and Cruz, J. (2011) Assessment of risks to non-target species from
an encapsulated toxin in a bait proposed for control of feral cats. Wildlife Research 38(1), 39–
50.
134
Radford, I.J., Dickman, C.R., Start, A.N., Palmer, C., Carnes, K., Everitt, C., Fairman, R.,
Graham, G., Partridge, T., and Thomson, A. (2014) Mammals of Australia's tropical
savannas: A conceptual model of assemblage structure and regulatory factors in the
Kimberley region. PLos ONE 9(3), e92341.
Ritchie, E.G., and Johnson, C.N. (2009) Predator interactions, mesopredator release and
biodiversity conservation. Ecology Letters 12, 982–998.
Russell-Smith, J., Yates, C.J., Edwards, A., Allan, G.E., Cook, G.D., Cooke, P., Craig, R.,
Heath, B., and Smith, R. (2003) Contemporary fire regimes of northern Australia, 1997–
2001: change since Aboriginal occupancy, challenges for sustainable management.
International Journal of Wildland Fire 12, 283–297.
Short, J., and Turner, B. (1994) A test of the vegetation mosaic hypothesis: A hypothesis to
explain the decline and extinction of Australian mammals. Conservation Biology 8(2), 439–
449.
Sinclair, E.A., Danks, A., and Wayne, A.F. (1996) Rediscovery of Gilbert's potoroo,
Potorous tridactylus, in Western Australia. Australian Mammalogy 19, 69–72.
Smith, A.P., and Quin, D.G. (1996) Patterns and causes of extinction and decline in
Australian conilurine rodents. Biological Conservation 77(2), 243–267.
Start, A.N., Burbidge, A.A., McDowell, M.C., and McKenzie, N.L. (2012) The status of non-
volant mammals along a rainfall gradient in the south-west Kimberley, Western Australia.
Australian Mammalogy 34(1), 36–48.
Sutherland, E.F., and Dickman, C.R. (1999) Mechanisms of recovery after fire by rodents in
the Australian environment: a review. Wildlife Research 26, 405–419.
Wang, Y., and Fisher, D.O. (2012) Dingoes affect activity of feral cats, but do not exclude
them from the habitat of an endangered macropod. Wildlife Research 39(7), 611–620.
Watts, C.H.S. (1974) The native rodents of Australia: a personal view. Aust. Mammal 1, 109–
115.
Westerling, A.L., Hidalgo, H.G., Cayan, D.R., and Swetnam, T.W. (2006) Warming and
earlier spring increase western US forest wildfire activity. Science 313(5789), 940–943.
Woinarski, J.C.Z., Armstrong, M., Brennan, K., Fisher, A., Griffiths, A.D., Hill, B., Milne,
D.J., Palmer, C., Ward, S., Watson, M., Winderlich, S., and Young, S. (2010) Monitoring
indicates rapid and severe decline of native small mammals in Kakadu National Park,
northern Australia. Wildlife Research 37, 116–126.
Woinarski, J.C.Z., Burbidge, A.A., and Harrison, P. (2014) 'Action plan for Australian
mammals 2012.' (CSIRO: Melbourne)
Ziembicki, M.R., Woinarski, J.C.Z., and Mackey, B. (2013) Evaluating the status of species
using Indigenous knowledge: Novel evidence for major native mammal declines in northern
Australia. Biological Conservation 157, 78–92.

135
136
Supplementary material
Appendix 1. Details on the creation of the dynamic grass cover map
To accurately measure grass variables in a landscape of constantly changing grass
biomass, we developed a dynamic map that estimated grass cover at any given
location and date. This involved creating a series of models of grass cover, derived
from vegetation attributes measured at 768 plots. These plots were each 10 m2, and
spread across the study area. To encompass a full range of fire and grazing responses
in grass growth, we used a stratified random sampling design with six plots placed in
each grass community (see Table 1) and to each combination of mild / intense fire; in
four time periods (up to 1 month post fire, 2 – 12 month post fire, 12 – 24 month post
fire, greater than 25 months since fire; in grazed and destocked areas. This created a
total of 96 plots per community.
At each of the 768 plots, we estimated the extent of grass cover at different heights by
adapting a line-intercept method. First, dominant plant species were identified. Then,
we inserted a 100 cm pole (diameter of 1.5 cm) vertically through the grass to the
ground at 50 points in a systematic grid over the plot. The number of grass intercepts
were recorded in height brackets of 0 – 10 cm (cat paw height), 11 – 30 cm (cat body
height), and 31 – 100 cm (greater than cat body height). For each plot, we converted
this into grass cover (% of poles with any grass intercept higher than 10 cm), dense
grass cover (% of poles with 10 or more grass intercepts; typically the centre of
tussocks), and grass biomass (total sum of grass intercepts). We considered grass
cover relevant for cats to be that higher than their paws (~ 10 cm), and grass cover
less than this would not assist their concealment or impair their vision. Therefore,
cover was measured as the percent of poles with any grass intercept greater than 10
cm.
137
To determine values for grass variable (cover, dense cover and biomass) for any given
location and date in the study area, models were derived from values for each plot and
plotted against other spatial and temporal explanatory variables that we could measure
or map. These were grass community class (as Table 1, below), time since fire
(mapped as per methods in paper), estimated number of days since fire where grass
had water available to grow (one month after last rain > 5 ml at Mornington), number
of days since the start of the dry season (days after April 1st, until December 1
st),
intensity of fire (high intensity versus mild), and grazing by introduced herbivores
(delineated by AWCs destocking fence). For each grass community, we fitted a linear
model to every combination of time since fire, fire intensity, dry days, grazing, and an
interaction term of time since fire and grazing. Within each grass community, these
models were compared within an information theory framework, and the most
parsimonious model was determined as that with the lowest AICc and Aikike weight.
All analysis was conducted in R (R Development Core Team 2008) using the ‘nlme’
and ‘MuMIn’ packages.
Once the most parsimonious model was selected for each grass community, we
applied the parameter estimates to each cat fix and associated random fix based on
values of predictor variables. We also capped derived values at an upper and lower
limit; zero was defined as the lower limit; the upper limit was the average value for
the corresponding unburnt plots in each grass communities and grazing type. This
allowed us to predict the grass cover, dense grass cover and relative grass biomass at
any location within the study area given grass community, time since fire and
stocking treatment. All top models had an adjusted R2 of greater than 0.7.
R Development Core Team (2008) R: a language and environment for statistical
computing. In '.' (R Foundation for Statistical Computing: Vienna)
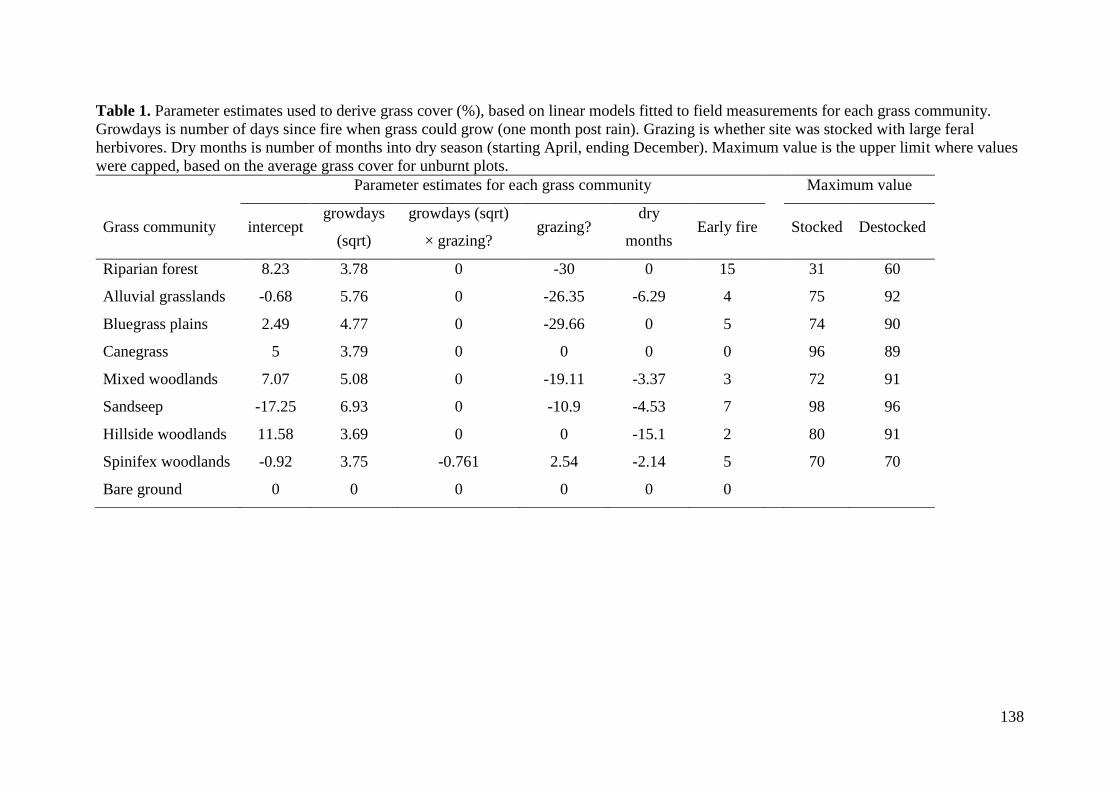
138
Table 1. Parameter estimates used to derive grass cover (%), based on linear models fitted to field measurements for each grass community.
Growdays is number of days since fire when grass could grow (one month post rain). Grazing is whether site was stocked with large feral
herbivores. Dry months is number of months into dry season (starting April, ending December). Maximum value is the upper limit where values
were capped, based on the average grass cover for unburnt plots.
Parameter estimates for each grass community Maximum value
Grass community intercept growdays
(sqrt)
growdays (sqrt)
× grazing? grazing?
dry
months Early fire
Stocked Destocked
Riparian forest 8.23 3.78 0 -30 0 15 31 60
Alluvial grasslands -0.68 5.76 0 -26.35 -6.29 4 75 92
Bluegrass plains 2.49 4.77 0 -29.66 0 5 74 90
Canegrass 5 3.79 0 0 0 0 96 89
Mixed woodlands 7.07 5.08 0 -19.11 -3.37 3 72 91
Sandseep -17.25 6.93 0 -10.9 -4.53 7 98 96
Hillside woodlands 11.58 3.69 0 0 -15.1 2 80 91
Spinifex woodlands -0.92 3.75 -0.761 2.54 -2.14 5 70 70
Bare ground 0 0 0 0 0 0

139
Appendix 2. Introduction to the footage obtained from the cat video collars
For this appendix, a short video was created. This provides a brief overview of how cameras
that were placed on cats were created, along with some of the resultant footage
The video can be accessed via dropbox by the following link:
https://www.dropbox.com/sh/cmtetmmzk59mnm2/AACtlLup-NGVLYLYjik14ONoa?dl=0
If there are any problems viewing this file, please email [email protected] for assistance