Embed Size (px)
Citation preview
Density-Functional-Theory Studies of the Infrared Spectra of Titanium CarbideNanocrystals
Michael Patzschke and Dage Sundholm*Department of Chemistry, UniVersity of Helsinki, P.O. Box 55 A.I. Virtanens plats 1,FIN-00014 Helsinki, Finland
ReceiVed: October 26, 2004; In Final Form: March 21, 2005
The infrared (IR) spectra of cuboidic titanium carbide (TiC) nanocrystals have been studied at the density-functional-theory (DFT) level using the Becke-Perdew (BP) functional and triple-ú quality basis sets augmentedby one set of polarization functions (TZVP). The accuracy of the calculations was checked by DFT calculationsusing the Perdew-Burke-Ernzerhof hybrid functional (PBE0) and up to quadruple-ú quality basis setsaugmented by one set of polarization functions (QZVP). The calculated IR spectrum for Ti14C13 (3 × 3 × 3)is found to be in fair agreement with the experimental IR spectrum obtained by infrared resonance-enhancedmultiphoton ionization (IR-REMPI) measurements, whereas, for Ti18C18 (4 × 3 × 3) and Ti32C32 (4 × 4 ×4), the calculated IR spectra differ significantly from the experimental ones. The smallest TiC cluster (Ti4C4,2 × 2 × 2) considered has not been reported in any mass-spectrometer studies. The present DFT calculationsshow that the vibrational modes related to the in-plane vibrations of solid TiC are not observed in the IR-REMPI spectra of nanocrystals larger than Ti14C13. Contrary to solid TiC, the studied TiC nanocrystals arenonmetallic with optical gaps of 0.62 eV (0.55 eV) and 0.028 eV (0.027 eV) for Ti32C32 and Ti108C108 (6 ×6 × 6), calculated at the time-dependent density-functional-theory (TDDFT) level using the BP functional.The HOMO-LUMO gaps obtained in the BP DFT calculations are given within parentheses. At the PBE0DFT level, the HOMO-LUMO gaps for Ti32C32 and Ti108C108 are 1.74 and 0.32 eV, respectively.
I. Introduction
The detection of the first metallocarbohedrene, Ti8C12, wasreported by Guo et al. in 1992,1 and the next year, Pilgrim andDuncan2 reported observations of titanium-carbon species withcubic lattice structures obtained in similar laser vaporizationexperiments. Because of the cluster structure, Pilgrim andDuncan designated them as titanium carbide (TiC) nanocrystals.2
The identification of the TiC nanoclusters relied on mass spectrashowing strong peaks at cluster masses corresponding to face-centered-cuboidic structures withNx × Ny × Nz atoms (Ti orC) in the three Cartesian directions exhibiting a stoichiometricratio of 1:1 for Ti/C. Pilgrim and Duncan2 reported observationsof perfect and truncated TiC nanocrystals such as Ti18C18 (4 ×3 × 3), Ti23C22 (5 × 3 × 3), Ti24C24 (4 × 4 × 3), Ti27C27 (6× 3 × 3), Ti30C30 (5 × 4 × 3), Ti32C32 (4 × 4 × 4), and Ti36C36
(6 × 4 × 3). The existence of these cluster species in molecularbeams have been verified by Helden et al.3 who also detectedlarger TiC nanocrystals such as Ti40C40 (5 × 4 × 4), Ti50C50 (5× 5 × 4), and Ti63C62 (5 × 5 × 5). For a review of varioustransition-metal carbenes, see ref 4.
Larger TiC nanocrystals have been proven to exhibit sto-ichiometric ratios deviating slightly from the expected 1:1.Experimental and computational studies have indicated that thebonds to carbon atoms in the corners of transition-metal carbidenanoclusters are much weaker than those for corner titaniumatoms;5 no perfect crystal fragments with corner carbons haveyet been observed.6 For example, Ti13C14 has not been detectedin any mass-spectrometer measurements, whereas peaks corre-sponding to Ti14C13 and Ti13C6 have been found. The Ti14C13
nanocluster has a cubic (3× 3 × 3) NaCl crystal structure withTi atoms in all eight corners, whereas Ti13C6 corresponds to atruncated 3× 3 × 3 nanocrystal having a titanium atom at the
crystallite center and lacking corner carbons.2,5 More generally,transition-metal carbide nanocrystals with evenNx, Ny, or Nz
seem to lack corner carbons. This conclusion has been drawnfrom mass spectra of vanadium carbide nanocrystals. Since themass of the48Ti isotope and the mass of four carbon atomscoincide, a detailed interpretation of the mass spectra for amixture of TiC nanocrystals is very difficult.6 A recent density-functional-theory (DFT) study has also shown that carbon cornersites are energetically disfavored in transition-metal carbidenanocrystals.5
The mass spectrometry provided the molecular masses of theclusters, and a newly developed experimental technique tomeasure the IR spectra yielded vibrational information aboutthe nanoclusters. The infrared resonance-enhanced multiphotonionization (IR-REMPI) method has been applied on TiCnanocrystals and related species in molecular beams.3,6-10 Also,other experimental techniques have been used to measure thevibrational (IR) spectra of nanoclusters.11 The IR-REMPIspectrum provides low-resolution information about the vibra-tional spectra of the clusters in the beam. For example, it revealswhether any C-C bonds are present in the cluster but only afew bands corresponding to other vibrations can be resolved.IR-REMPI spectroscopy does not yield any detailed fingerprintinformation about the vibrations as traditional IR spectroscopydoes. Thus, it is rather complicated to extract structuralinformation from the measured IR-REMPI spectra. IR-REMPIstudies of C60 have shown that the peaks of the IR-REMPIspectrum are slightly red shifted as compared to ordinary IRspectra.3 Few other techniques to measure IR spectra of TiCnanoclusters have been successful.11 However, nowadays, first-principle computational methods with a rather high accuracycan be used to obtain IR spectra of large nanocrystals and
12503J. Phys. Chem. B2005,109,12503-12508
10.1021/jp045126n CCC: $30.25 © 2005 American Chemical SocietyPublished on Web 06/02/2005
clusters. Comparisons of the calculated and measured IR spectracan facilitate the characterization of the nanoparticles presentin the molecular beam. Such studies on metallocarbohedrenes,M8C12, have been recently reported.12-16 In this work, we extendthis kind of study to include experimentally reported TiCnanocrystals. The IR spectrum for Ti14C13 (3 × 3 × 3) haspreviously been calculated at the DFT level,17 but to the bestof our knowledge, the IR spectra of the larger nanocrystals havenot been previously studied using first-principle computationalmethods.
The experimental IR-REMPI spectra of TiC nanocrystals aredominated by a strong resonance at 485 cm-1, and the positionof the peak is independent of the size of the cluster. For smallerTiC nanoclusters such as Ti14C13, another band appears at 600-
700 cm-1. Electron-energy-loss spectroscopy (EELS) measure-ments on solid TiC indicate that these two bands correspond toatomic motions perpendicular and parallel to the surface of bulkTiC.3,19 For the larger clusters, the IR-REMPI intensity of theband at 600-700 cm-1 is weak, and for the largest clustersconsidered, it even disappears into the background noise. Forvery large TiC clusters, the experimental IR spectrum isexpected to become broad and unstructured, since for them thetransformation from molecular clusters with significant opticalgaps into a conducting species with a small or no optical gap isexpected to occur. For a cluster with an optical gap of the samesize as the energy of the infrared radiation, the IR-REMPIexperiment involves combined electronic and vibrational excita-tions.
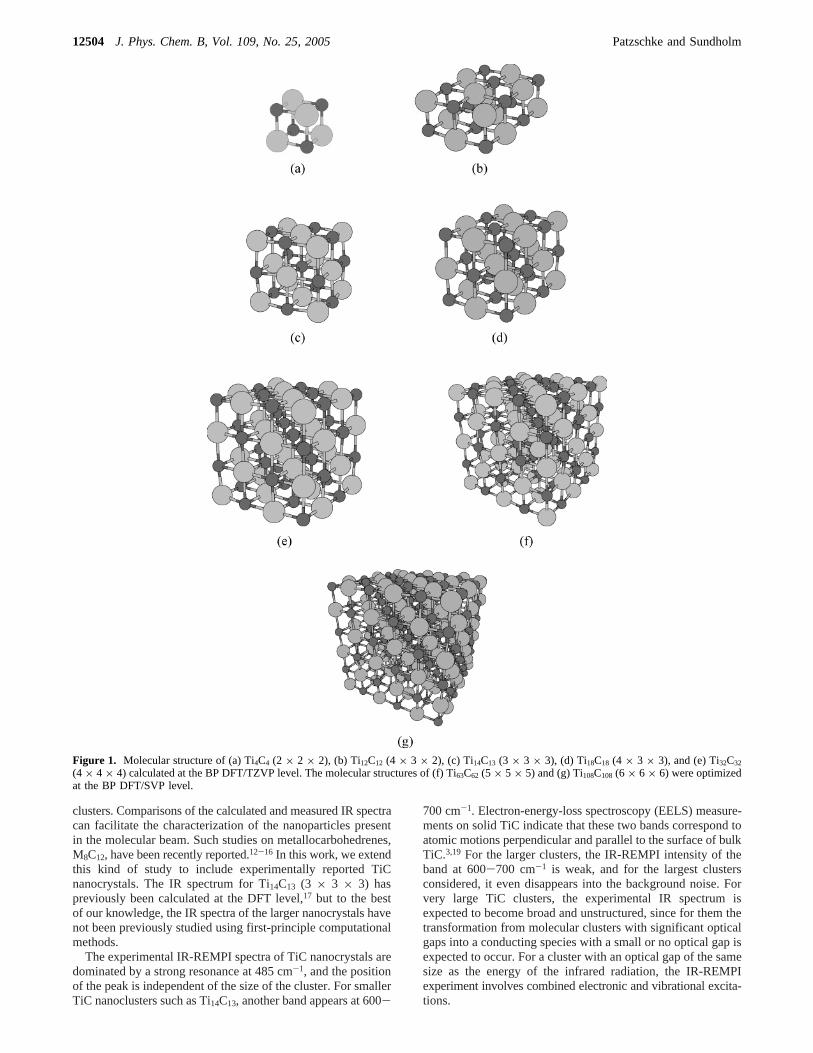
Figure 1. Molecular structure of (a) Ti4C4 (2 × 2 × 2), (b) Ti12C12 (4 × 3 × 2), (c) Ti14C13 (3 × 3 × 3), (d) Ti18C18 (4 × 3 × 3), and (e) Ti32C32
(4 × 4 × 4) calculated at the BP DFT/TZVP level. The molecular structures of (f) Ti63C62 (5 × 5 × 5) and (g) Ti108C108 (6 × 6 × 6) were optimizedat the BP DFT/SVP level.
12504 J. Phys. Chem. B, Vol. 109, No. 25, 2005 Patzschke and Sundholm
Here, we calculate the vibrational spectra of TiC clusters inorder to understand why the IR-REMPI spectra of the TiCclusters do not follow a continuous transformation from the oneobtained for the smallest clusters to a spectrum correspondingto the vibrational levels of solid TiC. The energy gap betweenthe highest occupied molecular orbital (HOMO) and the lowestunoccupied molecular orbital (LUMO) as well as the excitationenergies of the first excited singlet states have also been studiedat the DFT level. The largest species considered in this workare the Ti63C62 (5 × 5 × 5) and Ti108C108 (6 × 6 × 6)nanocrystals.
II. Computational Methods
The molecular structures of the TiC nanocrystals were fullyoptimized at the density-functional-theory (DFT) level20 em-ploying the Becke-Perdew (BP) generalized-gradient ap-proximation (GGA) functional21-23 as implemented in TUR-BOMOLE.24 In the BP DFT calculations, the resolution of theidentity (density fitting) approach was used to speed up thecalculations.20 The Karlsruhe triple-ú valence quality basis setsaugmented by one set of polarization functions (TZVP)25,26wereused as the default basis set in this study. The vibrationalfrequencies were calculated numerically at the BP DFT levelusing the NUMFORCE module of TURBOMOLE.24 Theexcitation energies were calculated at the time-dependentdensity-functional-theory (TDDFT) level using the BPfunctional.27-29 For the smaller TiC clusters, the TZVP basisset was employed in the structural optimizations, in thecalculations of the vibrational frequencies, and in the calculationof the optical gap, whereas the molecular structure calculationsand the calculations of the optical gap of the largest nanocrystals,that is, Ti63C62 and Ti108C108, were performed using split-valencebasis sets augmented with polarization functions (SVP).30
The accuracy of the BP DFT/TZVP calculations was checkedby performing BP DFT calculations on Ti4C4 using theKarlsruhe triple-ú basis sets augmented with double polarizationfunctions (TZVPP) as well as the Karlsruhe quadruple-ú basissets augmented with one set of polarization functions (QZVP).24
DFT calculations using the Perdew-Burke-Ernzerhof hybridfunctional (PBE0)31 were also employed in order to study thechanges in the vibrational frequencies and HOMO-LUMO gapsdue to exact Hartree-Fock exchange terms in the functional.The molecular structures were optimized at the PBE0 DFT/TZVP level for all clusters up to Ti32C32. The vibrationalfrequencies were studied at the PBE0 DFT/TZVP level for Ti4C4
and Ti14C13. The PBE0 DFT/SVP single-point calculations onTi63C62 and Ti108C108 suffered from convergence problems.
III. Structures
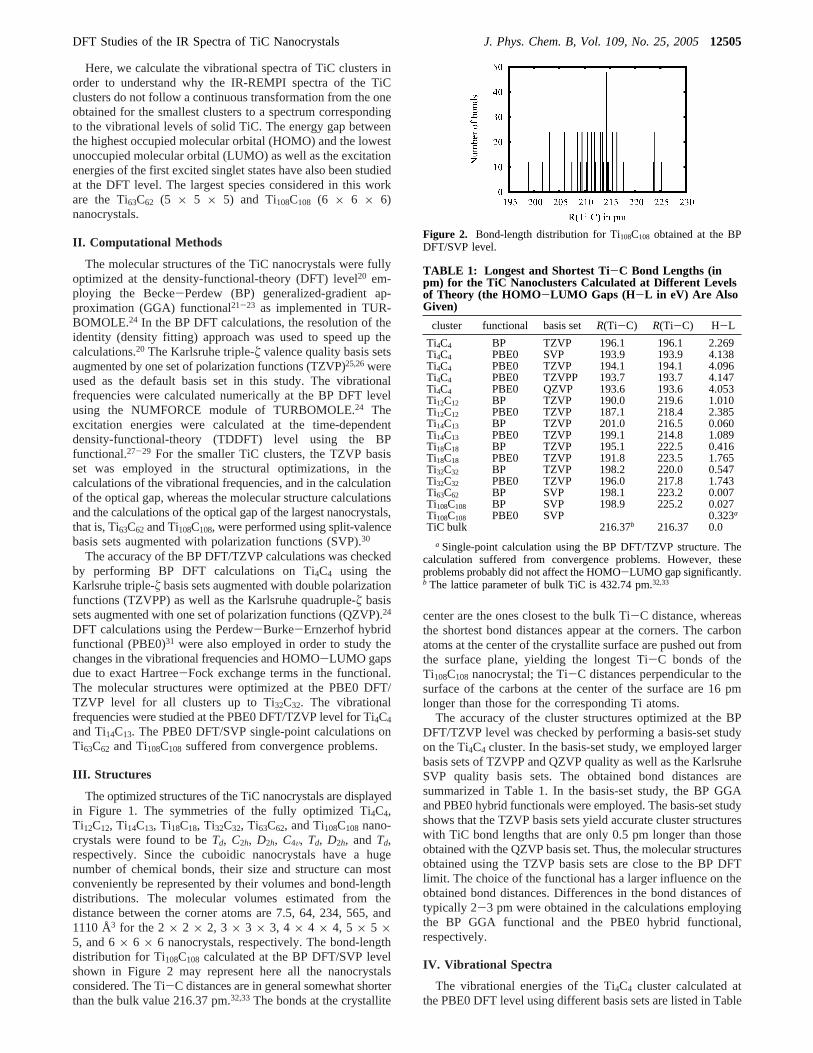
The optimized structures of the TiC nanocrystals are displayedin Figure 1. The symmetries of the fully optimized Ti4C4,Ti12C12, Ti14C13, Ti18C18, Ti32C32, Ti63C62, and Ti108C108 nano-crystals were found to beTd, C2h, D2h, C4V, Td, D2h, and Td,respectively. Since the cuboidic nanocrystals have a hugenumber of chemical bonds, their size and structure can mostconveniently be represented by their volumes and bond-lengthdistributions. The molecular volumes estimated from thedistance between the corner atoms are 7.5, 64, 234, 565, and1110 Å3 for the 2× 2 × 2, 3 × 3 × 3, 4 × 4 × 4, 5 × 5 ×5, and 6× 6 × 6 nanocrystals, respectively. The bond-lengthdistribution for Ti108C108 calculated at the BP DFT/SVP levelshown in Figure 2 may represent here all the nanocrystalsconsidered. The Ti-C distances are in general somewhat shorterthan the bulk value 216.37 pm.32,33The bonds at the crystallite
center are the ones closest to the bulk Ti-C distance, whereasthe shortest bond distances appear at the corners. The carbonatoms at the center of the crystallite surface are pushed out fromthe surface plane, yielding the longest Ti-C bonds of theTi108C108 nanocrystal; the Ti-C distances perpendicular to thesurface of the carbons at the center of the surface are 16 pmlonger than those for the corresponding Ti atoms.
The accuracy of the cluster structures optimized at the BPDFT/TZVP level was checked by performing a basis-set studyon the Ti4C4 cluster. In the basis-set study, we employed largerbasis sets of TZVPP and QZVP quality as well as the KarlsruheSVP quality basis sets. The obtained bond distances aresummarized in Table 1. In the basis-set study, the BP GGAand PBE0 hybrid functionals were employed. The basis-set studyshows that the TZVP basis sets yield accurate cluster structureswith TiC bond lengths that are only 0.5 pm longer than thoseobtained with the QZVP basis set. Thus, the molecular structuresobtained using the TZVP basis sets are close to the BP DFTlimit. The choice of the functional has a larger influence on theobtained bond distances. Differences in the bond distances oftypically 2-3 pm were obtained in the calculations employingthe BP GGA functional and the PBE0 hybrid functional,respectively.
IV. Vibrational Spectra
The vibrational energies of the Ti4C4 cluster calculated atthe PBE0 DFT level using different basis sets are listed in Table
Figure 2. Bond-length distribution for Ti108C108 obtained at the BPDFT/SVP level.
TABLE 1: Longest and Shortest Ti-C Bond Lengths (inpm) for the TiC Nanoclusters Calculated at Different Levelsof Theory (the HOMO-LUMO Gaps (H-L in eV) Are AlsoGiven)
cluster functional basis set R(Ti-C) R(Ti-C) H-L
Ti4C4 BP TZVP 196.1 196.1 2.269Ti4C4 PBE0 SVP 193.9 193.9 4.138Ti4C4 PBE0 TZVP 194.1 194.1 4.096Ti4C4 PBE0 TZVPP 193.7 193.7 4.147Ti4C4 PBE0 QZVP 193.6 193.6 4.053Ti12C12 BP TZVP 190.0 219.6 1.010Ti12C12 PBE0 TZVP 187.1 218.4 2.385Ti14C13 BP TZVP 201.0 216.5 0.060Ti14C13 PBE0 TZVP 199.1 214.8 1.089Ti18C18 BP TZVP 195.1 222.5 0.416Ti18C18 PBE0 TZVP 191.8 223.5 1.765Ti32C32 BP TZVP 198.2 220.0 0.547Ti32C32 PBE0 TZVP 196.0 217.8 1.743Ti63C62 BP SVP 198.1 223.2 0.007Ti108C108 BP SVP 198.9 225.2 0.027Ti108C108 PBE0 SVP 0.323aTiC bulk 216.37b 216.37 0.0
a Single-point calculation using the BP DFT/TZVP structure. Thecalculation suffered from convergence problems. However, theseproblems probably did not affect the HOMO-LUMO gap significantly.b The lattice parameter of bulk TiC is 432.74 pm.32,33
DFT Studies of the IR Spectra of TiC Nanocrystals J. Phys. Chem. B, Vol. 109, No. 25, 200512505
2. The vibrational energies are almost independent of the sizeof the basis set used. The largest energy difference of 17 cm-1
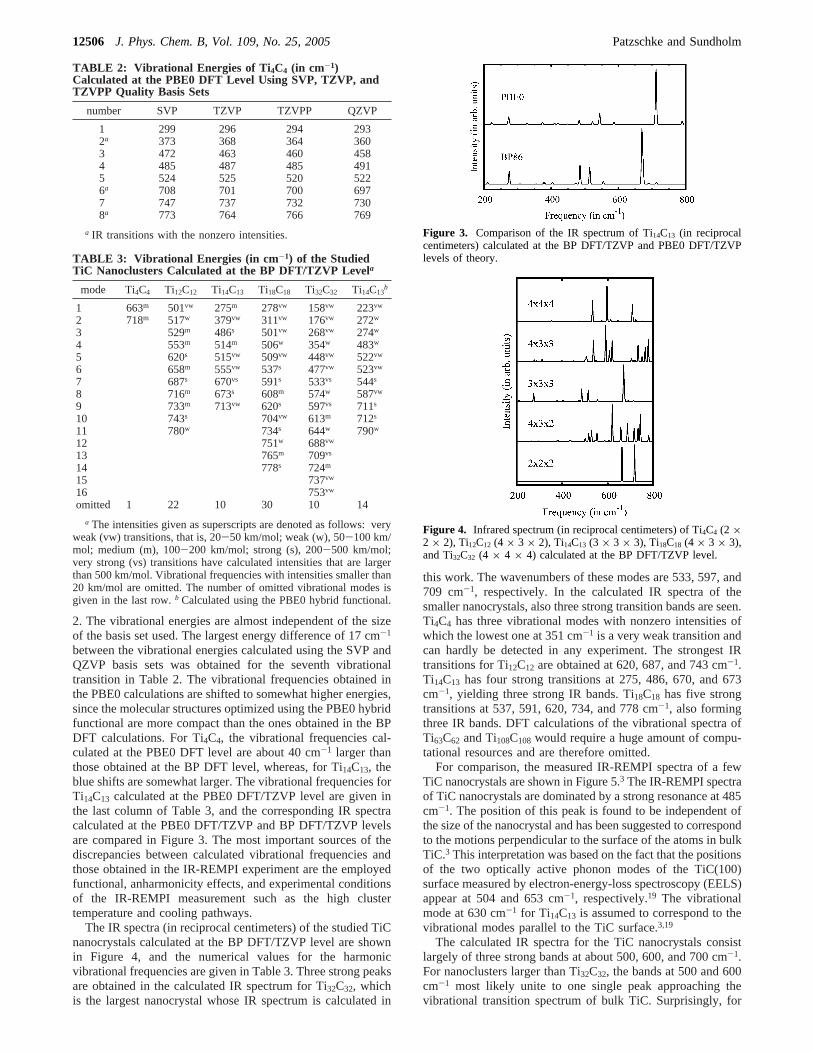
between the vibrational energies calculated using the SVP andQZVP basis sets was obtained for the seventh vibrationaltransition in Table 2. The vibrational frequencies obtained inthe PBE0 calculations are shifted to somewhat higher energies,since the molecular structures optimized using the PBE0 hybridfunctional are more compact than the ones obtained in the BPDFT calculations. For Ti4C4, the vibrational frequencies cal-culated at the PBE0 DFT level are about 40 cm-1 larger thanthose obtained at the BP DFT level, whereas, for Ti14C13, theblue shifts are somewhat larger. The vibrational frequencies forTi14C13 calculated at the PBE0 DFT/TZVP level are given inthe last column of Table 3, and the corresponding IR spectracalculated at the PBE0 DFT/TZVP and BP DFT/TZVP levelsare compared in Figure 3. The most important sources of thediscrepancies between calculated vibrational frequencies andthose obtained in the IR-REMPI experiment are the employedfunctional, anharmonicity effects, and experimental conditionsof the IR-REMPI measurement such as the high clustertemperature and cooling pathways.
The IR spectra (in reciprocal centimeters) of the studied TiCnanocrystals calculated at the BP DFT/TZVP level are shownin Figure 4, and the numerical values for the harmonicvibrational frequencies are given in Table 3. Three strong peaksare obtained in the calculated IR spectrum for Ti32C32, whichis the largest nanocrystal whose IR spectrum is calculated in
this work. The wavenumbers of these modes are 533, 597, and709 cm-1, respectively. In the calculated IR spectra of thesmaller nanocrystals, also three strong transition bands are seen.Ti4C4 has three vibrational modes with nonzero intensities ofwhich the lowest one at 351 cm-1 is a very weak transition andcan hardly be detected in any experiment. The strongest IRtransitions for Ti12C12 are obtained at 620, 687, and 743 cm-1.Ti14C13 has four strong transitions at 275, 486, 670, and 673cm-1, yielding three strong IR bands. Ti18C18 has five strongtransitions at 537, 591, 620, 734, and 778 cm-1, also formingthree IR bands. DFT calculations of the vibrational spectra ofTi63C62 and Ti108C108 would require a huge amount of compu-tational resources and are therefore omitted.
For comparison, the measured IR-REMPI spectra of a fewTiC nanocrystals are shown in Figure 5.3 The IR-REMPI spectraof TiC nanocrystals are dominated by a strong resonance at 485cm-1. The position of this peak is found to be independent ofthe size of the nanocrystal and has been suggested to correspondto the motions perpendicular to the surface of the atoms in bulkTiC.3 This interpretation was based on the fact that the positionsof the two optically active phonon modes of the TiC(100)surface measured by electron-energy-loss spectroscopy (EELS)appear at 504 and 653 cm-1, respectively.19 The vibrationalmode at 630 cm-1 for Ti14C13 is assumed to correspond to thevibrational modes parallel to the TiC surface.3,19
The calculated IR spectra for the TiC nanocrystals consistlargely of three strong bands at about 500, 600, and 700 cm-1.For nanoclusters larger than Ti32C32, the bands at 500 and 600cm-1 most likely unite to one single peak approaching thevibrational transition spectrum of bulk TiC. Surprisingly, for
TABLE 2: Vibrational Energies of Ti 4C4 (in cm-1)Calculated at the PBE0 DFT Level Using SVP, TZVP, andTZVPP Quality Basis Sets
number SVP TZVP TZVPP QZVP
1 299 296 294 2932a 373 368 364 3603 472 463 460 4584 485 487 485 4915 524 525 520 5226a 708 701 700 6977 747 737 732 7308a 773 764 766 769
a IR transitions with the nonzero intensities.
TABLE 3: Vibrational Energies (in cm -1) of the StudiedTiC Nanoclusters Calculated at the BP DFT/TZVP Levela
mode Ti4C4 Ti12C12 Ti14C13 Ti18C18 Ti32C32 Ti14C13b
1 663m 501vw 275m 278vw 158vw 223vw
2 718m 517w 379vw 311vw 176vw 272w
3 529m 486s 501vw 268vw 274w
4 553m 514m 506w 354w 483w
5 620s 515vw 509vw 448vw 522vw
6 658m 555vw 537s 477vw 523vw
7 687s 670vs 591s 533vs 544s
8 716m 673s 608m 574w 587vw
9 733m 713vw 620s 597vs 711s
10 743s 704vw 613m 712s
11 780w 734s 644w 790w
12 751w 688vw
13 765m 709vs
14 778s 724m
15 737vw
16 753vw
omitted 1 22 10 30 10 14
a The intensities given as superscripts are denoted as follows: veryweak (vw) transitions, that is, 20-50 km/mol; weak (w), 50-100 km/mol; medium (m), 100-200 km/mol; strong (s), 200-500 km/mol;very strong (vs) transitions have calculated intensities that are largerthan 500 km/mol. Vibrational frequencies with intensities smaller than20 km/mol are omitted. The number of omitted vibrational modes isgiven in the last row.b Calculated using the PBE0 hybrid functional.
Figure 3. Comparison of the IR spectrum of Ti14C13 (in reciprocalcentimeters) calculated at the BP DFT/TZVP and PBE0 DFT/TZVPlevels of theory.
Figure 4. Infrared spectrum (in reciprocal centimeters) of Ti4C4 (2 ×2 × 2), Ti12C12 (4 × 3 × 2), Ti14C13 (3 × 3 × 3), Ti18C18 (4 × 3 × 3),and Ti32C32 (4 × 4 × 4) calculated at the BP DFT/TZVP level.
12506 J. Phys. Chem. B, Vol. 109, No. 25, 2005 Patzschke and Sundholm
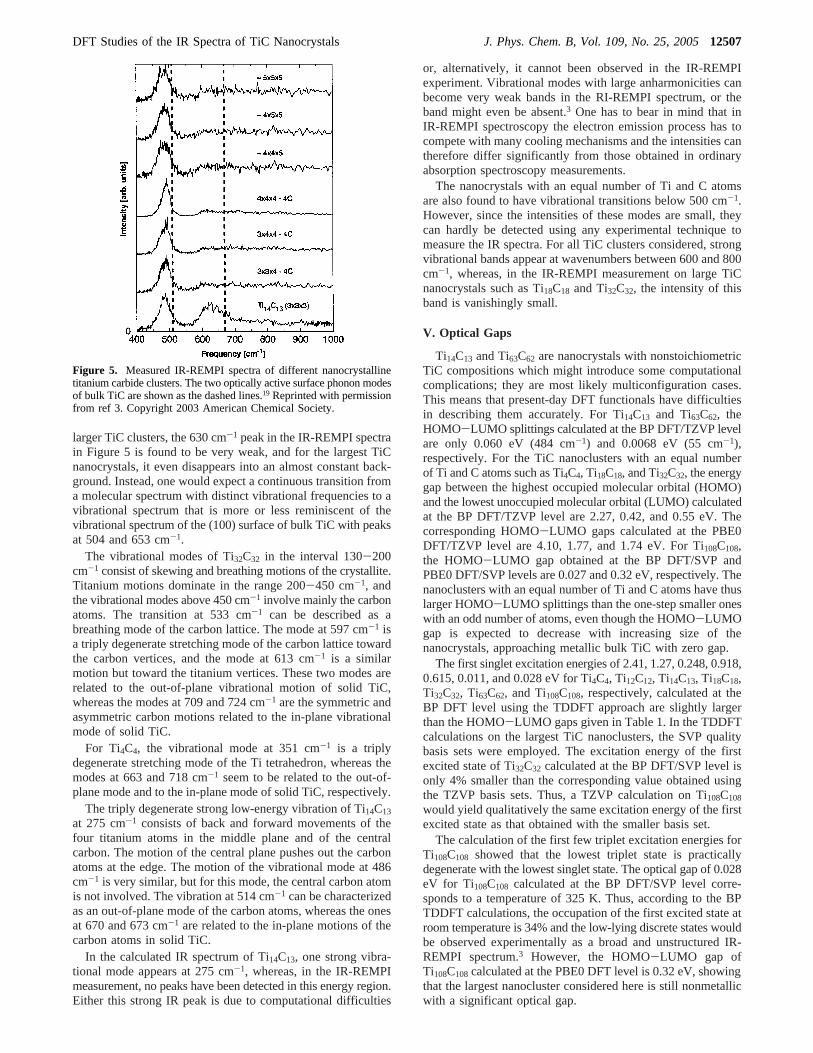
larger TiC clusters, the 630 cm-1 peak in the IR-REMPI spectrain Figure 5 is found to be very weak, and for the largest TiCnanocrystals, it even disappears into an almost constant back-ground. Instead, one would expect a continuous transition froma molecular spectrum with distinct vibrational frequencies to avibrational spectrum that is more or less reminiscent of thevibrational spectrum of the (100) surface of bulk TiC with peaksat 504 and 653 cm-1.
The vibrational modes of Ti32C32 in the interval 130-200cm-1 consist of skewing and breathing motions of the crystallite.Titanium motions dominate in the range 200-450 cm-1, andthe vibrational modes above 450 cm-1 involve mainly the carbonatoms. The transition at 533 cm-1 can be described as abreathing mode of the carbon lattice. The mode at 597 cm-1 isa triply degenerate stretching mode of the carbon lattice towardthe carbon vertices, and the mode at 613 cm-1 is a similarmotion but toward the titanium vertices. These two modes arerelated to the out-of-plane vibrational motion of solid TiC,whereas the modes at 709 and 724 cm-1 are the symmetric andasymmetric carbon motions related to the in-plane vibrationalmode of solid TiC.
For Ti4C4, the vibrational mode at 351 cm-1 is a triplydegenerate stretching mode of the Ti tetrahedron, whereas themodes at 663 and 718 cm-1 seem to be related to the out-of-plane mode and to the in-plane mode of solid TiC, respectively.
The triply degenerate strong low-energy vibration of Ti14C13
at 275 cm-1 consists of back and forward movements of thefour titanium atoms in the middle plane and of the centralcarbon. The motion of the central plane pushes out the carbonatoms at the edge. The motion of the vibrational mode at 486cm-1 is very similar, but for this mode, the central carbon atomis not involved. The vibration at 514 cm-1 can be characterizedas an out-of-plane mode of the carbon atoms, whereas the onesat 670 and 673 cm-1 are related to the in-plane motions of thecarbon atoms in solid TiC.
In the calculated IR spectrum of Ti14C13, one strong vibra-tional mode appears at 275 cm-1, whereas, in the IR-REMPImeasurement, no peaks have been detected in this energy region.Either this strong IR peak is due to computational difficulties
or, alternatively, it cannot been observed in the IR-REMPIexperiment. Vibrational modes with large anharmonicities canbecome very weak bands in the RI-REMPI spectrum, or theband might even be absent.3 One has to bear in mind that inIR-REMPI spectroscopy the electron emission process has tocompete with many cooling mechanisms and the intensities cantherefore differ significantly from those obtained in ordinaryabsorption spectroscopy measurements.
The nanocrystals with an equal number of Ti and C atomsare also found to have vibrational transitions below 500 cm-1.However, since the intensities of these modes are small, theycan hardly be detected using any experimental technique tomeasure the IR spectra. For all TiC clusters considered, strongvibrational bands appear at wavenumbers between 600 and 800cm-1, whereas, in the IR-REMPI measurement on large TiCnanocrystals such as Ti18C18 and Ti32C32, the intensity of thisband is vanishingly small.
V. Optical Gaps
Ti14C13 and Ti63C62 are nanocrystals with nonstoichiometricTiC compositions which might introduce some computationalcomplications; they are most likely multiconfiguration cases.This means that present-day DFT functionals have difficultiesin describing them accurately. For Ti14C13 and Ti63C62, theHOMO-LUMO splittings calculated at the BP DFT/TZVP levelare only 0.060 eV (484 cm-1) and 0.0068 eV (55 cm-1),respectively. For the TiC nanoclusters with an equal numberof Ti and C atoms such as Ti4C4, Ti18C18, and Ti32C32, the energygap between the highest occupied molecular orbital (HOMO)and the lowest unoccupied molecular orbital (LUMO) calculatedat the BP DFT/TZVP level are 2.27, 0.42, and 0.55 eV. Thecorresponding HOMO-LUMO gaps calculated at the PBE0DFT/TZVP level are 4.10, 1.77, and 1.74 eV. For Ti108C108,the HOMO-LUMO gap obtained at the BP DFT/SVP andPBE0 DFT/SVP levels are 0.027 and 0.32 eV, respectively. Thenanoclusters with an equal number of Ti and C atoms have thuslarger HOMO-LUMO splittings than the one-step smaller oneswith an odd number of atoms, even though the HOMO-LUMOgap is expected to decrease with increasing size of thenanocrystals, approaching metallic bulk TiC with zero gap.
The first singlet excitation energies of 2.41, 1.27, 0.248, 0.918,0.615, 0.011, and 0.028 eV for Ti4C4, Ti12C12, Ti14C13, Ti18C18,Ti32C32, Ti63C62, and Ti108C108, respectively, calculated at theBP DFT level using the TDDFT approach are slightly largerthan the HOMO-LUMO gaps given in Table 1. In the TDDFTcalculations on the largest TiC nanoclusters, the SVP qualitybasis sets were employed. The excitation energy of the firstexcited state of Ti32C32 calculated at the BP DFT/SVP level isonly 4% smaller than the corresponding value obtained usingthe TZVP basis sets. Thus, a TZVP calculation on Ti108C108
would yield qualitatively the same excitation energy of the firstexcited state as that obtained with the smaller basis set.
The calculation of the first few triplet excitation energies forTi108C108 showed that the lowest triplet state is practicallydegenerate with the lowest singlet state. The optical gap of 0.028eV for Ti108C108 calculated at the BP DFT/SVP level corre-sponds to a temperature of 325 K. Thus, according to the BPTDDFT calculations, the occupation of the first excited state atroom temperature is 34% and the low-lying discrete states wouldbe observed experimentally as a broad and unstructured IR-REMPI spectrum.3 However, the HOMO-LUMO gap ofTi108C108 calculated at the PBE0 DFT level is 0.32 eV, showingthat the largest nanocluster considered here is still nonmetallicwith a significant optical gap.
Figure 5. Measured IR-REMPI spectra of different nanocrystallinetitanium carbide clusters. The two optically active surface phonon modesof bulk TiC are shown as the dashed lines.19 Reprinted with permissionfrom ref 3. Copyright 2003 American Chemical Society.
DFT Studies of the IR Spectra of TiC Nanocrystals J. Phys. Chem. B, Vol. 109, No. 25, 200512507
Even though TiC is metallic in the bulk, the presentnanocrystals are nonmetallic. The low-lying excited states ofthe nanocrystals form discrete states just above the Fermi level,whereas the band with a large density of states (DOS) is stillwell-separated from the Fermi level. For the largest clusters,the discrete states approach the Fermi level and the band alsoexpands toward longer wavelengths. For Ti32C32, the HOMO-LUMO gap calculated at the BP DFT/TZVP level is 0.55 eVand the band structure begins to appear at about 1.5 eV abovethe Fermi level. By comparison, Ti4C4 has at the BP DFT/TZVPlevel a HOMO-LUMO gap of 2.27 eV and its band with alarge DOS lies above 8 eV. This is probably how the transitionfrom nonmetallic nanocrystals to a solid-state metallic materialoccurs.
VI. Conclusions
In this paper, we have demonstrated the possibility ofcalculating IR absorption spectra for large TiC nanocrystals.The calculated spectra are compared to vibrational spectraobtained using the infrared resonance-enhanced multiphotonionization (IR-REMPI) experimental technique.3 The calculatedand measured spectra largely agree, but some significantdiscrepancies are also obtained. For Ti32C32, three strong bandsare calculated at 533, 597, and 709 cm-1, respectively, whereasthe experimental spectrum shows only one strong band at 450-500 cm-1. The band at 600-700 cm-1 detected for Ti14C13
becomes very weak for the larger TiC nanocrystals, and for thelargest ones, it even disappears into the background noise (seeFigure 5), whereas, according to the calculations, the strongvibrational modes at 600-700 cm-1 are present also in the largernanocrystals even though they are not observed in the IR-REMPImeasurement. The notion that the vibrational properties ofTi14C13 (3 × 3 × 3) are very close to those of bulk TiC andbridging the gap between TiC nanocrystals and bulk is not quitecorrect; the agreement between the energy of the vibrationalbands of Ti14C13 obtained using IR-REMPI spectroscopy andthe vibrational energies of bulk TiC seems to be fortuitous. Allnanocrystals studied in this work are found to be nonmetallic;the HOMO-LUMO gap of the largest TiC nanocrystal, that is,of Ti108C108 (6 × 6 × 6) is calculated at the PBE0 DFT/SVPlevel to be 0.32 eV. For the largest nanocrystals, the first signsof the transition from nonmetallic nanocrystals to a metallicconductor become apparent.
Acknowledgment. We acknowledge financial support fromthe European research training network on “UnderstandingNanomaterials from a Quantum Perspective” (NANOQUANT),Contract No. MRTN-CT-2003-506842, from the Nordisk For-skerakademi network for research and research training (NorFAGrant No. 030262) on “Quantum Modeling of Molecular
Materials'′ (QMMM), from The Academy of Finland (FAprojects 53915, 200903, and 206102), and from MagnusEhrnrooth’s Foundation. We also thank Prof. Reinhart Ahlrichs(Karlsruhe) for an up-to-date version of the TURBOMOLEprogram package and CSCsScientific Computing Ltd. forcomputer time.
References and Notes
(1) Guo, B. C.; Kerns, K. P.; Castleman, A. W., Jr.Science1992, 255,1411.
(2) Pilgrim, J. S.; Duncan, M. A.J. Am. Chem. Soc.1993, 115, 9724.(3) von Helden, G.; van Heijnsbergen, D.; Meijer, G.J. Phys. Chem.
A 2003, 107, 1671.(4) Rohmer, M. M.; Be´nard, M.; Poblet, J. M.Chem. ReV. 2000, 100,
495.(5) Zhang, Q.; Lewis, S. P.Chem. Phys. Lett.2003, 372, 836.(6) von Helden, G.; van Heijnsbergen, D.; Duncan, M. A.; Meijer, G.
Chem. Phys. Lett.2001, 333, 350.(7) van Heijnsbergen, D.; von Helden, G.; Duncan, M. A.; van Roij,
A. J. A.; Meijer, G.Phys. ReV. Lett. 1999, 83, 4983.(8) von Helden, G.; Tielens, A. G. G. M.; van Heijnsbergen, D.;
Duncan, M. A.; Hony, S.; Waters, L. B. F. M.; Meijer, G.Science2000,288, 313.
(9) van Heijnsbergen, D.; Duncan, M. A.; Meijer, G.; von Helden, G.Chem. Phys. Lett.2001, 349, 220.
(10) van Heijnsbergen, D.; Fielicke, A.; Meijer, G.; von Helden, G.Phys.ReV. Lett. 2002, 89, 013401.
(11) Selvan, R.; Pradeep, T.Chem. Phys. Lett.1999, 309, 149.(12) Gueorguiev, G. K.; Pacheco, J. M.Phys. ReV. B 2003, 68, 241401.(13) Gueorguiev, G. K.; Pacheco, J. M.Phys. ReV. Lett. 2002, 88,
115504.(14) Baruah, T.; Pederson, M. R.; Lyn, M. L.; Castleman, A. W., Jr.
Phys. ReV. A 2002, 66, 053201.(15) Baruah, T.; Pederson, M. R.Phys. ReV. B 2002, 66, 241404.(16) Hou, H.; Muckerman, J. T.; Liu, P.; Rodrigues, J. A.J. Phys. Chem.
A 2003, 107, 9344.(17) Liu, P.; Rodriguez, J. A.; Hou, H.; Muckerman, J. T.J. Chem.
Phys.2003, 118, 7737.(18) Postnikov, A. V.; Entel, P.Phase Transitions2004, 77, 149.(19) Oshima, C.; Aizawa, T.; Wuttig, M.; Souda, R.; Otani, S.; Ishizawa,
Y.; Ishida, H.; Terakura, K.Phys. ReV. B 1987, 36, 7510.(20) Eichkorn, K.; Treutler, O.; O¨ hm, H.; Haser, M.; Ahlrichs, R.Chem.
Phys. Lett.1995, 240, 283.(21) Vosko, S. H.; Wilk, L.; Nusair, M.Can. J. Phys.1980, 58, 1200.(22) Perdew, J. P.Phys. ReV. B 1986, 33, 8822.(23) Becke, A. D.Phys. ReV. A 1988, 38, 3098.(24) Ahlrichs, R.; Ba¨r, M.; Haser, M.; Horn, H.; Ko¨lmel, C.Chem. Phys.
Lett. 1989, 162, 165 (for current version, see http://www.turbomole.de).(25) Scha¨fer, A.; Huber, C.; Ahlrichs, R.J. Chem. Phys.1994, 100,
5829.(26) http://www.turbomole.de/.(27) Bauernschmitt, R.; Ahlrichs, R.Chem. Phys. Lett.1996, 256, 454.(28) Bauernschmitt, R.; Ha¨ser, M.; Treutler, O.; Ahlrichs, R.Chem. Phys.
Lett. 1997, 264, 573.(29) Furche, F.; Ahlrichs, R.J. Chem. Phys.2002, 117, 7433.(30) Scha¨fer, A.; Horn, H.; Ahlrichs, R.J. Chem. Phys.1992, 97, 2571.(31) Perdew, J. P.; Burke, K.; Ernzerhof, M.Phys. ReV. Lett.1996, 77,
3865.(32) Toth, L. E.Transition Metal Carbides and Nitrides; Academic
Press: New York, 1971.(33) Barret, C. S.; Massalski, T. B.Structure of Metals: Crystallographic
Methods, Principles, and Data; Pergamon Press: New York, 1980.
12508 J. Phys. Chem. B, Vol. 109, No. 25, 2005 Patzschke and Sundholm


![INDEX []€¦ · BORON CARBIDE 42 BORON NITRIDE 34 BRINELL 22 BURNT REFRACTORIES 30 CALCIUM ALUMINATE 2 ... TITANIUM DIOXIDE 26 TITANIUM SLAG 39 TUNDISH SLAG 40 TUNGSTEN CARBIDE 42](https://img.pdfslide.us/doc/110x75/60670eb2f72be5794e2aa264/index-boron-carbide-42-boron-nitride-34-brinell-22-burnt-refractories-30-calcium.jpg)