Embed Size (px)
Citation preview
Density dependence is prevalent in a heterogeneous subtropicalforest
Yan Zhu, Xiangcheng Mi, Haibao Ren and Keping Ma
Y. Zhu, X. C. Mi, H. B. Ren and K. P. Ma ([email protected]), State Key Laboratory of Vegetation and Environmental Change, Inst. ofBotany, Chinese Academy of Sciences, 20 Nanxincun, Xiangshan, CN�Beijing 100093, China.
Although negative conspecific density dependence among neighbours is widely studied, the general prevalence of theeffects is still poorly understood due to a lack of studies from zonal forests other than the tropics. In addition, thedetection of density dependence may be confounded by the influence of habitat heterogeneity. Here we examinedthe spatial distributions of 47 common tree species (diameter at breast height]1 cm) using the pair-correlation functiong(r) in a fully mapped 24-ha subtropical forest in China. We first investigated whether habitat heterogeneity influencedtree distributions, and then examined the conspecific tree patterns and density dependence after removing the effects ofhabitat heterogeneity. We found that the forest plot exhibited strong large-scale heterogeneity in the distribution of bothlarge adult trees of different growth forms and individual species. After the habitat heterogeneity was accounted for, 39 ofthe 47 species (83.0%) were found to exhibit density dependence predominantly at close distances among neighbors. Ourfindings highlight density dependence as a prevalent mechanism for regulating the population spatial structure of mosttree species in the species-rich subtropical forest studied here. Furthermore, the occurrence of density dependence isclosely associated with species abundance and the strength of conspecific aggregation at local scales. Abundant specieswith high strength of conspecific aggregation tend to show density dependence.
Since Janzen (1970) and Connell (1971) reported theimpairing performance of conspecific neighbours in tropicalforest communities 40 years ago, negative density depen-dence has long been considered a potentially importantmechanism regulating population dynamics and facilitat-ing species coexistence (Wright 2002). Numerous studies ofindividual species have found evidence for negative densitydependence (Hubbell et al. 1990, Zimmerman et al. 2008).Some studies even directly verified that pests and patho-gens could cause density-dependent mortality (Bell et al.2006). Community-level evaluations of conspecific densitydependence have been provided by recent articles fromfully-censused tropical forest plots. For example, Harmset al. (2000) have shown prevailing evidence of densitydependent recruitment at seed-to-seedling transition andseedling stages, further verifying that density dependencepromotes coexistence of diverse species in the 50-ha BarroColorado Island (BCI) plot in Panama. Strong densitydependence was also found to be responsible for themortality of over 80% of tree species in the BCI plot andPasoh plot of Malaysia (Peters 2003) among trees largerthan 1 cm dbh. Nonetheless, there has been only weakevidence of density dependence in other zonal forests ascontrasted with the tropics (Hille Ris Lambers et al. 2002,Hyatt et al. 2003). Carson et al. (2008) found that 81% ofstudies of density dependence were from tropical forestplots, mainly conducted in BCI and Pasoh, and few studies
in subtropical forests have found evidence for densitydependence at the community level (Connell et al. 1984).Therefore, an important question is raised: are thesefindings from the tropical forests geographically biased?No comparable results from other large-scale subtropicalforest plots have been reported so far.
Although the above-mentioned studies have pointedto the importance of density-dependent regulation on thedynamics of tree populations in tropical forests, densitydependence may be confounded by other factors, notablyhabitat heterogeneity (Plotkin et al. 2000, Wiegand et al.2007, Murrell 2009). For example, spatial habitat hetero-geneity (e.g. less suitable habitats versus favorable habitats)might result in higher mortality in less suitable habitatsand increased survival in favorable habitats (Wright 2002,Getzin et al. 2008). He and Duncan (2000) found thatresults of detecting density-dependent effects could bealtered by controlling for the confounding influence ofelevation on tree survival, and they emphasized theimportance of considering habitat factors in exploringdensity dependence effects. These studies suggested theneed to control for or remove habitat heterogeneity ininferring the importance of density dependence in regulat-ing tree communities.
There are several possible density dependent effects,e.g. distance dependence of increased mortality of offspringnear parent trees (Janzen�Connell hypothesis) (Hubbell
Oikos 119: 109�119, 2010
doi: 10.1111/j.1600-0706.2009.17758.x,
# 2009 The Authors. Journal compilation # 2009 Oikos
Subject Editor: Thorsten Wiegand. Accepted 5 June 2009
109
et al. 1990, Condit et al. 1992, Hyatt et al. 2003), densitydependent thinning (random mortality hypothesis) (Kenkel1988), and a community compensatory trend (CCT)describing an inverse interspecific relationship betweenabundant species and rare species (Connell et al. 1984).The common method of detecting these effects is tocompare growth or mortality of individuals with the densityof a focal species, or the distance from parent trees (Wright2002). Another widely used method is to infer densitydependence from the spatial distribution of trees (Ford1975, Kenkel 1988, Getzin et al. 2006, Wiegand et al.2007). Density-dependence is a mechanism occurringamong neighbours due to resource competition, pestfacilitation, and allelopathy (Janzen 1970, Wright 2002).If there is strong density dependence, the distribution oflive trees that survived the effects is expected to be moreregular and conspecific clustering is expected to declinewith increasing size classes (Sterner et al. 1986, Barot et al.1999). Thus, comparison of the spatial patterns of differentsize classes may be used to indirectly detect densitydependence if no data on tree mortality is available. Thismethod requires a temporal invariance of the spatialpatterns of the different size classes.
Although spatial point pattern analysis is an effectiveapproach for detecting density dependence, the methodsuffers from the problem that habitat heterogeneity can alsosubstantially influence the spatial distribution of trees bothtoward aggregation (more common, Getzin et al. 2008)and toward regularity (less common, Chapin et al. 1989).Therefore, it is critical to take into account habitatheterogeneity when evaluating density dependence.
Following this line of reasoning, Getzin et al. (2008)analyzed density-dependent thinning in western hemlockpopulations using adults of western hemlock as a ‘control’to account for the biasing effects of habitat heterogeneity.Another work that explicitly considered habitat heteroge-neity is the one of Wiegand et al. (2007) who analyzed largesize trees (�10 cm in dbh) in the Sinharaja forest of SriLanka and found 24 of 46 common tree species showedregular or random patterns after conditioning on the largescale patterns which were likely to be driven by habitatheterogeneity. These studies have greatly improved ourunderstanding of the magnitude of density dependence inforest communities and have also provided sophisticatedanalytical tools to make unbiased inferences of densitydependence.
In this study, we explore the prevalence of densitydependence in a species-rich subtropical forest consideringthe potentially confounding effect of habitat heterogeneity.We also study the effect of species abundance andconspecific aggregation on the detection of density depen-dence. We analyze data from a newly established 24 hastem-mapping plot, the first of its kind in a subtropicalforest in China, named Gutianshan Forest Dynamic Plot(hereafter Gutianshan FDP; Legendre et al. 2009). Morecomprehensive than Wiegand et al. (2007), our analysisincludes trees with dbh]1 cm. By including small trees theeffects of density dependence will be more evident, sincesmall trees are likely more susceptible to the effects.
Our study consisted of three analytical steps. We firstassessed whether the environmental conditions of thestudy plot were heterogeneous. Second, we factored out
large-scale effects in the spatial patterns (beyond the scaleof direct tree�tree interactions) to selectively study small-scale effects (i.e. conspecific aggregation and regularity)which are likely to be caused by tree�tree interactionsbut could be caused by small-scale heterogeneity as well.This analysis allowed us to examine whether the majorityof examined species are still spatially aggregated afterremoving confounding large-scale effects and explain theoccurrence of density dependence combined with con-specific aggregation. Finally, we used a case-control designto examined ‘pure’ density dependence after factoring outhabitat heterogeneity, and explored the relationship ofdensity dependence with species abundance and conspe-cific aggregation.
Material and methods
Study site and data collection
Gutianshan FDP is located in Gutianshan NationalNature Reserve (29810?19ƒ�29817?41ƒN, 118803?49ƒ�118811?12ƒE) of eastern China (Fig. 1). Mean tempera-ture at Gutianshan Reserve ranges from 4.38C in Januaryto 27.98C in July with an annual mean of 15.38C. Themean annual frost-free period lasts 250 days. The meanannual precipitation is 1963.7 mm. There are two wetseasons, from March to June and September, and two dryseasons, from July to August and October to February.The plot encompasses a complicated and steep terrain withelevation ranging from 446.3 to 714.9 m a.s.l., and themean slope is about 37.528 and ranges from 12.798 to 628(Fig. 1).
The 600�400 m plot was established from November2004 to September 2005 as a part of the Chinese ForestBiodiversity Monitoring Networks with the aim to monitorlong-term changes in a subtropical evergreen broadleavedforest. All woody stems ]1 cm dbh in the plot weremapped, measured, identified to species and tagged. Wedocumented 140 700 individuals ]1 cm dbh belongingto 49 families, 103 genera and 159 species. Fagaceae,Lauraceae, Theaceae and Magnoliaceae are the dominantfamilies in the old-growth forest (Zhu et al. 2008). Specieswere grouped by maximum attainable height into threegrowth forms: shrubs (B5 m), understory trees (]5 andB15 m), and canopy trees (]15 m).
To obtain a sufficiently large sample size, we analyzedthe spatial pattern of 47 common species with ]40individuals at each life history stage (Supplementarymaterial Appendix 1). These species comprised 90.1% ofthe stems in the plot.
Point pattern analysis
We mainly used the pair-correlation functions g(r) toanalyze the spatial pattern of tree distributions at differentscales. The pair-correlation function g(r) is a counterpart tothe widely used K-function (Ripley 1976, Wiegand andMoloney 2004, Illian et al. 2008), which is calculated as:
110

g(r)�1
2ppdk(r)
d(r)(1)
K(r) is a cumulative distribution function where K(r) is theexpected number of points within the entire circle of agiven radius r around a typical point of the pattern dividedby the intensity l of the pattern. The values of K(r) atlarger scales include the values of K(r) at smaller scales,so that K(r) cannot detect significant point�point interac-tions at specific spatial scales (Wiegand and Moloney2004, Loosmore and Ford 2006). In contrast, the g(r)is a non-accumulative distribution function in which g(r)is the expected density of points in a ring of a givendistance r around a focal point divided by the intensityl of the pattern (Stoyan and Stoyan 1994, Dale et al.2002). The g-function may effectively identify what point�point interactions occur at specific scales and estimatethe strength of aggregation/regularity. If g(r)�1 there aremore points at distance r than expected under a randompattern, which indicates aggregation at scale r.
Biological questions and null models
Analysis 1. The effects of habitat heterogeneity onspatial patternsHabitat heterogeneity and the effects of plant interactionsmay cause locally elevated point densities and are thereforedifficult to separate. In general, only certain aspects ofheterogeneity can be detected (Illian et al. 2008). Getzinet al. (2008) used a relatively simple method to test forlarge-scale effects of heterogeneity on local tree density.They argued that mature trees can be expected to exploit allavailable sites (except canopy gaps) which have undergoneexcessive thinning due to habitat quality, so that thecombined spatial pattern of large adult trees of all speciesshould capture strong habitat factors common to all species.Thus, aggregation of all adults at larger scales (e.g. r�10 min boreal forests) should indicate heterogeneity (Stoyan andPenttinen 2000, Wiegand et al. 2007, Getzin et al. 2008).Note that there may be effects of plant�plant interactionsat small scales.
The pair correlation g-function and the L-function(the transformed K-function L(r)�[k(r)/p]0.5�r) show atypical behavior if the intensity of the pattern varies at largerscales (Wiegand and Moloney 2004). In this case theg-function does not approach the expected value of g(r)�1for scales r�rp where rp is the scale at which directtree-tree interactions should become unimportant. TheL-function shows a strong increase and does not drop forlarger scales to the expected value of L(r)�0. Cumulativeproperties of L(r) at larger scales (Besag 1977) facilitatevisual interpretation of large-scale habitat heterogeneity, sowe also used L(r) to test it.
We analyzed the joined spatial pattern of all old adulttrees of three different growth forms separately: shrubs withdbh]3 cm, under-story trees with dbh]10 cm, andcanopy trees with dbh]20 cm. The joined spatial patternof all old adult trees of a given growth form should reflect theeffects of heterogeneity common to all species. However, thejoined spatial pattern of all old adult trees may overrideeffects of individual niches and of species where the adults donot show aggregation at larger scales. Therefore we furtheranalyzed the spatial pattern of adults of each speciesindividually (Supplementary material Appendix 2).
Analysis 2. Population spatial patterns after removinglarge-scale effectsTo investigate the second-order characteristics (i.e. tree�treeinteractions) of the spatial patterns of tree species, we usedthe heterogeneous Poisson process (HP; Wiegand et al.2007) as the null model. Our approach is based on theassumption of separation of scales (Wiegand et al. 2007);in other words, habitat heterogeneity influences spatialdistribution of trees only at larger scales, typically alonggradients related to topography, whereas direct tree�treeinteractions take place at smaller scales. In this case, theheterogeneous Poisson process can reveal the second-ordercharacteristics of the spatial patterns of tree species byconditioning on the large scale pattern.
The heterogeneous Poisson process displaces the originallocation of all trees randomly within a circular moving
Figure 1. The location and contour map of the 24-ha Gutianshan FDP, China. The number in the contour map is relative height (m),and the unit of (x, y) � axes is meters.
111

window of radius R. This small displacement destroys smallscale patterns of the locations of the trees while keeping thelarge scale pattern unchanged. This allows us to selectivelystudy small-scale effects. However, this method is not ableto disentangle potential effects of small-scale heterogeneities(e.g. microsites see Fajardo and McIntire 2007) and tree�tree interactions.
In order to implement the heterogeneous Poissonprocess, we first estimated the intensity function l(x, y)of the pattern by using a moving window of bandwidth R(Wiegand and Moloney 2004, Wiegand et al. 2007). Theintensity l(x, y) is conducted by summing all stems ofthe circle window and then weighting them with a non-parametric kernel (Wiegand and Moloney 2004, Wiegandet al. 2007). The nonparametric kernel is defined as:
eR(d)�3
4R
�1�
d2
R2
��R5d5R
0; otherwise
(2)
8<:
where R is the bandwidth, d is the distance from a focalpoint. In the second step we generated random pointswithin the study plot but retained a point with a probabilitygiven by the intensity function l(x, y). This producespatterns with intensity function l(x, y). We selected aconservative value of R�30 m, and expected that thesignificant aggregation of tree�tree interactions shouldoccur at small scales and disappear well below 30 m. Ifthis is not the case the assumption of separation of scalesmay not hold (Wiegand et al. 2007).
We used a goodness-of-fit (GOF) test to assesssignificant departures from the null model. The p-valueof the observed pattern is calculated as follows
p�1�rank[u0] � 1
s(3)
where u0 is a summary statistic that measures thediscrepancy between the empirical and the expected paircorrelation function over a distance interval of interest. Thefunction rank[u0] returns the rank of u0 within the valuesof the corresponding summary statistics ui (i�1, . . . s)for each of the s simulations of the null model. We furtheranalyzed only those data sets with an observed p-valueB0.005 and a rank�995 (Loosmore and Ford 2006,Wiegand et al. 2007).
We used Spearman’s rho statistic (Hollander and Wolfe1973) to estimate the relationship between species abun-dance and conspecific aggregation measured by the maximalvalue of the pair correlation function, species abundanceand density dependence, and conspecific aggregation anddensity dependence.
Analysis 3. Conspecific density dependence using a casecontrol designAccounting for heterogeneity when testing for densitydependence is not easy because numerous environmentalcovariates are difficult to quantify (He and Duncan 2000,Wiegand et al. 2007). Getzin et al. (2008) approximatelysolved the problem through a population-based case-controlstudy using random labeling (RL) as the null model. Theapproach rests on three assumptions: 1) cases (smaller sizeclass trees) and controls (adults) deriving from the same
population are exposed to the same stochastic processesunder habitat heterogeneity (Wiegand and Moloney 2004),2) small-sized trees as well as adult trees should beapproximately in an equilibrium stage and not e.g. invadingthe study plot or declining, 3) the large-scale pattern ofadult trees reflects the underlying habitat heterogeneity,which is created by excessive thinning through life-historystages (Getzin et al. 2008). Under the null hypothesis ofrandom labeling, cases are a random sub-sample of thejoined patterns of cases and controls (Wiegand andMoloney 2004, Diggle et al. 2007). By comparing thecase patterns with control patterns, the case-controlapproach may identify specific factors (i.e. density depen-dence) other than habitat heterogeneity that may influencethe patterns of trees of smaller size classes (cases) up throughincreasing size classes if the null hypothesis is rejected.
We used adults as controls (pattern 1), to account forunderlying heterogeneity and smaller size class trees as cases(pattern 2) with g21(r)�g22(r) as test statistics in practicalapplications. Under the random labeling null model,g21(r)�g22(r), but if the cases show additional aggregationwhich is independent from the control pattern we findg21(r)�g22(r)B0 (Getzin et al. 2008). We expected theextent of additional aggregation to decline with size classes,thus revealing the effects of density dependence on theestablishment of cases.
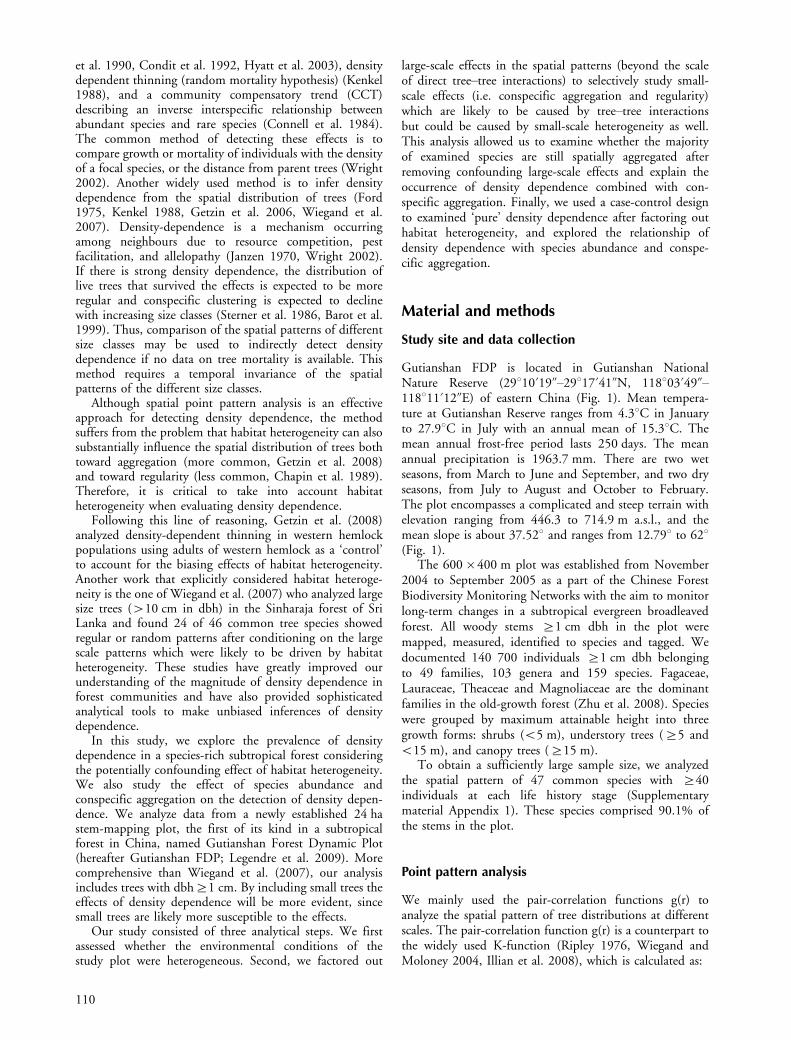
A formula can express this: d(r)�dj(r)�ds(r). Thefunction dj(r) returns the value taken by g21(r)�g22(r)over the scales r when the ‘cases’ are juveniles and thefunction ds(r) is the value when the ‘cases’ are saplings.The function d(r) reflects density-dependent thinningif d(r)�0, dmax is the maximum strength of density-dependent thinning when d(r) takes the maximal value.The rthin reflects the scales at which density-dependentthinning takes place, and rmax is the scale at which thestrength of density-dependent thinning peaks. We providedan example to illustrate our method on how to analyzedensity dependence by using the spatial distribution ofDistylium myricoides (Fig. 2a�c).
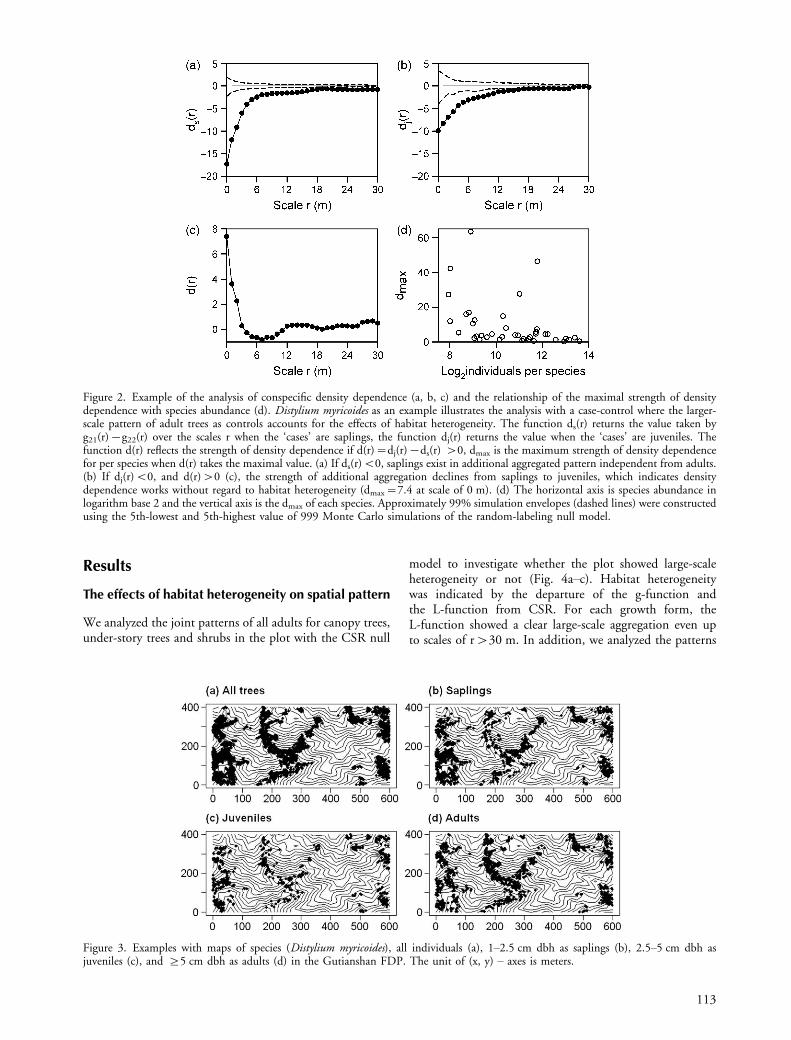
We classified population of different growth forms intothree size classes to define three life history stages: sapling,juvenile, and adult (see examples in Fig. 3). For shrubs, weclassified individuals of 1�1.5 cm dbh as saplings, 1.5�2 cmdbh as juveniles, and ]2 cm dbh as adults; similarly, forunder-story trees, we considered 1�2.5 cm dbh as saplings,2.5�5 cm dbh as juveniles, and ]5 cm dbh as adults; andfor canopy trees, we categorized 1�5 cm dbh as saplings,5�10 cm dbh as juveniles, and ]10 cm dbh as adults.
In all analyses, we used a grid size of 1 m2 and a ring widthof 3 m for analysis of plant�plant interactions at spatial scalesof 0 m up to 30 m. This is a fine resolution compared to the600�400 m size of the study plot and is sufficient to capturedetailed variation in the pair-correlation function over therange of scales where we expected significant effects up to30 m. Significant departure from null models was evaluatedusing the 5th-lowest and 5th-highest value of 999 MonteCarlo simulations of the null model to generate approxi-mately 99% simulation envelopes.
All point pattern analyses in this paper were done usingsoftware R 2.6.0 (R Development Core Team) and the grid-based software Programita (Wiegand and Moloney 2004).
112
Results
The effects of habitat heterogeneity on spatial pattern
We analyzed the joint patterns of all adults for canopy trees,under-story trees and shrubs in the plot with the CSR null
model to investigate whether the plot showed large-scaleheterogeneity or not (Fig. 4a�c). Habitat heterogeneitywas indicated by the departure of the g-function andthe L-function from CSR. For each growth form, theL-function showed a clear large-scale aggregation even upto scales of r�30 m. In addition, we analyzed the patterns
Figure 2. Example of the analysis of conspecific density dependence (a, b, c) and the relationship of the maximal strength of densitydependence with species abundance (d). Distylium myricoides as an example illustrates the analysis with a case-control where the larger-scale pattern of adult trees as controls accounts for the effects of habitat heterogeneity. The function ds(r) returns the value taken byg21(r)�g22(r) over the scales r when the ‘cases’ are saplings, the function dj(r) returns the value when the ‘cases’ are juveniles. Thefunction d(r) reflects the strength of density dependence if d(r)�dj(r)�ds(r) �0, dmax is the maximum strength of density dependencefor per species when d(r) takes the maximal value. (a) If ds(r)B0, saplings exist in additional aggregated pattern independent from adults.(b) If dj(r)B0, and d(r)�0 (c), the strength of additional aggregation declines from saplings to juveniles, which indicates densitydependence works without regard to habitat heterogeneity (dmax�7.4 at scale of 0 m). (d) The horizontal axis is species abundance inlogarithm base 2 and the vertical axis is the dmax of each species. Approximately 99% simulation envelopes (dashed lines) were constructedusing the 5th-lowest and 5th-highest value of 999 Monte Carlo simulations of the random-labeling null model.
Figure 3. Examples with maps of species (Distylium myricoides), all individuals (a), 1�2.5 cm dbh as saplings (b), 2.5�5 cm dbh asjuveniles (c), and ]5 cm dbh as adults (d) in the Gutianshan FDP. The unit of (x, y) � axes is meters.
113
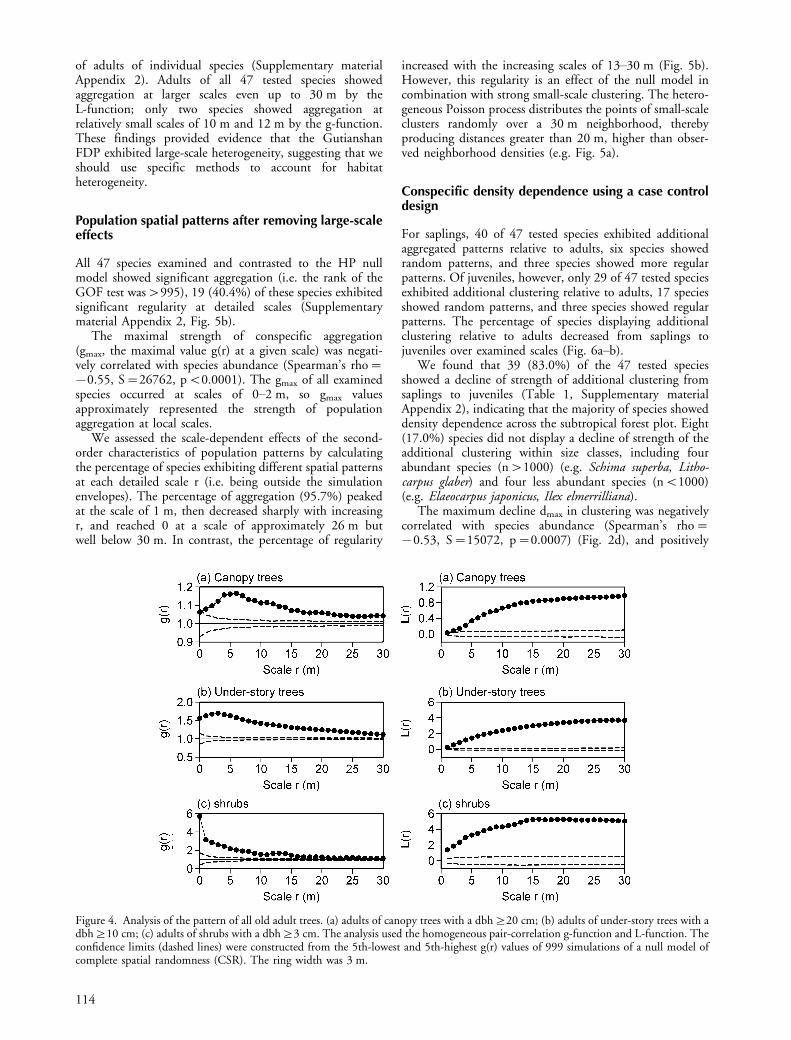
of adults of individual species (Supplementary materialAppendix 2). Adults of all 47 tested species showedaggregation at larger scales even up to 30 m by theL-function; only two species showed aggregation atrelatively small scales of 10 m and 12 m by the g-function.These findings provided evidence that the GutianshanFDP exhibited large-scale heterogeneity, suggesting that weshould use specific methods to account for habitatheterogeneity.
Population spatial patterns after removing large-scaleeffects
All 47 species examined and contrasted to the HP nullmodel showed significant aggregation (i.e. the rank of theGOF test was�995), 19 (40.4%) of these species exhibitedsignificant regularity at detailed scales (Supplementarymaterial Appendix 2, Fig. 5b).
The maximal strength of conspecific aggregation(gmax, the maximal value g(r) at a given scale) was negati-vely correlated with species abundance (Spearman’s rho��0.55, S�26762, pB0.0001). The gmax of all examinedspecies occurred at scales of 0�2 m, so gmax valuesapproximately represented the strength of populationaggregation at local scales.
We assessed the scale-dependent effects of the second-order characteristics of population patterns by calculatingthe percentage of species exhibiting different spatial patternsat each detailed scale r (i.e. being outside the simulationenvelopes). The percentage of aggregation (95.7%) peakedat the scale of 1 m, then decreased sharply with increasingr, and reached 0 at a scale of approximately 26 m butwell below 30 m. In contrast, the percentage of regularity
increased with the increasing scales of 13�30 m (Fig. 5b).However, this regularity is an effect of the null model incombination with strong small-scale clustering. The hetero-geneous Poisson process distributes the points of small-scaleclusters randomly over a 30 m neighborhood, therebyproducing distances greater than 20 m, higher than obser-ved neighborhood densities (e.g. Fig. 5a).
Conspecific density dependence using a case controldesign
For saplings, 40 of 47 tested species exhibited additionalaggregated patterns relative to adults, six species showedrandom patterns, and three species showed more regularpatterns. Of juveniles, however, only 29 of 47 tested speciesexhibited additional clustering relative to adults, 17 speciesshowed random patterns, and three species showed regularpatterns. The percentage of species displaying additionalclustering relative to adults decreased from saplings tojuveniles over examined scales (Fig. 6a�b).
We found that 39 (83.0%) of the 47 tested speciesshowed a decline of strength of additional clustering fromsaplings to juveniles (Table 1, Supplementary materialAppendix 2), indicating that the majority of species showeddensity dependence across the subtropical forest plot. Eight(17.0%) species did not display a decline of strength of theadditional clustering within size classes, including fourabundant species (n�1000) (e.g. Schima superba, Litho-carpus glaber) and four less abundant species (nB1000)(e.g. Elaeocarpus japonicus, Ilex elmerrilliana).
The maximum decline dmax in clustering was negativelycorrelated with species abundance (Spearman’s rho��0.53, S�15072, p�0.0007) (Fig. 2d), and positively
Figure 4. Analysis of the pattern of all old adult trees. (a) adults of canopy trees with a dbh]20 cm; (b) adults of under-story trees with adbh]10 cm; (c) adults of shrubs with a dbh]3 cm. The analysis used the homogeneous pair-correlation g-function and L-function. Theconfidence limits (dashed lines) were constructed from the 5th-lowest and 5th-highest g(r) values of 999 simulations of a null model ofcomplete spatial randomness (CSR). The ring width was 3 m.
114
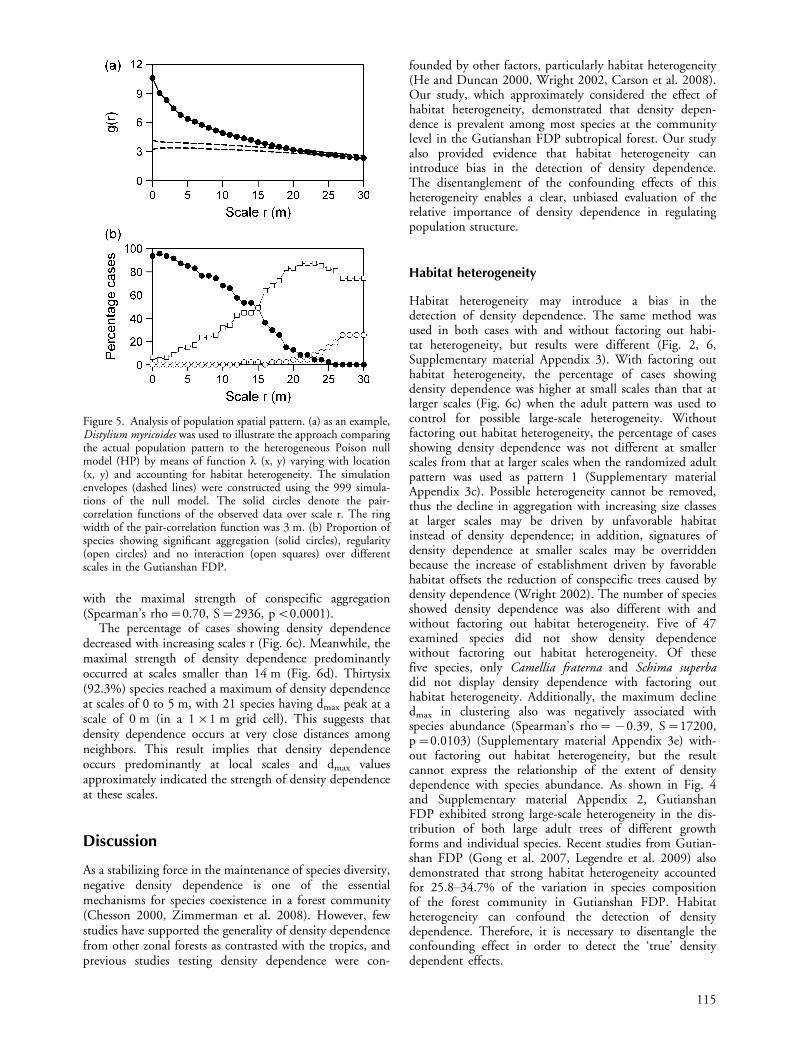
with the maximal strength of conspecific aggregation(Spearman’s rho�0.70, S�2936, pB0.0001).
The percentage of cases showing density dependencedecreased with increasing scales r (Fig. 6c). Meanwhile, themaximal strength of density dependence predominantlyoccurred at scales smaller than 14 m (Fig. 6d). Thirtysix(92.3%) species reached a maximum of density dependenceat scales of 0 to 5 m, with 21 species having dmax peak at ascale of 0 m (in a 1�1 m grid cell). This suggests thatdensity dependence occurs at very close distances amongneighbors. This result implies that density dependenceoccurs predominantly at local scales and dmax valuesapproximately indicated the strength of density dependenceat these scales.
Discussion
As a stabilizing force in the maintenance of species diversity,negative density dependence is one of the essentialmechanisms for species coexistence in a forest community(Chesson 2000, Zimmerman et al. 2008). However, fewstudies have supported the generality of density dependencefrom other zonal forests as contrasted with the tropics, andprevious studies testing density dependence were con-
founded by other factors, particularly habitat heterogeneity(He and Duncan 2000, Wright 2002, Carson et al. 2008).Our study, which approximately considered the effect ofhabitat heterogeneity, demonstrated that density depen-dence is prevalent among most species at the communitylevel in the Gutianshan FDP subtropical forest. Our studyalso provided evidence that habitat heterogeneity canintroduce bias in the detection of density dependence.The disentanglement of the confounding effects of thisheterogeneity enables a clear, unbiased evaluation of therelative importance of density dependence in regulatingpopulation structure.
Habitat heterogeneity
Habitat heterogeneity may introduce a bias in thedetection of density dependence. The same method wasused in both cases with and without factoring out habi-tat heterogeneity, but results were different (Fig. 2, 6,Supplementary material Appendix 3). With factoring outhabitat heterogeneity, the percentage of cases showingdensity dependence was higher at small scales than that atlarger scales (Fig. 6c) when the adult pattern was used tocontrol for possible large-scale heterogeneity. Withoutfactoring out habitat heterogeneity, the percentage of casesshowing density dependence was not different at smallerscales from that at larger scales when the randomized adultpattern was used as pattern 1 (Supplementary materialAppendix 3c). Possible heterogeneity cannot be removed,thus the decline in aggregation with increasing size classesat larger scales may be driven by unfavorable habitatinstead of density dependence; in addition, signatures ofdensity dependence at smaller scales may be overriddenbecause the increase of establishment driven by favorablehabitat offsets the reduction of conspecific trees caused bydensity dependence (Wright 2002). The number of speciesshowed density dependence was also different with andwithout factoring out habitat heterogeneity. Five of 47examined species did not show density dependencewithout factoring out habitat heterogeneity. Of thesefive species, only Camellia fraterna and Schima superbadid not display density dependence with factoring outhabitat heterogeneity. Additionally, the maximum declinedmax in clustering also was negatively associated withspecies abundance (Spearman’s rho��0.39, S�17200,p�0.0103) (Supplementary material Appendix 3e) with-out factoring out habitat heterogeneity, but the resultcannot express the relationship of the extent of densitydependence with species abundance. As shown in Fig. 4and Supplementary material Appendix 2, GutianshanFDP exhibited strong large-scale heterogeneity in the dis-tribution of both large adult trees of different growthforms and individual species. Recent studies from Gutian-shan FDP (Gong et al. 2007, Legendre et al. 2009) alsodemonstrated that strong habitat heterogeneity accountedfor 25.8�34.7% of the variation in species compositionof the forest community in Gutianshan FDP. Habitatheterogeneity can confound the detection of densitydependence. Therefore, it is necessary to disentangle theconfounding effect in order to detect the ‘true’ densitydependent effects.
Figure 5. Analysis of population spatial pattern. (a) as an example,Distylium myricoides was used to illustrate the approach comparingthe actual population pattern to the heterogeneous Poison nullmodel (HP) by means of function l (x, y) varying with location(x, y) and accounting for habitat heterogeneity. The simulationenvelopes (dashed lines) were constructed using the 999 simula-tions of the null model. The solid circles denote the pair-correlation functions of the observed data over scale r. The ringwidth of the pair-correlation function was 3 m. (b) Proportion ofspecies showing significant aggregation (solid circles), regularity(open circles) and no interaction (open squares) over differentscales in the Gutianshan FDP.
115

Conspecific density dependence
The prevalence of density dependenceThe majority of evidence for the prevalence of densitydependence comes from tropical forests, with only limitedevidence from other zonal forests (Carson et al. 2008). Forexample, Connell et al. (1984) found little evidence fordensity dependent growth or mortality at the communitylevel through 18 years of study in an Australian subtropicalforest. In the Gutianshan FDP, 83.0% of examined speciesdisplayed density dependent effects among established trees(]1 cm dbh) (Table 1). This finding clearly providedsupport for the generality of density dependence afteraccounting for heterogeneity in a subtropical forest.Additionally, it is worth an emphasis that the findingbenefits from the analysis of fine scales. Not like otherstudies that used larger scales of ]5 m for this analysis
(Wills et al. 1997, Peters 2003), our study applied a 1 mfine-scale of pair correlation function g(r). As densitydependence was strongest among neighbours at a 1 m scale,the analysis at fine scales may increase the probability ofdetecting density-dependent signatures, and facilitates usdetecting the prevalence of density dependence.
The proportion of species in our study affected bydensity dependence at the community level was similar tothat found in other tropical forests (Wills et al. 1997,Harms et al. 2000, Peters 2003, Uriate et al. 2004). Thissuggests that density dependence is not more prevalent intropical forests, although the number of species exhibit-ing density dependence in studies by Peters (2003)was considered to be overestimated (Leigh et al. 2004,Zimmerman et al. 2008). In temperate deciduous forests,Hille Ris Lambers et al. (2002) also found the proportionof species exhibiting density dependence was equivalent to
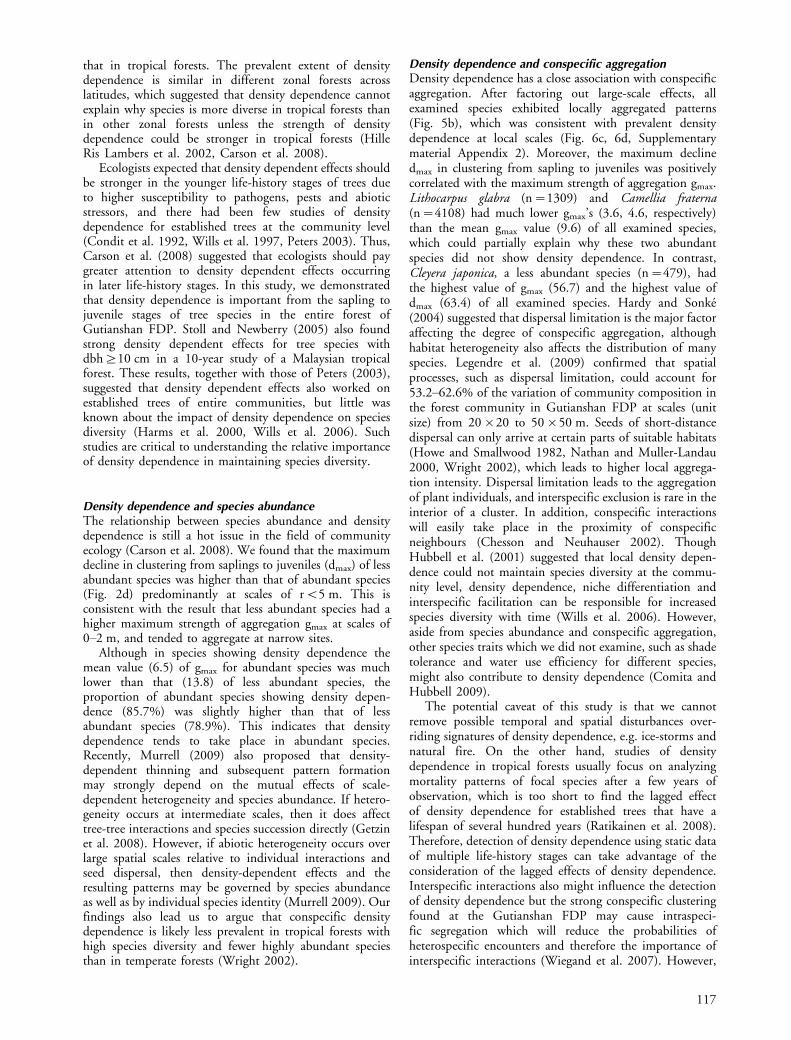
Figure 6. The analysis of scale-dependence of density dependence. (a, b) Proportion of species showing the test statistic g21(r)�g22(r)B0(solid circles), g21(r)�g22(r)�0 (open circles) and g21(r)�g22(r)�0 (the data are inside the simulation envelopes, open squares) overscales at the Gutianshan FDP. (a) saplings as ‘cases’, (b) juveniles as ‘cases’, (c) proportion of examined species showing densitydependence at detailed scales. (d) The number of tested species for which the strength of density dependence peaked at the range of scalesof 0 to 30 m. An arrow denotes that no species shows the maximal strength of density dependence beyond 14 m.
Table 1. The number of species examined (]100 trees in the forest plot) in each growth form, and the number of species exhibiting densitydependence or not (The percentage of species showing such effects follows in parenthesis).
Growth forms Examined No. species showing density dependent effects or not
showing the effects not showing the effects
Canopy trees 18 15 (83.3) 3 (16.7)Under-story trees 24 21 (87.5) 3 (12.5)Shrubs 5 3 (60.0) 2 (40.0)In total 47 39 (83.0) 8 (17.0)
116
that in tropical forests. The prevalent extent of densitydependence is similar in different zonal forests acrosslatitudes, which suggested that density dependence cannotexplain why species is more diverse in tropical forests thanin other zonal forests unless the strength of densitydependence could be stronger in tropical forests (HilleRis Lambers et al. 2002, Carson et al. 2008).
Ecologists expected that density dependent effects shouldbe stronger in the younger life-history stages of trees dueto higher susceptibility to pathogens, pests and abioticstressors, and there had been few studies of densitydependence for established trees at the community level(Condit et al. 1992, Wills et al. 1997, Peters 2003). Thus,Carson et al. (2008) suggested that ecologists should paygreater attention to density dependent effects occurringin later life-history stages. In this study, we demonstratedthat density dependence is important from the sapling tojuvenile stages of tree species in the entire forest ofGutianshan FDP. Stoll and Newberry (2005) also foundstrong density dependent effects for tree species withdbh]10 cm in a 10-year study of a Malaysian tropicalforest. These results, together with those of Peters (2003),suggested that density dependent effects also worked onestablished trees of entire communities, but little wasknown about the impact of density dependence on speciesdiversity (Harms et al. 2000, Wills et al. 2006). Suchstudies are critical to understanding the relative importanceof density dependence in maintaining species diversity.
Density dependence and species abundanceThe relationship between species abundance and densitydependence is still a hot issue in the field of communityecology (Carson et al. 2008). We found that the maximumdecline in clustering from saplings to juveniles (dmax) of lessabundant species was higher than that of abundant species(Fig. 2d) predominantly at scales of rB5 m. This isconsistent with the result that less abundant species had ahigher maximum strength of aggregation gmax at scales of0�2 m, and tended to aggregate at narrow sites.
Although in species showing density dependence themean value (6.5) of gmax for abundant species was muchlower than that (13.8) of less abundant species, theproportion of abundant species showing density depen-dence (85.7%) was slightly higher than that of lessabundant species (78.9%). This indicates that densitydependence tends to take place in abundant species.Recently, Murrell (2009) also proposed that density-dependent thinning and subsequent pattern formationmay strongly depend on the mutual effects of scale-dependent heterogeneity and species abundance. If hetero-geneity occurs at intermediate scales, then it does affecttree-tree interactions and species succession directly (Getzinet al. 2008). However, if abiotic heterogeneity occurs overlarge spatial scales relative to individual interactions andseed dispersal, then density-dependent effects and theresulting patterns may be governed by species abundanceas well as by individual species identity (Murrell 2009). Ourfindings also lead us to argue that conspecific densitydependence is likely less prevalent in tropical forests withhigh species diversity and fewer highly abundant speciesthan in temperate forests (Wright 2002).
Density dependence and conspecific aggregationDensity dependence has a close association with conspecificaggregation. After factoring out large-scale effects, allexamined species exhibited locally aggregated patterns(Fig. 5b), which was consistent with prevalent densitydependence at local scales (Fig. 6c, 6d, Supplementarymaterial Appendix 2). Moreover, the maximum declinedmax in clustering from sapling to juveniles was positivelycorrelated with the maximum strength of aggregation gmax.Lithocarpus glabra (n�1309) and Camellia fraterna(n�4108) had much lower gmax’s (3.6, 4.6, respectively)than the mean gmax value (9.6) of all examined species,which could partially explain why these two abundantspecies did not show density dependence. In contrast,Cleyera japonica, a less abundant species (n�479), hadthe highest value of gmax (56.7) and the highest value ofdmax (63.4) of all examined species. Hardy and Sonke(2004) suggested that dispersal limitation is the major factoraffecting the degree of conspecific aggregation, althoughhabitat heterogeneity also affects the distribution of manyspecies. Legendre et al. (2009) confirmed that spatialprocesses, such as dispersal limitation, could account for53.2�62.6% of the variation of community composition inthe forest community in Gutianshan FDP at scales (unitsize) from 20�20 to 50�50 m. Seeds of short-distancedispersal can only arrive at certain parts of suitable habitats(Howe and Smallwood 1982, Nathan and Muller-Landau2000, Wright 2002), which leads to higher local aggrega-tion intensity. Dispersal limitation leads to the aggregationof plant individuals, and interspecific exclusion is rare in theinterior of a cluster. In addition, conspecific interactionswill easily take place in the proximity of conspecificneighbours (Chesson and Neuhauser 2002). ThoughHubbell et al. (2001) suggested that local density depen-dence could not maintain species diversity at the commu-nity level, density dependence, niche differentiation andinterspecific facilitation can be responsible for increasedspecies diversity with time (Wills et al. 2006). However,aside from species abundance and conspecific aggregation,other species traits which we did not examine, such as shadetolerance and water use efficiency for different species,might also contribute to density dependence (Comita andHubbell 2009).
The potential caveat of this study is that we cannotremove possible temporal and spatial disturbances over-riding signatures of density dependence, e.g. ice-storms andnatural fire. On the other hand, studies of densitydependence in tropical forests usually focus on analyzingmortality patterns of focal species after a few years ofobservation, which is too short to find the lagged effectof density dependence for established trees that have alifespan of several hundred years (Ratikainen et al. 2008).Therefore, detection of density dependence using static dataof multiple life-history stages can take advantage of theconsideration of the lagged effects of density dependence.Interspecific interactions also might influence the detectionof density dependence but the strong conspecific clusteringfound at the Gutianshan FDP may cause intraspeci-fic segregation which will reduce the probabilities ofheterospecific encounters and therefore the importance ofinterspecific interactions (Wiegand et al. 2007). However,
117
additional studies are required to quantify the effect ofintraspecific interactions.
In summary, our study focused on the spatial patternfound in Gutianshan FDP and clearly highlighted densitydependence as a prevalent mechanism regulating thepopulation structure of woody species in a subtropicalforest. Our findings revealed that it is crucial to remove theconfounding effect of habitat heterogeneity in studies ofdensity dependence. Our findings also reflected that theoccurrence of density dependence has a close associationwith high species abundance and the strength of conspecificaggregation at local scales.
Acknowledgements � We are grateful to Dr Fangliang He forinsightful suggestions on the revision of the ms, and Fang Teng,Chen Shengwen and Prof. Ding Bingyang for species identifica-tion. Dr. Thorsten Wiegand helped with guidance of data analysisand insightful comments. We also thank many field workers fortheir contributions to the establishment and census of the 24 hapermanent forest plot. We gratefully acknowledge the supportfrom the Administration Bureau of the Gutianshan NationalNature Reserve. This study was financially supported by KeyInnovation Project of CAS (KZCX2-YW-430).
References
Barot, S. et al. 1999. Demography of a savanna palm tree:predictions from comprehensive spatial pattern analyses.� Ecology 80: 1987�2005.
Bell, T. et al. 2006. Plant pathogens drive density-dependentseedling mortality in a tropical tree. � Ecol. Lett. 9: 569�574.
Besag, J. 1977. Contribution to the discussion of Dr Ripley’spaper. � J. R. Stat. Soc. B 39: 193�195.
Carson, W. P. et al. 2008. Challenges associated with testing andfalsifying the Janzen�Connell hypothesis: a review andcritique. � In: Carson, W. P. and Stefan, A. S. (eds), Tropicalforest community ecology. Blackwell, pp. 210�241.
Chapin, F. S. et al. 1989. Competition causes regular spacing ofalder in Alaskan shrub tundra. � Oecologia 79: 412�416.
Chesson, P. 2000. Mechanisms of maintenance of speciesdiversity. � Annu. Rev. Ecol. Syst. 31: 343�366.
Chesson, P. and Neuhauser, C. 2002. Intraspecific aggregationand species coexistence. � Trends Ecol. Evol. 17: 210�211.
Comita, L. S. and Hubbell, S. P. 2009. Local neighborhood andspecies’ shade tolerance influence survival in a diverse seedlingbank. � Ecology 90: 328�334.
Condit, R. et al. 1992. Recruitment near conspecific adults andthe maintenance of tree and shrub diversity in a neotropicalforest. � Am. Nat. 140: 261�286.
Connell, J. H. 1971. On the role of natural enemies in preventingcompetitive exclusion in some marine animals and in rainforest trees. � In: Den Boer, P. J. and Gradwell, G. (eds),Dynamics of populations. PUDOC, pp. 298�312.
Connell, J. H. et al. 1984. Compensatory recruitment, growth,and mortality as factors maintaining rain forest tree diversity.� Ecol. Monogr. 54: 141�164.
Dale, M. R. T. et al. 2002. Conceptual and mathematicalrelationships among methods for spatial analysis. � Ecography25: 558�577.
Diggle, P. J. et al. 2007. Second-order analysis of inhomogeneousspatial point processes using case-control data. � Biometrics63: 550�557.
Fajardo, A. and McIntire, E. J. B. 2007. Distinguishing micrositeand competition processes in tree growth dynamics: an a priorispatial modeling approach. � Am. Nat. 169: 647�661.
Ford, E. D. 1975. Competition and stand structure in some even-aged plant monocultures. � J. Ecol. 63: 311�333.
Getzin, S. et al. 2006. Spatial patterns and competition of treespecies in a douglas-fir chronosequence on vancouver island.� Ecography 29: 671�682.
Getzin, S. et al. 2008. Heterogeneity influences spatial patternsand demographics in forest stands. � J. Ecol. 96: 807�820.
Gong G. Q. et al. 2007. Habitat associations of wood species inthe Gutianshan subtropical broad-leaved evergreen forest,� Sci. Soil Water Conserv. 5: 79�83, in Chinese.
Hardy, O. J. and Sonke, B. 2004. Spatial pattern analysis of treespecies distribution in a tropical rain forest of cameroon:assessing the role of limited dispersal and niche differentiation.� For. Ecol. Manage. 179: 191�202.
Harms, K. E. et al. 2000. Pervasive density-dependent recruitmentenhances seedling diversity in a tropical forest. � Nature 404:493�495.
He, F. L. and Duncan, R. P. 2000. Density-dependent effects ontree survival in an old-growth douglas fir forest. � J. Ecol. 88:676�688.
Hille Ris Lambers, J. et al. 2002. Density-dependent mortality andthe latitudinal gradient in species diversity. � Nature 417:732�735.
Hollander, M. and Wolfe, D. A. 1973. Nonparametric statisticalinference. � Wiley.
Howe, H. F. and Smallwood, J. 1982. Ecology of seed dispersal.� Annu. Rev. Ecol. Syst. 13: 201�228.
Hubbell, S. P. et al. 1990. Presence and absence of densitydependence in a neotropical tree community. � Philos. Trans.R. Soc. Lond. B 330: 269�281.
Hubbell, S. P. et al. 2001. Local neighborhood effects on long-term survival of individual trees in a neotropical forest. � Ecol.Res. 16: 859�875.
Hyatt, L. A. et al. 2003. The distance dependence prediction ofthe Janzen�Connell hypothesis: a meta-analysis. � Oikos 103:590�602.
Illian, J. et al. 2008. Statistical analysis and modelling of spatialpoint patterns. � Wiley.
Janzen, D. H. 1970. Herbivores and the number of tree species intropical forests. � Am. Nat. 104: 501�528.
Kenkel, N. C. 1988. Pattern of self-thinning in jack pine: testingthe random mortality hypothesis. � Ecology 69: 1017�1024.
Legendre, P. et al. 2009. Partitioning beta diversity in asubtropical broad-leaved forest of China. � Ecology 90:663�674.
Leigh, E. G. Jr. et al. 2004. Why do some tropical forests havesome many species of trees? � Biotropica 36:447�473.
Loosmore, N. B. and Ford, E. D. 2006. Statistical inferenceusing the G or K point pattern spatial statistics. � Ecology 87:1925�1931.
Murrell, D. J. 2009. On the emergent spatial structure of size-structured populations: when does self-thinning lead to areduction in clustering? � J. Ecol. 97: 256�266.
Nathan, R. and Muller-Landau, H. C. 2000. Spatial patterns ofseed dispersal, their determinants and consequences forrecruitment. � Trends Ecol. Evol. 15: 278�285.
Peters, H. A. 2003. Neighbour-regulated mortality: the influenceof positive and negative density dependence on tree popula-tions in species-rich tropical forests. � Ecol. Lett. 6: 757�765.
Plotkin, J. B. et al. 2000. Species-area curves, spatial aggregation,and habitat specialization in tropical forests. � J. Theor. Biol.207: 81�99.
118
Ratikainen, I. I. et al. 2008. When density dependence is notinstantaneous: theoretical developments and managementimplications. � Ecol. Lett. 11: 184�198.
Ripley, B. D. 1976. The second-order analysis of stationary pointprocesses. � J. Appl. Probabil. 13: 255�266.
Sterner, R. W. et al. 1986. Testing for life historical changesin spatial patterns of four tropical tree species. � J. Ecol. 74:621�633.
Stoll, P. and Newbery, D. M. 2005. Evidence of species-specificneighborhood effects in the Dipterocarpaceae of a Borneanrain forest. � Ecology 86: 3048�3062.
Stoyan, D. and Stoyan, H. 1994. Fractals, random shapes andpoint fields. Methods of geometrical statistics. � Wiley.
Stoyan, D. and Penttinen, A. 2000. Recent applications of pointprocess methods in forestry statistics. � Stat. Sci. 15: 61�78.
Uriate, M. et al. 2004. A maximum-likelihood, neighborhoodanalysis of tree growth and survival in a tropical forest. � Ecol.Monogr. 74: 591�614.
Wiegand, T. and Moloney, K. A. 2004. Rings, circles and null-models for point pattern analysis in ecology. � Oikos 104:209�229.
Wiegand, T. et al. 2007. Species associations in a heterogeneousSri Lankan dipterocarp forest. � Am. Nat. 170: E77�E95.
Wills, C. et al. 1997. Strong density- and diversity-related effectshelp to maintain tree species diversity in a neotropical forest.� Proc. Natl Acad. Sci. USA 94: 1252�1257.
Wills, C. et al. 2006. Nonrandom processes maintain diversity intropical forests. � Science 311: 527�531.
Wright, S. J. 2002. Plant diversity in tropical forests: a review ofmechanisms of species coexistence. � Oecologia 130: 1�14.
Zimmerman, J. K. et al. 2008. Large tropical forest dynamicsplots: testing explanations for the maintenance of speciesdiversity. � In: Carson, W. P. and Stefan, A. S. (eds), Tropicalforest community ecology. Blackwell, pp. 98�117.
Zhu, Y. et al. 2008. Community composition and structure ofGutianshan forest dynamic plot in a mid-subtropical evergreenbroad-leaved forest, east China. � J. Plant Ecol. 32: 262�273,in Chinese.
Supplementary material (available as Appendix O17758 atwww.oikos.ekol.lu.seappendix). Appendix 13.
119