Embed Size (px)
Citation preview

Density and Speed of Sound Measurements of Jet A and S-8Aviation Turbine Fuels†
Stephanie Outcalt,* Arno Laesecke, and Malte Brian Freund‡
Experimental Properties of Fluids Group, Thermophysical Properties DiVision, Chemical Science andTechnology Laboratory, National Institute of Standards and Technology (NIST), 325 Broadway, Boulder,
Colorado 80305-3337
ReceiVed October 14, 2008. ReVised Manuscript ReceiVed December 17, 2008
The density and speed of sound were measured for three samples of aviation jet fuel A and a synthetic fuel(S-8) derived from the Fischer-Tropsch process. Measurements of density and speed of sound were carriedout at ambient pressure (83 kPa) with a rapid characterization instrument from 278.15 to 343.15 K. Densitymeasurements of the compressed liquids ranged from 270 to 470 K with pressures to 30 MPa. A total of 529experimental points are reported. The density measurements are correlated within 0.1% with a modified Taitequation, and adiabatic compressibilities are derived from the density and speed of sound data at ambientpressure.
1. Introduction
The United States Department of Defense is interested infielding a generic fuel that would be similar to the currentmilitary aviation jet fuel JP-8 and that could be used to powereverything from planes to tanks and other ground vehicles. Inconjunction, environmental concerns and the desire to becomemore energy independent have led to the development of asynthetic fluid S-8 (CAS 437986-20-4) produced from naturalgas by the Fischer-Tropsch process, as a blending stock forJP-8. The major chemical constituents of JP-8 are nearlyidentical to those of Jet A, the most common commercial gasturbine fuel. In this work, we have studied three differentsamples of Jet A and one of S-8. These fluids are complexhydrocarbon mixtures whose properties cannot be predicted withsufficient accuracy by present models or simulation. Densityand speed of sound were measured for the three Jet A samplesand for S-8 to provide data necessary to formulate equations ofstate to correlate the fluid properties and thus facilitate theoptimization of future military fuels.
The measurements reported here are part of a comprehensiveproject to characterize fuels and rocket propellants.1 Tabulatedresults of density and speed of sound measurements for the threeJet A samples and S-8 are given. Density is an important fuelparameter directly related to aircraft range. Speed of sound isrequired in some aircraft fuel gauging systems for properoperation. Adiabatic compressibilities have been derived fromthe ambient pressure density and speed of sound data and are
also included in the tables. Compressed liquid density data havebeen extrapolated to 83 kPa and combined with ambient pressuredensity data to correlate a Rackett equation for density.Additionally, the compressed liquid density data have beencorrelated with a Tait equation. Parameters for all of thecorrelations are reported.
2. Sample Liquids
The four fuel samples measured in this work were providedby the Fuels Branch of the Air Force Research Laboratory,Wright-Patterson Air Force Base, Dayton, OH. A detaileddiscussion of composition and distillation curves for each ofthe samples is described by Smith and Bruno.2 The three Jet Asamples are designated as POSF-3638, -3602, and -4658 andrepresent a range of different compositions that are consistentwith the specifications for Jet A and JP-8. From a review of ref2, it is readily apparent that these specifications allow forrelatively significant differences in composition. The numericaldesignations serve only to identify an individual fluid and haveno significance with regard to composition. The sample labeledPOSF-4658 is considered to be the most representative of thethree Jet A samples, because it is a composite of severalavailable batches of Jet A, obtained from multiple manufacturersand mixed in approximately equal volume aliquots. For example,the aromatic content of the 4658 fuel is very close to the JetA/JP-8 average.3 The S-8 sample was produced from naturalgas by the Fischer-Tropsch process and consists of C7-C18
linear and branched alkanes. A detailed description of theanalysis and the composition of the Jet A 4658 and S-8 samplesis given by Bruno et al.4 Testing carried out in accordance withAmerican Society for Testing and Materials (ASTM) D-2789
† Disclaimer: To describe materials and experimental procedures ad-equately, it is occasionally necessary to identify commercial products bymanufacturers’ names or labels. In no instance does such identification implyendorsement by the National Institute of Standards and Technology (NIST)nor does it imply that the particular product or equipment is necessarilythe best available for the purpose.
* To whom correspondence should be addressed. Telephone: 1-303-497-5786. Fax: 1-303-497-5224. E-mail: [email protected].
‡ Guest Researcher from the Department of Mechanical Engineering,University of Hannover, Hannover D-30167, Germany.
(1) Outcalt, S. L.; Laesecke, A.; Brumback, K. J. Thermophysicalproperties measurements of rocket propellants RP-1 and RP-2. J. Propul.Power 2009, manuscript submitted.
(2) Smith, B. L.; Bruno, T. J. Improvements in the measurement ofdistillation curves. 4. Application to the aviation turbine fuel Jet-A. Ind.Eng. Chem. Res. 2007, 26, 310–320.
(3) World Fuel Sampling Program, CRC Report 647. CoordinationResearch Council, Alpharetta, GA, June 2006.
(4) Bruno, T. J.; Laesecke, A.; Outcalt, S. L.; Seelig, H. D.; Smith, B. L.Properties of a 50/50 Mixture of Jet-A + S-8. U.S. Department ofCommerce, Washington, D.C., 2007; p 32.
Energy & Fuels 2009, 23, 1626–16331626
10.1021/ef800888q This article not subject to U.S. Copyright. Published 2009 by the American Chemical SocietyPublished on Web 01/27/2009

is reported in ref 2 and shows the S-8 sample to be predomi-nantly paraffins (80% by volume), while Jet A 4658 was morediverse, with its major components being 46.5% paraffins,22.5% monocycloparaffins, and 18.4% alkyl aromatics. Thecomposition of the Jet A 3638 sample was similar to that of JetA 4658 but with the smallest amount of alkyl aromatics of thethree Jet A samples. The Jet A 3602 sample had a similarvolume fraction of monocycloparaffins but a smaller amountof paraffins (36.0% by volume) and a larger amount of alkylaromatics compared to the other two Jet A samples.
3. Experimental Section
A density and sound speed analyzer DSA 5000 from Anton PaarCompany was used to measure these properties at ambient pressure.Details of the instrument and experimental procedures have been
reported in Laesecke and Outcalt et al.,5 and thus, only a briefdescription will be given here. Temperature scans were programmedfrom 70 to 10 °C, in decrements of 10 °C, followed by a singlemeasurement at 5 °C. The device contains a sound speed cell anda vibrating quartz tube densimeter in series. The temperature ismeasured with an integrated Pt-100 thermometer, with an estimateduncertainty of 0.01 K. The instrument was calibrated with air anddeionized water at 20 °C. The reproducibility of the sound speedof water at 20 °C to within 0.01% was checked before and aftermeasurements of the fuel samples. Fresh samples of test liquidswere injected for each temperature scan instead of performingrepetitive measurements on the same sample. At least fourtemperature scans were performed for each test liquid. The relativestandard deviation of these repeated sound speed measurements
(5) Laesecke, A.; Outcalt, S. L.; Brumback, K. J. Density and speed ofsound measurements of methyl- and propylcyclohexane. Energy Fuels 2008,22, 2629–2636.
Table 1. Density, Speed of Sound, and Adiabatic Compressibility of the Fuels Measured in the Density and Sound Speed Analyzera
temperature,T (K)
density, F(kg m-3)
speed of sound, w(m s-1)
adiabatic compressibility,κs (T Pa-1)
density, F(kg m-3)
speed of sound, w(m s-1)
adiabatic compressibility,κs (T Pa-1)
Jet A 3602 Jet A 3638278.15 827.3 1385.6 629.63 804.2 1364.3 668.03283.15 823.6 1365.4 651.27 800.4 1344.0 691.68293.15 816.3 1325.9 696.85 792.8 1304.3 741.45303.15 808.9 1287.2 746.15 785.3 1265.3 795.38313.15 801.5 1249.2 799.57 777.8 1227.0 853.99323.15 794.1 1211.8 857.53 770.3 1189.2 917.93333.15 786.7 1175.2 920.49 762.8 1151.9 988.03343.15 779.2 1139.5 988.49 755.2 1115.4 1064.4
Jet A 4658 S-8278.15 814.1 1376.8 648.04 762.9 1336.0 734.35283.15 810.4 1356.5 670.56 759.2 1315.7 761.04293.15 803.1 1317.0 717.90 751.5 1275.7 817.73303.15 795.8 1278.3 769.06 744.0 1236.4 879.21313.15 788.4 1240.2 824.68 736.6 1197.9 946.13323.15 781.0 1202.7 885.19 729.2 1160.0 1019.1333.15 773.6 1165.8 951.02 721.7 1122.8 1099.0343.15 766.2 1130.0 1022.1 714.2 1086.3 1186.5
a The ambient pressure during the measurements was 0.083 MPa.
Figure 1. Measured (a) speed of sound data and (b) density data of the three Jet A samples and S-8 as a function of the temperature at an ambientpressure of 0.083 MPa and the correlation for the speed of sound and density of Jet A from ref 3.
Jet A and S-8 AViation Turbine Fuels Energy & Fuels, Vol. 23, 2009 1627

was lower than 0.04%. The manufacturer’s quoted uncertainty ofsound speed measurements with this instrument is 0.1%.
Densities of the test liquids were measured in accordance withASTM D4052 standard test method6 during the same temperaturescans that were carried out to obtain the speeds of sound. Theinstrument corrects the measured densities for the viscosity of thetest liquid. The relative standard deviation of repeated densitymeasurements was lower than 0.02%.
Density measurements of the compressed test liquids were madewith the automated densimeter of Outcalt and McLinden, details
of which have been described in a previous publication.7 Centralto the apparatus is a commercial vibrating-tube densimeter DMA-HPM from Anton Paar Company. Several physical and proceduralimprovements have been implemented beyond that of the com-mercial instrument operated in a stand-alone mode to minimize theuncertainty in the measurements. The temperature range of theinstrument is 270-470 K, with pressures up to 50 MPa. In thiswork, we measured 11 isotherms over the range of 0.5-30 MPafor each of the samples. The instrument was calibrated with propaneand toluene over the entire temperature and pressure range. The
Figure 2. Adiabatic compressibility data of the three Jet A compositionsand S-8 as a function of the temperature at ambient pressure. Valueswere calculated from the measured density and speed of sound data.
Table 2. Compressed Liquid Densities of Jet A 3602 Measured in the High-Pressure Vibrating-Tube Densimeter along Isotherms from270 to 470 Ka
pressure,p (MPa)
density, F(kg m-3)
pressure,p (MPa)
density, F(kg m-3)
pressure,p (MPa)
density, F(kg m-3)
pressure,p (MPa)
density, F(kg m-3)
pressure,p (MPa)
density, F(kg m-3)
pressure,p (MPa)
density, F(kg m-3)
270 K 290 K 310 K 330 K 350 K 370 K30.77 850.5 31.57 838.3 31.93 825.8 31.64 812.2 32.10 799.8 31.93 787.125.61 847.9 25.59 835.0 25.57 822.0 25.59 808.2 25.63 795.3 25.70 782.420.66 845.3 20.65 832.2 20.76 819.0 20.81 804.9 20.88 791.7 20.96 778.615.93 842.8 15.97 829.5 16.00 816.0 16.08 801.5 16.08 788.0 16.11 774.511.31 840.3 11.24 826.6 11.2 812.7 11.18 797.9 11.11 784.0 11.02 769.96.06 837.3 5.97 823.3 5.76 808.8 5.77 793.7 5.60 779.2 5.49 764.64.92 836.6 4.78 822.5 4.67 808.0 4.59 792.8 4.48 778.2 4.35 763.53.74 835.9 3.60 821.7 3.50 807.1 3.41 791.8 3.28 777.1 3.23 762.32.52 835.2 2.42 821.0 2.30 806.1 2.26 790.9 2.21 776.1 2.16 761.21.32 834.4 0.083 819.4 1.72 805.7 1.12 789.9 1.10 775.1 1.09 760.10.083 833.7 0.083 804.4 0.54 789.4 0.56 774.6 0.59 759.5
0.083 737.1 0.083 774.1 0.083 759.0
390 K 410 K 430 K 450 K 470 K31.81 774.6 31.75 762.0 31.66 749.3 31.67 736.8 31.63 724.425.74 769.5 25.84 756.6 25.87 743.6 25.93 730.6 26.01 717.921.01 765.4 21.03 752.0 21.04 738.6 21.03 725.0 20.98 711.516.08 760.8 16.04 746.9 15.97 732.8 15.90 718.6 15.85 704.410.88 755.6 10.78 741.1 10.65 726.3 10.57 711.3 10.52 696.25.41 749.8 5.33 734.5 5.30 719.1 5.32 703.2 5.39 687.34.28 748.5 4.28 733.2 4.26 717.5 4.33 701.6 4.39 685.43.24 747.3 3.21 731.8 3.26 716.1 3.33 699.9 3.40 683.52.16 746.0 2.19 730.4 2.24 714.5 2.35 698.2 2.41 681.51.26 744.9 1.19 729.1 1.27 713.0 1.34 696.4 1.43 679.50.66 744.2 0.083 727.6 0.083 711.1 0.083 694.1 0.083 676.60.083 743.5
a Values extrapolated to 0.083 MPa are indicated in italics.
Figure 3. Measured compressed liquid density data of the three Jet Asamples and S-8 as a function of the temperature. Along the isotherms,the highest density corresponds to 30 MPa and the lowest densitycorresponds to 0.5 MPa.
1628 Energy & Fuels, Vol. 23, 2009 Outcalt et al.

overall uncertainty (k ) 2) in density is 0.64-0.81 kg m-3,corresponding to a relative uncertainty in density of 0.07-0.14%.
4. Results
Table 1 lists values of density, speed of sound, and derivedadiabatic compressibilities for the three Jet A samples and S-8at ambient pressure from 278.15 to 343.15 K. Adiabaticcompressibilities were calculated from the measured densitiesand speeds of sound via the thermodynamic relation
κs )-(∂V/ ∂ F)s ⁄ V) 1/(Fw2) (1)
where V denotes the volume, p is the pressure, F is the density,and w is the speed of sound. The subscript s indicates “atconstant entropy”. The data for the speed of sound, ambientdensity, and adiabatic compressibility are depicted graphicallyin parts a and b of Figure 1 and Figure 2, respectively. It canbe seen in Figures 1 and 2 that the Jet A 3638 sample hasthermodynamic properties at atmospheric pressure that are mostsimilar to S-8. It can also be seen in Figure 1 that given the
Table 3. Compressed Liquid Densities of Jet A 3638 Measured in the High-Pressure Vibrating-Tube Densimeter along Isotherms from270 to 470 Ka
pressure,p (MPa)
density, F(kg m-3)
pressure,p (MPa)
density, F(kg m-3)
pressure,p (MPa)
density, F(kg m-3)
pressure,p (MPa)
density, F(kg m-3)
pressure,p (MPa)
density, F(kg m-3)
pressure,p (MPa)
density, F(kg m-3)
270 K 290 K 310 K 330 K 350 K 370 K30.05 827.1 30.08 814.1 30.08 801.4 30.04 788.3 30.06 775.3 30.05 762.525.10 824.5 25.14 811.3 25.13 798.3 25.11 784.9 25.12 771.7 25.12 758.520.15 821.8 20.19 808.4 20.18 795.1 20.16 781.4 20.16 767.8 20.16 754.315.16 819.1 15.20 805.4 15.19 791.8 15.17 777.7 15.18 763.8 15.18 749.910.13 816.2 10.18 802.2 10.16 788.3 10.15 773.8 10.16 759.5 10.16 745.25.06 813.2 5.11 798.2 5.09 784.5 5.08 769.7 5.09 754.9 5.09 740.04.04 812.6 4.09 798.2 4.08 783.8 4.07 768.8 4.07 753.9 4.07 738.93.02 812.0 3.07 797.5 3.05 783.0 3.05 767.9 3.06 753.0 3.05 737.81.99 811.3 2.05 796.8 2.03 782.2 2.03 767.0 2.04 752.0 2.03 736.70.97 810.7 1.03 796.1 1.01 781.4 1.01 766.1 1.02 751.0 1.01 735.50.083 810.0 0.083 795.4 0.083 780.6 0.083 765.3 0.083 750.0 0.083 734.5
390 K 410 K 430 K 450 K 470 K30.02 750.0 30.02 737.4 30.01 724.7 29.96 712.0 29.94 699.425.08 745.6 25.08 732.7 25.07 719.6 25.02 706.4 25.00 693.320.13 741.0 20.13 727.7 20.11 714.1 20.07 700.4 20.05 686.715.16 736.1 15.15 722.3 15.13 708.1 15.10 693.8 15.08 679.410.14 730.9 10.13 716.4 10.11 701.5 10.08 686.4 10.06 671.15.08 725.1 5.07 709.9 5.05 694.2 5.02 678.1 5.00 661.54.06 723.9 4.05 708.5 4.03 692.6 4.00 676.3 3.98 659.43.05 722.6 3.03 707.1 3.01 691.0 2.99 674.4 2.96 657.22.03 721.4 2.01 705.7 1.99 689.3 1.96 672.5 1.94 655.01.01 720.1 0.99 704.2 0.96 687.6 0.94 670.4 0.92 652.60.083 718.9 0.083 702.8 0.083 686.1 0.083 668.7 0.083 650.07
a Values extrapolated to 0.083 MPa are indicated in italics.
Table 4. Compressed Liquid Densities of Jet A 4658 Measured in the High-Pressure Vibrating-Tube Densimeter along Isotherms from270 to 470 Ka
pressure,p (MPa)
density, F(kg m-3)
pressure,p (MPa)
density, F(kg m-3)
pressure,p (MPa)
density, F(kg m-3)
pressure,p (MPa)
density, F(kg m-3)
pressure,p (MPa)
density, F(kg m-3)
pressure,p (MPa)
density, F(kg m-3)
270 K 290 K 310 K 330 K 350 K 370 K30.02 837.4 30.00 824.5 30.01 811.3 30.00 798.5 30.00 786.0 30.01 773.625.01 834.8 25.00 821.7 25.01 808.2 25.01 795.2 25.01 782.4 25.01 769.720.00 832.2 20.00 818.8 20.01 805.1 20.01 791.7 20.01 778.7 20.01 765.615.01 829.5 15.00 815.8 15.01 801.8 15.01 788.1 15.01 774.7 15.01 761.310.01 826.7 10.00 812.8 10.01 798.4 10.01 784.3 10.01 770.6 10.02 756.75.00 823.8 5.01 809.6 5.01 794.8 5.01 780.4 5.01 766.2 5.01 751.84.01 823.2 4.01 808.9 4.00 794.1 4.02 779.6 4.01 765.3 4.01 750.83.00 822.6 3.01 808.3 3.01 793.3 3.01 778.8 3.01 764.4 3.01 749.82.01 822.0 2.01 807.6 2.01 792.6 2.01 777.9 2.01 763.4 2.01 748.71.01 821.4 1.01 806.9 1.01 791.8 1.01 777.1 1.01 762.5 1.01 747.60.51 821.1 0.51 806.6 0.51 791.4 0.51 776.6 0.50 762.0 0.50 746.10.083 820.8 0.083 806.3 0.083 791.1 0.083 776.3 0.083 761.6 0.083 746.6
390 K 410 K 430 K 450 K 470 K30.01 761.2 30.00 748.7 30.00 736.2 30.00 723.8 29.99 711.525.01 756.9 25.01 744.0 25.01 731.2 25.00 718.3 25.00 705.620.02 752.4 20.01 739.9 20.01 725.8 20.01 712.5 20.01 699.215.01 747.7 15.00 735.3 15.01 720.0 15.00 706.1 15.02 692.110.01 742.6 10.01 728.3 10.02 713.8 10.00 699.1 10.02 684.35.01 737.2 5.01 722.2 5.01 706.9 5.02 691.4 5.01 675.54.01 736.0 4.01 720.9 4.02 705.4 4.00 689.7 4.00 673.53.01 734.9 3.01 719.5 3.00 703.9 3.01 688.0 3.00 671.52.00 733.7 2.00 718.2 2.01 702.4 2.01 686.2 2.01 669.51.01 732.5 1.01 716.9 1.01 700.8 1.01 684.4 1.01 667.40.50 731.8 0.52 716.2 0.51 700.0 0.51 683.4 0.51 666.30.083 731.3 0.083 715.6 0.083 699.3 0.083 682.6 0.083 665.3
a Values extrapolated to 0.083 MPa are indicated in italics.
Jet A and S-8 AViation Turbine Fuels Energy & Fuels, Vol. 23, 2009 1629

possible variations in sample composition, our measurementsare reasonably consistent with Jet A correlations from the CRCWorld Survey.3
Listed in Tables 2-5 are measured values of compressedliquid density from 270 to 470 K with pressures to 30 MPa forJet A 3602, Jet A 3638, Jet A 4658, and S-8, respectively. Alsolisted are density values extrapolated to 83 kPa (this is the
approximate atmospheric pressure in Boulder, CO) for eachtemperature. These were obtained by fitting a second-orderpolynomial to the isothermal data at pressures less than or equalto 10 MPa and extrapolating to 83 kPa. This extrapolation wasperformed to examine the consistency of the compressed liquiddata with the measurement results at ambient pressure from thedensity and sound speed analyzer. Measured compressed liquiddensities of all four fuels are plotted in Figure 3 to illustratehow they compare to one another.
5. Correlation of Data
The speed of sound data at atmospheric pressure werecorrelated as a function of the temperature with the second-order polynomial
w) �1 + �2T+ �3T2 (2)
The symbol w denotes the speed of sound in units of m s-1,and T is the absolute temperature in Kelvin. The values of theadjustable parameters �1-�3 and their standard deviations arelisted in Table 6 for all four of the test liquids. The listed
Table 5. Compressed Liquid Densities of S-8 Measured in the High-Pressure Vibrating-Tube Densimeter along Isotherms from 270 to470 Ka
pressure,p (MPa)
density, F(kg m-3)
pressure,p (MPa)
density, F(kg m-3)
pressure,p (MPa)
density, F(kg m-3)
pressure,p (MPa)
density, F(kg m-3)
pressure,p (MPa)
density, F(kg m-3)
pressure,p (MPa)
density, F(kg m-3)
270 K 290 K 310 K 330 K 350 K 370 K30.09 786.2 30.04 773.6 29.97 760.5 30.00 747.9 30.0 1 735.5 30.02 723.225.15 783.6 25.10 770.7 25.03 757.3 25.01 744.4 25.01 731.7 25.02 719.020.20 780.9 20.14 767.7 20.07 754.0 20.01 740.8 20.01 727.7 20.01 714.715.21 778.1 15.15 764.6 15.09 750.6 15.01 737.0 15.00 723.5 15.02 710.110.19 775.1 10.13 761.3 10.07 747.0 10.01 733.0 10.01 719.1 10.00 705.15.12 772.1 5.06 757.8 5.00 743.1 5.01 728.7 5.00 714.3 5.01 699.94.10 771.4 4.05 757.1 3.98 742.3 4.01 727.9 4.01 713.4 4.01 698.83.07 770.8 3.02 756.4 2.96 741.5 3.01 727.0 3.01 712.3 3.01 697.62.05 770.1 2.00 755.6 1.94 740.7 2.01 726.1 2.00 711.3 2.00 696.41.02 769.5 0.97 754.9 0.92 739.8 1.01 725.1 1.01 710.3 1.01 695.30.51 769.1 0.46 754.5 0.40 739.4 0.51 724.7 0.50 709.8 0.50 694.70.083 768.9 0.083 754.2 0.083 739.1 0.083 724.3 0.083 709.3 0.083 694.2
390 K 410 K 430 K 450 K 470 K30.02 711.0 30.01 698.7 29.99 686.4 30.02 674.3 30.01 662.225.00 706.5 25.01 693.8 25.02 681.1 25.01 668.4 25.01 655.920.01 701.7 20.01 688.6 20.00 675.3 20.02 662.1 20.01 649.015.01 696.6 15.00 683.0 15.00 669.1 15.00 655.2 15.01 641.310.00 691.1 10.01 676.9 10.01 662.2 10.00 647.5 10.01 632.65.00 685.2 5.00 670.1 5.00 654.6 5.01 638.8 5.01 622.74.00 683.9 4.00 668.7 4.01 653.0 4.00 636.9 4.02 620.53.00 682.6 3.00 667.2 3.01 651.3 3.00 634.9 3.01 618.12.01 681.3 2.01 665.7 2.00 649.5 2.01 632.9 2.00 615.71.00 680.0 1.00 664.1 1.01 647.7 1.01 630.8 1.00 613.20.50 679.3 0.50 663.3 0.49 646.8 0.50 629.7 0.50 611.90.083 678.7 0.083 662.7 0.083 646.0 0.083 628.8 0.083 610.8
a Values extrapolated to 0.083 MPa are indicated in italics.
Table 6. Parameters of the Correlations for the Speed of Sound of the Three Jet A Samples and S-8 at Ambient Pressure of 0.083 MPaand Temperatures from 278.15 to 343.15 Ka
parameter value standard deviation value standard deviation
Jet A 3602 Jet A 3638�1 (m s-1) 2789.1860 5.8 2727.3236 8.6�2 (m s-1 K-1) -6.0683741 3.7 × 10⁻² -5.7684925 5.6 × 10⁻²
�3 (m s-1 K-2) 3.6737339 × 10⁻³ 6.0 × 10⁻⁵ 3.1239530 × 10⁻³ 9.0 × 10⁻⁵
AAD (%) 3.7 × 10⁻³ 5.7 × 10⁻³
rms (%) 4.2 × 10⁻³ 6.2 × 10⁻³
Jet A 4658 S-8�1 (m s-1) 2771.1969 8.9 2738.2926 4.1�2 (m s-1 K-1) -6.0012041 5.7 × 10⁻² -6.0152111 2.7 × 10⁻²
�3 (m s-1 K-2) 3.5504567 × 10⁻³ 9.3 × 10⁻⁵ 3.5002921 × 10⁻³ 3.4 × 10⁻⁸
AAD (%) 6.0 × 10⁻³ 2.7 × 10⁻³
rms (%) 6.5 × 10⁻³ 3.0 × 10⁻³
a Average absolute deviations and root mean square deviations are given to indicate the quality of the correlations.
Table 7. Parameters of the Rackett Correlations for the Densityof Three Jet A Compositions and S-8 at Ambient Pressure of 83
kPa and Temperatures from 270 to 470 K
parameter valuestandarddeviation value
standarddeviation
Jet A 3602 Jet A 3638�4 (kg m-3) 287.67132 0.100 280.19930 0.054�5 0.52969387 9.1 × 10⁻⁵ 0.52863542 4.9 × 10⁻⁵
�6 (K) 574.26287 0.065 559.63279 0.033�7 0.62113263 1.3 × 10⁻⁴ 0.61879511 7.5 × 10⁻⁵
Jet A 4658 S-8�4 (kg m-3) 287.67122 0.148 273.71023 0.057�5 0.53272953 1.3 × 10⁻⁴ 0.53377090 5.4 × 10⁻⁵
�6 (K) 574.26277 0.103 544.31655 0.037�7 0.64481646 2.0 × 10⁻⁴ 0.64102711 8.8 × 10⁻⁵
1630 Energy & Fuels, Vol. 23, 2009 Outcalt et al.

parameters fit the data well within their experimental uncertainty.The correlations were tested up to 470 K and found to providereasonable extrapolation behavior up to that temperature.
Density measurements at ambient pressure and values ex-trapolated to 83 kPa from measured compressed liquid data werecorrelated with the Rackett equation to check the repeatabilityof the instruments and the consistency of our data in thecombined temperature range of 270-470 K. The Rackettequation is written as
F) �4�5-(1+(1 - T/�6)�7) (3)
Table 7 lists the Rackett correlation parameters for the Jet Asamples and S-8. In Figure 4, the correlations serve as thebaseline to compare the ambient pressure and extrapolatedvalues. It can be seen that both our measured and extrapolateddata agree within the stated uncertainty of the densitymeasurements.
To make the present results immediately usable for engineer-ing and design purposes, the compressed liquid density datawere correlated with a Tait equation similar to that of Dymondand Malhotra.8 The temperature dependence of the parameterC was omitted because it was not needed to fit the data within
their experimental uncertainty. The equation used to fit thecompressed liquid density data reads
F(T, p))Fref(T, pref)
1-C ln( p+B(T)pref +B(T))
(4)
where Fref(T) is the temperature-dependent density at thereference pressure pref ) 0.083 MPa from eq 2. The temperaturedependence of the Tait parameter B(T) was expressed by aquadratic polynomial
B(T)) �8 + �9Tr + �10Tr2 (5)
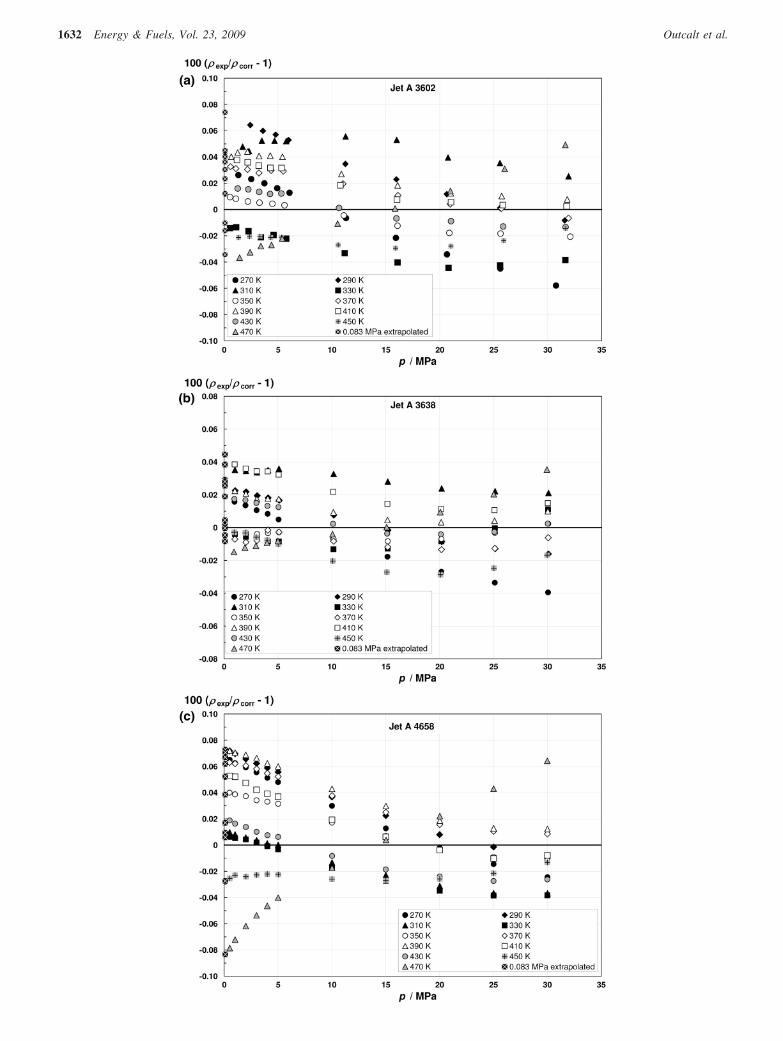
where Tr is the absolute temperature T divided by 273.15 K.Parameters for the Tait correlations are given in Table 8. Partsa-d of Figure 5 show deviations of the measured compressedliquid density data from baselines that represent the Taitcorrelations for Jet A 3602, Jet A 3638, Jet A 4658, and S-8,respectively. These correlations represent our data with AADsof 0.015-0.031%, which is well within the stated uncertainty.Previous work5 showed that the Tait equation can be extrapo-lated to 100 MPa without loss of accuracy. Variations in thecomposition of Jet A samples are a real concern in terms ofdeveloping an accurate equation of state to generically representthe fuel. That task however is not the intent of the correlationspresented here.
6. Conclusions
Density and speed of sound at ambient pressure andcompressed liquid densities of three Jet A samples and S-8have been measured covering a temperature range of270-470 K with pressures to 30 MPa. The density data havebeen correlated with a modified Tait equation within theirexperimental uncertainty of 0.1%, and the speed of sounddata at ambient pressure were correlated with a second-order
(6) American Society for Testing of Materials (ASTM), West Consho-hocken, PA.
(7) Outcalt, S. L.; McLinden, M. O. Automated densimeter for the rapidcharacterization of industrial fluids. Ind. Eng. Chem. Res. 2007, 46, 8264–8269.
(8) Dymond, J. H.; Malhotra, R. The Tait equation: 100 years on. Int.J. Thermophys. 1988, 9 (6), 941–951.
Figure 4. Deviations of measured and extrapolated ambient pressure density data of the three Jet A compositions and S-8 from the Rackett correlations.
Table 8. Parameters of the Tait Correlations for the Density ofThree Jet A Compositions and S-8 in Terms of Temperature
and Pressure
parameter valuestandarddeviation value
standarddeviation
Jet A 3602 Jet A 3638C 79.019261 × 10⁻³ 2.1 × 10⁻⁴ 79.563634 × 10⁻³ 1.2 × 10⁻⁴
�8 320.08985 1.0 319.99780 0.59�9 -284.95609 1.1 -291.41934 0.61�10 65.772865 0.30 68.515342 0.17
Jet A 4658 S-8C 79.505617 × 10⁻³ 2.9 × 10⁻⁴ 79.91734 × 10⁻³ 1.5 × 10⁻⁴
�8 323.45807 1.4 300.92000 0.69�9 -294.55363 1.4 -278.22110 0.73�10 70.165368 0.41 66.270142 0.21
Jet A and S-8 AViation Turbine Fuels Energy & Fuels, Vol. 23, 2009 1631
1632 Energy & Fuels, Vol. 23, 2009 Outcalt et al.

polynomial in the temperature within the experimentaluncertainty of 0.1%. The general composition of each of thesamples has been described, and it can be seen that theproperties of density and speed of sound reported here arerelatively similar (within 4% in density and 2% in speed ofsound) for the three Jet A samples. The S-8 sample exhibitedsomewhat smaller values of both density and speed of soundas compared to the Jet A samples, but this is not unexpectedbecause synthetic fuels are known for their high hydrogen
content and, thus, lower densities.3 Our measurements areconsistent with previously published data.
Acknowledgment. We acknowledge the financial support ofthe Air Force Research Laboratory (MIPR F4FBEY5102G001)and the Air Force Office of Scientific Research (MIPRF1ATA06004G004). We also acknowledge Tim Edwards forsuggestions that improved the manuscript.
EF800888Q
Figure 5. (a) Deviations of the density data of compressed liquid (a) Jet A 3602, (b) Jet A 3638, (c) Jet A 4658, and (d) S-8 from the Taitcorrelations.
Jet A and S-8 AViation Turbine Fuels Energy & Fuels, Vol. 23, 2009 1633