Embed Size (px)
Citation preview

9
DensitometryHastings A Smith,Jr., and Phyllis A Russo
9.1 INTRODUCTION
The term “densitometry” refers to measurement of the density of a material bydetermining the degree to which that material attenuates electromagnetic radiationof a given energy. Chapter 2 details the interaction of electromagnetic radiation(specifically x rays and gamma rays) with matter. Because electromagnetic radiationinteracts with atomic electrons, densitometry measurements are element-specific, notisotope-specific. Two phenomena occur during a densitometry measurement: first,part of the incident radiation energy is absorbed; and second, the ionized atoms emitcharacteristic x rays as they return to their stable atomic ground states. This latterprocess, known as x-ray fluorescence (XRF), is a powerful method for element-specificassays. (See Chapter 10 for details of the XRF technique.) In some cases, gamma-raytransmission measurements can provide information not only on the bulk density ofa sample but also on its composition. Because the absorption of low-energy photons(primarily by the photoelectric effect) is a strong function of the atomic numbers (Z)of the elements in the sample, a measurable signature is provided on which an assaycan be based.
This chapter describes various densitometry techniques involving measurement ofphoton absorption at a single energy and at multiple energies and measurement ofdifferential photon attenuation across absorption edges. Applications using these tech-niques are discussed, and measurement procedures with typical performance resultsare described.
All densitometry measurements discussed in this chapter are based on determinationof the transmission of electromagnetic radiation of a given energy by the samplematerial. The mathematical basis for the measurement is the exponential absorptionrelationship between the intensity (l.) of photon radiation of energy (E) incident on amaterial and the intensity (I) that is transmitted by a thickness (x) of the material:
I =10 exp(–ppx) (9-1)
273
274 Hastings A. Smith, Jr., and Phyllis A. Russo
where p is the mass density of the material and p is the mass attenuation coefficient,which is evaluated at the photon energy E. The incident and transmitted intensitiesare ‘the measured quantities. Their ratio (l/Io) is called the transmission (T) of thematerial at the photon energy of interest. If any two of the three quantities in theexponent expression are known from other data, the third quantity can be determinedby the transmission measurement. A strong advantage of a procedure that measuresphoton transmissions is that the data are handled as a ratio of two similarly measuredquantities, thereby removing many bothersome systematic effects that often complicatethe measurement of absolute photon intensity.
The measured electromagnetic radiation can originate from an artificial x-ray source(which emits photons with a continuous energy spectrum) or from a natural gamma-ray source (which emits gamma rays with discrete energies). The sample materialis placed between a photon source and a photon detector (see Figure 9.1). Thetransmission of the sample is determined by measuring the photon intensity of thesource both with (1) and without (l.) the sample material present.
PHOTONMSOURCE \
u
Fig. 9.1 Key componetits of a densitometry measurement.
9.2 SINGLE-LINE DENSITOMETRY
9.2.1 Concentration and Thickness Gauges
If a sample is composed of one type of material+r of a mixture of materialswhose composition is tightly controlled except for one component-then the sampletransmission at one gamma-ray energy can be used as a measure of the concentration(density p) of the varying component. Normally, discrete-energy gamma-ray sourcesare used. For example, consider a two-component system, such as a solution ofuranium and nitric acid, whose components have respective densities p and PO andmass attenuation coefficients ~ and ,uOat a given gamma-ray energy. The naturallogarithm of the photon transmission at that energy is given by
—. —.
Densitometry 275
in T = –(pp + popo)x . (9-2)
Whh p as the unknown concentration,
p=-(~) lnT-M. (9-3)px P
Equation 9-3 may be applied as a gauge for the concentration of an unknownamount of substance (p) in a known, carefully controlled solvent concentration (PO).
In applying the concentration gauge to special nuclear material (SNM) solutions(uranium and plutonium), it is critical both that the mass attenuation coefficientsbe well characterized for the solvent (PO) and the SNM (p) and that the solventcomposition (PO) be well known and constant from sample to sample. The samplesolutions should not be vulnerable to contamination because contamination wouldcause variations in the effective values of POand PO.
Single-line measurement can also be applied as a ttdckness gauge for materials ofknown and tightly controlled composition. On-line measurement of the transmittedphoton intensity at one energy through metals and other solids in a constant mea-surement geometry is a direct measure of the thickness (x) of those materials. Suchinformation is useful for timely control of some commercial production processes.
9.2.2 Measurement Precision
Consider the case of a single-line concentration measurement in which no significantfluctuations are present in the solvent composition. The measurement precision of theunknown quantity (p) is determined by the statistical variance of the transmission(T). The relative precision of the density measurement is obtained by differentiatingEquation 9-3:
~=(+[~1ThLs expression shows that there is a range of transmission values
(9-4)
over which therelative precision of the density measurement is smaller than that of the transmission(the favorable precision regime, Iln TI > 1 or T <0.37. For larger transmissionvalues, the relative precision of the density is larger than that of the transmission andthe measurement suffers accordingly. Note that when T approaches 1, the expressionfor the relative precision”diveqges because of the factor l/(ln T). Because the samplematerial is absorbing none of the incident radiation, there is no assay signal.
The range of useful transmission values cd also be related to a characteristicconcentration, PC = l/px. When in T > 1, then p > PC and the measurement isin the favorable precision regime; but when p < PC, the assay signal is too smalland the precision is unfavorable. By determining the favorable operating range from

276 Hastings A. Smith, Jr., and Phyllis A. Russo
the point of view of this characteristic concentration, one can choose a reasonable sam-ple thickness (x), given the intrinsic properties of the sample material to be measured(p) and the expected range of sample concentrations.
Because of the symmetry in p and x in Equations 9-1 through 9-3, Equation 9-4also expresses the relative precision of a thickness measurement. For a tldcknessmeasurement, the precision can be enhanced by a judicious choice of photon energy.
There are limits both on how high and on how low the sample transmission shouldbe for optimum measurement precision. Because T = I/10 and the intensities arestatistically varying quantities, Equation 9-4 can be rewritten as
1/2,.
UQ= 1
(-)
T+l
P lnT IoT “ (9-5)
A plot of tids relationship in Figure 9.2 shows the deterioration of the measurementprecision at the high- and low-concentration extremes. The optimum range of T isbelow the point where in T = 1, in keeping with the definition of p=. The range ofT over which ~e quantity o(p)/p is near a minimum determines the instrument de-sign features (sample thickness, measurable concentration range, and photon energy).These featuies are also important in the more complex &nsitometry measurementsdescribed in Sections 9.3 and 9.4.
Note that the above discussion deals with the measurement precision determinedby counting statistics alone. Generally, other factors can cause added fluctuationsin the measurement results; they include variations in the matrix material (solvent)and possible instrumental fluctuations. As a result, the precision of an assay instru-ment should be determined by making replicate measurements of known standardsrepresenting the fbll range of sainple and solvent properties.
Fig. 9.2 Precision of single-energydensitometry as a functionof sampie transrnisswnfor two values @incident ~ 5. Iphoton total counts (jYom w
1 (
Equation 9-5). The opti-SINGLE-ENERGY
Zg 4mum transmission is that a_3=which gives the smallest ~o 3 -relative measurement pre- ~ ~cision., This correspottds 2 G ~to a concentration that is %%greater thdn the charac- ~Q
*teristic concentration, pc, ~where in T = 1. (Note the ~ I I klogarithmic scale on the 0.001 0.01 0.10 1.00horizontal axis.) SAMPLE TRANSMISSION (T)
Densitometry 277
9.3 MULTIPLE-_GY DENSITOMETRY
Measurement of photon transmission at one energy allows for the assay of only onesubstance or of only one component of a mixtum the concentration of the other com-ponents must be kept constant. Measurement of photon transmission at two energiesallows for the assay of two components of a mixture. Such a compound measurementstands the greatest chance for success the more the attenuation coefficients of thetwo components differ from one another. Analysis of the concentration of a high-Zelement in a low-Z solvent is an exckllent example of a two-energy densitometrymeasurement.
9.3.1 Analysia of ‘Itvo-Energy Case
Consider a mixture of two components with (unknown) concentrations PI and P2.Let the mass attenuation coefficient of component i measured at energy j be given by
Pi = Pi@j) (9-6)
and define the transmission at energy j as
Tj = exp[– (p~pl + p~p2)x] . (9-7)
The measurement of two transmissions gives two equations for the two unknownconcentrations:
(–h Tl)/x = Ml = p~pl + p~pz
(–in T2)/x = Mz = p~pl + p~p2 . (9-8)
By attributing the measured absorption to the two sample components, we are actuallydefining the incident radiation to be the intensity transmitted by an empty samplecontainer. The solution to the above equations is
For Equation 9-8 to have a solution, the determinant of the coefficients, D, must benonzero. This condition is virtually assured if the mass attenuation coefficients for thetwo components have significantly different energy dependence. Physically, this hasthe meaning that the assay is feasible if the components can be distinguished from oneanother by their absorption properties. This criterion further suggests two possiblechoices of photon energies. First, if two widely differing energies “ue used, the dMfer-”
278 Hastings A. Smith, Jr., and Phyllis A. Russo
ent slopes of p vs E for the high-Z and the low-Z components suffice to differentiatebetween them. Second, by choosing photon energies near and on either side of anabsorption edge for the heavier (higher-Z) component, the energy dependence forthe mass attenuation coefficient of the higher-Z material will appear to have theopposite slope to that of the low-Z component, making the two components easilydistinguishable. This approach is especially promising in assays of SNM in low-density matrices or in assays of two SNM components.
%3.2 Measurement Precision
The primary source of random measurement uncertainty is the statistical varianceof the transmission measurements. The expression for the relative precision of eachcomponent’s concentration is given by
– 12 {[~+12+[~w2}”2c7(j@=PI pi in T2 – Pz in T1
‘= 11, {[W12+[W12)’U(p,)
P’ p~ln T1-plln T2(9-lo)
Note that because the assay result varies inversely with the sample thickness (seeEquation 9-8), the sample thickness (x) must be very well known or held constantwithin close tolerance.
9.3.3 Extension to More Energies
In principle, the multiple-energy densitometry technique can be extended to threeor more energies to measure three or more sample components. In practice, such abroadening of the technique undermines the sensitivity of the measurement for somesample components, because it is extremely dMicult to select gamma-ray energies thatcan sample different energy dependence of the absorption of each of the components.Accordingly, multiple-energy densitometry is rarely extended beyond the two-energycase.
9.4 ABSORPTION-EDGE DENSITOMETRY
Absorption-edge densitometry is a special application of two-energy densitometry.The photon energies at which the transmissions are measured are selected to be asnear as possible to, and on opposite sides of, the absorption-edge discontinuity inthe energy dependence of the mass attenuation coefficient for me unknown material(Ref. 1). Both the K and the LZIZ absorption edges have been used in nondestructive
—. .- —.
Densitometry 279
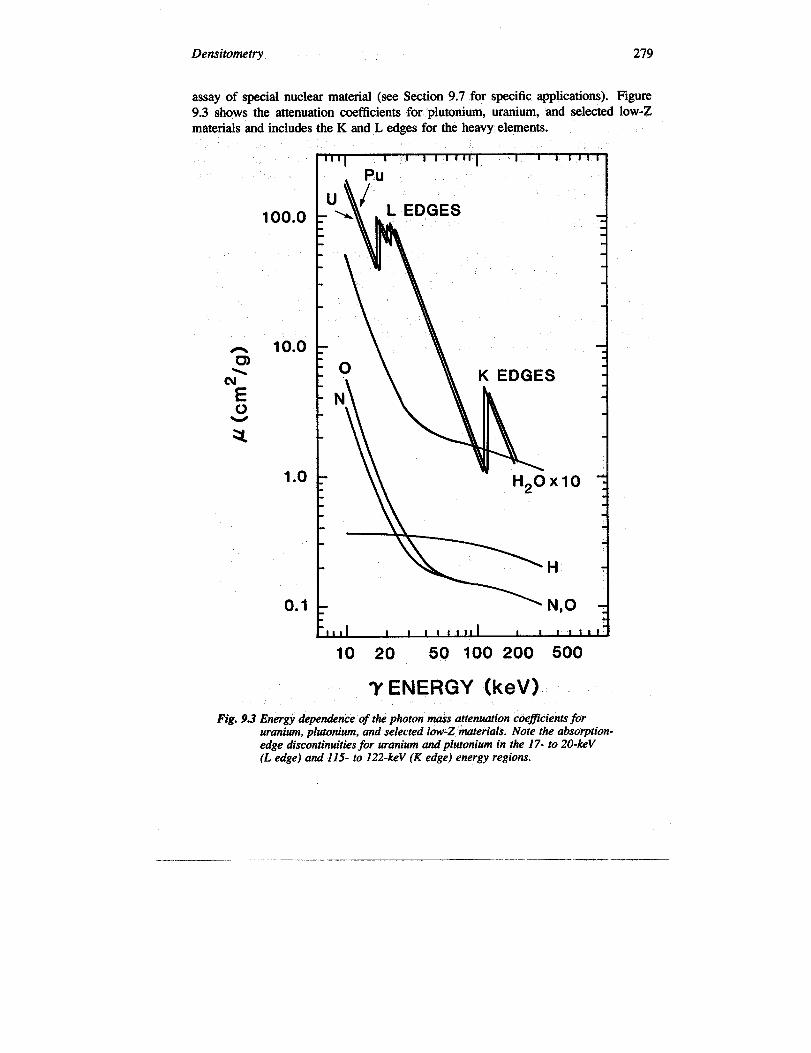
assay of special nuclear material (see Section 9.7 for specific applications). Figure9.3 shows the attenuation coefficients for plutonium, uranium, and selected low-Zmaterials and includes the K and L edges for the heavy elements.
100.0
10.0
1.0
0.1
t-,,,] 1 I I I I 1 Ill 1 i 1 I 1 1 I
10 20 50 100 200 500
T ElfJERGY (keV)
Fig. 9.3 Energy dependence of the photon mass attenuation coefficients foruranium, plutonium, and selected low-Z materials. Note the absorption-edge discontinuities for uranium and plutonium in the 17- to 20-keV(L edge) and 115- to 122-keV (K edge) energy regions.

280 Hastings A. Smith, Jr., and Phyllis A. Russo
Absorption-edge denaitometry involves the measurement of the transmission of atightly collimated photon beam through the sample material. The collimation definesthe measurement geometry and also reduces interference from radiation emitted by thesample material. Because the collimation selects only a small fraction of the samplevolume, the stiple must be highly uniform for the assay to be representative of allof the material. As a result, the absorption-edge technique is best suited for solutionassays, although it has been used for assays of solids (Refs. 2 through 4).
9.4.1 Description of Measure ment Technique
Consider the typical case of a high-Z (SNM) component in a low-Z (solvent) matrix.Figure 9.4 depicts the attenuation coefficients and measurement energies above (U)and below (L) an absorption edge. (The discussion emphasizes K-edge measurements,but the analysis is similar in the L-edge region as well.) The subscripts refers to themeasured element, and the subscripts M and m refer to the high- and low-Z matrixelements, respectively. The magnitudes of the attenuation coefficient discontinuitiesand the edge energies of interest are given in Table 9-1.
A
xw
x:
--- ——. -— --
I
.SampleMaterial,S
\
M: .: -‘‘~::ryM-+-- __ ___ Low-Z
Matrix,m
t t t >EL EK Eu
LOG( Ey)
Fig. 9.4 Expanded schematic of the mass attenuation co@cient as a jhnction ofphoton energy. Curves are shown for a sample material (s), assumed tobe a heavy element, a heavy-element matrix component(M), and a light-element matrix component (m).
—. —
Densitometry ‘ 281
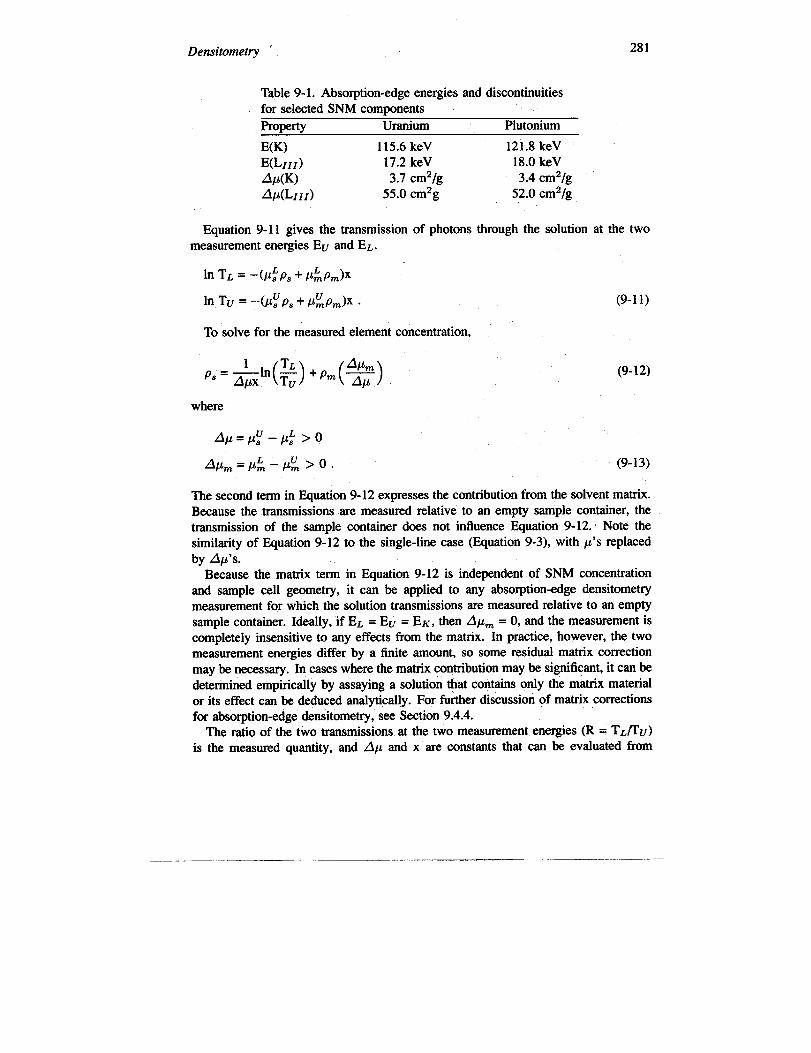
Table 9-1. Absorption-edge energies and discontinuitiesfor selected SNM commnents.Property Uranium Plutonium
E(K) 115.6 keV 121.8 keVE(LIII) 17.2 keV 18.0 keVAN(K) 3.7 cmzig 3.4 CmzlgAp(LIII) 55.0 cmzg 52.0 cm2/g
Equation 9-11 gives the transmission of photons through the solution at the twomea~urement energies Eu and EL.
in TL = -(P:P, + P&Pm)x
lnTu=– (P:PS + P:Pm)x .
To solve for the measured element concentration,
where
A/.L=p~-p~>O
Apm=/.L~-p:>O.
(9-11)
(9-12)
(9-13)
The second term in Equation 9-12 expresses the contribution from the solvent matrix.Because the transmissions arc measured relative to an empty sample container, thetransmission of the sample container does not influence Equation 9-12. Note thesimilarity of Equation 9-12 to the single-line case (Equation 9-3), with p’s replacedby Ap’s.
Because the matrix term in Equation 9-12 is independent of SNM concentrationand sample cell geometry, it can be applied to any absorption-edge densitometrymeasurement for which the solution transmissions are measured relative to an emptysample container. Ideally, if EL = EU = EK, then Apm = O, and the measurement iscompletely insensitive to any effects from the matrix. In practice, however, the twomeasurement energies differ by a finite amount, so some residual matrix correctionmay be necessary. In cases where the matrix contribution maybe significant, it can bedetermined empirically by assaying a solution that contains only the matrix materialor its effect can be deduced analytically. For further discussion of matrix correctionsfor absorption-edge densitomet~, see Section 9.4.4.
The ratio of the two transmissions at the two measurement energies (R = TL/’Tu)is the measured quantity, and Ap and x are constants that can be evaluated from

282 Hastings A. Smith, Jr., and Phyllis A. Russo
transmission measurements with calibrated standards of well-defined concentrations,Whh judiciously chosen photon energies, this technique will provide very reliable,nearly matrix-independent assays of specific elements whose absorption edges liebetween the transmission source energies.
9.4.2 Measurement Precision
Differentiation of Equation 9-12 gives the relative precision of a densitometry mea-surement:
–=(*) [* I”(+)FH ~
~(Ps)
P. (9-14)
The fractional error in R is determined by the counting statistics of the transmis-sion measurements. In analogy with the discussion of Equation 9-4, the choice ofmeasurement parameters can be guided by reference to a characteristic concentration,pc = 1/ANx. When p > pc, the measurement is in the favorable precision regime,where a(p)lp < a(R)/R. But if the SINMconcentration is too far above pc, the ex-cessive absorption deteriorates the measurement precision, primarily because of theenhanced absorption of the transmission gamma rays above the absorption edge. Thestatistical fluctuations of the very small transmitted intensity at Eu is then overpoweredby the statistical fluctuations of the background in that energy region.
Table 9-2 shows the values of these characteristic concentrations for a 1-cm trans-mission path length (x = 1 cm). The table implies, for example, that for a 1-cm samplecell thickness, K-edge assays of plutonium concentrations greater than 300 g/L wouldbe in the favorable precision regime. For assays of 30-~ solutions, the sample cellthickness should be greater than 0.5 cm for LIIr-edge assays and greater than 9 cmfor K-edge assays,
Table 9-2. Characteristic concentrations for uraniumand plutoniumCharacteristic Uranium PlutoniumConcentration (@) (w)
P.(K) 270 294
P.(Lz~I) 18 19
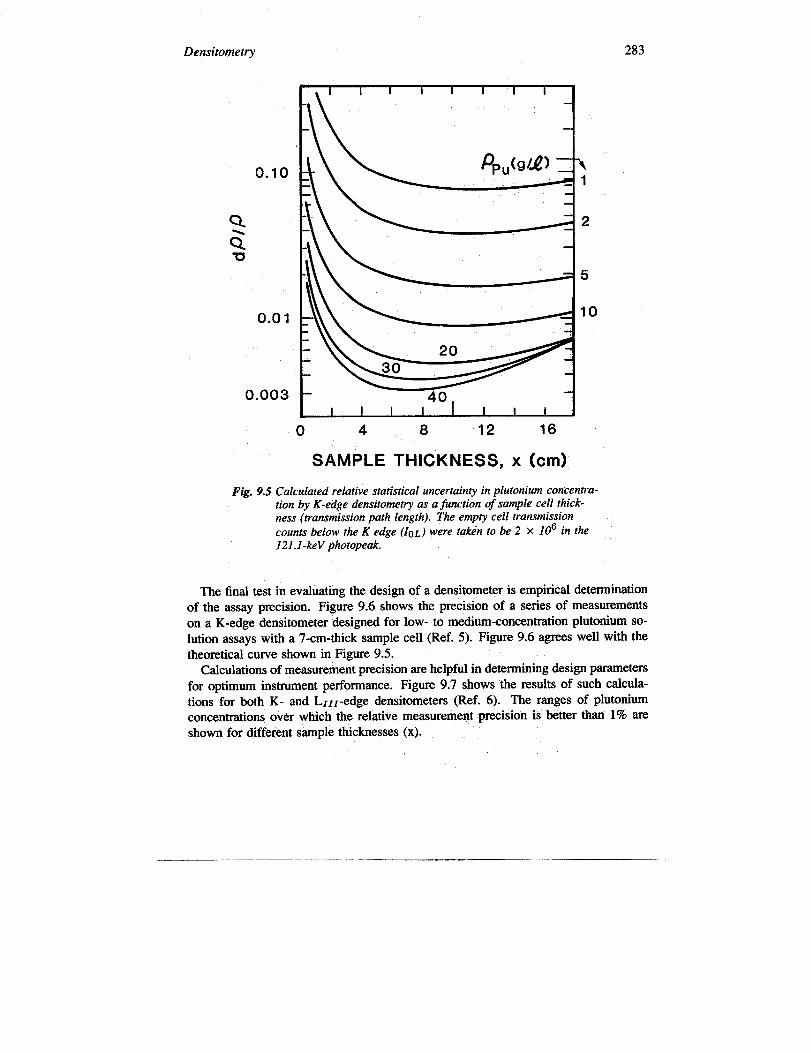
A more analytical approach can be used to optimize measurement parameters. Fig-ure 9.5 shows the calculated statistical measurement precision (Equation 9-14) as afunction of transmission path length (x) for a variety of SNM concentrations. Thefigure shows, for example, that a densitometer designed for 30-glL SNM solutionassays should have a sample cell thickness of 7 to 10 cm.
—
Densitometry 283
0.10
0.01
0.003
A
40.
o 4 8 12 16
1
2
5
10
SAMPLE THICKNESS, x (cm)
Fig. 9.5 Calculated relative statistical uncertainty in plutonium concentra-tion by K-edge densitomeoy as a function of sample cell thick-ness (transmission path length). The empty cell transmissioncounts below the K edge (IoL) were taken to be 2 X 10⁶ in the121 .l-keV photopeak.
The final test in evaluating the design of a densitometer is empirical determinationof the assay precision. Figure 9.6 shows the precision of a series of measurementson a K-edge densitometer designed for low- to medium-concentration plutonium so-lution assays with a 7-cm-thick sample cell (Ref. 5). Figure 9.6 agrees well with thetheoretical curve shown in Figure 9.5.
Calculations of measurement precision are helpful in determining design parametersfor optimum instrument performance. Figure 9.7 shows the results of such calcula-tions for both K- and LrIr-edge densitometers (Ref. 6). The ranges of plutoniumconcentrations over which the relative measurement precision is better than 1% areshown for different sample thicknesses (x).
.-.—

284 Hastings A. Smith, Jr., and Phyllis A. Russo
I I I I I I I I I I 1 I I I 1 I I I I I I I I
INSTRUMENT DENSITOMETRY ASSAY PRECISION
(50 mCi 75Se and25mCi . 57CO){:
-~<
g
20-MINUTEDENSITOMETRYASSAY -
0.5 ~ ----- ---- -. ---”4
I I 1 I I I I I I I I I 1 I A I I I
5 15 25 35 45 55 65 75 85 95 ~ 190 200
PLUTONIUMCONCENTRATION P (g/!Z)
Fig, 9.6 Relative statistical precision achieved in a plutonium concentra-tion measurement by K-edge densitomet~ as a jhnction of sampleconcentration, for a sample cell thickness OJ7 cm. Note the brokenscale above 100 glL. Curves are shown for two count times (Ref 5).
10.0
g
,,,
.00
\
$.+:.>,>.>.::. . .
. ...>..: ... . . . . . . . . . .. . . . . . . . . . . . . .. .. . . . . . . 1% UPPER..... .... ........ . .Y..:.
LIMIT .y..:->..-----............... ............. ......
“%=$:”’T.. . .....+......... .:.:..j.:.. ::.:.>..:}.;...:.::..“.”.“.”.... ... .... . .... ...... ....................o““.. .. ...........>............ . . . . .. . . ..
..~::::,-.::::::::..., “+;..>:........... . ., . . .
~\l
.-::::::::.....:::;::-....................... ...... . . ........ . . ......... . ...........““%:.y.:.;>.:+.. ...... . .-.... .. . ........ .....“::::;;::::::;:::::::.:.:::....... 0. .. . +.--o...................... .. .- .................-..-.....::: ;:..... ...........:::;:.::::::.... ..............................-..::::::::................::.... .. ........... .....:...:......................;;:::::.:.;::::...:::~:.:.:.:.:.:.:.:.:;.:...
.:::::.... ...... -....::::::.::::::::....$..::::::::....::.....:::::......-..:::.::::::.:::::.::::::.:::::...... .......:::::{::::::;::::::.:.:.:::.::::...... .........
“:;;~[E~$;%~;~;R
--.:+..:::::: ::::...::.;:’:”,...::;:::::::.::::::....:...::....4‘:::::;::::...... ... .,.......................
p:;z;i~:?!zg$g$:.
ti I I0.10 I 1 t I I I 1111 I t 1 1 I I Ill I I I I I Ill
1, 10 100 1000
Pu CONCENTRATION (g/~)
Fig. 9.7 Indications of sample transmission thicknesses (x) over which plu-tonium concentration assays can be pe~ormed by absorption-edgedensitometry to better than 1% statistical precision. Shaded regionsfor the K- and LIII-edge techniques show ph4tonium concentrationranges over which this precision is achievable.
Densitometry 285
9.4.3 Measurement Sensitivity
A useful parameter in the specification of a nondestructive assay instrument is its“minimum detectable limit,” which is that quantity of nuclear material that producesan assay signal significantly above background in a reasonable count time (Refs. 7and 8). For nuclear waste measurements, where the minimum detectable limit is animportant instrument specification, an assay signal that is three standard deviations(99% confidence level) (Ref. 9) above background is considered to be significant.This limit can also be regarded as a measurement sensitivity, in that it characterizesa lower limit of SNM that can be detected with some level of confidence.
Because absorption-edge densitometers are usually built for specific assay appli-cations in well-defined SNM solution concentration ranges, the minimum detectablelimit is not particularly important. However, the measurement sensitivity can serve asa convenient quantity for comparing design approaches and other factors that influenceinstrument performance.
To obtain an expression for the measurement sensitivity of an absorption-edgedensitometer, the assay background must be defined so that the minimum detectableassay signal can be determined. The statistical uncertainty in the measured density isgiven in Equation 9-14. The ratio R of the two transmissions above and below theabsorption edge is composed of raw gamma-ray (or x-ray) photon intensities that varyaccording to the usual statistical prescriptions. When the SNM concentration is zero,the solution is entirely matrix material (typically acid) and
TU w T~ = T = exp(–pmpmx) . (9-15)
When the the SNM concentration is zero, R = 1. Then the definition of T gives
(9-16)
Equation 9-16 expresses the uncertainty in the background., The three-sigma criterionprovides an expression for the minimum detectable limit’ (or sensitivity, s) for anabsorption-edge densitometer
‘=*[(++*)(+)1’” ‘g”)(9-17)
where the units of Apx are cm31g.Equation 9-17 shows that the measurement sensitivity is affected by several mea-
surement parameters:● The sensitivity suffers in low-transmission samples.● Long counts of the unattenuated photon intensities (l.) improve measurement sen-
sitivity.
—.
286 Hastings A. Smith, Jr., and Phyllis A. Russo
● L-edge measurements (with their larger Ap are more sensitive than K-edge mea-surements (if all other measurement parameters remain the same).
● An increase in sample cell thickness may improve the measurement sensitivity, butthe accompanying decrease in T will compete with that improvement.
9.4.4 Matrix Effects
The absorption-edge technique is insensitive to the effects of matrix materials ifboth transmissions are measured at the absorption edge. However, with a finite energyseparation of the transmission gamma rays, the matrix contribution is nonzero and isrepresented by the second term in Equation 9-12. This term can become significantfor low SNM concentrations, p., or when the spacing between the assay energies,EL and Eu, becomes largq either condition threatens the validity of the inequality
@nPm << 4PP.. :The natural width of the absorption edge (less than 130 eV) and the energy resolu-
tion of the detection system (typically 500 eV or more) are intrinsic limitations to thedesign of an instrument that attempts to minimize the effects of matrix attenuation byusing closely spaced assay energies. The limited availability of useful, naturally oc-curring radioisotopes rdso leads to compromises in the choice of transmission sources.
One very useful technique for reducing the matrix effect is an extrapolation pro-cedure applied to the measured transmission data (Refs. 2 and 5). The procedureattempts to extrapolate the measured transmissions to the energy of the absorptionedge. This extrapolation is possible because the energy dependence of the mass at-tenuation coefficients over narrow energy ranges is known to be a power law:
logp(E)=klog E+B . (9-18)
The slope parameter (k) is essentially the same for elements with Z > 50, withan average value of approximately –2.55 near the uranium and plutonium K edges(Ref. 2). Table 9-3 gives the extracted values for the slopes and intercepts of severalsubstances of interest to SNM assay (Ref. 10).
As an example of a general assay case, consider a solution of SNM in a low-Z solvent, with possible additional heavy-element (Z > 50) matrix contaminants.Equation 9-12 generalizes to
p.=(&)ln(%)+pM(%)+p.(~)- (9-19)
The subscript M refers to the high-Z matrix contaminant, and the subscript m repre-sents the low-Z matrix (solvent); and in analogy with Equation 9-13, APM = pi –pfi(see Figure 9.4). The measured transmissions are then extrapolated to the SNM Kedge using the ene~y dependence of P(E) for the heavy elements. Because theslope parameters (k) for Z >50 are all essentially the same, the SNM and high-Z
Densitometry 287
Table 9-3. Slopes (k) and intercepts (B) for the linear dependenceof log P(E) vs log E for various materials of interest in the100- to 150-keV energy region (log to base 10)”Solution, Component k B
Plutonium (above K edge) –2.48 5.83(below K edge) –2.56 5.42
Uranium (above K edge) –2.49 5.82(below K edge) –2.7 1 5.65
Tungsten –2.50 5.65Tin –2.45 5.12Iron – 1.57 2.70Aluminum –0.500 0.227Water –0.306 –0,153Nitric Acid –0.3 14 –0.171
aRef. 10.
matrix absoqxion coefficients can be transformed with the same k (for example, theaverage value, –2.55). As a result, the transformed ApM vanishes and the assayresult becomes
(9-20)
where AN+ (which equals N$ – p;, see Figure 9.4) is now defined across the ab-sorption edge (in this case, the K edge) rather than between the energies EL and Eu.The constants a, b, and c are defined as
a = (EK/EL)k
b = (EK/EU)k
c = (EK/EL)k-k’ – (EK/EU)k–k’ (9-21)
where k = –2.55 and k’ = –0.33 (the average value of k for elements with atomicnumbers less than 10). This procedure renders the assay essentially independent ofthe heavy-element matrix but still leaves a residual correction for the light-elementmatrix. It is not possible to remove the effects of both the light- and heavy-elementmatrix materials because k # k’. The transmissions must be corrected for the acidmatrix contributions because the transmissions are measured relative to an empty sam-ple cell. If the reference spectra (the IO intensities) were taken with the cell fill ofa representative acid solution, no acid matrix correction would be necessary. However,

288 Hastings A. Smith, Jr., and Phyllis A. Russo
any fluctuation in acid molarity would bias the measurement of an actual sample. Thedensity of nitric acid (pm) and the acid molarity (M) are related (Ref. 11) by
pm=l+0.03M. (9-22)
For plutonium K-edge assays in which the K edge is closely bracketed by 57C0 and75Se gamma rays (see Section 9.4.6), this low-Z matrix correction is small but maybe important at low plutonium concentrations. For example, the correction term inEquation 9-20 for 3 M nitric acid is equivalent to approximately 0.87 g Pu/L (Ref. 5).Equation 9-22 shows that fluctuations in acid molarity cause fluctuations in the acidmatrix correction that are only 370 as larg~ so careful control of the acid molarity isimportant only at very low SNM concentrations.
For uranium K-edge assays with a 169Yb transmission source (EL = 109.8 keV,Eu = 130.5 keV), the extrapolation procedure greatly improves the quality of theassay results. This is demonstrated graphically in Ref. 2, where assays of uraniumsolutions with varying tin concentrations were shown to be matrix-independent withthe extrapolation correction. Several other matrix effects studies are described inRef. 12.
9.4.5 Choice of Measurement Technique
Because of differences in the Ap values at the K edge versus the LIII edge, themeasurement sensitivity (defined in Equation 9- 17) is more than an order of magnitudelarger at the LZII edge than at the K edge, other parameters being equrd (see also Table9-1). However, because of the higher penetrability of photons at the K-edge energies,thicker samples can be used for the K-edge measurements, thereby enhancing K-edgesensitivity.
If significant quantities of lower-Z elements (such as yttrium and zirconium) arepresent in a sample, the K edges of these elements cause discrete interferences that biasthe LIII assays of uranium and plutonium (Ref. 12). Furthermore, detector resolutionat LIII energies limits the ability to perform LIII-edge assays in the presence ofsignificant amounts of neighboring elements (uranium with protactinium or neptuniumplutonium with neptunium or americium). The K-edge measurements are not subjectto such interferences. In addition, the higher photon energies required for the K-edgetransmission measurements permit the use of thicker or higher-Z materials for sample-cell windows, an important practical consideration for in-plant operation. Finally,more flexibilityy exists in the availability of discrete-gamma-ray transmission sourcesfor K-edge measurements.
9.4.6 Transmission Sources
The most versatile transmission source is the bremsstrahlung continuum producedby an x-ray generator. The intensity of this source can be varied to optimize the countrate for a variety of sample geometries, concentrations, and thicknesses.

Densitometry 289
The x-ray generator voltage (which determines the assay energy range) can beadjusted and the spectrum tailored appropriately for the assay of specific elements.Furthermore, matrix effects can be minimized by extrapolation of the measured trans-missions to the absorption edge. Commercial units are available with power suppliesthat are highly stable and x-ray tubes that are long-lived for long-term reliable oper-ation in either the K- or the LI1l-edge energy regions.
The use of discrete gamma-ray lines that bracket the absorption edge, the alter-native to the continuum transmission sources, has been demonstrated successfully inseveral instruments. This technique is appropriate for K-edge assays. Discrete gainmarays are not available as primary emissions in the LIII-edge energy region. This ap-proach depends on the availability of relatively slowly decaying radioisotopes thatemit gamma rays of appropriate energies and sufficient intensities. For example, aconvenient combination for the K-edge assay of plutonium (EK = 121.8 keV) is the121.1-keV gamma ray from 75Se (half-life = 120 days) and the 122.1-keV gamma rayfrom 57Co (half-life = 270 days). The proximity of both energies to the plutoniumabsorption edge minimizes the effects of the matrix and enhances the sensitivity ofthe assay (Ref. 1). Because of the different half-lives, accurate decay corrections orfrequent measurements of the unattenuated intensities (l.) are required. The use oflGgYb(half-life = 32 days) for uranium assay at the K edge (Refs. 2 and 3) has theadvantage of requiring no decay correction because both gamma rays come from thesame source. However, the linger energy separation (EL = 109.8 keV, EK = 115.,6keV, Eu = 130.5 keV) introduces a larger matrix sensitivity (larger Apm) and ,asmaller assay sensitivity (smaller Ap). Furthermore, to maintain acceptable count-ing statistics, the source must be replaced frequently because of the short half-life of16gYb. The extrapolation tectilque discussed in Section 9.4.4, is especially effectivein reducing the matrix sensitivityy. A detailed dkcussion of convenient radioisotopicsources for absorption-edge densitometry appears in Ref. 1. Several variations onthese two basic transmission source configurations are discussed in Ref. 12. ;
9.5 SINGLE-IXNE DENSITOMETERS
The measurement of photon transmission at a single energy has been applied usinglow-resolution detectors for assay of SNM in solution and in reactor fuel elements.These instruments use low-energy gamma-ray transmission sources to minimize theratio flO/fl (see Equation 9-3) and thus reduce the sensitivity to variations in the low-Zmatrix.
One instrument uses an 241Am transmission source mounted in the center of anannular cell containing SNM solution (Refs. 13 and 14). The cell is surroundedby a 47r plastic scintillator. The instrument separates the transmitted 60-keV gammaray from the background sample radiation by modulating the source with a rotating,slotted tungsten shield. Designed to assay high concentrations (>200 @L) of SNM,the instrument is sensitive to 1% changes in SNM concentration at the 95% confidencelevel.
—.

290 Hastings A. Smith, Jr., and Phyllis A. Russo
A single-line densitometer has been used to determine the density of SNM inpelleted and compacted cerhmic fuel elements (Ref. 15). The 67- and 76-keV gammarays of 171Tm and the 84-keV gamma ray of 170Tm me detected by a 1-in.-diamNaI(Tl) detector. The gross detector signals are counted in the multichannel scalingmode as the fuel elements are scanned to give the SNM density profile. The sensitivityyof the instrument to SNM is 0.2 @cm3 at the 95% confidence level.
9.6 DUAL-LIlN13 DENSITOMETERS
Dual-line densitometry has application to solids (fuel elements) and to solutions.Low- and high-resolution gamma spectrometers have been used and have been appliedto the assay of a low- and high-Z component, as well as to the assay of two high-Zcomponents.
A dual-line densitometer has been used to determine the densities of the low-Z (sil-icon ahd carbon) and high-Z (thorium and uranium) components in high-temperaturegas-cooled reactor (HTGR) fuel pellets (Refs. 16 and 17). The transmission sourceprovides two widely differing gamma-ray energies (122 keV from 57C0 and 1173 and1332 keV from ‘°Co), so that the &nsitivity to the two components is based on thedifferent slopes of p vs Eat low and high Z*S. Equation 9-9 applies in this case.Fuel pellet cakes containing 92 to 95% thorium and 5 to 8$?. 238U with a low-Z toheavy-Z weight ratio of 1.6 to 2.4 were assayed in 2-rein measurement periods. Thesensitivity to changes in the weight of either component was 3% or better at the 9570confidence level.
Dual-line solution densitombtry has also been applied to the assay of two SNMcomponents by measuring ~transmissions at two low gamma-ray energies (Refs. 18and 19]. The transmission energies were chosen to bracket the L-absorption edges ofthe higher-Z component (element 2) in such a way that, in Equation 9-8, p; = p; andp; > fl~. Thus, Equation 9-8 can be solved to give the concentration of element 1,independent of element 2:
‘l=(&)h(3 (9-23)
where Apl = p? – pi. The measured T2 and pl are then used to obtain the concen-tration of element 2:
In T2()
PIP? .‘2= —
P; P; (9-24)
Dual-1ine densitometry has been applied to thorium and uranium assay using sec-ondary sources of niobium and iodine K~ x rays (at 16.6 and 28.5 keV, respectively)
“241Am source. These x-rays bracket the L edges of uranium.fluoresced by a 100-mCl
.— ——
Densitometry 291
However, 16.6 keV is just above the LZIZ absorption edge of thorium (at 16.3 keV).Measurements were performed using low-resolution (Ref. 18) and high-resolution(Ref. 19) gamma-ray spectroscopy. The high-resolution experiments used referencesolutions containing mixtures of thorium and uranium with total SNM concentrationsbetween 35 and 70 g/L. In the range 0.25 S pm/~ S 4.0, the precision of the thoriumand uranium concentration assay was 1~0 or better for 4000-s count periods.
9.7 ABSORPTION-EDGE DENSITOMETERS
Assay of uranium and plutonium solutions by the absorption-edge densitometrytechnique has been demonstrated in field tests of several instmments that perfom K-edge or LIII-edge measurements. The instruments were designed for solution scraprecovery or reprocessing applications. Each instrument uses a high-resolution gamma-ray spectrometer (typically HPGe for K-edge assays and Si(Li) for Lzlz-edge assays)and a computer-based multichannel analyzer. The measurement precision achieved ineach case approaches the statistical prediction, which is typically 0.5% or better forshort (S30-min) count periods.
The transmission sources used by the K-edge instruments are discrete gamma-ray sources or bremsstrahlung continuum (x-ray) sources. The 109.8- and 130.5-keV gamma rays of lG9Yb are used for discrete K-edge assays of uranium, and the121.1- and 122.1-keV gamma rays of TSSe and STCOm used for discrete K-edge
assays of plutonium. Only x-ray generators have been used in the Lzzl-edge instru-ments.
The absorption-edge assay relies on Equation 9-12. The assay precision (Equation9-14) depends on several variables, including Aj.L, x, solution concentration, counttime, and incident beam intensity. It is therefore convenient in comparing variousinstruments to use the characteristic concentration parameter [PC= ( l/Apx)] for eachinstrument. The instmment relative precision is defined as the precision measured atthe optimum concentration for a fixed count period. This optimum concentration isthat for which the relative precision [o(p)/p] is a minimum (see Figures 9.5 and 9.6).
Tables 9-4 and 9-5 list the K-edge and Lzlz-edge densitometers that have undergonefield testing. The characteristic concentration (PC)and the empirically determined op-timum concentration (shown in parentheses beneath PC)are given for each instrument.The tables specify the solutions used to obtain the data and quote the measured preci-sion at the optimum concentrations in specified count periods. Detailed discussionsof the instruments listed in Tables 9-4 and 9-5 are given in Sections 9.7.1 and 9.7.2.
9.7.1 K-Absorption-Edge Densitometers
Given below are descriptions of several K-edge densitometers that have been testedand evaluated under actual or simulated in-plant environments. Table 9-4 summarizesthe performance data for the instruments.

Table 9-4. K-absorption-edge densitometers.P.
Instrument Test Poptimum Solution Precision Live TimeLocation (g/L) SNM Type 10 (%) (s) References
1. Los Ahunos 135 u(300)
HEU SR”, misc. 0.5 1000 12,20,21
2. Oak RidgeY-12
3. BarnwellAGNS
4. Tokai (Japan)PNC
5. Savannah RiverSRP
6. Seibersdorf (Austria)IAEA(portable)
7. Karlsruhe (FRG)KfK
u(:;0)
Pu(::0)
150 Pu(300)
Pu(:)
150 Pu(300)
150(300) :U
HEU SR, misc. 0.5 600 22,23
prepared 0.2 1200 12,24,25(fresh, aged)
RPb product 0.2 2000 12,26,27,28 $(fresh, aged) k
=.aRP product 0.2 2000
~5,12,29
(fresh)+
gprepared 0.3 500 30 “s
prepared 0.2 1000 12,31,32 %RP product 0.2 1000
1
+(continuum source) U(+PU)
[RF feed 1 0.2 1000 33 Q*
Pu(+u) U:PU::3:1 1.0 1000*h. . p
“SR = Scrap Recovery. gbbRP = Reprocessing Plant.s
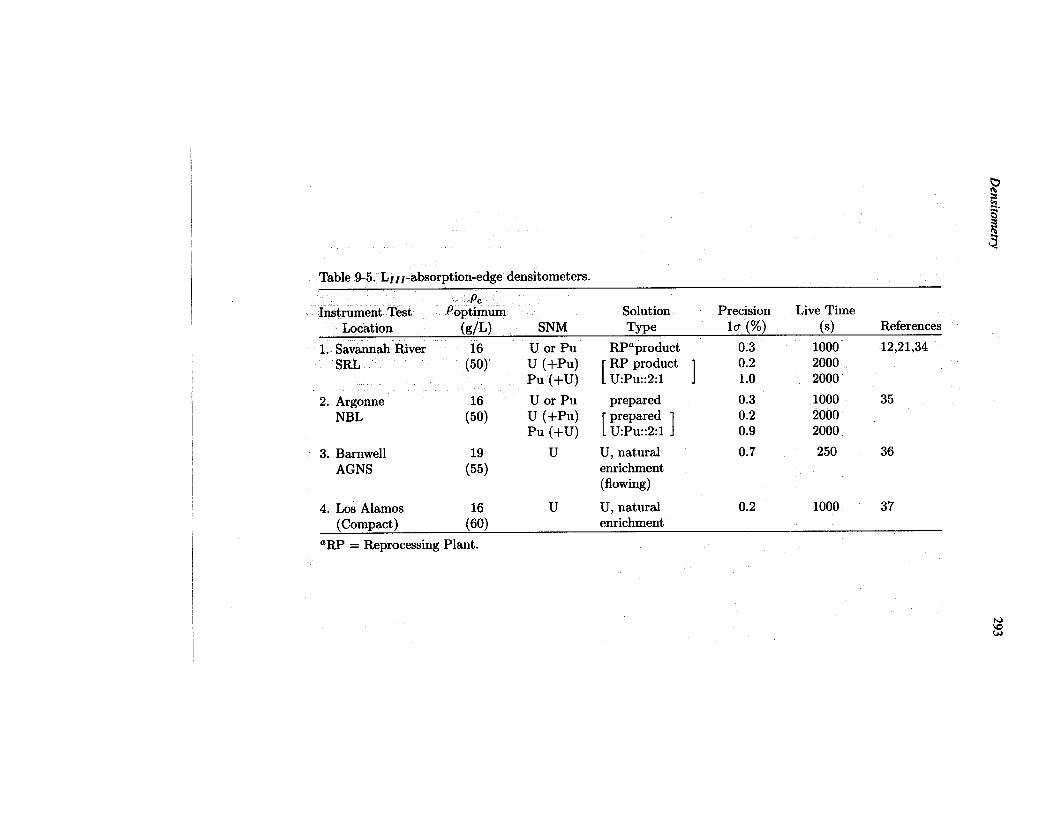
Table 9-5. LIzz-absorption-edge densitometers.
PcInstrument Test Poptimum Solution Precision Live Time
Location (gIL) SNM Type la (%) (s) References
1. Savannah River 16 U or PuSRL (50) u (+PU)
Pu (+U)
2. Argonne U or PuNBL (:) u (+PU)
Pu (+U)
3. Barnwell uAGNS (:)
4. Los Akamos 16 u
RPaproduct 0.3 1000 12,21,34
[RP product 1 0.2 2000.U:PU::2:1 1.0 2000
prepared 0.3 1000 35r prepared I 0.2 20001U:PU::2:1 j 0.9 2000
U, natural 0.7 250 36enrichment(flowing)
U, natural 0.2 1000 37(Compact) (60) enrichment
‘RP = Reprocessing Plant.

294 Hastings A. Smith, Jr., and Phyllis A. Russo
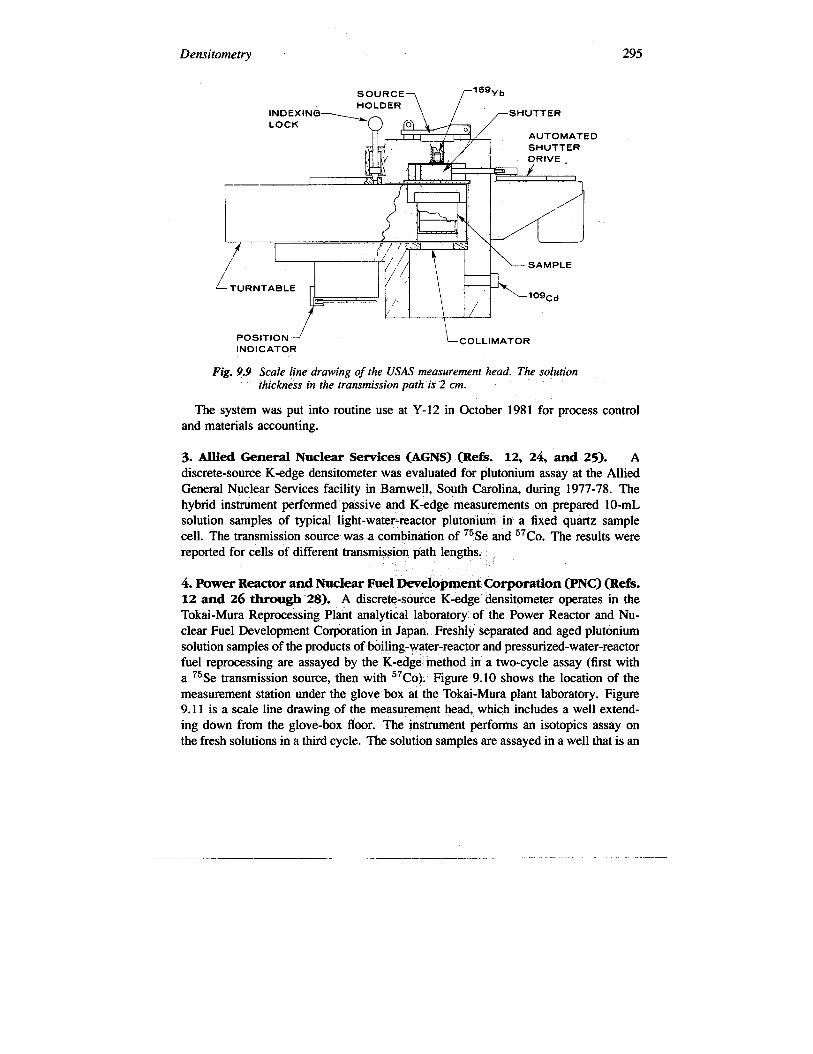
1. Los Alamos National Laboratory (Refs. 12, 20, and 21). The Los Alamosuranium solution assay system (USAS) is a hybrid assay instrument used off-line atthe Los Alamos high-enriched uranium (HEU) scrap recovery facility. The USASmeasurement head is shown in Figures 9.8 and 9.9.
The USAS applies three distinct gamma-ray methods to assay uranium concentrationin 20- or 50-mL uranium solution samples (in disposable plastic sample vials) in threeconcentration ranges. Waste solutions with uranium concentrations in the range 0.001to 0.5 g/L are counted for 2000 s with no transmission correction. Process solutionswith concentrations in the range 1 to 50 g/L are measured using a 169Ybtransmissionsource. The highest range, 50 to 400 g/L, corresponding to product solutions, isassayed by the K-edge method using a lGgYb transmission source. Accuracies of0.7-1 .5% can be achieved in measurement times of 400-2000 s.
The assay results are used for process control and nuclear material accounting. Theinstrument was in routine use in the scrap recovery facility from January 1976 untilAugust 1984 when the facility was closed.
2. Oak Ridge Y-12 Plant (RefS. 22 and 23). The HEU scrap recovery facilityat the Oak Ridge Y-12 Plant uses a solution assay system (SAS) that is analogous tothe USAS, The K-edge method is used to assay 50-mL uranium solution samples inthe concentration range 50 to 200 g/L, The samples include but are not limited to theproduct. The SAS uses a lG9Yb transmission source and disposable plastic samplevials.
Fig. 9.8 The USAS measurement head.
Densitometty 295
/POSITION JINDICATOR
L COLLIMATOR
Fig. 9.9 Scale line drawing of the USAS measurement head. The solutionthickness in the transmission path is 2 cm.
The system was put into routine use at Y-12 in October 1981 for process controland materials accounting.
3. Allied General Nuclesr Services (AGNS) (Refs. 12, 24, and 25). Adiscrete-source K-edge densitometer was evaluated for plutonium assay at the AlliedGeneral Nuclear Services facility in Barnwell, South Carolina, during 1977-78. Thehybrid instrument performed passive and K-edge measurements on prepared 10-mLsolution samples of typical light-water-reactor plutonium in a fixed quartz samplecell. The transmission source was a combination of 75Se and 57C0. The results werereported for cells of dhlerent transmission path lengths.
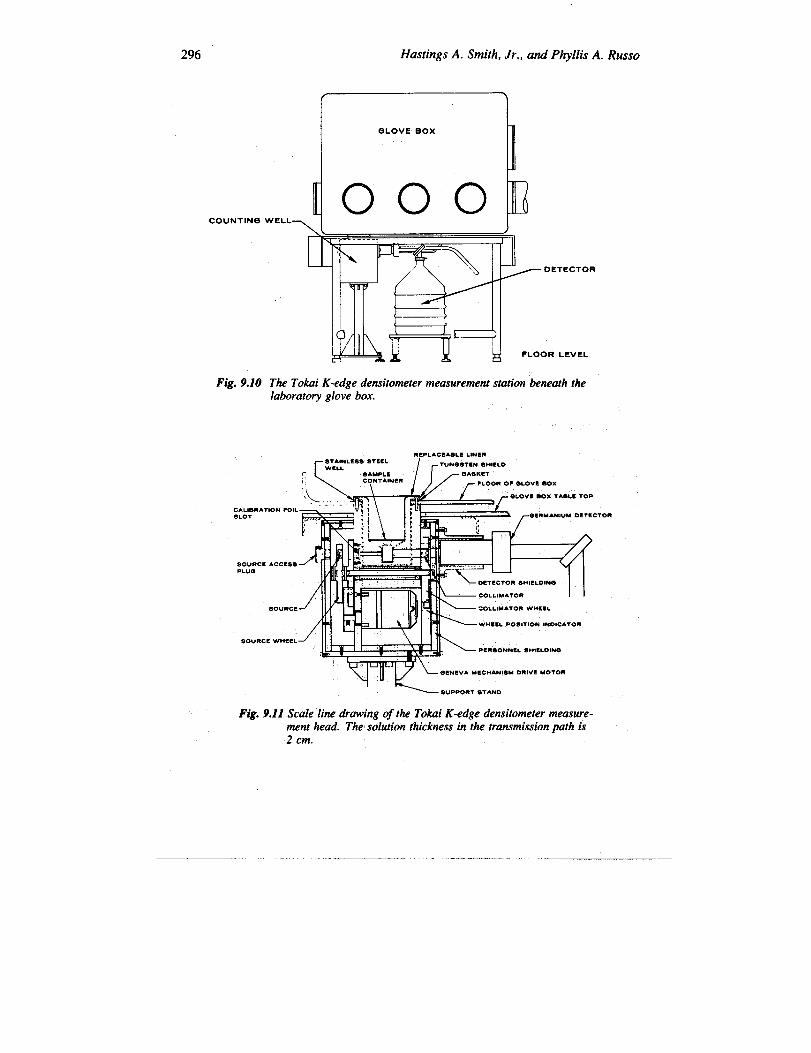
4. Power Reactor and Nuclear Fuel Development Corporation (PNC) (Refs.12 and 26 through 28). A discrete-source K-edge densitometer operates in theTokai-Mura Reprocessing Plant analytical laboratory of the Power Reactor and Nu-clear Fuel Development Corporation in Japan. Freshly separated and aged plutoniumsolution samples of the products of boiling-water-reactor and pressurized-water-reactorfuel reprocessing are assayed by the K-edge method in a two-cycle assay (first witha 75Se transmission source, then with 57CO). Figure 9.10 shows the location of themeasurement station under the glove box at the Tokai-Mura plant laboratory. Figure9.11 is a scale line drawing of the measurement head, which includes a well extend-ing down from the glove-box floor. The instrument performs an isotopics assay onthe fresh solutions in a third cycle. The solution samples are assayed in a well that is an
296 Hastings A. Smith, Jr., and Phyllis A. Russo
f 3
eLOVE BOX
[ 000 J-COUNTIN~ WELL>
Fig. 9.10
\L /J
( DETECTOR
/
[~”~~~j FLOORLEVEL
The Tokai K-edge densitometer measurement station beneath thelaboratory glove box.
S0.RCW211 w“Y OI?TZCTOR81’IIEI.DINO
R= COLLIMATOR IICOLLIMATOR WHEEL
~ W“CE(. P**,T,ON ,NO,CATO”
. &p,Rs..N=Ls”,ELo,NeRluv r ~ENl!VA MECHAN18M DRIVE MOTOR
l-k‘~ *“pp.”, *,...
Fig. 9.11 Scale line drawing of the Tokai K-edge densitometer measure-ment head. The solution thickness in the transmission path is2 cm.
Densitometty 297
2.0 i& I I 1 I I 1 t 1 1
Q- 1 f) k-----CAO=----A-----= -------Q-r----V -.
* C.u
o ● AGEDo oFRESHLY SEPARATED
t 1 t I I I
120 130 140 150’ 160 170 180 190 200
SAMPLE IDENTIFICATION
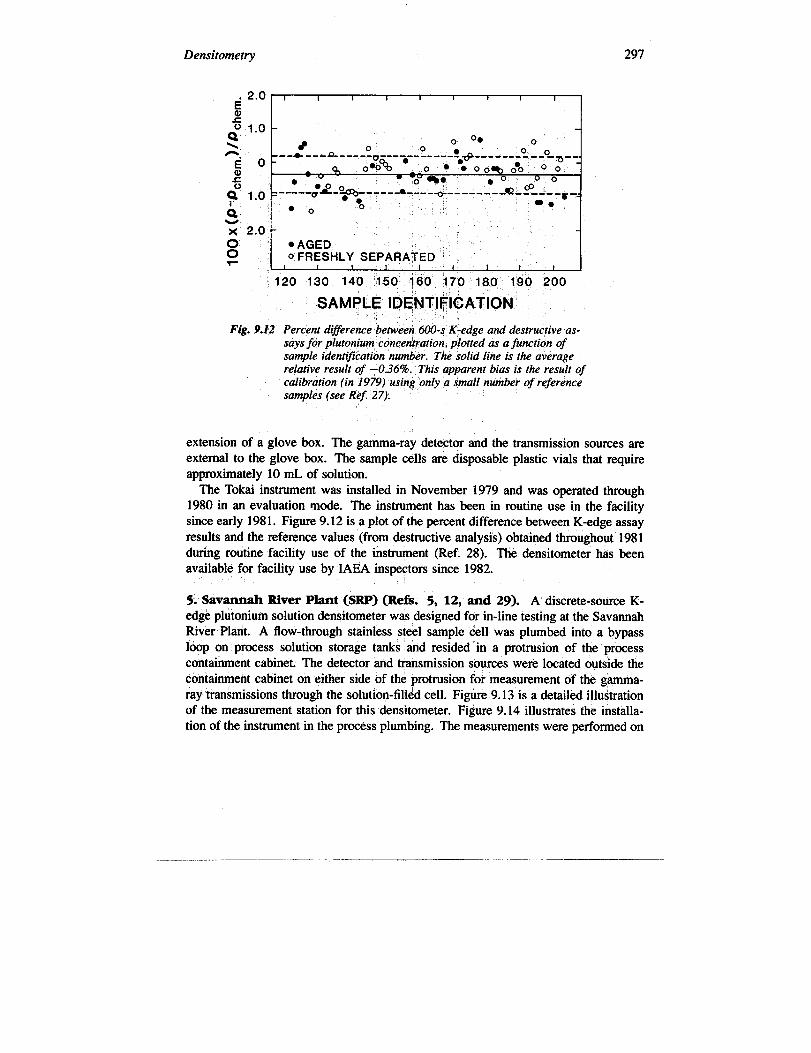
Fig. 9.12 Percent difference between 600-s K-edge a@ destructive as-says for plutonium concentration, plotted as a function ofsample identification number. The solid line is the averagerelative result of –0.36Y0. This apparent bias is the result ofcalibration (in 1979) using only a small number of referencesamples (see Ret 27).
extension of a glove box. The gamma-ray detector and the transmission sources areexternal to the glove box. The sample cells are disposable plastic vials that requireapproximately 10 mL of solution.
The Tokai instrument was installed in November 1979 and was operated through1980 in an evaluation mode. The instrument has been in routine use in the facilitysince early 1981. Figure 9.12 is a plot of the percent difference between K-edge assayresults and the reference values (from destructive analysis) obtained throughout 1981during routine facility use of the instrument (Ref. 28). The densitometer has beenavailable for facility use by IAEA inspectors since 1982.
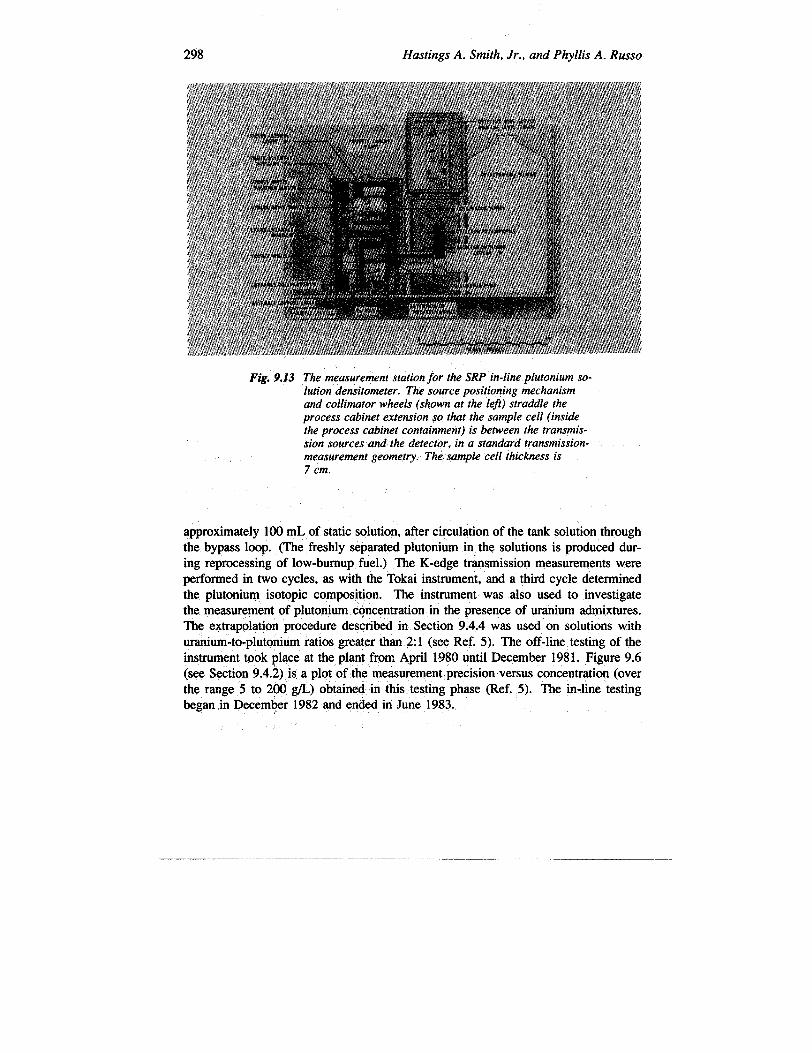
5. Savannah River Plant (SRP) (Refk. 5, 12, and 29). A discrete-source K-edge plutonium solution densitometer was designed for in-line testing at the SavannahRiver Plant. A flow-through stainless steel sample cell was plumbed into a bypassloop on process solution storage tanks hnd resided in a protrusion of the processcontainment cabinet. The detector and transmission sources were located outside thecontainment cabinet on either side of the protrusion for measurement of the gamma-ray transmissions through the solution-filled cell. Figure 9.13 is a detailed illustrationof the measurement station for this densitometer. Figure 9.14 illustrates the installa-tion of the instrument in the process plumbing. The measurements were performed on
—— .—
298 Hastings A. Smith, Jr., and Phyllis A. Russo
Fig. 9.13 The measurement station for the SRP in-line plutonium so-lution densitometer. The source positioning mechanismand collimator wheels (shown at the left) straalile theprocess cabinet extension so that the sample cell (insidethe process cabinet containment) is between the transmis-sion sources and the detector, in a standard transmission-measurement geometry. The sample cell thickness is7 cm.
approximately 100 mL of static solution, after circulation of the tank solution throughthe bypass loop. (The freshly separated plutonium in the solutions is produced dur-ing reprocessing of low-burnup fuel.) The K-edge transmission measurements wereperformed in two cycles, as with the Tokai instrument, and a third cycle determinedthe plutonium isotopic composition. The instrument was also used to investigatethe measurement of plutonium concentration in the presence of uranium admixtures.The extrapolation procedure described in Section 9.4.4 was used on solutions withuranium-to-plutonium ratios greater than 2:1 (see Ref. 5). The off-line testing of theinstrument took place at the plant from April 1980 until December 1981. Figure 9.6(see Section 9.4.2) is a plot of the measurement precision versus concentration (overthe range 5 to 2~ @) obtained in this testing phase (Ref. 5). The in-line testingbegan in December 1982 and ended in June 1983..
.—
Densitome~ 299
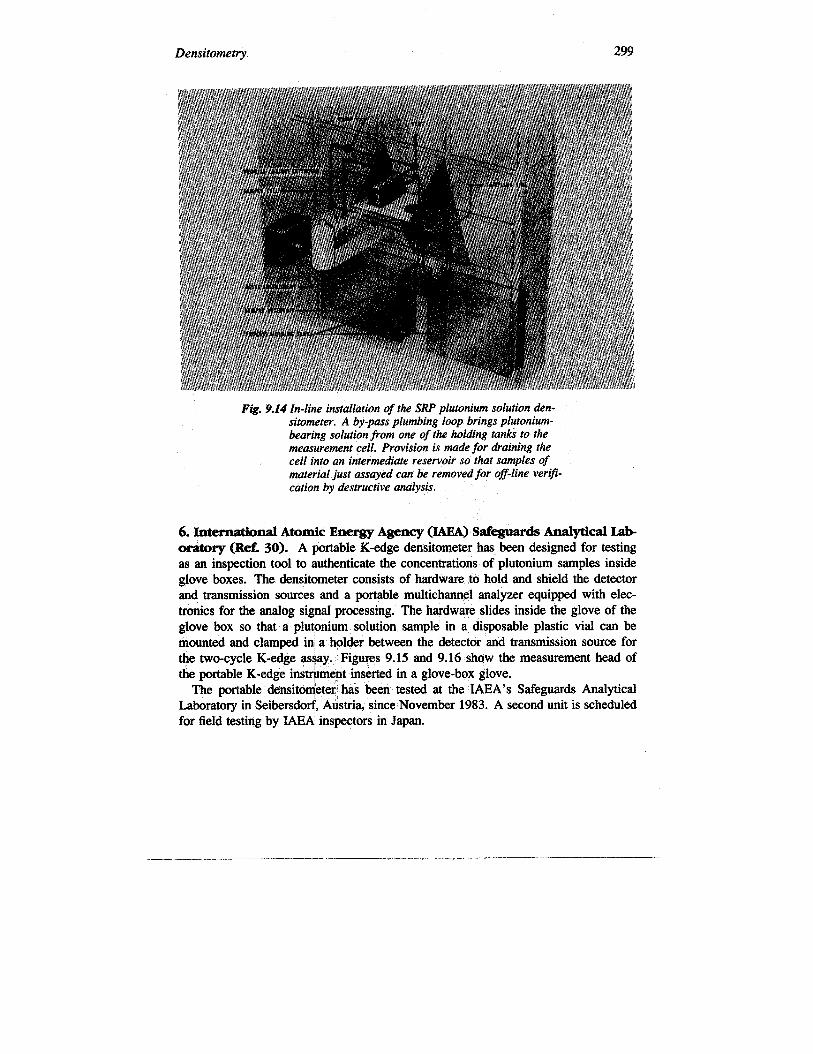
Fig. 9.14 In-line installation of the SRP plutonium solution den-sitometer. A by-pass plumbing loop brings plutonium-bearing solution from one of the holding tanks to themeasurement cell. Provision is mude for draining thecell into an intermediate reservoir so that sampies ofmaterial just assayed can be removed for off-line verijl-cation by destructive analysis.
6.InternationalAtomic Energy Agency (IAEA) Safeguards Analytical Lab-oratory (Ref. 30). A portable K-edge densitometer has been designed for testingas an inspection tool to authenticate the concentrations of plutonium samples insideglove boxes. The densitometer consists of hardware to hold and shield the detectorand transmission sources and a portable multichannel analyzer equipped with elec-tronics for the analog signal processing. The hardware slides inside the glove of theglove box so that a plutonium solution sample in a disposable plastic vial can bemounted and clamped in, a holder between the detector and transmission source forthe two-cycle K-edge assay. Figures 9.15 and 9.16 show the measurement head ofthe portable K-edge ins~ment inserted in a glove-box glove.
The portable densitometer has been tested at the IAEA’s Safeguards AnalyticalLaboratory in Seibersdorf, Austria, since November 1983. A second unit is scheduledfor field testing by IAEA inspectors in Japan.

, ..CONTAMINATEO 8
LOW-ENERGY PHOTON SPECTROMETER
HIGH-PURITY 5ERMANIUM DETECTOR
/’ /-TUN5STEN
GLOVE BOX INTERIOR
Fig. 9.15 Scale line drawing of the measurement head of the portable K-edge &nsitometer inserted in a glove-box glove.The sample cell thickness in the transmission path is 2 cm.

Densitometry 301
Fig. 9.16 The portable K-edge densitometer, positioned for measurement.
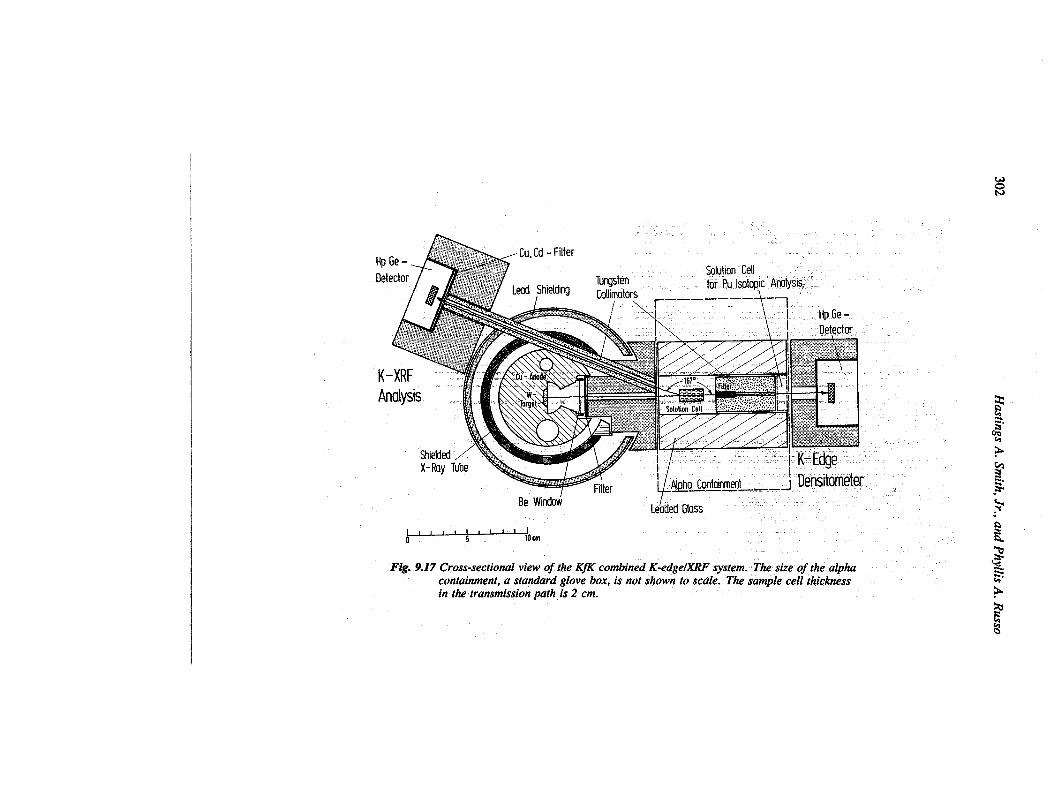
7. Kernforzchungszentrurn Karlsruhe (KfK) (Refi. 12 ~d 31 ~OU@33). A continuum-source K-edge densitometer has been tested at Kernforschungszen-trum Karlsruhe in Karlsruhe, Federal Republic of Germany (FRG), since 1978. Thedetector and x-ray head reside outside a glove box, and the samples and collimators areinside the glove box. The instrument has been used to assay reprocessing product so-lutions and fast-breeder-reactor reprocessing feed solutions for concentrations of bothuranium and plutonium. A hybrid version of this instrument was used for assayinglight-water-reactor feed solutions in which the plutonium content is approximately 1%of the uranium content. The continuum source served both iis a transmission sourcefor K-edge assay of uranium and as a fluorescing source for x-ray fluorescence (XRF)assay of the plutonium/uranium concentration ratio. The intensity of the continuumsource allows the highly restrictive sample collimation required for K-edge and XRFassays while greatly reducing the passive count rate from the samples, which containhigh levels of fission products.
Figure 9.17 is a line drawing of the measurement head for the hybrid instrument.Figure 9.18 shows the K-edge densitometer at Karlsruhe.
I
hAnalysis !
“%‘t
\
%iekkd ““”~.X-Ray Tube -.:, —
1 Alpha Cui-lt
Lemeo
Fig. 9.17 Cross-sectional view of the Kfi combined K-edgelXRF system.. The size of the alphacontainment, a stanahd glove box, is not shown to scale. The sample cell thicknessin the transmission path is 2 cm.

Densitomet?y 303
9.7.2 L~~rAbsorption-Edge Densitometers
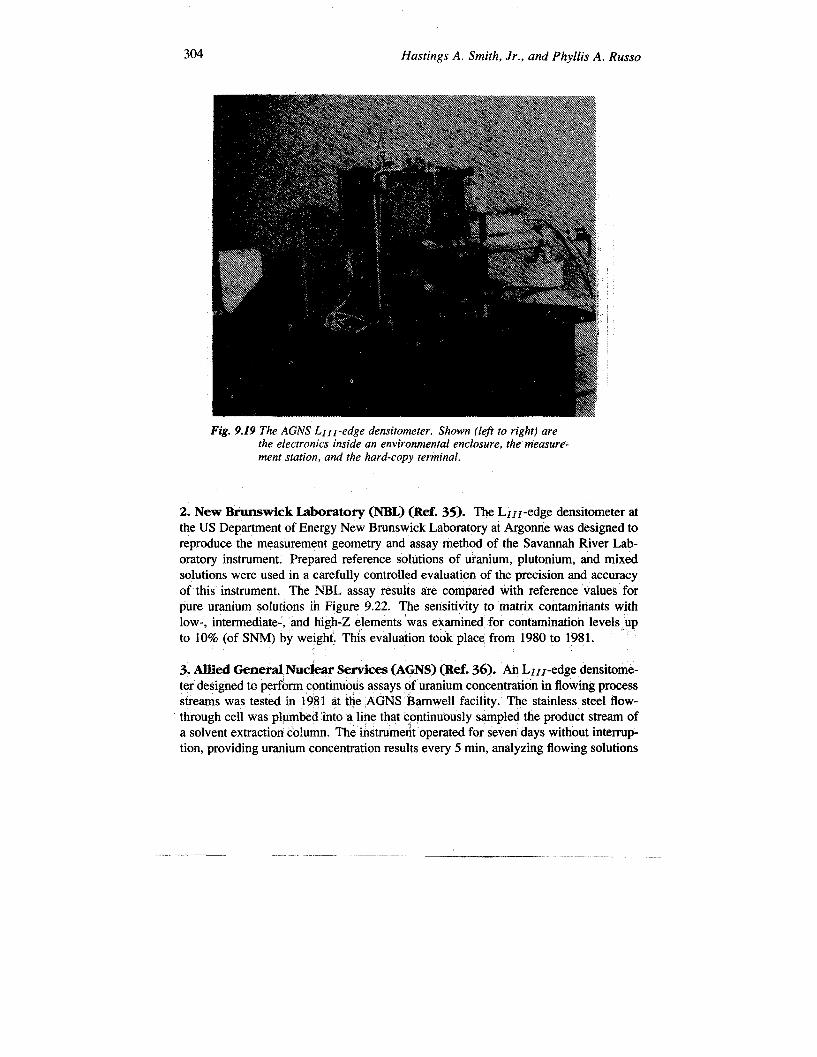
Given below are descriptions of several LIII-edge densitometers that have beentested and evaluated under actual or simulated in-plant environments. The first threeLrII-edge densitometers described were designed to be equivalent, mechanically andelectronically. Figure 9.19, a photograph of the AGNS instrument, represents allthree instruments; Figure 9.20 is a line drawing of the measurement head for all threeinstruments. Table 9-5 summarizes the performance data for the instruments.
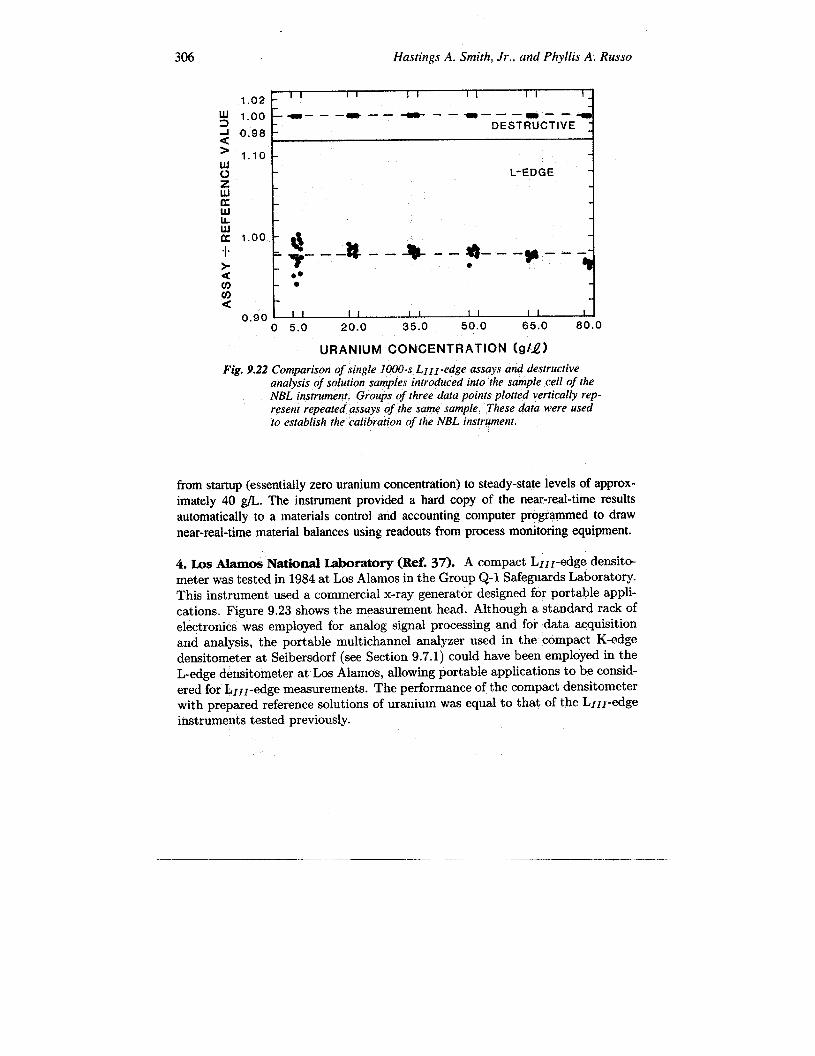
1. Savannah River Laboratory (SRL) (Refs. 12, 21, and 34). The LIIr-edge densitometer at the Savannah River Laboratory was tested in conjunction with asolution coprocessing demonstration facility. The stainless steel flow-through solutionsample cell (fitted with plastic winclows) was plumbed into the glove box that housedthe coprocessing setup, so that solution from various points ‘in the process could beintroduced into the cell for LIIz-edge assay of either uranium or plutonium or both.The instrument me~ured 15-mL static’ solutions in, the cell; ~fore each assay, theinstrument was flushed several times with the solution. The assay precision obtainedfor pure uranium or plutonium solutions are plotted versus concentration in Figure9.21. The instrument operakd at Savann& River from 1978 until 1980..,.
304 Hastings A. Smith, Jr., and Phyllis A. Russo
Fig. 9.19 The AGNS L1lI-edge densitometer. Shown (lefi to right) arethe electronics inside an environmental enclosure, the measure-ment station, and the hard-copy terminal.
2. New Brunswick Laboratory (NBL) (Ref. 35). The L1lr-edge densitometer atthe US Department of Energy New Brunswick Laboratory at Argonne was designed toreproduce the measurement geometry and assay method of the Savannah River Lab-oratory instrument. Prepared reference solutions of uranium, plutonium, and mixedsolutions were used in a carefully controlled evaluation of the precision and accuracyof this instrument. The NBL assay results ate compared with reference values forpure uranium solutions in Figure 9.22. The sensitivity to matrix contaminants withlow-, intermediate-, and high-Z elements was examined for contamination levels ,upto 10% (of SNM) by weight. This evaluation took place from 1980 to 1981.
3. AUied Gene@ Nuclezw Services (AGNS) (Ref. 36). An L~ll-edge densitome-ter designed to perform continuous assays ,ofuranium concentration in flowing processstreams was tested in 1981 at the AGNS Barnwell facility. The stainless steel flow-through cell was plumbed ‘intoa line that continuously sampled the product stream ofa solvent extraction column. The instrument operated for seven days without interrup-tion, providing uranium concentration results every 5 rein, analyzing flowing solutions
Densitometry 305
/- Si(Li) DETECTOR /-CAL16RAT10N FOIL
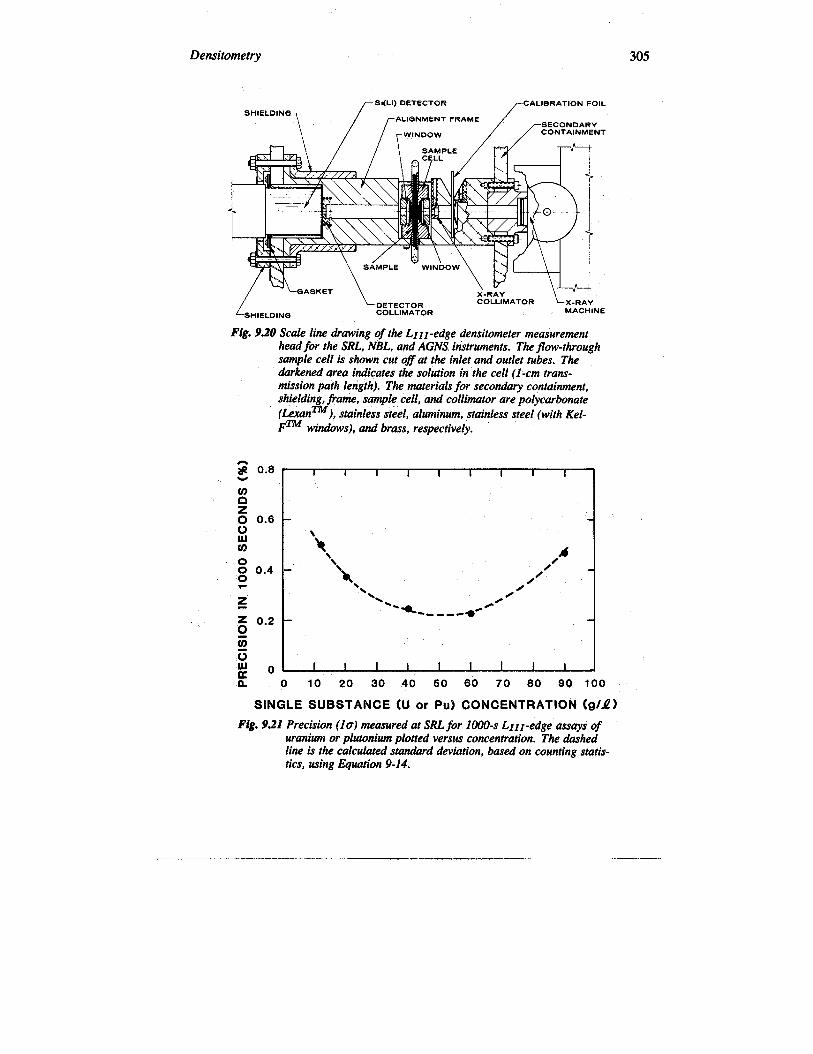
Fig. 9.20 Scale line drawing of the LIII-edge akwsitometer measurementhead for the SRL, NBL, ad AGNS instruments. The flow-throughsample cell is shown cut @at the inlet and outlet tubes. Theaiwkened area indicates the solution in the cell (l-cm trans-mission path length). The’materials for seconaluy containment,shielding, frame, sample cell, and collimator are polycarbonate
(LexanTM), stainless steel, aluminum, stainless steel (with Kel-Fm windows), and brass, respectively.
mnz0 0.60wa)o0 0.40
z 0.2g~
c)WoKn
I [ I I I 1 I I I I
o 10 20 30 4Q 50 60 70 60 90 100
SINGLE SUBSTANCE (U or Pu) CONCENTRATION (g/J?)
Fig. 9.21 Precision (10) measured at SRL for 1000-s LIII-edge assays ofuranium or plutonium plotted versus concentration. The dashedline is the calculated stanalwd deviation, based on counting statis-tics, using Equah”on 9-14.
306 Hastings A. Smith, Jr., und Phyllis A. Russo
zUJEwIAU.1WI
1.02 I I I I I I 1 I I I 1:
g 1.00 .w–––~——~–— w—— —m –--g
A o.9a DESTRUCTIVE
<
; 1.10
c) L-EDGE
‘Ii {“’”00 * @ * __ *-------0.
T———. —
> 0
< ●O(n ●
U)a
0.90 I 1 I 1 I I 1 I I 1 I
o 5.0 20.0 35.0 50.0 65.0 60.0
URANIUM CONCENTRATION (glJZ)
Fig. 9.22 Comparison of single 1000-s L1ll-edge assays and destructiveanalysis of solution samples introduced into the sample cell of theNBL instrument. Groups of three data points p[otted vertically rep-resent repeated assays of the same sample. These data were usedto establish the calibration of the NBL instrument.
from startup (essentially zero uranium concentration) to steady-state levels of approx-imately 40 ~. The instrument provided a hard copy of the near-real-time resultsautomaticallyy to a materials control and accounting computer programmed to drawnear-real-time material balances using readouts from process monitoring equipment.
4. m hos National bboratov (Ref. 37). A compact L~~I-edge demit~meter was tested in 1984 at Los Alamos in the Group Q-1 Safeguards Laboratory.Thk instrument used a commercial x-ray generator designed for portable appli-cations. Figure 9.23 shows the measurement head. Although a standard rack ofelectronics was employed for analog signal processing and for data acquisitionand analysis, the portable multichannel analyzer used in the compact K-edgedensitometer at Seibersdorf (see Section 9.7.1) could have been employed in theL-edge densitometer at Los Alamos, allowing portable applications to be consid-ered for LrIi-edge measurements. The performance of the compact densitometerwith prepared reference solutions of uranium was equal to that of the LIII-edgeinstruments tested previously.
.——

Densitometry
COMPACT X-RAY
b.
Fig. 9.23
GENERATOR
307
COLLIMATORS
II
I
DETECTOR
012345 EXIT PORTIONSAMPLE
COLLIMATORS
Scale (cm) ‘F ‘+AY ‘“~ CELL SLOT!. A-
COMPACTX-RAY GENERATOR
IX
Scale line drawings of the compact LI1l-edge densitometer measurementhead: (a) view @otn above in the horizontal plane of the x-ray transmissionpath; (b) side view. The solution thickness in the transmission path is I cm.

308 Hastings A. Smith, Jr., and Phyllis A. Russo
REFERENCES
1. T. R. Canada, J. L. Parker, and T, D. Reilly, “Total Plutonium and Uranium Deter-mination by Gamma-Ray Densitometry,” Transactions of the American NuclearSociety 22, 140 (1975).
2. T. R. Canada, D. G. Langner, and J. W. Tape, “Nuclear Safeguards Atmlications
3,
4.
5.
6.
7.
8.
9.
10.
11.
of Energy-DisWrsive Absorption-Edge ~nsitometry~ in ~uclear ~~feguardsAnalysis, E. A. Hakkila, Ed. (American Chemical Society, Washington, DC,1978), Series No. 79, p. %.
T. R. Canada, S. -T. Hsue, D. G. Langner, D, R. Martin, J. L. Parker, T. D. Reilly,and J. W. Tape, “Applications of the Absorption-Edge Densitometry Techniqueto Solutions and So1ids7 Nuc!ear Materials Management 6 (3), 702 (1977).
R. L. Bramblett, “Passive and Active Measurements of SNM in 55-GallonDrums: Nuclear Materials Management 4, 137 (1975).
H. A. Smith, Jr., T. Marks, S. S. Johnson, L, R. Cowder, J. K. Sprinkle, Jr., C.O. Shonrock, R. W. Slice, D. L. Garcia, K. W. MacMurdo, R. L. Pollard, L. B.Baker, P. Christie, and J. P. Clark, “Test and Evaluation of the In-Line PlutoniumSolution K-Absorption-Edge Densitometer at the Savannah River Planti Phase I,Off-Line Testing; Los Alarnos National Laboratory report LA-9124-MS (1982).
S. -T. Hsue to R. B. Walton, “Densitometry Design: LOS Alatnos documentQ-1-80-243 (May 1980).
L. A. Currie, “Limits for Quantitative Detection and Quantitative Determination:Analytical Chemistry 40,586 (1%8).
C. E. Crouthamel et al., “A Compilation of Gamma-Ray Spectra (NaI Detector),”in Applied Gamma-Ray Spectrometry, F. Adams and R. Dams, Eds. (PergamonPress, Braunschweig, Hungary, 1970).
T. W. Crane, “Detectability Limits and Precision for Shufflers,” Los AlamosNational Laboratory report LA-10158-MS (1984).
E. Storm and H. I. Israel, “Photon Cross Sections from 0.001 to 100 MeV forElements 1 through 10Q” Los Ahmos Scientific Laboratory report LA-3753(1967).
Handbook of Chemistry and Physics, 55th cd., R. C. Weast, Ed. (ChemicalRubber Company Press, Cleveland, Ohio, 1975).

Densitometry 309
12.
13.
14.
15.
16.
17.
18.
19.
20.
P. A. Russo, S. -T. Hsue, D. G. Langner, and J. K. Sprinkle, Jr., “NuclearSafeguards Applications of Energy-Dispersive Absorption-Edge Densitometry,”Nuclear Materials Management 9,730 (1981).
F. Brown, D. R. Terry, J. B. I-Iornsby, R. G. Monk, F. Morgan, J. Hernngton, P.T. Good, K. C. Steed, and V. M. Sinclair, “Application of Instrumental Methodsto the Determination of Nuclear Fuel Materials for Safeguards,” in SafeguardsTechniques, Proc. IAEA Karlsruhe Symp. (IAEA, Vienna, Austria, July 1970),Vol. II, p. 125.
D. R. Terry and A. P. Dixon, “A Portable Gamma Absorptiometer for Safe-guards Use in Nuclear Fuel Reprocessing Plants:’ Atomic Weapons ResearchEstablishment repon AWRE/44/88/28 COS28, Aldermastom England (1975).
J. E. Ayer and D. R. Schmitt, “A Gamma-Ray Absorptiometer for Nuclear FuelEvaluation,” Nuclear Technology 27,442 (1975).
T. Gozani, H. Weber, and Y. Segal, “A Gamma-Ray Transmission Gauge forDetermination of Heavy and Light Metal Loading of Fuel Elements,” NuclearMaterials Management 2 (3), 139 (1973).
T. Gozani, Active Nondestructive Assay of Nuclear Materials, Principles and Ap-~~ications, NUREG/CR-0602, (US Nuclear Regulatory Commission, WashingtonDC, 1981), p. 118.
G. Bardone, M. Aparo, and F. V. Frazzoli, “Dual-Energy ~-Ray Absorptiom-etry for the Assay of Mixed Special Nuclear Material in Solution,” in Proc.Second Annual Symposium on Safeguards and Nuclear Materials Management,Edinburgh, Scotland, March 26-28, 1980 (European Safeguards Research andDevelopment Association, Brussels, Belguim, 1980), p. 270.
M. Aparo, B. Mattia, F. V. Frazzoli, and P. Zeppa, “Dual-Energy X-Ray Ab-sorptiometer for Nondestructive Assay of Mixed Special Nuclear Material inSolution,” in Proc. Fifth Annual Symposium on Safeguards and Nuclear Mate-
rials Management, Versailles, France, April 19-21, 1983 (European SafeguardsResearch and Development Association, Brussels, Belgium, 1983), p. 271.
J. K. Sprinkle, Jr., H. R. Baxman, D. G. Langner, T. R. Canada, and T. E. Samp-son, “The In-Plant Evaluation of a Uranium NDA System,” in Proc. AmericanNuclear Society Topical Conference on Measurement Technology for Safeguardsand Materials Control, Kiawah Island, South Carolina, November 26-28, 1979(National Bureau of Standards, Washington, DC, 1980), p. 324.
310
21.
22,
23.
24.
25.
26.
27.
28.
Hastings A. Smith, Jr., and Phyllis A. Russo
T. R. Canada, J. L. Parker, and P. A. Russo, “Computer-Based In-Plant Nonde-structive Assay Instrumentation for the Measurement of Special Nuclear Mate-rials,” in Proc. American Nuclear Society Topical Conference on Computers inActivation Analysis in Gamma-Ray Spectroscopy, Mayaguez, Puerto Rico. April30-May 4, 1978 (US DOE Technical Information Center), p. 746.
H. H. Hogue and S. E. Smith, “Off-Line Nondestructive Analysis at a UraniumRecovery Facility; in Safeguards Technology: The Process-Safeguards Inter-face, Proc. American Nuclear Society-INMM Topical Conference, Hilton HeadIsland, South Carolina, November 28-December 2, 1983 (Conf. 831106, 1984).
H. H. Hogue and S. E. Smith, “Nondestmctive Analysis at the Oak Ridge Y-12Plant,” Oak Ridge Y-12 Plant report Y-2297 (1984).
K. J. Hofstetter, G. A. Huff, R. Gunnink, J. E. Evans, and A. L. Prindle, “On-Line Measurement of Total and Isotopic Plutonium Concentrations by Gamma-Ray Spectromet~,” in Analytical Chemistry in Nuclear Fuel Reprocessing, W. S.Lyon, Ed. (Science Press, Princeton, New Jersey, 1978), p. 266, and Universityof California report UCRL-52220 (1977).
K. J. Hofstetter and G. A. Huff, “On-Line Isotopic Concentration Monitor;Allied General Nuclear Services report AGNS-1040-2.3-52 (1978).
L. R. Cowder, S. -T. Hsue, S. S. Johnson, J. L. Parker, P. A. Russo, J. K. Sprinkle,Jr., Y. Asakura, T. Fukuda, and I. Kondo, “An Instrument for the Measurementof Pu Concentration and Isotopics of Product Solutions at Tokai-Mura,” in Proc.Second Annual Symposium on Safeguards and Nuclear Materials Management,Edinburgh, Scotland, March 26-28, 1980 (European Safeguards Research andDevelopment Association, Brussels, Belgium, 1980), p. 119.
P. A. Russo, S. -T. Hsue, J. K. Sprinkle, Jr., S. S. Johnson, Y. Asakura, 1.Kondo,J. Masui, and K. Shoji, “In-Plant Measurements of Gamma-Ray Transmissionsfor Precise K-Edge and Passive Assay of Plutonium Concentration and IsotopicFractions in Product Solutions: Los Alamos National Laboratory report LA-9440-MS (1982).
Y. Asakura, I. Kondo, J. Masui, K. Shoji, P. A. Russo, S. -T. Hsue, J. K.Sprinkle, Jr., and S. S. Johnson, “In-Plant Measurements of Gamma-Ray Trans-missions for Precise K-Edge and Passive Assay of Plutonium Concentration andIsotopic Abundances in Product Solutions at the Tokai Reprocessing Plant: Nu-clear Materials Management 11, 221 (1982).
Densitometry 311
29.
30.
31.
32.
33.
34.
H. A. Smith, Jr., T. Marks, L. R. Cowder, C. O. Shonrock, S. S. Johnson, R.W. Slice, J. K. Sprinkle, Jr., K. W. MacMurdo, R. L. Pollard, and L. B. Baker,“Development of In-Line Plutonium Solution NDA Instrumentation at the Sa-vannah River Plant,” in Proc. Second Annual Symposium on Safeguards andNuclear Materials Management, Edinburgh, Scotland, March 26-28, 1980 (Eu-ropean Safeguards Research and Development Association, Brussels, Belgium,1980), p. 123.
L. R. Cowder, S. F. Klosterbuer, R. H. Augustson, A. Esmailpour, R. Hawkins,and E. Kuhn, “A Compact K-Edge Densitometer,” in Proc. Sixth Annual Sym-
posium on Safeguards and Nuclear Materials Management, Venice, Italy, May14-18, 1984 (European Safeguards Research and Development Association, Brus-sels, Belgium, 1984), p. 261.
H. Eberle, P. Matussek, H. Ottmar, I. MicheM3per, M. R. Iyer, and P. P.Chakraborty, “Nondestructive Elemental and Isotopic Assay of Plutonium andUranium in Nuclear Materials,” Nuclear Safeguards Technology 1978 (Intern-ationalAtomic Energy Agency, Vienna, Austria, 1979), Vol. II, p. 27.
H. Eberle, P. Matussek, I. Michel-Piper, and H. Ottmar, “Assay of Uraniumand Plutonium in Solution by K-Edge Photon Absorptiometry Using a Contin-uous X-Ray Beam,” in Proc. Second Annual Symposium on Safeguards andNuclear Materials Management, Edinburgh, Scotland, March 26-28, 1980 (Eu-ropean Safeguards Research and Development Association, Brussels, Belgium,1980), p. 372.
H. Eberle, P. Matussek, I. Michel-Piper, and H. Ottmar, “Operational Experiencewith K-Edge Photon Absorptiometry for Reprocessing Feed and Product SolutionAnalysis,” in Proc. Third Annual Symposium on Safeguards and Nuclear Ma-terials Management, Karlsruhe, Fed. Rep. Germany, May 6-8, 1981 (EuropeanSafeguards Research and Development Association, Brussels, Belgium, 1981),p. 109.
P. A. Russo, T. R. Canada, D. G. Lan~er, J. W. Tape, S. -T. Hsue, L. R.Cowder, W. C. Moseley, L. W. Reynolds, and M. C. Thompson, “An X-RayLlr@dge Densitometer for Assay of Mixed SNM Solutions/’ in Proc. First
Annual Symposium on Safeguards and Nuclear Materials Management, Brussels,Belgium, April 25-27, 1979 (European Safeguards Research and DevelopmentAssociation, Brussels, Belgium, 1979), p. 235.

312 Hastings A. Smith, Jr., and Phyllis A. Russo
35. W. J. McGonnagle, M. K. Holland, C. S. Reynolds, N. M. Trahey, and A.C. Zook, “Evaluation and Calibration of a Los Alamos National LaboratoryLIII-Edge Densitometer,” US Department of Energy New Bnmswick Laboratoryreport NBL-307 (1983).
36. P. A. Russo, T. Marks, M. M. Stephens, A, L. Baker, and D. D. Cobb, “Auto-mated On-Line L-Edge Measurement of SNM Concentration for Near-Real-TimeAccounting,” Los Alamos National Laboratory report LA-9480-MS (1982).
37. M. L. Brooks, P. A. Russo, and J. K. Sprinkle, Jr., “A Compact L-Edge Den-sitometer for Uranium Concentration Assay;’ Los Alamos National Laboratoryreport LA-10306-MS (1985).


![Computerized Densitometry and Color Coding of … · Computerized Densitometry and Color Coding of ['"C] Deoxyglucose Autoradiographs Charles Goochee, BS, Wayne Rasband, MS, and Louis](https://img.pdfslide.us/doc/110x75/5b2b5e317f8b9af73e8b745b/computerized-densitometry-and-color-coding-of-computerized-densitometry-and.jpg)