Embed Size (px)
Citation preview

CREATING VALUE FOR OUR GUESTS AND SHAREHOLDERS
2006 Annual Report
Denny’s Corporation
203 East Main Street
Spartanburg, SC 29319
Den
ny
’s Co
rpo
ration
200
6 Annual Report

With sales at Company and franchised restaurants totaling over $2.4 billion,
Denny’s is America’s largest full-service family restaurant chain
providing a variety of food and beverage choices for guests of all ages. Our restaurants offer a casual
dining atmosphere and moderately-priced, good quality meals served 24 hours a day. Denny’s is
recognized for its famous Grand Slam® breakfast, award-winning D-Zone® kid’s menu, senior selections
and late-night fare. Lunch and dinner offerings are increasing in popularity with a variety of cravable
burgers and sandwiches as well as Denny’s American Dinner ClassicsTM, including Grilled Chicken Alfredo.
As of December 27, 2006, Denny’s had 1,545 Company-owned, franchised and licensed restaurants
located in the United States, Canada, Costa Rica, Guam, Mexico, New Zealand and Puerto Rico.
NASDAQ: DENN
Denny’s Corporate Information
de
sig
ned
by
curr
an &
co
nno
rs, i
nc. /
ww
w.c
urra
n-c
onn
ors
.co
m
CORPORATE OFFICERS
Nelson J. Marchioli(1,2,3)
Chief Executive Officer and President
Rhonda J. Parish Executive Vice President (1,2,3)
Chief Legal Offi cer (1,2) and Secretary (1,2)
F. Mark Wolfinger(1,2,3)
Executive Vice President, Growth Initiatives and Chief Financial Officer
Mark Chmiel(1,2,3)
Senior Vice President, ConceptInnovation
Janis S. Emplit(1,2,3)
Senior Vice President, Company Operations
Margaret L. Jenkins(1,2,3)
Senior Vice President, Marketing and Chief Marketing Officer
Louis M. Laguardia(1,2,3)
Senior Vice President,Human Resources and Diversity
Samuel M. Wilensky(1,2,3)
Senior Vice President and Acting Head of Operations
Steve Dunn(2)
Vice President, Development
Timothy E. FlemmingVice President (1,2) , General Counsel (2) andAssistant General Counsel (1)
Peter D. GibbonsVice President, Product Development (2)
Jay C. Gilmore(1,2)
Vice President and Controller
Michael J. Jank(1,2)
Vice President, Risk Management
S. Alex Lewis(1,2)
Vice President, Investor Relations and Treasurer
Enrique Mayor-Mora(2)
Vice President, Planning and Analysis
Susan L. Mirdamadi(2)
Vice President, Information Technologyand Chief Information Officer
Ross B. Nell(1,2)
Vice President, Tax
John K. Sanfacon(2)
Vice President, Strategic Marketing
Mark C. Smith(2)
Vice President, Procurement and Distribution
Thomas M. Starnes(2)
Vice President, Food Safety, Quality Assurance and Brand Standards
David J. Kahre(2)
Divisional Vice President of Company Operations—Division 1
Erick Martinez(2)
Divisional Vice President of Company Operations—Division 2
J. Scott Melton(2)
Assistant General Counsel (1,2) , Corporate Governance Officer (1)
and Assistant Secretary (1,2)
(1) Officer, Denny’s Corporation(2) Officer, Denny’s, Inc.(3) Executive Officer, Denny’s Corporation
DIRECTORS OF DENNY’S CORPORATION
Debra Smithart-OglesbyChairPresident, O/S Partners
Vera K. Farris President Emerita and Distinguished Professor of The Richard Stockton College of New Jersey, Professor, University of Pennsylvania
Brenda J. LauderbackRetired; Former President of Wholesale and RetailGroup of Nine West Group, Inc.
Nelson J. MarchioliChief Executive Officer and President,Denny’s Corporation
Robert E. MarksPresident,Marks Ventures, LLC
Michael MontelongoSenior Vice President, Strategic Marketing for Sodexho, Inc.
Henry J. NasellaFounding Partner,LNK Partners
Donald R. ShepherdRetired; Former Chairman, Loomis, Sayles & Company, L.P.
SHAREHOLDER INFORMATION
Corporate Office: Denny’s Corporation 203 East Main StreetSpartanburg, SC 29319(864) 597-8000
Independent Auditors:KPMG LLPGreenville, SC
Transfer Agent for Common Stock:For information regarding change of address or other matters concerning your shareholder account, please contact the transfer agent directly at:
Continental Stock Transfer & Trust Co.17 Battery PlaceNew York, NY 10004(212) 509-4000(800) 509-5586
Bond Trustees:10% Senior Notes due 2012U.S. Bank National AssociationAttn: Corporate Trust Department60 Livingston AvenueSt. Paul, MN 55107(800) 934-6802
Stock Listing Information:Denny’s Corporation common stock is listed on the NASDAQ Capital Market® under the symbol DENN.
For Financial Information:Call (877) 784-7167, or write to:Alex Lewis, Vice President of Investor Relations and TreasurerDenny’s Corporation203 East Main Street, P-11-6Spartanburg, SC 29319
Other investor information such as news releases, links to SEC filings and stock quotes may also be accessed from Denny’s corporate web site at: www.dennys.com
Annual Meeting:Wednesday, May 23, 2007Spartanburg, SC
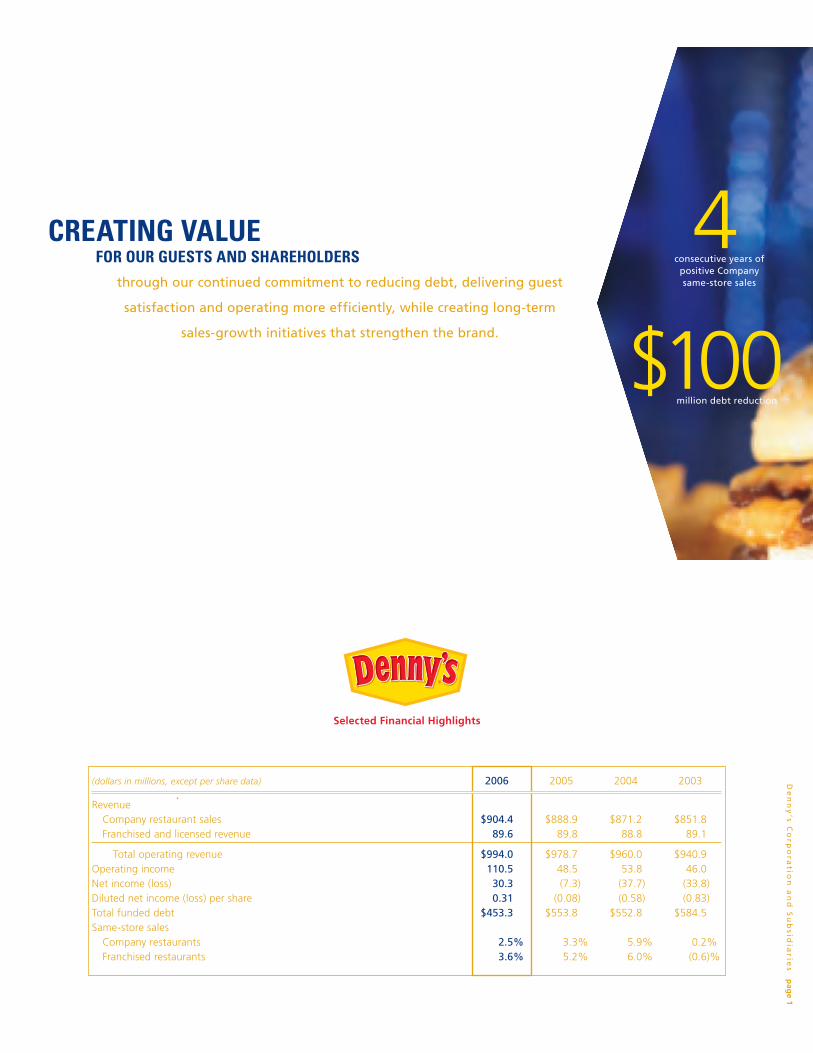
through our continued commitment to reducing debt, delivering guest
satisfaction and operating more efficiently, while creating long-term
sales-growth initiatives that strengthen the brand.
CREATING VALUE FOR OUR GUESTS AND SHAREHOLDERS
$100
4consecutive years of
positive Company same-store sales
million debt reduction
Selected Financial Highlights
(dollars in millions, except per share data) 2006 2005 2004 2003
Revenue Company restaurant sales $ 904.4 $ 888.9 $ 871.2 $ 851.8 Franchised and licensed revenue 89.6 89.8 88.8 89.1
Total operating revenue $ 994.0 $ 978.7 $ 960.0 $ 940.9 Operating income 110.5 48.5 53.8 46.0 Net income (loss) 30.3 (7.3) (37.7) (33.8)Diluted net income (loss) per share 0.31 (0.08) (0.58) (0.83)Total funded debt $ 453.3 $ 553.8 $ 552.8 $ 584.5 Same-store sales Company restaurants 2.5% 3.3% 5.9% 0.2% Franchised restaurants 3.6% 5.2% 6.0% (0.6)%
De
nn
y’s C
orp
ora
tion
an
d S
ub
sidia
ries p
age 1

Over the last few years Denny’s has driven same-store sales growth, increased restaurant operating margins while adding
labor and improving food quality, and invested much-needed capital into its facilities. Through these achievements we
have been able to gradually improve our capital structure and significantly lower our interest costs resulting in Denny’s
strongest financial position in more than 15 years.
Our continued operational and financial progress is attributable to the collective efforts of our employees and our
franchisees. Together, they focused on doing their best to attract, delight and retain our guests. In doing so, they
demonstrated that we have the team, the resources and the resolve to create long-term value for our shareholders.
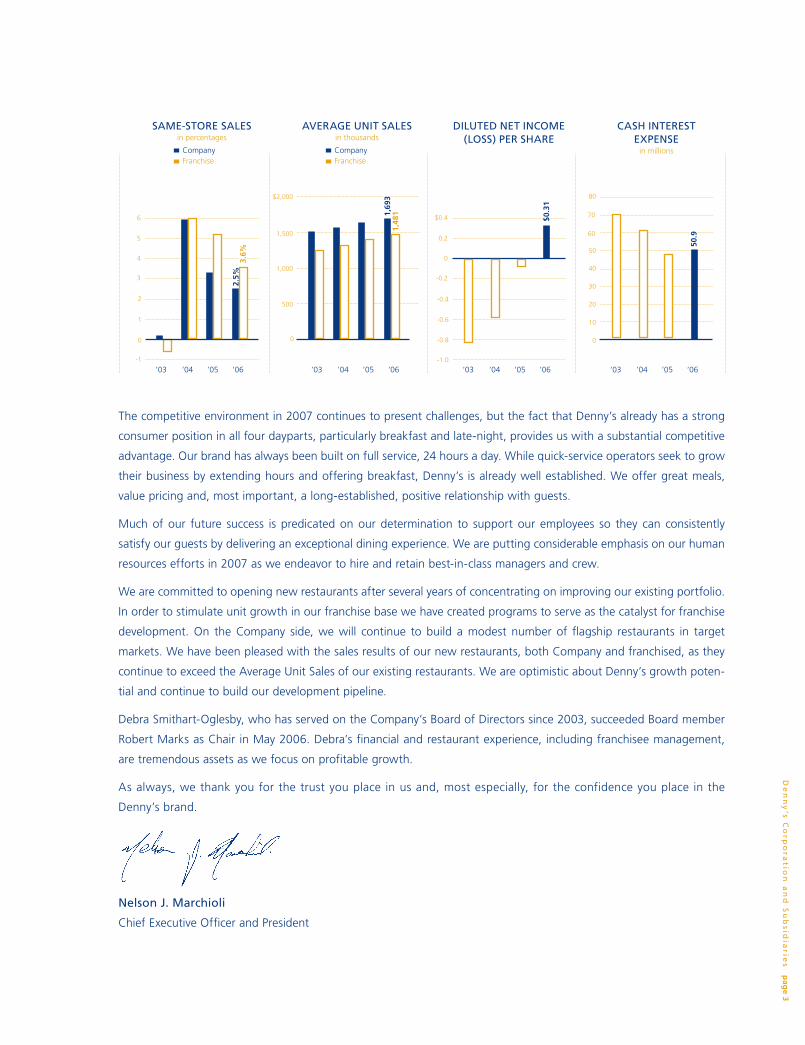
Same-store sales increased 3.2% across the Denny’s system in 2006 and the fourth quarter marked the 13th consecu-
tive quarter of positive same-store sales growth for the system. For the year, Company unit same-store sales grew
2.5% while franchisee sales increased 3.6%. Growth in same-store sales was somewhat offset by the closure of 26
Company-owned and 27 franchised restaurants last year. The Company restaurant closures resulted from a thorough
analysis which determined that either these restaurants did not meet our criteria for continued investment or through
a closure we were able to unlock real estate value that exceeded the business value of those particular locations.
We will continue to be diligent in our efforts to enhance our asset returns and make sound investment decisions
for our capital.
Overall, our sales results in 2006 were stronger than many of our competitors but were still challenged in our view.
The environment was difficult due to pressures on our consumers from higher gasoline prices and interest rates. We
responded to softening sales trends in the industry with promotions that clearly reinforced Denny’s value proposition.
Through a combination of new product offerings, a new advertising campaign and targeted discounting, we were
able to improve guest traffic without sacrificing average guest check.
Net income for the year was $30.3 million, or $0.31 per diluted common share, an increase of $37.7 million compared
with prior-year net loss of $7.3 million, or $0.08 per common share. The significant increase in net income reflects
gains on the sale of real estate assets during the year. Excluding these gains, as well as expenses related to asset sales,
restaurant closures and refinancing activities, our profitability increased due to higher sales, improved operating margins
and lower interest costs.
We made the decision early in 2006 to sell our real estate assets underlying franchisee-operated restaurants as we
believed these assets could create more value by using the sale proceeds to reduce our debt. Through the application
of asset sale proceeds and operating cash flow, we reduced our outstanding indebtedness by more than $100 million
in 2006. The resulting improvement in our balance sheet allowed us to refinance our credit facility with considerably
improved terms. The debt reduction combined with the improved borrowing rates should result in significant interest
savings as we move ahead.
We will continue to focus on growing guest traffic and average guest check, while controlling costs. New menu items
such as our Super Slam breakfasts and our American Dinner Classics continue to communicate and reinforce two of
Denny’s strongest consumer attributes—variety and value. We will continue to develop exciting new offerings to make
sure that Denny’s is a competitive dining choice.
20
06
An
nu
al R
ep
or
t pag
e 2
To our valued shareholders
De
nn
y’s C
orp
ora
tion
an
d S
ub
sidia
ries p
age 3
The competitive environment in 2007 continues to present challenges, but the fact that Denny’s already has a strong
consumer position in all four dayparts, particularly breakfast and late-night, provides us with a substantial competitive
advantage. Our brand has always been built on full service, 24 hours a day. While quick-service operators seek to grow
their business by extending hours and offering breakfast, Denny’s is already well established. We offer great meals,
value pricing and, most important, a long-established, positive relationship with guests.
Much of our future success is predicated on our determination to support our employees so they can consistently
satisfy our guests by delivering an exceptional dining experience. We are putting considerable emphasis on our human
resources efforts in 2007 as we endeavor to hire and retain best-in-class managers and crew.
We are committed to opening new restaurants after several years of concentrating on improving our existing portfolio.
In order to stimulate unit growth in our franchise base we have created programs to serve as the catalyst for franchise
development. On the Company side, we will continue to build a modest number of flagship restaurants in target
markets. We have been pleased with the sales results of our new restaurants, both Company and franchised, as they
continue to exceed the Average Unit Sales of our existing restaurants. We are optimistic about Denny’s growth poten-
tial and continue to build our development pipeline.
Debra Smithart-Oglesby, who has served on the Company’s Board of Directors since 2003, succeeded Board member
Robert Marks as Chair in May 2006. Debra’s financial and restaurant experience, including franchisee management,
are tremendous assets as we focus on profitable growth.
As always, we thank you for the trust you place in us and, most especially, for the confidence you place in the
Denny’s brand.
Nelson J. Marchioli
Chief Executive Officer and President
’03 ’04 ’05 ’06
2
3
4
5
6
2.5%
3.6%
SAME-STORE SALESin percentages
Company Franchise
1
0
-1
’03 ’04 ’05 ’06
500
1,000
1,500
$2,000
1,69
31,
481
0
Company Franchise
AVERAGE UNIT SALESin thousands
’03 ’04 ’05 ’06
50
60
70
80
CASH INTEREST EXPENSE
in millions
40
30
20
10
0
50.9
’03 ’04 ’05 ’06
-0.4
-0.2
0
0.2
DILUTED NET INCOME (LOSS) PER SHARE
-0.6
-0.8
-1.0
$0.4 $0.3
1
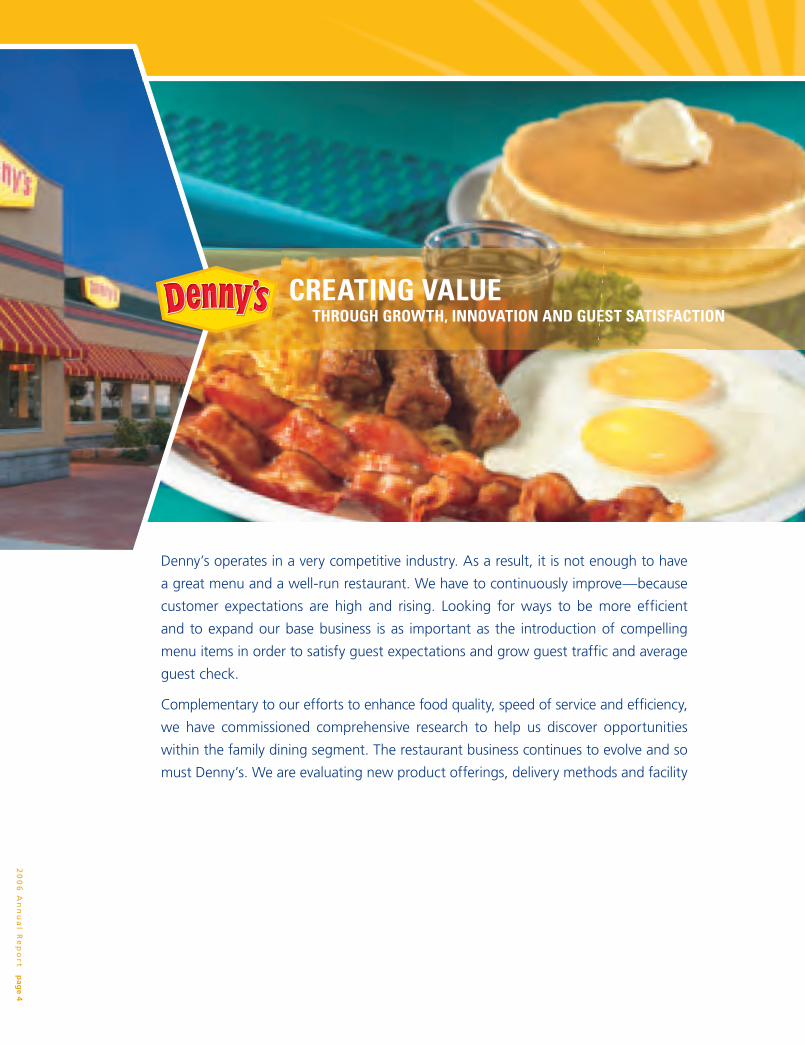
Denny’s operates in a very competitive industry. As a result, it is not enough to have
a great menu and a well-run restaurant. We have to continuously improve—because
customer expectations are high and rising. Looking for ways to be more efficient
and to expand our base business is as important as the introduction of compelling
menu items in order to satisfy guest expectations and grow guest traffic and average
guest check.
Complementary to our efforts to enhance food quality, speed of service and efficiency,
we have commissioned comprehensive research to help us discover opportunities
within the family dining segment. The restaurant business continues to evolve and so
must Denny’s. We are evaluating new product offerings, delivery methods and facility 2
00
6 A
nn
ua
l Re
po
rt p
age 4
CREATING VALUETHROUGH GROWTH, INNOVATION AND GUEST SATISFACTION
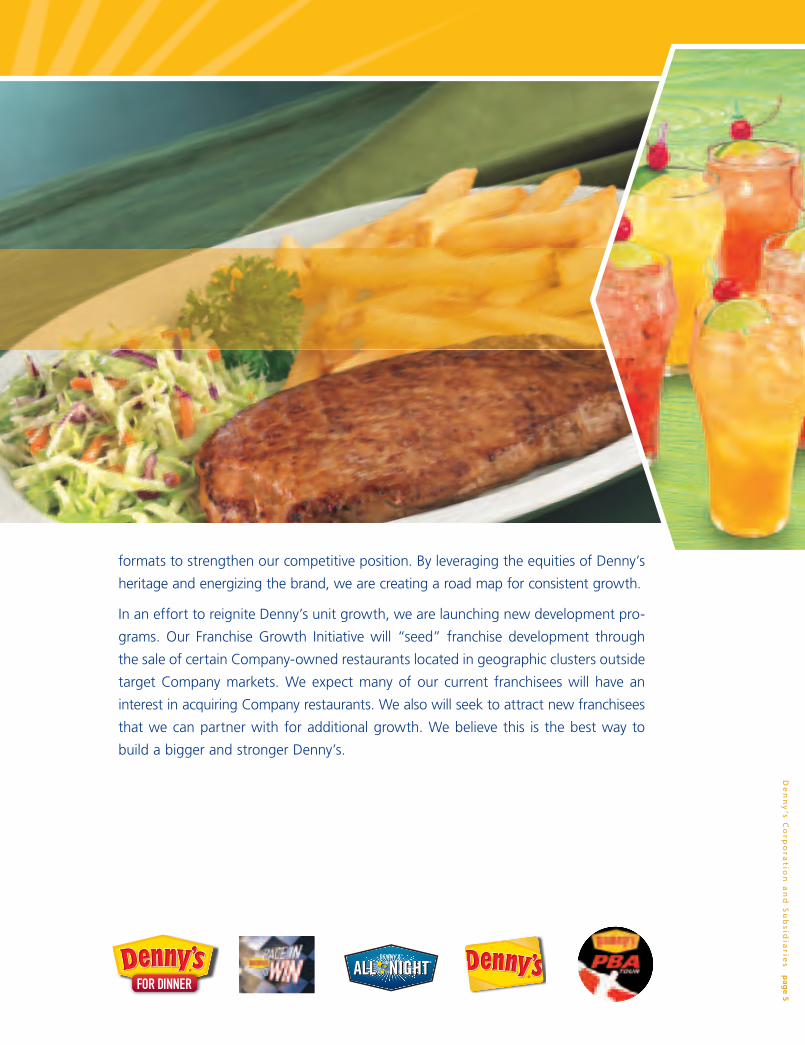
formats to strengthen our competitive position. By leveraging the equities of Denny’s
heritage and energizing the brand, we are creating a road map for consistent growth.
In an effort to reignite Denny’s unit growth, we are launching new development pro-
grams. Our Franchise Growth Initiative will “seed” franchise development through
the sale of certain Company-owned restaurants located in geographic clusters outside
target Company markets. We expect many of our current franchisees will have an
interest in acquiring Company restaurants. We also will seek to attract new franchisees
that we can partner with for additional growth. We believe this is the best way to
build a bigger and stronger Denny’s.
De
nn
y’s C
orp
ora
tion
an
d S
ub
sidia
ries p
age 5

Our Company will always strive to be a responsible corporate citizen on matters that
are vital to our business and of public concern. We believe in doing the right thing,
while balancing the interests of multiple stakeholders—including our guests, employ-
ees, communities and investors.
In 2006, we enacted an aggressive plan to eliminate trans fat from our menu. We
successfully tested and completed the rollout of a non-trans-fat alternative fry short-
ening in early 2007. Additionally, we expect to introduce trans fat free margarine
products by midyear. We are continually looking at ways to improve the taste and
flavor of our menu offerings and giving guests choices to meet their needs.
While everything we do is for the guest, it all begins with our employees. We want
to make Denny’s an employer of choice and create opportunities for people to grow
in a satisfying work environment. In 2006, we introduced a language learning program
called Sed de Saber (Thirst for Knowledge) in several markets. The program has helped
many of our Spanish-dominant employees improve their English proficiency—reducing
workplace language barriers and positively impacting job performance. We will be
making the program available to interested employees across the country over the
next two years.
20
06
An
nu
al R
ep
or
t pag
e 6
CREATING VALUEBY CONSISTENTLY DEMONSTRATING CORPORATE RESPONSIBILITY
Eliminating trans fat
English as a Second
Language program
Leveraging diversity
Caring for our
communities and
the environment

De
nn
y’s C
orp
ora
tion
an
d S
ub
sidia
ries p
age 7
Denny’s employs tens of thousands of people from diverse backgrounds and
diversity is a source of great strength for our brand. Evidence that we are finding
the right approaches to maximize that diversity can be seen in the Company’s most
recent recognition in the Black Enterprise 2006 list as one of the “40 Best Companies
for Diversity.”
Beyond our role as taxpayer, employer and purchaser, we examine the impact Denny’s
is having in the communities we serve. To help protect the environment, we contract
with qualified waste management firms to recycle paper and food waste at our restau-
rants and manage a comprehensive lighting efficiency program.
We are especially proud of the active role that our employees play in making their
communities stronger and better places to live and work. For the third year, we
recognized outstanding employee volunteers who are unselfishly giving of their time
and resources in unique, meaningful ways. Corporately, we partnered with The
Salvation Army, United Way and National Urban League during the year to positively
impact the lives of children and families. Our first effort for The Salvation Army’s
2006 Angel Tree program collected over 268,000 gifts of clothing and toys, valued at
more than $5.3 million.

CREATING VALUETHROUGH AN UNWAVERING COMMITMENT TO FOOD SAFETY AND QUALITY
20
06
An
nu
al R
ep
or
t pag
e 6 2
00
6 A
nn
ua
l Re
po
rt p
age 8
Food safety remains a central part of Denny’s operating philosophy and we commit
the resources to make sure we do it right. We know that Denny’s has one of the
most aggressive and effective programs in place to ensure the safety of the food
served in our restaurants. We also recognize that this is a critical area that requires
constant vigilance. The national attention placed on produce safety over the past year
has underscored this fact. We are active participants in major food safety councils,
including the National Restaurant Association’s Produce Working Group. We also
benchmark with other companies to make sure we employ the latest food safety
practices and innovations.

[THIS PAGE INTENTIONALLY LEFT BLANK]
UNITED STATESSECURITIES AND EXCHANGE COMMISSION
Washington, D.C. 20549
Form 10-KANNUAL REPORT PURSUANT TO SECTION 13 OR 15(d) OF THE
SECURITIES EXCHANGE ACT OF 1934For the Fiscal Year Ended December 27, 2006
Commission file number 0-18051
DENNY’S CORPORATION(Exact name of registrant as specified in its charter)
Delaware 13-3487402(State or other jurisdiction of
incorporation or organization)(I.R.S. employer
identification number)
203 East Main StreetSpartanburg, South Carolina 29319-9966
(Address of principal executive offices)(Zip Code)
(864) 597-8000(Registrant’s telephone number, including area code)
Securities registered pursuant to Section 12(b) of the Act:Title of each class Name of each exchange on which registered
$.01 Par Value, Common Stock The Nasdaq Stock MarketSecurities registered pursuant to Section 12(g) of the Act: None
Indicate by check mark if the registrant is a well-known seasoned issuer, as defined in Rule 405 of the SecuritiesAct. Yes ‘ No È
Indicate by check mark if the registrant is not required to file reports pursuant to Section 13 or Section 15(d) of theAct. Yes ‘ No È
Indicate by check mark whether the registrant (1) has filed all reports required to be filed by Section 13 or 15(d) of the SecuritiesExchange Act of 1934 during the preceding 12 months (or for such shorter period that the registrant was required to file such reports),and (2) has been subject to such filing requirements for the past 90 days. Yes È No ‘
Indicate by check mark if disclosure of delinquent filers pursuant to Item 405 of Regulation S-K is not contained herein, and willnot be contained, to the best of the registrant’s knowledge, in definitive proxy or information statements incorporated by reference inPart III of this Form 10-K or any amendment to this Form 10-K. ‘
Indicate by check mark whether the registrant is a large accelerated filer, an accelerated filer, or a non-accelerated filer. Seedefinition of “accelerated filer and large accelerated filer” in Rule 12b-2 of the Exchange Act. (Check one):
Large accelerated filer ‘ Accelerated filer È Non-accelerated filer ‘
Indicate by check mark whether the registrant is a shell company (as defined in Rule 12b-2 of the ExchangeAct). Yes ‘ No È
The aggregate market value of the voting common stock held by non-affiliates of the registrant was approximately $324.7 millionas of June 28, 2006 the last business day of the registrant’s most recently completed second fiscal quarter, based upon the closing salesprice of registrant’s common stock on that date of $3.55 per share and, for purposes of this computation only, the assumption that allof the registrant’s directors, executive officers and beneficial owners of 10% or more of the registrant’s common stock are affiliates.
As of March 1, 2007, 93,522,470 shares of the registrant’s common stock, $.01 par value per share, were outstanding.Documents incorporated by reference:Portions of the registrant’s definitive Proxy Statement for the 2007 Annual Meeting of Stockholders are incorporated by
reference into Part III of this Form 10-K.
TABLE OF CONTENTS
Page
PART I
Item 1. Business . . . . . . . . . . . . . . . . . . . . . . . . . . . . . . . . . . . . . . . . . . . . . . . . . . . . . . . . . . . . . . . . . . 1
Item 1A. Risk Factors . . . . . . . . . . . . . . . . . . . . . . . . . . . . . . . . . . . . . . . . . . . . . . . . . . . . . . . . . . . . . . . 7
Item 1B. Unresolved Staff Comments . . . . . . . . . . . . . . . . . . . . . . . . . . . . . . . . . . . . . . . . . . . . . . . . . . . 12
Item 2. Properties . . . . . . . . . . . . . . . . . . . . . . . . . . . . . . . . . . . . . . . . . . . . . . . . . . . . . . . . . . . . . . . . . 13
Item 3. Legal Proceedings . . . . . . . . . . . . . . . . . . . . . . . . . . . . . . . . . . . . . . . . . . . . . . . . . . . . . . . . . . . 14
Item 4. Submission of Matters to a Vote of Security Holders . . . . . . . . . . . . . . . . . . . . . . . . . . . . . . . 14
PART II
Item 5. Market for Registrant’s Common Equity, Related Stockholder Matters and Issuer Purchasesof Equity Securities . . . . . . . . . . . . . . . . . . . . . . . . . . . . . . . . . . . . . . . . . . . . . . . . . . . . . . . 15
Item 6. Selected Financial Data . . . . . . . . . . . . . . . . . . . . . . . . . . . . . . . . . . . . . . . . . . . . . . . . . . . . . . 16
Item 7. Management’s Discussion and Analysis of Financial Condition and Results ofOperations . . . . . . . . . . . . . . . . . . . . . . . . . . . . . . . . . . . . . . . . . . . . . . . . . . . . . . . . . . . . . . . 18
Item 7A. Quantitative and Qualitative Disclosures About Market Risk . . . . . . . . . . . . . . . . . . . . . . . . . 33
Item 8. Financial Statements and Supplementary Data . . . . . . . . . . . . . . . . . . . . . . . . . . . . . . . . . . . . 34
Item 9. Changes in and Disagreements with Accountants on Accounting and FinancialDisclosure . . . . . . . . . . . . . . . . . . . . . . . . . . . . . . . . . . . . . . . . . . . . . . . . . . . . . . . . . . . . . . . 34
Item 9A. Controls and Procedures . . . . . . . . . . . . . . . . . . . . . . . . . . . . . . . . . . . . . . . . . . . . . . . . . . . . . . 35
Item 9B. Other Information . . . . . . . . . . . . . . . . . . . . . . . . . . . . . . . . . . . . . . . . . . . . . . . . . . . . . . . . . . . 37
PART III
Item 10. Directors, Executive Officers and Corporate Governance . . . . . . . . . . . . . . . . . . . . . . . . . . . . 37
Item 11. Executive Compensation . . . . . . . . . . . . . . . . . . . . . . . . . . . . . . . . . . . . . . . . . . . . . . . . . . . . . 37
Item 12. Security Ownership of Certain Beneficial Owners and Management and RelatedStockholder Matters . . . . . . . . . . . . . . . . . . . . . . . . . . . . . . . . . . . . . . . . . . . . . . . . . . . . . . . 37
Item 13. Certain Relationships and Related Transactions, and Director Independence . . . . . . . . . . . . . 37
Item 14. Principal Accounting Fees and Services . . . . . . . . . . . . . . . . . . . . . . . . . . . . . . . . . . . . . . . . . 37
PART IV
Item 15. Exhibits and Financial Statement Schedules . . . . . . . . . . . . . . . . . . . . . . . . . . . . . . . . . . . . . . 38
Index to Consolidated Financial Statements . . . . . . . . . . . . . . . . . . . . . . . . . . . . . . . . . . . . . . . . . . . . . . . . F-1
Signatures
FORWARD-LOOKING STATEMENTS
The forward-looking statements included in the “Business,” “Risk Factors,” “Legal Proceedings,”“Management’s Discussion and Analysis of Financial Condition and Results of Operations,” and “Quantitativeand Qualitative Disclosures About Market Risk” sections and elsewhere herein, which reflect our best judgmentbased on factors currently known, involve risks and uncertainties. Words such as “expects,” “anticipates,”“believes,” “intends,” “plans,” “hopes,” and variations of such words and similar expressions are intended toidentify such forward-looking statements. Except as may be required by law, we expressly disclaim anyobligation to update these forward-looking statements to reflect events or circumstances after the date of thisForm 10-K or to reflect the occurrence of unanticipated events. Actual results could differ materially from thoseanticipated in these forward-looking statements as a result of a number of factors including, but not limited to,the factors discussed in such sections and, in particular, those set forth in the cautionary statements contained in“Risk Factors.” The forward-looking information we have provided in this Form 10-K pursuant to the safe harborestablished under the Private Securities Litigation Reform Act of 1995 should be evaluated in the context ofthese factors.

[THIS PAGE INTENTIONALLY LEFT BLANK]
PART I
Item 1. Business
Description of Business
Denny’s Corporation, or Denny’s, is one of America’s largest family-style restaurant chains. Denny’s,through its wholly owned subsidiaries, Denny’s Holdings, Inc. and Denny’s, Inc., owns and operates the Denny’srestaurant brand. At December 27, 2006, the Denny’s brand consisted of 1,545 restaurants, 521 of which arecompany-owned and operated and 1,024 of which are franchised/licensed restaurants. These Denny’s restaurantsoperated in 49 states, the District of Columbia, two U.S. territories and five foreign countries, withconcentrations in California (26% of total restaurants), Florida (10%) and Texas (10%).
Debt Reduction and Refinancing
During 2006, we successfully divested a significant portion of our non-core real estate assets and reducedour outstanding indebtedness. Through the proceeds generated from the real estate sales and cash flow fromoperations, we reduced our debt by more than $100 million, or approximately 18%. During the fourth quarter of2006, we successfully refinanced our credit facility. As a result of the improvement in our financial position andcredit rating upgrades by both Moody’s and Standard & Poor’s, we were able to obtain a new credit facility withextended maturities and lower interest costs. Based on current interest rates, the refinancing is expected to saveapproximately $5.5 million in annual cash interest.
Operations
Denny’s restaurants generally are open 24 hours a day, 7 days a week. This “always open” operatingplatform is a distinct competitive advantage. We provide high quality menu offerings and generous portions atreasonable prices with friendly and efficient service in a pleasant atmosphere. Denny’s expansive menu offerstraditional American-style food such as breakfast items, appetizers, sandwiches, dinner entrees and desserts.Denny’s sales are broadly distributed across each of its dayparts (i.e., breakfast, lunch, dinner and late-night);however, breakfast items account for the majority of Denny’s sales.
We believe that the superior execution of basic restaurant operations in each Denny’s restaurant, whether itis company-owned or franchised, is critical to our success. To meet and exceed our customers’ expectations, werequire both our company-owned and our franchised restaurants to maintain the same strict brand standards.These standards relate to the preparation and efficient serving of quality food and the maintenance, repair andcleanliness of restaurants.
We devote significant effort to ensuring all restaurants offer quality food served by friendly, knowledgeableand attentive employees in a clean and well-maintained restaurant. Through a network of division, region, areaand restaurant level managers, we seek to ensure that our company-owned restaurants meet our vision of “GreatFood and Great Service by Great People…Everytime.”
A principal feature of Denny’s restaurant operations is the consistent focus on improving operations at theunit level. Unit managers are hands-on and versatile in their supervisory activities. Region and area managersspend the majority of their time in the restaurants. Many of our restaurant management personnel began as hourlyassociates in the restaurants and, therefore, know how to perform restaurant functions and are able to train byexample.
Denny’s maintains a training program for associates and restaurant managers. To ensure our staff is properlystaffed when changing job function, before using new equipment or before performing new procedures,eLearning tools are used in the restaurants to support on the job training. New general managers attend customer
1
service and leadership training at the corporate headquarters and receive hands on training at specially designatedtraining units in the following areas:
• customer interaction;
• kitchen management and food preparation;
• data processing and cost control techniques;
• equipment and building maintenance; and
• leadership skills.
Denny’s employs a comprehensive system to ensure that the menu remains appealing to all customers. Ourresearch and development group analyzes consumer trends, competitive activity and operator input to determinenew offerings. We develop new offerings in our test kitchen and then introduce them in selected restaurants todetermine customer response and to ensure that consistency, quality standards and profitability are maintained. Ifa new item proves successful at the research and development level, it is usually tested in selected markets. Asuccessful menu item is then incorporated into the restaurant system. Low selling items are periodically removedfrom the menu.
Information Technology
Financial and management control is facilitated in all of the Denny’s company-owned restaurants by the useof point-of-sale (“POS”) systems which transmit detailed sales reports, payroll data and periodic inventoryinformation for management review. During 2006, we substantially completed the implementation of a new POSsystem in our company-owned restaurants. Total capital expenditures related to the new POS system were$13.1 million, of which $7.0 million was financed through capital leases.
Marketing & Advertising
Our marketing department manages contributions from both company-owned and franchised units providingfor an integrated marketing and advertising process to promote our brand, including:
• media advertising;
• menu management;
• menu pricing strategy; and
• specialized promotions to help differentiate Denny’s from our competitors.
Media advertising is primarily product oriented, featuring consistent, high-quality entrees presented tocommunicate the message of great food at great values to our guests. Our advertising is conducted through:
• national network and cable television;
• radio;
• outdoor; and
• print.
Denny’s integrated marketing and advertising approach reaches out to all consumers. Community outreachprograms are designed to enhance our diversity efforts.
Franchising
The Denny’s system is approximately one-third company-operated and two-thirds franchised. Our criteria tobecome a Denny’s franchisee include minimum liquidity and net worth requirements and appropriate operational
2
experience. We believe that Denny’s is an attractive financial proposition for current and potential franchiseesand that our fee structure is competitive with other full service brands. The initial fee for a single twenty-yearDenny’s franchise agreement is $40,000 and the royalty payment is 4% of gross sales. Additionally, ourfranchisees contribute up to 4% of gross sales for advertising.
A network of regional franchise operations managers oversee our franchised restaurants to ensurecompliance with brand standards, promote operational excellence, and provide general support to ourfranchisees. These managers visit each franchised unit an average of two to four times per quarter.
Site Selection
The success of any restaurant is influenced significantly by its location. Our real estate and franchisedevelopment groups work closely with franchisees and real estate brokers to identify sites which meet specificstandards. Sites are evaluated on the basis of a variety of factors, including but not limited to:
• demographics;
• traffic patterns;
• visibility;
• building constraints;
• competition;
• environmental restrictions; and
• proximity to high-traffic consumer activities.
Facilities Expenditures
We invest significantly in our restaurant facilities in order to provide a well-maintained, comfortableenvironment and improve the overall customer experience. During 2006, 2005 and 2004, we spent approximately$32 million, $47 million and $36 million, respectively, in capital expenditures and $18 million, $19 million and$17 million, respectively, for repair and maintenance of company-owned units.
We have remodeled approximately 142 company-owned restaurants in the past three years. In addition, ourfranchisees have remodeled approximately 430 restaurants in the past three years. We believe our remodelprogram appeals to existing and new franchisees, which is integral to the completion of the program systemwide.The normal components of a remodel include, among other things, new signs, painting of the building exteriorand interior, wallpaper, pictures, carpet, chairs, tables and booths.
Product Sources and Availability
Our purchasing department administers our programs for the procurement of food and non-food products.Our franchisees also purchase food and non-food products directly from the vendors under these programs. Ourcentralized purchasing program is designed to ensure uniform product quality as well as to minimize food,beverage and supply costs. Our size provides significant purchasing power which often enables us to obtainproducts at favorable prices from nationally recognized manufacturers.
While nearly all products are contracted for by our purchasing department, the majority are purchased anddistributed through Meadowbrook Meat Company, or MBM, under a long-term distribution contract. MBMdistributes restaurant products and supplies to Denny’s from nearly 300 vendors, representing approximately85% of our restaurant product and supply purchases. We believe that satisfactory sources of supply are generallyavailable for all the items regularly used by our restaurants, and we have not experienced any material shortagesof food, equipment, or other products which are necessary to our restaurant operations.
3
Seasonality
Our business is moderately seasonal. Restaurant sales are generally greater in the second and third calendarquarters (April through September) than in the first and fourth calendar quarters (October through March).Additionally, severe weather, storms and similar conditions may impact sales volumes seasonally in someoperating regions. Occupancy and other operating costs, which remain relatively constant, have adisproportionately greater negative effect on operating results during quarters with lower restaurant sales.
Trademarks and Service Marks
Through our wholly owned subsidiaries, we have certain trademarks and service marks registered with theUnited States Patent and Trademark Office and in international jurisdictions, including “Denny’s” and “GrandSlam Breakfast”. We consider our trademarks and service marks important to the identification of our restaurantsand believe they are of material importance to the conduct of our business. Domestic trademark and service markregistrations are renewable at various intervals from 10 to 20 years, while international trademark and servicemark registrations have various durations from 5 to 20 years. We generally intend to renew trademarks andservice marks which come up for renewal. We own or have rights to all trademarks we believe are material to ourrestaurant operations. In addition, we have registered various domain names on the internet that incorporatecertain of our trademarks and service marks, and believe these domain name registrations are an integral part ofour identity. From time to time, we may resort to legal measures to defend and protect the use of our intellectualproperty.
Competition
Our restaurants operate in the full—service segment of the restaurant industry. Full-service restaurantsinclude the mid-scale, casual dining and upscale (fine dining) segments. A large portion of mid-scale businesscomes from three categories—family-style, family steak and cafeteria—and is characterized by complete meals,menu variety and moderate prices. The family-style category, which includes Denny’s, consists of a smallnumber of national chains, many local and regional chains, and thousands of independent operators.
The restaurant industry is highly competitive. Competition among major companies that own or operaterestaurant chains is especially intense. Restaurants compete on the basis of name recognition and advertising; theprice, quality, variety, and perceived value of their food offerings; the quality of their customer service; and theconvenience and attractiveness of their facilities. Denny’s direct competition in the family-style category isprimarily a collection of national and regional chains. Denny’s also competes with quick service restaurants asthey attem pt to upgrade their menus with premium sandwiches, entree salads, new breakfast offerings andextended hours. We believe that Denny’s has a number of competitive strengths, including strong brand namerecognition, well-located restaurants and market penetr ation. We benefit from economies of scale in a variety ofareas, including advertising, purchasing and distribution. Additionally, we believe that Denny’s has competitivestrengths in the value, variety, and quality of our food products, and in the quality and training of our employees.See “Risk Factors” for certain additional factors relating to our competition in the restaurant industry.
Economic, Market and Other Conditions
The restaurant industry is affected by many factors, including changes in national, regional and localeconomic conditions affecting consumer spending, the political environment (including acts of war andterrorism), changes in customer travel patterns, changes in socio-demographic characteristics of areas whererestaurants are located, changes in consumer tastes and preferences, increases in the number of restaurants,unfavorable trends affecting restaurant operations, such as rising wage rates, healthcare costs and utilitiesexpenses, and unfavorable weather.
4
Government Regulations
We and our franchisees are subject to local, state and federal laws and regulations governing various aspectsof the restaurant business, including, but not limited to:
• health;
• sanitation;
• land use, sign restrictions and environmental matters;
• safety;
• disabled persons’ access to facilities;
• the sale of alcoholic beverages; and
• hiring and employment practices.
The operation of our franchise system is also subject to regulations enacted by a number of states and rulespromulgated by the Federal Trade Commission. We believe we are in material compliance with applicable lawsand regulations, but we cannot predict the effect on operations of the enactment of additional regulations in thefuture.
We are also subject to federal and state laws governing matters such as minimum wage, tipreporting, overtime and other working conditions. At December 27, 2006, a substantial number of our employeeswere paid the minimum wage. Accordingly, increases in the minimum wage or decreases in the allowable tipcredit (which reduces the minimum wage paid to tipped employees in certain states) increase our labor costs.This is especially true for our operations in California, where there is no tip credit. Employers must pay thehigher of the federal or state minimum wage. We have attempted to offset increases in the minimum wagethrough pricing and various cost control efforts; however, there can be no assurance that we will be successful inthese efforts in the future.
Environmental Matters
Federal, state and local environmental laws and regulations have not historically had a material impact onour operations; however, we cannot predict the effect of possible future environmental legislation or regulationson our operations.
5
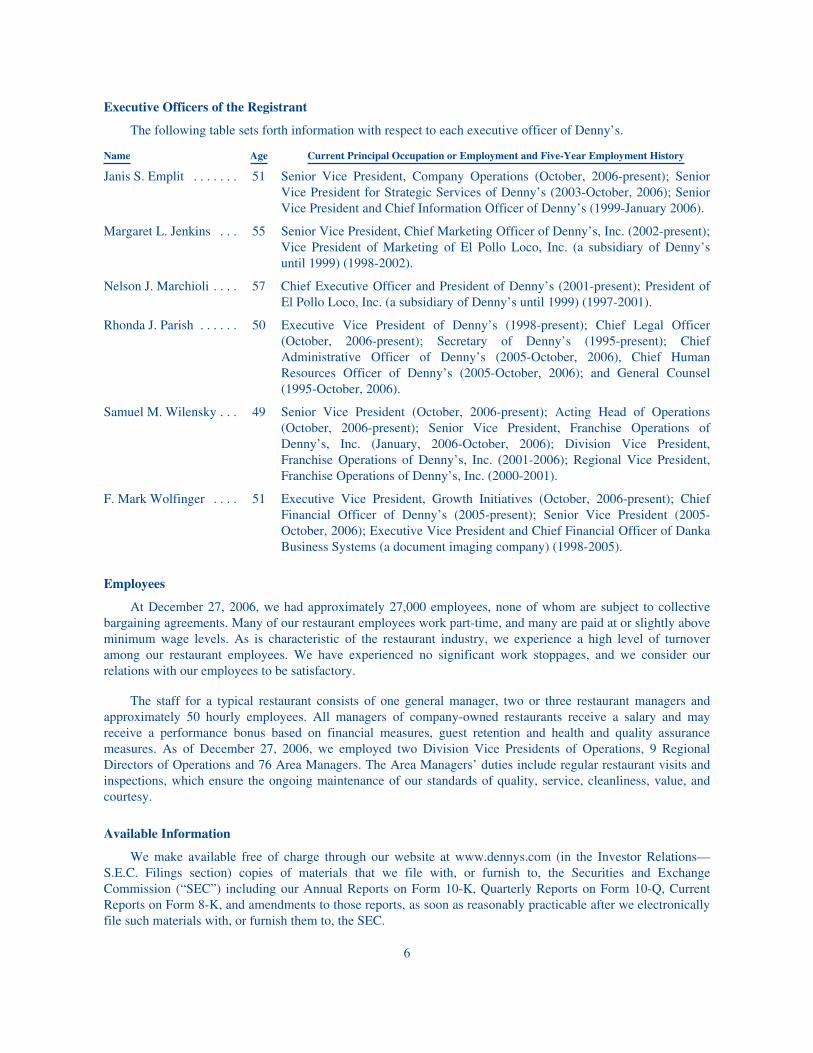
Executive Officers of the Registrant
The following table sets forth information with respect to each executive officer of Denny’s.
Name Age Current Principal Occupation or Employment and Five-Year Employment History
Janis S. Emplit . . . . . . . 51 Senior Vice President, Company Operations (October, 2006-present); SeniorVice President for Strategic Services of Denny’s (2003-October, 2006); SeniorVice President and Chief Information Officer of Denny’s (1999-January 2006).
Margaret L. Jenkins . . . 55 Senior Vice President, Chief Marketing Officer of Denny’s, Inc. (2002-present);Vice President of Marketing of El Pollo Loco, Inc. (a subsidiary of Denny’suntil 1999) (1998-2002).
Nelson J. Marchioli . . . . 57 Chief Executive Officer and President of Denny’s (2001-present); President ofEl Pollo Loco, Inc. (a subsidiary of Denny’s until 1999) (1997-2001).
Rhonda J. Parish . . . . . . 50 Executive Vice President of Denny’s (1998-present); Chief Legal Officer(October, 2006-present); Secretary of Denny’s (1995-present); ChiefAdministrative Officer of Denny’s (2005-October, 2006), Chief HumanResources Officer of Denny’s (2005-October, 2006); and General Counsel(1995-October, 2006).
Samuel M. Wilensky . . . 49 Senior Vice President (October, 2006-present); Acting Head of Operations(October, 2006-present); Senior Vice President, Franchise Operations ofDenny’s, Inc. (January, 2006-October, 2006); Division Vice President,Franchise Operations of Denny’s, Inc. (2001-2006); Regional Vice President,Franchise Operations of Denny’s, Inc. (2000-2001).
F. Mark Wolfinger . . . . 51 Executive Vice President, Growth Initiatives (October, 2006-present); ChiefFinancial Officer of Denny’s (2005-present); Senior Vice President (2005-October, 2006); Executive Vice President and Chief Financial Officer of DankaBusiness Systems (a document imaging company) (1998-2005).
Employees
At December 27, 2006, we had approximately 27,000 employees, none of whom are subject to collectivebargaining agreements. Many of our restaurant employees work part-time, and many are paid at or slightly aboveminimum wage levels. As is characteristic of the restaurant industry, we experience a high level of turnoveramong our restaurant employees. We have experienced no significant work stoppages, and we consider ourrelations with our employees to be satisfactory.
The staff for a typical restaurant consists of one general manager, two or three restaurant managers andapproximately 50 hourly employees. All managers of company-owned restaurants receive a salary and mayreceive a performance bonus based on financial measures, guest retention and health and quality assurancemeasures. As of December 27, 2006, we employed two Division Vice Presidents of Operations, 9 RegionalDirectors of Operations and 76 Area Managers. The Area Managers’ duties include regular restaurant visits andinspections, which ensure the ongoing maintenance of our standards of quality, service, cleanliness, value, andcourtesy.
Available Information
We make available free of charge through our website at www.dennys.com (in the Investor Relations—S.E.C. Filings section) copies of materials that we file with, or furnish to, the Securities and ExchangeCommission (“SEC”) including our Annual Reports on Form 10-K, Quarterly Reports on Form 10-Q, CurrentReports on Form 8-K, and amendments to those reports, as soon as reasonably practicable after we electronicallyfile such materials with, or furnish them to, the SEC.
6
Item 1A. Risk Factors
Risks Related to Our Business
The restaurant business is highly competitive, and if we are unable to compete effectively, our business willbe adversely affected.
We expect competition to continue to increase. The following are important aspects of competition:
• restaurant location;
• food quality and value;
• quality and speed of service;
• attractiveness and repair and maintenance of facilities; and
• the effectiveness of marketing and advertising programs.
Each of our restaurants competes with a wide variety of restaurants ranging from national and regionalrestaurant chains (some of which have substantially greater financial resources than we do) to locally ownedrestaurants. There is also active competition for advantageous commercial real estate sites suitable forrestaurants.
Our business may be adversely affected by changes in consumer tastes, economic conditions, demographictrends, bad publicity, regional weather conditions and increased supply and labor costs.
Food service businesses are often adversely affected by changes in:
• consumer tastes;
• national, regional and local economic conditions; and
• demographic trends.
The performance of our individual restaurants may be adversely affected by factors such as:
• traffic patterns;
• demographic consideration; and
• the type, number and location of competing restaurants.
Multi-unit food service chains such as ours can also be materially and adversely affected by publicityresulting from:
• poor food quality;
• illness;
• injury; and
• other health concerns or operating issues.
Dependence on frequent deliveries of fresh produce and groceries subjects food service businesses to therisk that shortages or interruptions in supply caused by adverse weather or other conditions could adversely affectthe availability, quality and cost of ingredients. In addition, the food service industry in general ,and our resultsof operations and financial condition in particular, may also be adversely affected by unfavorable trends ordevelopments such as:
• inflation;
• increased food costs;
• increased energy costs;
7
• labor and employee benefits costs (including increases in minimum hourly wage and employment taxrates);
• regional weather conditions; and
• the availability of experienced management and hourly employees.
The locations where we have restaurants may cease to be attractive as demographic patterns change.
The success of our owned and franchised restaurants is significantly influenced by location. Currentlocations may not continue to be attractive as demographic patterns change. It is possible that the neighborhoodor economic conditions where our restaurants are located could decline in the future, potentially resulting inreduced sales in those locations.
A majority of Denny’s restaurants are owned and operated by independent franchisees, and as a result thefinancial performance of franchisees can negatively impact our business.
We receive royalties and contributions to advertising from our franchisees. Our financial results aresomewhat contingent upon the operational and financial success of our franchisees, including implementation ofour strategic plans, as well as their ability to secure adequate financing. If sales trends or economic conditionsworsen for our franchisees, their financial health may worsen, our collection rates may decline and we may berequired to assume the responsibility for additional lease payments on franchised restaurants. Additionally,refusal on the part of franchisees to renew their franchise agreements may result in decreased royalties.
Although the loss of revenues from the closure of any one franchise restaurant may not be material, suchrevenues generate margins that may exceed those generated by other restaurants or offset fixed costs which wecontinue to incur.
The interests of franchisees, as owners of the majority of our restaurants, might sometimes conflict with ourinterests. For example, whereas franchisees are concerned with their individual business strategies andobjectives, we are responsible for ensuring the success of our entire chain of restaurants and for taking a longerterm view with respect to system improvements.
Numerous government regulations impact our business, and our failure to comply with them couldadversely affect our business.
We and our franchisees are subject to federal, state and local laws and regulations governing, among otherthings:
• health;
• sanitation;
• environmental matters;
• safety;
• the sale of alcoholic beverages; and
• hiring and employment practices, including minimum wage laws.
Our restaurant operations are also subject to federal and state laws that prohibit discrimination and lawsregulating the design and operation of facilities, such as the Americans with Disabilities Act of 1990. Theoperation of our franchisee system is also subject to regulations enacted by a number of states and rulespromulgated by the Federal Trade Commission. If we or our franchisees fail to comply with these laws andregulations, we could be subjected to restaurant closure, fines, penalties, and litigation, which may be costly. In
8
addition, the future enactment of additional legislation regulating the franchise relationship could adversely affectour operations, particularly our relationship with franchisees.
Negative publicity generated by incidents at a few restaurants can adversely affect the operating results ofour entire chain and the Denny’s brand.
Food safety concerns, criminal activity, alleged discrimination or other operating issues stemming from onerestaurant or a limited number of restaurants do not just impact that particular restaurant or a limited number ofrestaurants. Rather, our entire chain of restaurants may be at risk from negative publicity generated by anincident at a single restaurant. This negative publicity can adversely affect the operating results of our entirechain and the Denny’s brand.
As holding companies, Denny’s Corporation and Denny’s Holdings depend on upstream payments fromtheir operating subsidiaries. Our ability to repay our indebtedness depends on the performance of thosesubsidiaries and their ability to make distributions to us.
A substantial portion of our assets are owned, and a substantial percentage of our total operating revenuesare earned, by our subsidiaries. Accordingly, Denny’s Corporation and Denny’s Holdings depend upondividends, loans and other intercompany transfers from our subsidiaries to meet their debt service and otherobligations. These transfers are subject to contractual restrictions.
Our subsidiaries are separate and distinct legal entities and they have no obligation, contingent or otherwise,to make any funds available to meet our debt service and other obligations, whether by dividend, distribution,loan or other payments. If our subsidiaries do not pay dividends or other distributions, Denny’s Corporation andDenny’s Holdings may not have sufficient cash to fulfill their obligations.
If we lose the services of any of our key management personnel, our business could suffer.
Our future success significantly depends on the continued services and performance of our key managementpersonnel. Our future performance will depend on our ability to motivate and retain these and other key officersand key team members, particularly regional and area managers and restaurant general managers. Competitionfor these employees is intense. The loss of the services of members of our senior management or key teammembers or the inability to attract additional qualified personnel as needed could materially harm our business.
Risks Related to our Indebtedness
Our substantial indebtedness could have a material adverse effect on our financial condition andoperations.
We have a significant amount of indebtedness. As of December 27, 2006, we had total indebtedness ofapproximately $453.3 million.
Our substantial level of indebtedness could:
• make it more difficult for us to satisfy our obligations with respect to our indebtedness;
• require us to continue to dedicate a substantial portion of our cash flow from operations to pay interestand principal on our indebtedness, which would reduce the availability of our cash flow to fund futureworking capital, capital expenditures, acquisitions and other general corporate purposes;
• increase our vulnerability to general adverse economic and industry conditions;
• limit our flexibility in planning for, or reacting to, changes in our business and the industry in which weoperate;
9
• restrict us from making strategic acquisitions or pursuing business opportunities;
• place us at a competitive disadvantage compared to our competitors that have relatively lessindebtedness; and
• limit our ability to borrow additional funds.
We may need to access the capital markets in the future to raise the funds to repay our indebtedness. Wehave no assurance that we will be able to complete a refinancing or that we will be able to raise any additionalfinancing, particularly in view of our anticipated high levels of indebtedness and the restrictions contained in thecredit agreements and indenture that govern our indebtedness. If we are unable to satisfy or refinance our currentdebt as it comes due, we may default on our debt obligations. If we default on payments under our debtobligations, virtually all of our other debt would become immediately due and payable.
Despite our current level of indebtedness, we may still be able to incur substantially more debt, which couldfurther exacerbate the risks associated with our substantial leverage.
Despite our current and anticipated debt levels, we may be able to incur substantial additional indebtednessin the future. The credit agreements and the indenture governing our indebtedness limit, but do not fully prohibit,us from incurring additional indebtedness. If new debt is added to our current debt levels, the related risks thatwe now face could intensify.
At December 27, 2006, we had an outstanding term loan of $245.6 million and outstanding letters of creditof $42.6 million (comprised of $39.6 million under our letter of credit facility and $3.0 million under ourrevolving facility). There were no revolving loans outstanding at December 27, 2006. These balances result inavailability of $0.4 million under our letter of credit facility and $47.0 million under the revolving facility. As ofMarch 1, 2007 we had availability of $4.8 million under our letter of credit facility and $47.1 million under therevolving facility. There were no revolving loans outstanding at March 1, 2007. In addition, we have Denny’sHoldings. Inc. 10% Senior Notes due in 2012 (the “10% Notes”) with an aggregate principal amount of$175 million.
We continue to monitor our cash flow and liquidity needs. Although we believe that our existing cashbalances, funds from operations and amounts available under our credit facility will be adequate to cover thoseneeds, we may seek additional sources of funds including additional financing sources and continued selectedasset sales, to maintain sufficient cash flow to fund our ongoing operating needs, pay interest and scheduled debtamortization and fund anticipated capital expenditures over the next twelve months.
Our ability to generate cash depends on many factors beyond our control, and we may not be able togenerate the cash required to service or repay our indebtedness.
Our ability to make scheduled payments on our indebtedness will depend upon our subsidiaries’ operatingperformance, which will be affected by general economic, financial, competitive, legislative, regulatory and otherfactors that are beyond our control. Our historical financial results have been, and our future financial results areexpected to be, subject to substantial fluctuations. We cannot be sure that our subsidiaries will generate sufficientcash flow from operations to enable us to service or reduce our indebtedness or to fund our other liquidity needs.Our subsidiaries’ ability to maintain or increase operating cash flow will depend upon:
• consumer tastes;
• the success of our marketing initiatives and other efforts by us to increase customer traffic in ourrestaurants; and
• prevailing economic conditions and other matters, many of which are beyond our control.
If we are unable to meet our debt service obligations or fund other liquidity needs, we may need to refinanceall or a portion of our indebtedness on or before maturity or seek additional equity capital. We cannot be sure that
10
we will be able to pay or refinance our indebtedness or obtain additional equity capital on commerciallyreasonable terms, or at all.
Restrictive covenants in our debt instruments restrict or prohibit our ability to engage in or enter into avariety of transactions, which could adversely affect us.
The credit agreement and the indenture governing our indebtedness contain various covenants that limit,among other things, our ability to:
• incur additional indebtedness;
• pay dividends or make distributions or certain other restricted payments;
• make certain investments;
• create dividend or other payment restrictions affecting restricted subsidiaries;
• issue or sell capital stock of restricted subsidiaries;
• guarantee indebtedness;
• enter into transactions with stockholders or affiliates;
• create liens;
• sell assets and use the proceeds thereof;
• engage in sale-leaseback transactions; and
• enter into certain mergers and consolidations.
Our credit agreement contains additional restrictive covenants, including financial maintenancerequirements. These covenants could have an adverse effect on our business by limiting our ability to takeadvantage of financing, merger, acquisition or other corporate opportunities and to fund our operations.
A breach of a covenant in our debt instruments could cause acceleration of a significant portion of ouroutstanding indebtedness.
A breach of a covenant or other provision in any debt instrument governing our current or futureindebtedness could result in a default under that instrument and, due to cross-default and cross-accelerationprovisions, could result in a default under our other debt instruments. In addition, our credit agreement requiresus to maintain certain financial ratios. Our ability to comply with these covenants may be affected by eventsbeyond our control, and we cannot be sure that we will be able to comply with these covenants. Upon theoccurrence of an event of default under any of our debt instruments, the lenders could elect to declare all amountsoutstanding to be immediately due and payable and terminate all commitments to extend further credit. If wewere unable to repay those amounts, the lenders could proceed against the collateral granted to them, if any, tosecure the indebtedness. If the lenders under our current or future indebtedness accelerate the payment of theindebtedness, we cannot be sure that our assets would be sufficient to repay in full our outstanding indebtedness.
We may not be able to repurchase the 10% Senior Notes due 2012 upon a change of control.
Upon the occurrence of specific kinds of change of control events, we would be required to offer torepurchase all outstanding 10% Notes at 101% of their principal amount, together with any accrued and unpaidinterest and liquidated damages, if any, from the issue date. We may not be able to repurchase the notes upon achange of control because we may not have sufficient funds. Further, our credit agreement restricts our ability torepurchase the notes, and also provides that certain change of control events will constitute a default under ourcredit agreement that permits our lenders thereunder to accelerate the maturity of related borrowings, and, if suchdebt is not paid, to enforce security interests in the collateral securing such debt, thereby limiting our ability to
11
raise cash to purchase the notes. Any future credit agreements or other agreements relating to indebtedness towhich we become a party may contain similar restrictions and provisions. In the event a change of control occursat a time when we are prohibited by any other indebtedness from purchasing the notes, we could seek consent ofthe lenders of such indebtedness to the purchase of the notes or could attempt to refinance the borrowings thatcontain such prohibition. If we do not obtain such consent or repay such borrowings, we will remain prohibitedfrom purchasing the notes. In such case, our failure to purchase tendered notes would constitute an event ofdefault under the indenture governing the notes which would, in turn, constitute a default under our creditagreement.
Item 1B. Unresolved Staff Comments
None.
12
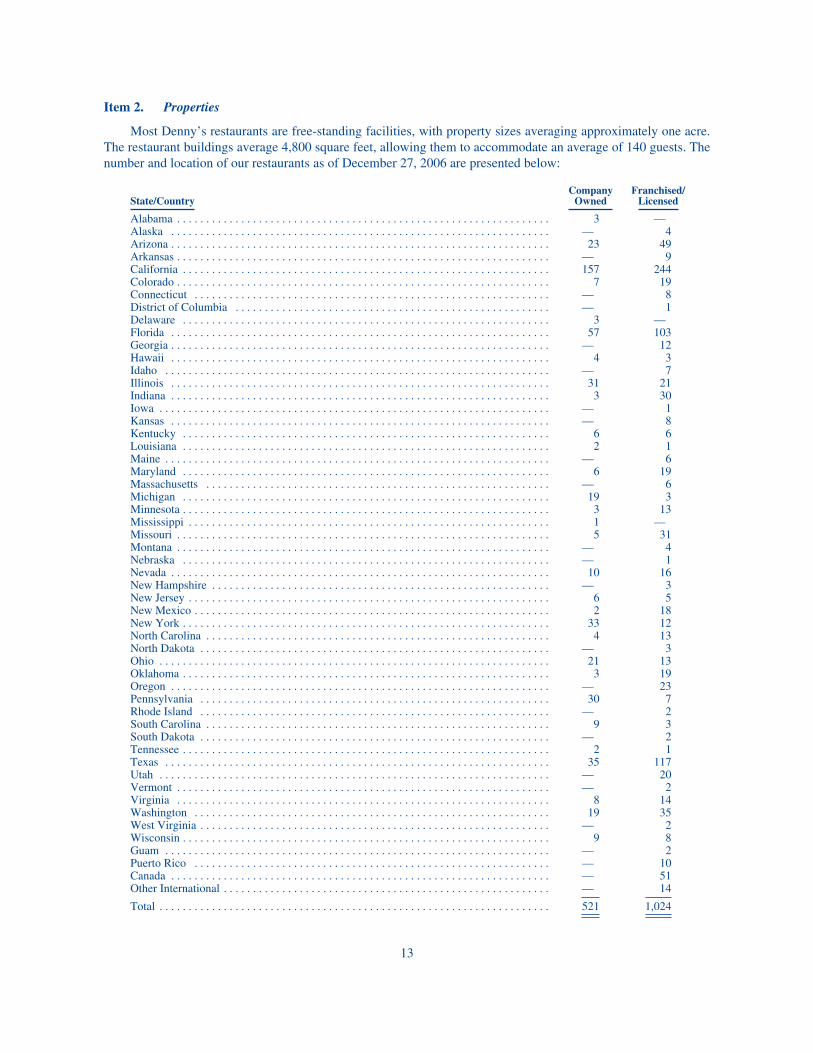
Item 2. Properties
Most Denny’s restaurants are free-standing facilities, with property sizes averaging approximately one acre.The restaurant buildings average 4,800 square feet, allowing them to accommodate an average of 140 guests. Thenumber and location of our restaurants as of December 27, 2006 are presented below:
State/CountryCompany
OwnedFranchised/
Licensed
Alabama . . . . . . . . . . . . . . . . . . . . . . . . . . . . . . . . . . . . . . . . . . . . . . . . . . . . . . . . . . . . . . . . 3 —Alaska . . . . . . . . . . . . . . . . . . . . . . . . . . . . . . . . . . . . . . . . . . . . . . . . . . . . . . . . . . . . . . . . . — 4Arizona . . . . . . . . . . . . . . . . . . . . . . . . . . . . . . . . . . . . . . . . . . . . . . . . . . . . . . . . . . . . . . . . . 23 49Arkansas . . . . . . . . . . . . . . . . . . . . . . . . . . . . . . . . . . . . . . . . . . . . . . . . . . . . . . . . . . . . . . . . — 9California . . . . . . . . . . . . . . . . . . . . . . . . . . . . . . . . . . . . . . . . . . . . . . . . . . . . . . . . . . . . . . . 157 244Colorado . . . . . . . . . . . . . . . . . . . . . . . . . . . . . . . . . . . . . . . . . . . . . . . . . . . . . . . . . . . . . . . . 7 19Connecticut . . . . . . . . . . . . . . . . . . . . . . . . . . . . . . . . . . . . . . . . . . . . . . . . . . . . . . . . . . . . . — 8District of Columbia . . . . . . . . . . . . . . . . . . . . . . . . . . . . . . . . . . . . . . . . . . . . . . . . . . . . . . — 1Delaware . . . . . . . . . . . . . . . . . . . . . . . . . . . . . . . . . . . . . . . . . . . . . . . . . . . . . . . . . . . . . . . 3 —Florida . . . . . . . . . . . . . . . . . . . . . . . . . . . . . . . . . . . . . . . . . . . . . . . . . . . . . . . . . . . . . . . . . 57 103Georgia . . . . . . . . . . . . . . . . . . . . . . . . . . . . . . . . . . . . . . . . . . . . . . . . . . . . . . . . . . . . . . . . . — 12Hawaii . . . . . . . . . . . . . . . . . . . . . . . . . . . . . . . . . . . . . . . . . . . . . . . . . . . . . . . . . . . . . . . . . 4 3Idaho . . . . . . . . . . . . . . . . . . . . . . . . . . . . . . . . . . . . . . . . . . . . . . . . . . . . . . . . . . . . . . . . . . — 7Illinois . . . . . . . . . . . . . . . . . . . . . . . . . . . . . . . . . . . . . . . . . . . . . . . . . . . . . . . . . . . . . . . . . 31 21Indiana . . . . . . . . . . . . . . . . . . . . . . . . . . . . . . . . . . . . . . . . . . . . . . . . . . . . . . . . . . . . . . . . . 3 30Iowa . . . . . . . . . . . . . . . . . . . . . . . . . . . . . . . . . . . . . . . . . . . . . . . . . . . . . . . . . . . . . . . . . . . — 1Kansas . . . . . . . . . . . . . . . . . . . . . . . . . . . . . . . . . . . . . . . . . . . . . . . . . . . . . . . . . . . . . . . . . — 8Kentucky . . . . . . . . . . . . . . . . . . . . . . . . . . . . . . . . . . . . . . . . . . . . . . . . . . . . . . . . . . . . . . . 6 6Louisiana . . . . . . . . . . . . . . . . . . . . . . . . . . . . . . . . . . . . . . . . . . . . . . . . . . . . . . . . . . . . . . . 2 1Maine . . . . . . . . . . . . . . . . . . . . . . . . . . . . . . . . . . . . . . . . . . . . . . . . . . . . . . . . . . . . . . . . . . — 6Maryland . . . . . . . . . . . . . . . . . . . . . . . . . . . . . . . . . . . . . . . . . . . . . . . . . . . . . . . . . . . . . . . 6 19Massachusetts . . . . . . . . . . . . . . . . . . . . . . . . . . . . . . . . . . . . . . . . . . . . . . . . . . . . . . . . . . . — 6Michigan . . . . . . . . . . . . . . . . . . . . . . . . . . . . . . . . . . . . . . . . . . . . . . . . . . . . . . . . . . . . . . . 19 3Minnesota . . . . . . . . . . . . . . . . . . . . . . . . . . . . . . . . . . . . . . . . . . . . . . . . . . . . . . . . . . . . . . . 3 13Mississippi . . . . . . . . . . . . . . . . . . . . . . . . . . . . . . . . . . . . . . . . . . . . . . . . . . . . . . . . . . . . . . 1 —Missouri . . . . . . . . . . . . . . . . . . . . . . . . . . . . . . . . . . . . . . . . . . . . . . . . . . . . . . . . . . . . . . . . 5 31Montana . . . . . . . . . . . . . . . . . . . . . . . . . . . . . . . . . . . . . . . . . . . . . . . . . . . . . . . . . . . . . . . . — 4Nebraska . . . . . . . . . . . . . . . . . . . . . . . . . . . . . . . . . . . . . . . . . . . . . . . . . . . . . . . . . . . . . . . — 1Nevada . . . . . . . . . . . . . . . . . . . . . . . . . . . . . . . . . . . . . . . . . . . . . . . . . . . . . . . . . . . . . . . . . 10 16New Hampshire . . . . . . . . . . . . . . . . . . . . . . . . . . . . . . . . . . . . . . . . . . . . . . . . . . . . . . . . . . — 3New Jersey . . . . . . . . . . . . . . . . . . . . . . . . . . . . . . . . . . . . . . . . . . . . . . . . . . . . . . . . . . . . . . 6 5New Mexico . . . . . . . . . . . . . . . . . . . . . . . . . . . . . . . . . . . . . . . . . . . . . . . . . . . . . . . . . . . . . 2 18New York . . . . . . . . . . . . . . . . . . . . . . . . . . . . . . . . . . . . . . . . . . . . . . . . . . . . . . . . . . . . . . . 33 12North Carolina . . . . . . . . . . . . . . . . . . . . . . . . . . . . . . . . . . . . . . . . . . . . . . . . . . . . . . . . . . . 4 13North Dakota . . . . . . . . . . . . . . . . . . . . . . . . . . . . . . . . . . . . . . . . . . . . . . . . . . . . . . . . . . . . — 3Ohio . . . . . . . . . . . . . . . . . . . . . . . . . . . . . . . . . . . . . . . . . . . . . . . . . . . . . . . . . . . . . . . . . . . 21 13Oklahoma . . . . . . . . . . . . . . . . . . . . . . . . . . . . . . . . . . . . . . . . . . . . . . . . . . . . . . . . . . . . . . . 3 19Oregon . . . . . . . . . . . . . . . . . . . . . . . . . . . . . . . . . . . . . . . . . . . . . . . . . . . . . . . . . . . . . . . . . — 23Pennsylvania . . . . . . . . . . . . . . . . . . . . . . . . . . . . . . . . . . . . . . . . . . . . . . . . . . . . . . . . . . . . 30 7Rhode Island . . . . . . . . . . . . . . . . . . . . . . . . . . . . . . . . . . . . . . . . . . . . . . . . . . . . . . . . . . . . — 2South Carolina . . . . . . . . . . . . . . . . . . . . . . . . . . . . . . . . . . . . . . . . . . . . . . . . . . . . . . . . . . . 9 3South Dakota . . . . . . . . . . . . . . . . . . . . . . . . . . . . . . . . . . . . . . . . . . . . . . . . . . . . . . . . . . . . — 2Tennessee . . . . . . . . . . . . . . . . . . . . . . . . . . . . . . . . . . . . . . . . . . . . . . . . . . . . . . . . . . . . . . . 2 1Texas . . . . . . . . . . . . . . . . . . . . . . . . . . . . . . . . . . . . . . . . . . . . . . . . . . . . . . . . . . . . . . . . . . 35 117Utah . . . . . . . . . . . . . . . . . . . . . . . . . . . . . . . . . . . . . . . . . . . . . . . . . . . . . . . . . . . . . . . . . . . — 20Vermont . . . . . . . . . . . . . . . . . . . . . . . . . . . . . . . . . . . . . . . . . . . . . . . . . . . . . . . . . . . . . . . . — 2Virginia . . . . . . . . . . . . . . . . . . . . . . . . . . . . . . . . . . . . . . . . . . . . . . . . . . . . . . . . . . . . . . . . 8 14Washington . . . . . . . . . . . . . . . . . . . . . . . . . . . . . . . . . . . . . . . . . . . . . . . . . . . . . . . . . . . . . 19 35West Virginia . . . . . . . . . . . . . . . . . . . . . . . . . . . . . . . . . . . . . . . . . . . . . . . . . . . . . . . . . . . . — 2Wisconsin . . . . . . . . . . . . . . . . . . . . . . . . . . . . . . . . . . . . . . . . . . . . . . . . . . . . . . . . . . . . . . . 9 8Guam . . . . . . . . . . . . . . . . . . . . . . . . . . . . . . . . . . . . . . . . . . . . . . . . . . . . . . . . . . . . . . . . . . — 2Puerto Rico . . . . . . . . . . . . . . . . . . . . . . . . . . . . . . . . . . . . . . . . . . . . . . . . . . . . . . . . . . . . . — 10Canada . . . . . . . . . . . . . . . . . . . . . . . . . . . . . . . . . . . . . . . . . . . . . . . . . . . . . . . . . . . . . . . . . — 51Other International . . . . . . . . . . . . . . . . . . . . . . . . . . . . . . . . . . . . . . . . . . . . . . . . . . . . . . . . — 14
Total . . . . . . . . . . . . . . . . . . . . . . . . . . . . . . . . . . . . . . . . . . . . . . . . . . . . . . . . . . . . . . . . . . . 521 1,024
13
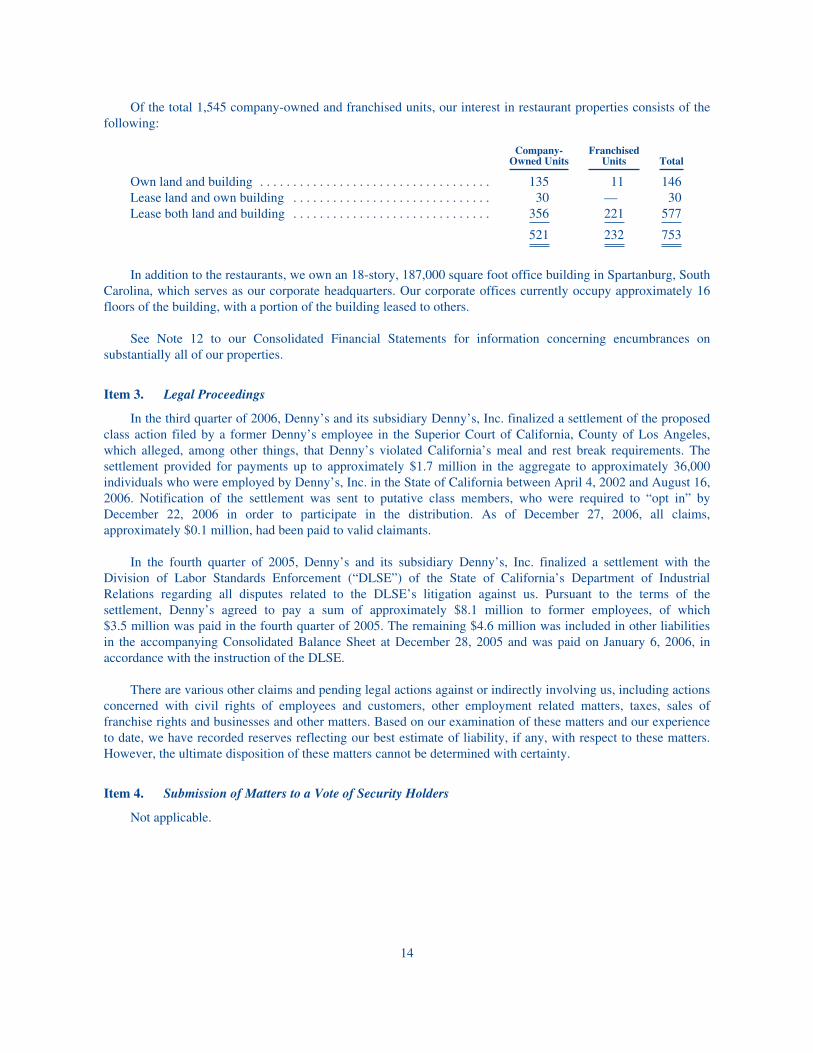
Of the total 1,545 company-owned and franchised units, our interest in restaurant properties consists of thefollowing:
Company-Owned Units
FranchisedUnits Total
Own land and building . . . . . . . . . . . . . . . . . . . . . . . . . . . . . . . . . . . 135 11 146Lease land and own building . . . . . . . . . . . . . . . . . . . . . . . . . . . . . . 30 — 30Lease both land and building . . . . . . . . . . . . . . . . . . . . . . . . . . . . . . 356 221 577
521 232 753
In addition to the restaurants, we own an 18-story, 187,000 square foot office building in Spartanburg, SouthCarolina, which serves as our corporate headquarters. Our corporate offices currently occupy approximately 16floors of the building, with a portion of the building leased to others.
See Note 12 to our Consolidated Financial Statements for information concerning encumbrances onsubstantially all of our properties.
Item 3. Legal Proceedings
In the third quarter of 2006, Denny’s and its subsidiary Denny’s, Inc. finalized a settlement of the proposedclass action filed by a former Denny’s employee in the Superior Court of California, County of Los Angeles,which alleged, among other things, that Denny’s violated California’s meal and rest break requirements. Thesettlement provided for payments up to approximately $1.7 million in the aggregate to approximately 36,000individuals who were employed by Denny’s, Inc. in the State of California between April 4, 2002 and August 16,2006. Notification of the settlement was sent to putative class members, who were required to “opt in” byDecember 22, 2006 in order to participate in the distribution. As of December 27, 2006, all claims,approximately $0.1 million, had been paid to valid claimants.
In the fourth quarter of 2005, Denny’s and its subsidiary Denny’s, Inc. finalized a settlement with theDivision of Labor Standards Enforcement (“DLSE”) of the State of California’s Department of IndustrialRelations regarding all disputes related to the DLSE’s litigation against us. Pursuant to the terms of thesettlement, Denny’s agreed to pay a sum of approximately $8.1 million to former employees, of which$3.5 million was paid in the fourth quarter of 2005. The remaining $4.6 million was included in other liabilitiesin the accompanying Consolidated Balance Sheet at December 28, 2005 and was paid on January 6, 2006, inaccordance with the instruction of the DLSE.
There are various other claims and pending legal actions against or indirectly involving us, including actionsconcerned with civil rights of employees and customers, other employment related matters, taxes, sales offranchise rights and businesses and other matters. Based on our examination of these matters and our experienceto date, we have recorded reserves reflecting our best estimate of liability, if any, with respect to these matters.However, the ultimate disposition of these matters cannot be determined with certainty.
Item 4. Submission of Matters to a Vote of Security Holders
Not applicable.
14
PART II
Item 5. Market for Registrant’s Common Equity, Related Stockholder Matters and Issuer Purchases ofEquity Securities
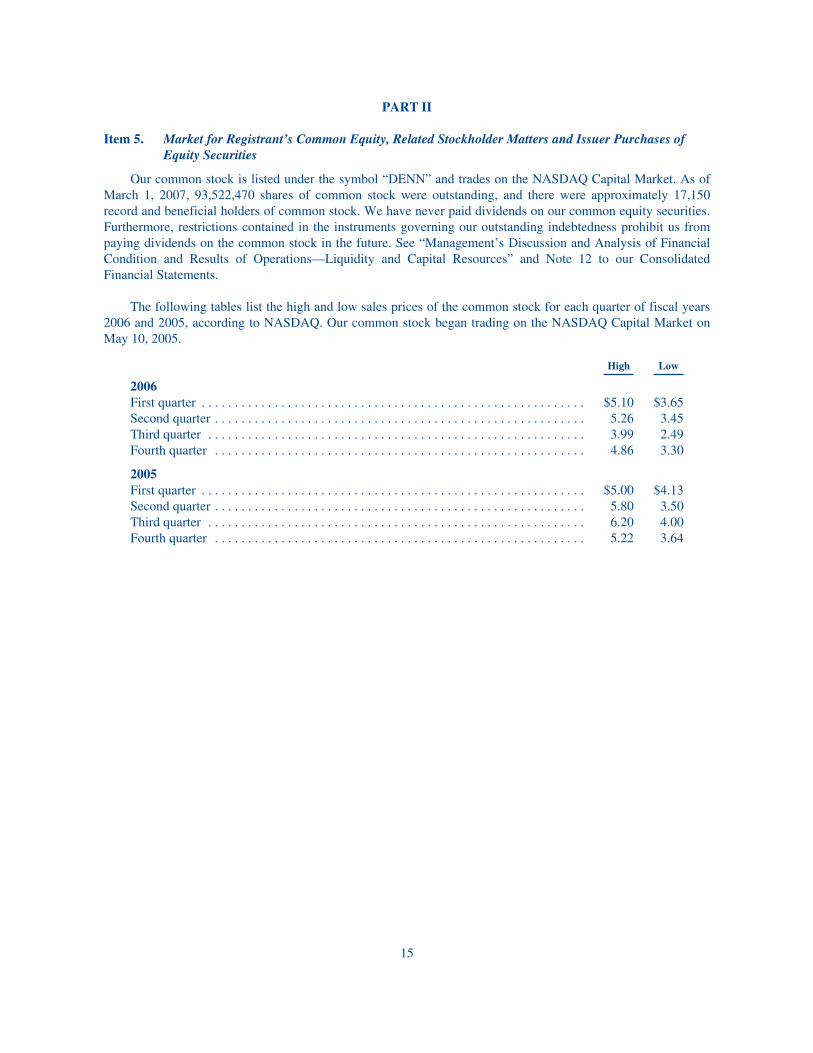
Our common stock is listed under the symbol “DENN” and trades on the NASDAQ Capital Market. As ofMarch 1, 2007, 93,522,470 shares of common stock were outstanding, and there were approximately 17,150record and beneficial holders of common stock. We have never paid dividends on our common equity securities.Furthermore, restrictions contained in the instruments governing our outstanding indebtedness prohibit us frompaying dividends on the common stock in the future. See “Management’s Discussion and Analysis of FinancialCondition and Results of Operations—Liquidity and Capital Resources” and Note 12 to our ConsolidatedFinancial Statements.
The following tables list the high and low sales prices of the common stock for each quarter of fiscal years2006 and 2005, according to NASDAQ. Our common stock began trading on the NASDAQ Capital Market onMay 10, 2005.
High Low
2006First quarter . . . . . . . . . . . . . . . . . . . . . . . . . . . . . . . . . . . . . . . . . . . . . . . . . . . . . . . . . . $5.10 $3.65Second quarter . . . . . . . . . . . . . . . . . . . . . . . . . . . . . . . . . . . . . . . . . . . . . . . . . . . . . . . . 5.26 3.45Third quarter . . . . . . . . . . . . . . . . . . . . . . . . . . . . . . . . . . . . . . . . . . . . . . . . . . . . . . . . . 3.99 2.49Fourth quarter . . . . . . . . . . . . . . . . . . . . . . . . . . . . . . . . . . . . . . . . . . . . . . . . . . . . . . . . 4.86 3.30
2005First quarter . . . . . . . . . . . . . . . . . . . . . . . . . . . . . . . . . . . . . . . . . . . . . . . . . . . . . . . . . . $5.00 $4.13Second quarter . . . . . . . . . . . . . . . . . . . . . . . . . . . . . . . . . . . . . . . . . . . . . . . . . . . . . . . . 5.80 3.50Third quarter . . . . . . . . . . . . . . . . . . . . . . . . . . . . . . . . . . . . . . . . . . . . . . . . . . . . . . . . . 6.20 4.00Fourth quarter . . . . . . . . . . . . . . . . . . . . . . . . . . . . . . . . . . . . . . . . . . . . . . . . . . . . . . . . 5.22 3.64
15
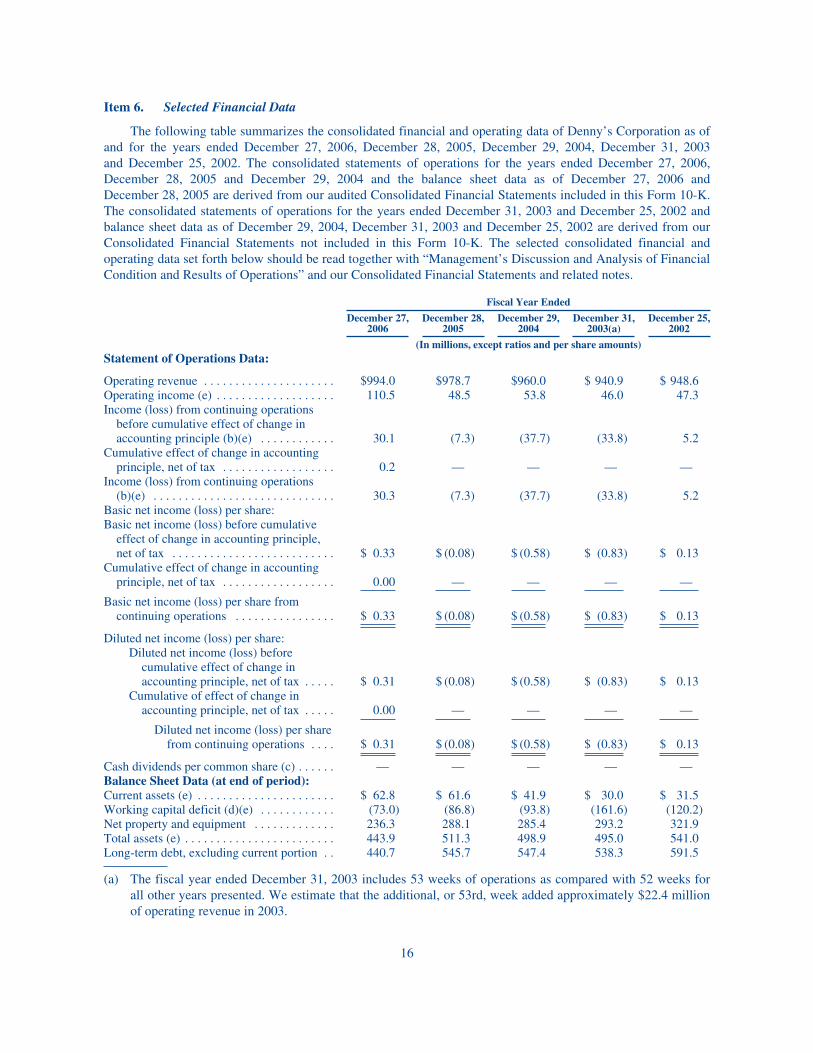
Item 6. Selected Financial Data
The following table summarizes the consolidated financial and operating data of Denny’s Corporation as ofand for the years ended December 27, 2006, December 28, 2005, December 29, 2004, December 31, 2003and December 25, 2002. The consolidated statements of operations for the years ended December 27, 2006,December 28, 2005 and December 29, 2004 and the balance sheet data as of December 27, 2006 andDecember 28, 2005 are derived from our audited Consolidated Financial Statements included in this Form 10-K.The consolidated statements of operations for the years ended December 31, 2003 and December 25, 2002 andbalance sheet data as of December 29, 2004, December 31, 2003 and December 25, 2002 are derived from ourConsolidated Financial Statements not included in this Form 10-K. The selected consolidated financial andoperating data set forth below should be read together with “Management’s Discussion and Analysis of FinancialCondition and Results of Operations” and our Consolidated Financial Statements and related notes.
Fiscal Year Ended
December 27,2006
December 28,2005
December 29,2004
December 31,2003(a)
December 25,2002
(In millions, except ratios and per share amounts)Statement of Operations Data:
Operating revenue . . . . . . . . . . . . . . . . . . . . . $994.0 $978.7 $960.0 $ 940.9 $ 948.6Operating income (e) . . . . . . . . . . . . . . . . . . . 110.5 48.5 53.8 46.0 47.3Income (loss) from continuing operations
before cumulative effect of change inaccounting principle (b)(e) . . . . . . . . . . . . 30.1 (7.3) (37.7) (33.8) 5.2
Cumulative effect of change in accountingprinciple, net of tax . . . . . . . . . . . . . . . . . . 0.2 — — — —
Income (loss) from continuing operations(b)(e) . . . . . . . . . . . . . . . . . . . . . . . . . . . . . 30.3 (7.3) (37.7) (33.8) 5.2
Basic net income (loss) per share:Basic net income (loss) before cumulative
effect of change in accounting principle,net of tax . . . . . . . . . . . . . . . . . . . . . . . . . . $ 0.33 $ (0.08) $ (0.58) $ (0.83) $ 0.13
Cumulative effect of change in accountingprinciple, net of tax . . . . . . . . . . . . . . . . . . 0.00 — — — —
Basic net income (loss) per share fromcontinuing operations . . . . . . . . . . . . . . . . $ 0.33 $ (0.08) $ (0.58) $ (0.83) $ 0.13
Diluted net income (loss) per share:Diluted net income (loss) before
cumulative effect of change inaccounting principle, net of tax . . . . . $ 0.31 $ (0.08) $ (0.58) $ (0.83) $ 0.13
Cumulative of effect of change inaccounting principle, net of tax . . . . . 0.00 — — — —
Diluted net income (loss) per sharefrom continuing operations . . . . $ 0.31 $ (0.08) $ (0.58) $ (0.83) $ 0.13
Cash dividends per common share (c) . . . . . . — — — — —Balance Sheet Data (at end of period):Current assets (e) . . . . . . . . . . . . . . . . . . . . . . $ 62.8 $ 61.6 $ 41.9 $ 30.0 $ 31.5Working capital deficit (d)(e) . . . . . . . . . . . . (73.0) (86.8) (93.8) (161.6) (120.2)Net property and equipment . . . . . . . . . . . . . 236.3 288.1 285.4 293.2 321.9Total assets (e) . . . . . . . . . . . . . . . . . . . . . . . . 443.9 511.3 498.9 495.0 541.0Long-term debt, excluding current portion . . 440.7 545.7 547.4 538.3 591.5
(a) The fiscal year ended December 31, 2003 includes 53 weeks of operations as compared with 52 weeks forall other years presented. We estimate that the additional, or 53rd, week added approximately $22.4 millionof operating revenue in 2003.
16
(b) We classified FRD as discontinued operations through July 2002, the divestiture date. We completed thedivestiture of FRD in 2002.
(c) Our bank facilities have prohibited, and our previous and current public debt indentures have significantlylimited, distributions and dividends on Denny’s Corporation’s (and its predecessors’) common equitysecurities. See Note 12 to our Consolidated Financial Statements.
(d) A negative working capital position is not unusual for a restaurant operating company. The decrease inworking capital deficit from December 31, 2003 to December 29, 2004 is primarily related to the use ofcash received during the recapitalization transactions completed during the third and fourth quarters of 2004to repay outstanding amounts related to term loans and revolving loans under our previous credit facilitythat had a December 20, 2004 expiration date. See “Management’s Discussion and Analysis of FinancialCondition and Results of Operations—Liquidity and Capital Resources”. The increase in working capitaldeficit from December 25, 2002 to December 31, 2003 is primarily attributable to the reclassification of theterm loan of $40.0 million and revolving loans of $11.1 million under our previous credit facility to currentliabilities as a result of their December 20, 2004 expiration date.
(e) Fiscal years 2002 through 2005 have been adjusted from amounts previously reported to reflect certainadjustments as discussed in “Balance Sheet Adjustments” in Note 3 to our Consolidated FinancialStatements.
17
Item 7. Management’s Discussion and Analysis of Financial Condition and Results of Operations
The following discussion should be read in conjunction with “Selected Financial Data,” and ourConsolidated Financial Statements and the notes thereto.
Overview
Denny’s revenues are primarily derived from two sources: the sale of food and beverages at our company-owned restaurants and the collection of royalties and fees from restaurants operated by our franchisees under theDenny’s name.
Sales are affected by many factors including competition, economic conditions affecting consumerspending, weather and changes in customer tastes and preferences. Two primary sales drivers are changes insame-store sales and the number of restaurants. Same-store sales are comprised of the changes in guestcheck average and guest counts.
We continue to focus on identifying and closing low performing units. As a result, company-owned andfranchise units decreased by 22 and 11 units, respectively, during 2006. Netted in the unit decreases were theopening of three company-owned and 17 franchisee restaurants. Development of company-owned restaurantswill focus on flagship locations in Denny’s core markets. We expect that the majority of new Denny’s restaurantswill be developed by our franchisees.
Our costs of company-owned restaurant sales are exposed to volatility in two main areas: product costs andpayroll and benefit costs. Many of the products sold in our restaurants are affected by commodity pricing and are,therefore, subject to price volatility. This volatility is caused by factors that are fundamentally outside of ourcontrol and are often unpredictable. In general, we purchase food products based on market prices, or we “lockin” prices in purchase agreements with our vendors. In addition, some of our purchasing agreements containfeatures that minimize price volatility by establishing price ceilings and/or floors. While we will addresscommodity cost increases which are significant and considered long-term in nature by adjusting menu prices,competitive circumstances can limit such actions.
Payroll and benefit costs’ volatility results primarily from changes in wage rates and increases in laborrelated expenses such as medical benefit costs and workers’ compensation costs. A number of our employees arepaid the minimum wage. Accordingly, substantial increases in the minimum wage increases our labor costs.Additionally, declines in guest counts and investments in store level labor can cause payroll and benefit costs toincrease as a percentage of sales.
Franchise and license revenues are the revenues received by Denny’s from its franchisees and includeroyalties (based on a percentage of sales of franchise operated restaurants), initial franchise fees and occupancyrevenue related to restaurants leased or subleased to franchisees. During 2006, we sold 81 franchise-operated realestate properties. Occupancy revenue, included in franchise and license revenue in 2006, related to the soldproperties was approximately $5.0 million. Our costs of franchise and license revenue include occupancy costsrelated to restaurants leased or subleased to franchisees and direct costs consisting primarily of payroll andbenefit costs of franchise operations personnel, bad debt expense and marketing expenses net of marketingcontributions received from franchisees. Occupancy costs, included in costs of franchise and license revenue in2006, related to the sold properties were approximately $0.9 million. Franchise and licensing revenues aregenerally billed and collected from franchisees on a weekly basis which minimizes the impact of bad debts onour costs of franchise and license revenues.
Interest expense has a significant impact on our net income (loss) as a result of our substantial indebtedness.However, during 2006 we continued to reduce interest expense through a series of debt repayments and arefinancing of our credit facilities, contributing to an overall debt reduction of more than $100 million. We aresubject to the effects of interest rate volatility since approximately 58% of our debt has variable interest rates.
18
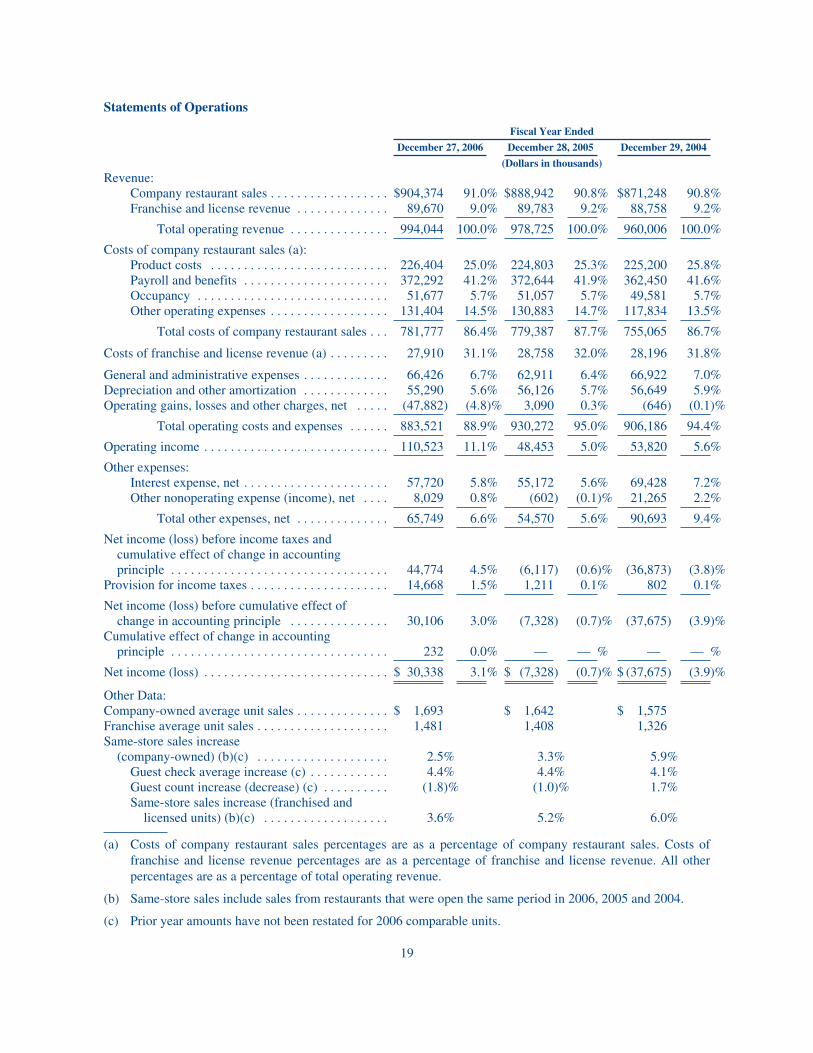
Statements of Operations
Fiscal Year Ended
December 27, 2006 December 28, 2005 December 29, 2004
(Dollars in thousands)Revenue:
Company restaurant sales . . . . . . . . . . . . . . . . . . $904,374 91.0% $888,942 90.8% $871,248 90.8%Franchise and license revenue . . . . . . . . . . . . . . 89,670 9.0% 89,783 9.2% 88,758 9.2%
Total operating revenue . . . . . . . . . . . . . . . 994,044 100.0% 978,725 100.0% 960,006 100.0%
Costs of company restaurant sales (a):Product costs . . . . . . . . . . . . . . . . . . . . . . . . . . . 226,404 25.0% 224,803 25.3% 225,200 25.8%Payroll and benefits . . . . . . . . . . . . . . . . . . . . . . 372,292 41.2% 372,644 41.9% 362,450 41.6%Occupancy . . . . . . . . . . . . . . . . . . . . . . . . . . . . . 51,677 5.7% 51,057 5.7% 49,581 5.7%Other operating expenses . . . . . . . . . . . . . . . . . . 131,404 14.5% 130,883 14.7% 117,834 13.5%
Total costs of company restaurant sales . . . 781,777 86.4% 779,387 87.7% 755,065 86.7%
Costs of franchise and license revenue (a) . . . . . . . . . 27,910 31.1% 28,758 32.0% 28,196 31.8%
General and administrative expenses . . . . . . . . . . . . . 66,426 6.7% 62,911 6.4% 66,922 7.0%Depreciation and other amortization . . . . . . . . . . . . . 55,290 5.6% 56,126 5.7% 56,649 5.9%Operating gains, losses and other charges, net . . . . . (47,882) (4.8)% 3,090 0.3% (646) (0.1)%
Total operating costs and expenses . . . . . . 883,521 88.9% 930,272 95.0% 906,186 94.4%
Operating income . . . . . . . . . . . . . . . . . . . . . . . . . . . . 110,523 11.1% 48,453 5.0% 53,820 5.6%
Other expenses:Interest expense, net . . . . . . . . . . . . . . . . . . . . . . 57,720 5.8% 55,172 5.6% 69,428 7.2%Other nonoperating expense (income), net . . . . 8,029 0.8% (602) (0.1)% 21,265 2.2%
Total other expenses, net . . . . . . . . . . . . . . 65,749 6.6% 54,570 5.6% 90,693 9.4%
Net income (loss) before income taxes andcumulative effect of change in accountingprinciple . . . . . . . . . . . . . . . . . . . . . . . . . . . . . . . . . 44,774 4.5% (6,117) (0.6)% (36,873) (3.8)%
Provision for income taxes . . . . . . . . . . . . . . . . . . . . . 14,668 1.5% 1,211 0.1% 802 0.1%
Net income (loss) before cumulative effect ofchange in accounting principle . . . . . . . . . . . . . . . 30,106 3.0% (7,328) (0.7)% (37,675) (3.9)%
Cumulative effect of change in accountingprinciple . . . . . . . . . . . . . . . . . . . . . . . . . . . . . . . . . 232 0.0% — — % — — %
Net income (loss) . . . . . . . . . . . . . . . . . . . . . . . . . . . . $ 30,338 3.1% $ (7,328) (0.7)% $ (37,675) (3.9)%
Other Data:Company-owned average unit sales . . . . . . . . . . . . . . $ 1,693 $ 1,642 $ 1,575Franchise average unit sales . . . . . . . . . . . . . . . . . . . . 1,481 1,408 1,326Same-store sales increase
(company-owned) (b)(c) . . . . . . . . . . . . . . . . . . . . 2.5% 3.3% 5.9%Guest check average increase (c) . . . . . . . . . . . . 4.4% 4.4% 4.1%Guest count increase (decrease) (c) . . . . . . . . . . (1.8)% (1.0)% 1.7%Same-store sales increase (franchised and
licensed units) (b)(c) . . . . . . . . . . . . . . . . . . . 3.6% 5.2% 6.0%
(a) Costs of company restaurant sales percentages are as a percentage of company restaurant sales. Costs offranchise and license revenue percentages are as a percentage of franchise and license revenue. All otherpercentages are as a percentage of total operating revenue.
(b) Same-store sales include sales from restaurants that were open the same period in 2006, 2005 and 2004.
(c) Prior year amounts have not been restated for 2006 comparable units.
19
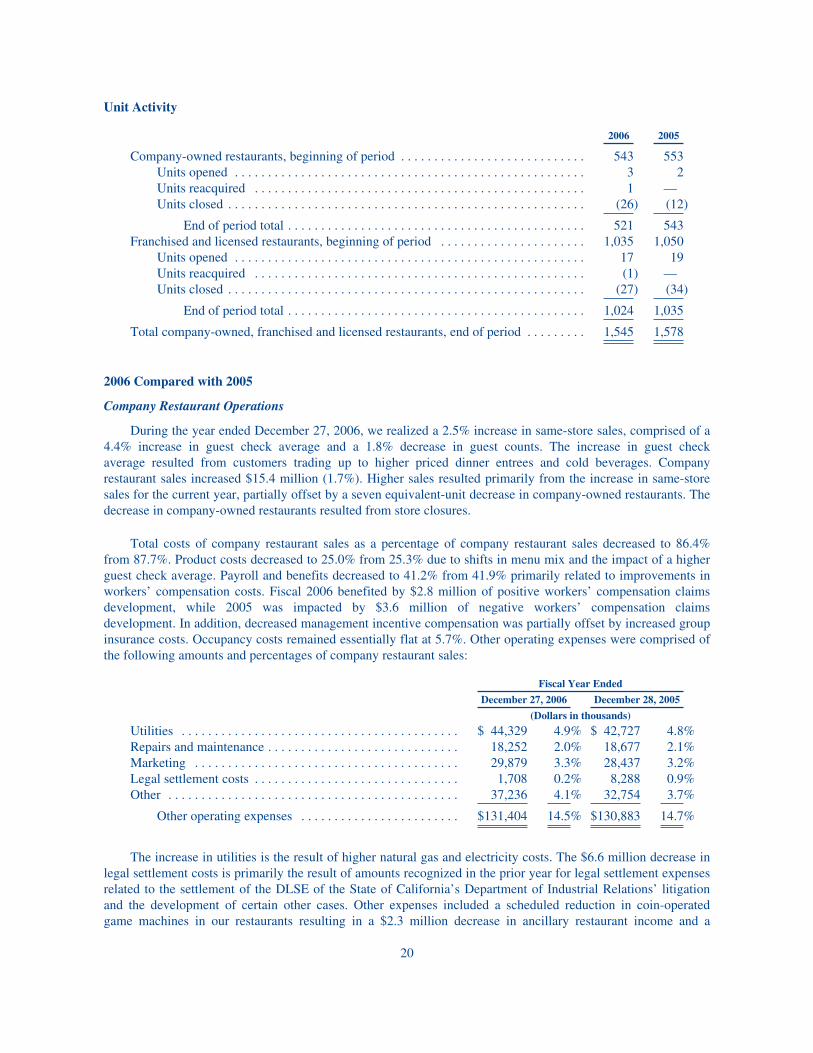
Unit Activity
2006 2005
Company-owned restaurants, beginning of period . . . . . . . . . . . . . . . . . . . . . . . . . . . . 543 553Units opened . . . . . . . . . . . . . . . . . . . . . . . . . . . . . . . . . . . . . . . . . . . . . . . . . . . . . 3 2Units reacquired . . . . . . . . . . . . . . . . . . . . . . . . . . . . . . . . . . . . . . . . . . . . . . . . . . 1 —Units closed . . . . . . . . . . . . . . . . . . . . . . . . . . . . . . . . . . . . . . . . . . . . . . . . . . . . . . (26) (12)
End of period total . . . . . . . . . . . . . . . . . . . . . . . . . . . . . . . . . . . . . . . . . . . . . 521 543Franchised and licensed restaurants, beginning of period . . . . . . . . . . . . . . . . . . . . . . 1,035 1,050
Units opened . . . . . . . . . . . . . . . . . . . . . . . . . . . . . . . . . . . . . . . . . . . . . . . . . . . . . 17 19Units reacquired . . . . . . . . . . . . . . . . . . . . . . . . . . . . . . . . . . . . . . . . . . . . . . . . . . (1) —Units closed . . . . . . . . . . . . . . . . . . . . . . . . . . . . . . . . . . . . . . . . . . . . . . . . . . . . . . (27) (34)
End of period total . . . . . . . . . . . . . . . . . . . . . . . . . . . . . . . . . . . . . . . . . . . . . 1,024 1,035
Total company-owned, franchised and licensed restaurants, end of period . . . . . . . . . 1,545 1,578
2006 Compared with 2005
Company Restaurant Operations
During the year ended December 27, 2006, we realized a 2.5% increase in same-store sales, comprised of a4.4% increase in guest check average and a 1.8% decrease in guest counts. The increase in guest checkaverage resulted from customers trading up to higher priced dinner entrees and cold beverages. Companyrestaurant sales increased $15.4 million (1.7%). Higher sales resulted primarily from the increase in same-storesales for the current year, partially offset by a seven equivalent-unit decrease in company-owned restaurants. Thedecrease in company-owned restaurants resulted from store closures.
Total costs of company restaurant sales as a percentage of company restaurant sales decreased to 86.4%from 87.7%. Product costs decreased to 25.0% from 25.3% due to shifts in menu mix and the impact of a higherguest check average. Payroll and benefits decreased to 41.2% from 41.9% primarily related to improvements inworkers’ compensation costs. Fiscal 2006 benefited by $2.8 million of positive workers’ compensation claimsdevelopment, while 2005 was impacted by $3.6 million of negative workers’ compensation claimsdevelopment. In addition, decreased management incentive compensation was partially offset by increased groupinsurance costs. Occupancy costs remained essentially flat at 5.7%. Other operating expenses were comprised ofthe following amounts and percentages of company restaurant sales:
Fiscal Year Ended
December 27, 2006 December 28, 2005
(Dollars in thousands)
Utilities . . . . . . . . . . . . . . . . . . . . . . . . . . . . . . . . . . . . . . . . . . $ 44,329 4.9% $ 42,727 4.8%Repairs and maintenance . . . . . . . . . . . . . . . . . . . . . . . . . . . . . 18,252 2.0% 18,677 2.1%Marketing . . . . . . . . . . . . . . . . . . . . . . . . . . . . . . . . . . . . . . . . 29,879 3.3% 28,437 3.2%Legal settlement costs . . . . . . . . . . . . . . . . . . . . . . . . . . . . . . . 1,708 0.2% 8,288 0.9%Other . . . . . . . . . . . . . . . . . . . . . . . . . . . . . . . . . . . . . . . . . . . . 37,236 4.1% 32,754 3.7%
Other operating expenses . . . . . . . . . . . . . . . . . . . . . . . . $131,404 14.5% $130,883 14.7%
The increase in utilities is the result of higher natural gas and electricity costs. The $6.6 million decrease inlegal settlement costs is primarily the result of amounts recognized in the prior year for legal settlement expensesrelated to the settlement of the DLSE of the State of California’s Department of Industrial Relations’ litigationand the development of certain other cases. Other expenses included a scheduled reduction in coin-operatedgame machines in our restaurants resulting in a $2.3 million decrease in ancillary restaurant income and a
20
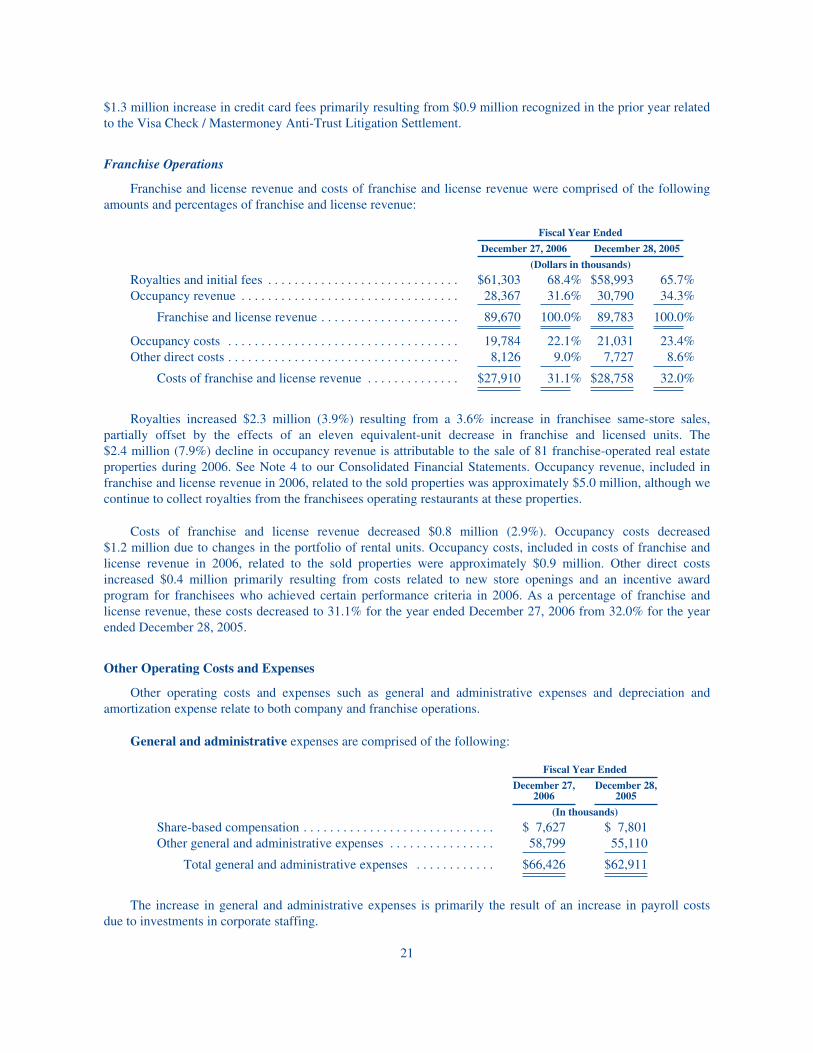
$1.3 million increase in credit card fees primarily resulting from $0.9 million recognized in the prior year relatedto the Visa Check / Mastermoney Anti-Trust Litigation Settlement.
Franchise Operations
Franchise and license revenue and costs of franchise and license revenue were comprised of the followingamounts and percentages of franchise and license revenue:
Fiscal Year Ended
December 27, 2006 December 28, 2005
(Dollars in thousands)
Royalties and initial fees . . . . . . . . . . . . . . . . . . . . . . . . . . . . . $61,303 68.4% $58,993 65.7%Occupancy revenue . . . . . . . . . . . . . . . . . . . . . . . . . . . . . . . . . 28,367 31.6% 30,790 34.3%
Franchise and license revenue . . . . . . . . . . . . . . . . . . . . . 89,670 100.0% 89,783 100.0%
Occupancy costs . . . . . . . . . . . . . . . . . . . . . . . . . . . . . . . . . . . 19,784 22.1% 21,031 23.4%Other direct costs . . . . . . . . . . . . . . . . . . . . . . . . . . . . . . . . . . . 8,126 9.0% 7,727 8.6%
Costs of franchise and license revenue . . . . . . . . . . . . . . $27,910 31.1% $28,758 32.0%
Royalties increased $2.3 million (3.9%) resulting from a 3.6% increase in franchisee same-store sales,partially offset by the effects of an eleven equivalent-unit decrease in franchise and licensed units. The$2.4 million (7.9%) decline in occupancy revenue is attributable to the sale of 81 franchise-operated real estateproperties during 2006. See Note 4 to our Consolidated Financial Statements. Occupancy revenue, included infranchise and license revenue in 2006, related to the sold properties was approximately $5.0 million, although wecontinue to collect royalties from the franchisees operating restaurants at these properties.
Costs of franchise and license revenue decreased $0.8 million (2.9%). Occupancy costs decreased$1.2 million due to changes in the portfolio of rental units. Occupancy costs, included in costs of franchise andlicense revenue in 2006, related to the sold properties were approximately $0.9 million. Other direct costsincreased $0.4 million primarily resulting from costs related to new store openings and an incentive awardprogram for franchisees who achieved certain performance criteria in 2006. As a percentage of franchise andlicense revenue, these costs decreased to 31.1% for the year ended December 27, 2006 from 32.0% for the yearended December 28, 2005.
Other Operating Costs and Expenses
Other operating costs and expenses such as general and administrative expenses and depreciation andamortization expense relate to both company and franchise operations.
General and administrative expenses are comprised of the following:
Fiscal Year Ended
December 27,2006
December 28,2005
(In thousands)
Share-based compensation . . . . . . . . . . . . . . . . . . . . . . . . . . . . . $ 7,627 $ 7,801Other general and administrative expenses . . . . . . . . . . . . . . . . 58,799 55,110
Total general and administrative expenses . . . . . . . . . . . . $66,426 $62,911
The increase in general and administrative expenses is primarily the result of an increase in payroll costsdue to investments in corporate staffing.
21
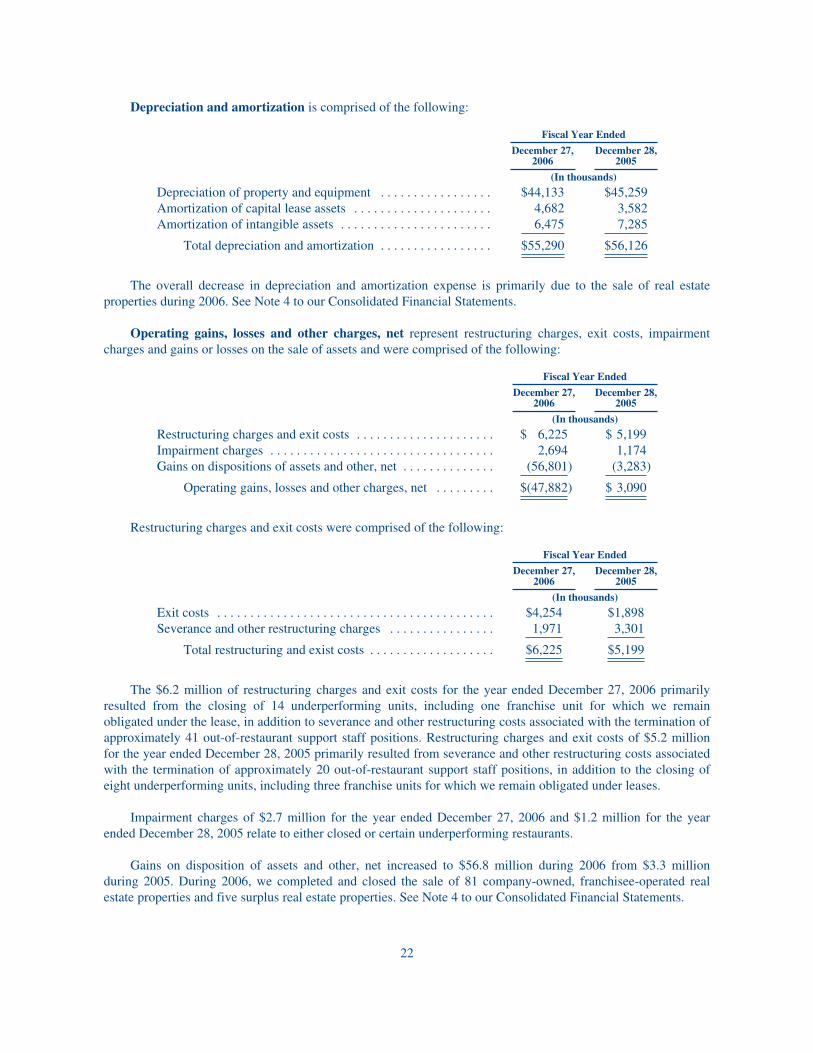
Depreciation and amortization is comprised of the following:
Fiscal Year Ended
December 27,2006
December 28,2005
(In thousands)
Depreciation of property and equipment . . . . . . . . . . . . . . . . . $44,133 $45,259Amortization of capital lease assets . . . . . . . . . . . . . . . . . . . . . 4,682 3,582Amortization of intangible assets . . . . . . . . . . . . . . . . . . . . . . . 6,475 7,285
Total depreciation and amortization . . . . . . . . . . . . . . . . . $55,290 $56,126
The overall decrease in depreciation and amortization expense is primarily due to the sale of real estateproperties during 2006. See Note 4 to our Consolidated Financial Statements.
Operating gains, losses and other charges, net represent restructuring charges, exit costs, impairmentcharges and gains or losses on the sale of assets and were comprised of the following:
Fiscal Year Ended
December 27,2006
December 28,2005
(In thousands)
Restructuring charges and exit costs . . . . . . . . . . . . . . . . . . . . . $ 6,225 $ 5,199Impairment charges . . . . . . . . . . . . . . . . . . . . . . . . . . . . . . . . . . 2,694 1,174Gains on dispositions of assets and other, net . . . . . . . . . . . . . . (56,801) (3,283)
Operating gains, losses and other charges, net . . . . . . . . . $(47,882) $ 3,090
Restructuring charges and exit costs were comprised of the following:
Fiscal Year Ended
December 27,2006
December 28,2005
(In thousands)
Exit costs . . . . . . . . . . . . . . . . . . . . . . . . . . . . . . . . . . . . . . . . . . $4,254 $1,898Severance and other restructuring charges . . . . . . . . . . . . . . . . 1,971 3,301
Total restructuring and exist costs . . . . . . . . . . . . . . . . . . . $6,225 $5,199
The $6.2 million of restructuring charges and exit costs for the year ended December 27, 2006 primarilyresulted from the closing of 14 underperforming units, including one franchise unit for which we remainobligated under the lease, in addition to severance and other restructuring costs associated with the termination ofapproximately 41 out-of-restaurant support staff positions. Restructuring charges and exit costs of $5.2 millionfor the year ended December 28, 2005 primarily resulted from severance and other restructuring costs associatedwith the termination of approximately 20 out-of-restaurant support staff positions, in addition to the closing ofeight underperforming units, including three franchise units for which we remain obligated under leases.
Impairment charges of $2.7 million for the year ended December 27, 2006 and $1.2 million for the yearended December 28, 2005 relate to either closed or certain underperforming restaurants.
Gains on disposition of assets and other, net increased to $56.8 million during 2006 from $3.3 millionduring 2005. During 2006, we completed and closed the sale of 81 company-owned, franchisee-operated realestate properties and five surplus real estate properties. See Note 4 to our Consolidated Financial Statements.
22
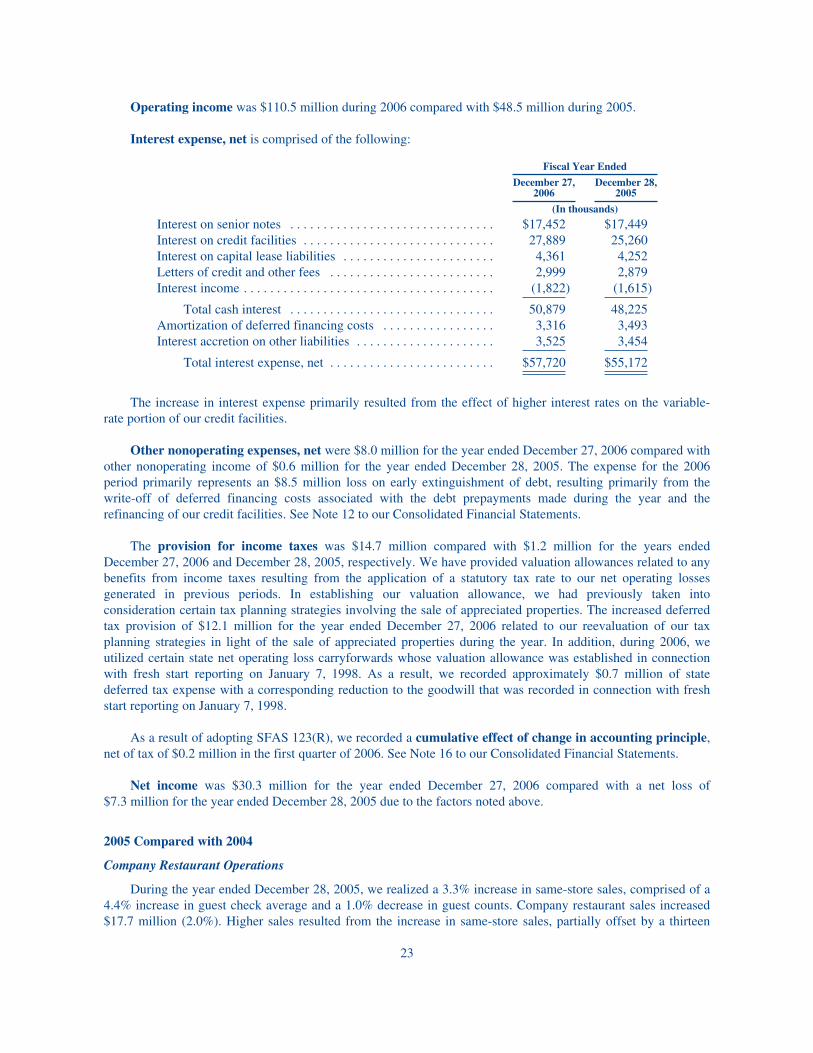
Operating income was $110.5 million during 2006 compared with $48.5 million during 2005.
Interest expense, net is comprised of the following:
Fiscal Year Ended
December 27,2006
December 28,2005
(In thousands)
Interest on senior notes . . . . . . . . . . . . . . . . . . . . . . . . . . . . . . . $17,452 $17,449Interest on credit facilities . . . . . . . . . . . . . . . . . . . . . . . . . . . . . 27,889 25,260Interest on capital lease liabilities . . . . . . . . . . . . . . . . . . . . . . . 4,361 4,252Letters of credit and other fees . . . . . . . . . . . . . . . . . . . . . . . . . 2,999 2,879Interest income . . . . . . . . . . . . . . . . . . . . . . . . . . . . . . . . . . . . . . (1,822) (1,615)
Total cash interest . . . . . . . . . . . . . . . . . . . . . . . . . . . . . . . 50,879 48,225Amortization of deferred financing costs . . . . . . . . . . . . . . . . . 3,316 3,493Interest accretion on other liabilities . . . . . . . . . . . . . . . . . . . . . 3,525 3,454
Total interest expense, net . . . . . . . . . . . . . . . . . . . . . . . . . $57,720 $55,172
The increase in interest expense primarily resulted from the effect of higher interest rates on the variable-rate portion of our credit facilities.
Other nonoperating expenses, net were $8.0 million for the year ended December 27, 2006 compared withother nonoperating income of $0.6 million for the year ended December 28, 2005. The expense for the 2006period primarily represents an $8.5 million loss on early extinguishment of debt, resulting primarily from thewrite-off of deferred financing costs associated with the debt prepayments made during the year and therefinancing of our credit facilities. See Note 12 to our Consolidated Financial Statements.
The provision for income taxes was $14.7 million compared with $1.2 million for the years endedDecember 27, 2006 and December 28, 2005, respectively. We have provided valuation allowances related to anybenefits from income taxes resulting from the application of a statutory tax rate to our net operating lossesgenerated in previous periods. In establishing our valuation allowance, we had previously taken intoconsideration certain tax planning strategies involving the sale of appreciated properties. The increased deferredtax provision of $12.1 million for the year ended December 27, 2006 related to our reevaluation of our taxplanning strategies in light of the sale of appreciated properties during the year. In addition, during 2006, weutilized certain state net operating loss carryforwards whose valuation allowance was established in connectionwith fresh start reporting on January 7, 1998. As a result, we recorded approximately $0.7 million of statedeferred tax expense with a corresponding reduction to the goodwill that was recorded in connection with freshstart reporting on January 7, 1998.
As a result of adopting SFAS 123(R), we recorded a cumulative effect of change in accounting principle,net of tax of $0.2 million in the first quarter of 2006. See Note 16 to our Consolidated Financial Statements.
Net income was $30.3 million for the year ended December 27, 2006 compared with a net loss of$7.3 million for the year ended December 28, 2005 due to the factors noted above.
2005 Compared with 2004
Company Restaurant Operations
During the year ended December 28, 2005, we realized a 3.3% increase in same-store sales, comprised of a4.4% increase in guest check average and a 1.0% decrease in guest counts. Company restaurant sales increased$17.7 million (2.0%). Higher sales resulted from the increase in same-store sales, partially offset by a thirteen
23
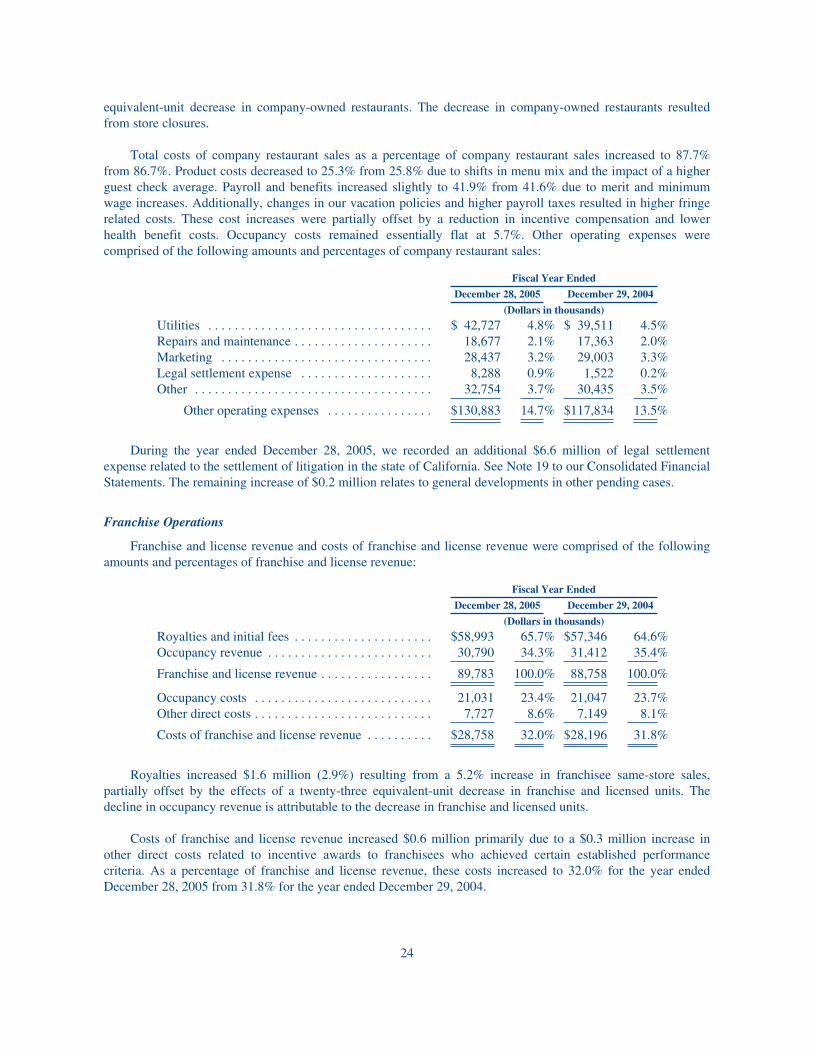
equivalent-unit decrease in company-owned restaurants. The decrease in company-owned restaurants resultedfrom store closures.
Total costs of company restaurant sales as a percentage of company restaurant sales increased to 87.7%from 86.7%. Product costs decreased to 25.3% from 25.8% due to shifts in menu mix and the impact of a higherguest check average. Payroll and benefits increased slightly to 41.9% from 41.6% due to merit and minimumwage increases. Additionally, changes in our vacation policies and higher payroll taxes resulted in higher fringerelated costs. These cost increases were partially offset by a reduction in incentive compensation and lowerhealth benefit costs. Occupancy costs remained essentially flat at 5.7%. Other operating expenses werecomprised of the following amounts and percentages of company restaurant sales:
Fiscal Year Ended
December 28, 2005 December 29, 2004
(Dollars in thousands)
Utilities . . . . . . . . . . . . . . . . . . . . . . . . . . . . . . . . . . $ 42,727 4.8% $ 39,511 4.5%Repairs and maintenance . . . . . . . . . . . . . . . . . . . . . 18,677 2.1% 17,363 2.0%Marketing . . . . . . . . . . . . . . . . . . . . . . . . . . . . . . . . 28,437 3.2% 29,003 3.3%Legal settlement expense . . . . . . . . . . . . . . . . . . . . 8,288 0.9% 1,522 0.2%Other . . . . . . . . . . . . . . . . . . . . . . . . . . . . . . . . . . . . 32,754 3.7% 30,435 3.5%
Other operating expenses . . . . . . . . . . . . . . . . $130,883 14.7% $117,834 13.5%
During the year ended December 28, 2005, we recorded an additional $6.6 million of legal settlementexpense related to the settlement of litigation in the state of California. See Note 19 to our Consolidated FinancialStatements. The remaining increase of $0.2 million relates to general developments in other pending cases.
Franchise Operations
Franchise and license revenue and costs of franchise and license revenue were comprised of the followingamounts and percentages of franchise and license revenue:
Fiscal Year Ended
December 28, 2005 December 29, 2004
(Dollars in thousands)
Royalties and initial fees . . . . . . . . . . . . . . . . . . . . . $58,993 65.7% $57,346 64.6%Occupancy revenue . . . . . . . . . . . . . . . . . . . . . . . . . 30,790 34.3% 31,412 35.4%
Franchise and license revenue . . . . . . . . . . . . . . . . . 89,783 100.0% 88,758 100.0%
Occupancy costs . . . . . . . . . . . . . . . . . . . . . . . . . . . 21,031 23.4% 21,047 23.7%Other direct costs . . . . . . . . . . . . . . . . . . . . . . . . . . . 7,727 8.6% 7,149 8.1%
Costs of franchise and license revenue . . . . . . . . . . $28,758 32.0% $28,196 31.8%
Royalties increased $1.6 million (2.9%) resulting from a 5.2% increase in franchisee same-store sales,partially offset by the effects of a twenty-three equivalent-unit decrease in franchise and licensed units. Thedecline in occupancy revenue is attributable to the decrease in franchise and licensed units.
Costs of franchise and license revenue increased $0.6 million primarily due to a $0.3 million increase inother direct costs related to incentive awards to franchisees who achieved certain established performancecriteria. As a percentage of franchise and license revenue, these costs increased to 32.0% for the year endedDecember 28, 2005 from 31.8% for the year ended December 29, 2004.
24
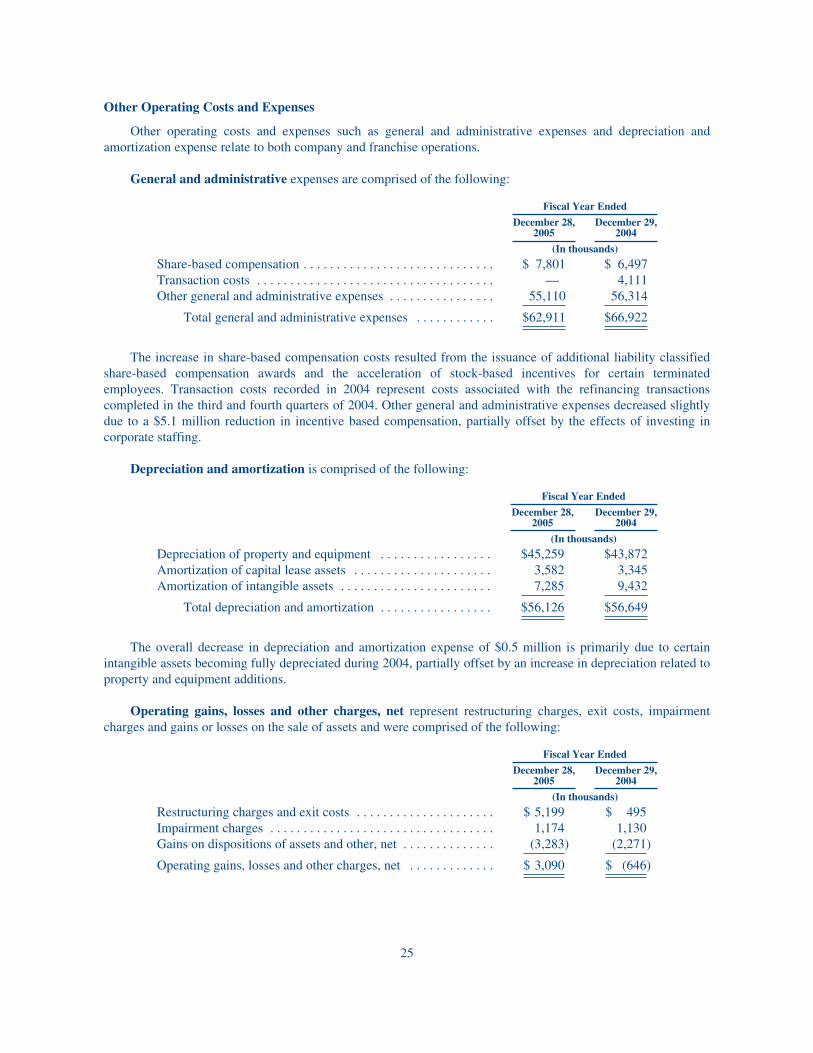
Other Operating Costs and Expenses
Other operating costs and expenses such as general and administrative expenses and depreciation andamortization expense relate to both company and franchise operations.
General and administrative expenses are comprised of the following:
Fiscal Year Ended
December 28,2005
December 29,2004
(In thousands)
Share-based compensation . . . . . . . . . . . . . . . . . . . . . . . . . . . . . $ 7,801 $ 6,497Transaction costs . . . . . . . . . . . . . . . . . . . . . . . . . . . . . . . . . . . . — 4,111Other general and administrative expenses . . . . . . . . . . . . . . . . 55,110 56,314
Total general and administrative expenses . . . . . . . . . . . . $62,911 $66,922
The increase in share-based compensation costs resulted from the issuance of additional liability classifiedshare-based compensation awards and the acceleration of stock-based incentives for certain terminatedemployees. Transaction costs recorded in 2004 represent costs associated with the refinancing transactionscompleted in the third and fourth quarters of 2004. Other general and administrative expenses decreased slightlydue to a $5.1 million reduction in incentive based compensation, partially offset by the effects of investing incorporate staffing.
Depreciation and amortization is comprised of the following:
Fiscal Year Ended
December 28,2005
December 29,2004
(In thousands)
Depreciation of property and equipment . . . . . . . . . . . . . . . . . $45,259 $43,872Amortization of capital lease assets . . . . . . . . . . . . . . . . . . . . . 3,582 3,345Amortization of intangible assets . . . . . . . . . . . . . . . . . . . . . . . 7,285 9,432
Total depreciation and amortization . . . . . . . . . . . . . . . . . $56,126 $56,649
The overall decrease in depreciation and amortization expense of $0.5 million is primarily due to certainintangible assets becoming fully depreciated during 2004, partially offset by an increase in depreciation related toproperty and equipment additions.
Operating gains, losses and other charges, net represent restructuring charges, exit costs, impairmentcharges and gains or losses on the sale of assets and were comprised of the following:
Fiscal Year Ended
December 28,2005
December 29,2004
(In thousands)
Restructuring charges and exit costs . . . . . . . . . . . . . . . . . . . . . $ 5,199 $ 495Impairment charges . . . . . . . . . . . . . . . . . . . . . . . . . . . . . . . . . . 1,174 1,130Gains on dispositions of assets and other, net . . . . . . . . . . . . . . (3,283) (2,271)
Operating gains, losses and other charges, net . . . . . . . . . . . . . $ 3,090 $ (646)
25
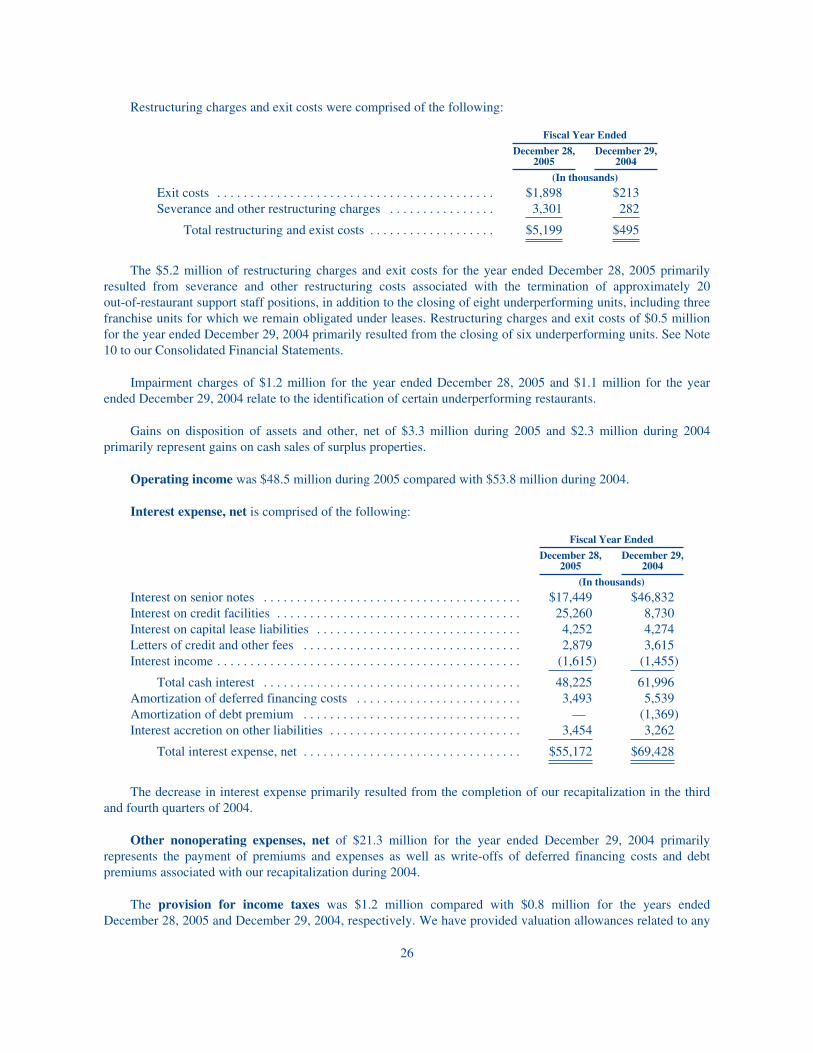
Restructuring charges and exit costs were comprised of the following:
Fiscal Year Ended
December 28,2005
December 29,2004
(In thousands)
Exit costs . . . . . . . . . . . . . . . . . . . . . . . . . . . . . . . . . . . . . . . . . . $1,898 $213Severance and other restructuring charges . . . . . . . . . . . . . . . . 3,301 282
Total restructuring and exist costs . . . . . . . . . . . . . . . . . . . $5,199 $495
The $5.2 million of restructuring charges and exit costs for the year ended December 28, 2005 primarilyresulted from severance and other restructuring costs associated with the termination of approximately 20out-of-restaurant support staff positions, in addition to the closing of eight underperforming units, including threefranchise units for which we remain obligated under leases. Restructuring charges and exit costs of $0.5 millionfor the year ended December 29, 2004 primarily resulted from the closing of six underperforming units. See Note10 to our Consolidated Financial Statements.
Impairment charges of $1.2 million for the year ended December 28, 2005 and $1.1 million for the yearended December 29, 2004 relate to the identification of certain underperforming restaurants.
Gains on disposition of assets and other, net of $3.3 million during 2005 and $2.3 million during 2004primarily represent gains on cash sales of surplus properties.
Operating income was $48.5 million during 2005 compared with $53.8 million during 2004.
Interest expense, net is comprised of the following:
Fiscal Year Ended
December 28,2005
December 29,2004
(In thousands)
Interest on senior notes . . . . . . . . . . . . . . . . . . . . . . . . . . . . . . . . . . . . . . . $17,449 $46,832Interest on credit facilities . . . . . . . . . . . . . . . . . . . . . . . . . . . . . . . . . . . . . 25,260 8,730Interest on capital lease liabilities . . . . . . . . . . . . . . . . . . . . . . . . . . . . . . . 4,252 4,274Letters of credit and other fees . . . . . . . . . . . . . . . . . . . . . . . . . . . . . . . . . 2,879 3,615Interest income . . . . . . . . . . . . . . . . . . . . . . . . . . . . . . . . . . . . . . . . . . . . . . (1,615) (1,455)
Total cash interest . . . . . . . . . . . . . . . . . . . . . . . . . . . . . . . . . . . . . . . 48,225 61,996Amortization of deferred financing costs . . . . . . . . . . . . . . . . . . . . . . . . . 3,493 5,539Amortization of debt premium . . . . . . . . . . . . . . . . . . . . . . . . . . . . . . . . . — (1,369)Interest accretion on other liabilities . . . . . . . . . . . . . . . . . . . . . . . . . . . . . 3,454 3,262
Total interest expense, net . . . . . . . . . . . . . . . . . . . . . . . . . . . . . . . . . $55,172 $69,428
The decrease in interest expense primarily resulted from the completion of our recapitalization in the thirdand fourth quarters of 2004.
Other nonoperating expenses, net of $21.3 million for the year ended December 29, 2004 primarilyrepresents the payment of premiums and expenses as well as write-offs of deferred financing costs and debtpremiums associated with our recapitalization during 2004.
The provision for income taxes was $1.2 million compared with $0.8 million for the years endedDecember 28, 2005 and December 29, 2004, respectively. We have provided valuation allowances related to any
26
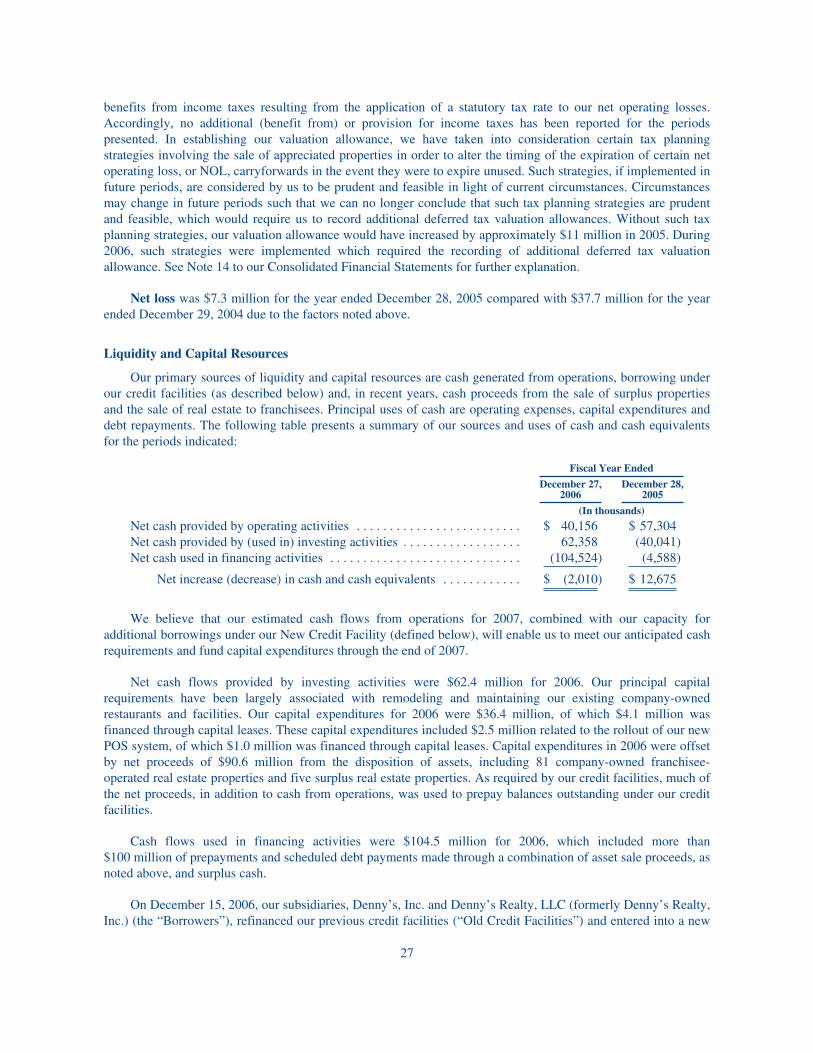
benefits from income taxes resulting from the application of a statutory tax rate to our net operating losses.Accordingly, no additional (benefit from) or provision for income taxes has been reported for the periodspresented. In establishing our valuation allowance, we have taken into consideration certain tax planningstrategies involving the sale of appreciated properties in order to alter the timing of the expiration of certain netoperating loss, or NOL, carryforwards in the event they were to expire unused. Such strategies, if implemented infuture periods, are considered by us to be prudent and feasible in light of current circumstances. Circumstancesmay change in future periods such that we can no longer conclude that such tax planning strategies are prudentand feasible, which would require us to record additional deferred tax valuation allowances. Without such taxplanning strategies, our valuation allowance would have increased by approximately $11 million in 2005. During2006, such strategies were implemented which required the recording of additional deferred tax valuationallowance. See Note 14 to our Consolidated Financial Statements for further explanation.
Net loss was $7.3 million for the year ended December 28, 2005 compared with $37.7 million for the yearended December 29, 2004 due to the factors noted above.
Liquidity and Capital Resources
Our primary sources of liquidity and capital resources are cash generated from operations, borrowing underour credit facilities (as described below) and, in recent years, cash proceeds from the sale of surplus propertiesand the sale of real estate to franchisees. Principal uses of cash are operating expenses, capital expenditures anddebt repayments. The following table presents a summary of our sources and uses of cash and cash equivalentsfor the periods indicated:
Fiscal Year Ended
December 27,2006
December 28,2005
(In thousands)
Net cash provided by operating activities . . . . . . . . . . . . . . . . . . . . . . . . . $ 40,156 $ 57,304Net cash provided by (used in) investing activities . . . . . . . . . . . . . . . . . . 62,358 (40,041)Net cash used in financing activities . . . . . . . . . . . . . . . . . . . . . . . . . . . . . (104,524) (4,588)
Net increase (decrease) in cash and cash equivalents . . . . . . . . . . . . $ (2,010) $ 12,675
We believe that our estimated cash flows from operations for 2007, combined with our capacity foradditional borrowings under our New Credit Facility (defined below), will enable us to meet our anticipated cashrequirements and fund capital expenditures through the end of 2007.
Net cash flows provided by investing activities were $62.4 million for 2006. Our principal capitalrequirements have been largely associated with remodeling and maintaining our existing company-ownedrestaurants and facilities. Our capital expenditures for 2006 were $36.4 million, of which $4.1 million wasfinanced through capital leases. These capital expenditures included $2.5 million related to the rollout of our newPOS system, of which $1.0 million was financed through capital leases. Capital expenditures in 2006 were offsetby net proceeds of $90.6 million from the disposition of assets, including 81 company-owned franchisee-operated real estate properties and five surplus real estate properties. As required by our credit facilities, much ofthe net proceeds, in addition to cash from operations, was used to prepay balances outstanding under our creditfacilities.
Cash flows used in financing activities were $104.5 million for 2006, which included more than$100 million of prepayments and scheduled debt payments made through a combination of asset sale proceeds, asnoted above, and surplus cash.
On December 15, 2006, our subsidiaries, Denny’s, Inc. and Denny’s Realty, LLC (formerly Denny’s Realty,Inc.) (the “Borrowers”), refinanced our previous credit facilities (“Old Credit Facilities”) and entered into a new
27
senior secured credit agreement in an aggregate principal amount of $350 million. The new credit facilityconsists of a $50 million revolving credit facility (including a $10 million revolving letter of credit facility), a$260 million term loan and an additional $40 million letter of credit facility (together, the “New Credit Facility”).The revolving facility matures on December 15, 2011. The term loan and the $40 million letter of credit facilitymatures on March 31, 2012. The term loan amortizes in equal quarterly installments at a rate equal toapproximately 1% per annum with all remaining amounts due on the maturity date. The New Credit Facility isavailable for working capital, capital expenditures and other general corporate purposes. We will be required tomake mandatory prepayments under certain circumstances (such as the sale of specified properties) and maymake certain optional prepayments under the New Credit Facility.
The New Credit Facility is guaranteed by Denny’s and its other subsidiaries and is secured by substantiallyall of the assets of Denny’s and its subsidiaries. In addition, the New Credit Facility is secured by first-prioritymortgages on 140 company-owned real estate assets. The New Credit Facility contains certain financialcovenants (i.e., maximum total debt to EBITDA (as defined under the New Credit Facility) ratio requirements,maximum senior secured debt to EBITDA ratio requirements, minimum fixed charge coverage ratiorequirements and limitations on capital expenditures), negative covenants, conditions precedent, material adversechange provisions, events of default and other terms, conditions and provisions customarily found in creditagreements for facilities and transactions of this type. These covenants are substantially similar to those that werecontained in the Old Credit Facilities. We were in compliance with the terms of the New Credit Facility as ofDecember 27, 2006.
Interest on loans under the new revolving facility will be payable, initially, at per annum rates equal toLIBOR plus 250 basis points and will adjust over time based on our leverage ratio. Interest on the new term loanand letter of credit facility will be payable at per annum rates equal to LIBOR plus 225 basis points. Theweighted-average interest rate under the term loan was 7.60% as of December 27, 2006. The weighted averageinterest rate under the first lien facility and the second lien facility was 7.30% and 9.39%, respectively, as ofDecember 28, 2005.
Effective March 8, 2007, we amended the New Credit Facility to reduce the per annum interest rate on theterm loan and letter of credit facility to LIBOR plus 200 basis points. Upon the event of a refinancing transaction,under certain circumstances within one year of the amendment, we would be required to pay the term loan andletter of credit facility lenders a 1.0% prepayment premium in the transaction.
As a result of the prepayments noted above and the debt refinancing, we recorded $8.5 million of losseson early extinguishment of debt resulting primarily from the write-off of deferred financing costs. These lossesare included as a component of other nonoperating expense in the Consolidated Statements of Operations.
28
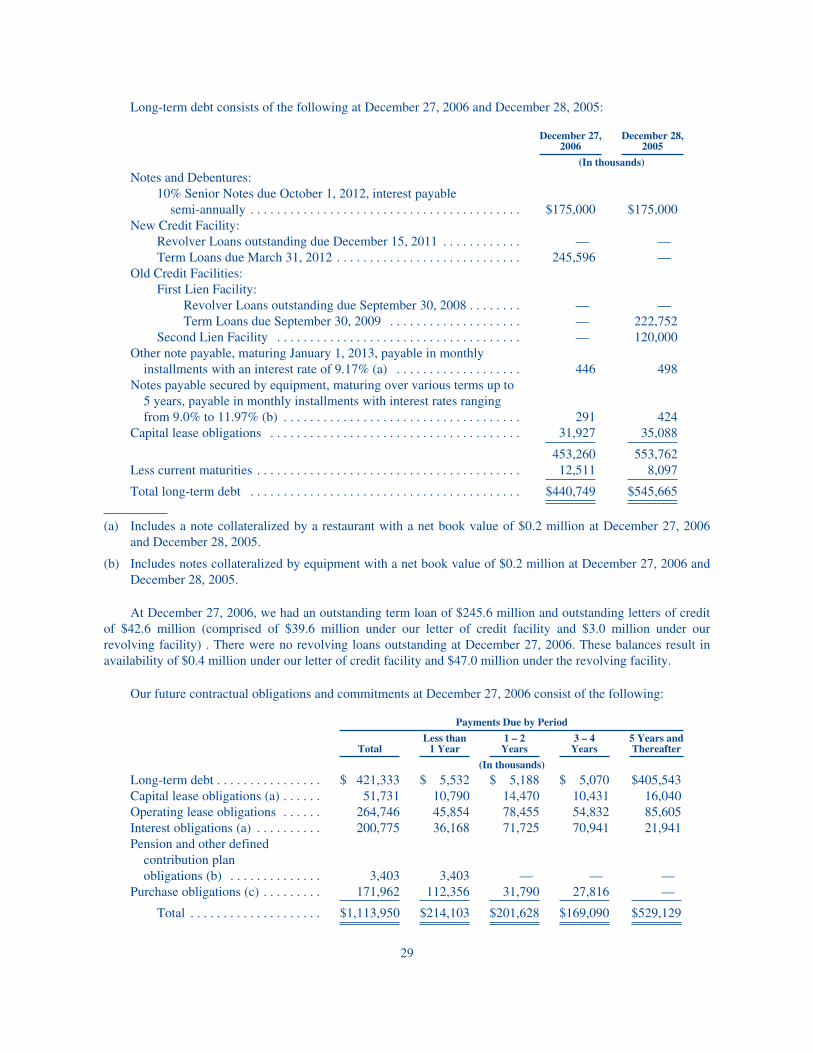
Long-term debt consists of the following at December 27, 2006 and December 28, 2005:
December 27,2006
December 28,2005
(In thousands)
Notes and Debentures:10% Senior Notes due October 1, 2012, interest payable
semi-annually . . . . . . . . . . . . . . . . . . . . . . . . . . . . . . . . . . . . . . . . . $175,000 $175,000New Credit Facility:
Revolver Loans outstanding due December 15, 2011 . . . . . . . . . . . . — —Term Loans due March 31, 2012 . . . . . . . . . . . . . . . . . . . . . . . . . . . . 245,596 —
Old Credit Facilities:First Lien Facility:
Revolver Loans outstanding due September 30, 2008 . . . . . . . . — —Term Loans due September 30, 2009 . . . . . . . . . . . . . . . . . . . . — 222,752
Second Lien Facility . . . . . . . . . . . . . . . . . . . . . . . . . . . . . . . . . . . . . — 120,000Other note payable, maturing January 1, 2013, payable in monthly
installments with an interest rate of 9.17% (a) . . . . . . . . . . . . . . . . . . . 446 498Notes payable secured by equipment, maturing over various terms up to
5 years, payable in monthly installments with interest rates rangingfrom 9.0% to 11.97% (b) . . . . . . . . . . . . . . . . . . . . . . . . . . . . . . . . . . . . 291 424
Capital lease obligations . . . . . . . . . . . . . . . . . . . . . . . . . . . . . . . . . . . . . . 31,927 35,088
453,260 553,762Less current maturities . . . . . . . . . . . . . . . . . . . . . . . . . . . . . . . . . . . . . . . . 12,511 8,097
Total long-term debt . . . . . . . . . . . . . . . . . . . . . . . . . . . . . . . . . . . . . . . . . $440,749 $545,665
(a) Includes a note collateralized by a restaurant with a net book value of $0.2 million at December 27, 2006and December 28, 2005.
(b) Includes notes collateralized by equipment with a net book value of $0.2 million at December 27, 2006 andDecember 28, 2005.
At December 27, 2006, we had an outstanding term loan of $245.6 million and outstanding letters of creditof $42.6 million (comprised of $39.6 million under our letter of credit facility and $3.0 million under ourrevolving facility) . There were no revolving loans outstanding at December 27, 2006. These balances result inavailability of $0.4 million under our letter of credit facility and $47.0 million under the revolving facility.
Our future contractual obligations and commitments at December 27, 2006 consist of the following:
Payments Due by Period
TotalLess than
1 Year1 – 2Years
3 – 4Years
5 Years andThereafter
(In thousands)
Long-term debt . . . . . . . . . . . . . . . . $ 421,333 $ 5,532 $ 5,188 $ 5,070 $405,543Capital lease obligations (a) . . . . . . 51,731 10,790 14,470 10,431 16,040Operating lease obligations . . . . . . 264,746 45,854 78,455 54,832 85,605Interest obligations (a) . . . . . . . . . . 200,775 36,168 71,725 70,941 21,941Pension and other defined
contribution planobligations (b) . . . . . . . . . . . . . . 3,403 3,403 — — —
Purchase obligations (c) . . . . . . . . . 171,962 112,356 31,790 27,816 —
Total . . . . . . . . . . . . . . . . . . . . $1,113,950 $214,103 $201,628 $169,090 $529,129
29
(a) Interest obligations represent payments related to our long-term debt outstanding at December 27, 2006. Forlong-term debt with variable rates, we have used the rate applicable at December 27, 2006 to project interestover the periods presented in the table above. See Note 12 to our Consolidated Financial Statements forbalances and terms of the New Credit Facility and the 10% Notes due 2012 (the “10% Notes) atDecember 27, 2006. The capital lease obligation amounts above are inclusive of interest.
(b) Pension and other defined contribution plan obligations are estimates based on facts and circumstances atDecember 27, 2006. Amounts cannot currently be estimated for more than one year. See Note 13 to ourConsolidated Financial Statements.
(c) Purchase obligations include amounts payable under purchase contracts for food and non-food products. Inmost cases, these agreements do not obligate us to purchase any specific volumes, and include provisionsthat would allow us to cancel such agreements with appropriate notice. Amounts included in the table aboverepresent our estimate of purchase obligations during the periods presented, if we were to cancel thesecontracts with appropriate notice. We would likely take delivery of goods under such circumstances.
At December 27, 2006, our working capital deficit was $73.0 million compared with $86.8 million atDecember 28, 2005. The working capital deficit decrease of $13.8 million resulted primarily from a decrease inlitigation reserves of approximately $5.3 million and a decrease in accrued interest of approximately $3.4 milliondue to our debt refinancing during fiscal 2006. We are able to operate with a substantial working capital deficitbecause (1) restaurant operations and most food service operations are conducted primarily on a cash (and cashequivalent) basis with a low level of accounts receivable, (2) rapid turnover allows a limited investment ininventories, and (3) accounts payable for food, beverages and supplies usually become due after the receipt ofcash from the related sales.
Off-Balance Sheet Arrangements
In January 2005, we entered into an interest rate swap with a notional amount of $75 million to hedge aportion of the cash flows of our previous floating rate term loan debt. We designated the interest rate swap as acash flow hedge of our exposure to variability in future cash flows attributable to payments of LIBOR plus afixed 3.25% spread due on a related $75 million notional debt obligation under the previous term loan facility.Under the terms of the swap, we paid a fixed rate of 3.76% on the $75 million notional amount and receivedpayments from a counterparty based on the 3-month LIBOR rate for a term ending on September 30, 2007.Interest rate differentials paid or received under the swap agreement were recognized as adjustments to interestexpense. To the extent the swap was effective in offsetting the variability of the hedged cash flows, changes inthe fair value of the swap were not included in current earnings but were reported as other comprehensive income(loss). See Note 12 to our Consolidated Financial Statements.
As a result of the extinguishment of a portion of our debt on December 15, 2006, we discontinued hedgeaccounting treatment related to the interest rate swap. The interest rate swap was sold for a cash price of$1.1 million, resulting in a gain of $0.9 million, which was recognized as a component of other nonoperatingexpense in the Consolidated Statements of Operations.
Critical Accounting Policies and Estimates
Our discussion and analysis of our financial condition and results of operations are based upon ourConsolidated Financial Statements, which have been prepared in accordance with U.S. generally acceptedaccounting principles. The preparation of these financial statements requires us to make estimates and judgmentsthat affect the reported amounts of assets, liabilities, revenues and expenses, and related disclosure of contingentassets and liabilities. On an ongoing basis, we evaluate our estimates, including those related to self-insuranceliabilities, impairment of long-lived assets, and restructuring and exit costs. We base our estimates on historicalexperience and on various other assumptions that we believe to be reasonable under the circumstances, theresults of which form the basis for making judgments about the carrying values of assets and liabilities that are
30
not readily apparent from other sources. Actual results may differ from these estimates under differentassumptions or conditions; however, we believe that our estimates, including those for the above-describeditems, are reasonable.
We believe the following critical accounting policies affect our more significant judgments and estimatesused in the preparation of our Consolidated Financial Statements:
Self-insurance liabilities. We record liabilities for insurance claims during periods in which we have beeninsured under large deductible programs or have been self-insured for our medical and dental claims andworkers’ compensation, general/product and automobile insurance liabilities. Maximum self-insured retention,including defense costs per occurrence, ranges from $0.5 to $1.0 million per individual claim for workers’compensation and for general/product and automobile liability. The liabilities for prior and current estimatedincurred losses are discounted to their present value based on expected loss payment patterns determined byindependent actuaries, using our actual historical payments. These estimates include assumptions regardingclaims frequency and severity as well as changes in our business environment, medical costs and the regulatoryenvironment that could impact our overall self-insurance costs.
Total discounted insurance liabilities at December 27, 2006 and December 28, 2005 were $41.0 million and$42.4 million, respectively, reflecting a 5% discount rate. The related undiscounted amounts at such dates were$46.4 million and $48.4 million, respectively.
Impairment of long-lived assets. We evaluate our long-lived assets for impairment at the restaurant level ona quarterly basis or whenever changes or events indicate that the carrying value may not be recoverable. Weassess impairment of restaurant-level assets based on the operating cash flows of the restaurant and our plans forrestaurant closings. Generally, all units with negative cash flows from operations for the most recent twelvemonths at each quarter end are included in our assessment. In performing our assessment, we must makeassumptions regarding estimated future cash flows, including estimated proceeds from similar asset sales, andother factors to determine both the recoverability and the estimated fair value of the respective assets. If the long-lived assets of a restaurant are not recoverable based upon estimated future, undiscounted cash flows, we writethe assets down to their fair value. If these estimates or their related assumptions change in the future, we may berequired to record additional impairment charges.
During 2006, 2005 and 2004, we recorded impairment charges of $2.7 million, $1.2 million and$1.1 million, respectively, for underperforming restaurants, including restaurants closed. These charges areincluded as a component of operating gains, losses and other charges, net in the Consolidated Statements ofOperations. At December 27, 2006, we had a total of four restaurants with an aggregate net book value ofapproximately $0.7 million, after taking into consideration impairment charges recorded, which had negativecash flows from operations for the most recent twelve months.
Restructuring and exit costs. As a result of changes in our organizational structure and in our portfolio ofrestaurants, we have recorded charges for restructuring and exit costs. These costs consist primarily of the costsof future obligations related to closed units and severance and outplacement costs for terminated employees.These costs are included as a component of operating gains, losses and other charges, net in the ConsolidatedStatements of Operations.
Discounted liabilities for future lease costs and the fair value of related subleases of closed units arerecorded when the units are closed. All other costs related to closed units are expensed as incurred. In assessingthe discounted liabilities for future costs of obligations related to closed units, we make assumptions regardingamounts of future subleases. If these assumptions or their related estimates change in the future, we may berequired to record additional exit costs or reduce exit costs previously recorded. Exit costs recorded for each ofthe periods presented include the effect of such changes in estimates.
31
The most significant estimate included in our accrued exit costs liabilities relates to the timing and amountof estimated subleases. At December 27, 2006, our total discounted liability for closed units was approximately$11.9 million, net of $7.7 million related to existing sublease agreements and $3.8 million related to propertiesfor which we expect to enter into sublease agreements in the future. If any of the estimates noted above or theirrelated assumptions change in the future, we may be required to record additional exit costs or reduce exit costspreviously recorded. See Note 10 to our Consolidated Financial Statements.
Implementation of New Accounting Standards
Effective December 29, 2005, the first day of fiscal 2006, we adopted Statement of Financial AccountingStandards No. 123 (revised 2004) “Share-Based Payment (“SFAS 123(R)”) . This standard requires all share-based compensation to be recognized in the statement of operations based on fair value and applies to all awardsgranted, modified, cancelled or repurchased after the effective date. Additionally, for awards outstanding as ofDecember 29, 2005 for which the requisite service has not been rendered, compensation expense will berecognized as the requisite service is rendered. The statement also requires the benefits of tax deductions inexcess of recognized compensation cost to be reported as a financing cash flow, rather than as an operating cashflow. We adopted this accounting treatment using the modified-prospective-transition method, therefore resultsfor prior periods have not been restated. SFAS 123(R) supersedes SFAS 123, “Accounting for Stock BasedCompensation,” or SFAS No. 123, which had allowed companies to choose between expensing stock options orshowing pro forma disclosure only.
In September 2006, the Financial Accounting Standards Board (“FASB”) issued Statement of FinancialAccounting Standards No. 158 (“SFAS 158”), “Employer’s Accounting for Defined Benefit Pension and OtherPostretirement Plans—an amendment of FASB Statements No. 87, 88, 106, and 132(R)”. SFAS 158 requiresrecognition of the overfunded or underfunded status of defined benefit postretirement plans as an asset or liabilityin the statement of financial position and recognition of changes in that funded status in comprehensive incomein the year in which the changes occur. SFAS 158 also requires measurement of the funded status of a plan as ofthe date of the statement of financial position. SFAS 158 is effective for recognition of the funded status of thebenefit plans for fiscal years ending after December 15, 2006 and is effective for the measurement dateprovisions for fiscal years ending after December 15, 2008. We adopted the recognition of the funded status andchanges in the funded status of our benefit plans in the fourth quarter of 2006. The adoption had no impact on ourConsolidated Balance Sheet or Statement of Shareholders’ Deficit.
In September 2006, the FASB issued Statement of Financial Accounting Standards No. 157 (“SFAS 157”),“Fair Value Measurements.” SFAS 157 defines fair value, establishes a framework for measuring fair value ingenerally accepted accounting principles, and expands disclosures about fair value measurements. SFAS 157applies under other accounting pronouncements that require or permit fair value measurements, the FASB havingpreviously concluded in those accounting pronouncements that fair value is the relevant measurement attribute.Accordingly, SFAS 157 does not require any new fair value measurements. SFAS No. 157 is effective for thefirst fiscal period beginning after November 15, 2007. We are required to adopt SFAS 157 in the first quarter offiscal 2008. We are currently evaluating the impact of adopting SFAS 157 on the disclosures in our ConsolidatedFinancial Statements.
In September 2006, the Securities and Exchange Commission issued Staff Accounting Bulletin No. 108(“SAB 108”), “Considering the Effects of Prior Year Misstatements when Quantifying Misstatements in CurrentYear Financial Statements,” which provides interpretive guidance on the consideration of the effects of prior yearmisstatements in quantifying current year misstatements for the purpose of a materiality assessment. SAB 108requires registrants to quantify misstatements using both the balance sheet and income statement approaches andto evaluate whether either approach results in quantifying an error that is material based on relevant quantitativeand qualitative factors. We adopted the guidance in the fourth quarter of fiscal 2006. The adoption of SAB 108did not have an impact on our Consolidated Financial Statements.
32
In July 2006, the FASB issued FASB Interpretation No. (“FIN”) 48 “Accounting for Uncertainty in IncomeTaxes,” which clarifies the accounting for uncertainty in income tax recognized in an entity’s financialstatements in accordance with Statement of Financial Accounting Standards No. 109 “Accounting for IncomeTaxes.” FIN 48 requires companies to determine whether it is more-likely-than-not that a tax position will besustained upon examination by the appropriate taxing authorities before any part of the benefit can be recorded inthe financial statements. This interpretation also provides guidance on derecognition, classification, accounting ininterim periods, and expanded disclosure requirements. The provisions of FIN 48 are effective for fiscal yearsbeginning after December 15, 2006, with the cumulative effect of the change in accounting principle recorded asan adjustment to opening retained earnings. We are currently evaluating the impact of adopting FIN 48 on ourfinancial statements; however, we do not expect the impact to be significant.
In June 2006, the Emerging Issues Task Force (“EITF”) ratified EITF Issue 06-3, “How Taxes CollectedFrom Customers and Remitted to Governmental Authorities Should Be Presented in the Income Statement (ThatIs, Gross versus Net Presentation).” A consensus was reached that entities may adopt a policy of presenting taxesin the income statement on either a gross or net basis. An entity should disclose its policy of presenting taxes andthe amount of any taxes presented on a gross basis should be disclosed, if significant. The guidance is effectivefor periods beginning after December 15, 2006. We present sales net of sales taxes. EITF 06-3 does not impactthe method for recording these sales taxes in our Consolidated Financial Statements.
Other accounting standards that have been issued or proposed by the FASB or other standards-setting bodiesthat do not require adoption until a future date are not expected to have a material impact on the ConsolidatedFinancial Statements upon adoption.
Item 7A. Quantitative and Qualitative Disclosures About Market Risk
Interest Rate Risk
We have exposure to interest rate risk related to certain instruments entered into for other than tradingpurposes. Specifically, borrowings under the term loan and revolving credit facility bear interest at a variable ratebased on LIBOR (LIBOR rate plus 2.25% for the term loan and letter of credit facility and LIBOR rate plus2.50% for the revolving credit facility; effective March 8, 2007, LIBOR plus 2.00% for the term loan and letterof credit facility).
In January 2005, we entered into an interest rate swap with a notional amount of $75 million to hedge aportion of the cash flows of our previous floating rate term loan debt. We designated the interest rate swap as acash flow hedge of our exposure to variability in future cash flows attributable to payments of LIBOR plus afixed 3.25% spread due on a related $75 million notional debt obligation under the previous term loan facility.Under the terms of the swap, we paid a fixed rate of 3.76% on the $75 million notional amount and receivedpayments from a counterparty based on the 3-month LIBOR rate for a term ending on September 30, 2007. Theswap effectively increased our ratio of fixed rate debt to total debt. On December 15, 2006, we refinanced theOld Credit Facilities containing the $75 million notional amount hedged and we sold the interest rate swap. As aresult of the extinguishment of debt, we are required to discontinue hedge accounting. The amountpreviously included as other comprehensive income (loss) was recognized as a component of other nonoperatingexpense in the Consolidated Statements of Operations for the year ended December 27, 2006.
Based on the levels of borrowings under the New Credit Facility at December 27, 2006, if interest rateschanged by 100 basis points our annual cash flow and income before income taxes would change byapproximately $2.5 million. This computation is determined by considering the impact of hypothetical interestrates on the variable rate portion of the New Credit Facility at December 27, 2006. However, the nature andamount of our borrowings under the New Credit Facility may vary as a result of future business requirements,market conditions and other factors.
33
Our other outstanding long-term debt bears fixed rates of interest. The estimated fair value of our fixed ratelong-term debt (excluding capital lease obligations and revolving credit facility advances) was approximately$184.5 million compared with a book value of $175.7 million, at December 27, 2006. This computation is basedon market quotations for the same or similar debt issues or the estimated borrowing rates available to us.Specifically, the difference between the estimated fair value of long-term debt compared with its historical costreported in our Consolidated Balance Sheets at December 27, 2006 relates primarily to market quotations for our10% Notes. See Note 12 to our Consolidated Financial Statements.
We also have exposure to interest rate risk related to our pension plan, other defined benefit plans, and self-insurance liabilities. A 25 basis point increase in discount rate would reduce our projected benefit obligationrelated to our pension plan and other defined benefit plans by $1.9 million and $0.1 million, respectively, andreduce our net periodic benefit cost related to our pension plan by $0.1 million. A 25 basis point decrease indiscount rate would increase our projected benefit obligation related to our pension plan and other defined benefitplans by $2.0 million and $0.1 million, respectively, and increase our net periodic benefit cost related to ourpension plan by $0.1 million. The impact of a 25 basis point increase or decrease in discount rate on periodicbenefit costs related our other defined benefit plans would be less than $0.1 million. A 25 basis point increase ordecrease in discount rate related to our self-insurance liabilities would result in a decrease or increase of$0.2 million, respectively.
Commodity Price Risk
We purchase certain food products such as beef, poultry, pork, eggs and coffee, and utilities such as gas andelectricity, which are affected by commodity pricing and are, therefore, subject to price volatility caused byweather, production problems, delivery difficulties and other factors that are outside our control and which aregenerally unpredictable. Changes in commodity prices affect us and our competitors generally and oftensimultaneously. In general, we purchase food products and utilities based upon market prices established withvendors. Although many of the items purchased are subject to changes in commodity prices, approximately 50%of our purchasing arrangements are structured to contain features that minimize price volatility by establishingprice ceilings and/or floors. We use these types of purchase arrangements to control costs as an alternative tousing financial instruments to hedge commodity prices. We have determined that our purchasing agreements donot qualify as derivative financial instruments or contain embedded derivative instruments. In many cases, webelieve we will be able to address commodity cost increases which are significant and appear to be long-term innature by adjusting our menu pricing or changing our product delivery strategy. However, competitivecircumstances could limit such actions and, in those circumstances, increases in commodity prices could lowerour margins. Because of the often short-term nature of commodity pricing aberrations and our ability to changemenu pricing or product delivery strategies in response to commodity price increases, we believe that the impactof commodity price risk is not significant.
We have established a policy to identify, control and manage market risks which may arise from changes ininterest rates, commodity prices and other relevant rates and prices. We do not use derivative instruments fortrading purposes.
Item 8. Financial Statements and Supplementary Data
See Index to Financial Statements which appears on page F-1 herein.
Item 9. Changes in and Disagreements with Accountants on Accounting and Financial Disclosure
None.
34
Item 9A. Controls and Procedures
A. Disclosure Controls and Procedures. As required by Rule 13a-15(b) under the Securities Exchange Actof 1934, as amended, (the “Exchange Act”) our management conducted an evaluation (under the supervision andwith the participation of our President and Chief Executive Officer, Nelson J. Marchioli, and our Executive VicePresident, Growth Initiatives and Chief Financial Officer, F. Mark Wolfinger) as of the end of the period coveredby this Annual Report on Form 10-K, of the effectiveness of our disclosure controls and procedures as defined inRules 13a-15(e) and 15d-15(e) under the Exchange Act. Based on that evaluation, Messrs. Marchioli andWolfinger each concluded that our disclosure controls and procedures are effective to ensure that informationrequired to be disclosed in the reports that we file or submit under the Exchange Act, is recorded, processed,summarized and reported within the time periods specified in the Securities and Exchange Commission’s rulesand forms.
B. Management’s Report on Internal Control Over Financial Reporting. Our management is responsible forestablishing and maintaining adequate internal control over financial reporting, as such term is defined inExchange Act Rules 13a-15(f) and 15d-15(f). Our internal control system is designed to provide reasonableassurance to our management and Board of Directors regarding the preparation and fair presentation of publishedfinancial statements. Because of its inherent limitations, internal control over financial reporting may not preventor detect misstatements. Also, projections of any evaluation of effectiveness to future periods are subject to therisk that controls may become inadequate because of changes in conditions, or that the degree of compliance withthe policies or procedures may deteriorate.
Management has assessed the effectiveness of our internal control over financial reporting as ofDecember 27, 2006. Management’s assessment was based on criteria set forth in Internal Control—IntegratedFramework, issued by the Committee of Sponsoring Organizations of the Treadway Commission (COSO). Basedupon this assessment, management concluded that, as of December 27, 2006, our internal control over financialreporting was effective, based upon those criteria.
The Company’s independent registered public accounting firm, KPMG LLP, has issued an attestation reporton management’s assessment of our internal control over financial reporting, which follows this report.
C. Changes in Internal Control Over Financial Reporting. There have been no changes in our internalcontrol over financial reporting identified in connection with the evaluation required by Rule 13a-15(d) of theExchange Act that occurred during our last fiscal quarter (our fourth fiscal quarter) that have materially affected,or are reasonably likely to materially affect, our internal control over financial reporting.
35
Report of Independent Registered Public Accounting Firm
The Board of DirectorsDenny’s Corporation:
We have audited management’s assessment, included in the accompanying Management’s Report onInternal Control Over Financial Reporting (Item 9A.B.), that Denny’s Corporation’s (the Company) internalcontrol over financial reporting was effective as of December 27, 2006, based on criteria established in InternalControl—Integrated Framework issued by the Committee of Sponsoring Organizations of the TreadwayCommission (COSO). The Company’s management is responsible for maintaining effective internal control overfinancial reporting and for its assessment of the effectiveness of internal control over financial reporting. Ourresponsibility is to express an opinion on management’s assessment and an opinion on the effectiveness of theCompany’s internal control over financial reporting based on our audit.
We conducted our audit in accordance with the standards of the Public Company Accounting OversightBoard (United States). Those standards require that we plan and perform the audit to obtain reasonable assuranceabout whether effective internal control over financial reporting was maintained in all material respects. Ouraudit included obtaining an understanding of internal control over financial reporting, evaluating management’sassessment, testing and evaluating the design and operating effectiveness of internal control, and performing suchother procedures as we considered necessary in the circumstances. We believe that our audit provides areasonable basis for our opinion.
A company’s internal control over financial reporting is a process designed to provide reasonable assuranceregarding the reliability of financial reporting and the preparation of financial statements for external purposes inaccordance with generally accepted accounting principles. A company’s internal control over financial reportingincludes those policies and procedures that (1) pertain to the maintenance of records that, in reasonable detail,accurately and fairly reflect the transactions and dispositions of the assets of the company; (2) provide reasonableassurance that transactions are recorded as necessary to permit preparation of financial statements in accordancewith generally accepted accounting principles, and that receipts and expenditures of the company are being madeonly in accordance with authorizations of management and directors of the company; and (3) provide reasonableassurance regarding prevention or timely detection of unauthorized acquisition, use, or disposition of thecompany’s assets that could have a material effect on the financial statements.
Because of its inherent limitations, internal control over financial reporting may not prevent or detectmisstatements. Also, projections of any evaluation of effectiveness to future periods are subject to the risk thatcontrols may become inadequate because of changes in conditions, or that the degree of compliance with thepolicies or procedures may deteriorate.
In our opinion, management’s assessment that Denny’s Corporation maintained effective internal controlover financial reporting as of December 27, 2006, is fairly stated, in all material respects, based on criteriaestablished in Internal Control—Integrated Framework issued by the Committee of Sponsoring Organizations ofthe Treadway Commission (COSO). Also, in our opinion, Denny’s Corporation maintained, in all materialrespects, effective internal control over financial reporting as of December 27, 2006, based on criteria establishedin Internal Control—Integrated Framework issued by the Committee of Sponsoring Organizations of theTreadway Commission (COSO).
We also have audited, in accordance with the standards of the Public Company Accounting Oversight Board(United States), the consolidated balance sheets of Denny’s Corporation and subsidiaries as of December 27,2006 and December 28, 2005, and the related consolidated statements of operations, shareholders’ deficit andcomprehensive income (loss), and cash flows for each of the fiscal years in the three-year period endedDecember 27, 2006, and our report dated March 9, 2007 expressed an unqualified opinion on those consolidatedfinancial statements.
Greenville, South CarolinaMarch 9, 2007
36
Item 9B. Other Information
None.
PART III
Item 10. Directors, Executive Officers and Corporate Governance
Information required by this item with respect to our executive officers and directors, compliance by ourdirectors, executive officers and certain beneficial owners of our common stock with Section 16(a) of theSecurities Exchange Act of 1934, the committees of our Board of Directors, our Audit Committee FinancialExpert and our Code of Ethics is furnished by incorporation by reference to information under the captionsentitled “Election of Directors”, and “Section 16(a) Beneficial Ownership Reporting Compliance” in the proxystatement (to be filed hereafter) in connection with Denny’s Corporation 2006 Annual Meeting of theShareholders and possibly elsewhere in the proxy statement (or will be filed by amendment to this report). Theinformation required by this item related to our executive officers appears in Item 1 of Part I of this report underthe caption “Executive Officers of the Registrant.”
Item 11. Executive Compensation
The information required by this item is furnished by incorporation by reference to information under thecaptions entitled “Executive Compensation” and “Election of Directors” in the proxy statement and possiblyelsewhere in the proxy statement (or will be filed by amendment to this report).
Item 12. Security Ownership of Certain Beneficial Owners and Management and Related Stockholder Matters
The information required by this item is furnished by incorporation by reference to information under thecaption “General—Equity Security Ownership” in the proxy statement and possibly elsewhere in the proxystatement (or will be filed by amendment to this report).
Item 13. Certain Relationships and Related Transactions, and Director Independence
The information required by this item is furnished by incorporation by reference to information under thecaptions “Related Party Transactions” and “Election of Directors” in the proxy statement and possibly elsewherein the proxy statement (or will be filed by amendment to this report).
Item 14. Principal Accounting Fees and Services
The information required by this item is furnished by incorporation by reference to information under thecaption entitled “Selection of Independent Registered Public Accounting Firm—2006 Audit Information” and“Audit Committee’s Pre-approved Policies and Procedures” in the proxy statement and possibly elsewhere in theproxy statement (or will be filed by amendment to this report).
37
PART IV
Item 15. Exhibits and Financial Statement Schedules
(a)(1) Financial Statements: See the Index to Financial Statements which appears on page F-1 hereof.
(a)(2) Financial Statement Schedules: No schedules are filed herewith because of the absence of conditionsunder which they are required or because the information called for is in our Consolidated Financial Statementsor notes thereto appearing elsewhere herein.
(a)(3) Exhibits: Certain of the exhibits to this Report, indicated by an asterisk, are hereby incorporated byreference from other documents on file with the Commission with which they are electronically filed, to be a parthereof as of their respective dates.
Exhibit No. Description
*3.1 Restated Certificate of Incorporation of Denny’s Corporation dated March 3, 2003 as amended byCertificate of Amendment to Restated Certificate of Incorporation to Increase AuthorizedCapitalization dated August 25, 2004 (incorporated by reference to Exhibit 3.1 to the AnnualReport on Form 10-K of Denny’s Corporation for the year ended December 29, 2004.)
*3.2 Certificate of Designation, Preferences and Rights of Series A Junior Participating Preferred Stockdated August 27, 2004 (incorporated by reference to Exhibit 3.3 to Current Report on Form 8-K ofDenny’s Corporation filed with the Commission on August 27, 2004)
*3.3 By-Laws of Denny’s Corporation, as effective as of August 25, 2004 (incorporated by reference toExhibit 3.2 to Current Report on Form 8-K of Denny’s Corporation filed with the Commission onAugust 27, 2004)
*4.1 10% Senior Notes due 2012 Indenture dated as of October 5, 2004 between Denny’s Holdings,Inc., as Issuer, Denny’s Corporation, as Guarantor, and U.S. Bank National Association, asTrustee (incorporated by reference to Exhibit 4.3 to the Quarterly Report on Form 10-Q ofDenny’s Corporation for the quarter ended September 29, 2004)
*4.2 Form of 10% Senior Note due 2012 and annexed Guarantee (included in Exhibit 4.1 hereto)
*4.3 Amended and Restated Rights Agreement, dated as of January 5, 2005, between Denny’sCorporation and Continental Stock Transfer and Trust Company, as Rights Agent (incorporated byreference to Exhibit 1 to the Form 8-A/A of Denny’s Corporation, filed with the CommissionJanuary 12, 2005 relating to preferred stock purchase rights)
+*10.1 Advantica Restaurant Group Director Stock Option Plan, as amended through January 24, 2001(incorporated by reference to Exhibit 10.1 to the Quarterly Report on Form 10-Q ofDenny’s Corporation (then known as Advantica) filed with the Commission on May 14, 2001)
+*10.2 Advantica Stock Option Plan as amended through November 28, 2001 (incorporated by referenceto Exhibit 10.19 to the Annual Report on Form 10-K of Denny’s Corporation (then known asAdvantica) for the year ended December 26, 2001)
+*10.3 Form of Agreement, dated February 9, 2000, providing certain retention incentives and severancebenefits for company management (incorporated by reference to Exhibit 10.2 to the QuarterlyReport on Form 10-Q of Denny’s Corporation (then known as Advantica) for the quarter endedMarch 29, 2000)
*10.4 Stipulation and Agreement of Settlement, dated February 19, 2002, by and among FRDAcquisition Co., the Creditors Committee, Advantica, Denny’s, Inc. FRI-M Corporation, Coco’sRestaurants, Inc. and Carrows Restaurants, Inc., and as filed with the Bankruptcy Court onFebruary 19, 2002 (incorporated by reference to Exhibit 99.1 to the Current Report on Form 8-Kof Denny’s Corporation (then known as Advantica), filed with the Commission on February 20,2002)
38
Exhibit No. Description
*10.5 First Amended Plan of Reorganization of FRD Acquisition, Co., confirmed by order of theUnited States Bankruptcy Court for the District of Delaware on June 20, 2002 (incorporated byreference to Exhibit 2.2 to the Current Report on Form 8-K of Denny’s Corporation (then knownas Advantica) dated July 25, 2002)
+*10.6 Denny’s, Inc. Omnibus Incentive Compensation Plan for Executives (incorporated by reference toExhibit 99 to the Registration Statement on Form S-8 of Denny’s Corporation (No. 333-103220)filed with the Commission on February 14, 2003)
+*10.7 Employment Agreement dated November 1, 2003 between Denny’s Corporation andNelson J. Marchioli (incorporated by reference to Exhibit 10.3 to the Quarterly Report on Form10-Q of Denny’s Corporation for the quarter ended September 24, 2003)
*10.8 Credit Agreement dated as of September 21, 2004, Among Denny’s, Inc., Denny’s Realty, Inc., asBorrowers, Denny’s Corporation, Denny’s Holdings, Inc., DFO, Inc., as Guarantors, the Lendersnamed herein, Bank of America, N.A., as Administrative Agent, and UBS SECURITIES LLC, asSyndication Agent, and Banc of America Securities LLC and UBS Securities LLC, as Joint LeadArrangers and Joint Bookrunners (First Lien) (incorporated by reference to Exhibit 10.1 to theQuarterly Report on Form 10-Q of Denny’s Corporation for the quarter ended September 29,2004)
*10.9 Credit Agreement dated as of September 21, 2004, Among Denny’s, Inc., Denny’s Realty, Inc., asBorrowers, Denny’s Corporation, Denny’s Holdings, Inc., DFO, Inc., as Guarantors, the Lendersnamed herein, Bank of America, N.A., as Administrative Agent, and UBS SECURITIES LLC, asSyndication Agent, and Banc of America Securities LLC and UBS Securities LLC, as Joint LeadArrangers and Joint Bookrunners (Second Lien) (incorporated by reference to Exhibit 10.2 to theQuarterly Report on Form 10-Q of Denny’s Corporation for the quarter ended September 29,2004)
*10.10 Guarantee and Collateral Agreement dated as of September 21, 2004, among Denny’s, Inc.,Denny’s Realty, Inc., Denny’s Corporation, Denny’s Holdings, Inc., DFO, Inc., each otherSubsidiary Loan Party and Bank of America, N.A., as Collateral Agent (First Lien) (incorporatedby reference to Exhibit 10.3 to the Quarterly Report on Form 10-Q of Denny’s Corporation for thequarter ended September 29, 2004)
*10.11 Guarantee and Collateral Agreement dated as of September 21, 2004, among Denny’s, Inc.,Denny’s Realty, Inc., Denny’s Corporation, Denny’s Holdings, Inc., DFO, Inc., each otherSubsidiary Loan Party and Bank of America, N.A., as Collateral Agent (Second Lien)(incorporated by reference to Exhibit 10.4 to the Quarterly Report on Form 10-Q of Denny’sCorporation for the quarter ended September 29, 2004)
*10.12 First Lien Amendment No. 1 effective as of July 17, 2006, to the Credit Agreement dated as ofSeptember 21, 2004 (incorporated by reference to Exhibit 10.1 to the Quarterly Report on Form10-Q of Denny’s Corporation for the quarter ended June 28, 2006)
*10.13 Second Lien Amendment No. 1 effective as of July 17, 2006 to the Credit Agreement dated as ofSeptember 21, 2004 (incorporated by reference to Exhibit 10.2 to the Quarterly Report on Form10-Q of Denny’s Corporation for the quarter ended June 28, 2006)
+*10.14 Description of amendments to the Denny’s, Inc. Omnibus Incentive Compensation Plan forExecutives, the Advantica Stock Option Plan and the Advantica Restaurant Group Director StockOption Plan (incorporated by reference to Exhibit 10.7 to the Quarterly Report on Form 10-Q ofDenny’s Corporation for the quarter ended September 29, 2004)
+*10.15 Denny’s Corporation 2004 Omnibus Incentive Plan (incorporated by reference to Exhibit 10.16 tothe Annual Report on Form 10-K of Denny’s Corporation for the year ended December 29, 2004)
39
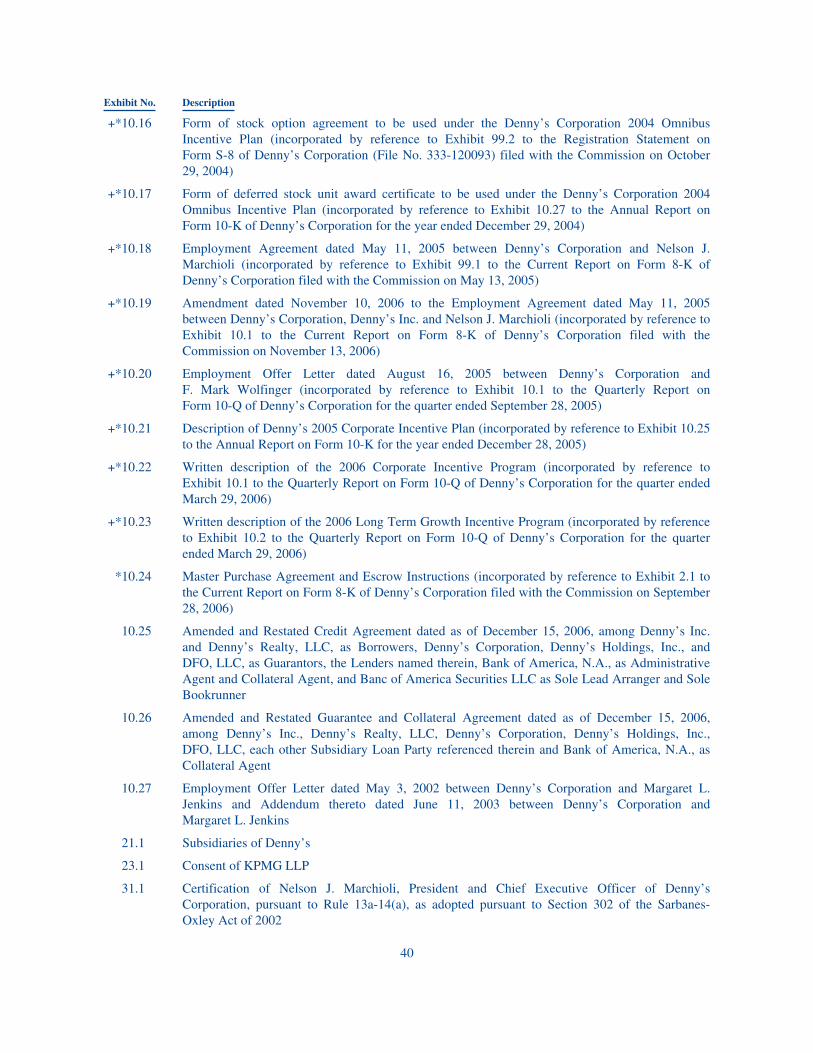
Exhibit No. Description
+*10.16 Form of stock option agreement to be used under the Denny’s Corporation 2004 OmnibusIncentive Plan (incorporated by reference to Exhibit 99.2 to the Registration Statement onForm S-8 of Denny’s Corporation (File No. 333-120093) filed with the Commission on October29, 2004)
+*10.17 Form of deferred stock unit award certificate to be used under the Denny’s Corporation 2004Omnibus Incentive Plan (incorporated by reference to Exhibit 10.27 to the Annual Report onForm 10-K of Denny’s Corporation for the year ended December 29, 2004)
+*10.18 Employment Agreement dated May 11, 2005 between Denny’s Corporation and Nelson J.Marchioli (incorporated by reference to Exhibit 99.1 to the Current Report on Form 8-K ofDenny’s Corporation filed with the Commission on May 13, 2005)
+*10.19 Amendment dated November 10, 2006 to the Employment Agreement dated May 11, 2005between Denny’s Corporation, Denny’s Inc. and Nelson J. Marchioli (incorporated by reference toExhibit 10.1 to the Current Report on Form 8-K of Denny’s Corporation filed with theCommission on November 13, 2006)
+*10.20 Employment Offer Letter dated August 16, 2005 between Denny’s Corporation andF. Mark Wolfinger (incorporated by reference to Exhibit 10.1 to the Quarterly Report onForm 10-Q of Denny’s Corporation for the quarter ended September 28, 2005)
+*10.21 Description of Denny’s 2005 Corporate Incentive Plan (incorporated by reference to Exhibit 10.25to the Annual Report on Form 10-K for the year ended December 28, 2005)
+*10.22 Written description of the 2006 Corporate Incentive Program (incorporated by reference toExhibit 10.1 to the Quarterly Report on Form 10-Q of Denny’s Corporation for the quarter endedMarch 29, 2006)
+*10.23 Written description of the 2006 Long Term Growth Incentive Program (incorporated by referenceto Exhibit 10.2 to the Quarterly Report on Form 10-Q of Denny’s Corporation for the quarterended March 29, 2006)
*10.24 Master Purchase Agreement and Escrow Instructions (incorporated by reference to Exhibit 2.1 tothe Current Report on Form 8-K of Denny’s Corporation filed with the Commission on September28, 2006)
10.25 Amended and Restated Credit Agreement dated as of December 15, 2006, among Denny’s Inc.and Denny’s Realty, LLC, as Borrowers, Denny’s Corporation, Denny’s Holdings, Inc., andDFO, LLC, as Guarantors, the Lenders named therein, Bank of America, N.A., as AdministrativeAgent and Collateral Agent, and Banc of America Securities LLC as Sole Lead Arranger and SoleBookrunner
10.26 Amended and Restated Guarantee and Collateral Agreement dated as of December 15, 2006,among Denny’s Inc., Denny’s Realty, LLC, Denny’s Corporation, Denny’s Holdings, Inc.,DFO, LLC, each other Subsidiary Loan Party referenced therein and Bank of America, N.A., asCollateral Agent
10.27 Employment Offer Letter dated May 3, 2002 between Denny’s Corporation and Margaret L.Jenkins and Addendum thereto dated June 11, 2003 between Denny’s Corporation andMargaret L. Jenkins
21.1 Subsidiaries of Denny’s
23.1 Consent of KPMG LLP
31.1 Certification of Nelson J. Marchioli, President and Chief Executive Officer of Denny’sCorporation, pursuant to Rule 13a-14(a), as adopted pursuant to Section 302 of the Sarbanes-Oxley Act of 2002
40
Exhibit No. Description
31.2 Certification of F. Mark Wolfinger, Executive Vice President, Growth Initiatives and ChiefFinancial Officer of Denny’s Corporation, pursuant to Rule 13a-14(a), as adopted pursuant toSection 302 of the Sarbanes-Oxley Act of 2002
32.1 Statement of Nelson J. Marchioli, President and Chief Executive Officer of Denny’s Corporation,and F. Mark Wolfinger, Executive Vice President, Growth Initiatives and Chief Financial Officerof Denny’s Corporation, pursuant to 18 U.S.C. Section 1350, as adopted pursuant to Section 906of the Sarbanes-Oxley Act of 2002
+ Management contracts or compensatory plans or arrangements.
PLEASE NOTE: It is inappropriate for investors to assume the accuracy of any covenants, representations orwarranties that may be contained in agreements or other documents filed as exhibits to this Form 10-K. Any suchcovenants, representations or warranties: may have been qualified or superseded by disclosures contained inseparate schedules not filed with this Form 10-K, may reflect the parties’ negotiated risk allocation in theparticular transaction, may be qualified by materiality standards that differ from those applicable for securitieslaw purposes, and may not be true as of the date of this Form 10-K or any other date.
41
[THIS PAGE INTENTIONALLY LEFT BLANK]
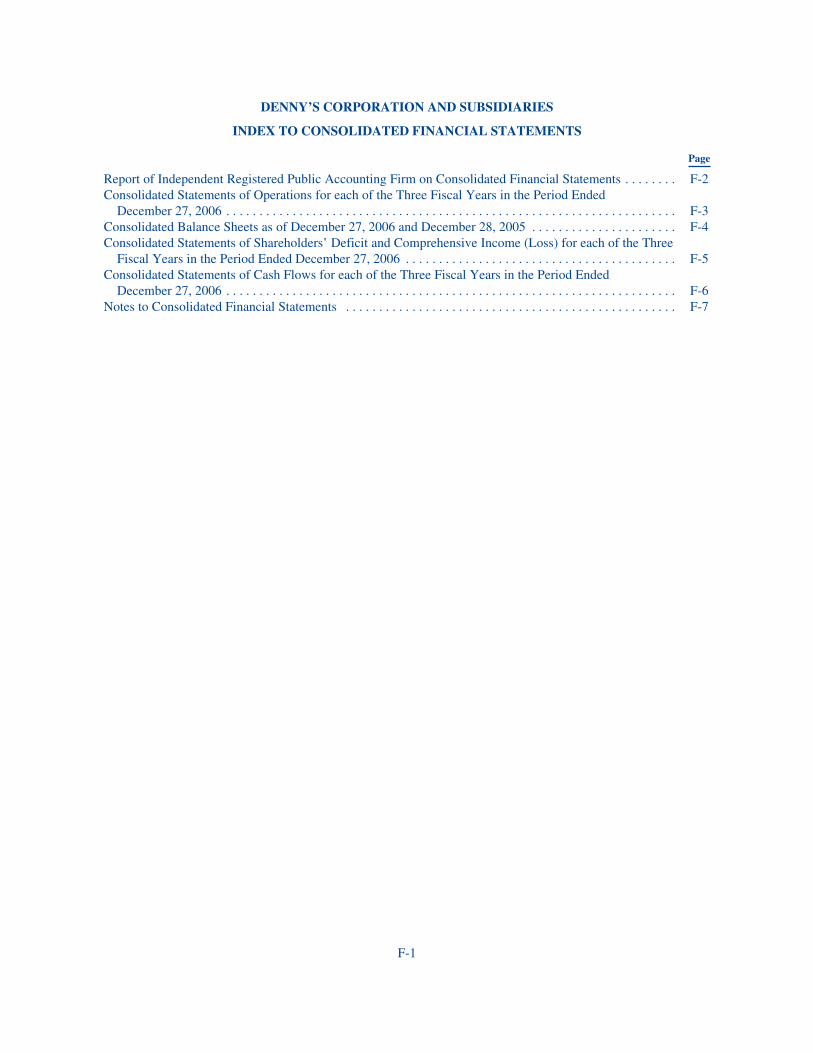
DENNY’S CORPORATION AND SUBSIDIARIES
INDEX TO CONSOLIDATED FINANCIAL STATEMENTS
Page
Report of Independent Registered Public Accounting Firm on Consolidated Financial Statements . . . . . . . . F-2Consolidated Statements of Operations for each of the Three Fiscal Years in the Period Ended
December 27, 2006 . . . . . . . . . . . . . . . . . . . . . . . . . . . . . . . . . . . . . . . . . . . . . . . . . . . . . . . . . . . . . . . . . . . . F-3Consolidated Balance Sheets as of December 27, 2006 and December 28, 2005 . . . . . . . . . . . . . . . . . . . . . . F-4Consolidated Statements of Shareholders’ Deficit and Comprehensive Income (Loss) for each of the Three
Fiscal Years in the Period Ended December 27, 2006 . . . . . . . . . . . . . . . . . . . . . . . . . . . . . . . . . . . . . . . . . F-5Consolidated Statements of Cash Flows for each of the Three Fiscal Years in the Period Ended
December 27, 2006 . . . . . . . . . . . . . . . . . . . . . . . . . . . . . . . . . . . . . . . . . . . . . . . . . . . . . . . . . . . . . . . . . . . . F-6Notes to Consolidated Financial Statements . . . . . . . . . . . . . . . . . . . . . . . . . . . . . . . . . . . . . . . . . . . . . . . . . . F-7
F-1
Report of Independent Registered Public Accounting Firm
The Board of DirectorsDenny’s Corporation:
We have audited the accompanying consolidated balance sheets of Denny’s Corporation and subsidiaries asof December 27, 2006 and December 28, 2005, and the related consolidated statements of operations,shareholders’ deficit and comprehensive income (loss), and cash flows for each of the fiscal years in the three-year period ended December 27, 2006. These consolidated financial statements are the responsibility of theCompany’s management. Our responsibility is to express an opinion on these consolidated financial statementsbased on our audits.
We conducted our audits in accordance with the standards of the Public Company Accounting OversightBoard (United States). Those standards require that we plan and perform the audit to obtain reasonable assuranceabout whether the financial statements are free of material misstatement. An audit includes examining, on a testbasis, evidence supporting the amounts and disclosures in the financial statements. An audit also includesassessing the accounting principles used and significant estimates made by management, as well as evaluatingthe overall financial statement presentation. We believe that our audits provide a reasonable basis for ouropinion.
In our opinion, the consolidated financial statements referred to above present fairly, in all material respects,the financial position of Denny’s Corporation and subsidiaries as of December 27, 2006 and December 28, 2005,and the results of their operations and their cash flows for each of the fiscal years in the three-year period endedDecember 27, 2006, in conformity with U.S. generally accepted accounting principles .
As discussed in note 2, the Company changed its method of accounting for share-based payment in fiscal2006.
We also have audited, in accordance with the standards of the Public Company Accounting Oversight Board(United States), the effectiveness of the Company’s internal control over financial reporting as of December 27,2006, based on criteria established in Internal Control—Integrated Framework issued by the Committee ofSponsoring Organizations of the Treadway Commission (COSO) , and our report dated March 9, 2007 expressedan unqualified opinion on management’s assessment of, and the effective operation of, internal control overfinancial reporting.
Greenville, South CarolinaMarch 9, 2007
F-2

Denny’s Corporation and Subsidiaries
Consolidated Statements of Operations
Fiscal Year Ended
December 27,2006
December 28,2005
December 29,2004
(In thousands, except per share amounts)Revenue:
Company restaurant sales . . . . . . . . . . . . . . . . . . . . . . . . . . . . . . . . $904,374 $888,942 $871,248Franchise and license revenue . . . . . . . . . . . . . . . . . . . . . . . . . . . . . 89,670 89,783 88,758
Total operating revenue . . . . . . . . . . . . . . . . . . . . . . . . . . . . . . 994,044 978,725 960,006
Costs of company restaurant sales:Product costs . . . . . . . . . . . . . . . . . . . . . . . . . . . . . . . . . . . . . . . . . . 226,404 224,803 225,200Payroll and benefits . . . . . . . . . . . . . . . . . . . . . . . . . . . . . . . . . . . . . 372,292 372,644 362,450Occupancy . . . . . . . . . . . . . . . . . . . . . . . . . . . . . . . . . . . . . . . . . . . . 51,677 51,057 49,581Other operating expenses . . . . . . . . . . . . . . . . . . . . . . . . . . . . . . . . 131,404 130,883 117,834
Total costs of company restaurant sales . . . . . . . . . . . . . . . . . 781,777 779,387 755,065Costs of franchise and license revenue . . . . . . . . . . . . . . . . . . . . . . . . . . 27,910 28,758 28,196General and administrative expenses . . . . . . . . . . . . . . . . . . . . . . . . . . . 66,426 62,911 66,922Depreciation and amortization . . . . . . . . . . . . . . . . . . . . . . . . . . . . . . . . 55,290 56,126 56,649Operating gains, losses and other charges, net . . . . . . . . . . . . . . . . . . . . (47,882) 3,090 (646)
Total operating costs and expenses . . . . . . . . . . . . . . . . . . . . . 883,521 930,272 906,186
Operating income . . . . . . . . . . . . . . . . . . . . . . . . . . . . . . . . . . . . . . . . . . 110,523 48,453 53,820
Other expenses:Interest expense, net . . . . . . . . . . . . . . . . . . . . . . . . . . . . . . . . . . . . 57,720 55,172 69,428Other nonoperating expense (income), net . . . . . . . . . . . . . . . . . . . 8,029 (602) 21,265
Total other expenses, net . . . . . . . . . . . . . . . . . . . . . . . . . . . . . 65,749 54,570 90,693
Net income (loss) before income taxes and cumulative effect of changein accounting principle . . . . . . . . . . . . . . . . . . . . . . . . . . . . . . . . . . . . 44,774 (6,117) (36,873)
Provision for income taxes . . . . . . . . . . . . . . . . . . . . . . . . . . . . . . . . . . . 14,668 1,211 802
Net income (loss) before cumulative effect of change in accountingprinciple . . . . . . . . . . . . . . . . . . . . . . . . . . . . . . . . . . . . . . . . . . . . . . . . 30,106 (7,328) (37,675)
Cumulative effect of change in accounting principle, net of tax . . . . . . 232 — —
Net income (loss) . . . . . . . . . . . . . . . . . . . . . . . . . . . . . . . . . . . . . . . . . . $ 30,338 $ (7,328) $ (37,675)
Basic net income (loss) per share:Basic net income (loss) before cumulative effect of change in
accounting principle, net of tax . . . . . . . . . . . . . . . . . . . . . . . . . . $ 0.33 $ (0.08) $ (0.58)Cumulative effect of change in accounting principle, net of tax . . 0.00 — —
Basic net income (loss) per share . . . . . . . . . . . . . . . . . . . . . . $ 0.33 $ (0.08) $ (0.58)
Diluted net income (loss) per share:Diluted net income (loss) before cumulative effect of change in
accounting principle, net of tax . . . . . . . . . . . . . . . . . . . . . . . . . . $ 0.31 $ (0.08) $ (0.58)Cumulative effect of change in accounting principle, net of tax . . 0.00 — —
Diluted net income (loss) per share . . . . . . . . . . . . . . . . . . . . . $ 0.31 $ (0.08) $ (0.58)
Weighted average shares outstanding:Basic . . . . . . . . . . . . . . . . . . . . . . . . . . . . . . . . . . . . . . . . . . . . . . . . 92,250 91,018 64,708
Diluted . . . . . . . . . . . . . . . . . . . . . . . . . . . . . . . . . . . . . . . . . . . . . . . 97,364 91,018 64,708
See notes to consolidated financial statements.
F-3
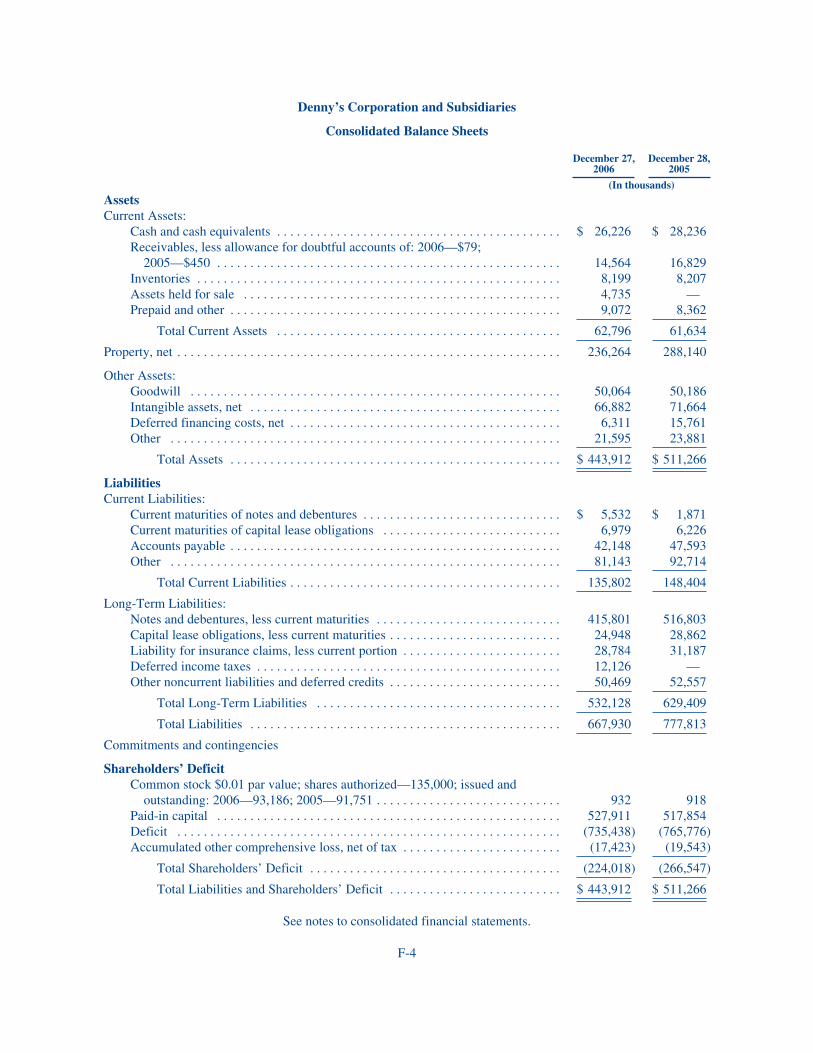
Denny’s Corporation and Subsidiaries
Consolidated Balance Sheets
December 27,2006
December 28,2005
(In thousands)
AssetsCurrent Assets:
Cash and cash equivalents . . . . . . . . . . . . . . . . . . . . . . . . . . . . . . . . . . . . . . . . . . . $ 26,226 $ 28,236Receivables, less allowance for doubtful accounts of: 2006—$79;
2005—$450 . . . . . . . . . . . . . . . . . . . . . . . . . . . . . . . . . . . . . . . . . . . . . . . . . . . . 14,564 16,829Inventories . . . . . . . . . . . . . . . . . . . . . . . . . . . . . . . . . . . . . . . . . . . . . . . . . . . . . . . 8,199 8,207Assets held for sale . . . . . . . . . . . . . . . . . . . . . . . . . . . . . . . . . . . . . . . . . . . . . . . . 4,735 —Prepaid and other . . . . . . . . . . . . . . . . . . . . . . . . . . . . . . . . . . . . . . . . . . . . . . . . . . 9,072 8,362
Total Current Assets . . . . . . . . . . . . . . . . . . . . . . . . . . . . . . . . . . . . . . . . . . . 62,796 61,634
Property, net . . . . . . . . . . . . . . . . . . . . . . . . . . . . . . . . . . . . . . . . . . . . . . . . . . . . . . . . . . 236,264 288,140
Other Assets:Goodwill . . . . . . . . . . . . . . . . . . . . . . . . . . . . . . . . . . . . . . . . . . . . . . . . . . . . . . . . 50,064 50,186Intangible assets, net . . . . . . . . . . . . . . . . . . . . . . . . . . . . . . . . . . . . . . . . . . . . . . . 66,882 71,664Deferred financing costs, net . . . . . . . . . . . . . . . . . . . . . . . . . . . . . . . . . . . . . . . . . 6,311 15,761Other . . . . . . . . . . . . . . . . . . . . . . . . . . . . . . . . . . . . . . . . . . . . . . . . . . . . . . . . . . . 21,595 23,881
Total Assets . . . . . . . . . . . . . . . . . . . . . . . . . . . . . . . . . . . . . . . . . . . . . . . . . . $ 443,912 $ 511,266
LiabilitiesCurrent Liabilities:
Current maturities of notes and debentures . . . . . . . . . . . . . . . . . . . . . . . . . . . . . . $ 5,532 $ 1,871Current maturities of capital lease obligations . . . . . . . . . . . . . . . . . . . . . . . . . . . 6,979 6,226Accounts payable . . . . . . . . . . . . . . . . . . . . . . . . . . . . . . . . . . . . . . . . . . . . . . . . . . 42,148 47,593Other . . . . . . . . . . . . . . . . . . . . . . . . . . . . . . . . . . . . . . . . . . . . . . . . . . . . . . . . . . . 81,143 92,714
Total Current Liabilities . . . . . . . . . . . . . . . . . . . . . . . . . . . . . . . . . . . . . . . . . 135,802 148,404
Long-Term Liabilities:Notes and debentures, less current maturities . . . . . . . . . . . . . . . . . . . . . . . . . . . . 415,801 516,803Capital lease obligations, less current maturities . . . . . . . . . . . . . . . . . . . . . . . . . . 24,948 28,862Liability for insurance claims, less current portion . . . . . . . . . . . . . . . . . . . . . . . . 28,784 31,187Deferred income taxes . . . . . . . . . . . . . . . . . . . . . . . . . . . . . . . . . . . . . . . . . . . . . . 12,126 —Other noncurrent liabilities and deferred credits . . . . . . . . . . . . . . . . . . . . . . . . . . 50,469 52,557
Total Long-Term Liabilities . . . . . . . . . . . . . . . . . . . . . . . . . . . . . . . . . . . . . 532,128 629,409
Total Liabilities . . . . . . . . . . . . . . . . . . . . . . . . . . . . . . . . . . . . . . . . . . . . . . . 667,930 777,813
Commitments and contingencies
Shareholders’ DeficitCommon stock $0.01 par value; shares authorized—135,000; issued and
outstanding: 2006—93,186; 2005—91,751 . . . . . . . . . . . . . . . . . . . . . . . . . . . . 932 918Paid-in capital . . . . . . . . . . . . . . . . . . . . . . . . . . . . . . . . . . . . . . . . . . . . . . . . . . . . 527,911 517,854Deficit . . . . . . . . . . . . . . . . . . . . . . . . . . . . . . . . . . . . . . . . . . . . . . . . . . . . . . . . . . (735,438) (765,776)Accumulated other comprehensive loss, net of tax . . . . . . . . . . . . . . . . . . . . . . . . (17,423) (19,543)
Total Shareholders’ Deficit . . . . . . . . . . . . . . . . . . . . . . . . . . . . . . . . . . . . . . (224,018) (266,547)
Total Liabilities and Shareholders’ Deficit . . . . . . . . . . . . . . . . . . . . . . . . . . $ 443,912 $ 511,266
See notes to consolidated financial statements.
F-4
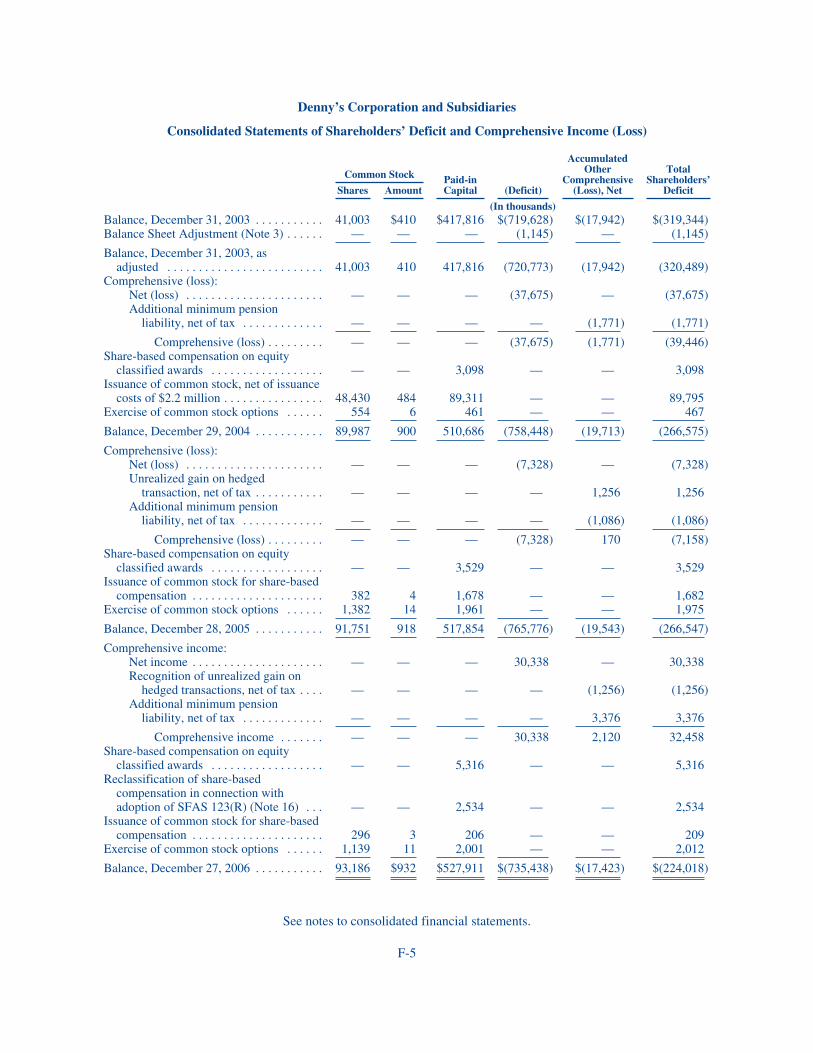
Denny’s Corporation and Subsidiaries
Consolidated Statements of Shareholders’ Deficit and Comprehensive Income (Loss)
Common Stock Paid-inCapital (Deficit)
AccumulatedOther
Comprehensive(Loss), Net
TotalShareholders’
DeficitShares Amount
(In thousands)Balance, December 31, 2003 . . . . . . . . . . . 41,003 $410 $417,816 $(719,628) $(17,942) $(319,344)Balance Sheet Adjustment (Note 3) . . . . . . — — — (1,145) — (1,145)
Balance, December 31, 2003, asadjusted . . . . . . . . . . . . . . . . . . . . . . . . . 41,003 410 417,816 (720,773) (17,942) (320,489)
Comprehensive (loss):Net (loss) . . . . . . . . . . . . . . . . . . . . . . — — — (37,675) — (37,675)Additional minimum pension
liability, net of tax . . . . . . . . . . . . . — — — — (1,771) (1,771)
Comprehensive (loss) . . . . . . . . . — — — (37,675) (1,771) (39,446)Share-based compensation on equity
classified awards . . . . . . . . . . . . . . . . . . — — 3,098 — — 3,098Issuance of common stock, net of issuance
costs of $2.2 million . . . . . . . . . . . . . . . . 48,430 484 89,311 — — 89,795Exercise of common stock options . . . . . . 554 6 461 — — 467
Balance, December 29, 2004 . . . . . . . . . . . 89,987 900 510,686 (758,448) (19,713) (266,575)
Comprehensive (loss):Net (loss) . . . . . . . . . . . . . . . . . . . . . . — — — (7,328) — (7,328)Unrealized gain on hedged
transaction, net of tax . . . . . . . . . . . — — — — 1,256 1,256Additional minimum pension
liability, net of tax . . . . . . . . . . . . . — — — — (1,086) (1,086)
Comprehensive (loss) . . . . . . . . . — — — (7,328) 170 (7,158)Share-based compensation on equity
classified awards . . . . . . . . . . . . . . . . . . — — 3,529 — — 3,529Issuance of common stock for share-based
compensation . . . . . . . . . . . . . . . . . . . . . 382 4 1,678 — — 1,682Exercise of common stock options . . . . . . 1,382 14 1,961 — — 1,975
Balance, December 28, 2005 . . . . . . . . . . . 91,751 918 517,854 (765,776) (19,543) (266,547)
Comprehensive income:Net income . . . . . . . . . . . . . . . . . . . . . — — — 30,338 — 30,338Recognition of unrealized gain on
hedged transactions, net of tax . . . . — — — — (1,256) (1,256)Additional minimum pension
liability, net of tax . . . . . . . . . . . . . — — — — 3,376 3,376
Comprehensive income . . . . . . . — — — 30,338 2,120 32,458Share-based compensation on equity
classified awards . . . . . . . . . . . . . . . . . . — — 5,316 — — 5,316Reclassification of share-based
compensation in connection withadoption of SFAS 123(R) (Note 16) . . . — — 2,534 — — 2,534
Issuance of common stock for share-basedcompensation . . . . . . . . . . . . . . . . . . . . . 296 3 206 — — 209
Exercise of common stock options . . . . . . 1,139 11 2,001 — — 2,012
Balance, December 27, 2006 . . . . . . . . . . . 93,186 $932 $527,911 $(735,438) $(17,423) $(224,018)
See notes to consolidated financial statements.
F-5
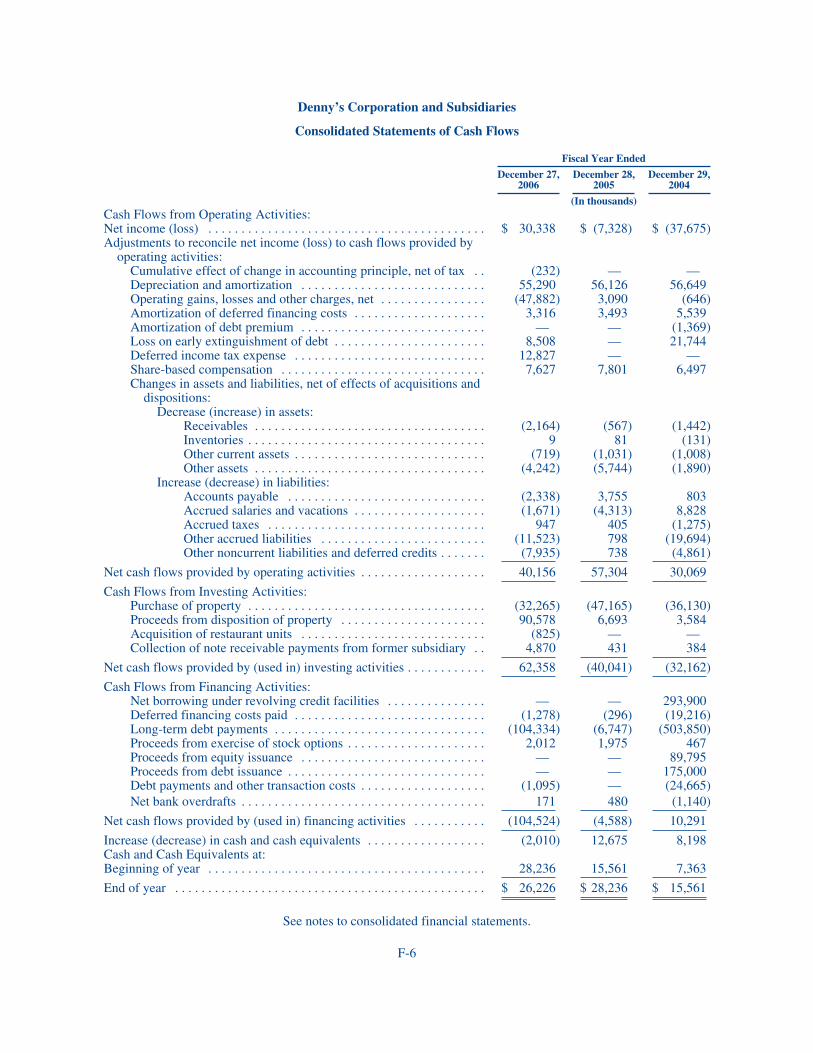
Denny’s Corporation and Subsidiaries
Consolidated Statements of Cash Flows
Fiscal Year Ended
December 27,2006
December 28,2005
December 29,2004
(In thousands)Cash Flows from Operating Activities:Net income (loss) . . . . . . . . . . . . . . . . . . . . . . . . . . . . . . . . . . . . . . . . . . $ 30,338 $ (7,328) $ (37,675)Adjustments to reconcile net income (loss) to cash flows provided by
operating activities:Cumulative effect of change in accounting principle, net of tax . . (232) — —Depreciation and amortization . . . . . . . . . . . . . . . . . . . . . . . . . . . . 55,290 56,126 56,649Operating gains, losses and other charges, net . . . . . . . . . . . . . . . . (47,882) 3,090 (646)Amortization of deferred financing costs . . . . . . . . . . . . . . . . . . . . 3,316 3,493 5,539Amortization of debt premium . . . . . . . . . . . . . . . . . . . . . . . . . . . . — — (1,369)Loss on early extinguishment of debt . . . . . . . . . . . . . . . . . . . . . . . 8,508 — 21,744Deferred income tax expense . . . . . . . . . . . . . . . . . . . . . . . . . . . . . 12,827 — —Share-based compensation . . . . . . . . . . . . . . . . . . . . . . . . . . . . . . . 7,627 7,801 6,497Changes in assets and liabilities, net of effects of acquisitions and
dispositions:Decrease (increase) in assets:
Receivables . . . . . . . . . . . . . . . . . . . . . . . . . . . . . . . . . . . (2,164) (567) (1,442)Inventories . . . . . . . . . . . . . . . . . . . . . . . . . . . . . . . . . . . . 9 81 (131)Other current assets . . . . . . . . . . . . . . . . . . . . . . . . . . . . . (719) (1,031) (1,008)Other assets . . . . . . . . . . . . . . . . . . . . . . . . . . . . . . . . . . . (4,242) (5,744) (1,890)
Increase (decrease) in liabilities:Accounts payable . . . . . . . . . . . . . . . . . . . . . . . . . . . . . . (2,338) 3,755 803Accrued salaries and vacations . . . . . . . . . . . . . . . . . . . . (1,671) (4,313) 8,828Accrued taxes . . . . . . . . . . . . . . . . . . . . . . . . . . . . . . . . . 947 405 (1,275)Other accrued liabilities . . . . . . . . . . . . . . . . . . . . . . . . . (11,523) 798 (19,694)Other noncurrent liabilities and deferred credits . . . . . . . (7,935) 738 (4,861)
Net cash flows provided by operating activities . . . . . . . . . . . . . . . . . . . 40,156 57,304 30,069
Cash Flows from Investing Activities:Purchase of property . . . . . . . . . . . . . . . . . . . . . . . . . . . . . . . . . . . . (32,265) (47,165) (36,130)Proceeds from disposition of property . . . . . . . . . . . . . . . . . . . . . . 90,578 6,693 3,584Acquisition of restaurant units . . . . . . . . . . . . . . . . . . . . . . . . . . . . (825) — —Collection of note receivable payments from former subsidiary . . 4,870 431 384
Net cash flows provided by (used in) investing activities . . . . . . . . . . . . 62,358 (40,041) (32,162)
Cash Flows from Financing Activities:Net borrowing under revolving credit facilities . . . . . . . . . . . . . . . — — 293,900Deferred financing costs paid . . . . . . . . . . . . . . . . . . . . . . . . . . . . . (1,278) (296) (19,216)Long-term debt payments . . . . . . . . . . . . . . . . . . . . . . . . . . . . . . . . (104,334) (6,747) (503,850)Proceeds from exercise of stock options . . . . . . . . . . . . . . . . . . . . . 2,012 1,975 467Proceeds from equity issuance . . . . . . . . . . . . . . . . . . . . . . . . . . . . — — 89,795Proceeds from debt issuance . . . . . . . . . . . . . . . . . . . . . . . . . . . . . . — — 175,000Debt payments and other transaction costs . . . . . . . . . . . . . . . . . . . (1,095) — (24,665)Net bank overdrafts . . . . . . . . . . . . . . . . . . . . . . . . . . . . . . . . . . . . . 171 480 (1,140)
Net cash flows provided by (used in) financing activities . . . . . . . . . . . (104,524) (4,588) 10,291
Increase (decrease) in cash and cash equivalents . . . . . . . . . . . . . . . . . . (2,010) 12,675 8,198Cash and Cash Equivalents at:Beginning of year . . . . . . . . . . . . . . . . . . . . . . . . . . . . . . . . . . . . . . . . . . 28,236 15,561 7,363
End of year . . . . . . . . . . . . . . . . . . . . . . . . . . . . . . . . . . . . . . . . . . . . . . . $ 26,226 $ 28,236 $ 15,561
See notes to consolidated financial statements.
F-6
Denny’s Corporation and Subsidiaries
Notes to Consolidated Financial Statements
Note 1. Introduction and Basis of Reporting
Denny’s Corporation, or Denny’s, is one of America’s largest family-style restaurant chains. AtDecember 27, 2006 the Denny’s brand consisted of 1,545 restaurants, 521 of which are company-owned andoperated and 1,024 of which are franchised/licensed restaurants. These Denny’s restaurants are operated in 49states, the District of Columbia, two U.S. territories and five foreign countries, with principal concentrations inCalifornia, Florida and Texas.
Note 2. Summary of Significant Accounting Policies
The following accounting policies significantly affect the preparation of our Consolidated FinancialStatements:
Use of Estimates. The preparation of these financial statements requires us to make estimates and judgmentsthat affect the reported amounts of assets, liabilities, revenues and expenses, and related disclosure of contingentassets and liabilities. On an ongoing basis, we evaluate our estimates. We base our estimates on historicalexperience and on various other assumptions that we believe to be reasonable under the circumstances, theresults of which form the basis for making judgments about the carrying values of assets and liabilities that arenot readily apparent from other sources. Actual results may differ from these estimates under differentassumptions or conditions; however, we believe that our estimates are reasonable.
Consolidation Policy. The Consolidated Financial Statements include the financial statements of Denny’sCorporation and its wholly-owned subsidiaries, the most significant of which are Denny’s Holdings, Inc.;Denny’s, Inc. and DFO, Inc., which are subsidiaries of Denny’s Holdings, Inc. All significant intercompanybalances and transactions have been eliminated in consolidation.
Fiscal Year. Our fiscal year ends on the Wednesday in December closest to December 31 of each year. As aresult, a fifty-third week is added to a fiscal year every five or six years. Fiscal 2004, 2005 and 2006 each include52 weeks of operations.
Cash Equivalents and Investments. We consider all highly liquid investments with an original maturity ofthree months or less to be cash equivalents.
Allowances for Doubtful Accounts. We maintain allowances for doubtful accounts for estimated lossesresulting from the inability of our franchisees to make required payments for franchise royalties, rent, advertisingand notes receivable. In assessing recoverability of these receivables, we make judgments regarding the financialcondition of the franchisees based primarily on past and current payment trends and periodic financialinformation which the franchisees are required to submit to us.
Inventories. Inventories are valued primarily at the lower of average cost (first-in, first-out) or market.
Assets Held for Sale. Assets held for sale consist of real estate properties that we expect to sell within thenext 12 months. The properties are reported at the lower of carrying amount or fair value less costs to sell.
Property and Depreciation. We depreciate owned property over its estimated useful life using the straight-line method. We amortize property held under capital leases (at capitalized value) over the lesser of its estimateduseful life or the initial lease term. In certain situations, one or more option periods may be used in determiningthe depreciable life of certain properties leased under operating lease agreements, if we deem that an economicpenalty will be incurred and exercise of such option periods is reasonably assured. In either circumstance, our
F-7
policy requires lease term consistency when calculating the depreciation period, in classifying the lease, and incomputing rent expense. The following estimated useful service lives were in effect during all periods presentedin the financial statements:
Buildings—Five to thirty years
Equipment—Two to ten years
Leasehold Improvements—Estimated useful life limited by the expected lease term, generally betweenfive and fifteen years.
Goodwill. Amounts recorded as goodwill primarily represent excess reorganization value recognized as aresult of our 1998 bankruptcy. We test goodwill for impairment at each fiscal year end, and more frequently ifcircumstances indicate impairment may exist.
Other Intangible Assets. Other intangible assets consist primarily of trademarks, trade names, franchise andother operating agreements. Trade names and trademarks are considered indefinite-lived intangible assets and arenot amortized. Franchise and other operating agreements are amortized using the straight-line basis over the termof the related agreement. We test trade name and trademark assets for impairment at each fiscal year end, andmore frequently if circumstances indicate impairment may exist. We assess impairment of franchise and otheroperating agreements whenever changes or events indicate that the carrying value may not be recoverable.
Deferred Financing Costs. Costs related to the issuance of debt are deferred and amortized as a componentof interest expense using the effective interest method over the terms of the respective debt issuances.
Cash Overdrafts. We have included in accounts payable on the Consolidated Balance Sheets cash overdraftstotaling $12.2 million and $12.0 million at December 27, 2006 and December 28, 2005, respectively.
Self-insurance liabilities. We record liabilities for insurance claims during periods in which we have beeninsured under large deductible programs or have been self-insured for our medical and dental claims andworkers’ compensation, general/product and automobile insurance liabilities. Maximum self-insured retentionlevels, including defense costs per occurrence, range from $0.5 to $1.0 million per individual claim for workers’compensation and for general/product and automobile liability. The liabilities for prior and current estimatedincurred losses are discounted to their present value based on expected loss payment patterns determined byindependent actuaries, using our actual historical payments. Total discounted insurance liabilities atDecember 27, 2006 and December 28, 2005 were $41.0 million and $42.4 million, respectively, reflecting a 5%discount rate. The related undiscounted amounts at such dates were $46.4 million and $48.4 million, respectively.
Income Taxes. We record a valuation allowance to reduce our net deferred tax assets to the amount that ismore-likely-than-not to be realized. While we have considered ongoing, prudent and feasible tax planningstrategies in assessing the need for our valuation allowance, in the event we were to determine that we would beable to realize our deferred tax assets in the future in an amount in excess of the net recorded amount, anadjustment to the valuation allowance (except for the valuation allowance established in connection with theadoption of fresh start reporting on January 7, 1998—see Note 14) would decrease income tax expense in theperiod such determination was made. At December 27, 2006 and December 28, 2005, a valuation allowance wasrecorded for all of our deferred tax assets.
Leases. Our policy requires the use of a consistent lease term for (i) calculating the maximum depreciationperiod for related buildings and leasehold improvements; (ii) classifying the lease; and (iii) computing periodicrent expense increases where the lease terms include escalations in rent over the lease term. The lease termcommences on the date when we become legally obligated for the rent payments. We account for rent escalationsin leases on a straight-line basis over the expected lease term. Any rent holidays after lease commencement arerecognized on a straight-line basis over the expected lease term, which includes the rent holiday period.
F-8
Leasehold improvements that have been funded by lessors have historically been insignificant. Any leaseholdimprovements we make that are funded by lessor incentives or allowances under operating leases are recorded asleasehold improvement assets and amortized over the expected lease term. Such incentives are also recorded asdeferred rent and amortized as reductions to lease expense over the expected lease term. We record contingentrent expense based on estimated sales for respective units over the contingency period.
Fair Value of Financial Instruments. Our significant financial instruments are cash and cash equivalents,investments, receivables, accounts payable, accrued liabilities, long-term debt and interest rate swaps. Except forlong-term debt and interest rate swaps, the fair value of these financial instruments approximates their carryingvalues based on their short maturities. See Note 12 for information about the fair value of long-term debt andinterest rate swaps.
Derivative Financial Instruments. We record all derivative financial instruments as either assets or liabilitiesin the balance sheet at fair value. During 2006 and 2005, we had designated an interest rate swap as a hedge ofthe cash flows on variable rate debt. To the extent the derivative instrument was effective in offsetting thevariability of the hedged cash flows, changes in the fair value of the derivative instrument were not included incurrent earnings but were reported as other comprehensive income (loss). The ineffective portion of the hedgewas recorded as an adjustment to earnings. We do not enter into derivative financial instruments for trading orspeculative purposes.
Contingencies and Litigation. We are subject to legal proceedings involving ordinary and routine claimsincidental to our business as well as legal proceedings that are nonroutine and include compensatory or punitivedamage claims. Our ultimate legal and financial liability with respect to such matters cannot be estimated withcertainty and requires the use of estimates in recording liabilities for potential litigation settlements.
Segment. Denny’s operates in only one segment. All significant revenues and pre-tax earnings relate to retailsales of food and beverages to the general public through either company-owned or franchised restaurants.
Company Restaurant Sales. Company restaurant sales are recognized when food and beverage products aresold at company-owned units. Proceeds from the sale of gift certificates and gift cards are deferred andrecognized as revenue when they are redeemed. We present company restaurant sales net of sales taxes.
Franchise and License Fees. We recognize initial franchise and license fees when all of the materialobligations have been performed and conditions have been satisfied, typically when operations of a newfranchised restaurant have commenced. During 2006, 2005 and 2004, we recorded initial fees of $0.9 million,$0.7 million and $1.4 million, respectively, as a component of franchise and license revenue in the accompanyingConsolidated Statements of Operations. At December 27, 2006, December 28, 2005, and December 29, 2004,deferred fees were $0.6 million, $0.6 million and $0.6 million, respectively and are included in other accruedliabilities in the accompanying Consolidated Balance Sheets. Continuing fees, such as royalties and rents, arerecorded as income on a monthly basis. For 2006, our ten largest franchisees accounted for approximately 28%of our franchise revenues.
Advertising Costs. We expense production costs for radio and television advertising in the year in which thecommercials are initially aired. Advertising expense for 2006, 2005 and 2004 was $29.9 million, $28.4 millionand $29.0 million, respectively, net of contributions from franchisees of $36.7 million, $35.2 millionand $34.2 million, respectively. Advertising costs are recorded as a component of other operating expenses in ourConsolidated Statements of Operations.
Restructuring and exit costs. As a result of changes in our organizational structure and in our portfolio ofrestaurants, we have recorded restructuring and exit costs. These costs consist primarily of the costs of futureobligations related to closed units and severance and outplacement costs for terminated employees and areincluded as a component of operating gains, losses and other charges, net in the Consolidated Statements ofOperations.
F-9
We evaluate store closures for potential disclosure as discontinued operations based on an assessment ofseveral quantitative and qualitative factors, including the nature of the closure, revenue migration to othercompany-owned and franchised stores, planned market development in the vicinity of the disposed store and theimpact on the relevant financial statement line items.
Discounted liabilities for future lease costs and the fair value of related subleases of closed units arerecorded when the units are closed. All other costs related to closed units are expensed as incurred. In assessingthe discounted liabilities for future costs of obligations related to closed units, we make assumptions regardingamounts of future subleases. If these assumptions or their related estimates change in the future, we may berequired to record additional exit costs or reduce exit costs previously recorded. Exit costs recorded for each ofthe periods presented include the effect of such changes in estimates.
Impairment of long-lived assets. We evaluate our long-lived assets for impairment at the restaurant level ona quarterly basis or whenever changes or events indicate that the carrying value may not be recoverable. Weassess impairment of restaurant-level assets based on the operating cash flows of the restaurant and our plans forrestaurant closings. Generally, all units with negative cash flows from operations for the most recent twelvemonths at each quarter end are included in our assessment. In performing our assessment, we make assumptionsregarding estimated future cash flows, including estimated proceeds from similar asset sales, and other factors todetermine both the recoverability and the estimated fair value of the respective assets. If the long-lived assets of arestaurant are not recoverable based upon estimated future, undiscounted cash flows, we write the assets down totheir fair value. If these estimates or their related assumptions change in the future, we may be required to recordadditional impairment charges. These charges were $2.7 million, $1.2 million and $1.1 million for the yearsended December 27, 2006, December 28, 2005 and December 29, 2004, respectively, and are included as acomponent of operating gains, losses and other charges, net in the Consolidated Statements of Operations.
Gains on Sales of Company-Owned Restaurants and Real Estate Properties. Generally, gains on salesof real estate properties and company-owned restaurants that include real estate are recognized when the cashproceeds from the sale exceed the minimum requirements under Statement of Financial Accounting StandardsNo. 66 “Accounting for Sales of Real Estate”. Total proceeds from the sales of real estate and company-ownedrestaurants were $90.2 million, $6.7 million and $3.6 million in 2006, 2005 and 2004, respectively. Total gainsresulting from these transactions were $56.7 million, $3.3 million and $2.3 million in 2006, 2005 and 2004,respectively, and are included as a component of operating gains, losses and other charges, net in theConsolidated Statements of Operations. We continue to collect royalties from any franchisees operatingrestaurants at these properties.
Share-Based Payment. Effective December 29, 2005, the first day of fiscal 2006, we adopted Statement ofFinancial Accounting Standards No. 123 (revised 2004) “Share-Based Payment” (“SFAS 123(R)”). This standardrequires all share-based compensation to be recognized in the statement of operations based on fair value andapplies to all awards granted, modified, cancelled or repurchased after the effective date. Additionally, forawards outstanding as of December 29, 2005 for which the requisite service has not been rendered, compensationexpense will be recognized as the requisite service is rendered. The statement also requires the benefits of taxdeductions in excess of recognized compensation cost to be reported as a financing cash flow, rather than as anoperating cash flow. We adopted this accounting treatment using the modified-prospective-transition method,therefore results for prior periods have not been restated. SFAS 123(R) supersedes SFAS 123, “Accounting forStock Based Compensation” (“SFAS No. 123”), which had allowed companies to choose between expensingstock options or showing pro forma disclosure only.
Under SFAS 123(R), we are required to estimate potential forfeitures of share-based awards and adjust thecompensation cost accordingly. Our estimate of forfeitures will be adjusted over the requisite service period tothe extent that actual forfeitures differ, or are expected to differ, from such estimates. Prior to the adoption ofSFAS 123(R), we recorded forfeitures as they occurred. As a result of this change, we recognized a cumulativeeffect of change in accounting principle in the Consolidated Statement of Operations of $0.2 million.
F-10

Additionally, in accordance with SFAS 123(R), $2.5 million related to restricted stock units payable in shares,previously recorded as liabilities, were reclassified to additional paid-in capital in the Consolidated BalanceSheet during the first quarter of 2006. Our previous practice was to accrue compensation expense for restrictedstock units payable in shares as a liability until such time as the shares were actually issued.
Share-based compensation for fiscal years 2005 and 2004 was accounted for under Accounting PrinciplesBoard Opinion No. 25 “Accounting for Stock Issued to Employees” (“APB 25”) and related interpretations (i.e.,the “intrinsic method”). See Note 16.
The following table illustrates the pro forma effect on net income (loss) and net income (loss) per commonshare had we applied the fair value recognition provisions of SFAS 123 to share-based compensation for theyears ended December 28, 2005 and December 29, 2004:
Year Ended
December 28,2005
December 29,2004
(In millions, except pershare data)
Report net loss . . . . . . . . . . . . . . . . . . . . . . . . . . . . . . . . . . . . . . . . . . . . . . $ (7.3) $(37.7)Share-based employee compensation expense included in reported net
loss, net of related taxes . . . . . . . . . . . . . . . . . . . . . . . . . . . . . . . . . . . . . 7.8 6.5Less total share-based employee compensation expense determined
under fair value based method for all awards, net of related taxeffects . . . . . . . . . . . . . . . . . . . . . . . . . . . . . . . . . . . . . . . . . . . . . . . . . . . (11.9) (9.9)
Pro forma net loss . . . . . . . . . . . . . . . . . . . . . . . . . . . . . . . . . . . . . . . . . . . $(11.4) $(41.1)
Net loss per share:Basic and diluted—as reported . . . . . . . . . . . . . . . . . . . . . . . . . . . . . . . . . $(0.08) $(0.58)
Basic and diluted—pro forma . . . . . . . . . . . . . . . . . . . . . . . . . . . . . . . . . . $(0.13) $(0.63)
Earnings Per Share. Basic earnings (loss) per share is calculated by dividing net income (loss) by theweighted average number of common shares outstanding during the period. Diluted earnings (loss) per share iscalculated by dividing net income (loss) by the weighted average number of common shares and potentialcommon shares outstanding during the period. See Note 17.
Reclassification. Certain previously reported amounts have been reclassified to conform to the currentpresentation.
New Accounting Standards.
In September 2006, the Financial Accounting Standards Board (“FASB”) issued Statement of FinancialAccounting Standards No. 158 (“SFAS 158”), “Employer’s Accounting for Defined Benefit Pension and OtherPostretirement Plans—an amendment of FASB Statements No. 87, 88, 106, and 132(R)”. SFAS 158 requiresrecognition of the overfunded or underfunded status of defined benefit postretirement plans as an asset or liabilityin the statement of financial position and recognition of changes in that funded status in comprehensive incomein the year in which the changes occur. SFAS 158 also requires measurement of the funded status of a plan as ofthe date of the statement of financial position. SFAS 158 is effective for recognition of the funded status of thebenefit plans for fiscal years ending after December 15, 2006 and is effective for the measurement dateprovisions for fiscal years ending after December 15, 2008. We adopted the recognition of the funded status andchanges in the funded status of our benefit plans in the fourth quarter of 2006. The adoption had no impact on ourConsolidated Financial Statements.
F-11

In September 2006, the FASB issued Statement of Financial Accounting Standards No. 157 (“SFAS 157”),“Fair Value Measurements.” SFAS 157 defines fair value, establishes a framework for measuring fair value ingenerally accepted accounting principles, and expands disclosures about fair value measurements. SFAS 157applies under other accounting pronouncements that require or permit fair value measurements, the FASB havingpreviously concluded in those accounting pronouncements that fair value is the relevant m easurement attribute.Accordingly, SFAS 157 does not require any new fair value measurements. SFAS No. 157 is effective for thefirst fiscal period beginning after November 15, 2007. We are required to adopt SFAS 157 in the first quarter offiscal 2008. We are currently evaluating the impact of adopting SFAS 157 on the disclosures in our ConsolidatedFinancial Statements .
In September 2006, the Securities and Exchange Commission issued Staff Accounting Bulletin No. 108(“SAB 108”), “Considering the Effects of Prior Year Misstatements when Quantifying Misstatements in CurrentYear Financial Statements,” which provides interpretive guidance on the consideration of the effects of prior yearmisstatements in quantifying current year misstatements for the purpose of a materiality assessment. SAB 108requires registrants to quantify misstatements using both the balance sheet and income statement approaches andto evaluate whether either approach results in quantifying an error that is material based on relevant quantitativeand qualitative factors. We adopted the guidance in the fourth quarter of fiscal 2006. The adoption of SAB 108did not have an impact on our Consolidated Financial Statements.
In July 2006, the FASB issued FASB Interpretation No. (“FIN”) 48 “Accounting for Uncertainty in IncomeTaxes,” which clarifies the accounting for uncertainty in income tax recognized in an entity’s financialstatements in accordance with Statement of Financial Accounting Standards No. 109 “Accounting for IncomeTaxes.” FIN 48 requires companies to determine whether it is more-likely-than-not that a tax position will besustained upon examination by the appropriate taxing authorities before any part of the benefit can be recorded inthe financial statements. This interpretation also provides guidance on derecognition, classification, accounting ininterim periods, and expanded disclosure requirements. The provisions of FIN 48 are effective for fiscal yearsbeginning after December 15, 2006, with the cumulative effect of the change in accounting principle recorded asan adjustment to opening retained earnings. We are currently evaluating the impact of adopting FIN 48 on ourfinancial statements; however, we do not expect the impact to be significant.
In June 2006, the Emerging Issues Task Force (“EITF”) ratified EITF Issue 06-3, “How Taxes CollectedFrom Customers and Remitted to Governmental Authorities Should Be Presented in the Income Statement (ThatIs, Gross versus Net Presentation).” A consensus was reached that entities may adopt a policy of presenting taxesin the income statement on either a gross or net basis. An entity should disclose its policy of presenting taxes andthe amount of any taxes presented on a gross basis should be disclosed, if significant. The guidance is effectivefor periods beginning after December 15, 2006. We present sales net of sales taxes. EITF 06-3 will not impactthe method for recording these sales taxes in our Consolidated Financial Statements.
Other accounting standards that have been issued or proposed by the FASB or other standards-setting bodiesthat do not require adoption until a future date are not expected to have a material impact on the ConsolidatedFinancial Statements upon adoption.
Note 3. Balance Sheet Adjustments
In June 2006, we adjusted certain amounts to correct an error in our accounting for receivables and certainrelated payables impacting the Consolidated Statement of Operations for the year ended December 25, 2002. Weidentified this matter as a part of our internal control review process. Though we concluded that the adjustmentswere inconsequential, we have adjusted the prior periods currently presented to reflect the correction. Theadjustments had no impact on our results of operations for the periods ended December 27, 2006,
F-12
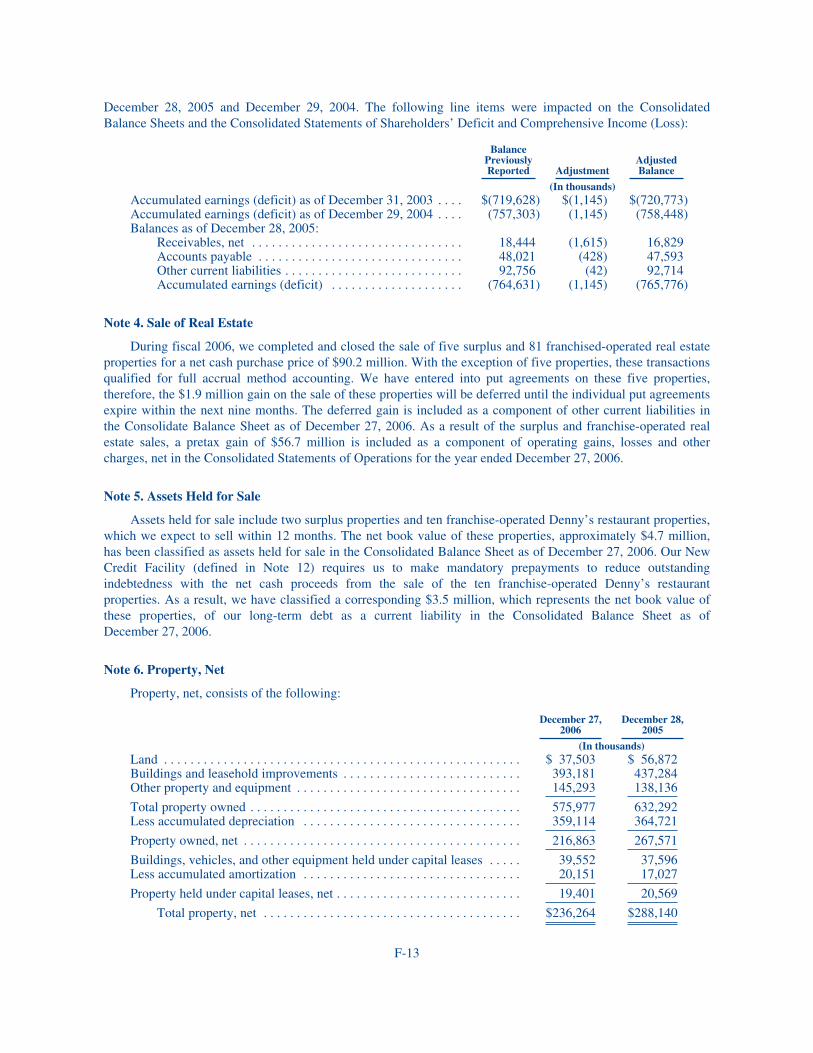
December 28, 2005 and December 29, 2004. The following line items were impacted on the ConsolidatedBalance Sheets and the Consolidated Statements of Shareholders’ Deficit and Comprehensive Income (Loss):
BalancePreviouslyReported Adjustment
AdjustedBalance
(In thousands)Accumulated earnings (deficit) as of December 31, 2003 . . . . $(719,628) $(1,145) $(720,773)Accumulated earnings (deficit) as of December 29, 2004 . . . . (757,303) (1,145) (758,448)Balances as of December 28, 2005:
Receivables, net . . . . . . . . . . . . . . . . . . . . . . . . . . . . . . . . 18,444 (1,615) 16,829Accounts payable . . . . . . . . . . . . . . . . . . . . . . . . . . . . . . . 48,021 (428) 47,593Other current liabilities . . . . . . . . . . . . . . . . . . . . . . . . . . . 92,756 (42) 92,714Accumulated earnings (deficit) . . . . . . . . . . . . . . . . . . . . (764,631) (1,145) (765,776)
Note 4. Sale of Real Estate
During fiscal 2006, we completed and closed the sale of five surplus and 81 franchised-operated real estateproperties for a net cash purchase price of $90.2 million. With the exception of five properties, these transactionsqualified for full accrual method accounting. We have entered into put agreements on these five properties,therefore, the $1.9 million gain on the sale of these properties will be deferred until the individual put agreementsexpire within the next nine months. The deferred gain is included as a component of other current liabilities inthe Consolidate Balance Sheet as of December 27, 2006. As a result of the surplus and franchise-operated realestate sales, a pretax gain of $56.7 million is included as a component of operating gains, losses and othercharges, net in the Consolidated Statements of Operations for the year ended December 27, 2006.
Note 5. Assets Held for Sale
Assets held for sale include two surplus properties and ten franchise-operated Denny’s restaurant properties,which we expect to sell within 12 months. The net book value of these properties, approximately $4.7 million,has been classified as assets held for sale in the Consolidated Balance Sheet as of December 27, 2006. Our NewCredit Facility (defined in Note 12) requires us to make mandatory prepayments to reduce outstandingindebtedness with the net cash proceeds from the sale of the ten franchise-operated Denny’s restaurantproperties. As a result, we have classified a corresponding $3.5 million, which represents the net book value ofthese properties, of our long-term debt as a current liability in the Consolidated Balance Sheet as ofDecember 27, 2006.
Note 6. Property, Net
Property, net, consists of the following:
December 27,2006
December 28,2005
(In thousands)Land . . . . . . . . . . . . . . . . . . . . . . . . . . . . . . . . . . . . . . . . . . . . . . . . . . . . . . $ 37,503 $ 56,872Buildings and leasehold improvements . . . . . . . . . . . . . . . . . . . . . . . . . . . 393,181 437,284Other property and equipment . . . . . . . . . . . . . . . . . . . . . . . . . . . . . . . . . . 145,293 138,136
Total property owned . . . . . . . . . . . . . . . . . . . . . . . . . . . . . . . . . . . . . . . . . 575,977 632,292Less accumulated depreciation . . . . . . . . . . . . . . . . . . . . . . . . . . . . . . . . . 359,114 364,721
Property owned, net . . . . . . . . . . . . . . . . . . . . . . . . . . . . . . . . . . . . . . . . . . 216,863 267,571
Buildings, vehicles, and other equipment held under capital leases . . . . . 39,552 37,596Less accumulated amortization . . . . . . . . . . . . . . . . . . . . . . . . . . . . . . . . . 20,151 17,027
Property held under capital leases, net . . . . . . . . . . . . . . . . . . . . . . . . . . . . 19,401 20,569
Total property, net . . . . . . . . . . . . . . . . . . . . . . . . . . . . . . . . . . . . . . . $236,264 $288,140
F-13
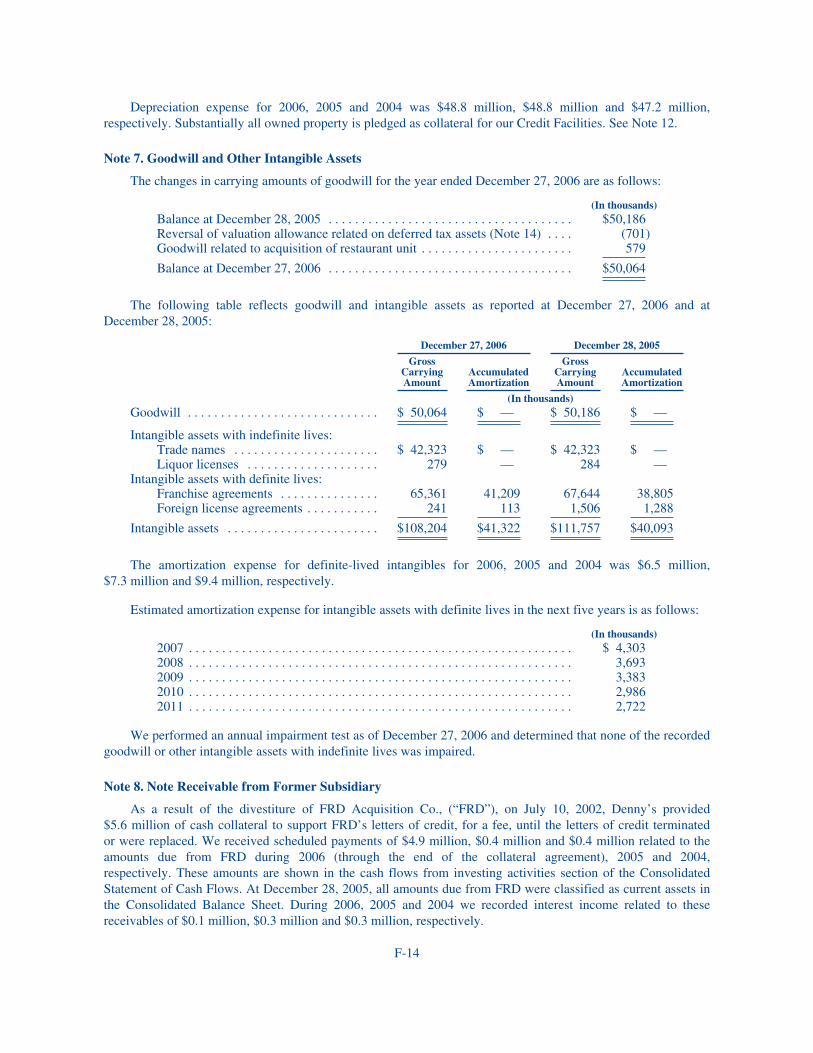
Depreciation expense for 2006, 2005 and 2004 was $48.8 million, $48.8 million and $47.2 million,respectively. Substantially all owned property is pledged as collateral for our Credit Facilities. See Note 12.
Note 7. Goodwill and Other Intangible Assets
The changes in carrying amounts of goodwill for the year ended December 27, 2006 are as follows:
(In thousands)Balance at December 28, 2005 . . . . . . . . . . . . . . . . . . . . . . . . . . . . . . . . . . . . . $50,186Reversal of valuation allowance related on deferred tax assets (Note 14) . . . . (701)Goodwill related to acquisition of restaurant unit . . . . . . . . . . . . . . . . . . . . . . . 579
Balance at December 27, 2006 . . . . . . . . . . . . . . . . . . . . . . . . . . . . . . . . . . . . . $50,064
The following table reflects goodwill and intangible assets as reported at December 27, 2006 and atDecember 28, 2005:
December 27, 2006 December 28, 2005
GrossCarryingAmount
AccumulatedAmortization
GrossCarryingAmount
AccumulatedAmortization
(In thousands)Goodwill . . . . . . . . . . . . . . . . . . . . . . . . . . . . . $ 50,064 $ — $ 50,186 $ —
Intangible assets with indefinite lives:Trade names . . . . . . . . . . . . . . . . . . . . . . $ 42,323 $ — $ 42,323 $ —Liquor licenses . . . . . . . . . . . . . . . . . . . . 279 — 284 —
Intangible assets with definite lives:Franchise agreements . . . . . . . . . . . . . . . 65,361 41,209 67,644 38,805Foreign license agreements . . . . . . . . . . . 241 113 1,506 1,288
Intangible assets . . . . . . . . . . . . . . . . . . . . . . . $108,204 $41,322 $111,757 $40,093
The amortization expense for definite-lived intangibles for 2006, 2005 and 2004 was $6.5 million,$7.3 million and $9.4 million, respectively.
Estimated amortization expense for intangible assets with definite lives in the next five years is as follows:
(In thousands)2007 . . . . . . . . . . . . . . . . . . . . . . . . . . . . . . . . . . . . . . . . . . . . . . . . . . . . . . . . . . $ 4,3032008 . . . . . . . . . . . . . . . . . . . . . . . . . . . . . . . . . . . . . . . . . . . . . . . . . . . . . . . . . . 3,6932009 . . . . . . . . . . . . . . . . . . . . . . . . . . . . . . . . . . . . . . . . . . . . . . . . . . . . . . . . . . 3,3832010 . . . . . . . . . . . . . . . . . . . . . . . . . . . . . . . . . . . . . . . . . . . . . . . . . . . . . . . . . . 2,9862011 . . . . . . . . . . . . . . . . . . . . . . . . . . . . . . . . . . . . . . . . . . . . . . . . . . . . . . . . . . 2,722
We performed an annual impairment test as of December 27, 2006 and determined that none of the recordedgoodwill or other intangible assets with indefinite lives was impaired.
Note 8. Note Receivable from Former Subsidiary
As a result of the divestiture of FRD Acquisition Co., (“FRD”), on July 10, 2002, Denny’s provided$5.6 million of cash collateral to support FRD’s letters of credit, for a fee, until the letters of credit terminatedor were replaced. We received scheduled payments of $4.9 million, $0.4 million and $0.4 million related to theamounts due from FRD during 2006 (through the end of the collateral agreement), 2005 and 2004,respectively. These amounts are shown in the cash flows from investing activities section of the ConsolidatedStatement of Cash Flows. At December 28, 2005, all amounts due from FRD were classified as current assets inthe Consolidated Balance Sheet. During 2006, 2005 and 2004 we recorded interest income related to thesereceivables of $0.1 million, $0.3 million and $0.3 million, respectively.
F-14
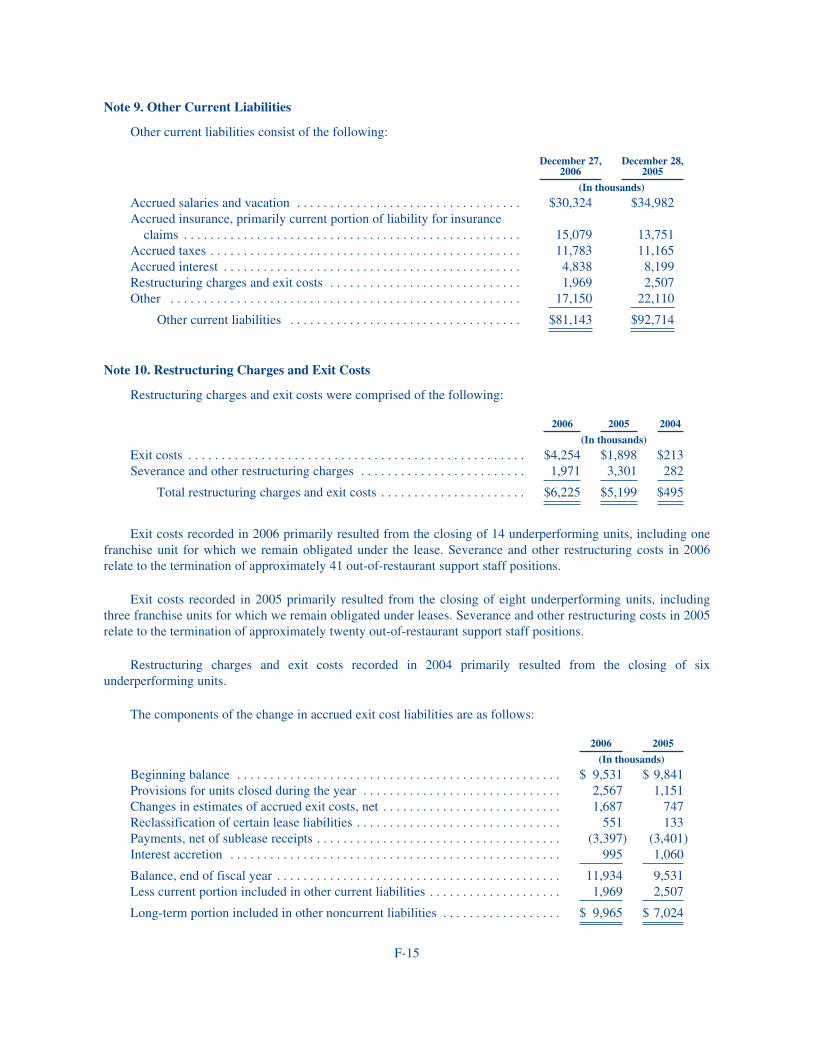
Note 9. Other Current Liabilities
Other current liabilities consist of the following:
December 27,2006
December 28,2005
(In thousands)
Accrued salaries and vacation . . . . . . . . . . . . . . . . . . . . . . . . . . . . . . . . . . $30,324 $34,982Accrued insurance, primarily current portion of liability for insurance
claims . . . . . . . . . . . . . . . . . . . . . . . . . . . . . . . . . . . . . . . . . . . . . . . . . . . 15,079 13,751Accrued taxes . . . . . . . . . . . . . . . . . . . . . . . . . . . . . . . . . . . . . . . . . . . . . . . 11,783 11,165Accrued interest . . . . . . . . . . . . . . . . . . . . . . . . . . . . . . . . . . . . . . . . . . . . . 4,838 8,199Restructuring charges and exit costs . . . . . . . . . . . . . . . . . . . . . . . . . . . . . 1,969 2,507Other . . . . . . . . . . . . . . . . . . . . . . . . . . . . . . . . . . . . . . . . . . . . . . . . . . . . . 17,150 22,110
Other current liabilities . . . . . . . . . . . . . . . . . . . . . . . . . . . . . . . . . . . $81,143 $92,714
Note 10. Restructuring Charges and Exit Costs
Restructuring charges and exit costs were comprised of the following:
2006 2005 2004
(In thousands)
Exit costs . . . . . . . . . . . . . . . . . . . . . . . . . . . . . . . . . . . . . . . . . . . . . . . . . . . $4,254 $1,898 $213Severance and other restructuring charges . . . . . . . . . . . . . . . . . . . . . . . . . 1,971 3,301 282
Total restructuring charges and exit costs . . . . . . . . . . . . . . . . . . . . . . $6,225 $5,199 $495
Exit costs recorded in 2006 primarily resulted from the closing of 14 underperforming units, including onefranchise unit for which we remain obligated under the lease. Severance and other restructuring costs in 2006relate to the termination of approximately 41 out-of-restaurant support staff positions.
Exit costs recorded in 2005 primarily resulted from the closing of eight underperforming units, includingthree franchise units for which we remain obligated under leases. Severance and other restructuring costs in 2005relate to the termination of approximately twenty out-of-restaurant support staff positions.
Restructuring charges and exit costs recorded in 2004 primarily resulted from the closing of sixunderperforming units.
The components of the change in accrued exit cost liabilities are as follows:
2006 2005
(In thousands)
Beginning balance . . . . . . . . . . . . . . . . . . . . . . . . . . . . . . . . . . . . . . . . . . . . . . . . . $ 9,531 $ 9,841Provisions for units closed during the year . . . . . . . . . . . . . . . . . . . . . . . . . . . . . . 2,567 1,151Changes in estimates of accrued exit costs, net . . . . . . . . . . . . . . . . . . . . . . . . . . . 1,687 747Reclassification of certain lease liabilities . . . . . . . . . . . . . . . . . . . . . . . . . . . . . . . 551 133Payments, net of sublease receipts . . . . . . . . . . . . . . . . . . . . . . . . . . . . . . . . . . . . . (3,397) (3,401)Interest accretion . . . . . . . . . . . . . . . . . . . . . . . . . . . . . . . . . . . . . . . . . . . . . . . . . . 995 1,060
Balance, end of fiscal year . . . . . . . . . . . . . . . . . . . . . . . . . . . . . . . . . . . . . . . . . . . 11,934 9,531Less current portion included in other current liabilities . . . . . . . . . . . . . . . . . . . . 1,969 2,507
Long-term portion included in other noncurrent liabilities . . . . . . . . . . . . . . . . . . $ 9,965 $ 7,024
F-15
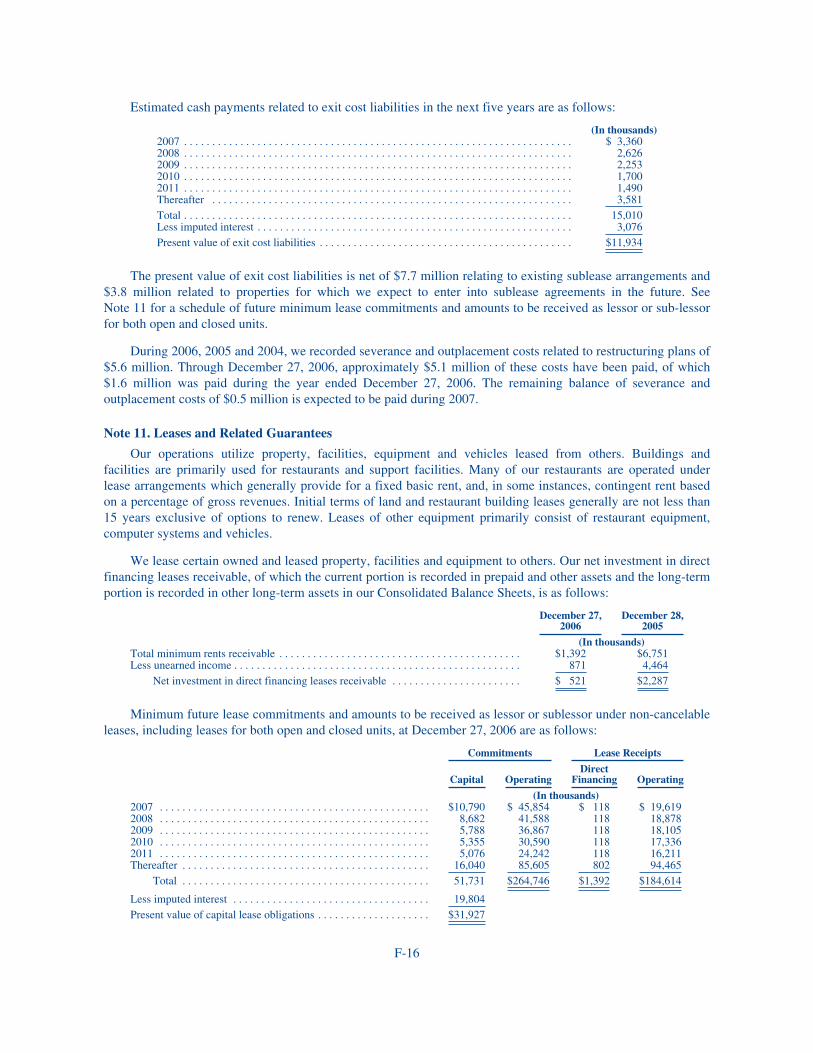
Estimated cash payments related to exit cost liabilities in the next five years are as follows:
(In thousands)2007 . . . . . . . . . . . . . . . . . . . . . . . . . . . . . . . . . . . . . . . . . . . . . . . . . . . . . . . . . . . . . . . . . . . . . $ 3,3602008 . . . . . . . . . . . . . . . . . . . . . . . . . . . . . . . . . . . . . . . . . . . . . . . . . . . . . . . . . . . . . . . . . . . . . 2,6262009 . . . . . . . . . . . . . . . . . . . . . . . . . . . . . . . . . . . . . . . . . . . . . . . . . . . . . . . . . . . . . . . . . . . . . 2,2532010 . . . . . . . . . . . . . . . . . . . . . . . . . . . . . . . . . . . . . . . . . . . . . . . . . . . . . . . . . . . . . . . . . . . . . 1,7002011 . . . . . . . . . . . . . . . . . . . . . . . . . . . . . . . . . . . . . . . . . . . . . . . . . . . . . . . . . . . . . . . . . . . . . 1,490Thereafter . . . . . . . . . . . . . . . . . . . . . . . . . . . . . . . . . . . . . . . . . . . . . . . . . . . . . . . . . . . . . . . . 3,581Total . . . . . . . . . . . . . . . . . . . . . . . . . . . . . . . . . . . . . . . . . . . . . . . . . . . . . . . . . . . . . . . . . . . . . 15,010Less imputed interest . . . . . . . . . . . . . . . . . . . . . . . . . . . . . . . . . . . . . . . . . . . . . . . . . . . . . . . . 3,076Present value of exit cost liabilities . . . . . . . . . . . . . . . . . . . . . . . . . . . . . . . . . . . . . . . . . . . . . $11,934
The present value of exit cost liabilities is net of $7.7 million relating to existing sublease arrangements and$3.8 million related to properties for which we expect to enter into sublease agreements in the future. SeeNote 11 for a schedule of future minimum lease commitments and amounts to be received as lessor or sub-lessorfor both open and closed units.
During 2006, 2005 and 2004, we recorded severance and outplacement costs related to restructuring plans of$5.6 million. Through December 27, 2006, approximately $5.1 million of these costs have been paid, of which$1.6 million was paid during the year ended December 27, 2006. The remaining balance of severance andoutplacement costs of $0.5 million is expected to be paid during 2007.
Note 11. Leases and Related Guarantees
Our operations utilize property, facilities, equipment and vehicles leased from others. Buildings andfacilities are primarily used for restaurants and support facilities. Many of our restaurants are operated underlease arrangements which generally provide for a fixed basic rent, and, in some instances, contingent rent basedon a percentage of gross revenues. Initial terms of land and restaurant building leases generally are not less than15 years exclusive of options to renew. Leases of other equipment primarily consist of restaurant equipment,computer systems and vehicles.
We lease certain owned and leased property, facilities and equipment to others. Our net investment in directfinancing leases receivable, of which the current portion is recorded in prepaid and other assets and the long-termportion is recorded in other long-term assets in our Consolidated Balance Sheets, is as follows:
December 27,2006
December 28,2005
(In thousands)Total minimum rents receivable . . . . . . . . . . . . . . . . . . . . . . . . . . . . . . . . . . . . . . . . . . . $1,392 $6,751Less unearned income . . . . . . . . . . . . . . . . . . . . . . . . . . . . . . . . . . . . . . . . . . . . . . . . . . . 871 4,464
Net investment in direct financing leases receivable . . . . . . . . . . . . . . . . . . . . . . . $ 521 $2,287
Minimum future lease commitments and amounts to be received as lessor or sublessor under non-cancelableleases, including leases for both open and closed units, at December 27, 2006 are as follows:
Commitments Lease Receipts
Capital OperatingDirect
Financing Operating
(In thousands)2007 . . . . . . . . . . . . . . . . . . . . . . . . . . . . . . . . . . . . . . . . . . . . . . . . $10,790 $ 45,854 $ 118 $ 19,6192008 . . . . . . . . . . . . . . . . . . . . . . . . . . . . . . . . . . . . . . . . . . . . . . . . 8,682 41,588 118 18,8782009 . . . . . . . . . . . . . . . . . . . . . . . . . . . . . . . . . . . . . . . . . . . . . . . . 5,788 36,867 118 18,1052010 . . . . . . . . . . . . . . . . . . . . . . . . . . . . . . . . . . . . . . . . . . . . . . . . 5,355 30,590 118 17,3362011 . . . . . . . . . . . . . . . . . . . . . . . . . . . . . . . . . . . . . . . . . . . . . . . . 5,076 24,242 118 16,211Thereafter . . . . . . . . . . . . . . . . . . . . . . . . . . . . . . . . . . . . . . . . . . . . 16,040 85,605 802 94,465
Total . . . . . . . . . . . . . . . . . . . . . . . . . . . . . . . . . . . . . . . . . . . . 51,731 $264,746 $1,392 $184,614
Less imputed interest . . . . . . . . . . . . . . . . . . . . . . . . . . . . . . . . . . . 19,804Present value of capital lease obligations . . . . . . . . . . . . . . . . . . . . $31,927
F-16
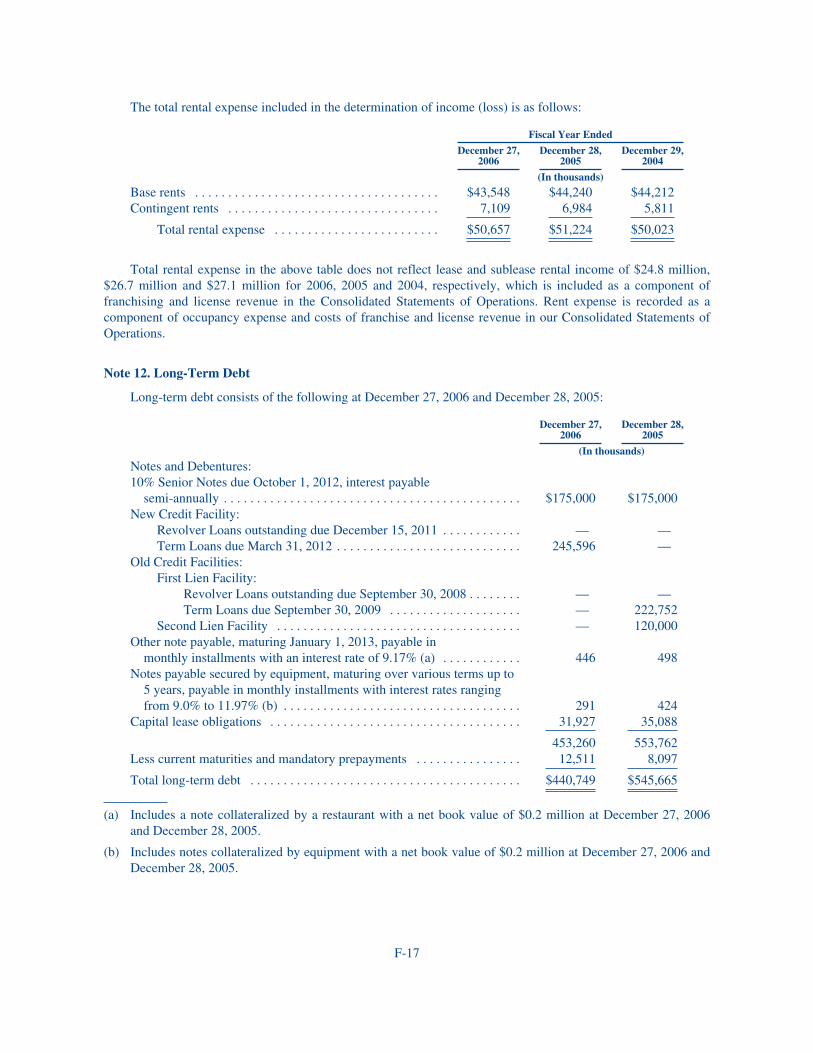
The total rental expense included in the determination of income (loss) is as follows:
Fiscal Year Ended
December 27,2006
December 28,2005
December 29,2004
(In thousands)
Base rents . . . . . . . . . . . . . . . . . . . . . . . . . . . . . . . . . . . . . $43,548 $44,240 $44,212Contingent rents . . . . . . . . . . . . . . . . . . . . . . . . . . . . . . . . 7,109 6,984 5,811
Total rental expense . . . . . . . . . . . . . . . . . . . . . . . . . $50,657 $51,224 $50,023
Total rental expense in the above table does not reflect lease and sublease rental income of $24.8 million,$26.7 million and $27.1 million for 2006, 2005 and 2004, respectively, which is included as a component offranchising and license revenue in the Consolidated Statements of Operations. Rent expense is recorded as acomponent of occupancy expense and costs of franchise and license revenue in our Consolidated Statements ofOperations.
Note 12. Long-Term Debt
Long-term debt consists of the following at December 27, 2006 and December 28, 2005:
December 27,2006
December 28,2005
(In thousands)
Notes and Debentures:10% Senior Notes due October 1, 2012, interest payable
semi-annually . . . . . . . . . . . . . . . . . . . . . . . . . . . . . . . . . . . . . . . . . . . . . $175,000 $175,000New Credit Facility:
Revolver Loans outstanding due December 15, 2011 . . . . . . . . . . . . — —Term Loans due March 31, 2012 . . . . . . . . . . . . . . . . . . . . . . . . . . . . 245,596 —
Old Credit Facilities:First Lien Facility:
Revolver Loans outstanding due September 30, 2008 . . . . . . . . — —Term Loans due September 30, 2009 . . . . . . . . . . . . . . . . . . . . — 222,752
Second Lien Facility . . . . . . . . . . . . . . . . . . . . . . . . . . . . . . . . . . . . . — 120,000Other note payable, maturing January 1, 2013, payable in
monthly installments with an interest rate of 9.17% (a) . . . . . . . . . . . . 446 498Notes payable secured by equipment, maturing over various terms up to
5 years, payable in monthly installments with interest rates rangingfrom 9.0% to 11.97% (b) . . . . . . . . . . . . . . . . . . . . . . . . . . . . . . . . . . . . 291 424
Capital lease obligations . . . . . . . . . . . . . . . . . . . . . . . . . . . . . . . . . . . . . . 31,927 35,088
453,260 553,762Less current maturities and mandatory prepayments . . . . . . . . . . . . . . . . 12,511 8,097
Total long-term debt . . . . . . . . . . . . . . . . . . . . . . . . . . . . . . . . . . . . . . . . . $440,749 $545,665
(a) Includes a note collateralized by a restaurant with a net book value of $0.2 million at December 27, 2006and December 28, 2005.
(b) Includes notes collateralized by equipment with a net book value of $0.2 million at December 27, 2006 andDecember 28, 2005.
F-17
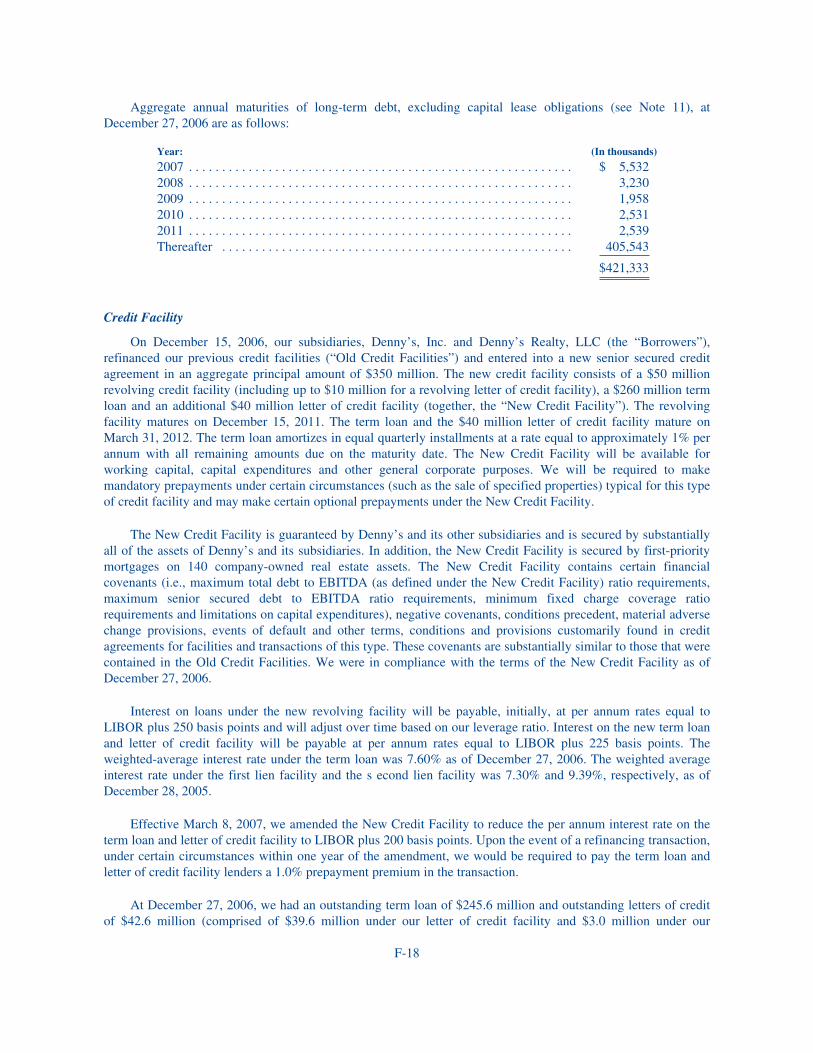
Aggregate annual maturities of long-term debt, excluding capital lease obligations (see Note 11), atDecember 27, 2006 are as follows:
Year: (In thousands)
2007 . . . . . . . . . . . . . . . . . . . . . . . . . . . . . . . . . . . . . . . . . . . . . . . . . . . . . . . . . . $ 5,5322008 . . . . . . . . . . . . . . . . . . . . . . . . . . . . . . . . . . . . . . . . . . . . . . . . . . . . . . . . . . 3,2302009 . . . . . . . . . . . . . . . . . . . . . . . . . . . . . . . . . . . . . . . . . . . . . . . . . . . . . . . . . . 1,9582010 . . . . . . . . . . . . . . . . . . . . . . . . . . . . . . . . . . . . . . . . . . . . . . . . . . . . . . . . . . 2,5312011 . . . . . . . . . . . . . . . . . . . . . . . . . . . . . . . . . . . . . . . . . . . . . . . . . . . . . . . . . . 2,539Thereafter . . . . . . . . . . . . . . . . . . . . . . . . . . . . . . . . . . . . . . . . . . . . . . . . . . . . . 405,543
$421,333
Credit Facility
On December 15, 2006, our subsidiaries, Denny’s, Inc. and Denny’s Realty, LLC (the “Borrowers”),refinanced our previous credit facilities (“Old Credit Facilities”) and entered into a new senior secured creditagreement in an aggregate principal amount of $350 million. The new credit facility consists of a $50 millionrevolving credit facility (including up to $10 million for a revolving letter of credit facility), a $260 million termloan and an additional $40 million letter of credit facility (together, the “New Credit Facility”). The revolvingfacility matures on December 15, 2011. The term loan and the $40 million letter of credit facility mature onMarch 31, 2012. The term loan amortizes in equal quarterly installments at a rate equal to approximately 1% perannum with all remaining amounts due on the maturity date. The New Credit Facility will be available forworking capital, capital expenditures and other general corporate purposes. We will be required to makemandatory prepayments under certain circumstances (such as the sale of specified properties) typical for this typeof credit facility and may make certain optional prepayments under the New Credit Facility.
The New Credit Facility is guaranteed by Denny’s and its other subsidiaries and is secured by substantiallyall of the assets of Denny’s and its subsidiaries. In addition, the New Credit Facility is secured by first-prioritymortgages on 140 company-owned real estate assets. The New Credit Facility contains certain financialcovenants (i.e., maximum total debt to EBITDA (as defined under the New Credit Facility) ratio requirements,maximum senior secured debt to EBITDA ratio requirements, minimum fixed charge coverage ratiorequirements and limitations on capital expenditures), negative covenants, conditions precedent, material adversechange provisions, events of default and other terms, conditions and provisions customarily found in creditagreements for facilities and transactions of this type. These covenants are substantially similar to those that werecontained in the Old Credit Facilities. We were in compliance with the terms of the New Credit Facility as ofDecember 27, 2006.
Interest on loans under the new revolving facility will be payable, initially, at per annum rates equal toLIBOR plus 250 basis points and will adjust over time based on our leverage ratio. Interest on the new term loanand letter of credit facility will be payable at per annum rates equal to LIBOR plus 225 basis points. Theweighted-average interest rate under the term loan was 7.60% as of December 27, 2006. The weighted averageinterest rate under the first lien facility and the s econd lien facility was 7.30% and 9.39%, respectively, as ofDecember 28, 2005.
Effective March 8, 2007, we amended the New Credit Facility to reduce the per annum interest rate on theterm loan and letter of credit facility to LIBOR plus 200 basis points. Upon the event of a refinancing transaction,under certain circumstances within one year of the amendment, we would be required to pay the term loan andletter of credit facility lenders a 1.0% prepayment premium in the transaction.
At December 27, 2006, we had an outstanding term loan of $245.6 million and outstanding letters of creditof $42.6 million (comprised of $39.6 million under our letter of credit facility and $3.0 million under our
F-18
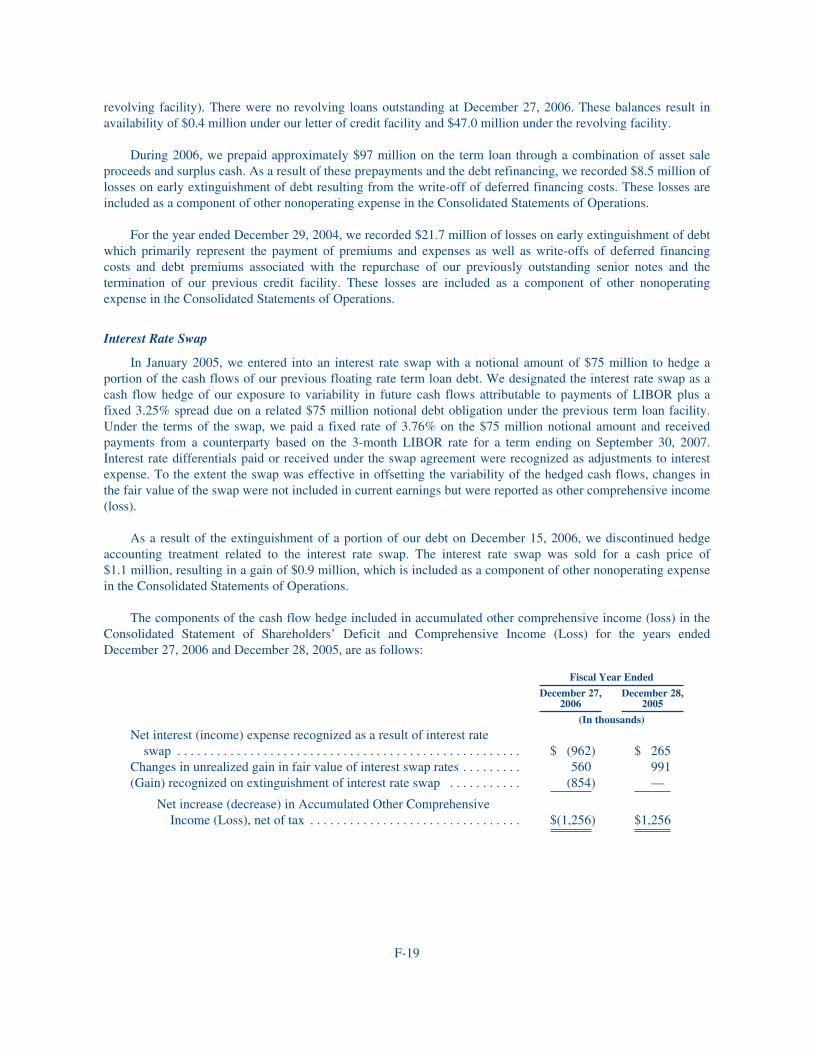
revolving facility). There were no revolving loans outstanding at December 27, 2006. These balances result inavailability of $0.4 million under our letter of credit facility and $47.0 million under the revolving facility.
During 2006, we prepaid approximately $97 million on the term loan through a combination of asset saleproceeds and surplus cash. As a result of these prepayments and the debt refinancing, we recorded $8.5 million oflosses on early extinguishment of debt resulting from the write-off of deferred financing costs. These losses areincluded as a component of other nonoperating expense in the Consolidated Statements of Operations.
For the year ended December 29, 2004, we recorded $21.7 million of losses on early extinguishment of debtwhich primarily represent the payment of premiums and expenses as well as write-offs of deferred financingcosts and debt premiums associated with the repurchase of our previously outstanding senior notes and thetermination of our previous credit facility. These losses are included as a component of other nonoperatingexpense in the Consolidated Statements of Operations.
Interest Rate Swap
In January 2005, we entered into an interest rate swap with a notional amount of $75 million to hedge aportion of the cash flows of our previous floating rate term loan debt. We designated the interest rate swap as acash flow hedge of our exposure to variability in future cash flows attributable to payments of LIBOR plus afixed 3.25% spread due on a related $75 million notional debt obligation under the previous term loan facility.Under the terms of the swap, we paid a fixed rate of 3.76% on the $75 million notional amount and receivedpayments from a counterparty based on the 3-month LIBOR rate for a term ending on September 30, 2007.Interest rate differentials paid or received under the swap agreement were recognized as adjustments to interestexpense. To the extent the swap was effective in offsetting the variability of the hedged cash flows, changes inthe fair value of the swap were not included in current earnings but were reported as other comprehensive income(loss).
As a result of the extinguishment of a portion of our debt on December 15, 2006, we discontinued hedgeaccounting treatment related to the interest rate swap. The interest rate swap was sold for a cash price of$1.1 million, resulting in a gain of $0.9 million, which is included as a component of other nonoperating expensein the Consolidated Statements of Operations.
The components of the cash flow hedge included in accumulated other comprehensive income (loss) in theConsolidated Statement of Shareholders’ Deficit and Comprehensive Income (Loss) for the years endedDecember 27, 2006 and December 28, 2005, are as follows:
Fiscal Year Ended
December 27,2006
December 28,2005
(In thousands)
Net interest (income) expense recognized as a result of interest rateswap . . . . . . . . . . . . . . . . . . . . . . . . . . . . . . . . . . . . . . . . . . . . . . . . . . . . $ (962) $ 265
Changes in unrealized gain in fair value of interest swap rates . . . . . . . . . 560 991(Gain) recognized on extinguishment of interest rate swap . . . . . . . . . . . (854) —
Net increase (decrease) in Accumulated Other ComprehensiveIncome (Loss), net of tax . . . . . . . . . . . . . . . . . . . . . . . . . . . . . . . . $(1,256) $1,256
F-19

10% Senior Notes Due 2012
On October 5, 2004, Denny’s Holdings issued $175 million aggregate principal amount of its 10% SeniorNotes due 2012 (the “10% Notes”). The 10% Notes are irrevocably, fully and unconditionally guaranteed on asenior basis by Denny’s Corporation. The 10% Notes are general, unsecured senior obligations of Denny’sHoldings, and rank equal in right of payment to all existing and future indebtedness and other obligations that arenot, by their terms, expressly subordinated in right of payment to the 10% Notes; rank senior in right of paymentto all existing and future subordinated indebtedness; and are effectively subordinated to all existing and futuresecured debt to the extent of the value of the assets securing such debt and structurally subordinated to allindebtedness and other liabilities of the subsidiaries of Denny’s Holdings, including the New Credit Facility. The10% Notes bear interest at the rate of 10% per year, payable semi-annually in arrears on April 1 and October 1 ofeach year. The 10% Notes mature on October 1, 2012.
At any time on or after October 1, 2008, Denny’s Holdings may redeem all or a portion of the 10% Notesfor cash at its option, upon not less than 30 days nor more than 60 days notice to each holder of 10% Notes, at thefollowing redemption prices (expressed as percentages of the principal amount) if redeemed during the 12-monthperiod commencing October 1 of the years indicated below, in each case together with accrued and unpaidinterest and liquidated damages, if any, thereon to the date of redemption of the 10% Notes (the “RedemptionDate”):
Year: Percentage
2008 . . . . . . . . . . . . . . . . . . . . . . . . . . . . . . . . . . . . . . . . . . . . . . . . . . . . . . . . . . . . 105.0%2009 . . . . . . . . . . . . . . . . . . . . . . . . . . . . . . . . . . . . . . . . . . . . . . . . . . . . . . . . . . . . 102.5%2010 and thereafter . . . . . . . . . . . . . . . . . . . . . . . . . . . . . . . . . . . . . . . . . . . . . . . . . 100.0%
At any time on or prior to October 1, 2007, upon one or more Qualified Equity Offerings (as defined in theindenture governing the 10% Notes (the “Indenture”)) for cash, up to 35% of the aggregate principal amount ofthe 10% Notes issued pursuant to the Indenture may be redeemed at the option of Denny’s Holdings within90 days of such Qualified Equity Offering, on not less than 30 days, but not more than 60 days, notice to eachholder of the 10% Notes to be redeemed, with cash contributed to Denny’s Holdings from the cash proceeds ofsuch Qualified Equity Offering, at a redemption price equal to 110% of the principal amount, together withaccrued and unpaid interest and Liquidated Damages, if any, thereon to the Redemption Date; provided,however, that immediately following such redemption not less than 65% of the aggregate principal amount of the10% Notes originally issued pursuant to the Indenture remain outstanding.
The Indenture contains certain covenants limiting the ability of Denny’s Holdings and its subsidiaries (butnot its parent, Denny’s Corporation) to, among other things, incur additional indebtedness (including disqualifiedcapital stock); pay dividends or make distributions or certain other restricted payments; make certaininvestments; create liens on our assets to secure debt; enter into sale and leaseback transactions; enter intotransactions with affiliates; merge or consolidate with another company; sell, lease or otherwise dispose of all orsubstantially all of its assets; enter into new lines of business; and guarantee indebtedness. These covenants aresubject to a number of important limitations and exceptions.
The Indenture is fully and unconditionally guaranteed by Denny’s Corporation. Denny’s Corporation is aholding company with no independent assets or operations, other than as related to the ownership of the commonstock of Denny’s Holdings and its status as a holding company. Denny’s Corporation is not subject to therestrictive covenants in the Indenture. Denny’s Holdings is restricted from paying dividends and makingdistributions to Denny’s Corporation under the terms of the Indenture.
F-20
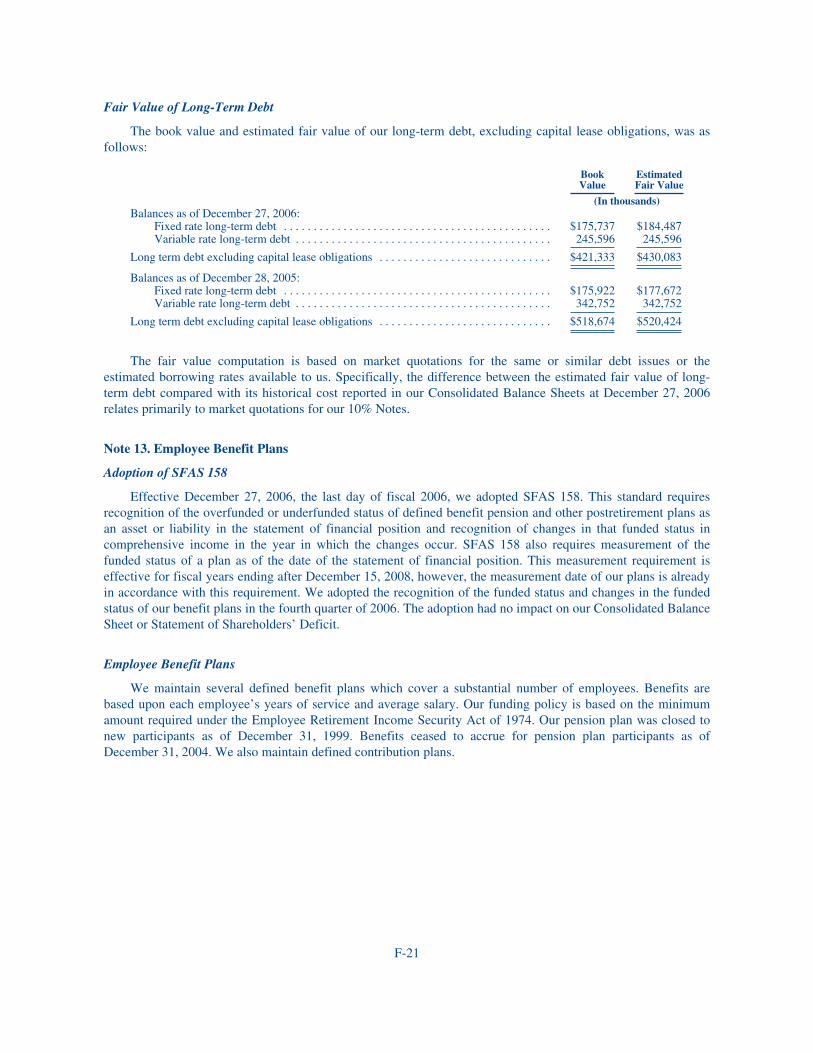
Fair Value of Long-Term Debt
The book value and estimated fair value of our long-term debt, excluding capital lease obligations, was asfollows:
BookValue
EstimatedFair Value
(In thousands)Balances as of December 27, 2006:
Fixed rate long-term debt . . . . . . . . . . . . . . . . . . . . . . . . . . . . . . . . . . . . . . . . . . . . . $175,737 $184,487Variable rate long-term debt . . . . . . . . . . . . . . . . . . . . . . . . . . . . . . . . . . . . . . . . . . . 245,596 245,596
Long term debt excluding capital lease obligations . . . . . . . . . . . . . . . . . . . . . . . . . . . . . $421,333 $430,083
Balances as of December 28, 2005:Fixed rate long-term debt . . . . . . . . . . . . . . . . . . . . . . . . . . . . . . . . . . . . . . . . . . . . . $175,922 $177,672Variable rate long-term debt . . . . . . . . . . . . . . . . . . . . . . . . . . . . . . . . . . . . . . . . . . . 342,752 342,752
Long term debt excluding capital lease obligations . . . . . . . . . . . . . . . . . . . . . . . . . . . . . $518,674 $520,424
The fair value computation is based on market quotations for the same or similar debt issues or theestimated borrowing rates available to us. Specifically, the difference between the estimated fair value of long-term debt compared with its historical cost reported in our Consolidated Balance Sheets at December 27, 2006relates primarily to market quotations for our 10% Notes.
Note 13. Employee Benefit Plans
Adoption of SFAS 158
Effective December 27, 2006, the last day of fiscal 2006, we adopted SFAS 158. This standard requiresrecognition of the overfunded or underfunded status of defined benefit pension and other postretirement plans asan asset or liability in the statement of financial position and recognition of changes in that funded status incomprehensive income in the year in which the changes occur. SFAS 158 also requires measurement of thefunded status of a plan as of the date of the statement of financial position. This measurement requirement iseffective for fiscal years ending after December 15, 2008, however, the measurement date of our plans is alreadyin accordance with this requirement. We adopted the recognition of the funded status and changes in the fundedstatus of our benefit plans in the fourth quarter of 2006. The adoption had no impact on our Consolidated BalanceSheet or Statement of Shareholders’ Deficit.
Employee Benefit Plans
We maintain several defined benefit plans which cover a substantial number of employees. Benefits arebased upon each employee’s years of service and average salary. Our funding policy is based on the minimumamount required under the Employee Retirement Income Security Act of 1974. Our pension plan was closed tonew participants as of December 31, 1999. Benefits ceased to accrue for pension plan participants as ofDecember 31, 2004. We also maintain defined contribution plans.
F-21
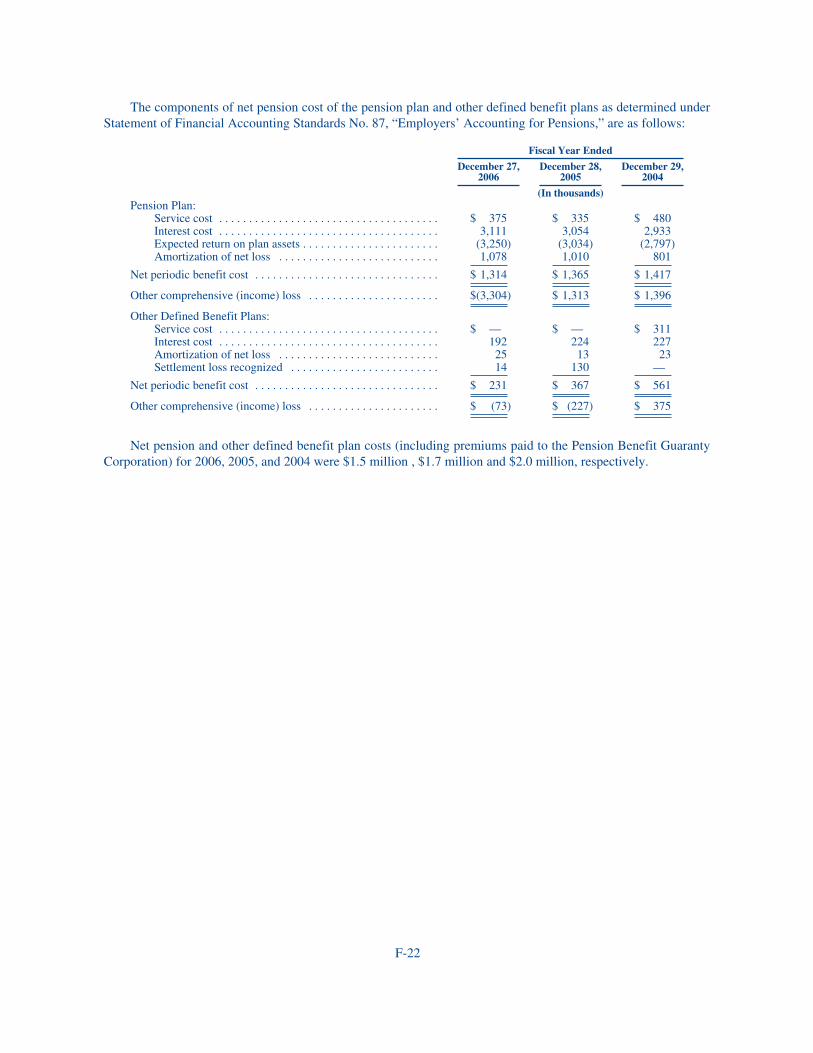
The components of net pension cost of the pension plan and other defined benefit plans as determined underStatement of Financial Accounting Standards No. 87, “Employers’ Accounting for Pensions,” are as follows:
Fiscal Year Ended
December 27,2006
December 28,2005
December 29,2004
(In thousands)Pension Plan:
Service cost . . . . . . . . . . . . . . . . . . . . . . . . . . . . . . . . . . . . . $ 375 $ 335 $ 480Interest cost . . . . . . . . . . . . . . . . . . . . . . . . . . . . . . . . . . . . . 3,111 3,054 2,933Expected return on plan assets . . . . . . . . . . . . . . . . . . . . . . . (3,250) (3,034) (2,797)Amortization of net loss . . . . . . . . . . . . . . . . . . . . . . . . . . . 1,078 1,010 801
Net periodic benefit cost . . . . . . . . . . . . . . . . . . . . . . . . . . . . . . . $ 1,314 $ 1,365 $ 1,417
Other comprehensive (income) loss . . . . . . . . . . . . . . . . . . . . . . $(3,304) $ 1,313 $ 1,396
Other Defined Benefit Plans:Service cost . . . . . . . . . . . . . . . . . . . . . . . . . . . . . . . . . . . . . $ — $ — $ 311Interest cost . . . . . . . . . . . . . . . . . . . . . . . . . . . . . . . . . . . . . 192 224 227Amortization of net loss . . . . . . . . . . . . . . . . . . . . . . . . . . . 25 13 23Settlement loss recognized . . . . . . . . . . . . . . . . . . . . . . . . . 14 130 —
Net periodic benefit cost . . . . . . . . . . . . . . . . . . . . . . . . . . . . . . . $ 231 $ 367 $ 561
Other comprehensive (income) loss . . . . . . . . . . . . . . . . . . . . . . $ (73) $ (227) $ 375
Net pension and other defined benefit plan costs (including premiums paid to the Pension Benefit GuarantyCorporation) for 2006, 2005, and 2004 were $1.5 million , $1.7 million and $2.0 million, respectively.
F-22
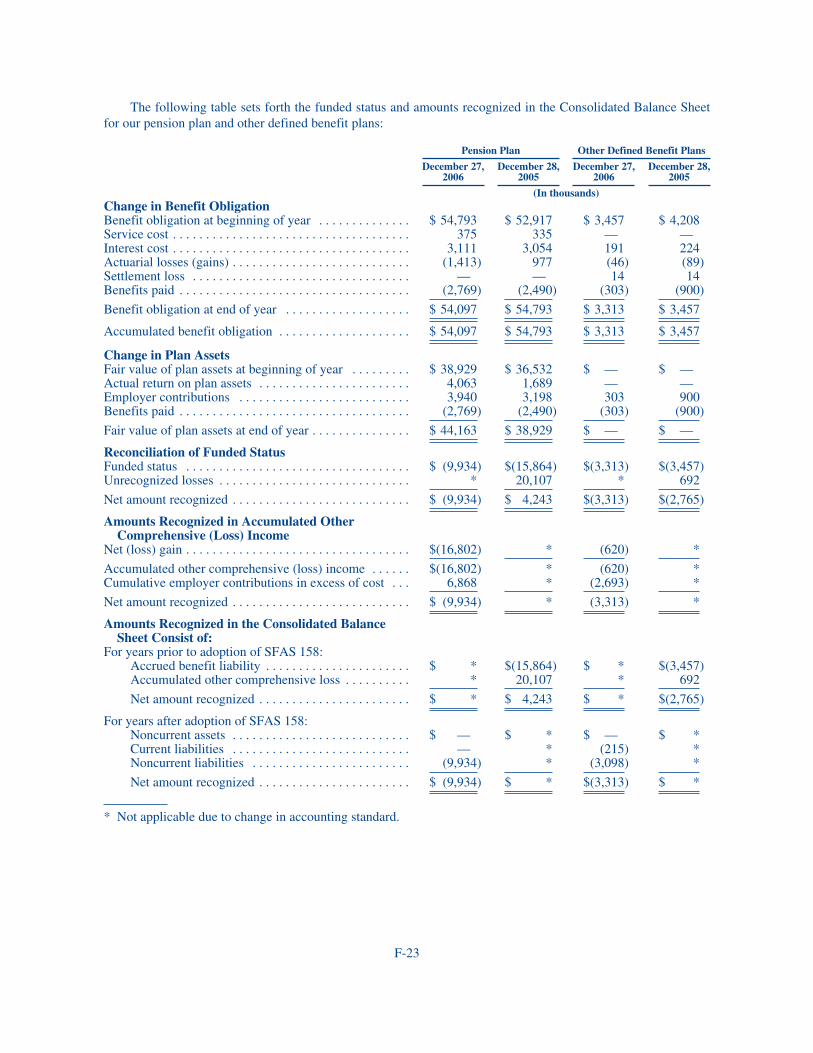
The following table sets forth the funded status and amounts recognized in the Consolidated Balance Sheetfor our pension plan and other defined benefit plans:
Pension Plan Other Defined Benefit Plans
December 27,2006
December 28,2005
December 27,2006
December 28,2005
(In thousands)Change in Benefit ObligationBenefit obligation at beginning of year . . . . . . . . . . . . . . $ 54,793 $ 52,917 $ 3,457 $ 4,208Service cost . . . . . . . . . . . . . . . . . . . . . . . . . . . . . . . . . . . . 375 335 — —Interest cost . . . . . . . . . . . . . . . . . . . . . . . . . . . . . . . . . . . . 3,111 3,054 191 224Actuarial losses (gains) . . . . . . . . . . . . . . . . . . . . . . . . . . . (1,413) 977 (46) (89)Settlement loss . . . . . . . . . . . . . . . . . . . . . . . . . . . . . . . . . — — 14 14Benefits paid . . . . . . . . . . . . . . . . . . . . . . . . . . . . . . . . . . . (2,769) (2,490) (303) (900)
Benefit obligation at end of year . . . . . . . . . . . . . . . . . . . $ 54,097 $ 54,793 $ 3,313 $ 3,457
Accumulated benefit obligation . . . . . . . . . . . . . . . . . . . . $ 54,097 $ 54,793 $ 3,313 $ 3,457
Change in Plan AssetsFair value of plan assets at beginning of year . . . . . . . . . $ 38,929 $ 36,532 $ — $ —Actual return on plan assets . . . . . . . . . . . . . . . . . . . . . . . 4,063 1,689 — —Employer contributions . . . . . . . . . . . . . . . . . . . . . . . . . . 3,940 3,198 303 900Benefits paid . . . . . . . . . . . . . . . . . . . . . . . . . . . . . . . . . . . (2,769) (2,490) (303) (900)
Fair value of plan assets at end of year . . . . . . . . . . . . . . . $ 44,163 $ 38,929 $ — $ —
Reconciliation of Funded StatusFunded status . . . . . . . . . . . . . . . . . . . . . . . . . . . . . . . . . . $ (9,934) $(15,864) $(3,313) $(3,457)Unrecognized losses . . . . . . . . . . . . . . . . . . . . . . . . . . . . . * 20,107 * 692
Net amount recognized . . . . . . . . . . . . . . . . . . . . . . . . . . . $ (9,934) $ 4,243 $(3,313) $(2,765)
Amounts Recognized in Accumulated OtherComprehensive (Loss) Income
Net (loss) gain . . . . . . . . . . . . . . . . . . . . . . . . . . . . . . . . . . $(16,802) * (620) *
Accumulated other comprehensive (loss) income . . . . . . $(16,802) * (620) *Cumulative employer contributions in excess of cost . . . 6,868 * (2,693) *
Net amount recognized . . . . . . . . . . . . . . . . . . . . . . . . . . . $ (9,934) * (3,313) *
Amounts Recognized in the Consolidated BalanceSheet Consist of:
For years prior to adoption of SFAS 158:Accrued benefit liability . . . . . . . . . . . . . . . . . . . . . . $ * $(15,864) $ * $(3,457)Accumulated other comprehensive loss . . . . . . . . . . * 20,107 * 692
Net amount recognized . . . . . . . . . . . . . . . . . . . . . . . $ * $ 4,243 $ * $(2,765)
For years after adoption of SFAS 158:Noncurrent assets . . . . . . . . . . . . . . . . . . . . . . . . . . . $ — $ * $ — $ *Current liabilities . . . . . . . . . . . . . . . . . . . . . . . . . . . — * (215) *Noncurrent liabilities . . . . . . . . . . . . . . . . . . . . . . . . (9,934) * (3,098) *
Net amount recognized . . . . . . . . . . . . . . . . . . . . . . . $ (9,934) $ * $(3,313) $ *
* Not applicable due to change in accounting standard.
F-23
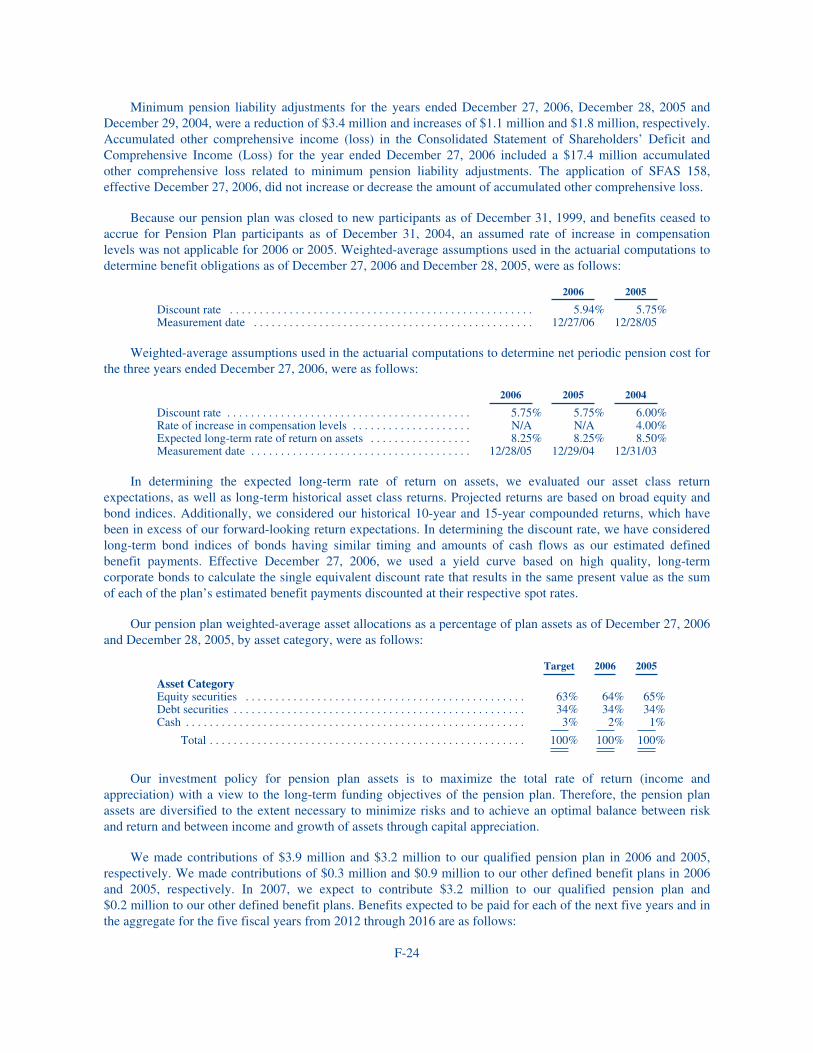
Minimum pension liability adjustments for the years ended December 27, 2006, December 28, 2005 andDecember 29, 2004, were a reduction of $3.4 million and increases of $1.1 million and $1.8 million, respectively.Accumulated other comprehensive income (loss) in the Consolidated Statement of Shareholders’ Deficit andComprehensive Income (Loss) for the year ended December 27, 2006 included a $17.4 million accumulatedother comprehensive loss related to minimum pension liability adjustments. The application of SFAS 158,effective December 27, 2006, did not increase or decrease the amount of accumulated other comprehensive loss.
Because our pension plan was closed to new participants as of December 31, 1999, and benefits ceased toaccrue for Pension Plan participants as of December 31, 2004, an assumed rate of increase in compensationlevels was not applicable for 2006 or 2005. Weighted-average assumptions used in the actuarial computations todetermine benefit obligations as of December 27, 2006 and December 28, 2005, were as follows:
2006 2005
Discount rate . . . . . . . . . . . . . . . . . . . . . . . . . . . . . . . . . . . . . . . . . . . . . . . . . . . 5.94% 5.75%Measurement date . . . . . . . . . . . . . . . . . . . . . . . . . . . . . . . . . . . . . . . . . . . . . . . 12/27/06 12/28/05
Weighted-average assumptions used in the actuarial computations to determine net periodic pension cost forthe three years ended December 27, 2006, were as follows:
2006 2005 2004
Discount rate . . . . . . . . . . . . . . . . . . . . . . . . . . . . . . . . . . . . . . . . . 5.75% 5.75% 6.00%Rate of increase in compensation levels . . . . . . . . . . . . . . . . . . . . N/A N/A 4.00%Expected long-term rate of return on assets . . . . . . . . . . . . . . . . . 8.25% 8.25% 8.50%Measurement date . . . . . . . . . . . . . . . . . . . . . . . . . . . . . . . . . . . . . 12/28/05 12/29/04 12/31/03
In determining the expected long-term rate of return on assets, we evaluated our asset class returnexpectations, as well as long-term historical asset class returns. Projected returns are based on broad equity andbond indices. Additionally, we considered our historical 10-year and 15-year compounded returns, which havebeen in excess of our forward-looking return expectations. In determining the discount rate, we have consideredlong-term bond indices of bonds having similar timing and amounts of cash flows as our estimated definedbenefit payments. Effective December 27, 2006, we used a yield curve based on high quality, long-termcorporate bonds to calculate the single equivalent discount rate that results in the same present value as the sumof each of the plan’s estimated benefit payments discounted at their respective spot rates.
Our pension plan weighted-average asset allocations as a percentage of plan assets as of December 27, 2006and December 28, 2005, by asset category, were as follows:
Target 2006 2005
Asset CategoryEquity securities . . . . . . . . . . . . . . . . . . . . . . . . . . . . . . . . . . . . . . . . . . . . . . . 63% 64% 65%Debt securities . . . . . . . . . . . . . . . . . . . . . . . . . . . . . . . . . . . . . . . . . . . . . . . . . 34% 34% 34%Cash . . . . . . . . . . . . . . . . . . . . . . . . . . . . . . . . . . . . . . . . . . . . . . . . . . . . . . . . . 3% 2% 1%
Total . . . . . . . . . . . . . . . . . . . . . . . . . . . . . . . . . . . . . . . . . . . . . . . . . . . . . 100% 100% 100%
Our investment policy for pension plan assets is to maximize the total rate of return (income andappreciation) with a view to the long-term funding objectives of the pension plan. Therefore, the pension planassets are diversified to the extent necessary to minimize risks and to achieve an optimal balance between riskand return and between income and growth of assets through capital appreciation.
We made contributions of $3.9 million and $3.2 million to our qualified pension plan in 2006 and 2005,respectively. We made contributions of $0.3 million and $0.9 million to our other defined benefit plans in 2006and 2005, respectively. In 2007, we expect to contribute $3.2 million to our qualified pension plan and$0.2 million to our other defined benefit plans. Benefits expected to be paid for each of the next five years and inthe aggregate for the five fiscal years from 2012 through 2016 are as follows:
F-24
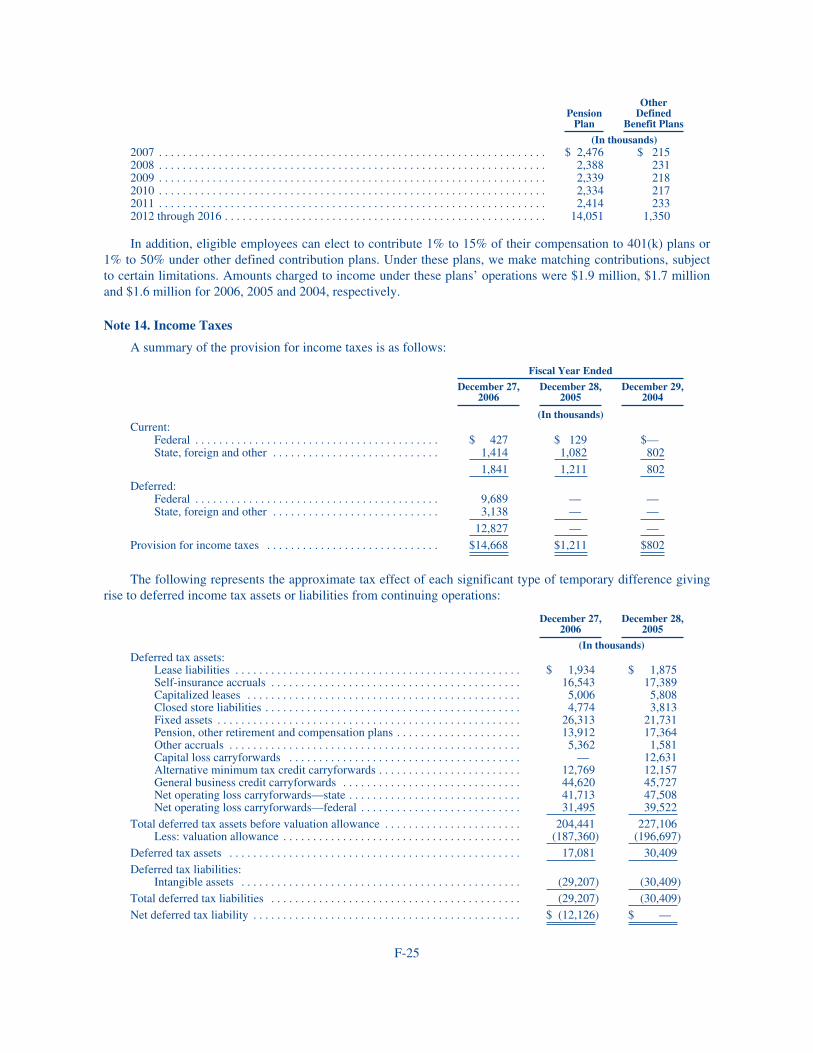
PensionPlan
OtherDefined
Benefit Plans
(In thousands)2007 . . . . . . . . . . . . . . . . . . . . . . . . . . . . . . . . . . . . . . . . . . . . . . . . . . . . . . . . . . . . . . . . . $ 2,476 $ 2152008 . . . . . . . . . . . . . . . . . . . . . . . . . . . . . . . . . . . . . . . . . . . . . . . . . . . . . . . . . . . . . . . . . 2,388 2312009 . . . . . . . . . . . . . . . . . . . . . . . . . . . . . . . . . . . . . . . . . . . . . . . . . . . . . . . . . . . . . . . . . 2,339 2182010 . . . . . . . . . . . . . . . . . . . . . . . . . . . . . . . . . . . . . . . . . . . . . . . . . . . . . . . . . . . . . . . . . 2,334 2172011 . . . . . . . . . . . . . . . . . . . . . . . . . . . . . . . . . . . . . . . . . . . . . . . . . . . . . . . . . . . . . . . . . 2,414 2332012 through 2016 . . . . . . . . . . . . . . . . . . . . . . . . . . . . . . . . . . . . . . . . . . . . . . . . . . . . . . 14,051 1,350
In addition, eligible employees can elect to contribute 1% to 15% of their compensation to 401(k) plans or1% to 50% under other defined contribution plans. Under these plans, we make matching contributions, subjectto certain limitations. Amounts charged to income under these plans’ operations were $1.9 million, $1.7 millionand $1.6 million for 2006, 2005 and 2004, respectively.
Note 14. Income Taxes
A summary of the provision for income taxes is as follows:
Fiscal Year Ended
December 27,2006
December 28,2005
December 29,2004
(In thousands)Current:
Federal . . . . . . . . . . . . . . . . . . . . . . . . . . . . . . . . . . . . . . . . . $ 427 $ 129 $—State, foreign and other . . . . . . . . . . . . . . . . . . . . . . . . . . . . 1,414 1,082 802
1,841 1,211 802
Deferred:Federal . . . . . . . . . . . . . . . . . . . . . . . . . . . . . . . . . . . . . . . . . 9,689 — —State, foreign and other . . . . . . . . . . . . . . . . . . . . . . . . . . . . 3,138 — —
12,827 — —
Provision for income taxes . . . . . . . . . . . . . . . . . . . . . . . . . . . . . $14,668 $1,211 $802
The following represents the approximate tax effect of each significant type of temporary difference givingrise to deferred income tax assets or liabilities from continuing operations:
December 27,2006
December 28,2005
(In thousands)Deferred tax assets:
Lease liabilities . . . . . . . . . . . . . . . . . . . . . . . . . . . . . . . . . . . . . . . . . . . . . . . . $ 1,934 $ 1,875Self-insurance accruals . . . . . . . . . . . . . . . . . . . . . . . . . . . . . . . . . . . . . . . . . . 16,543 17,389Capitalized leases . . . . . . . . . . . . . . . . . . . . . . . . . . . . . . . . . . . . . . . . . . . . . . 5,006 5,808Closed store liabilities . . . . . . . . . . . . . . . . . . . . . . . . . . . . . . . . . . . . . . . . . . . 4,774 3,813Fixed assets . . . . . . . . . . . . . . . . . . . . . . . . . . . . . . . . . . . . . . . . . . . . . . . . . . . 26,313 21,731Pension, other retirement and compensation plans . . . . . . . . . . . . . . . . . . . . . 13,912 17,364Other accruals . . . . . . . . . . . . . . . . . . . . . . . . . . . . . . . . . . . . . . . . . . . . . . . . . 5,362 1,581Capital loss carryforwards . . . . . . . . . . . . . . . . . . . . . . . . . . . . . . . . . . . . . . . — 12,631Alternative minimum tax credit carryforwards . . . . . . . . . . . . . . . . . . . . . . . . 12,769 12,157General business credit carryforwards . . . . . . . . . . . . . . . . . . . . . . . . . . . . . . 44,620 45,727Net operating loss carryforwards—state . . . . . . . . . . . . . . . . . . . . . . . . . . . . . 41,713 47,508Net operating loss carryforwards—federal . . . . . . . . . . . . . . . . . . . . . . . . . . . 31,495 39,522
Total deferred tax assets before valuation allowance . . . . . . . . . . . . . . . . . . . . . . . 204,441 227,106Less: valuation allowance . . . . . . . . . . . . . . . . . . . . . . . . . . . . . . . . . . . . . . . . (187,360) (196,697)
Deferred tax assets . . . . . . . . . . . . . . . . . . . . . . . . . . . . . . . . . . . . . . . . . . . . . . . . . 17,081 30,409Deferred tax liabilities:
Intangible assets . . . . . . . . . . . . . . . . . . . . . . . . . . . . . . . . . . . . . . . . . . . . . . . (29,207) (30,409)Total deferred tax liabilities . . . . . . . . . . . . . . . . . . . . . . . . . . . . . . . . . . . . . . . . . . (29,207) (30,409)Net deferred tax liability . . . . . . . . . . . . . . . . . . . . . . . . . . . . . . . . . . . . . . . . . . . . . $ (12,126) $ —
F-25
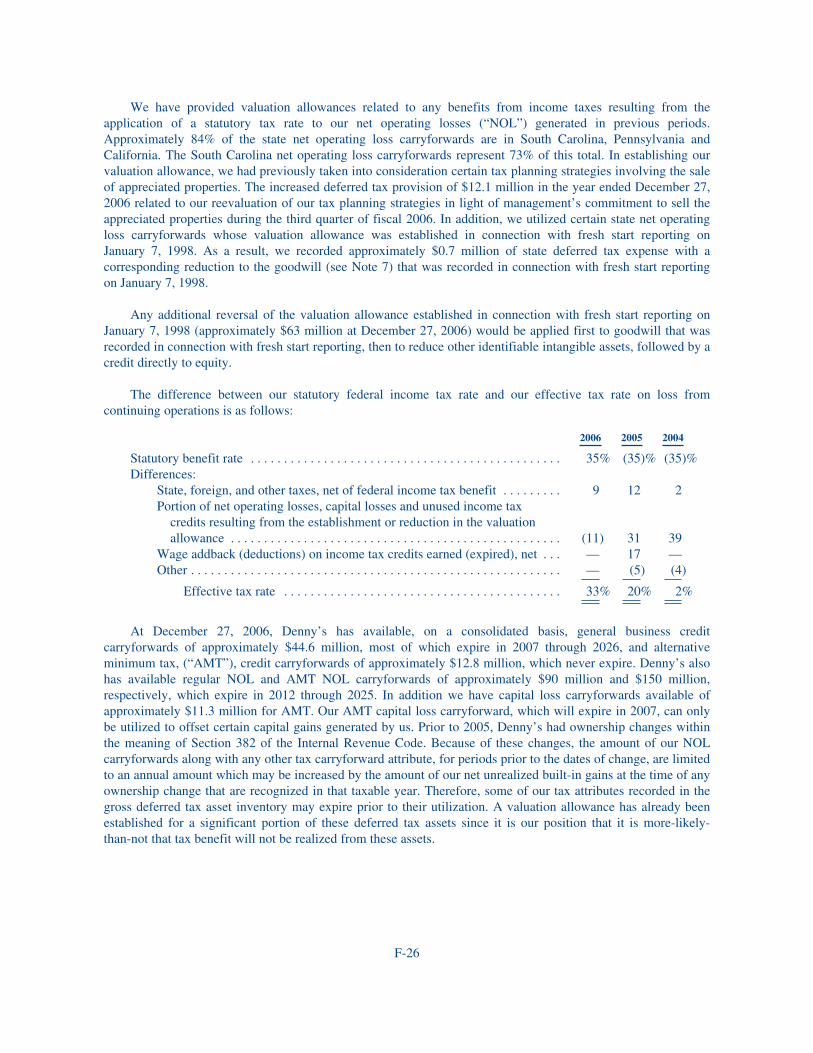
We have provided valuation allowances related to any benefits from income taxes resulting from theapplication of a statutory tax rate to our net operating losses (“NOL”) generated in previous periods.Approximately 84% of the state net operating loss carryforwards are in South Carolina, Pennsylvania andCalifornia. The South Carolina net operating loss carryforwards represent 73% of this total. In establishing ourvaluation allowance, we had previously taken into consideration certain tax planning strategies involving the saleof appreciated properties. The increased deferred tax provision of $12.1 million in the year ended December 27,2006 related to our reevaluation of our tax planning strategies in light of management’s commitment to sell theappreciated properties during the third quarter of fiscal 2006. In addition, we utilized certain state net operatingloss carryforwards whose valuation allowance was established in connection with fresh start reporting onJanuary 7, 1998. As a result, we recorded approximately $0.7 million of state deferred tax expense with acorresponding reduction to the goodwill (see Note 7) that was recorded in connection with fresh start reportingon January 7, 1998.
Any additional reversal of the valuation allowance established in connection with fresh start reporting onJanuary 7, 1998 (approximately $63 million at December 27, 2006) would be applied first to goodwill that wasrecorded in connection with fresh start reporting, then to reduce other identifiable intangible assets, followed by acredit directly to equity.
The difference between our statutory federal income tax rate and our effective tax rate on loss fromcontinuing operations is as follows:
2006 2005 2004
Statutory benefit rate . . . . . . . . . . . . . . . . . . . . . . . . . . . . . . . . . . . . . . . . . . . . . . . 35% (35)% (35)%Differences:
State, foreign, and other taxes, net of federal income tax benefit . . . . . . . . . 9 12 2Portion of net operating losses, capital losses and unused income tax
credits resulting from the establishment or reduction in the valuationallowance . . . . . . . . . . . . . . . . . . . . . . . . . . . . . . . . . . . . . . . . . . . . . . . . . . (11) 31 39
Wage addback (deductions) on income tax credits earned (expired), net . . . — 17 —Other . . . . . . . . . . . . . . . . . . . . . . . . . . . . . . . . . . . . . . . . . . . . . . . . . . . . . . . . — (5) (4)
Effective tax rate . . . . . . . . . . . . . . . . . . . . . . . . . . . . . . . . . . . . . . . . . . 33% 20% 2%
At December 27, 2006, Denny’s has available, on a consolidated basis, general business creditcarryforwards of approximately $44.6 million, most of which expire in 2007 through 2026, and alternativeminimum tax, (“AMT”), credit carryforwards of approximately $12.8 million, which never expire. Denny’s alsohas available regular NOL and AMT NOL carryforwards of approximately $90 million and $150 million,respectively, which expire in 2012 through 2025. In addition we have capital loss carryforwards available ofapproximately $11.3 million for AMT. Our AMT capital loss carryforward, which will expire in 2007, can onlybe utilized to offset certain capital gains generated by us. Prior to 2005, Denny’s had ownership changes withinthe meaning of Section 382 of the Internal Revenue Code. Because of these changes, the amount of our NOLcarryforwards along with any other tax carryforward attribute, for periods prior to the dates of change, are limitedto an annual amount which may be increased by the amount of our net unrealized built-in gains at the time of anyownership change that are recognized in that taxable year. Therefore, some of our tax attributes recorded in thegross deferred tax asset inventory may expire prior to their utilization. A valuation allowance has already beenestablished for a significant portion of these deferred tax assets since it is our position that it is more-likely-than-not that tax benefit will not be realized from these assets.
F-26
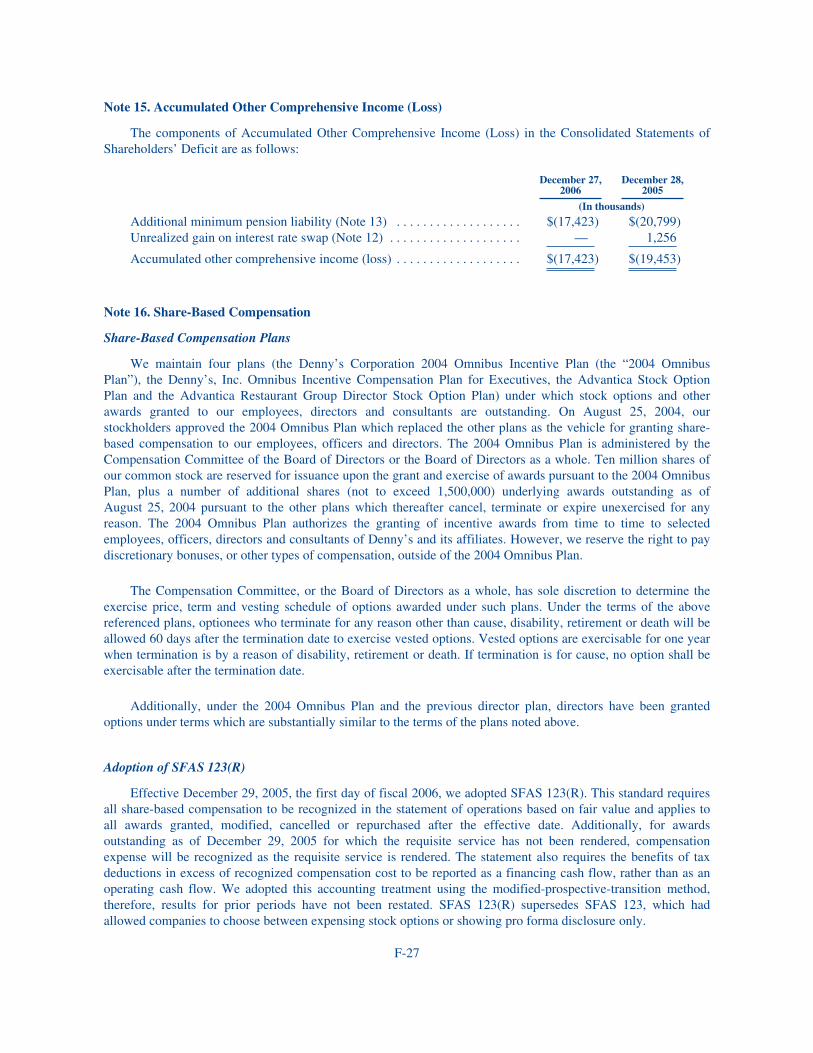
Note 15. Accumulated Other Comprehensive Income (Loss)
The components of Accumulated Other Comprehensive Income (Loss) in the Consolidated Statements ofShareholders’ Deficit are as follows:
December 27,2006
December 28,2005
(In thousands)
Additional minimum pension liability (Note 13) . . . . . . . . . . . . . . . . . . . $(17,423) $(20,799)Unrealized gain on interest rate swap (Note 12) . . . . . . . . . . . . . . . . . . . . — 1,256
Accumulated other comprehensive income (loss) . . . . . . . . . . . . . . . . . . . $(17,423) $(19,453)
Note 16. Share-Based Compensation
Share-Based Compensation Plans
We maintain four plans (the Denny’s Corporation 2004 Omnibus Incentive Plan (the “2004 OmnibusPlan”), the Denny’s, Inc. Omnibus Incentive Compensation Plan for Executives, the Advantica Stock OptionPlan and the Advantica Restaurant Group Director Stock Option Plan) under which stock options and otherawards granted to our employees, directors and consultants are outstanding. On August 25, 2004, ourstockholders approved the 2004 Omnibus Plan which replaced the other plans as the vehicle for granting share-based compensation to our employees, officers and directors. The 2004 Omnibus Plan is administered by theCompensation Committee of the Board of Directors or the Board of Directors as a whole. Ten million shares ofour common stock are reserved for issuance upon the grant and exercise of awards pursuant to the 2004 OmnibusPlan, plus a number of additional shares (not to exceed 1,500,000) underlying awards outstanding as ofAugust 25, 2004 pursuant to the other plans which thereafter cancel, terminate or expire unexercised for anyreason. The 2004 Omnibus Plan authorizes the granting of incentive awards from time to time to selectedemployees, officers, directors and consultants of Denny’s and its affiliates. However, we reserve the right to paydiscretionary bonuses, or other types of compensation, outside of the 2004 Omnibus Plan.
The Compensation Committee, or the Board of Directors as a whole, has sole discretion to determine theexercise price, term and vesting schedule of options awarded under such plans. Under the terms of the abovereferenced plans, optionees who terminate for any reason other than cause, disability, retirement or death will beallowed 60 days after the termination date to exercise vested options. Vested options are exercisable for one yearwhen termination is by a reason of disability, retirement or death. If termination is for cause, no option shall beexercisable after the termination date.
Additionally, under the 2004 Omnibus Plan and the previous director plan, directors have been grantedoptions under terms which are substantially similar to the terms of the plans noted above.
Adoption of SFAS 123(R)
Effective December 29, 2005, the first day of fiscal 2006, we adopted SFAS 123(R). This standard requiresall share-based compensation to be recognized in the statement of operations based on fair value and applies toall awards granted, modified, cancelled or repurchased after the effective date. Additionally, for awardsoutstanding as of December 29, 2005 for which the requisite service has not been rendered, compensationexpense will be recognized as the requisite service is rendered. The statement also requires the benefits of taxdeductions in excess of recognized compensation cost to be reported as a financing cash flow, rather than as anoperating cash flow. We adopted this accounting treatment using the modified-prospective-transition method,therefore, results for prior periods have not been restated. SFAS 123(R) supersedes SFAS 123, which hadallowed companies to choose between expensing stock options or showing pro forma disclosure only.
F-27
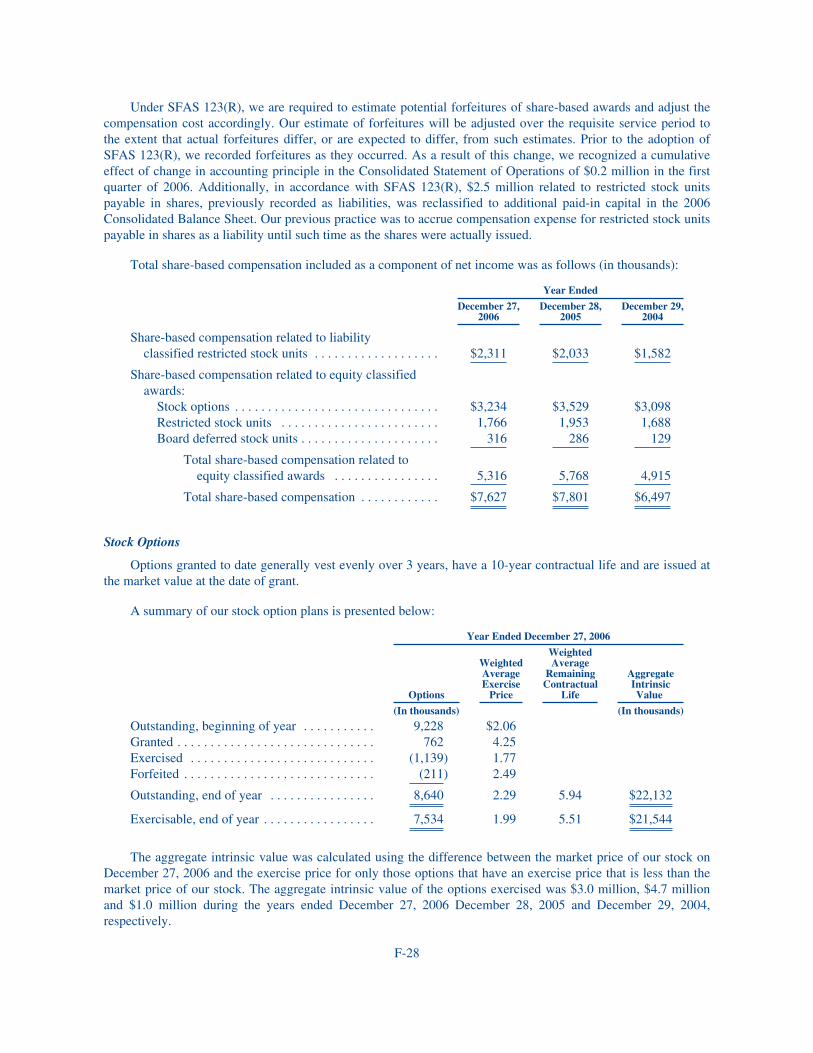
Under SFAS 123(R), we are required to estimate potential forfeitures of share-based awards and adjust thecompensation cost accordingly. Our estimate of forfeitures will be adjusted over the requisite service period tothe extent that actual forfeitures differ, or are expected to differ, from such estimates. Prior to the adoption ofSFAS 123(R), we recorded forfeitures as they occurred. As a result of this change, we recognized a cumulativeeffect of change in accounting principle in the Consolidated Statement of Operations of $0.2 million in the firstquarter of 2006. Additionally, in accordance with SFAS 123(R), $2.5 million related to restricted stock unitspayable in shares, previously recorded as liabilities, was reclassified to additional paid-in capital in the 2006Consolidated Balance Sheet. Our previous practice was to accrue compensation expense for restricted stock unitspayable in shares as a liability until such time as the shares were actually issued.
Total share-based compensation included as a component of net income was as follows (in thousands):
Year Ended
December 27,2006
December 28,2005
December 29,2004
Share-based compensation related to liabilityclassified restricted stock units . . . . . . . . . . . . . . . . . . . $2,311 $2,033 $1,582
Share-based compensation related to equity classifiedawards:
Stock options . . . . . . . . . . . . . . . . . . . . . . . . . . . . . . . $3,234 $3,529 $3,098Restricted stock units . . . . . . . . . . . . . . . . . . . . . . . . 1,766 1,953 1,688Board deferred stock units . . . . . . . . . . . . . . . . . . . . . 316 286 129
Total share-based compensation related toequity classified awards . . . . . . . . . . . . . . . . 5,316 5,768 4,915
Total share-based compensation . . . . . . . . . . . . $7,627 $7,801 $6,497
Stock Options
Options granted to date generally vest evenly over 3 years, have a 10-year contractual life and are issued atthe market value at the date of grant.
A summary of our stock option plans is presented below:
Year Ended December 27, 2006
Options
WeightedAverageExercise
Price
WeightedAverage
RemainingContractual
Life
AggregateIntrinsicValue
(In thousands) (In thousands)
Outstanding, beginning of year . . . . . . . . . . . 9,228 $2.06Granted . . . . . . . . . . . . . . . . . . . . . . . . . . . . . . 762 4.25Exercised . . . . . . . . . . . . . . . . . . . . . . . . . . . . (1,139) 1.77Forfeited . . . . . . . . . . . . . . . . . . . . . . . . . . . . . (211) 2.49
Outstanding, end of year . . . . . . . . . . . . . . . . 8,640 2.29 5.94 $22,132
Exercisable, end of year . . . . . . . . . . . . . . . . . 7,534 1.99 5.51 $21,544
The aggregate intrinsic value was calculated using the difference between the market price of our stock onDecember 27, 2006 and the exercise price for only those options that have an exercise price that is less than themarket price of our stock. The aggregate intrinsic value of the options exercised was $3.0 million, $4.7 millionand $1.0 million during the years ended December 27, 2006 December 28, 2005 and December 29, 2004,respectively.
F-28
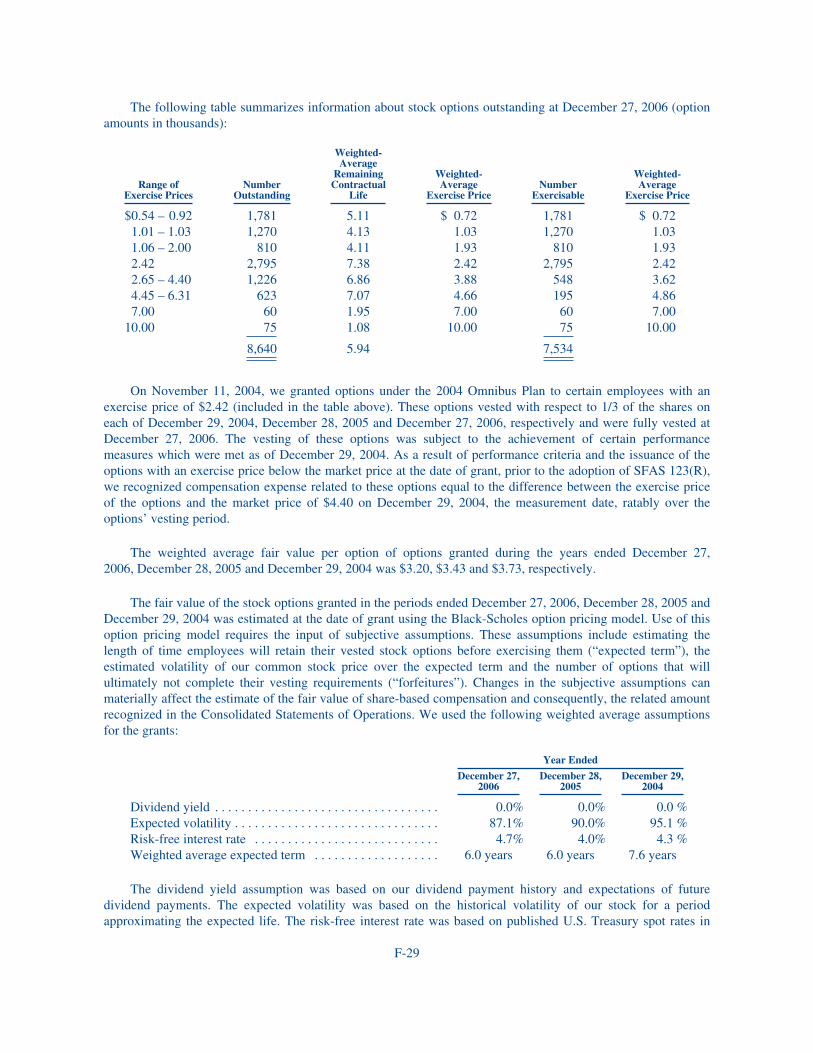
The following table summarizes information about stock options outstanding at December 27, 2006 (optionamounts in thousands):
Range ofExercise Prices
NumberOutstanding
Weighted-Average
RemainingContractual
Life
Weighted-Average
Exercise PriceNumber
Exercisable
Weighted-Average
Exercise Price
$0.54 – 0.92 1,781 5.11 $ 0.72 1,781 $ 0.721.01 – 1.03 1,270 4.13 1.03 1,270 1.031.06 – 2.00 810 4.11 1.93 810 1.932.42 2,795 7.38 2.42 2,795 2.422.65 – 4.40 1,226 6.86 3.88 548 3.624.45 – 6.31 623 7.07 4.66 195 4.867.00 60 1.95 7.00 60 7.00
10.00 75 1.08 10.00 75 10.00
8,640 5.94 7,534
On November 11, 2004, we granted options under the 2004 Omnibus Plan to certain employees with anexercise price of $2.42 (included in the table above). These options vested with respect to 1/3 of the shares oneach of December 29, 2004, December 28, 2005 and December 27, 2006, respectively and were fully vested atDecember 27, 2006. The vesting of these options was subject to the achievement of certain performancemeasures which were met as of December 29, 2004. As a result of performance criteria and the issuance of theoptions with an exercise price below the market price at the date of grant, prior to the adoption of SFAS 123(R),we recognized compensation expense related to these options equal to the difference between the exercise priceof the options and the market price of $4.40 on December 29, 2004, the measurement date, ratably over theoptions’ vesting period.
The weighted average fair value per option of options granted during the years ended December 27,2006, December 28, 2005 and December 29, 2004 was $3.20, $3.43 and $3.73, respectively.
The fair value of the stock options granted in the periods ended December 27, 2006, December 28, 2005 andDecember 29, 2004 was estimated at the date of grant using the Black-Scholes option pricing model. Use of thisoption pricing model requires the input of subjective assumptions. These assumptions include estimating thelength of time employees will retain their vested stock options before exercising them (“expected term”), theestimated volatility of our common stock price over the expected term and the number of options that willultimately not complete their vesting requirements (“forfeitures”). Changes in the subjective assumptions canmaterially affect the estimate of the fair value of share-based compensation and consequently, the related amountrecognized in the Consolidated Statements of Operations. We used the following weighted average assumptionsfor the grants:
Year Ended
December 27,2006
December 28,2005
December 29,2004
Dividend yield . . . . . . . . . . . . . . . . . . . . . . . . . . . . . . . . . . 0.0% 0.0% 0.0 %Expected volatility . . . . . . . . . . . . . . . . . . . . . . . . . . . . . . . 87.1% 90.0% 95.1 %Risk-free interest rate . . . . . . . . . . . . . . . . . . . . . . . . . . . . 4.7% 4.0% 4.3 %Weighted average expected term . . . . . . . . . . . . . . . . . . . 6.0 years 6.0 years 7.6 years
The dividend yield assumption was based on our dividend payment history and expectations of futuredividend payments. The expected volatility was based on the historical volatility of our stock for a periodapproximating the expected life. The risk-free interest rate was based on published U.S. Treasury spot rates in
F-29
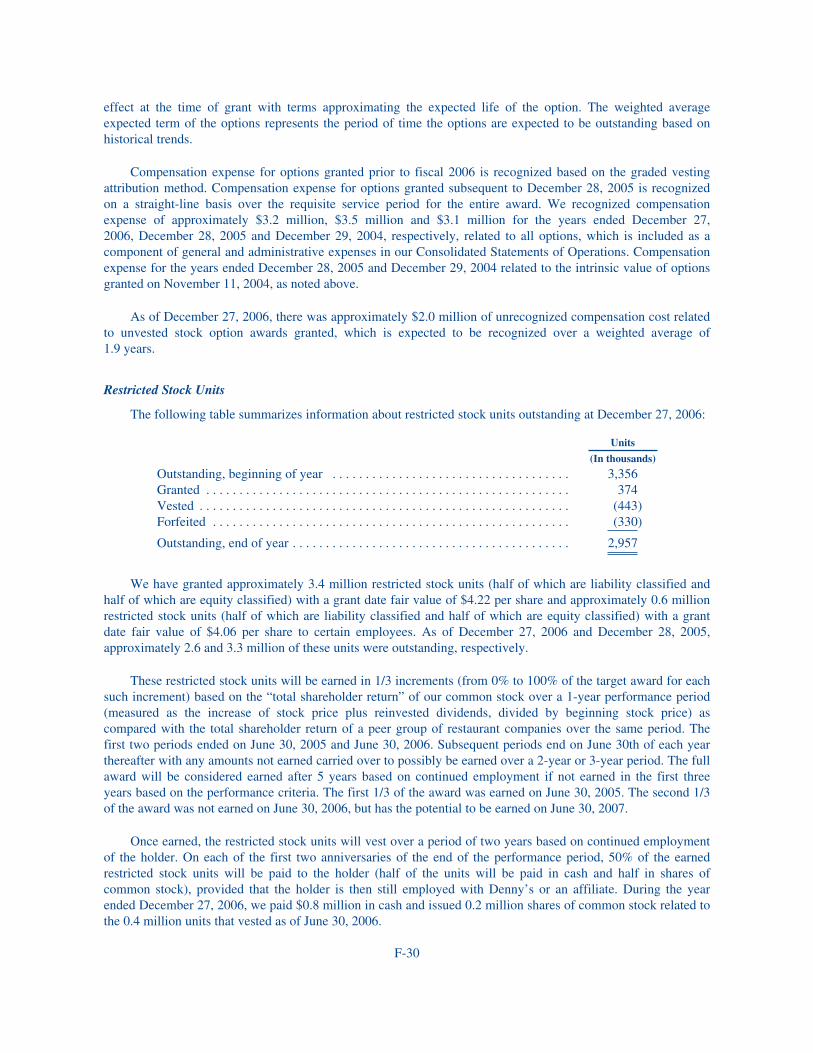
effect at the time of grant with terms approximating the expected life of the option. The weighted averageexpected term of the options represents the period of time the options are expected to be outstanding based onhistorical trends.
Compensation expense for options granted prior to fiscal 2006 is recognized based on the graded vestingattribution method. Compensation expense for options granted subsequent to December 28, 2005 is recognizedon a straight-line basis over the requisite service period for the entire award. We recognized compensationexpense of approximately $3.2 million, $3.5 million and $3.1 million for the years ended December 27,2006, December 28, 2005 and December 29, 2004, respectively, related to all options, which is included as acomponent of general and administrative expenses in our Consolidated Statements of Operations. Compensationexpense for the years ended December 28, 2005 and December 29, 2004 related to the intrinsic value of optionsgranted on November 11, 2004, as noted above.
As of December 27, 2006, there was approximately $2.0 million of unrecognized compensation cost relatedto unvested stock option awards granted, which is expected to be recognized over a weighted average of1.9 years.
Restricted Stock Units
The following table summarizes information about restricted stock units outstanding at December 27, 2006:
Units
(In thousands)
Outstanding, beginning of year . . . . . . . . . . . . . . . . . . . . . . . . . . . . . . . . . . . . 3,356Granted . . . . . . . . . . . . . . . . . . . . . . . . . . . . . . . . . . . . . . . . . . . . . . . . . . . . . . . 374Vested . . . . . . . . . . . . . . . . . . . . . . . . . . . . . . . . . . . . . . . . . . . . . . . . . . . . . . . . (443)Forfeited . . . . . . . . . . . . . . . . . . . . . . . . . . . . . . . . . . . . . . . . . . . . . . . . . . . . . . (330)
Outstanding, end of year . . . . . . . . . . . . . . . . . . . . . . . . . . . . . . . . . . . . . . . . . . 2,957
We have granted approximately 3.4 million restricted stock units (half of which are liability classified andhalf of which are equity classified) with a grant date fair value of $4.22 per share and approximately 0.6 millionrestricted stock units (half of which are liability classified and half of which are equity classified) with a grantdate fair value of $4.06 per share to certain employees. As of December 27, 2006 and December 28, 2005,approximately 2.6 and 3.3 million of these units were outstanding, respectively.
These restricted stock units will be earned in 1/3 increments (from 0% to 100% of the target award for eachsuch increment) based on the “total shareholder return” of our common stock over a 1-year performance period(measured as the increase of stock price plus reinvested dividends, divided by beginning stock price) ascompared with the total shareholder return of a peer group of restaurant companies over the same period. Thefirst two periods ended on June 30, 2005 and June 30, 2006. Subsequent periods end on June 30th of each yearthereafter with any amounts not earned carried over to possibly be earned over a 2-year or 3-year period. The fullaward will be considered earned after 5 years based on continued employment if not earned in the first threeyears based on the performance criteria. The first 1/3 of the award was earned on June 30, 2005. The second 1/3of the award was not earned on June 30, 2006, but has the potential to be earned on June 30, 2007.
Once earned, the restricted stock units will vest over a period of two years based on continued employmentof the holder. On each of the first two anniversaries of the end of the performance period, 50% of the earnedrestricted stock units will be paid to the holder (half of the units will be paid in cash and half in shares ofcommon stock), provided that the holder is then still employed with Denny’s or an affiliate. During the yearended December 27, 2006, we paid $0.8 million in cash and issued 0.2 million shares of common stock related tothe 0.4 million units that vested as of June 30, 2006.
F-30
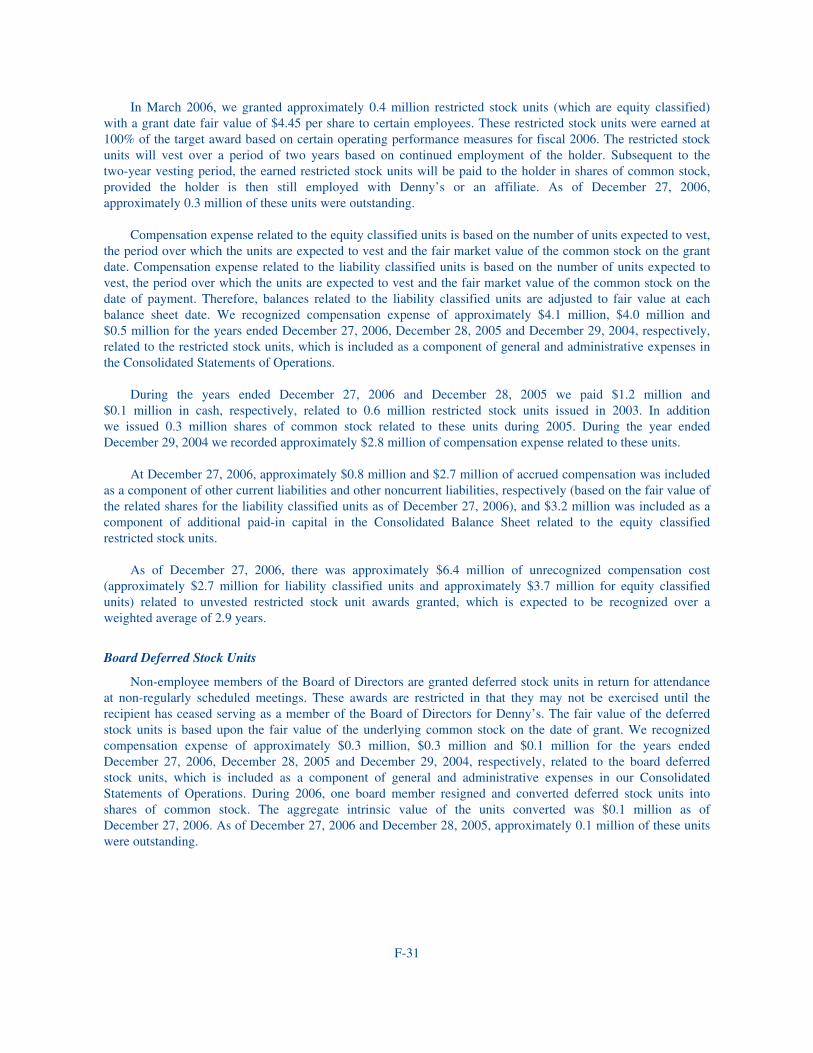
In March 2006, we granted approximately 0.4 million restricted stock units (which are equity classified)with a grant date fair value of $4.45 per share to certain employees. These restricted stock units were earned at100% of the target award based on certain operating performance measures for fiscal 2006. The restricted stockunits will vest over a period of two years based on continued employment of the holder. Subsequent to thetwo-year vesting period, the earned restricted stock units will be paid to the holder in shares of common stock,provided the holder is then still employed with Denny’s or an affiliate. As of December 27, 2006,approximately 0.3 million of these units were outstanding.
Compensation expense related to the equity classified units is based on the number of units expected to vest,the period over which the units are expected to vest and the fair market value of the common stock on the grantdate. Compensation expense related to the liability classified units is based on the number of units expected tovest, the period over which the units are expected to vest and the fair market value of the common stock on thedate of payment. Therefore, balances related to the liability classified units are adjusted to fair value at eachbalance sheet date. We recognized compensation expense of approximately $4.1 million, $4.0 million and$0.5 million for the years ended December 27, 2006, December 28, 2005 and December 29, 2004, respectively,related to the restricted stock units, which is included as a component of general and administrative expenses inthe Consolidated Statements of Operations.
During the years ended December 27, 2006 and December 28, 2005 we paid $1.2 million and$0.1 million in cash, respectively, related to 0.6 million restricted stock units issued in 2003. In additionwe issued 0.3 million shares of common stock related to these units during 2005. During the year endedDecember 29, 2004 we recorded approximately $2.8 million of compensation expense related to these units.
At December 27, 2006, approximately $0.8 million and $2.7 million of accrued compensation was includedas a component of other current liabilities and other noncurrent liabilities, respectively (based on the fair value ofthe related shares for the liability classified units as of December 27, 2006), and $3.2 million was included as acomponent of additional paid-in capital in the Consolidated Balance Sheet related to the equity classifiedrestricted stock units.
As of December 27, 2006, there was approximately $6.4 million of unrecognized compensation cost(approximately $2.7 million for liability classified units and approximately $3.7 million for equity classifiedunits) related to unvested restricted stock unit awards granted, which is expected to be recognized over aweighted average of 2.9 years.
Board Deferred Stock Units
Non-employee members of the Board of Directors are granted deferred stock units in return for attendanceat non-regularly scheduled meetings. These awards are restricted in that they may not be exercised until therecipient has ceased serving as a member of the Board of Directors for Denny’s. The fair value of the deferredstock units is based upon the fair value of the underlying common stock on the date of grant. We recognizedcompensation expense of approximately $0.3 million, $0.3 million and $0.1 million for the years endedDecember 27, 2006, December 28, 2005 and December 29, 2004, respectively, related to the board deferredstock units, which is included as a component of general and administrative expenses in our ConsolidatedStatements of Operations. During 2006, one board member resigned and converted deferred stock units intoshares of common stock. The aggregate intrinsic value of the units converted was $0.1 million as ofDecember 27, 2006. As of December 27, 2006 and December 28, 2005, approximately 0.1 million of these unitswere outstanding.
F-31
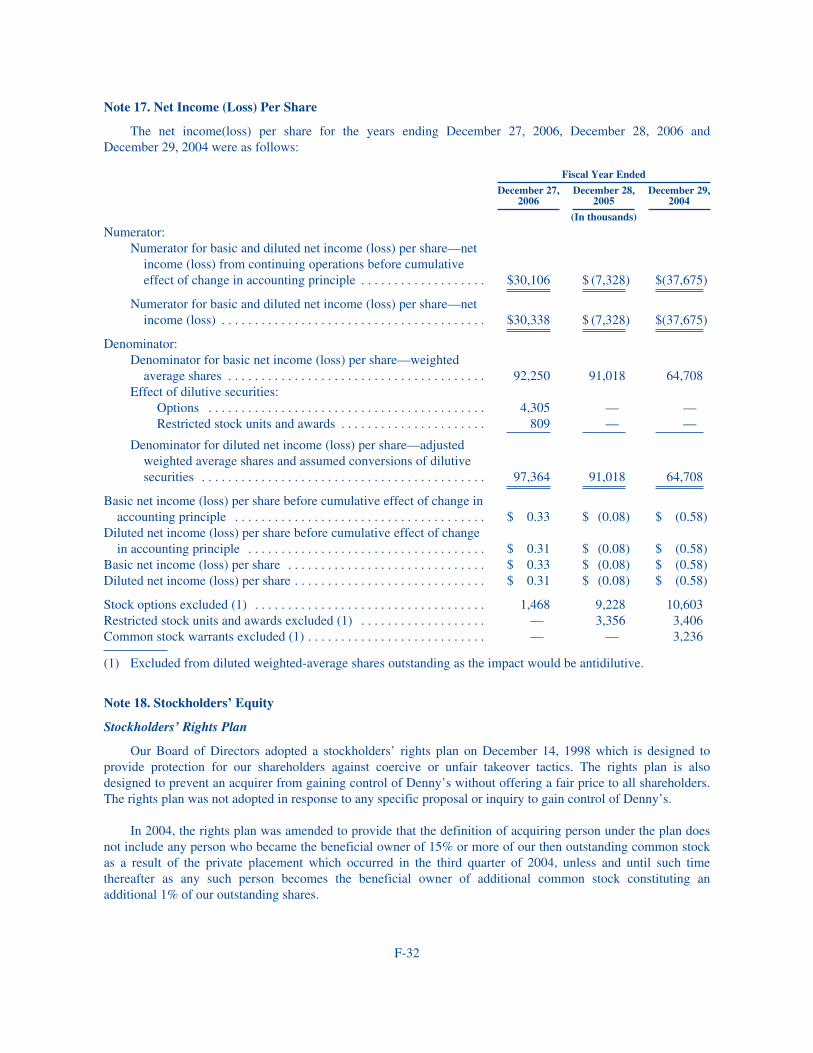
Note 17. Net Income (Loss) Per Share
The net income(loss) per share for the years ending December 27, 2006, December 28, 2006 andDecember 29, 2004 were as follows:
Fiscal Year Ended
December 27,2006
December 28,2005
December 29,2004
(In thousands)
Numerator:Numerator for basic and diluted net income (loss) per share—net
income (loss) from continuing operations before cumulativeeffect of change in accounting principle . . . . . . . . . . . . . . . . . . . $30,106 $ (7,328) $(37,675)
Numerator for basic and diluted net income (loss) per share—netincome (loss) . . . . . . . . . . . . . . . . . . . . . . . . . . . . . . . . . . . . . . . . $30,338 $ (7,328) $(37,675)
Denominator:Denominator for basic net income (loss) per share—weighted
average shares . . . . . . . . . . . . . . . . . . . . . . . . . . . . . . . . . . . . . . . 92,250 91,018 64,708Effect of dilutive securities:
Options . . . . . . . . . . . . . . . . . . . . . . . . . . . . . . . . . . . . . . . . . . 4,305 — —Restricted stock units and awards . . . . . . . . . . . . . . . . . . . . . . 809 — —
Denominator for diluted net income (loss) per share—adjustedweighted average shares and assumed conversions of dilutivesecurities . . . . . . . . . . . . . . . . . . . . . . . . . . . . . . . . . . . . . . . . . . . 97,364 91,018 64,708
Basic net income (loss) per share before cumulative effect of change inaccounting principle . . . . . . . . . . . . . . . . . . . . . . . . . . . . . . . . . . . . . . $ 0.33 $ (0.08) $ (0.58)
Diluted net income (loss) per share before cumulative effect of changein accounting principle . . . . . . . . . . . . . . . . . . . . . . . . . . . . . . . . . . . . $ 0.31 $ (0.08) $ (0.58)
Basic net income (loss) per share . . . . . . . . . . . . . . . . . . . . . . . . . . . . . . $ 0.33 $ (0.08) $ (0.58)Diluted net income (loss) per share . . . . . . . . . . . . . . . . . . . . . . . . . . . . . $ 0.31 $ (0.08) $ (0.58)
Stock options excluded (1) . . . . . . . . . . . . . . . . . . . . . . . . . . . . . . . . . . . 1,468 9,228 10,603Restricted stock units and awards excluded (1) . . . . . . . . . . . . . . . . . . . — 3,356 3,406Common stock warrants excluded (1) . . . . . . . . . . . . . . . . . . . . . . . . . . . — — 3,236
(1) Excluded from diluted weighted-average shares outstanding as the impact would be antidilutive.
Note 18. Stockholders’ Equity
Stockholders’ Rights Plan
Our Board of Directors adopted a stockholders’ rights plan on December 14, 1998 which is designed toprovide protection for our shareholders against coercive or unfair takeover tactics. The rights plan is alsodesigned to prevent an acquirer from gaining control of Denny’s without offering a fair price to all shareholders.The rights plan was not adopted in response to any specific proposal or inquiry to gain control of Denny’s.
In 2004, the rights plan was amended to provide that the definition of acquiring person under the plan doesnot include any person who became the beneficial owner of 15% or more of our then outstanding common stockas a result of the private placement which occurred in the third quarter of 2004, unless and until such timethereafter as any such person becomes the beneficial owner of additional common stock constituting anadditional 1% of our outstanding shares.
F-32
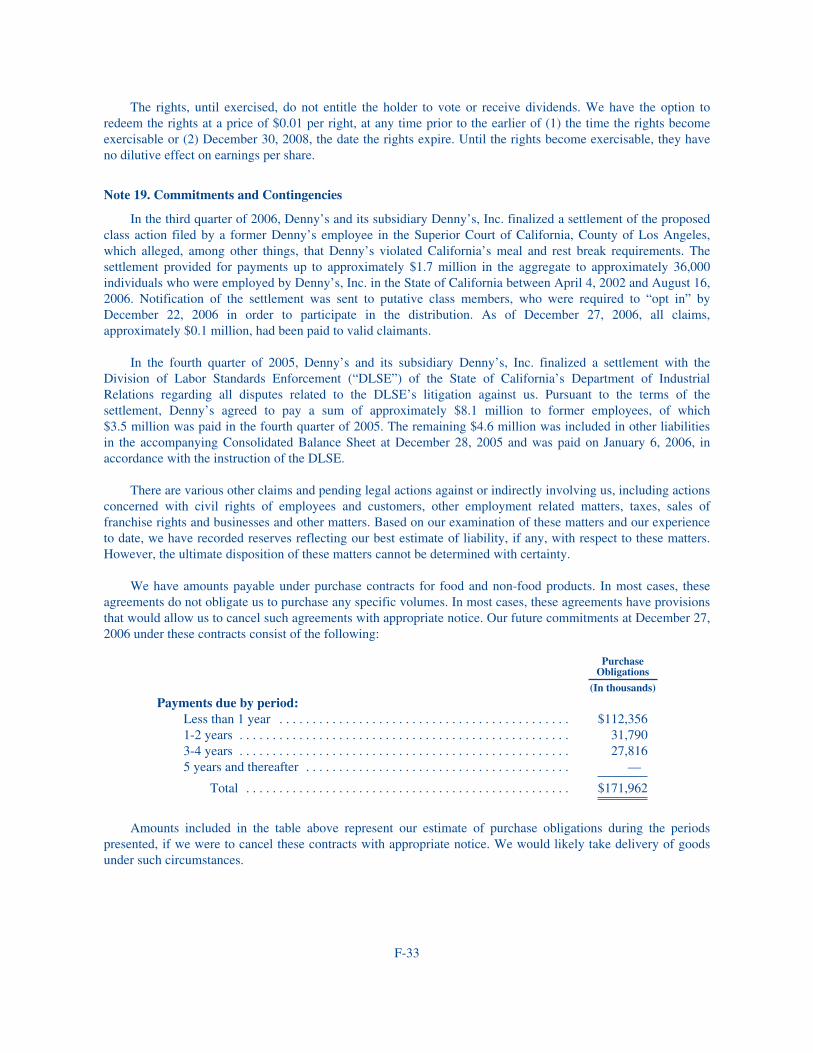
The rights, until exercised, do not entitle the holder to vote or receive dividends. We have the option toredeem the rights at a price of $0.01 per right, at any time prior to the earlier of (1) the time the rights becomeexercisable or (2) December 30, 2008, the date the rights expire. Until the rights become exercisable, they haveno dilutive effect on earnings per share.
Note 19. Commitments and Contingencies
In the third quarter of 2006, Denny’s and its subsidiary Denny’s, Inc. finalized a settlement of the proposedclass action filed by a former Denny’s employee in the Superior Court of California, County of Los Angeles,which alleged, among other things, that Denny’s violated California’s meal and rest break requirements. Thesettlement provided for payments up to approximately $1.7 million in the aggregate to approximately 36,000individuals who were employed by Denny’s, Inc. in the State of California between April 4, 2002 and August 16,2006. Notification of the settlement was sent to putative class members, who were required to “opt in” byDecember 22, 2006 in order to participate in the distribution. As of December 27, 2006, all claims,approximately $0.1 million, had been paid to valid claimants.
In the fourth quarter of 2005, Denny’s and its subsidiary Denny’s, Inc. finalized a settlement with theDivision of Labor Standards Enforcement (“DLSE”) of the State of California’s Department of IndustrialRelations regarding all disputes related to the DLSE’s litigation against us. Pursuant to the terms of thesettlement, Denny’s agreed to pay a sum of approximately $8.1 million to former employees, of which$3.5 million was paid in the fourth quarter of 2005. The remaining $4.6 million was included in other liabilitiesin the accompanying Consolidated Balance Sheet at December 28, 2005 and was paid on January 6, 2006, inaccordance with the instruction of the DLSE.
There are various other claims and pending legal actions against or indirectly involving us, including actionsconcerned with civil rights of employees and customers, other employment related matters, taxes, sales offranchise rights and businesses and other matters. Based on our examination of these matters and our experienceto date, we have recorded reserves reflecting our best estimate of liability, if any, with respect to these matters.However, the ultimate disposition of these matters cannot be determined with certainty.
We have amounts payable under purchase contracts for food and non-food products. In most cases, theseagreements do not obligate us to purchase any specific volumes. In most cases, these agreements have provisionsthat would allow us to cancel such agreements with appropriate notice. Our future commitments at December 27,2006 under these contracts consist of the following:
PurchaseObligations
(In thousands)
Payments due by period:Less than 1 year . . . . . . . . . . . . . . . . . . . . . . . . . . . . . . . . . . . . . . . . . . . . $112,3561-2 years . . . . . . . . . . . . . . . . . . . . . . . . . . . . . . . . . . . . . . . . . . . . . . . . . . 31,7903-4 years . . . . . . . . . . . . . . . . . . . . . . . . . . . . . . . . . . . . . . . . . . . . . . . . . . 27,8165 years and thereafter . . . . . . . . . . . . . . . . . . . . . . . . . . . . . . . . . . . . . . . . —
Total . . . . . . . . . . . . . . . . . . . . . . . . . . . . . . . . . . . . . . . . . . . . . . . . . $171,962
Amounts included in the table above represent our estimate of purchase obligations during the periodspresented, if we were to cancel these contracts with appropriate notice. We would likely take delivery of goodsunder such circumstances.
F-33
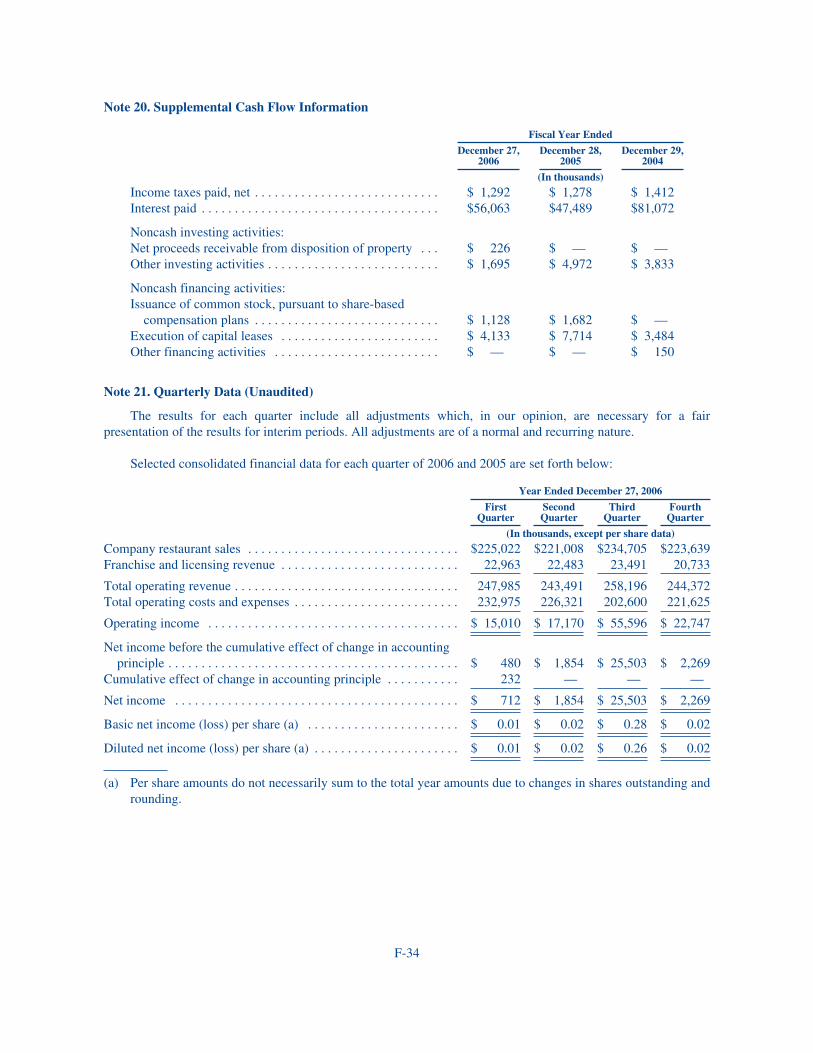
Note 20. Supplemental Cash Flow Information
Fiscal Year Ended
December 27,2006
December 28,2005
December 29,2004
(In thousands)
Income taxes paid, net . . . . . . . . . . . . . . . . . . . . . . . . . . . . $ 1,292 $ 1,278 $ 1,412Interest paid . . . . . . . . . . . . . . . . . . . . . . . . . . . . . . . . . . . . $56,063 $47,489 $81,072
Noncash investing activities:Net proceeds receivable from disposition of property . . . $ 226 $ — $ —Other investing activities . . . . . . . . . . . . . . . . . . . . . . . . . . $ 1,695 $ 4,972 $ 3,833
Noncash financing activities:Issuance of common stock, pursuant to share-based
compensation plans . . . . . . . . . . . . . . . . . . . . . . . . . . . . $ 1,128 $ 1,682 $ —Execution of capital leases . . . . . . . . . . . . . . . . . . . . . . . . $ 4,133 $ 7,714 $ 3,484Other financing activities . . . . . . . . . . . . . . . . . . . . . . . . . $ — $ — $ 150
Note 21. Quarterly Data (Unaudited)
The results for each quarter include all adjustments which, in our opinion, are necessary for a fairpresentation of the results for interim periods. All adjustments are of a normal and recurring nature.
Selected consolidated financial data for each quarter of 2006 and 2005 are set forth below:
Year Ended December 27, 2006
FirstQuarter
SecondQuarter
ThirdQuarter
FourthQuarter
(In thousands, except per share data)
Company restaurant sales . . . . . . . . . . . . . . . . . . . . . . . . . . . . . . . . $225,022 $221,008 $234,705 $223,639Franchise and licensing revenue . . . . . . . . . . . . . . . . . . . . . . . . . . . 22,963 22,483 23,491 20,733
Total operating revenue . . . . . . . . . . . . . . . . . . . . . . . . . . . . . . . . . . 247,985 243,491 258,196 244,372Total operating costs and expenses . . . . . . . . . . . . . . . . . . . . . . . . . 232,975 226,321 202,600 221,625
Operating income . . . . . . . . . . . . . . . . . . . . . . . . . . . . . . . . . . . . . . $ 15,010 $ 17,170 $ 55,596 $ 22,747
Net income before the cumulative effect of change in accountingprinciple . . . . . . . . . . . . . . . . . . . . . . . . . . . . . . . . . . . . . . . . . . . . $ 480 $ 1,854 $ 25,503 $ 2,269
Cumulative effect of change in accounting principle . . . . . . . . . . . 232 — — —
Net income . . . . . . . . . . . . . . . . . . . . . . . . . . . . . . . . . . . . . . . . . . . $ 712 $ 1,854 $ 25,503 $ 2,269
Basic net income (loss) per share (a) . . . . . . . . . . . . . . . . . . . . . . . $ 0.01 $ 0.02 $ 0.28 $ 0.02
Diluted net income (loss) per share (a) . . . . . . . . . . . . . . . . . . . . . . $ 0.01 $ 0.02 $ 0.26 $ 0.02
(a) Per share amounts do not necessarily sum to the total year amounts due to changes in shares outstanding androunding.
F-34
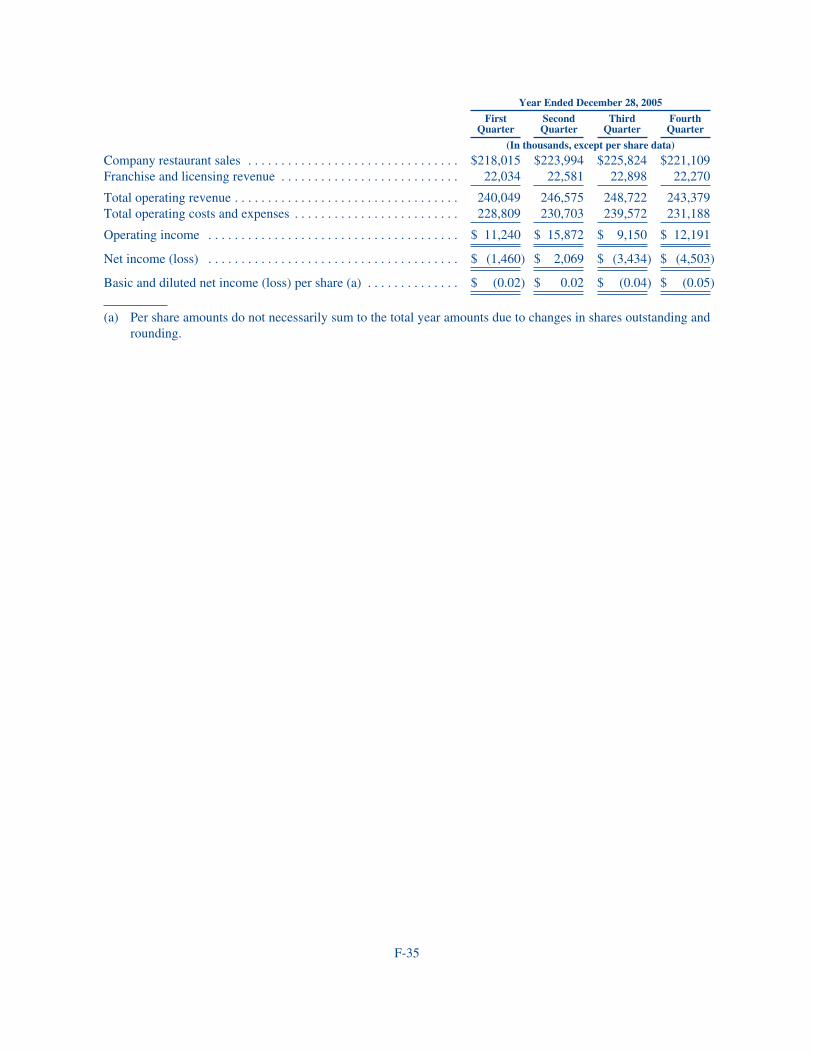
Year Ended December 28, 2005
FirstQuarter
SecondQuarter
ThirdQuarter
FourthQuarter
(In thousands, except per share data)
Company restaurant sales . . . . . . . . . . . . . . . . . . . . . . . . . . . . . . . . $218,015 $223,994 $225,824 $221,109Franchise and licensing revenue . . . . . . . . . . . . . . . . . . . . . . . . . . . 22,034 22,581 22,898 22,270
Total operating revenue . . . . . . . . . . . . . . . . . . . . . . . . . . . . . . . . . . 240,049 246,575 248,722 243,379Total operating costs and expenses . . . . . . . . . . . . . . . . . . . . . . . . . 228,809 230,703 239,572 231,188
Operating income . . . . . . . . . . . . . . . . . . . . . . . . . . . . . . . . . . . . . . $ 11,240 $ 15,872 $ 9,150 $ 12,191
Net income (loss) . . . . . . . . . . . . . . . . . . . . . . . . . . . . . . . . . . . . . . $ (1,460) $ 2,069 $ (3,434) $ (4,503)
Basic and diluted net income (loss) per share (a) . . . . . . . . . . . . . . $ (0.02) $ 0.02 $ (0.04) $ (0.05)
(a) Per share amounts do not necessarily sum to the total year amounts due to changes in shares outstanding androunding.
F-35
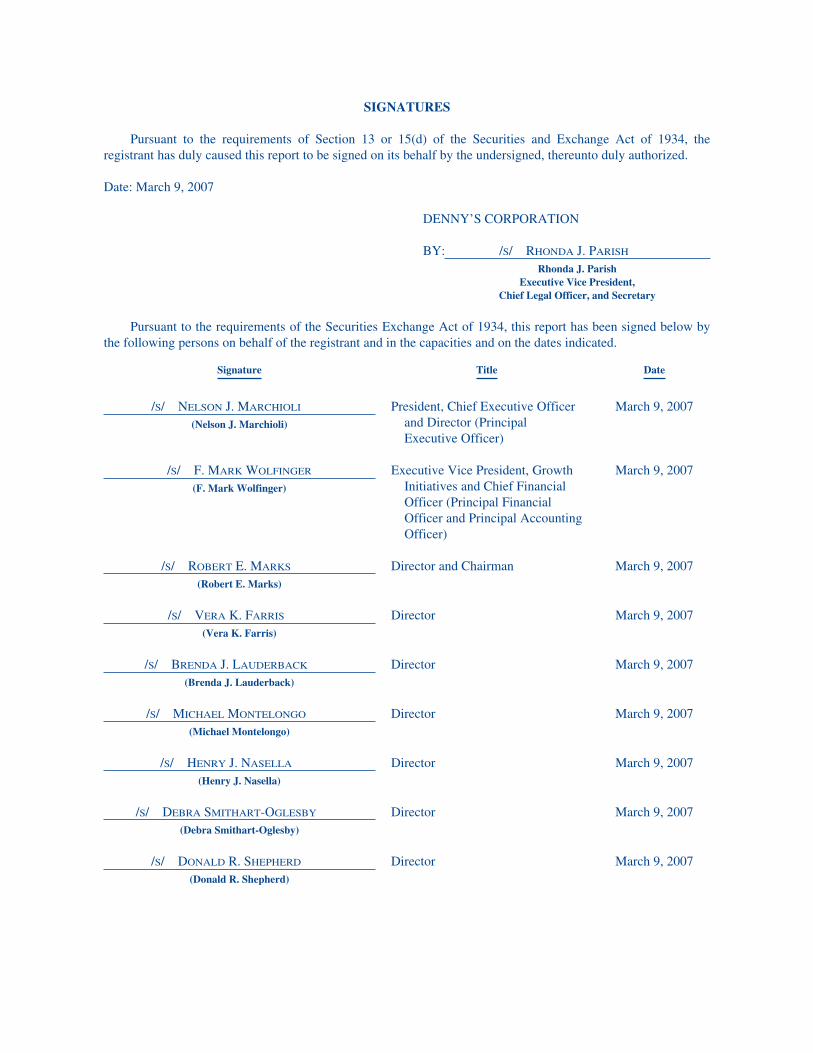
SIGNATURES
Pursuant to the requirements of Section 13 or 15(d) of the Securities and Exchange Act of 1934, theregistrant has duly caused this report to be signed on its behalf by the undersigned, thereunto duly authorized.
Date: March 9, 2007
DENNY’S CORPORATION
BY: /S/ RHONDA J. PARISH
Rhonda J. ParishExecutive Vice President,
Chief Legal Officer, and Secretary
Pursuant to the requirements of the Securities Exchange Act of 1934, this report has been signed below bythe following persons on behalf of the registrant and in the capacities and on the dates indicated.
Signature Title Date
/S/ NELSON J. MARCHIOLI
(Nelson J. Marchioli)
President, Chief Executive Officerand Director (PrincipalExecutive Officer)
March 9, 2007
/S/ F. MARK WOLFINGER
(F. Mark Wolfinger)
Executive Vice President, GrowthInitiatives and Chief FinancialOfficer (Principal FinancialOfficer and Principal AccountingOfficer)
March 9, 2007
/S/ ROBERT E. MARKS
(Robert E. Marks)
Director and Chairman March 9, 2007
/S/ VERA K. FARRIS
(Vera K. Farris)
Director March 9, 2007
/S/ BRENDA J. LAUDERBACK
(Brenda J. Lauderback)
Director March 9, 2007
/S/ MICHAEL MONTELONGO
(Michael Montelongo)
Director March 9, 2007
/S/ HENRY J. NASELLA
(Henry J. Nasella)
Director March 9, 2007
/S/ DEBRA SMITHART-OGLESBY
(Debra Smithart-Oglesby)
Director March 9, 2007
/S/ DONALD R. SHEPHERD
(Donald R. Shepherd)
Director March 9, 2007
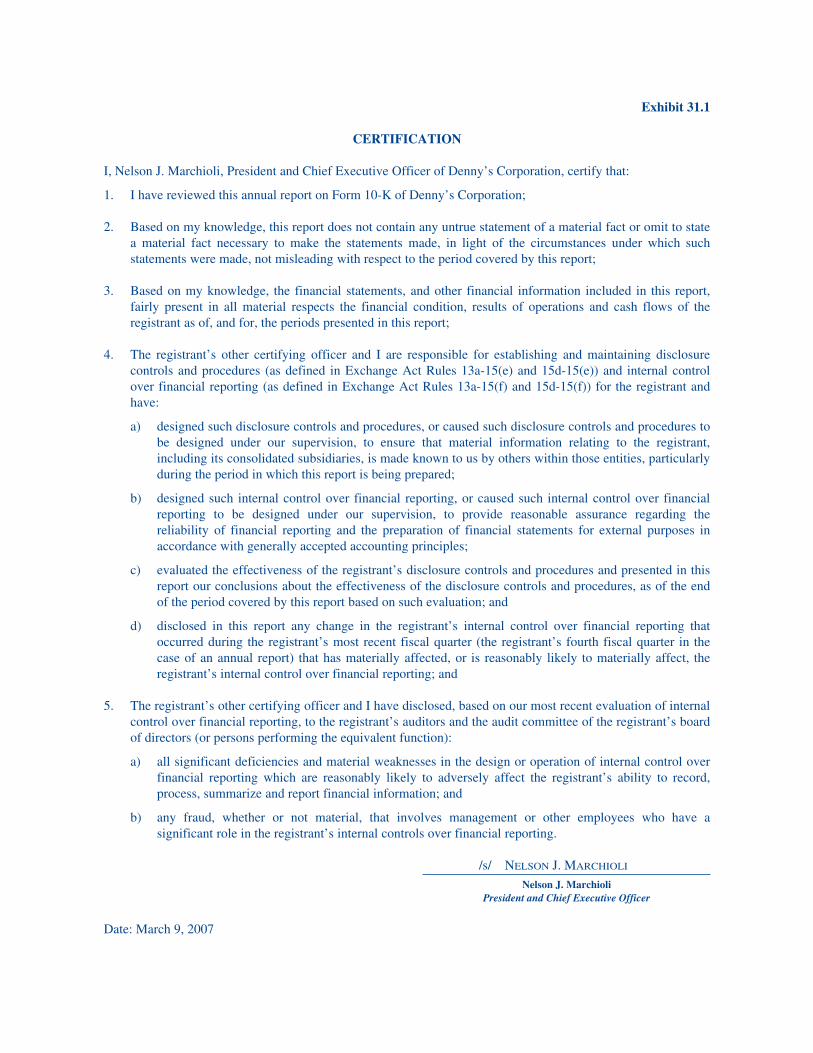
Exhibit 31.1
CERTIFICATION
I, Nelson J. Marchioli, President and Chief Executive Officer of Denny’s Corporation, certify that:
1. I have reviewed this annual report on Form 10-K of Denny’s Corporation;
2. Based on my knowledge, this report does not contain any untrue statement of a material fact or omit to statea material fact necessary to make the statements made, in light of the circumstances under which suchstatements were made, not misleading with respect to the period covered by this report;
3. Based on my knowledge, the financial statements, and other financial information included in this report,fairly present in all material respects the financial condition, results of operations and cash flows of theregistrant as of, and for, the periods presented in this report;
4. The registrant’s other certifying officer and I are responsible for establishing and maintaining disclosurecontrols and procedures (as defined in Exchange Act Rules 13a-15(e) and 15d-15(e)) and internal controlover financial reporting (as defined in Exchange Act Rules 13a-15(f) and 15d-15(f)) for the registrant andhave:
a) designed such disclosure controls and procedures, or caused such disclosure controls and procedures tobe designed under our supervision, to ensure that material information relating to the registrant,including its consolidated subsidiaries, is made known to us by others within those entities, particularlyduring the period in which this report is being prepared;
b) designed such internal control over financial reporting, or caused such internal control over financialreporting to be designed under our supervision, to provide reasonable assurance regarding thereliability of financial reporting and the preparation of financial statements for external purposes inaccordance with generally accepted accounting principles;
c) evaluated the effectiveness of the registrant’s disclosure controls and procedures and presented in thisreport our conclusions about the effectiveness of the disclosure controls and procedures, as of the endof the period covered by this report based on such evaluation; and
d) disclosed in this report any change in the registrant’s internal control over financial reporting thatoccurred during the registrant’s most recent fiscal quarter (the registrant’s fourth fiscal quarter in thecase of an annual report) that has materially affected, or is reasonably likely to materially affect, theregistrant’s internal control over financial reporting; and
5. The registrant’s other certifying officer and I have disclosed, based on our most recent evaluation of internalcontrol over financial reporting, to the registrant’s auditors and the audit committee of the registrant’s boardof directors (or persons performing the equivalent function):
a) all significant deficiencies and material weaknesses in the design or operation of internal control overfinancial reporting which are reasonably likely to adversely affect the registrant’s ability to record,process, summarize and report financial information; and
b) any fraud, whether or not material, that involves management or other employees who have asignificant role in the registrant’s internal controls over financial reporting.
/s/ NELSON J. MARCHIOLI
Nelson J. MarchioliPresident and Chief Executive Officer
Date: March 9, 2007
Exhibit 31.2
CERTIFICATION
I, F. Mark Wolfinger, Executive Vice President, Growth Initiatives and Chief Financial Officer of Denny’sCorporation, certify that:
1. I have reviewed this annual report on Form 10-K of Denny’s Corporation;
2. Based on my knowledge, this report does not contain any untrue statement of a material fact or omit to statea material fact necessary to make the statements made, in light of the circumstances under which suchstatements were made, not misleading with respect to the period covered by this report;
3. Based on my knowledge, the financial statements, and other financial information included in this report,fairly present in all material respects the financial condition, results of operations and cash flows of theregistrant as of, and for, the periods presented in this report;
4. The registrant’s other certifying officer and I are responsible for establishing and maintaining disclosurecontrols and procedures (as defined in Exchange Act Rules 13a-15(e) and 15d-15(e)) and internal controlover financial reporting (as defined in Exchange Act Rules 13a-15(f) and 15d-15(f)) for the registrant andhave:
a) designed such disclosure controls and procedures, or caused such disclosure controls and procedures tobe designed under our supervision, to ensure that material information relating to the registrant,including its consolidated subsidiaries, is made known to us by others within those entities, particularlyduring the period in which this report is being prepared;
b) designed such internal control over financial reporting, or caused such internal control over financialreporting to be designed under our supervision, to provide reasonable assurance regarding thereliability of financial reporting and the preparation of financial statements for external purposes inaccordance with generally accepted accounting principles;
c) evaluated the effectiveness of the registrant’s disclosure controls and procedures and presented in thisreport our conclusions about the effectiveness of the disclosure controls and procedures, as of the endof the period covered by this report based on such evaluation; and
d) disclosed in this report any change in the registrant’s internal control over financial reporting thatoccurred during the registrant’s most recent fiscal quarter (the registrant’s fourth fiscal quarter in thecase of an annual report) that has materially affected, or is reasonably likely to materially affect, theregistrant’s internal control over financial reporting; and
5. The registrant’s other certifying officer and I have disclosed, based on our most recent evaluation of internalcontrol over financial reporting, to the registrant’s auditors and the audit committee of the registrant’s boardof directors (or persons performing the equivalent function):
a) all significant deficiencies and material weaknesses in the design or operation of internal control overfinancial reporting which are reasonably likely to adversely affect the registrant’s ability to record,process, summarize and report financial information; and
b) any fraud, whether or not material, that involves management or other employees who have asignificant role in the registrant’s internal controls over financial reporting.
/s/ F. MARK WOLFINGER
F. Mark WolfingerExecutive Vice President, Growth
Initiatives and Chief Financial Officer
Date: March 9, 2007
Exhibit 32.1
CERTIFICATION
Nelson J. MarchioliPresident and Chief Executive Officer of Denny’s Corporation
and
F. Mark WolfingerExecutive Vice President, Growth Initiatives and Chief Financial Officer
Pursuant to 18 U.S.C. Section 1350,As Adopted Pursuant toSection 906 of the Sarbanes-Oxley Act of 2002
In connection with the Annual Report of Denny’s Corporation (the “Company”) on Form 10-K for the fiscalyear ended December 27, 2006 as filed with the Securities and Exchange Commission on the date hereof (the“Report”), I, Nelson J. Marchioli, President and Chief Executive Officer of the Company, and I, F. MarkWolfinger, Executive Vice President, Growth Initiatives and Chief Financial Officer of the Company, certify,pursuant to 18 U.S.C. Section 1350, as adopted pursuant to Section 906 of the Sarbanes-Oxley Act of 2002, that:
1) The Report fully complies with the requirements of Section 13(a) or 15(d) of the Securities Exchange Act of1934; and
2) The information contained in the Report fairly presents, in all material respects, the financial condition andresults of operations of the Company.
/s/ NELSON J. MARCHIOLI
Nelson J. MarchioliPresident and Chief Executive Officer
March 9, 2007
/s/ F. MARK WOLFINGER
F. Mark WolfingerExecutive Vice President, Growth
Initiatives and Chief Financial Officer
March 9, 2007
A signed original of this written statement required by Section 906, or other document authenticating,acknowledging, or otherwise adopting the signature that appears in typed form within the electronic version ofthis written statement required by Section 906, has been provided to Denny’s Corporation and will be retained byDenny’s Corporation and furnished to the Securities and Exchange Commission or its staff upon request.
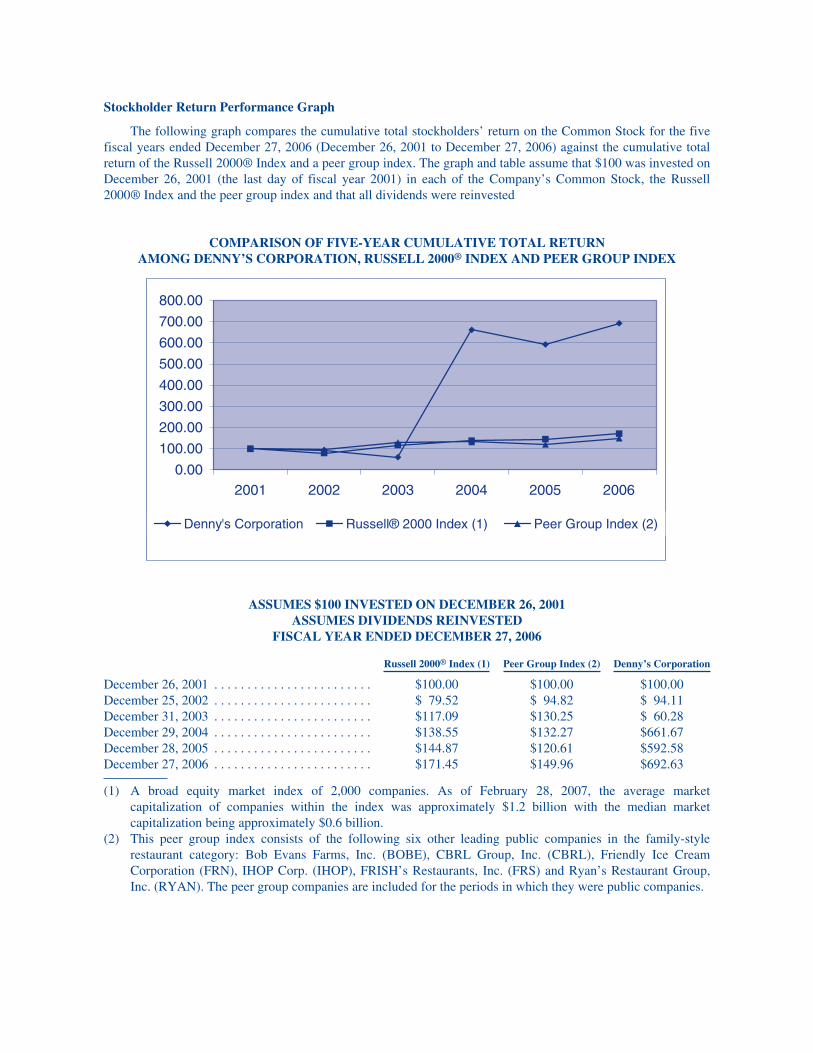
Stockholder Return Performance Graph
The following graph compares the cumulative total stockholders’ return on the Common Stock for the fivefiscal years ended December 27, 2006 (December 26, 2001 to December 27, 2006) against the cumulative totalreturn of the Russell 2000® Index and a peer group index. The graph and table assume that $100 was invested onDecember 26, 2001 (the last day of fiscal year 2001) in each of the Company’s Common Stock, the Russell2000® Index and the peer group index and that all dividends were reinvested
COMPARISON OF FIVE-YEAR CUMULATIVE TOTAL RETURNAMONG DENNY’S CORPORATION, RUSSELL 2000® INDEX AND PEER GROUP INDEX
0.00
100.00
200.00
300.00
400.00
500.00
600.00
700.00
800.00
2001 2002 2003 2004 2005 2006
Denny's Corporation Russell® 2000 Index (1) Peer Group Index (2)
ASSUMES $100 INVESTED ON DECEMBER 26, 2001ASSUMES DIVIDENDS REINVESTED
FISCAL YEAR ENDED DECEMBER 27, 2006
Russell 2000® Index (1) Peer Group Index (2) Denny’s Corporation
December 26, 2001 . . . . . . . . . . . . . . . . . . . . . . . . $100.00 $100.00 $100.00December 25, 2002 . . . . . . . . . . . . . . . . . . . . . . . . $ 79.52 $ 94.82 $ 94.11December 31, 2003 . . . . . . . . . . . . . . . . . . . . . . . . $117.09 $130.25 $ 60.28December 29, 2004 . . . . . . . . . . . . . . . . . . . . . . . . $138.55 $132.27 $661.67December 28, 2005 . . . . . . . . . . . . . . . . . . . . . . . . $144.87 $120.61 $592.58December 27, 2006 . . . . . . . . . . . . . . . . . . . . . . . . $171.45 $149.96 $692.63
(1) A broad equity market index of 2,000 companies. As of February 28, 2007, the average marketcapitalization of companies within the index was approximately $1.2 billion with the median marketcapitalization being approximately $0.6 billion.
(2) This peer group index consists of the following six other leading public companies in the family-stylerestaurant category: Bob Evans Farms, Inc. (BOBE), CBRL Group, Inc. (CBRL), Friendly Ice CreamCorporation (FRN), IHOP Corp. (IHOP), FRISH’s Restaurants, Inc. (FRS) and Ryan’s Restaurant Group,Inc. (RYAN). The peer group companies are included for the periods in which they were public companies.
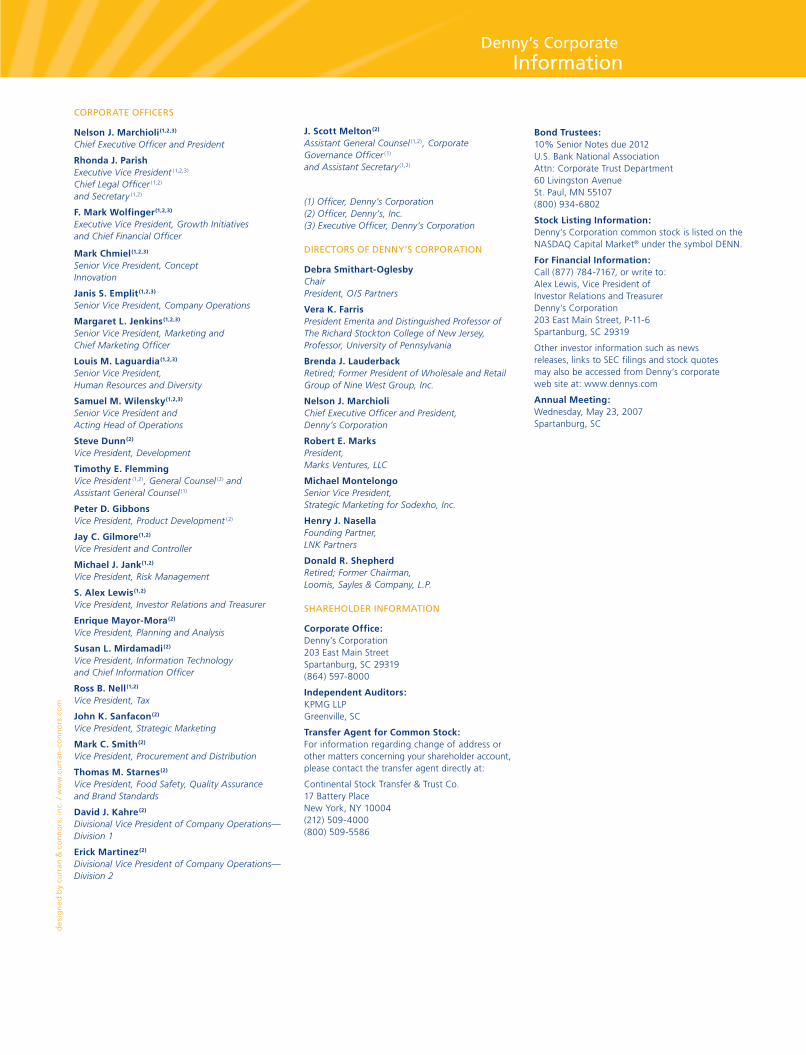
With sales at Company and franchised restaurants totaling over $2.4 billion,
Denny’s is America’s largest full-service family restaurant chain
providing a variety of food and beverage choices for guests of all ages. Our restaurants offer a casual
dining atmosphere and moderately-priced, good quality meals served 24 hours a day. Denny’s is
recognized for its famous Grand Slam® breakfast, award-winning D-Zone® kid’s menu, senior selections
and late-night fare. Lunch and dinner offerings are increasing in popularity with a variety of cravable
burgers and sandwiches as well as Denny’s American Dinner ClassicsTM, including Grilled Chicken Alfredo.
As of December 27, 2006, Denny’s had 1,545 Company-owned, franchised and licensed restaurants
located in the United States, Canada, Costa Rica, Guam, Mexico, New Zealand and Puerto Rico.
NASDAQ: DENN
Denny’s Corporate Information
de
sig
ned
by
curr
an &
co
nno
rs, i
nc. /
ww
w.c
urra
n-c
onn
ors
.co
m
CORPORATE OFFICERS
Nelson J. Marchioli(1,2,3)
Chief Executive Officer and President
Rhonda J. Parish Executive Vice President (1,2,3)
Chief Legal Offi cer (1,2) and Secretary (1,2)
F. Mark Wolfinger(1,2,3)
Executive Vice President, Growth Initiatives and Chief Financial Officer
Mark Chmiel(1,2,3)
Senior Vice President, ConceptInnovation
Janis S. Emplit(1,2,3)
Senior Vice President, Company Operations
Margaret L. Jenkins(1,2,3)
Senior Vice President, Marketing and Chief Marketing Officer
Louis M. Laguardia(1,2,3)
Senior Vice President,Human Resources and Diversity
Samuel M. Wilensky(1,2,3)
Senior Vice President and Acting Head of Operations
Steve Dunn(2)
Vice President, Development
Timothy E. FlemmingVice President (1,2) , General Counsel (2) andAssistant General Counsel (1)
Peter D. GibbonsVice President, Product Development (2)
Jay C. Gilmore(1,2)
Vice President and Controller
Michael J. Jank(1,2)
Vice President, Risk Management
S. Alex Lewis(1,2)
Vice President, Investor Relations and Treasurer
Enrique Mayor-Mora(2)
Vice President, Planning and Analysis
Susan L. Mirdamadi(2)
Vice President, Information Technologyand Chief Information Officer
Ross B. Nell(1,2)
Vice President, Tax
John K. Sanfacon(2)
Vice President, Strategic Marketing
Mark C. Smith(2)
Vice President, Procurement and Distribution
Thomas M. Starnes(2)
Vice President, Food Safety, Quality Assurance and Brand Standards
David J. Kahre(2)
Divisional Vice President of Company Operations—Division 1
Erick Martinez(2)
Divisional Vice President of Company Operations—Division 2
J. Scott Melton(2)
Assistant General Counsel (1,2) , Corporate Governance Officer (1)
and Assistant Secretary (1,2)
(1) Officer, Denny’s Corporation(2) Officer, Denny’s, Inc.(3) Executive Officer, Denny’s Corporation
DIRECTORS OF DENNY’S CORPORATION
Debra Smithart-OglesbyChairPresident, O/S Partners
Vera K. Farris President Emerita and Distinguished Professor of The Richard Stockton College of New Jersey, Professor, University of Pennsylvania
Brenda J. LauderbackRetired; Former President of Wholesale and RetailGroup of Nine West Group, Inc.
Nelson J. MarchioliChief Executive Officer and President,Denny’s Corporation
Robert E. MarksPresident,Marks Ventures, LLC
Michael MontelongoSenior Vice President, Strategic Marketing for Sodexho, Inc.
Henry J. NasellaFounding Partner,LNK Partners
Donald R. ShepherdRetired; Former Chairman, Loomis, Sayles & Company, L.P.
SHAREHOLDER INFORMATION
Corporate Office: Denny’s Corporation 203 East Main StreetSpartanburg, SC 29319(864) 597-8000
Independent Auditors:KPMG LLPGreenville, SC
Transfer Agent for Common Stock:For information regarding change of address or other matters concerning your shareholder account, please contact the transfer agent directly at:
Continental Stock Transfer & Trust Co.17 Battery PlaceNew York, NY 10004(212) 509-4000(800) 509-5586
Bond Trustees:10% Senior Notes due 2012U.S. Bank National AssociationAttn: Corporate Trust Department60 Livingston AvenueSt. Paul, MN 55107(800) 934-6802
Stock Listing Information:Denny’s Corporation common stock is listed on the NASDAQ Capital Market® under the symbol DENN.
For Financial Information:Call (877) 784-7167, or write to:Alex Lewis, Vice President of Investor Relations and TreasurerDenny’s Corporation203 East Main Street, P-11-6Spartanburg, SC 29319
Other investor information such as news releases, links to SEC filings and stock quotes may also be accessed from Denny’s corporate web site at: www.dennys.com
Annual Meeting:Wednesday, May 23, 2007Spartanburg, SC

CREATING VALUE FOR OUR GUESTS AND SHAREHOLDERS
2006 Annual Report
Denny’s Corporation
203 East Main Street
Spartanburg, SC 29319
Den
ny
’s Co
rpo
ration
200
6 Annual Report