Embed Size (px)
Citation preview

Denise Troll CoveyAssociate University Librarian, Carnegie Mellon
NERCOMP Library/IT SIG Workshop – April 2002
versus Count-Ability

Personal Observation
• Some data are compiled
• Lots of data gathering
• Some compiled data are analyzed
• Some analyzed data are actually used
Wasted effort?

Personal Suspicion
• Lots of data languishing – Why?
– Accountability for data reporting is minimal
– Data management is cumbersome
– Sense that some of the data aren’t useful
– Imperative to implement new measures

New Data Gathering
• Evidence of becoming “Predominantly digital”
• Address Advisory Board concerns
0%
20%
40%
60%
80%
100%
Visits Reserves Reference
Traditional
Digital

Assessment Challenges
• Deciding what data to gather
• Understanding the whole assessment process
• Determining what skills to acquire & how
• Organizing assessment as a core activity
• Managing assessment data
• Acquiring an interpretive context
Distinguished Fellowship Nov 2000 – Oct 2001

2001 MIS Task Force
• Assess current & proposed data practices
• Determine what data to gather & how
• Develop a specification for a new MIS that solves current problems
• Oversee implementation & deployment of the new MIS

MIS TF Time LineINITIAL REVISED
Conduct data audit & needs assessment May 01 Jun 01
Recommend data to gather & manage in MIS Jul 01 Apr 02
Prepare & approve functional specification July 01 Jun 02
Evaluate & recommend software for new MIS Sept 01 Aug 02
Prepare & approve design specification Nov 01 Nov 02
Implement & test MIS prototype Feb 02 Feb 03
Implement & test production MIS May 02 May 03
Document MIS & provide training Jun 02 Jul 03
Migrate data & release new MIS Jul 02 Aug 03

May-June 2001 – Data Audit
• Interviews with functional groups
– What data do you gather or plan to gather?
– How do you gather the data? How often?
– Who uses the data? How often?
– For what purpose do you gather the data?
– For what audience do you gather the data?
– How do you present the data? To whom?
– How do you store, access, & manipulate the data?
– What problems do you have with data?

July 2001 – Assemble Results• Created 12-page spreadsheet – data, department, source,
audience, software, process, problems, & solutions
• Identified common problems– Data management is decentralized & uncoordinated
– Current “MIS” is incomplete & not kept up-to-date
– Errors or anomalies in the data are not corrected
– Data gathering & entry are too complicated
– Difficult to generate multi-year trend lines
– Sheer volume of data is overwhelming

More Problems• Lack of communication, training, & support
– What data are available? Where?
– How do I access & use the current MIS?
– Problems with access privileges, server, & network
• Wasted resources
– Duplicate efforts
– No one has time, skills, or responsibility to analyze the data
– Data are either not used or under used

August 2001 – Libraries Council
• Distributed spreadsheet to governing council
– To confirm information was accurate & complete
– To confirm problems with current data practices
– Are we gathering the right data?
– Is the data we’re gathering worth the effort?
• Outcome
– Add missing data (e.g., ACRL, IPEDS)
– Add more proposed new measures

Sept 2001 – Field Trip• Keep task force small & strategic
– Members with power, willing to take the heat & do the work
• Be judgmental about usefulness of the data
• Distinguish data for external & internal audiences
• Data gathering advice– Stop counting what you don’t need
– Automate everything you can
– Use more sampling
• Identify data for MIS based on research questions

October 2001 – Department Heads
• Added data LC requested
• Distributed 15-page spreadsheet organized by department
– To confirm information was accurate & complete
• Outcome: clarification of minor details

November 2001 – Winnow the List
• Least useful data = data required for ACRL & IPEDS
– University Librarian will consider NOT gathering the data
IF we don’t really use it or it can’t be automated
• Don’t know enough about data gathering & use
– Someone above them in the food chain uses the data
– Data definitions are inconsistent or shifting
– How difficult is it to gather data manually?
– Can data gathering be automated?

February 2002 – Department Heads• Distributed spreadsheet per department – data (current
& proposed), audience (internal & external)
– How used by department?
– Is data gathering automated? Can it be automated?
– Recommend – Keep regularly, Sample, or Not gather
• Outcome
– Few recommendations to Sample or Not gather data
– Uncertainty about what was or could be automated
– Hypotheses about how data could be used
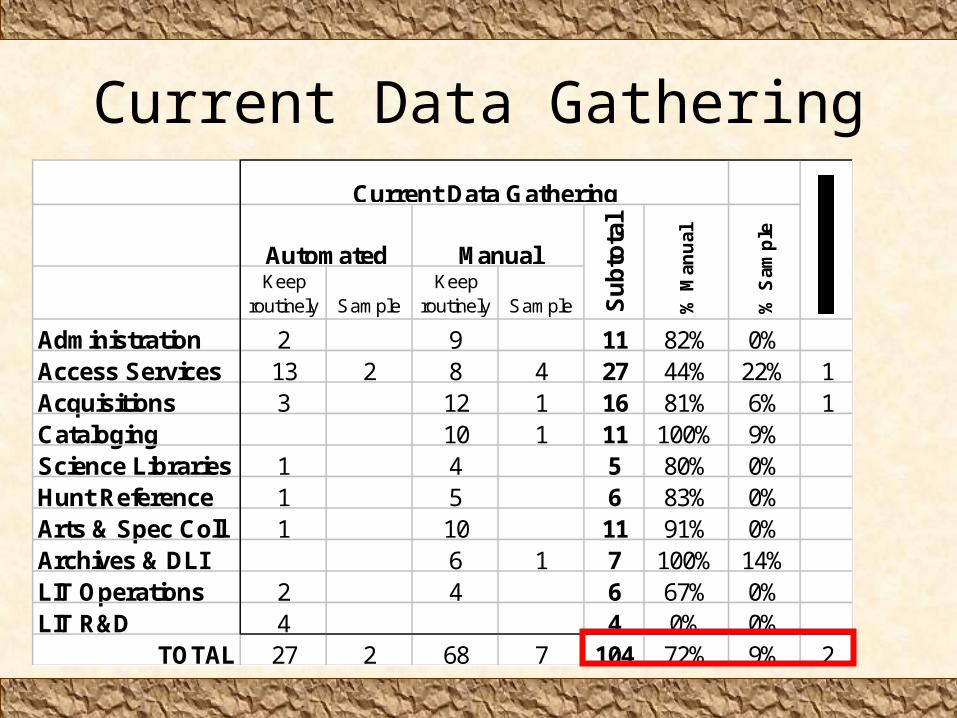
Current Data Gathering
Keep routinely Sample
Keep routinely Sample
Administration 2 9 11 82% 0%Access Services 13 2 8 4 27 44% 22% 1Acquisitions 3 12 1 16 81% 6% 1Cataloging 10 1 11 100% 9%Science Libraries 1 4 5 80% 0%Hunt Reference 1 5 6 83% 0%Arts & Spec Coll 1 10 11 91% 0%Archives & DLI 6 1 7 100% 14%LIT Operations 2 4 6 67% 0%LIT R&D 4 4 0% 0%
TOTAL 27 2 68 7 104 72% 9% 2
Current Data Gathering
Su
bto
tal
Automated Manual
% M
anu
al
% S
amp
le

Proposed Data Gathering
Keep routinely Sample
Keep routinely Sample Increase
Administration 1 1 12 8% 100% 0%Access Services 1 2 3 6 32 19% 83% 50%Acquisitions 1 1 16 6% 100% 0%Cataloging 1 1 12 8% 100% 0%Science Libraries 3 3 8 38% 100% 0%Hunt Reference 3 3 9 33% 100% 0%Arts & Spec Coll 6 6 17 35% 100% 0%Archives & DLI 0 7LIT Operations 1 1 7 14% 0% 0%LIT R&D 5 5 9 56% 0% 0%
TOTAL 7 0 17 3 27 129 21% 74% 11%
Proposed Data Gathering
% I
ncr
ease
% I
ncr
ease
M
anu
al
% I
ncr
ease
S
amp
leAutomated Manual
GR
AN
D T
OT
AL

April 2001 – Recommendations to LC
• What data to gather
• How to gather the data
• What data to manage in 1st version of new MIS
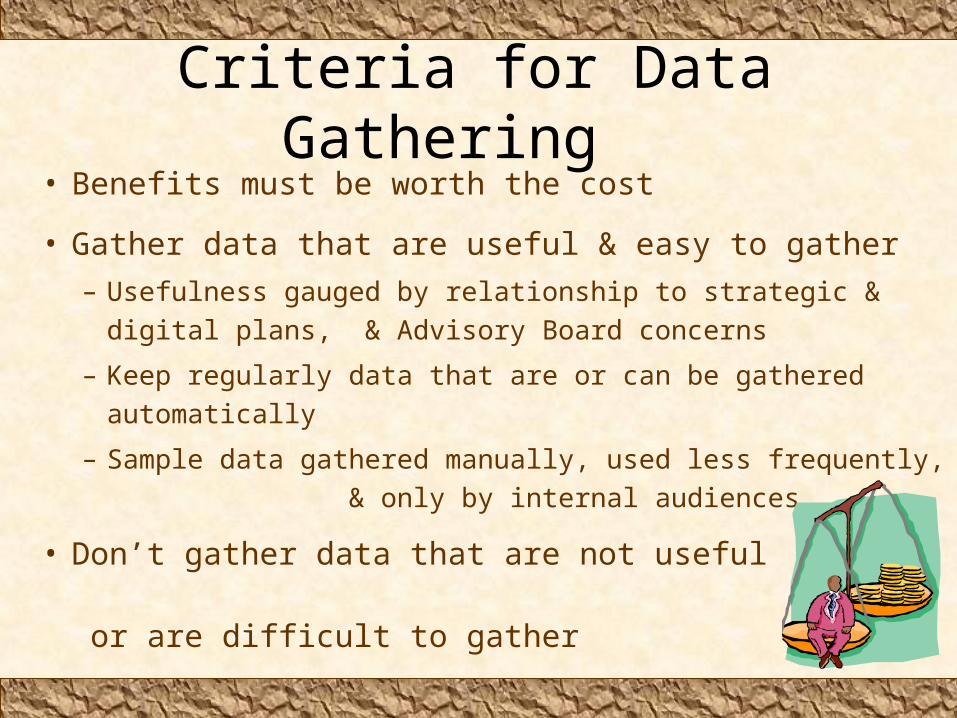
Criteria for Data Gathering • Benefits must be worth the cost
• Gather data that are useful & easy to gather
– Usefulness gauged by relationship to strategic & digital plans,
& Advisory Board concerns
– Keep regularly data that are or can be gathered automatically
– Sample data gathered manually, used less frequently,
& only by internal audiences
• Don’t gather data that are not useful or are difficult to gather

What Data to Gather & How
STRATEGY C P TOTAL
Eliminate 11 6 17 15%
Sample 13 3 16 14%
Keep regularly
Already automated 22 22 19%
Automate if possible 13 7 20 17%
Manual 36 6 42 36%
TOTAL to gather 84 16 100
C = Current P = Proposed

Changes in Data Gathering
0
25
50
75
100
125
Current Proposed Recommended
Eliminate
Sample
Automated
Manual

Criteria for Data in the New MIS
• Data gathered regularly & useful with external audiences
– University administrators, ACRL, IPEDS, & FactBook
– Measures of important traditional or digital trends
– Selected service costs & expenditures
• Small enough data set to implement in a year
– Other data may be added to MIS later
– All data gathered will NOT be managed by the MIS
• For example, department goals for Advisory Board

Next Steps for MIS TF
May 2002Decide what data manipulations, access methods & controls, & graphics we want the new MIS to do
Consider additional new measures
July 2002Determine the feasibility of what we want
Document functional requirements specification
Submit to the Libraries Council (LC) for approval
Sept 2002 Evaluate software & make recommendation to LC
Dec 2002Design the user interface of the new MIS
Use paper prototyping to facilitate design work
Jan 2003 Begin implementing new MIS prototype

Next Steps for MIS TF
??? MIS prototype ready for data entry & testing
2-3 weeks Test prototype MIS
??? Revise design & functionality based on testing
???Implement MIS
Work with LC to decide what existing data, if any, gets “migrated” to the new MIS
2-3 months Documentation, training, data entry, & testing
??? New MIS released

“Culture of Assessment”• Traditional & emerging measures
– Inputs, outputs, outcomes, composites, performance
– Meta-assessments of new measures
• Guidelines, best practices, & standards
• BS about “creating a culture”– As if new know-what & know-how are enough– No attention to what a culture really is– No understanding of what it takes to change a culture

What is a Culture?
• Beliefs – values & expectations
• Behaviors – observable activities
• Assumptions – unconscious rationale for continuing beliefs & behaviors
Conner, D.R. Managing at the Speed of Change. NY: Villard, 1992.

Orchestrating a Culture• Conduct a cultural audit
– If there’s a gap between your current culture & your objectives, close it
– If you don’t close it, the current culture wins
CURRENT
Beliefs
Behaviors
Assumptions
DESIRED
Beliefs
Behaviors
Assumptions
Transition

Audit via Observation
CURRENT DESIRED
Beliefs • Data aren’t useful
• Data aren’t used
• No reward for work
• Data are useful
• Data are used
• Work is rewarded
Behaviors • Haphazard data gathering, reporting, compilation, & analysis
• Inefficient data mgmt
• Ineffective data use
• Accurate, timely data gathering, reporting, compilation, & analysis
• Efficient data mgmt
• Effective data use
Assumptions Data aren’t important Data are important
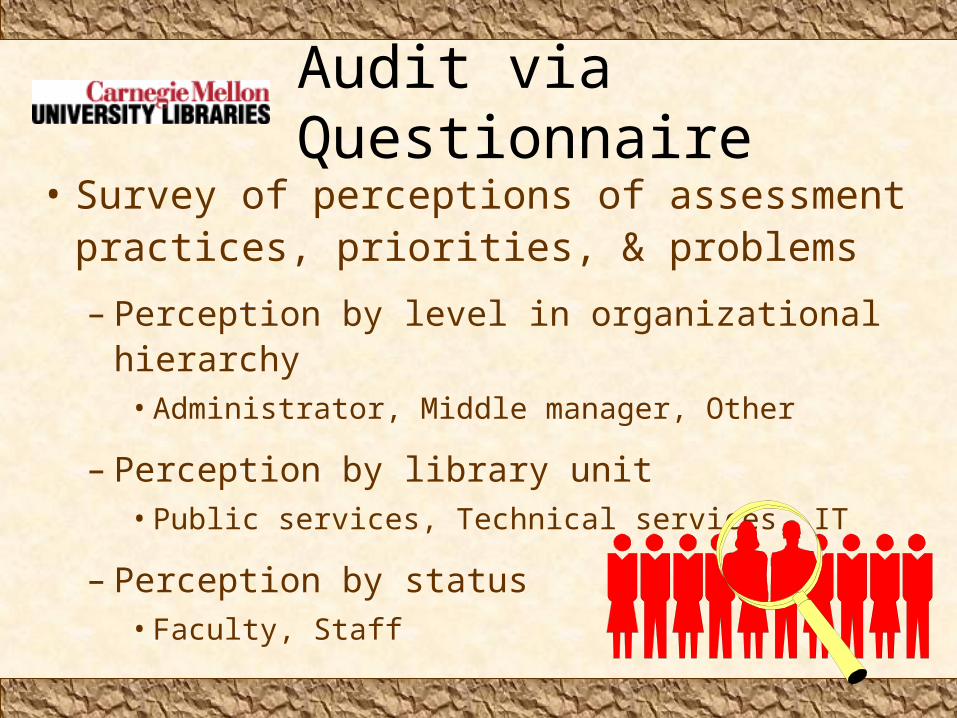
Audit via Questionnaire
• Survey of perceptions of assessment practices, priorities, & problems
– Perception by level in organizational hierarchy• Administrator, Middle manager, Other
– Perception by library unit• Public services, Technical services, IT
– Perception by status • Faculty, Staff

Audit via Questionnaire• Somewhat agree on top three assessment priorities
– Understand user behaviors, needs, expectations, & priorities
– Operate the libraries cost-effectively
– Validate expenditures
• Disagree on– How assessment is organized
– What assessments are conducted
– What resources are allocated to assessment
– What we need to solve our assessment problems

Creating a Culture of Assessment
• Change beliefs, behaviors, & assumptions
– Resistance is natural, but it should be futile
– The onus is on administration & management
• To apply consequences (motivate)
• To provide training (enable)
• Change management is pain management
– Pain = incentive to disengage from the status quo
– Remedies = incentive to adopt the vision & plans

Communication is Critical• Administrators must focus & secure commitment
– Articulate goals & rationale
– Develop & distribute action plans
– Manage expectations
– Assign responsibilities
– Provide training & consequences
– Answer questions
– Identify & solve problems
– Repeat as necessary
The alternative is to
suffer the consequences
of resistance, failure,
or missed opportunity

0
10
20
30
40
50
60
70
1960 1970 1980 1990 2000 2010 2020
Speed of Technological Change
Change is inevitable & acceleratingBy 2015, it will occur at an exponential rate

Good management
without sound administration
is like straightening the deck chairs
on the Titanic

Thank YouDenise Troll Covey
Associate University Librarian
Carnegie Mellon
412-268-8599