Embed Size (px)
Citation preview
RTQ-91-12
cFtes•-
AVR 16 1.95J
TPANSPOTM,C t PSC
DEMONSTRATION OF PRÉVOST CAR INC. H5-60 ARTICULATED COACHES
IN COMMERCIAL SERVICE
BEAUCHEIVIIN-BEATON-LAPOINTE INC.
September 1991
CANQ TR 1700A
uébec CanadU
REÇU CENTRE DE DOCUMENTATION
AvR 13 1993
TnANsPonts QUÉBEC
DEMONSTRATION OF PRÉVOST CAR INC. H5-60 ARTICULATED COACHES
IN COMMERCIAL SERVICE
MINISTÈRE DES TRANSPORTS CENTRE DE DOCUMENTATION 700, SOUL. ria*É-LÉvrisouE EST, 22e ÉTAGE QUÉBEC (QUÉBEC) - CANADA G1R 5H1
Transports Québec report number RTQ-91-12 Transport Canada report number TP 11153E
Prepared within the framework of the Canada-Québec Subsidiary Agreement on Transportation Development
Research and Development
September 1991

Thecontents 'Of thià report reflect the views of the authors and not necessarily the official views or opinions of Transport Canada or of the ministère des Transports du Québec.
,.;
f
Ce document est également disponible en français sous le titre « Projet de démonstration d'autocars articulés H5-60 de Prévost Car Inc. en service cominercial » (TP 11153F).
Bibliothèque nationale du Québec Catalogue no. T48-31/1993E ISBN 0-662-20390-9
1+1 Transport Transports Canada Canada PUBLICATION DATA FORM
I.
1, Transport Canada Publication No.
TP 11153E
2. Project No.
6942
3. Reciplent's Catalogue No.
4 Title and Subtitie Publication Date
Demonstration of Prévost Car Inc. H5-60 articulated coaches September 1991 In commercial service
Performing Organization Document No.
Author(s) Transport Canada File No.
Beauchemin-Beaton-Lapointe Inc. ZCD 1465-490
g. Performing OrganIzatIon Name and Adrar« DSS File No.
Voyageur Inc. Autocars Orléans Express Inc. 533 Ontario Street East, Suite 350 Montreal, Quebec
CISS or Transport Canada Contract No.
H2L 1N8
12 Sponsoring Agency Name and Address Type ol Publication and Period Coyered
Transportation Development Centre (DC) Guy Favreau Complex Final
200 René Lévesque Blvd. West Project Off ber West Tower, Suite 601 Montreal, Quebec H2Z 1X4 , Brian Marshall
Supplementary Notes (Funding programs, Mies of reiated publications, etc.)
Funded under the Canada-Quebec Subsidiary Agreement on Transportation Development 1985-1992 .
Abstract
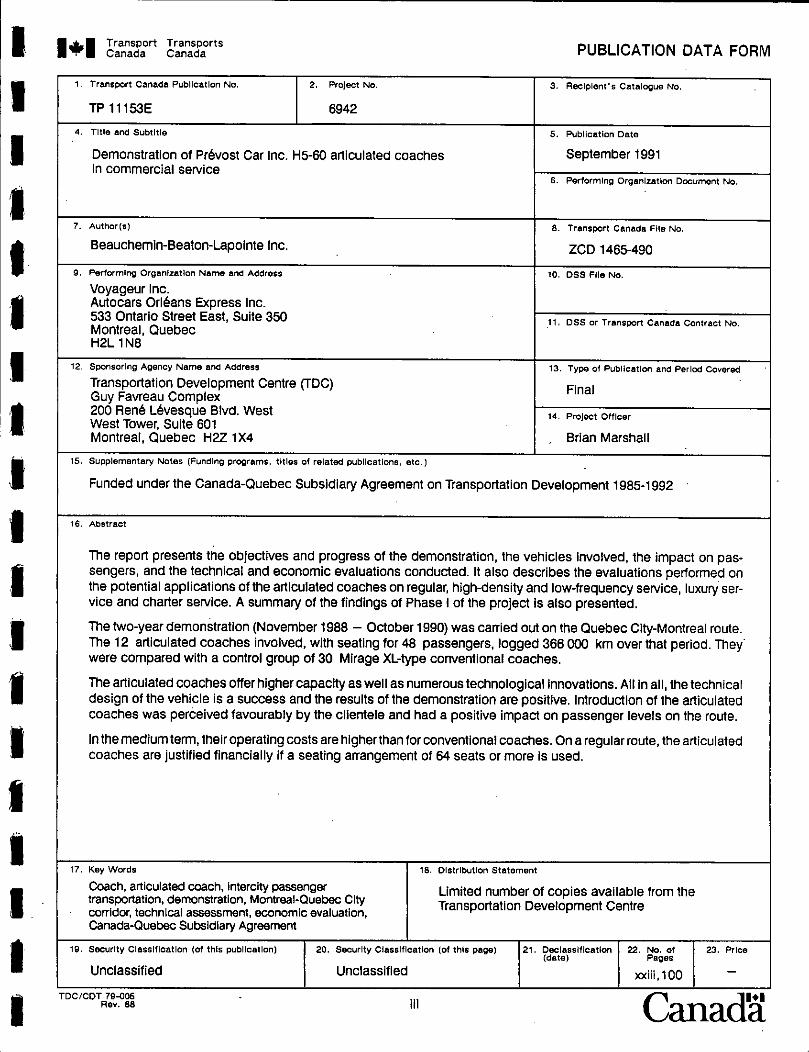
The report presents the objectives and progress of the demonstration, the vehicles involved, the impact on pas- sengers, and the technical and economic evaluations conducted. il also describes the evaluations performed on the potentiel applications of the articulated coaches on regular, high-density and low-frequency service, luxury ser- vice and charter service. A summary of the findings of Phase I of the project is also presented.
The two-year demonStration (November 1988 — October 1990) was carried out on the Quebec City-Montreal route. The 12 articulated coaches involved, with seating for 48 passengers, logged 366 000 km over that period. "[bey . were compared with a control group of 30 Mirage XL-type conventional coaches.
The articulated coaches offer higher capacity as well as numerous technological Innovations. All in ail, the technical design of the vehicle is a success and the results of the demonstration are positive. Introduction of the articulated coaches was peràeived favourably by the clientele and had a positive impact on passenger levers on the route.
In the medium term, their operating costs are hIgher than for conventional coaches. On a regular route, the articulated coaches are justified financially if a seating arrangement of 64 seats or more Is used.
17 Key Words 18 Distribution Statement
Coach, articulated coach, intercity passenger Limited number of copies avallable from the transportation, demonstration, Montreal-Quebec City corridor, technical assessment, economic eyaluation, Transportation Development Centre
Canada-Quebec Subsidiary Agreement
19, Security Classification (of this publication)
Unclassified
20. Security Classification (of this page)
Unclassified
21. Deciassification (date)
22. No. of Pages
xxii1,100
23. Price
_
CanadU TDC/CDT 79-005 Ray. 88
I+ . Transports Transport II Canada Canada FORMULE DE DONNÉES POUR PUBLICATION
1. N ° de la publication de Transports Canada
TP 11153E
2. N ° de l'étude
6942
3. N ° de catalogue du destinataire •
4, Titre et sous-titre Date de la publication
Demonstration of Prévost Car Inc. 1-15-60 articulated coaches in commercial service
Septembre 1991
N ° du document de l'organisme exécutant
Auteur (s) N ° de dossier — Transports Canada
Beauchemin-Beaton-Lapointe Inc. ZCD 1465-490
Nom et adresse do l'organisme exécutant 10 N e de dossier — ASC
Voyageur Inc. Autocars Orléans Express Inc. 533 est, rue Ontario, suite 350 Montréal (Québec)
11. N ° de contrat — ASC ou Transports Canada
H2L 1N8
12. Nom et adresse de l'organisme parrain Genre de publication et période visée
Centre de développement des transports (CDT) Complexe Guy-Favreau Final
200 ouest, boul. René-Lévesque Agent de projet Tour ouest, suite 601 Montréal (Québec) H2Z 1X4 Brian Marshall
Remarques additionnelles (Programmes de financement, titres de publications connexes, etc.)
Financé dans le cadre de l'Entente auxiliaire Canada-Québec sur le développement des transports 1985-1992
16, Résumé
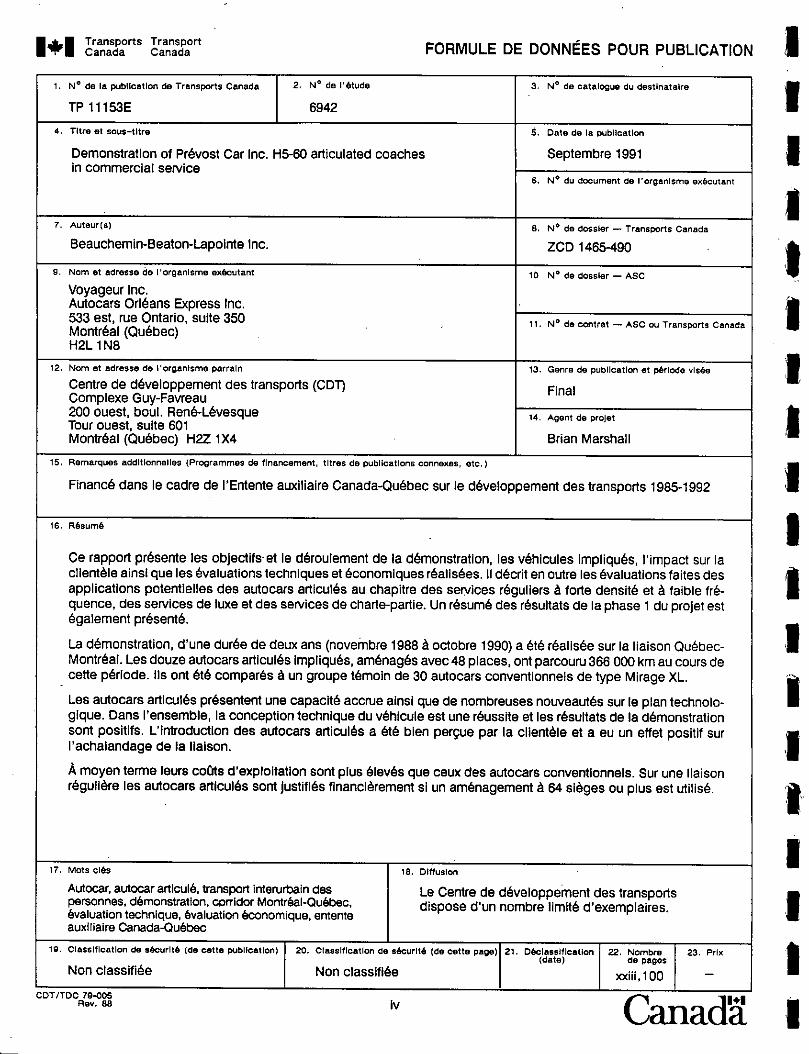
Ce rapport présente les objectifs - et le déroulement de la démonstration, les véhicules impliqués, l'impact sur la clientèle ainsi que les évaluations techniques et économiques réalisées. Il décrit en outre les évaluations faites des applications potentielles des autocars articulés au chapitre des services réguliers à forte densité et à faible fré- quence, des services de luxe et des services de charte-partie. Un résumé des résultats de la phase 1 du projet est également présenté.
La démonstration, d'une durée de deux ans (novernbre 1988 à octobre 1990) a été réalisée sur la liaison Québec- Montréal. Les douze autocars articulés impliqués, aménagés avec 48 places, ont parcouru 366 000 km au cours de
. cette période. Ils ont été comparés à un groupe témoin de 30 autocars conventionnels de type Mirage XL.
Les autocars articulés présentent une capacité accrue ainsi que de nombreuses nouveautés sur le plan technolo- gique. Dans l'ensemble, la conception technique du véhicule est une réussite et les résultats de la démonstration sont positifs. L'Introduction des autocars articulés a été bien perçue par la clientèle et a eu un effet positif sur l'achalandage de la liaison.
À moyen terme leurs coûts d'exploitation sont plus élevés que ceux des autocars conventionnels. Sur une liaison régulière les autocars articulés sont justifiés financièrement si un aménagement à 64 sièges ou plus est utilisé.
17. Mots clés 18. Diffusion
Autocar, autocar articulé, transport interurbain des Le Centre de développement des transports personnes, démonstration, corridor Mont éal-Québec, évaluation technique, évaluation économ'que, entente
dispose d'un nombre limité d'exemplaires.
auxiliaire Canada-Québec
19. Classification de sécurité (de cette publication) 20. Classification de sécurité (de cette page) 21. Declassification (date)
22, Nombre de pages
23. Prix
Non classifiée Non classifiée ,iii,100 — CDT/TDC 79-005
Rev. 88
iv
1 CanadU
• TABLE OF CONTENTS
CANADA-QUEBEC SUBSIDIARY AGREEMENT ON TRANSPORTATION DEVELOPMENT xiii
ACKNOWLEDGEMENTS xv
SUMMARY xvii
PREFACE xxii
1 PROJECT 1
1.1 Results of Phase I 2
Ii 1.2 Phase II agreement 3
1.3 Objectives of Phase II 4
1.4 General characteristics of the articulated coach and the Mirage XL coach 5
1.5 H5-60 articulated coach 5
1.5.1 Body 5
1.5.2 Articulation system 8 1.5.3 Axles 8 1.5.4 Aerodynamic drag coefficient 9
1.5.5 Engine-transmission unit 9 1.5.6 Braking system 9
1.5.7 Ventilation, air-conditioning and heating of the passenger compartment
10
1.5.8 Driver's station 10
1.5.9 Front kneeling system 10 1.5.10 Suspension 10 1.5.11 Doors 11
1.5.12 Interior layout 11
1.5.13 Overhead baggage compartments 11
1.5.14 Underfloor baggage compartments 11
1.6 Prévost Mirage XL coach 11
1.6.1 Body 11
1.6.2 Mies 13
1
TABLE OF CONTENTS
1.6.3 Engine-transmission unit
1.6.4 Braking system
1.6.5 Air-conditioning and heating of passenger compartment
1.6.6 Driver's station
1.6.7 Front kneeling system
1.6.8 Suspension
1.6.9 Door
13
14 14 14 14
14 15
1.6.10 Interior layout 15
1.6.11 Overhead baggage compartments 15
1.6.12 Underfloor baggage compartments 15
2 METHODOLOGICAL APPROACH 16
2.1 Methodology 16
2.2 Work program 17
3 PROGRESS OF THE DEMONSTRATION 18
3.1 Voyageur Inc. 18
3.2 Orléans Express 18
3.3 Impact of the transfer of activities 18
3.4 Montreal-Quebec City express service 19
3.5 Project management and organization of tasks 19
3.6 Acquisition of vehicles 20
3.7 Infrastructure and modifications 20
3.7.1 Effect of the articulated coach on infrastructure 20 3.7.2 Modifications 22
3.8 Training of personnel 23
3.9 Computer systems 23
3.10 Advertising, promotion and marketing 24
3.10.1 Advertising, promotion and marketing program 24
3.10.2 Results 25
3.11 Programming of operations 26
3.12 Use of vehicles 28
vi
TABLE OF CONTENTS
4
3.13 Maintenance
3.14 Studies and evaluations
TECHNICAL ASSESSMENT
29
29
33
4.1 Objectives 33
4.2 Methodology 33
4.3 Results 34
4.4 Detailed results 36
4.4.1 Use of the coaches 36
4.4.2 Drivers' perception 36
4.4.3 Perception of maintenance personnel 37
4.4.4 Modifications made to the articulated coach 38
4.4.5 Modifications made under warranty 41
4.4.6 Comparison of operating costs 42
4.4.7 Technical performance (qualitative evaluation) 45
4.4.8 Estimate of medium-term operating costs 48
5 MODAL SPLIT AND SEGMENTATION OF CLIENTELE IN 49 THE MONTREAL-QUEBEC CITY CORRIDOR
5.1 Objectives 49
5.2 Methodology 50
5.3 Findings 51
5.4 Detailed findings 51
5.4.1 Socio-demographic profile of respondents 51
5.4.2 Behavioural profile of respondents 53
5.4.3 Attitudinal profile of respondents 54
5.5 Trends in passenger levels 55
6 IMPACT ON CLIENTELE 58
6.1 Objectives 58
6.2 Methodology 58
6.3 Findings 58
vil
TABLE OF CONTENTS
6.4 Detailed findings 59
6.4.1 Findings of the omnibus survey 59
6.4.2 Findings of the on-board survey 60
6.4.3 Findings from group meetings 62
7 BUSINESS CLIENTELE 65
7.1 Objectives 65
7.2 Methodology 65
7.3 Findings 66
7.4 Detailed findings 66
7.4.1 Findings of the market segmentation study 66
7.4.2 Findings of the survey of travellers and corporate decision-makers
67
8 ECONOMIC EVALUATION 69
8.1 Objectives 69
8.2 Methodology 69
8.2.1 Passenger level scenarios 70
8.2.2 Estimated revenues 72
8.2.3 Unit operating costs df articulated and conventional coaches 72
8.2.4 Calculation of distance travelled and number of trips 72
8.2.5 Economic assumptions 73
8.2.6 Viability measurements 73
82.7 Combinations of assumptions 75
8.3 Results of the economic evaluation 75
8.4 Economic evaluation of the demonstration 77
8.5 Conclusion 77
9 POTENTIAL APPLICATIONS 79
9.1 Luxury service 79
9.1.1 Features of the luxury service 79
9.1.2 Methodology 80
TABLE OF CONTENTS
9.1.3 Assumptions 9.1.4 Results
9.2 Scheduled high-density, low-frequency service
9.2.1 Methodology 9.2.2 Methodological assumptions
9.2.3 Results
9.3 Economic evaluation of a charter service
82 83
84
84
87
89
89
9.3.1 Methodology 89
9.3.2 Financial assumptions 91
9.3.3 Results 91
10 CONCLUSIONS 94
10.1 Results of the technical assessment 94
10.2 Clientele 95
10.3 Viability 96
10.3.1 Viability of services offered within the framework of the demonstration
96
10.3.2 Impact of the number and arrangement of seats 96
10.3.3 Viability of potential uses 97
10.4 Impact of the articulated coach on modal split in the Montreal-Quebec City corridor
97
10.5 Outlook 98
BIBLIOGRAPHY 99
ix
TABLE OF CONTENTS
LIST OF FIGURES
Figure 1 General characteristics of the 1-15-60 articulated coach 6 and the Mirage XL coach
Figure 2 Project flow Chari 21
Figure 3 Articulated coach delivery schedule 22
Figure 4 Media calendar 25
Figure 5 Means of leaming of the existence of the arliculated coach 27
Figure 6 Number of trips saved by using articulated coaches 28
Figure 7 Maintenance of the articulated coaches and the control group 30 from November 1988 to November 1990
Figure 8 Studies and evaluations 31
Figure 9 Survey of clientele 32
Figure 10 Costs generated by the articulated coach expressed as 35 a percentage increase or decrease over the costs generated by the conventional coach
Figure 11 Average weekly distance travelled per coach 37
Figure 12 Modifications made to the articulated coaches 39
Figure 13 Work on the articulated coach — Modifications 41
Figure 14 Breakdown of operating costs — Conventional coach (30 coaches) 43
Figure 15 Breakdown of operating costs — Articulated coach (12 coaches) 43
Figure 16 Comparison of operating costs (from 1988-11-27 to 1990-10-27) 44
Figure 17 Maintenance cos1/1 000 km — Conventional coach 46
Figure 18 Maintenance cost/1 000 km — Articulated coach 46
Figure 19 Summary of work 47
Figure 20 Modal split of travellers with Montreal-Quebec City 51 as origin-destination in 1988
Figure 21 RankIng of selection criteria 54
Figure 22 Voyageur Inc. — Trends in passenger levels on express 56 routes 1978-1988 (Regression of actual data)
Figure 23 Montreal-Quebec City route — Fluctuations in passenger 57 levels during the demonstration project
Figure 24 Criteria for differentiating actual transportation mode 67
TABLE OF CONTENTS
Figure 25 Econornic evaluation methodoiogy for the articulated coaches 70
Figure 26 Passenger level scenarios 71
Figure 27 Methodology for determining number of trips 74
Figure 28 Results of economic evaluation — Montreal-Ouebec City service 76
Figure 29 Results of demonstration, January 1989 to October 1990 78 (22 months)
Figure 30 Economic evaluation of a luxury service 81
Figure 31 Results of economic evaluation — Luxury service — 1 retum trip 85
Figure 32 Results of econornic evaivation — Luxury service — 2 retum trips 86
Figure 33 Passenger levet scenarios on the Montreal-Toronto route 87
Figure 34 Results of economic evaluation — Coaches on the 90 Montreal-Toronto route
Figure 35 Charter service — Cost per seat-km 92
Figure 36 Charter service — Cost per seat-km for groups of various sizes 93
LIST OF ILLUSTRATIONS
Plate 1 115-60 articulated coach
Plate 2 Structure of the I15-60 articulated coach 7
Plate 3 Tuming radius of the articulated coach 8
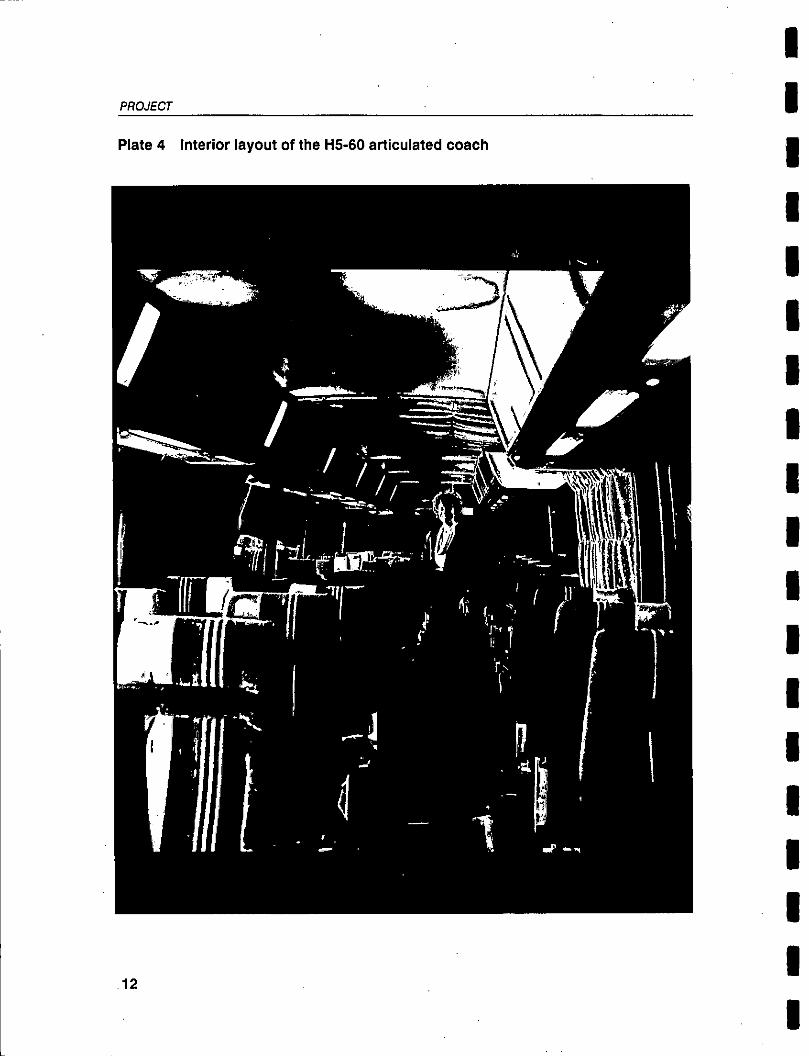
Plate 4 Interlor layout of the 115-60 articulated coach 12
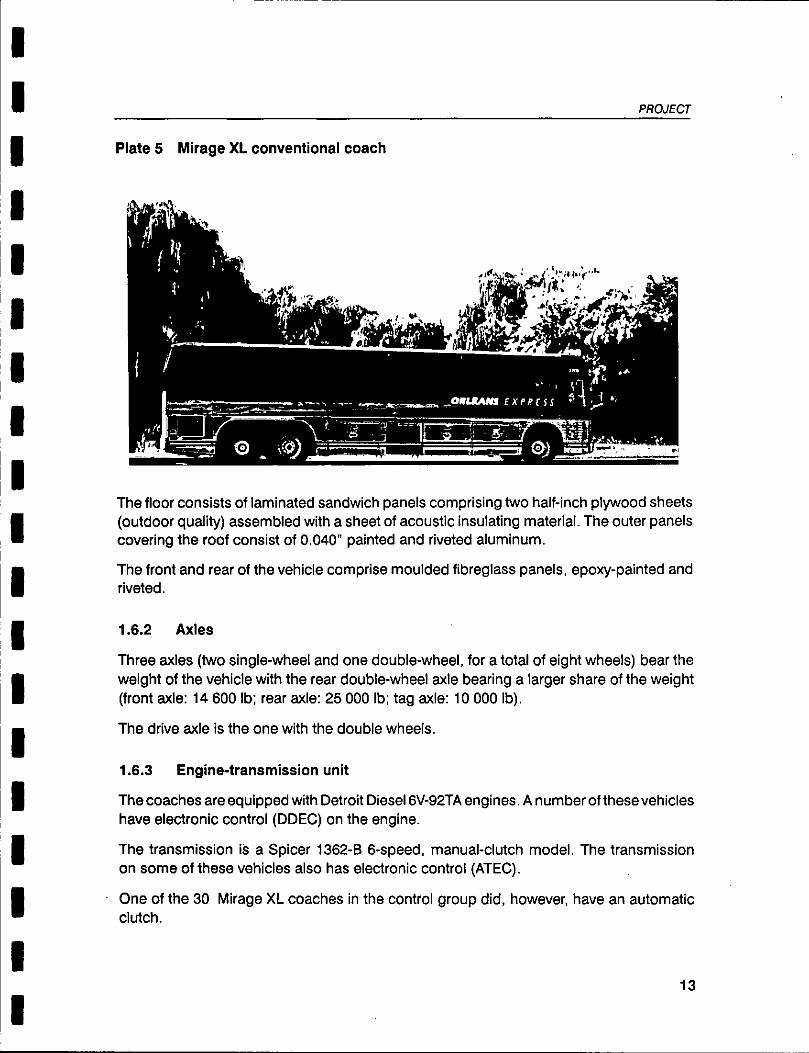
Plate 5 Mirage XL conventional coach 13
xi
CANADA-OUEBEC SUBSIDIARY AGREEMENT ON TRANSPORTATION DEVELOPMENT
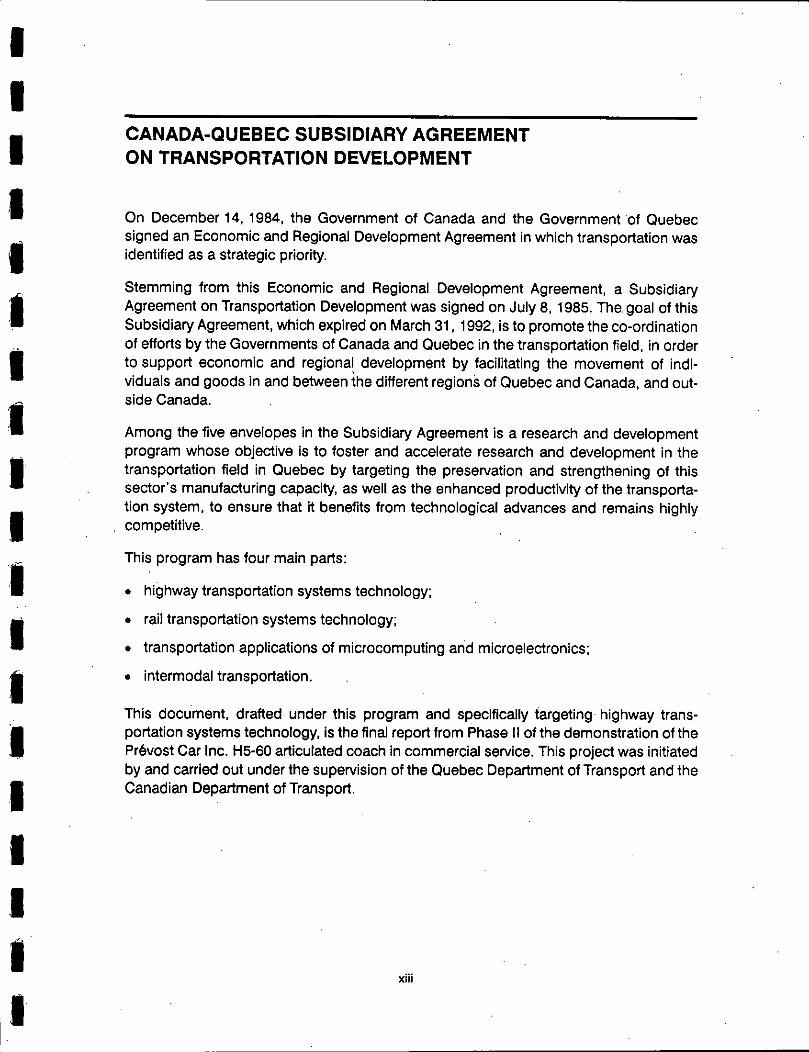
On December 14, 1984, the Government of Canada and the Government of Quebec signed an Economic and Regional Development Agreement in which transportation was identified as a strategic priority.
Stemming from this Economic and Regional Development Agreement, a Subsidiary Agreement on Transportation Development was signed on July 8, 1985. The goal of this Subsidiary Agreement, which expired on March 31, 1992, is to promote the co-ordination of efforts by the Governments of Canada and Quebec in the transportation field, in order to support economic and regional development by facilitating the movement of indi-viduals and goods in and between the different regions of Quebec and Canada, and out-side Canada.
Among the five envelopes in the Subsidiary Agreement is a research and development program whose objective is to foster and accelerate research and development in the transportation field in Quebec by targeting the preservation and strengthening of this sector's manufacturing capacity, as well as the enhanced productivity of the transporta-tion system, to ensure that it benefits from technological advances and remains highly competitive.
This program has four main parts:
highway transportation systems technology;
rail transportation systems technology;
transportation applications of microcomputing and microelectronics;
intermodal transportation.
This document, drafted under this program and specifically targeting highway trans-portation systems technology, is the final report from Phase II of the demonstration of the Prévost Car Inc. H5-60 articulated coach in commercial service. This project was initiated by and carried out under the supervision of the Quebec Department of Transport and the Canadian Department of Transport.
ACKNOWLEDGEMENTS
We wish ta thank the following individuals and organizations for their participation and assistance in the project:
Quebec Department of Transport
Jacques Brouillette
Jean-François Guilloteau
Diane Sicotte
Transport Canada
Brian Marshall
Voyageur Inc.
André Cadorette
Don Haire
Paul McElligott
Dan Sguigna
Autocars Orléans Inc.
Sylvain Langis
Serge Mérineau
Roger Morin
Jacques Yelle
XV
SUMMARY
The demonstration of Prévost Car Inc. H5-60 articulated coaches in commercial service stems from agreements signed in 1987 by the Quebec Department of Transport (MTQ), the Transportation Development Centre (TDC) of Transport Canada, and Voyageur Inc. (the carrier), under the Canada-Quebec Subsidiary Agreement on Transportation Development.
General objective
The general objective of the demonstration in regular commercial service was to review the viability of the H5-60 articulated intercity coach on the high-density Montreal-Quebec City route. This coach, presenting innovations in terms of technology and capacity (from 48 to 71 seats), was tested over a two-year period, with special attention given to its tech-nical reliability in actual operating conditions, its impact on clientele, and its profitability.
The approach and methodology selected for the demonstration were based on two fundamental principles:
identification of initial operating conditions (modal split and market segmentation, revenues, costs and problems of operation and maintenance of the conventional intercity bus fleet and network);
introduction of a control group of conventional coaches (43-seater Mirage )tLs) subject to the same operating conditions as the articulated coaches.
During the demonstration in commercial service, which ran from November 1988 ta October 1990, the 12 articulated coaches:
logged approximately 4.4 million km, an average of 366 000 km per vehicle;
travelled the Montreal-Quebec City route 15 479 times, an average of 525 km per day per vehicle.
Vehicle
The articulated coach showcases several innovations in terms not only of capacity, but also of technology. It is manufactured with materials and equipment used for the first tirne on this type of vehicle and inciudes a number of components developed especially or imported from Europe. Among the special features of the vehicle are the stainless steel structure, the bodywork of composite material, the articulation systems with self-
xvii
SUMMARY
adjusting damping mechanisms, the twin steering front axles and the fifth steering axle at the rear, the electronically controlled engine and transmission, and the antilock braking system.
The control vehicle for comparison purposes was the Mirage XL manufactured by Prévost Car Inc. and put into service with Voyageur in the second half of 1987, approximately one year before the articulated coaches. These vehicles are of classic design, using Detroit Diesel 6V-92TA engines, with manual transmission and no electronic controls.
Demonstration project
The demonstration project involved operating the articulated coaches in scheduled service on the Montreal-Quebec City route for two years, and gathering data concerning ail main-tenance, servicing and operating costs. The Montreal and Quebec City terminuses and the Voyageur Maintenance Centre in Montreal were modified so these vehicles could be used. More than 200 drivers took a 3-day training course before the demonstration began. A data collection and processing system was set up for the technical and economic evaluations. A major promotion and advertising program using television, billboards and newspapers was carried out during the first year of the demonstration. Various tech-nical and economic studies and customer surveys were conducted before and during the demonstration.
Progress of the demonstration
Despite a strike of Voyageurs maintenance personnel lasting from dune 1988 to December 1989 and despite the sale of the Montreal-Quebec City route and the articulated coaches to Autocars Orléans Express in July 1990, the demonstration project advanced without these events having any major effects on its progress. The greatest impact was that of reduced advertising from Voyageur in late 1989 and in 1990.
The additional capacity of the coaches meant as many as 97 trips per month were saved, or 1 657 trips in ail, 4% of the total.
Technical assessment
The technical assessment shows that maintenance costs for the 12 articulated coaches (labour and parts) per 1 000 km were equivalent to costs for the control group of conven-tional coaches, which were already one year old when the demonstration began. But overall operating costs (maintenance, fuel, lubrication and servicing) per 1 000 km during the demonstration, taking into account applicable warranties, were approximately 22% higher than for the conventional coach.
xvi
SUMMARY
In the medium term, that is, beyond the demonstration period, the operating costs for the articulated coach per 1 000 km would be some 35% higher than for a conventional coach.
The technical assessment also shows that the main problems with the coach were attribut-able not ta the presence of an articulation, butta the innovative equipment and the compo-nents and materials used ta ensure that vehicle weight met government standards.
Gauging the effects of the coach on passengers
A further objective of the demonstration project was ta gauge the effect of the vehicle on passengers. This assessment was based on a modal split study, conducted at the start of the demonstration, and on a series of surveys carried out during the demonstration.
The modal split study confirmed, on the one hand, that for trips between Montreal and Quebec City the automobile is the most frequently used mode, with 87.4% of travellers, followed by buses with 7.8%, airlines with 2.7% and railways with 2.1%.
A comparison of usual, preferred transportation modes shows that the bus is the least popular: close ta two-thirds (65%) of its regular clientele would prefer ta use another mode of transportation.
Despite disparities between segments, the transportation market between Montreal and Quebec City is primarily, for ail transportation modes, a market for business and work travel.
The findings of the surveys conducted during the demonstration confirm that the higher passenger levels observed during the demonstration project ta ail intents and purposes correspond te the percentage of customers saying they were travelling by bus only be-cause of the introduction of the articulated coach. The total increase in passenger levels for the entire duration of the demonstration was approximately 6%. For customers saying they weretravelling more often (or less often), it is hard, if flot impossible, ta establish in absolute terms the effect of the articulated coaches, because they may have travelled more or less frequently even without the articulated coaches.
From the studies conducted, it emerges clearly that the automobile is the most frequently (62%) and regularly used mode. It is also the mode preferred by business travellers.
Business customers stressed efficiency. They view transportation from a primarily func-tional perspective. This is indicated by modal differentation criteria, which serve te define the priorities for business travellers and corporate decision makers:
quality of the ticket reservation system, speed of ticket purchase, travel time..
xix

SUMMARY
Economic evaluation (cost-effectiveness)
Another goal of the project was ta establish the cost-effectiveness of the Montreal-Quebec City route served by 48-seat articulated coaches. It appears that it is difficult ta make this investment pay with al 5% after-tax rate of return with only 48 seats in the vehicles, in light of the higher operating costs observed and the assumptions made concerning trends in passenger levels.
The economic evaluation shows that articulated coaches equipped with more seats (for instance, 64 or more seats) present the greatest potential for intercity services and would yield a return on investment of 38.8%, compared with 0.3% for 48 seats and 8.2% for 51 seats.
The economic evaluation also examined three other types of articulated coach service:
a luxury service in a corridor (Montreal-Quebec City);
a high-density, low-frequency route (Montreal-Toronto);
a charter service.
The objective of the economic evaluation of these services was ta determine the viability of introducing and operating articulated coaches in different conditions from those prevailing for the regular service between Montreal and auebec City.
For the luxury service between Montreal and Quebec City, the findings show that a com-bination of optimistic assumptions is necessary for the service ta be profitable, namely:
passengers levels comprising from 25% to 30% new passengers and single and double cannibalization (shift of passengers from regular coaches te articulated coaches) of 15% and 20%, respectively;
fares 90% higher than regular fares.
For the Montreal-Toronto route, a regular service with lower frequency and higher density (more passengers per departure) than Montreal-Quebec City, using articulated coaches is viable for 64 and 68-seater coaches but not for 48 and 51-seaters. High-capacity coaches (64 or 68 seats) would bring total operating costs down considerably and would yield returns on investment substantially higher than 15% atter tax, with no increase in pas-senger levels.
The economic evaluation of a charter service shows that the articulated coach offers advantages over the conventional coach, even if its operating costs are higher on a per-day or per-kilometre basis. The advantages of the articulated coach are twofold:
>CC
SUMMARY
the cost per seat-kilometre may be less than for the conventional coach for several different groups, particularly for 64 and 68-seater coaches;
the articulated coach could meet needs of markets where the main considerations are comfort and spaciousness and price is a secondary factor.
Conclusion
Ail in ail, the results of the demonstration are positive, the technical design of the vehicle is a success, and the volume of clientele increased.
Nonetheless, it is concluded that the 48-seat articulated coach cannot be justified finan-cially on the Montreal-Quebec City route in existing operating conditions. The viability of the articulated coaches may be improved by taking advantage of the additional capacity provided by the vehicle and using a 64 or 68-seat configuration. Otherwise, the articulated coach must larget markets where comfort, and not fares, is the fundamental criterion on which travellers base their modal choice.
xxi
PREFACE
This summary report presents the findings and conclusions drawn from the different studies conducted in Phase II of the Prévost Car Inc. 115-60 articulated coach demonstra-tion project.
The demonstration involved:
evaluating the vehicle and its different components in commercial service on the basis of maintenance a-nd repair data and comments from drivers, mechanics and passengers;
identifying the critical elements in its maintenance (technical assessment);
identifying the modal split of intercity travel (market segmentation) in the Montreal-Quebec City corridor;
evaluating the impact on the carriers clientele of bringing an articulated coach into service;
establishing the vehicle's viability (economic assessment);
and, finally, identifying the viability of the vehicle in luxury service, charter service and on the Montreal-Toronto route.
The report also presents an overall evaluation of the coach and its future prospects.
Aside from the conclusions stemm ing from the actuel project, the report offers an overview of the demonstration project, including:
the context of the project;
the agreement from which the demonstration stems;
project objectives;
a description of the vehicle itself, including a list of its spécial features and its innova-tions with respect to conventional coaches;
methodology and work program;
tasks carried out during the project;
organization and distribution of tasks and responsibilities within the framework of the demonstration;
finally, a description of the major events that occurred during the project.
1. PROJECT
The demonstration of Prévost Car Inc. H5-60 articulated coaches in commercial service stems from agreements signed in 1987 by Voyageur Inc. (the carrier), the Ministère des transports du Québec (MTQ), and the Transportation Development Centre (TDC) of Transport Canada.
The project is the final stage of an initiative arising from the growing concerns of players in the bus transportation industry. While the bus holds the largest market share of medium-haul intercity travel of ail public passenger transportation modes in Quebec and Canada, its traditional clientele are nonetheless being eroded, to the benefit of other transportation modes. This erosion is due to the combined effect of the populations increased affluence, which translates into a greater number of cars owned and used, improvement in car quai ity, improvement of the highway network, and aging of the population, ail of which reduce the size of the bus's major traditional clientele. Over the same period, the quality of bus service has net substantially improved, and more comfortable modes of transportation, such as the train, have attracted travellers on certain routes.
In light of this situation and the fact that conventional intercity buses have trouble com-peting with the automobile, Voyageur Inc. sought ways of increasing its market share while bringing down its operating costs. In 1981, Voyageur tested a Neoplan articulated coach of German design. This coach, and particularly its articulation, proved inadequate for Voyageur's operating conditions. Prévost Car Inc., the only intercity bus manufacturer in Quebec and one of the three largest in North America, then developed an articulated coach. Prévost Car built afirst prototype in 1985 and the first production vehicle, the H5-60, in 1988.
Given its needs, Voyageur Inc. was interested in this new articulated coach developed by Prévost Car Inc. But the novelty of the product and the integration of this type of vehicle in the existing fleet were hurdles for Voyageur. In addition, the acquisition of articulated coaches represented a major investment. The introduction of the vehicle would also in-volve considerable start-up costs, such as changes to garages and terminuses, personnel training and the purchase of a new parts inventory.
Because of the costs and risks represented by the introduction of articulated coaches, Voyageur Inc. approached the governments of Quebec and Canada regarding financial assistance for testing the H5-60. In 1987, the Ministère des transports du Québec (MTQ) and the Transportation Development Centre (TDC) of Transport Canada signed an initial agreement for preliminary endurance tests and various other technical tests to be con-ducted on the Prévost Car Inc. articulated coach prototype. These tests, constituting Phase I of the project, were carried out and completed to the satisfaction of Voyageur, which then wished to undertake Phase II.
1
PROJECT
On October 22, 1987, the three partners completed negotiations on the conditions for a demonstration service and, under the Canada-Quebec Subsidiary Agreement on Trans-portation Development, signed agreements providing for the acquisition and trials of vehicles in commercial service.
The demonstration project, under the responsibility of a management committee con-sisting of one MTC) and one TDC representative, teck place in four stages. The objective of the first stage was te plan the demonstration and establish the approach to be followed. This planning stage was followed by the preparation and development of the demon-stration, then by the actual two-year demonstration in commercial service, starting on November 14, 1988. The fourth stage consisted of the evaluation of the results of the implementation.
1.1 Results of Phase I
The endurance and evaluation testing, or Phase I of the demonstration project, began on March 27, 1986, and ended on May 9, 1986. During this period, the prototype articulated coach logged 53 353 km. The tests were carried out by a team of five professional drivers from Voyageur Inc., supported by a crew from Prévost Car Inc., one of whom was available at ail times.
The endurance and evaluation tests included driving activities on various routes in Quebec, including 2000 km of tests in winter on extremely slippery, snow-covered highways in Chibougamau Park, Laurentide Park, Abitibi and La Vérendrye Park, on mountainous secondary roads in the Laurentians, and in dense urban settings at rush heur. High-speed driving trials on main highways and autoroutes were aise carried out, including 48 000 km of tests on Autoroutes 20 and 40 between Montreal and Quebec City.
The endurance tests allowed for the evaluation of more than 100 different components and elements in various operating scenarios. Emphasis was placed on evaluating the articula-tion turntable and the main structure of the coach as well as its exterior skin, ail of which were new concepts.
These important components were evaluated in difficult operating conditions, in terms of load, centre of gravity and speed and in terms of driving methods.
The results of the different tests and evaluations may be summarized in four points:
The vehicle's articulation turntable, its main structure, its exterior skin and its sus-pension performed excellently.
In terms of highway handling and safety in a variety of extreme driving conditions, the vehicle showed:
2

PROJECT
- safe handling
- excellent braking
good road holding
- excellent lateral stability
- satisfactory traction
- the ability to climb an 18% grade, to stop in the middle of the ascent, with full load, and ta start up again
good manoeuvrability and visibility
excellent handling and a well-designed driver's station
- a comfortable, ergonomically sound drivers station
- a feeling of security for each of the different manoeuvres effected.
The passenger compartment of the vehicle was evaluated as pleasant and practical, offering good visibility and great comfort. The rear section is just as comfortable as the forward section.
The other components evaluated also showed satisfactory results overall.
Following the trials in Phase I, Voyageur Inc. considered the design of the H5-60 articulated coach prototype to be successful.
Suggestions and observations were conveyed to the manufacturer during the trials. Most of these recommendations concerned the specific standards required by Voyageur and normally used in its equipment specifications.
1.2 Phase II agreement
An agreement with Voyageur Inc. for the demonstration of the Prévost H5-60 articulated coach was signed on October 22, 1987. Under the agreement:
the demonstration was to take place in commercial service with a minimum of 12 or a maximum of 20 Prévost H5-60 articulated coaches delivered in two stages (12 ve-hicles followed one year later by 8 more vehicles)
this demonstration covered the Montreal-Ouebec City express route, under the carrier's regular operating conditions.
The agreement called for a two-year demonstration in commercial service starting in November 1988.
3

PROJECT
The expenditures eligible for government financial assistance covered the costs of vehicle acquisition, purchase and modification of infrastructures, personnel training, promotion and advertising, impact studies, and project management.
Government funding provided under the agreement was set at a maximum of $4 898 000, ta be shared equally by the two governments. The total project cost, including the carriers share, was estimated at $12 million.
1.3 Objectives of Phase II
The general objective of the demonstration service was to determine the viability of the H5-60 articulated coach on a high-density route over a two-year period.
In addition ta this general objective, the project had 10 specific objectives related to tech-nical, commercial and intermodal aspects.
The technical objectives were.
to assess the technical reliability of the H5-60 articulated coach and its innovations;
to evaluate the feasibility of using the H5-60 articulated coach in commercial service on a regular route;
to evaluate the implications for maintenance and operations of introducing articulated coaches;
to determine the reaction of employees working with the articulated coaches and to determine any resulting attitudinal changes.
There were three economic objectives:
to assess the viability of the H5-60 articulated coach service compared with the ser-vices using conventional coaches;
to assess the impact of the number and configuration of seats on the viability of the articulated coach;
to establish, on the basis of information gathered during the demonstration, the viability of potential uses of the H5-60 articulated coach.
4
PROJECT •
The commercial objective was:
te measure the response of existing and potential clientele, and see how this response changes, with respect te the articulated coaches, during the demonstration.
With regard te intermodality, the project had two objectives:
te gauge the contribution of the articulated coaches to the efficiency and performance of the passenger transportation system in Quebec;
te measure, for the duration of the demonstration, the volume and characteristics of the intermodal transfers associated with the introduction of the articulated coaches.
1.4 General characteristics of the articulated coach and the Mirage XL coach
In addition te the H5-60 articulated coach, the demonstration project involved using a control group of 30 Mirage XL coaches, which were already in service with Voyageur. Figure 1 presents the main features of the articulated coach and the Mirage XL coach.
1.5 H5 -60 articulated coach
Prévost Car Inc.'s 115-60 articulated coach is a North American intercity bus presenting innovations in terms of both capacity and technology. Its design is the result of almost seven years' research. Furthermore, this coach comprises materials and equipment used for the first time on this type of vehicle. It also includes components imported from Europe or developed specifically for its needs. The coach's significant innovative com-ponents and equipment may be listed under 14 headings.
1.5.1 Body
The body consists of a self-supporting structure designed using computer simulation. The structural components are made of rust-protected stainless steel, from the vehicle base te above the windows. The stainless steel structure was chosen in response te the very serious problem of corrosion in buses.
The structural supports for the suspension are made of corrosion-protected high tensile steel. The upper front section of the structure, supporting the windshields, is made of com-posite material (Kevlar) reinforced with carbon fibre, and moulded in one piece for greater strength and easy replacement in the event of major damage. The side panels and rear cap are also made of sandwich-type composite material (Kevlar).
5
PROJECT
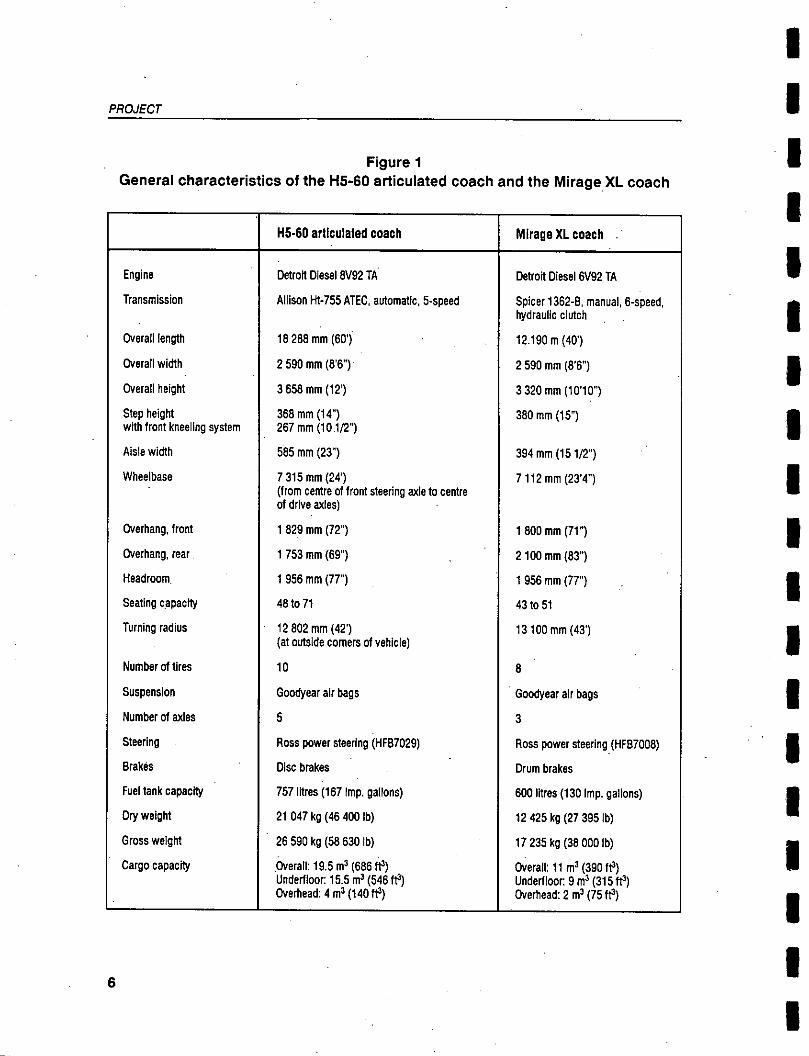
Figure 1 General characteristics of the H5-60 articulated coach and the Mirage XL coach
H5 -60 articulated coach Mirage XL coach ..
Engine Detroit Diesel 8V92 TA . Detroit Diesel 6V92 TA
Transmission Allison lit-755 ATEC, automatic, 5-speed Spicer 1362-8, manuel, 6-speed, hydraulic clutch .
Overall length 18 288 rn .rn (60') 12.190 m (40')
Overall width 2 590 mm (86") 2 590 mm (8 .6")
Overall height 3 658 mm (12') 3 320 mm (10'10")
Step height 368 mm (14") 380 mm (15") with front kneeling system 267 mm (10 1/2")
Aisle width 585 mm (23") 394 mm (15 1/2")
Wheelbase 7 315 mm (24') 7 112 mm (23'4") (tram centre of front steering axle ta centre of drive axles)
Overhang, front 1 829 mm (72") 1 800 mm (71")
Overhang, rear 1 753 mm (69") 2 100 mm (83")
Headroom 1 956 mm (77") 1 956 mm (77")
Seating capacily 48 ta 71 43 to 51
Turning radius 12 802 mm (42') 13 100 mm (43') (at outside corners of vehicle)
Number of tires 10 8
Suspension Goodyear air bags Goodyear air bags
Number of ales 5 3
Steering Ross power steering (HFB7029) Ross power steering , (HFB7008)
Brakes Disc brakes Drum brakes
Fuel tank capactty 757 litres (167 Imp. gallons) 600 litres (130 Imp. gallons)
Dry weight 21 047 kg (46 400 lb) 12 425 kg (27 395 lb)
Gross weight 26 590 kg (58 630 lb) 17 235 kg (38 000 lb)
Cargo capacity .0v. erall: 19.5 m3 (686 ft3) Ov' erall: 11 m 3 (390 ft3) Underfloor. 15.5 m 3 (546 ft3) Underfloor: 9m 3 (315 ft3) Overhead: 4 m 3 (140 ft3) Overhead: 2 m 3 (75 1t3)
6

PROJECT
Plate 1 115-60 articulated coach
Plate 2 Structure of the H5-60 articulated coach
7
PROJECT
1.5.2 Articulation system
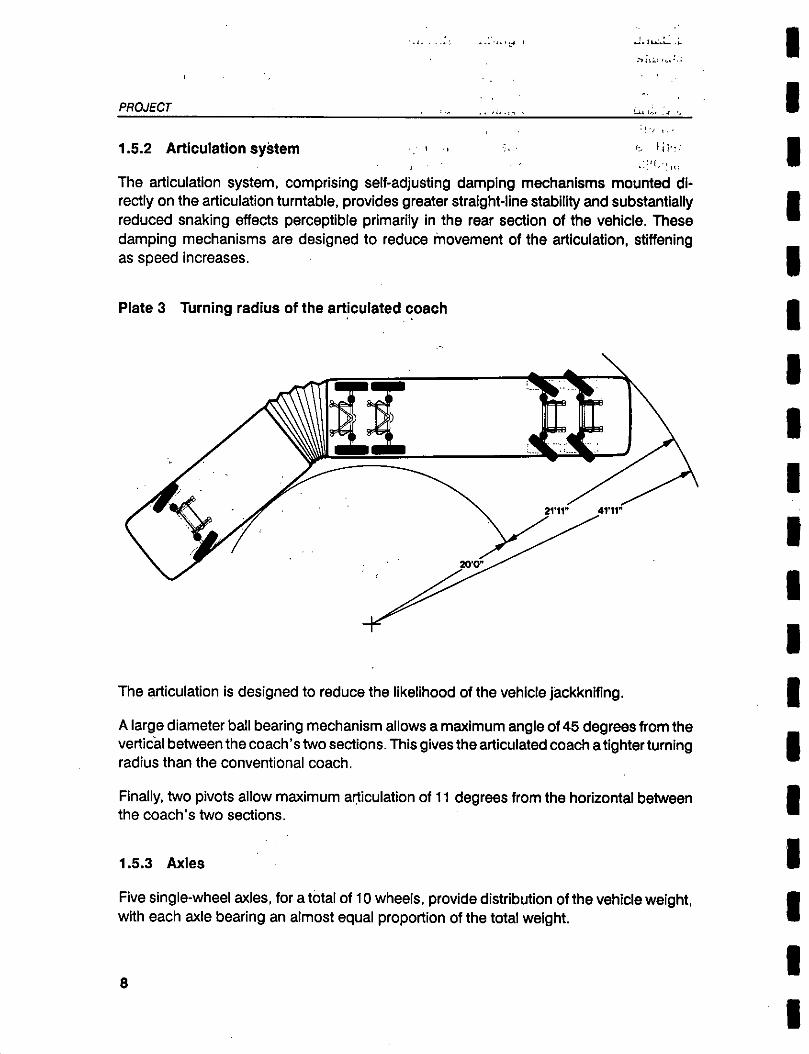
The articulation system, comprising self-adjusting damping mechanisms mounted dl-rectly on the articulation turntable, provides greater straight-line stability and substantially reduced snaking effects perceptible primarily in the rear section of the vehicle. These damping mechanisms are designed to reduce movement of the articulation, stiffening as speed increases.
Plate 3 Turning radius of the articulated coach
The articulation is designed to reduce the likellhood of the vehicle jackknifing.
A large diameter ball bearing mechanism allows a maximum angle of 45 degrees from the vertical between the coach' s two sections. This gives the articulated coach a tighter turning radius than the conventional coach.
Finally, two pivots allow maximum articulation of 11 degrees from the horizontal between the coach's two sections.
1.5.3 Axles
Five single-wheel axles, for a total of 10 wheels, provide distribution of the vehicle weight, with each axle bearing an almost equal proportion of the total weight.
8
PROJECT
The forward tandem consists of two steering axles. These axles are twinned with the rear axle, also a steering axle, which is controlled by a device integrated in the articulation turntable,•thus facilitating city operation.
The two drive axles, grouped in tandem, are placed in the centre of the vehicle right behind the engine-transmission unit, so as to increase the traction coefficient and ensure direc-tional stability.
1.5.4 Aerodynamic drag coefficient
The aerodynamic design of the vehicle is the result of wind tunnel testing. The rounded windshields facilitate air flow and minimize turbulence along bath the top and sides of the vehicle.
An aerodynamic spoiler is mounted on the front bumper to accelerate air flow along the side walls.
The roof of each section is a single sheet of aluminum, fastened and bonded to the structure for improved air flow.
The glass bays and smooth outside panels are flush-mounted with hidden fasteners, also to facilitate air flow.
1.5.5 Engine-transmission unit
The coach is equipped with a Detroit Diesel 8V-92-DDEC (Detroit Diesel Electronic Contrai) engine, which incorporates electronic controls for engine efficiency (fuel consumption) and for comprehensive diagnosis of engine problems, and an Allison HT-755 ATEC (Allison Transmission Electronic Control) automatic five-speed transmission te prolong the transmission life.
For ease of inspection and maintenance, the entire unit is mounted on a slide-out cradle, which is part of the vehicle's integral structure.
1.5.6 Braking system
The compressed air braking system comprises three independent braking circuits, one manuel parking brake, disc brakes with automatic tension devices on ail 10 wheels and an antilocking system.
Rockwell Dura-Master oversize brakes are installed on each of the 10 wheels. These brakes are actuated by a Wabco ABS antilocking system, for controlled deceleration and directional stability in ail highway conditions.
9
PROJECT
A hydraulic retarder, which regulates the vehicle's deceleration on braking, is built into 11 the transmission.
1.5.7 Ventilation, air-conditioning and heating of the passenger compartment
The air-conditioning compressor is mounted on the slide-out cradle of the engine-transmission unit.
Three independent units provide ventilation and temperature control in each of the coach 's three zones: driver's station, front section and rear section.
The precision and energy efficiency of the air-conditioning and heating system are ensured by an electronic calibration system.
1.5.8 Driver's station
The console groups instruments together by function. Controls for the door, rearview mirrors and cabin lighting are to the driver's let Driving accessories, such as odometer, oil and air pressure gauges and outside lighting controls, are laid out in front of the driver for enhanced readability. Te the driver's right are the TV monitor, linked to the rear camera for backing-up manoeuvres and rear door monitoring, and the PA and stereo system controls.
The fully adjustable driver's seat is equipped with headrest and armrests. The steering 1 wheel is also adjustable.
The entire driver's station was designed te recognized ergonorriic standards. 1
1.5.9 Front kneeling system
The coach is equipped with a kneeling system wherebythe front can be lowered by 150 mm 1 (6 inches) for greater user comfort on boarding or disembarkation.
1.5.10 Suspension
The vehicle's suspension features two air springs. The axles are coupled to the body by 1 means of flexible air bags and dual action shock absorbers. The suspension aise com-
prises stabilizer bars on each axle. An automatic levelling system keeps the vehicle at a constant levei with the road. Each steering axle is also equipped with Panhard rods and radius rods, while the differential axles are equipped with V-mounted radius rods.
10

PROJECT
1.5.11 Doors
The forward and rear doors are compressed-air operated. The door moves out and slides backwards in the same plane as the vehicle, for a wider opening with less space required for movement.
1.5.12 Interior layout
The coach has reclining seats with armrests, and cushions moulded to recognized ergo-nomic standards. The vehicle's seat arrangement allows generous space for passengers' shoulders and knees. Seats are arranged in a configuration of 16 rows with three seats abreast (one on one side of the aisle, two on the other).
The seats are also fitted with work tables.
Overhead baggage compartments
The baggage compartments are equipped with doors and have an average capacity of 0.2 m3 (7.75 cubic feet); total capacity is 3.9 m 3 (140 cubic feet).
1.5.14 Underfloor baggage compartments
The coach has four baggage compartments stretching the width of the vehicle. Three of these compartments are located in the rear section. The doors of ail thesecompartments are 122 cm (48 inches) high on both sides of the vehicle. The coach also hes smaller compartments above the wheels on the left-hand side. The overall capacity of the com part-ments is 15.5 m 3 (546 cubic feet).
1.6 Prévost Mirage XL coach
A control group of 30 Prévost Mirage XL coaches was used during the first part of demon-stration; 20 were used during the last six months. These coaches ail had the same tech-nical components and equipment, aparl from one which had automatic rather th an manuel transmission.
The components and equipment of this coach are described in the following sections.
1.6.1 Body
The structural components are made partially of stainless steel.
The roof is rust-protected through acid treatment, epoxy-based zinc chromate sealer paint, a tectyl-based treatment and a sealer peint.
11
PROJECT
Plate 4 Interior layout of the H5-60 articulated coach
12
PROJECT
Plate 5 Mirage XL conventional coach
The floor consists of laminated sandwich panels comprising two half-inch plywood sheets (outdoor quality) assembled with a sheet of acoustic insulating material. The outer panels covering the roof consist of 0.040" painted and riveted aluminum.
The front and rear of the vehicle comprise moulded fibreglass panels, epoxy-painted and riveted.
1.6.2 Axles
Three axles (two single-wheel and one double-wheel, for a total of eight wheels) bear the weight of the vehicle with the rear double-wheel axle bearing a larger share of the weight (front axle: 14 600 lb; rear axle: 25 000 lb; tag axle: 10 000 lb).
The drive axle is the one with the double wheels.
1.6.3 Engine-transmission unit
The coaches are equipped with Detroit Diesel 6V-92TA engines. A number of these vehicles have electronic control (DDEC) on the engine.
The transmission is a Spicer 1362-B 6-speed, manual-clutch model. The transmission on some of these vehicles also has electronic control (ATEC).
One of the 30 Mirage XL coaches in the control group did, however, have an automatic clutch.
13

PROJECT
1.6.4 Braking system
The compressed air braking system comprises two independent circuits, one manuel parking brake and drum brakes.
These coaches are flot equipped with anti-locking systems or hydraulic retarders.
1.6.5 Air-conditioning and heating of passenger compartment
Two units provide ventilation and temperature control in both zones of the coach: driver's station and passenger compartment.
1.6.6 Driver's station
The driver's station is equipped with standard components for this type of vehicle:
2 air pressure gauges
odometer
tachometer
ou l pressure gauge
water temperature gauge
fuel tank gauge
voltmeter
miscellaneous indicator lights and audible warnings
1.6.7 Front-kneeling system
None of the vehicles in the control group is equipped with a front-kneeling system, although it is an option on this coach model.
1.6.8 Suspension
The vehicle's suspension comprises Goodyear air bags. The front axle comprises:
2 cushions
2 shock absorbers
4 radial rods
1 Panhard lateral rod
1 level adjustment valve
; .14
PROJECT
The rear drive axle comprises:
4 cushions
4 shock absorbers
3 radial rods
1 Panhard lateral rod
2 level adjustment valves
The tag axle comprises:
2 cushions
2 shock absorbers
4 radial rods
1 Panhard lateral rod
1.6.9 Door
The coach has a single, manually operated door.
1.6.10 Interior layout
The coach is equipped with standard reclining seats, arranged in a configuration of 10 rows with two seats on either side of the aisle and an eleventh row at the rear with three seats.
1.6.11 Overhead baggage compartments
The overhead baggage compartments are equipped with doors. The total capacity of these compartments is 2 m3 (75 cubic feet).
1.6.12 Underfloor baggage comPartments
The coach has three underfloor baggage compartments stretching the width of the vehicle. These compartments are located between the front and rear axles. Their doors are 90 cm (35 1/2 inches) high. The overall capacity of the underfloor compartments is 9 m 3 (315 cubic feet).
15

2. METHODOLOGICAL APPROACH
The approach chosen for the demonstration project called for four stages:
Identification of the methodology
Development of the work program
The actual demonstration (Implementation, studies and evaluations)
Comprehensive evaluation
2.1 Methodology
The methodological approach chosen for the project was based•on two fundamental principles:
Identification of the initial operating conditions (market segmentation, revenues, operating and maintenance costs and problems for the fleet and the network).
Use of a contrai group of conventional coaches subject to the same operating condi-tions as the articulated coaches to enable comparative assessment.
A control group of conventional coaches makes it is possible ta identify which changes in the initial operating conditions were specifically brought about by the introduction of the articulated coach. It also alloWs for comparison of the performance of the articulated coach with that of the conventional coach (impact on clientele, revenues, technical reliability, maintenance and operating costs, etc.).
The original contrai group consisted of 30 Prévost Car Inc. Mirage XL Series 2200 coaches in commercial service. They were subject ta the same operating conditions as the articu-lated coaches, namely:
in service primarily in the Montreal-Quebec City express route; I
used on major highways and autoroutes with a few exceptions because of the impossi-I bility of confining these vehicles exclusively to the Montreal-Quebec City route;
undergoing the same type of maintenance and technical assessment. I
The Mirage XLs in the control group are 43-seater vehicles delivered in 1988, some of which are equipped with the Detroit Diesel Electronic Contrai (DDEC) system and others
I with the Allison Transmission Electronic Contrai (ATEC) system.
16
METHOD.OLOGICAL APPROACH
Six months before the end of the demonstration, 100f the Mirage XLs in the control group were bought by Voyageur Colonial when Voyageur Inc.'s network was sold off. These 10 Mirage XLs were therefore not part of the demonstration during the last six months.
2.2 Work program
The methodology was based on a rigorous work program identifying tasks to be per-formed, budgets, schedules and players involved. The work program ranked in order and described in detail the following eight tasks required for the project:
acquisition of vehicles and mechanical parts;
alteration of infrastructures;
training of personnel; Y.
automation of the data management system;
project advertising and promotion;
programming of the operation, implementation and data gathering;
studies and evaluations;
project management.
Each of these activities, the organization of tasks and the allocation of responsibilities are ail described in Chapter 3.
17
3. PROGRESS OF THE DEMONSTRATION
The demonstration was carried out in the context of the Montreal-Quebec City express service offered by Voyageur Inc., and subsequently by Orléans Express Inc.
3.1 Voyageur Inc.
Voyageur Inc. offered a passenger and parcel transportation service in Quebec and Ontario until 1990.
Before its assets were sold, this firm ranked third in North America and first in Canada among bus passenger transportation companies in sales.
Voyageur's network stretched from Toronto, Ottawa and Montreal to Quebec City, Jonquière, the North Shore and the Gaspé. In Quebec, the network included the Abitibi and Sherbrooke routes. The Montreal-Quebec City route generated the greatest revenues.
In 1989, Voyageur Inc. began to sell off its network in Quebec. The routes to Sherbrooke and Abitibi were sold to another carrier. This sale had no impact on the demonstration project. Another part of the network, Quebec City to Jonquière and Quebec City to Baie Comeau, was sold to a local carrier and, on July 5, 1990, Autocars Orléans Express acquired the remainder of the network.
3.2 Orléans Express
Orléans Express took over the demonstration project from Voyageur Inc. in 1990.
Orléans Express was formed following the sale of the network and assets of Voyageur Inc. in 1990. This company purchased the exclusive Montreal-Quebec City route, the Lower St. Lawrence-Gaspé route and a substantial portion of Voyageur's assets, including Mirage XL coaches and ail the articulated coaches.
Orléans Express also hired Voyageur Inc.'s drivers, maintenance management personnel and administrative personnel, thereby ensuring continuity of service in the Montreal-Quebec City corridor.
3.3 Impact of the transfer of activities
The transfer of part of Voyageur Inc.'s assets to Orléans Express had no significant impact on the progress and results of the demonstration. It should, however, be noted that in the six months prior to the sale of its assets, Voyageur limited its investment in marketing (promotion and advertising) and made its personnel available only within the limits provided for in the agreement.
18
PROGRESS OF THE DEMONSTRATION
3.4 Montreal-Quebec City express service
The Montreal-Quebec City service operated exclusively by Voyageur Inc. and subse-quently by Orléans Express from the Montreal, Longueuil, St. Foy and Quebec City terminuses involved:
departures almost every hour between 06:00 and 23:00;
guaranteed seat and departure for ail ticket holders;
parcel service;
through service to Chicoutimi, Baie Comeau and Ottawa.
During the demonstration period, the Montreal-Quebec City route was sold, the Voyageur employees went on strike, and the company switched to subcontractors for vehicle maintenance
The strike of employees of the Voyageur Maintenance Centre and the Montreal and Quebec City terminuses and of Voyageur accounting staff from J une 1988 to December 1989, along with the anticipated sale of some of its assets, led Voyageur to limit the num ber of necessary alterations to the garage and terminus infrastructure for maintenance and oPeration of the arliculated coaches, and to use subcontracting. This had the effect of increasing the cost of certain services which were now carried out manually, such as hand washing rather than automatic washing, but the service was not affected.
3.5 Project management and organization of tasks
As defined in the agreement, Voyageur Inc., and subsequently Orléans Express, were responsible for project management. The services of Beauchemin-Beaton-Lapointe Inc. (BBL) were retained to assist with the management of the demonstration project.
The BBL project manager was solely or jointly responsible with the management com-mittee for:
co-ordinating ail activities among the carrier's various departments;
managing the budget and establishing invoicing;
providing liaison between the carrier and the project management committee;
ensuring contact with the manufacturer, Prévost Car Inc.;
drafting a number of the specifications and calls for tender for professional services;
recommending professionals for conducting the different studies;
19
PRO GRESS OF THE DEMONSTRATION
ensuring follow-up of the studies and of recommendations with respect to the project jointly with the management committee;
drafting a final report of the demonstration project.
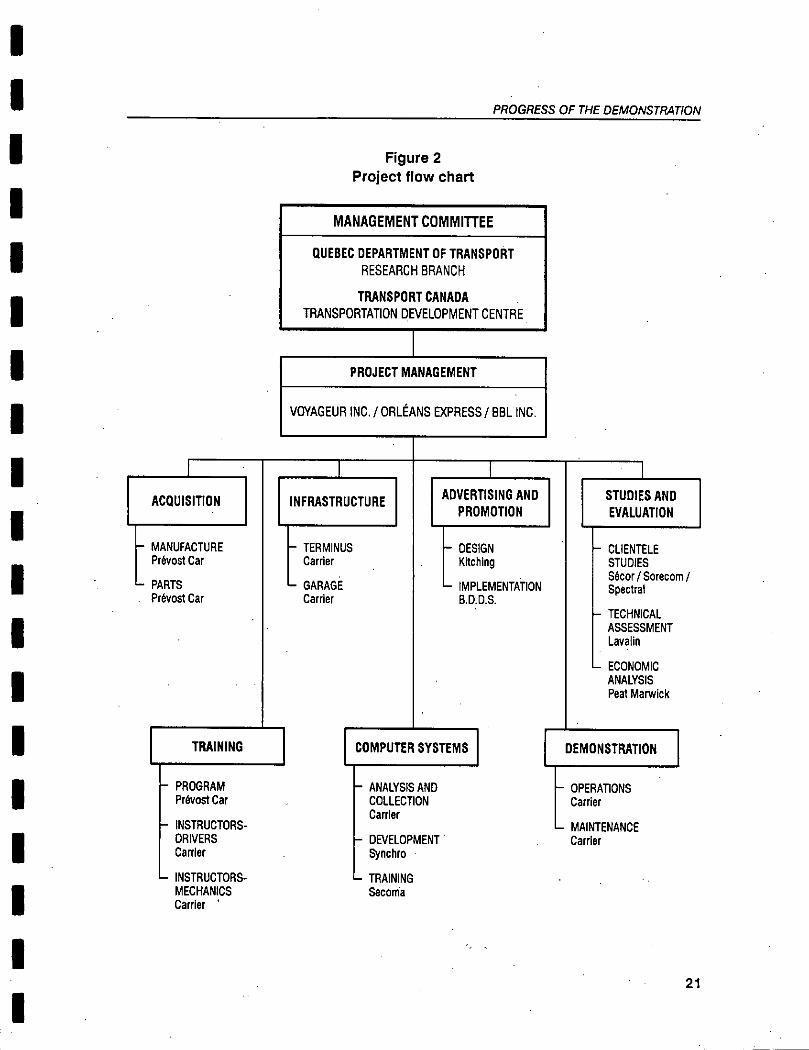
Figure 2 presents the project flow chat
3.6 Acquisition of vehicles
The original vehicle acquisition plan for the demonstration project called for a Iwo-stage purchase of a maximum of 20 articulated coaches from Prévost Car Inc.
In the first stage 12 articulated coaches were bought.
The second stage provided for in the plan involved the purchase and bringing into service of eight more articulated coaches one year after the introduction of the first group. The decision as to whether to acquire the eight additional vehicles lay with Voyageur Inc. which, for various reasons, did not exercise this option.
Mer the submission of the results of the first year of implementation in October 1989, the carrier informed the management committee of its intention not to pursue the acquisition program, albeit while continuing the demonstration for one year with the 12 vehicles already in service.
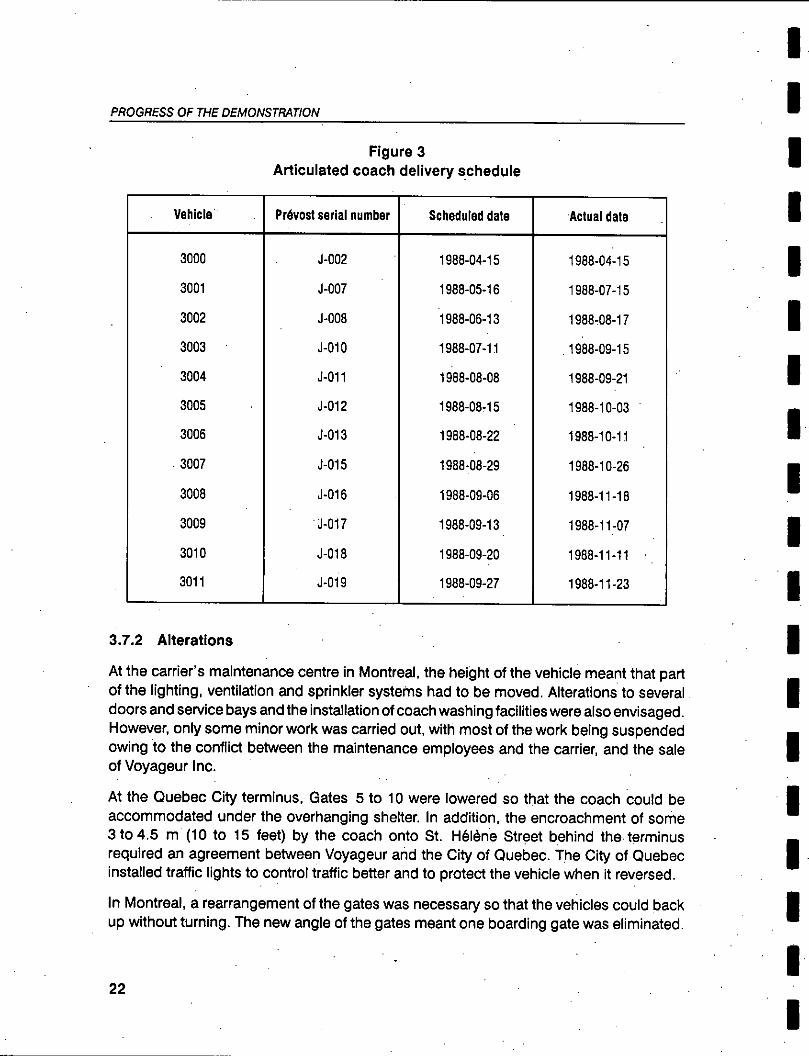
Figure 3 shows the scheduled and actual delivery dates for the 12 coaches.
3.7 Infrastructure and alterations
Voyageur facilities used for the period of the demonstration were the Montreal, Longueuil, St. Foy and Quebec City terminuses and the Voyageur Maintenance Centre in Montreal. Following the sale of Voyageurs assets, the Autocar de l'Estrie garage and the Aérocar, Clarke Transport, Airlie, Maska and FDS garages were also used. Given the size of the articulated coach, alterations to some of these facilities were necessary.
3.7.1 Impact of the articulated coach on infrastructure
The H5-60 articulated coach is 30 cm (12 inches) higher and 6 m (20 feet) longer than the longest and widest conventional coach for which facilities have been provided. The demonstration thus necessitated modifications to certain gates in the terminuses and cer-tain maintenance garages to permit operation and maintenance of the articulated coach.
20
PROGRESS OF THE DEMONSTRATION
Figure 2 Project flow chart
MANAGEMENT COMMITTEE
QUEBEC DEPARTMENT OF TRANSPORT RESEARCH /MANCH
TRANSPORT CANADA TRANSPORTATION DEVELOPMENT CENTRE
PROJECT MANAGEMENT
VOYAGEUR INC. / ORLÉANS EXPRESS / BBL INC.
ACQUISITION
MANUFACTURE Prévost Car
PARTS • Prévost Car
INFRASTRUCTURE
— TERMINUS Carrier
— GARAGE Carrier
ADVERTISING AND PROMOTION
DESIGN Kitching
IMPLEMENTATION B.D.D.S.
STUDIES AND EVALUATION
CLIENTELE STUDIES Sécor / Sorecom / Spectral
TECHNICAL ASSESSMENT Lavalin
ECONOMIC ANALYSIS Peat Marwick
TRAINING
— PROGRAM Prévost Car
INSTRUCTORS-DRIVERS Carrier
COMPUTER SYSTEMS
ANALYSIS AND COLLECTION Carrier
DEVELOPMENT Synchro
DEMONSTRATION
OPERATIONS Carrier
MAINTENANCE Carrier
INSTRUCTORS- 4— TRAINING MECHANICS Secoma Carrier '
21
PROGRESS OF THE DEMONSTRATION
Figure 3 Articulated coach delivery schedule
Vehicle Prévost serial !nimber Scheduled date Actuel date
3000 J-002 1988-04-15 1988-04-15
3001 J-007 1988-05-16 1988-07-15
3002 J-008 1988-06-13 1988-08-17
3003 J-010 1988-07-11 1988-09-15
3004 J-011 1988-08-08 1988-09-21
3005 J-012 1988-08-15 1988-10-03
3006 J-013 1988-08-22 1988-10-11
3007 J-015 1988-08-29 1988-10-26
3008 J-016 1988-09-06 1988-11-18
3009 J-017 1988-09-13 1988-11-07
3010 J-018 1988-09-20 1988-11-11
3011 J-019 1988-09-27 1988-11-23
3.7.2 Alterations
At the carrier's maintenance centre in Montreal, the height of the vehicle meant that part of the lighting, ventilation and sprinkler systems had to be moved. Alterations to several doors and service bays and the installation of coach washing facilities were also envisaged. However, only some minor work was carried out, with most of the work being suspended owing to the conflict between the maintenance employees and the carrier, and the sale of Voyageur Inc.
At the Quebec City terminus, Gates 5 to 10 were lowered so that the coach couic' be accommodated under the overhanging shelter. In addition, the encroachment of some 3 to 4.5 m (10 to 15 feet) by the coach onto St. Hélène Street behind the terminus required an agreement between Voyageur and the City of Quebec. The City of Quebec installed traffic lights to control traffic better and to protect the vehicle when it reversed.
In Montreal, a rearrangement of the gates was necessary so that the vehicles could back up without turning. The new angle of the gates meant one boarding gate was eliminated.
I.
22
PRO GRESS OF THE DEMONSTRATION
Following the sale of the network, including the Montreal-Quebec City route, to Orléans Express, the maintenance of the vehicles, including the articulated coach, was carried out in both Montreal and Quebec City at subcontractors' facilities, which were able ta accom-modate the articulated coaches without any major modifications.
3.8 Training of personnel
To ensure that the carriers personnel were fully proficient in driving and maintenance of the articulated coach, a training program was set up.
This program concerned drivers, foremen, and a number of mechanics working on a subcontract basis.
The training program was jointly designed with Prévost Car Inc. More than 200 drivers from Montreal, Quebec City and Jonquière, that is, the regular drivers and casual drivers posted to Rimouski and Chicoutimi, had to be trained. This three-day training focused on the layout of the vehicle, reversing manoeuvres, cornering, and autoroute driving. The drivers were trained in groups of four by Voyageur instructors who had previously received training at Prévost Car Inc.
The training of maintenance personnel was restricted to a small number of foremen and mechanics from Voyageur and the two subcontractors (Quebec City and Montreal), in light of the partial sale of the network. The four-day training focused on the presentation of the differences between the articulated coach and conventional coaches.
3.9 Computer systems
As part of the demonstration project, several studies were conducted in order to assess the cost and maintenance of the vehicles. To be able to collect ail the data effectively, Voyageur set up a data management system for vehicle maintenance. Programming was entrusted ta an outside firm, Synchro, which developed the software in a fourth-generation language for the HP 3000 mainframe computer already in place at Voyageur.
The computerized data management system was developed in several stages: design of the computer system on the basis of a functional analysis of the various procedures already in place, development and verification, documentation and installation of hardware, and finally Implementation of the system and procedures, in particular at the maintenance centre where the staff were trained accordingly.
The information and data related to work orders, outside service calls, tire changes and vehicle use were directly loaded into the computer system. Thus, it was possible to track the evolution of repairs carried out, parts replaced and costs.
23
PROGRESS OF THE DEMONSTRATION
Two modifications were made to the system during the demonstration. The first made it possible te identify the vehicles and the corresponding number of passengers for each trip between Montreal and Quebec City and hence also determine the number of double departures avoided through the use of an articulated coach with a larger number of seats.
Voyageur aise acquired software for transferring the results and reports from the HP 3000 computer system to Lotus PC software.
The greatest difficulty encountered in using the system concerned the tire cost monitoring subsystem, which was supposed to allow for tracking of tire rotation, each tire replacement, and wear and tear. It proved too complex to be implemented in a work environment such as the Voyageur Maintenance Centre where, especially during the strike, the personnel responsible for checking tire wear changed frequently.
3.10 Advertising, promotion and marketing
The two governments and Voyageur agreed that it was essentiel to make the articulated coach known te the target clientele, in particular business travellers. Market studies showed the importance of the business clientele for ail transportation modes between Montreal and Quebec City.
3.10.1 Advertising, promotion and marketing program
Following market analyses, an advertising concePt and messages were developed and air lime and advertising space reserved and, finally, an advertising and promotion campaign was planned, according te the schedule presented in Figure 4.
• The advertising program was developed by the Kitching agency, and the promotion was entrusted te the Begin, Dumas, Duprée Sormany public relations firm.
The official launch of the demonstration service was reported in a press release and a mailing te 11 000 people.
The advertising produced involved televised messages in French, advertisements in daily and specialty newspapers in English and French, and external billboards in French. The televised advertising campaign began on January 15, 1989. From late May 1989 to November 1989, 36 billboards were installed in the Quebec City and Montreal areas.
The coach was aise presented at the Quebec City Expo from August 25 to September 5, 1988, and at the small business show in Montreal on October 28,29 and 30, 1988, and was used in the filming of the "He Shoots, He Scores Ill" TV series.
24

PROGRESS OF THE DEMONSTRATION
Figure 4 Media calendar
Televlslon — 30 sec.
Montre
Quebec City
WrItten press
Les Affaires
EActualité
This Week in Business
10' x 20' bIllboards
Montreal
Quebec City
1988/1989 1989/1990
ONDJFMAMJJ A SONDJF
150 GRP
1 X a
150 GRP
GRP
100 GRP 100 GRP
25
1 X a
1 X a
25 GRP
GRP : GROSS RATING POINTS
A marketing plan was also prepared by the carriers marketing department. This plan was only partially applied, given the sale of Voyageur. Of ail the components of the plan, only three were applied: cellular telephone in some vehicIes, a pre-recorded message broadcast on board, and a no smoking policy on ail the buses. Finally, as a consequence of the sale of Voyageur, the budget set aside for advertising in the written press was not fully spent, since Voyageur was no longer interested in developing the service in the months leading up to the sale.
3.10.2 Results
Ail in all, the advertising, promotion and marketing campaign was successful. An omnibus survey conducted in 1989 by the Sorécom polling firm showed that this campaign reached
25
PROGRESS OF THE DEMONSTRATION
81% of the adult population of Quebec City and 66% of the adult population of the Island of Montreal. More specifically:
Six people out of ten (60%) said they were aware of or had heard of Voyageur's articu-lated coach, with men having heard of it more often (69%).
The articulated coach was better known to young people than to older respondents (70% of young people, as against 51% of respondents aged 55 and over, said they were aware the articulated coach existed).
Similarly, a larger number of respondents with 13 years or more of education than those with 12 years or under were aware of the existence of the articulated coach.
The articulated coach was best known in Quebec City (81%) and in the east of the Island of Montreal (66%); those having used a Voyageur bus on the Montreal-Quebec City route in the past year were more familiar (70%) with the articulated coach.
Professionals, technicians, administrators and managers (69%) and respondents with annual family incomes of more than $20 000 were also among those most familiar with the articulated coach.
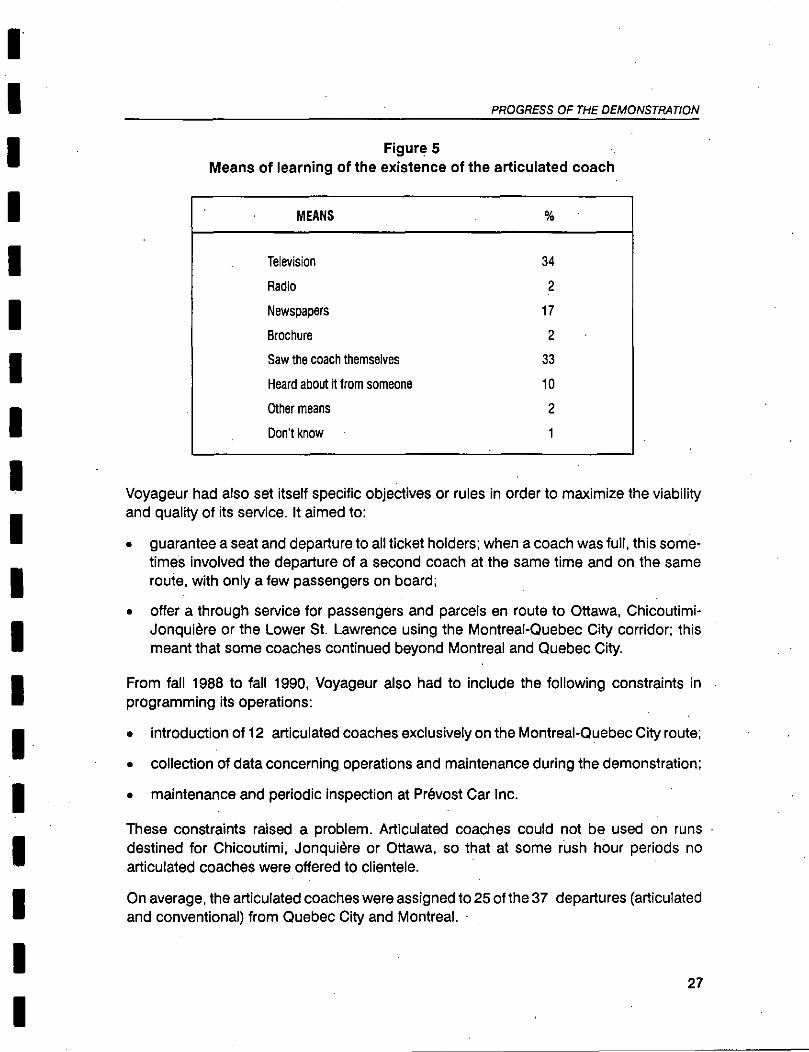
Among those who said they knew the articulated coach, the two most common means of hearing about its existence were television (34%) and having actually seen the articulated coach (33%) (See Figure 5).
Among francophones aged 25 to 34 and residents of Montreal's North Shore, a larger number of respondents learned of the articulated coach through television; the impor-tance of this means of communication declined as the level of education and family income increased.
It was more particularly non-francophones who learned of the articulated coach by seeing it on the road.
3.11 Programming of operations
As defined In the work program, the objective of programming the operations was to incorporate the demonstration project into the framework of the carrier's regular activities. This involved:
actual planning of operations (assignment and schedule of coaches and personnel, and maintenance management);
beginning service according te the established assignments and .schedules;
maintaining of the fleet in line with established assignments and schedules.
26
PROGRESS OF THE DEMONSTRATION
Figure 5 Means of learning of the existence of the articulated coach
MEANS
Television 34
Radio 2
Newspapers 17
Brochure 2
Saw the coach themselves 33
Heard about it from someone 10
Other means 2
Dont know 1
Voyageur had also set itself specific objectives or rules in order to maximize the viability and quality of its service. It aimed to:
guarantee a seat and departure to ail ticket holders; when a coach was full, this some-times involved the departure of a second coach at the same time and on the same route, with only a few passengers on board;
offer a through service for passengers and parcels en route to Ottawa, Chicoutimi-Jonquière or the Lower St. Lawrence using the Montreal-Quebec City corridor; this meant that some coaches continued beyond Montreal and Quebec City.
From fall 1988 to fall 1990, Voyageur also had to include the following constraints in programming its operations:
introduction of 12 articulated coaches exclusively on the Montreal-Quebec City route;
collection of data concerning operations and maintenance during the demonstration;
maintenance and periodic inspection at Prévost Car Inc.
These constraints raised a problem. Articulated coaches could net be used on runs destined for Chicoutimi, Jonquière or Ottawa, so that at some rush heur periods no articulated coaches were offered to clientele.
On average, the articulated coaches were assigned te 25 of the 37 departures (articulated and conventional) from Quebec City and Montreal.
27

PROGRESS OF THE DEMONSTRATION
3.12 Use of vehicles
The compilation of data on the demonstration service took place from November 27, 1988, to October 27, 1990. During this time, the 12 articulated coaches:
logged approximately 4.4 million km, an average of 366 000 km per vehicle;
travelled the Montreal-Quebec City route 15 479 times, an average of 525 km per day per vehicle.
The additional capacity of five seats in the articulated coaches meant as many as 97 trips per month were saved, for 1 657 trips in ail, 4% of the total for the period from December 1988 to October 1990. Figure 6 presents the number of trips saved per month.
None of the trips was extended through to Chicoutimi-Jonquière or Baie Comeau.
During this same period, the conventional coaches in the contrai group:
logged a total of 10.4 million km between Montreal and Quebec City, an average of 376 000 km per vehicle;
travelled the Montreal-Quebec City route 25 703 times.
No major incident or highway accident affected the progress or result of the studies.
Figure 6 Number of trips saved by using articulated coaches
1988.1989 1990
December 44 —
January 60 71
February 75 61
Match 97 89
April 60 63
May 75 62
June 75 87
July 62 94
August 71 83
September 77 59
October 72 80
November 69 —
December 71 —
28
PROGRESS OF THE DEMONSTRATION
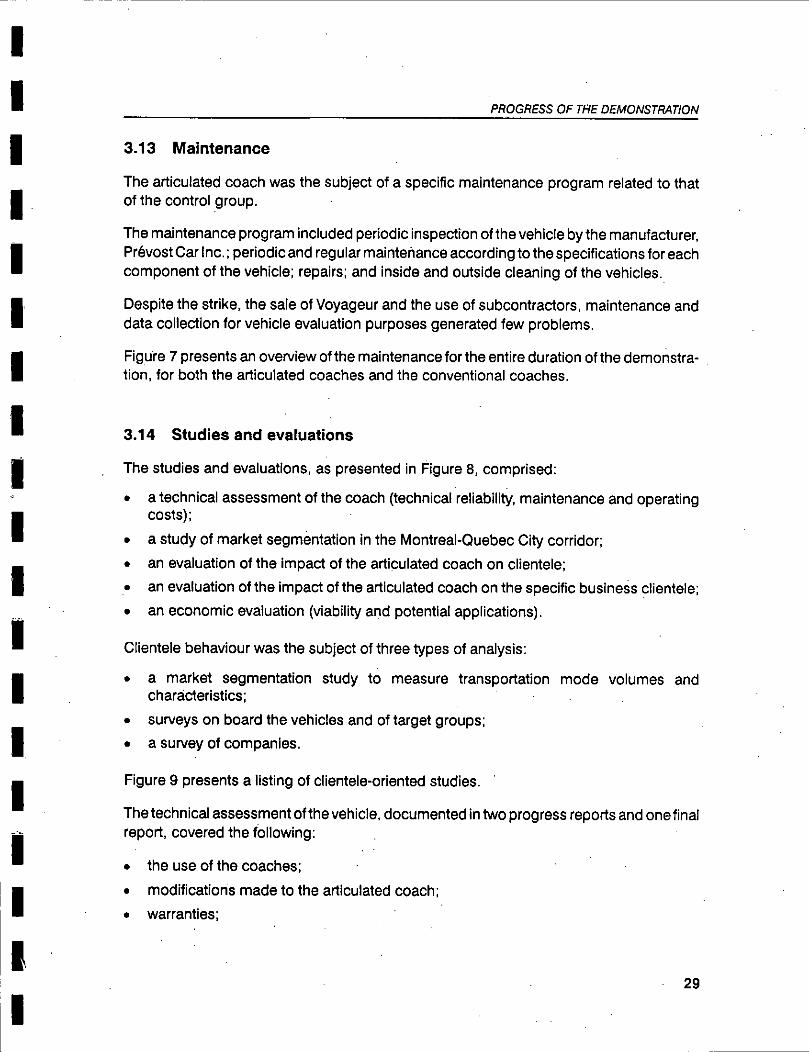
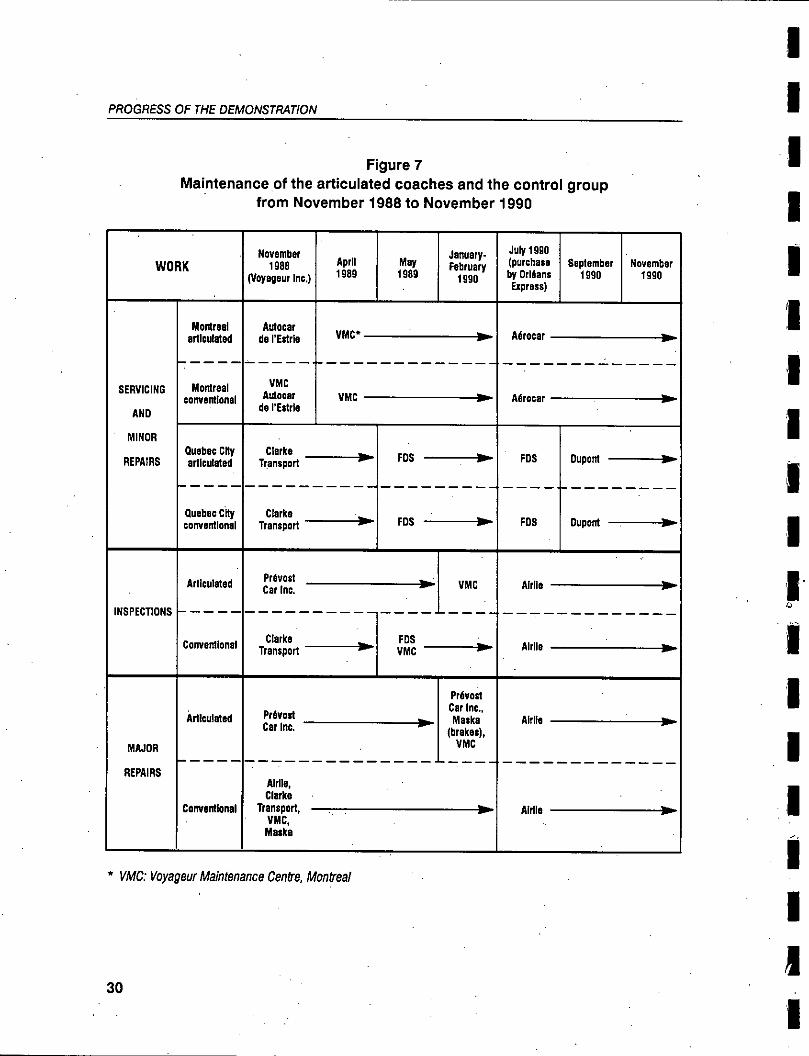
3.13 Maintenance
The articulated coach was the subject of a specific maintenance program related to that of the contrai group.
The maintenance program included periodic inspection of the vehicle bythe manufacturer, Prévost Car Inc.; periodic and reg ular maintenance according ta the specifications for each component of the vehicle; repairs; and Inside and outside cleaning of the vehicles.
Despite the strike, the sale of Voyageur and the use of subcontractors, maintenance and data collection for vehicle evaluation purposes generated few problems.
Figure 7 presents an overview of the maintenance for the entire duration of the demonstra-tion, for bath the articulated coaches and the conventional coaches.
3.14 Studies and evaluations
The studies and evaluations, as presented in Figure 8, comprised:
a technical assessment of the coach (technical reliability, maintenance and operating costs);
a study of market segmentation in the Montreal-Quebec City corridor;
an evaluation of the impact of the articulated coach on clientele;
an evaluation of the impact of the articulated coach on the specific business clientele;
an economic evaluation (viability and potential applications).
Clientele behaviour was the subject of three types of analysis:
a market segmentation study ta measure transportation mode volumes and characteristics;
surveys on board the vehicles and of target groups;
a survey of companies.
Figure 9 presents a listing of clientele-oriented studies.
The technical assessment of the vehicle, documented in two progress reports and one final report, covered the following:
the use of the coaches;
modifications made to the articulated coach;
warranties;
29
PROGRESS OF 771E DEMONSTF14TION
Figure 7 Maintenance of the articulated coaches and the control group
from November 1988 to November 1990
WORK November
1988 (Voyageur Inc.)
AprIl 1989
May 1989
January- February
1990
July 1990 (purchase by Orléans
Express)
September 1990
November 1990
SERVICING
AND
MINOR
REPAIRS
Montreal articulated
Mootreal conventIonal
Autocar de l'Estrie
VMC Autocar
de l'Estrle
VMC . Aérocar 1.- go.
VMC Aérocar ka-
Quebec City articulated
Guelma City conventIonal
Clarke FDS FOS
FOS
Transport
Clarke
Dupont
Transport FDS Dupont
INSPECTIONS
Articulated
Conventions'
Prévost nu Car Inc.
Clarke EDS
Alrlle »•••
Alrlle Transport VMC Ir
MAJOR
REPAIRS
ArlIculated
ConventIonal
Prévoit
Prévost Car Inc., Maska
(brakes), Alrlle
VMC
Car Inc.
Alrlle, Clarke
Transport,
—
Ils-
Ie. VMC,
Maska
Mlle ille.
* VMC: Voyageur Maintenance Centre, Montreal
II
30
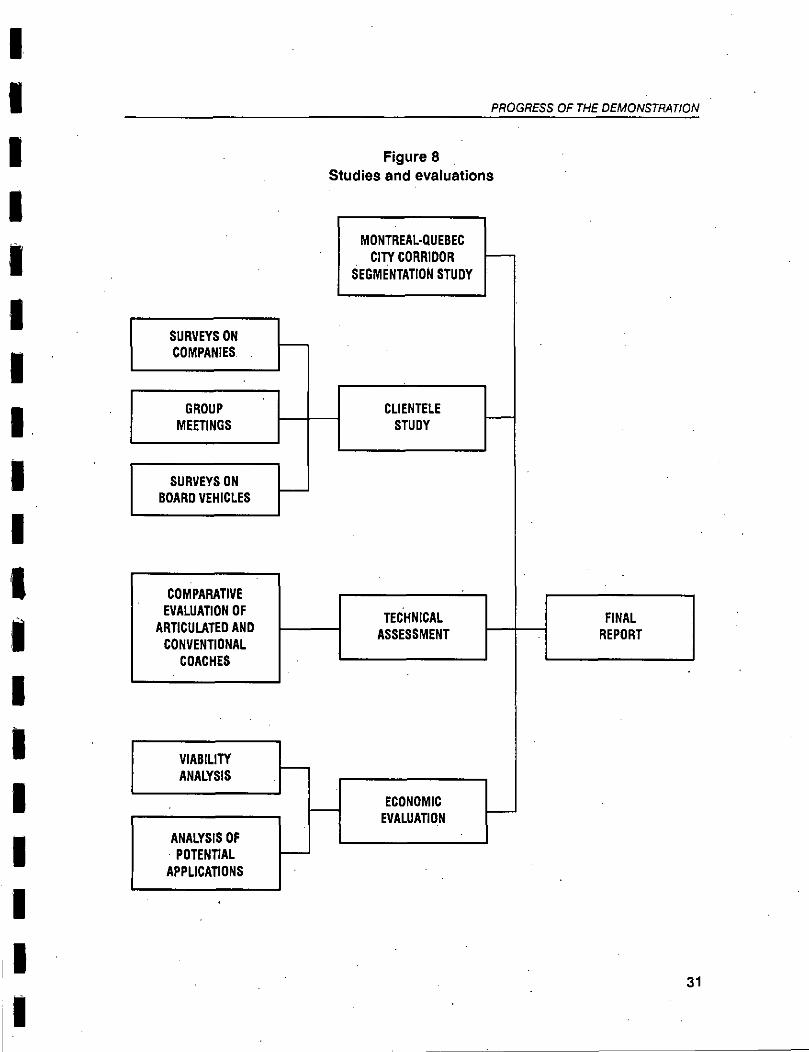
PROGRESS OF THE DEMONSTRATION
Figure 8 Studies and evaluations
MONTREAL-QUEBEC CITY CORRIDOR
SEGMENTATION STUDY
SURVEYS ON COMPANIES
GROUP MEETINGS
SURVEYS ON BOARD VEHICLES
CLIENTELE STUDY
COMPARATIVE EVALUATION OF
ARTICULATED AND CON VENTIONAL
COACHES
VIABILITY ANALYSIS
ANALYSIS OF POTENTIAL
APPLICATIONS
TECHNICAL ASSESSMENT
FINAL REPORT
ECONOMIC EVALUATION
31
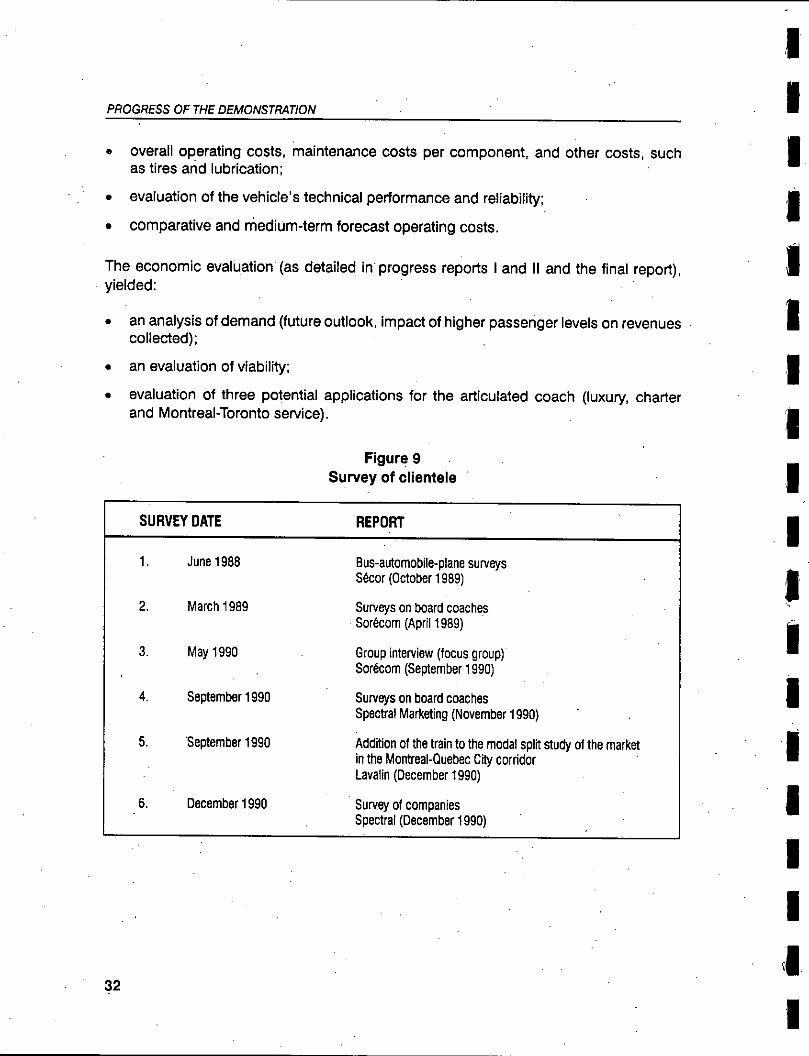
PROGRESS OF THE DEMONSTRATION
overall operating costs, maintenance costs per component, and other costs, such as tires and lubrication;
evaluation of the vehicle's technical performance and reliability;
comparative and rnedium-term forecast operating costs.
The economic evaluation (as detailed in progress reports l and Il and the final report), yielded:
an analysis of demand (future outlook, impact of higher passenger levels on revenues collected);
an evaluation of viability;
evaluation of three potential applications for the articulated coach (luxury, charter and Montreal-Toronto service).
Figure 9 Survey of clientele
SURVEY DATE REPORT
June 1988 Bus-automobile-plane surveys Sécor (October 1989)
March 1989 Surveys on board coaches Sorécom (Apri11989)
May 1990 Group interview (focus group) Sorécom (September 1990)
September 1990 Surveys on board coaches Spectral Marketing (November 1990)
September 1990 Addition of the train ta the modal split study of the market in the Montreal-Cluebec City corridor Lavalin (December 1990)
December 1990 Survey of companies Spectral (December 1990)
92

4. TECHNICAL ASSESSMENT
In order to identify the advantages and disadvantages of the articulated coach with respect to its operation and maintenance, a technical assessment was carried out and documented in two progress reports (June and November 1989) and a final report (February 1991) by Lavalin Inc.
4.1 Objectives
The technical assessment of the articulated coach, of which the February 1991 final report was the final stage, targeted four objectives:
to assess the technical reliability of the H5-60 articulated coach, in particular the innovative aspects of that coach;
te demonstrate the feasibility of using the H5-60 articulated coach in commercial service on a regular route;
to evaluate the implications for maintenance and operations of the introduction of articulated coaches;
te find out the reaction of employees called upon te use the articulated coaches or te carry out work on them, and to measure changes in these employees' attitudes.
1 4.2 Methodology
The methodology used for the technical assessment of the articulated coaches involved:
two surveys of drivers in order to find out their opinions. The first was conducted
I some 6 months atter the introduction of the articulated coach, and the second some 12 months later. Both used a specially designed questionnaire. The surveys were carried out on a basis of comparison with the control group;
I • surveys of and interviews with maintenance staff in order te find out their opinions concerning the layout, accessibility, required maintenance and design of the articu-
1 lated coach. A questionnaire was developed and the surveys were conducted some 6 and 18 months atter the introduction of the articulated coach. These surveys were also conducted on a basis of comparison between the two groups of coaches;
Il . an analysis of maintenance costs (labour and parts), fuel and lubrication costs and servicing costs (washing, cleaning, additional fuel and other liquids), using data from
I the automated cost gathering system developed to track the direct costs associated with the use and maintenance of the two groups of coaches;
33
TECHNICAL ASSESSMENT
• an analysis of the other documents relative to the articulated coaches: maintenance procedure, specifications, communications with the manufacturer, etc.
4.3 Results
Maintenance cost (labour and parts) of the articulated coach was equivalent to that of the conventional coach. However, overall operating cost (maintenance, fuel, lubrication and servicing) per 1 000 km was approximately 22% higher than for the conventional coach.
The analyses and observations were carried out using data on the same basis of com-parison (equivalent hourly rate for labour). But they made no allowance for the difference in average kilometres travelled by the two groups of coaches (366 000 km for the articulated coach and 677 000 km for the conventional coach).
The main elements accounting for this higher cost are cost of fuel, cost of tires and cost of servicing.
The cost of fuel per 1 000 km is approximately 55% higher for the articulated coach, which is heavier than the conventional coach. The cost of tires is approximately 72% higher, partly because of the larger number of tires (10, compared to 6 for the conventional coach), and partly because summer tires and winter tires must be used on the drive wheels, which is net the case on the conventional coach. The cost of servicing is approximately 45% higher, owing to vehicle size and more frequent cleaning.
Medium-term operating costs are estimated on the basis of an evaluation of the work that will have to be carried out when the articulated coach has logged as many kilometres as the conventional coach. According to this estimate, the operating cost per 1 000 km for the articulated coach should be 35% higher than for the conventional coach. This percentage was estimated on the basis of the costs of the conventional coach, which logged an average of 675 000 km, and on the basis of work which will be required beyond that distance. This cost could rise when major body work is required on both groups of coaches.
The articulated coach was also evaluated by various Voyageur employees. ln terms of road handling, the articulated coach was considered satisfactory by drivers. The initial problems of stability with the rear section of the coach were resolved, and the coach now handles adequately on the road. The transportation department appreciates the concept and design of the articulated coach. The durability of many of the articulated coach's non-essential accessories is questioned. The maintenance department considers that the articulated coach requires more maintenance than the conventional coach.
34
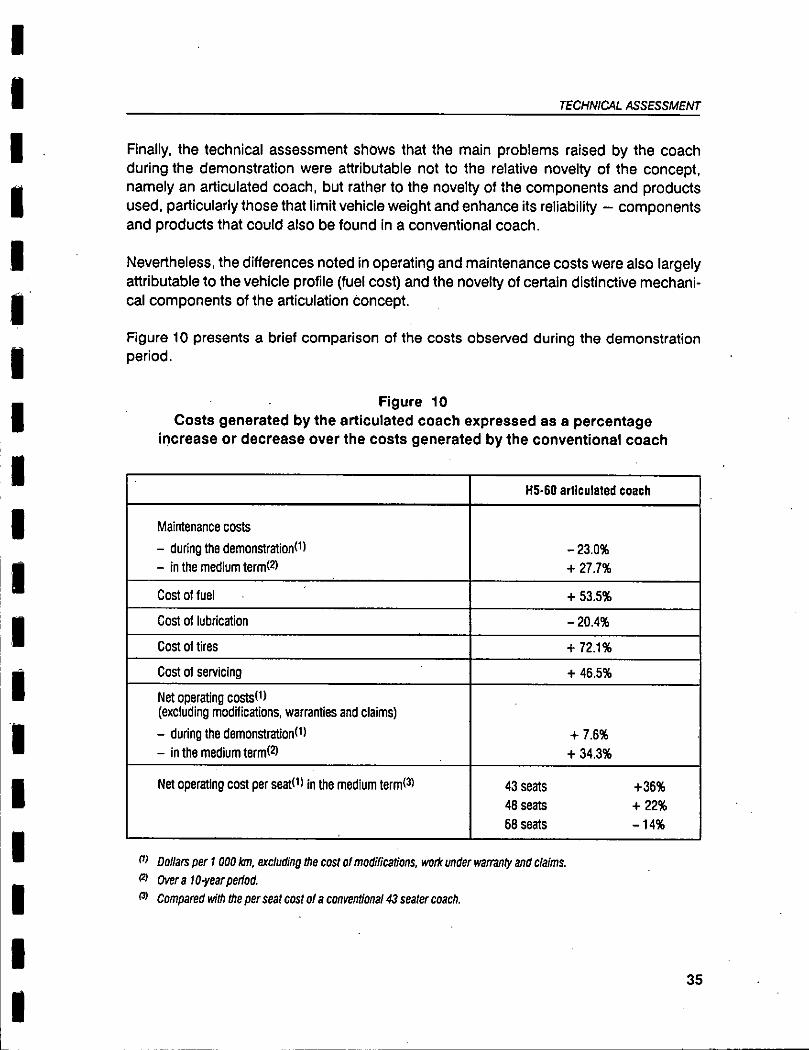
TECHNICAL ASSESSMENT
Finally, the technical assessment shows that the main problems raised by the coach during the demonstration were attributable flot to the relative novelty of the concept, namely an articulated coach, but rather to the novelty of the components and products used, particularly those that limit vehicle weight and enhance its reliability — components and products that could also be found in a conventional coach.
Nevertheless, the differences noted in operating and maintenance costs were also largely attributable to the vehicle profile (fuel cost) and the novelty of certain distinctive mechani-cal components of the articulation concept.
Figure 10 presents a brief comparison of the costs observed during the demonstration period.
Figure 10 Costs generated by the articulated coach expressed as a percentage
increase or decrease over the costs generated by the conventional coach
115-60 articulated coach
Maintenance costs
— during the demonstration0) — in the medium terre
— 23.0% + 27.7%
Cost of fuel + 53.5%
Cost of lubrication — 20.4%
Cost of tires + 72.1%
Cost of servicing + 46.5%
Net operating coste) (excluding modifications, warranties and cbims)
— during Me demonstration( 1 ) — in the medium tern( 2)
+ 7.6% + 34.3%
Net operating cost per seat0) in the medium terne 43 seats 48 seats 68 seats
+36% + 22% —14%
(I) Dollars per 1 000Icm, excluding the cosi ol modifications, work under warranty and daims. Over a 10-year perfod. Compared with Me per seat cost of a conventions! 43 seater coach.
35

TECHNICAL ASSESSMENT
4.4 Detailed results
The technical assessment presents a picture of the use of the coaches (Mirage and articulated) as well as of the technical reliability of the articulated coach from six distinct angles:
• drivers' perception;
• perception of maintenance personnel;
• modifications made to the articulated coach;
• comparative operating costs during the demonstration;
• technical performance (qualitative evaluation);
• comparative updates of estimated medium-term operating costs.
4.4.1 Use of the coaches
As of October 27, 1990, the articulated coaches logged a total of approximately 4.4 million km, an average of about 366 000 km each, or some 3 600 km per coach per week.
The conventional coaches logged approximately 10.4 million km du ring this period, an averageofsome376 000 km percoach, orabout3 750 km perweek percoach. Sincetheir introduction in service, the conventional coaches logged some 19.4 million km, an average of 677 000 km per coach.
Figure 11 shows the average weekly use of both types of coaches.
4.4.2 Drivers' perception
Two surveys were conducted to find out drivers' opinions and comments concerning the design, performance and handling of the articulated coach. The first was carried out in April 1989 and the second in June 1990. The idea behind conducting one survey at the beginning and one at the end of the demonstration was to evaluate changes in drivers' perceptions between the two surveys.
Ali in all, the drivers considered the articulated coach to be superior to the conventional coach, and this attitude, based on the opinion expressed for each component of the coach, was more pronounced in the second survey. A substantial increase was, however, observed in the r:iumber of respondents preferring to drive a conventional coach (11 % in April 1989 and 38% in June 1990).
36

TECHN/CAL ASSESSMENT
Figure 11 Average weekly distance travelled per coach
5 000
LJ CONVENTIONAL COACH
Ill ARTICULATED COACH - '.'.'.:'" -
~ 1
T [C'"
i: 1 ' 1 ; 1 - 7 ~ ,,. 1
!:
1
1 !• ) T "'" [". ~; G"' / f i :;.·'.
••• .. ••
,,. 1 -,___ ....
···. •:
.• ... ; '.· :: 1 ;.
4 000
3 000
1
; ... •
; k k 1:: : .. i ••••
. 1 :
•••• [< :
••••
•••
1: 1: .•. . ;
1 : 1 f ••• :. ••• ·• ;'.·
i>
···; .. ; :; t> 2 000
1 000
I•
••• •·•
;
1 ••• }
·:: ;
•••• •••
F ;
1~
••••
••••
; •:• :: .. ... :.
K •••
1::
1 •••• 1 ••:: 1 !•. '.;. 1 ;'.
T .·.;
) ; 1 ;'.
1 ••
..... ; 1 •.• ·.•· ~; 1 ..•. ·::
;
•••
1 :•:
;; 1: ;· ;;
i .·;
.. ;'.; ;. ..
••• •• •• . ... ; ;;
0 D J F M A M J J A S 0 N D J F M A M J J A S 0
1989 1990
4.4.3 Perception of maintenance personnel
Two surveys of maintenance staff were conducted to gather their opinions and comments concerning the maintenance of the articulated coach. The first was carried out in April 1989 and the second in June 1990.
Ali in all, the maintenance personnel as a whole considered the articulated coach to be superior in terms of concept and design to the conventional coach. The concept of the articulated coach, its mechanical reliability and its appearance give it an image of high quality. But several elements were considered more fragile and of lesser quality.
Between the surveys of April 1989 and June 1990, the articulated coach suffered a considerable decline in popularity. As the articulated coaches accumulated kilometres, a number of problems arase and opinion on the durability of wheels and tires went from one extreme to another. The poor performance of the ri ms had not been se en at the time of the April 1989 survey.
After the Montreal-Quebec City service was taken ov~r by the present operator, consultations were carried out with the new maintenance personnel. Since maintenance is now carried out at suppliers' premises, and the articulated coach has logged more than 366 000 km, the maintenance personnel expressed a more favourable opinion toward the
37
TECHNICAL ASSESSMENT
articulated coach. This is largely attributable ta the long life of the braking system (over-haul at 240 000 km, compared with 120 000 km for the conventional coach) and the performance of the engine and suspension.
4.4.4 Modifications made to the articulated coach
The articulated coach required modifications in the design and conception of its compo-nents during the demonstration. Figure 12 lists these modifications. For modifications associated with defects and covered by warranty, refer to Paragraph 4.4.5.
Almost ail (more than 95%) of the modifications were carried out by the coach manu-facturer, who assumed the cost. Furthermore, Prévost Car worked constantly to solve numerous problems and modify certain components. Integrating these modifications in a new production series should not entail a significant increase in the purchase cost of the articulated coach, since several of them are minor.
As may be seen from Figure 13, more than half of the modifications involved the body. This is understandable, since the body is a new concept and several of its components are also unique to the articulated coach (mirrors, upper windshield wipers, door concept, under-floor bag gage compartment door concept, etc.). The cost of the modifications made to the body for the analysis period totalled some $66 600 for the 12 articulated coaches.
The articulated system underwent modifications costing approximately $25 200. Essen-tially, these involved the articulation brake, which was modified in order ta give the coach greater stability at high speed.
The engine underwent modifications costing a total of some $17 700. These changes did not apply to all 12 articulated coaches.
The heating and air-conditioning system also underwent major modifications. These modi-fications cost approximately $13 000, more than 80% of this involving changes to vents (installation of the two-speed blower).
Other modifications to the coach were minimal in terms of cost.
The modifications carried out by the Manufacturer totalled approximately $147 000 (some $12 250 per coach), including about $123 000 for the body, articulation, engine and heating and air-conditioning system, or more than 83% of the cost.
Generally speaking, the major modifications to the articulated coach allowed for problems to be eliminated and represent a normal running-in situation for a new product.
38

TECHNICAL ASSESSMENT
Figure 12 Modifications made to the articulated coaches
GROUP SUBGROUP MODIFICATION
Steering axles Various
Body (interlor) Seats and tables Reinforce seat ami Place a guard behind seats 46 & 47 Move seat and card table
Sun vlsor Replace left sun viser Interlor subtotal
Body (outside) Roof structure Reseal roof and roof emergency exit Forward door Instar' safety device (speed switch) on forward door
Install protection for forward door ami Modify forward door pantograph luta° gutter over door Modify forward door and adjust preload
Rear door Install switch for rear door Mirrors Install new mirror mounting Underfloor baggage compartments • Check welding joints In compartments
Check leaks in compartments Check adjustment of compartment doors
Service doors Modtfy resistance of small doors Windows Drill drain for windows
Modify locking system for opening windows Check and adjust window opening Check window opening pressure ' Install window bars
WIndshield wiper Install stop for upper wIndshield wlper Mocitly windshield de•lcing spray
Varlous Install vehicle height decals Check quality of casting 'Wall book for drivers coat Install "baggage compartment hot" decals Lower drivers guard (plates) Install additional handrall in rear Umtali guard on modeste panel Relnforce rear door Check leaks In electrical compartments Check electrlc locks Replace breaker symbols Weld reinforcements Install welding reinforcements Remove reflective strlps Seal rear lights Check condenser door Install stop on inside reading lights (4)
(beide subtotal Body subtotal
39
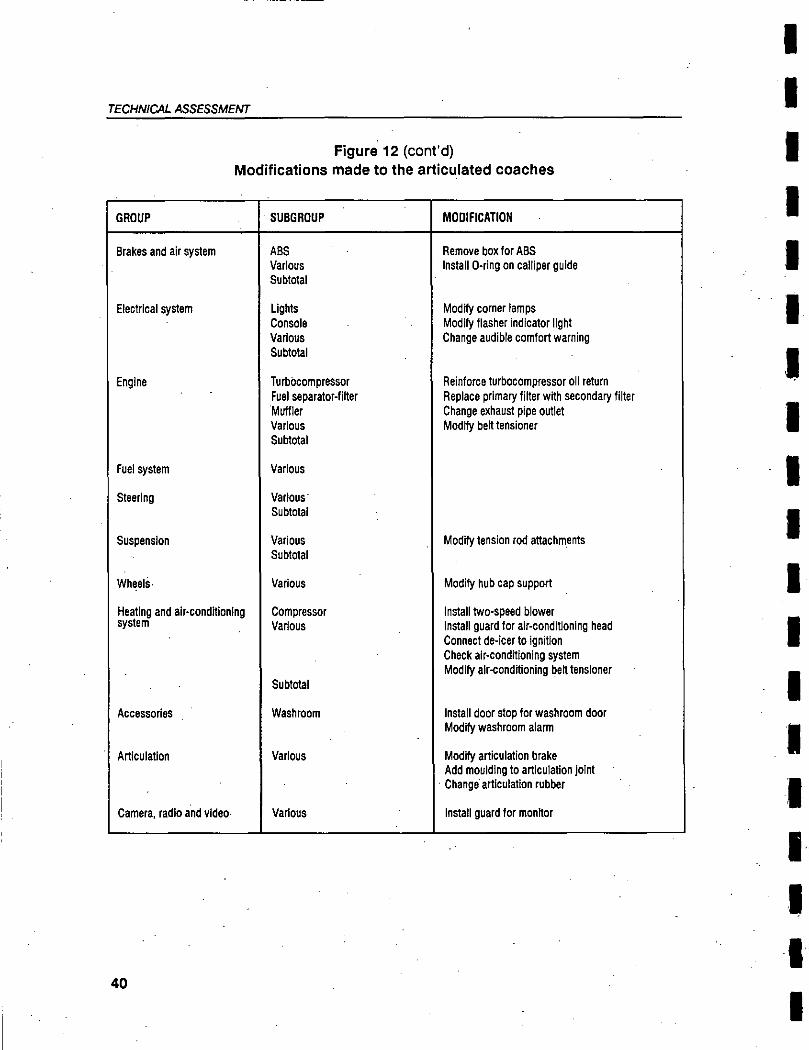
TECHNICAL ASSESSMENT
Figure 12 (cont'd) Modifications made to the articulated coaches
GROUP SUBGROUP MODIFICATION
Brakes and air system ABS Remove box for ABS Varlous Install 0-ring on calliper guide Subtotal
Electrical system Lights Modify corner lamps Console Modify flasher indicator light Varlous Change audible comfort warning Subtotal
Engine Turbbcompressor Reinforce turbocompressor oll return Fuel separator-filter Replace primary tiller with secondary lifter Muflier Change exhaust pipe outlet Various Modify bert tensioner Subtotal
Fuel system Varlous
Steering Varlous - Subtotal
Suspension Various Modify tension rod attachmeMs Subtotal
Wheels • Various Modify hub cap support
Heating and air-conditIonIng Compressor Install two-speed blower system Various Install guard for air-conditionIng head
Connect de-icer to ignition Check air-conditioning system Modify air-conditioning ben tensioner
• Subtotal
Accessories Washroom luta door stop for washroom door Modify washroom alarm
Articulation Varlous Modify articulation brake Add moulding to articulation joint Change articulation rubber
Camera, radio and vide° Varlous Install guard for monitor
•
40
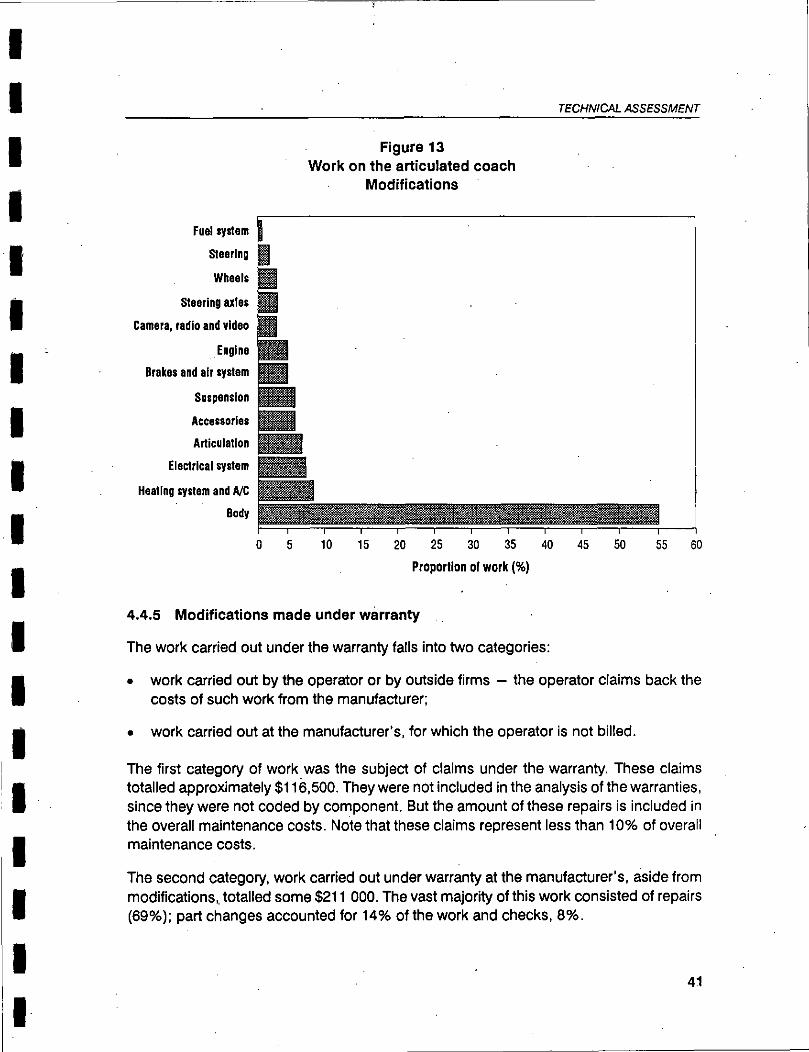
TECHNICAL ASSESSMENT
Figure 13 Work on the articulated coach
Modifications
Fuel system
Steering
Wheels
Steering alles
Camera, radio and vIdeo
Engins
Brakes and air system
Suspension
Accessorles
Articulation
Electrical system
Heating system and NC
Body
0 5 10 15 20 25 30 35 40
45
50
55 60
Proportion of work (%)
4.4.5 Modifications made under warranty
The work carried out under the warranty falls into two categories:
work carried out by the operator or by outside firms — the operator daims back the costs of such work from the manufacturer;
work carried out at the manufacturer's, for which the operator is not billed.
The first category of work was the subject of daims under the warranty. These claims totalled approximately $116,500. They were flot included in the analysis of the warranties, since they were flot coded by component. But the amount of these repairs is included in the overall maintenance costs. Note that these daims represent less than 10% of overall maintenance costs.
The second category, work carried out under warranty at the manufacturer's, aside from modifications,, totalled some $211 000. The vast majority of this work consisted of repairs (69%); part changes accounted for 14% of the work and checks, 8%.
41
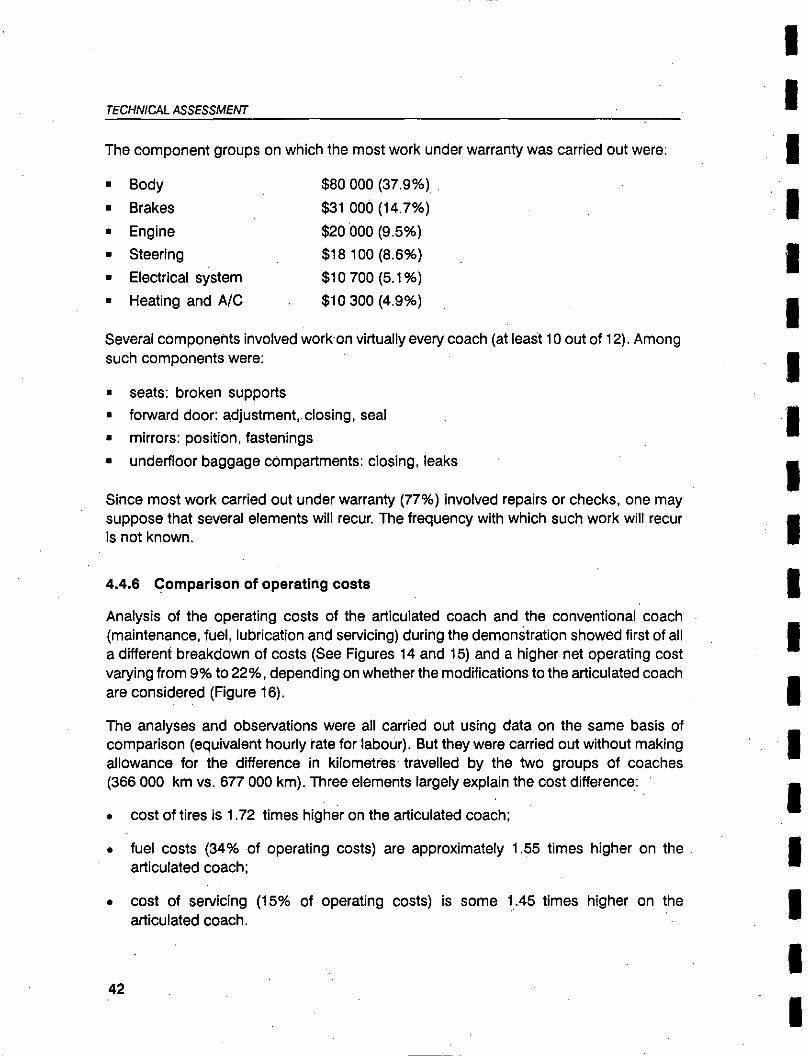
TECHNICAL ASSESSMENT
The component groups on which the most work under warranty was carried out were:
• Body $80 000 (37.9%)
• Brakes $31 000 (14.7%)
• Engine $20000 (9.5%)
• Steering $18 100 (8.6%)
• Electrical system $10 700(5.1%)
• Heating and A/C $10 300 (4.9%)
Several components involved work on virtually every coach (at least 10 out of 12). Among such components were:
seats: broken supports
forward door: adjustment, closing, seal
mirrors: position, fastenings
underfloor baggage compartments: closing, leaks
Since most work carried out under warranty (77%) involved repairs or checks, one may suppose that several elements will recur. The frequency with which such work will recur is not known.
4.4.6 Comparison of operating costs
Analysis of the operating costs of the articulated coach and the conventional coach (maintenance, fuel, lubrication and servicing) during the demonstration showed first of ail a different breakdown of costs (See Figures 14 and 15) and a higher net operating cost varying from 9% to 22%, depending on whether the modifications to the articulated coach are considered (Figure 16).
The analyses and observations were ail carried out using data on the same basis of comparison (equivalent hourly rate for labour). But they were carried out without making allowance for the difference in kilometres travelled by the two groups of coaches (366 000 km vs. 677 000 km). Three elements largely explain the cost difference:
cost of tires is 1.72 times higher on the articulated coach;
fuel costs (34% of operating costs) are approximately 1.55 times higher on the articulated coach;
cost of servicing (15% of operating costs) is some 1•45 times higher on the articulated coach.
42
Lubrication 0.76%
Lubrication 0.41%
TECHNICAL ASSESSMENT
Figure 14 Breakdown of operating costs
Conventional coach (30 coaches)
Figure 15 Breakdown•of operating costs
Articulated coach (12 coaches)
43
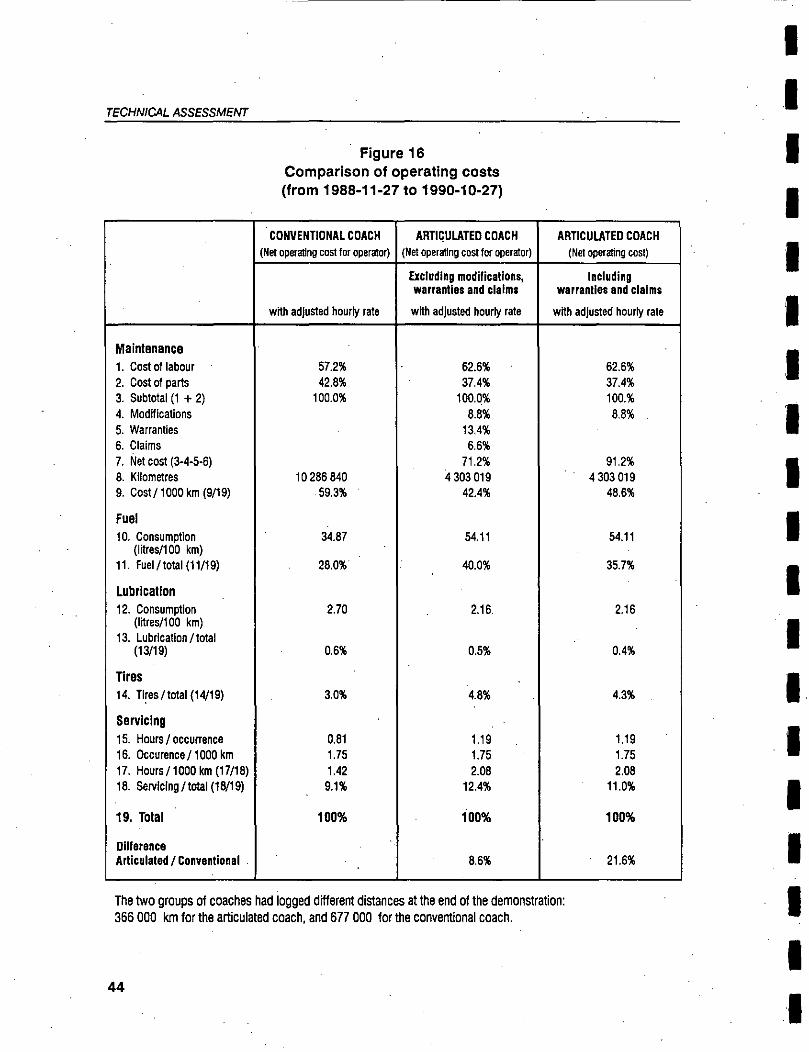
TECHNICAL ASSESSMENT
Figure 16 Comparison of operating costs (from 1988-11-27 to 1990-10-27)
. CONVENTIONAL COACH (Net operating cost for operator)
ARTICULATED COACH (Net operating cost for operator)
ARTICULATED COACH (Net operating cost)
with adjusted hourly rate
Excluding modifications, warranties and daims
with adjusted hourly rate
Including warrantles and daims
with adjusted hourly rate
Maintenance Cost of labour 57.2% 62.6% 62.6% Cost of parts 42.8% 37.4% 37.4% Subtotal (1 + 2) 100.0% 100.0% 100.% Modifications 8.8% 8.8% Warranties 13.4% Claims 6.6% Net cost (3-4-5-6) 71.2% 91.2% Kilometres 10 286 840 4 303 019 . 4 303 019 Cost/ 1000 km (9/19) 59.3% 42.4% 48.6%
Fuel . Consomption (litres/100 km)
34.87 54.11 54.11
Fuel/total (11/19) 28.0% 40.0% 35.7%
Lubrication Consumption (litres/100 km)
2.70 2.16 2.16
Lubrication / total (13/19) 0.6% 0.5% 0.4%
Tires Tires /total (14/19) 3.0% 4.8% 4.3%
ServIcing Hours / occurrence 0.81 1.19 1.19 Occurence / 1000 km 1.75 1.75 1.75 Hours / 1000 km (17/18) 1.42 2.08 2.08 SerylcIng /total (18/19) 9.1% 12.4% 11.0%
Total 100% 100% 100%
Dilf orante Articulated / Conventional 8.6% 21.6%
The two groups of coaches had logged efferent distances at the end of the demonstration: 366 000 km for the articulated coach, and 677 000 for the conventional coach.
1 1
44
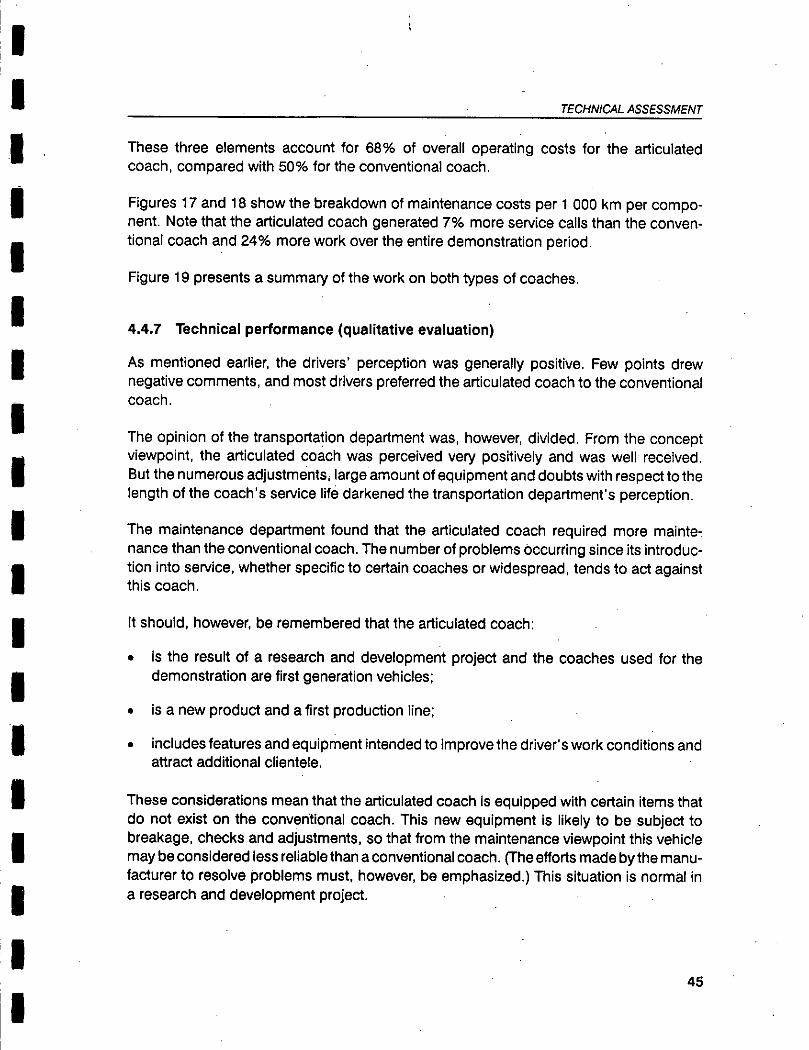
TECHNICAL ASSESSMENT
These three elements account for 68% of overall operating costs for the articulated coach, compared with 50% for the conventional coach.
Figures 17 and 18 show the breakdown of maintenance costs per 1 000 km per compo-nent. Note that the articulated coach generated 7% more service calls than the conven-tional coach and 24% more work over the entire demonstration period.
Figure 19 presents a summary of the work on both types of coaches.
4.4.7 Technical performance (qualitative evaluation)
As mentioned earlier, the drivers' perception was generally positive. Few points drew negative comments, and most drivers preferred the articulated coach to the conventional coach.
The opinion of the transportation department was, however, divided. From the concept viewpoint, the articulated coach was perceived very positively and was well received. But the numerous adjustments, large amount of equipment and doubts with respect te the length of the coach's service life darkened the transportation department's perception.
The maintenance department found that the articulated coach required more mainte-nance than the conventional coach. The number of problems occurring since its introduc-tion into service, whether specific to certain coaches or widespread, tends to act against this coach.
lt should, however, be remembered that the articulated coach:
is the result of a research and development project and the coaches used for the demonstration are first generation vehicles;
is a new product and a first production line;
includes features and equipment intended to improve the driver's work conditions and attract additional clientele.
These considerations mean that the articulated coach is equipped with certain items that do flot exist on the conventional coach. This new equipment is likely te be subject to breakage, checks and adjustments, so that from the maintenance viewpoint this vehicle may be considered less reliable than a conventional coach. (The efforts made by the manu-facturer te resolve problems must, however, be emphasized.) This situation is normal in a research and development project.
45

TECHNICAL ASSESSMEIVT
Figure 17 Maintenance cost /1000 km — Conventional coach
Steering axis* Drive shatt
Fuel system Camera, radio and video
Lubdcation Miscellaneous
Accessorles Cooling system OrNe/leg skies
Transmission Steering
Clutch MechanIcal inspection and washing
Banting system and NC Wheeis
Suspension Marnai system
Body Brakes and air system
Engins
0 5 10 15 20 25 30 35
Proportion of costs (%)
Figure 18 Maintenance cost / 1000 km — Articulated coach
Steering ale
Drive shed Articulation Fuel system
MIscellaneous Accessories
LubrIcatlan Camera, radio and vida
DrWe/hearing ale Transmission
Suspension Canna system
Meeting Mahonia' inspection and washing
Wheels Engine
Binding system and Ait Electrical system
Brakes and air system Body
0 5 10 15 20 25 30 35
Proportion of costs (%)
46
-------------------
NUMBEA Of COACHES
KILOMETRES TRAVELLED
NUMBEA Of WEEKS
NO. OF SERVICE WITHDAAWALS (2)
NO. OF OPERATIONS
NO.Of HOUAS' LABOUR
WEEKLY KILOMETRES/COACH
ND. Of WITHDRAWALSw'COACWWEEK
NO. OF OPEAATIONSw'SEAVICE WITHDAAWAL
NO. Of WITHDAAWALSw'1000 km
NO. Of HOUAS: LABOUFVSEAVICE WITHDAAWAL
COST/SEAVICE WITHDRAWAL
CONVENTIONAL COACH·
(1)
30 20
Figure 19 Summary of work
CONVENTIONAL ARTICULATED COACH COACH
SUBTOTAL lncludlng modillcatlons,
warrantles and clalms
12
8 546 050 1740890 10 286 940 4 303 019
75 25 100 100
6 766 1765 8531 4387
22334 5678 28012 12848
36115 9183 45298 22482
3 798 3482 3 741 3586
3007 3530 3102 3656
3301 3217 3284 2929
0792 1 014 0829 1 020
5338 5203 5 310 5125
(1 J The number of conventiona/ vehides !rom May 1990 ta lhe end of lhe trial period is 20.
(2) The number of setVice withdrawals is based on the number of service ca!Js or the number of work orders issued.
ARTICULATED RATIO RATIO COACH ARTICJCONV. ARTICJCONV.
. Excludlng lncludlng Excludlng mocfdlcatlons, modifications, modHicatJon1,
lncludlng warrantles lnclucfmg warrantles and and clabns warranties
clalms and claims
12
4 303 019
100 .
4368
12384
21 043
3586 0959 0959
3640 1179 1173
2835 0892 0863
1 015 1 229 1224
4818 0965 0907
0880 0806
TECHNICAL ASSESSMENT
The main innovative components of the articulated coach generated no reliability problems. They did, however, undergo certain modifications or adjustments attributable to their belonging to a first generation. Thus, for example, the tension of the articulation braking system was increased so as to reduce rear section sway.
4.4.8 Estimate of medium-term operating costs
In the medium term, the operating costs of the articulated coach are estimated at approxi-mately 35% more than for the conventional coach (see Figure 10). This variation may be associated with the fact that not only does the articulated coach have certain equip-ment that the conventional coach does flot (articulation, accessories, etc.) and a larger number of components for several major systems (brakes, suspension, heating and air-conditioning system, tires, body, wheels, etc.), it also has certain equipment requiring more frequent adjustment (forward door, service doors, baggage compartment doors, etc.).
48
5. MODAL SPLIT AND SEGMENTATION OF CLIENTELE IN THE MONTREAL-OUEBEC CITY CORRIDOR
The study of modal split in the Montreal-Quebec City corridor was initially scheduled in two stages: one study at the start of the demonstration, and another at the end.
The first study, conducted by Sécor Inc. during the first year of the demonstration in June 1988, was intended to "take a picture" of the passenger transportation market between Montreal and Quebec City prior to the introduction of the articulated coach (quantification and explanation).
The second study scheduled in the work program was intended te assess the impact of the introduction of the articulated coach on the modal split in the corridor. Following the initial results of the demonstration, however, it did net prove necessary to carry out a second modal split study.
The increase in passenger levels observed between the beginning and end of the demon-station was 4.7% in 1989 and 1.49% in 1990. Such increases were ncit sufficient to Identity a possible transfer of clientele from one transportation mode te another, given the margin error for the initial modal split . study (a mail-in questionnaire).
5.1 Objectives
As mentioned above, the market segmentation and modal split in the Montreal-Quebec City corridor was subject to only one study, at the start of the demonstration. This initial study had two complementary objectives:
a quantitative description of the modal split;
an explanation of this split.
The first objective was to "take a picture" of the passenger transportation market between Montreal and Quebec City. It covered the following in considerable detail:
quantification of the clientele of each mode of transport;
the socio-demographic profile of each clientele;
habits and background to choices of transportation mode;
frequency of this travel;
reasons for travel between Montreal and Quebec City;
perceptions concerning transportation costs.
49
MODAL SPLIT AND SEGMENTATION OF CLIENTELE IN THE MONTREAL-OLIEBEC CITY CORRIDOR
Complementing this descriptive view of the market, the following elements of the study aimed to provide an explanation of behaviour:
to evaluate the relative importance of selection criteria for the clientele of each transportation mode;
to evaluate each transportation mode according te these criteria;
to identify the structure or structures of modal positioning underlying these evaluations;
to identify the criteria actually used to differentiate between transportation modes;
to bring to light the discriminant criteria distinguishing transportation modes from their competition;
to measure preferences with respect to transportation modes;
te shape the market segments inherent in the different transportation modes in socio-demographic terms and with respect to the benefits sought;
to produce perceptual maps of the competitive structure of the market.
5.2 Methodology
From June 10- 21, 1989, 12 525 vehicles were stopped on Autoroutes 20 and 40 and their drivers handed a questionnaire to be returned by mail. During the same period, the questionnaires were aise distributed to air and intercity bus passengers; questionnaires were handed te each traveller on boarding selected departures, and collected upon arrivai.
Given the scope of the study and the constraints associated with each mode, a multi-purpose, self-administered questionnaire was used.
The classification procedure began with the identification of a valid sampling of drivers' questionnaires, that is, those meeting the criteria for inclusion with respect te origin and destination, and with respect to completion of the questionnaire — i.e., not more than 10 unanswered questions.
ln ail, 3 695 questionnaires meeting the criteria for inclusion in the sarnpling were kept and compiled for the analysis.
Data from an engin-destination study conducted in 1988 on board VIA trains between Montreal and Quebec City (Lavalin 1989) were incorporated in the findings of the survey.
For the airlines, this addition allowed the 1987 passenger data originally intended for use to be replaced by 1988 data compiled by Statistics Canada.
50
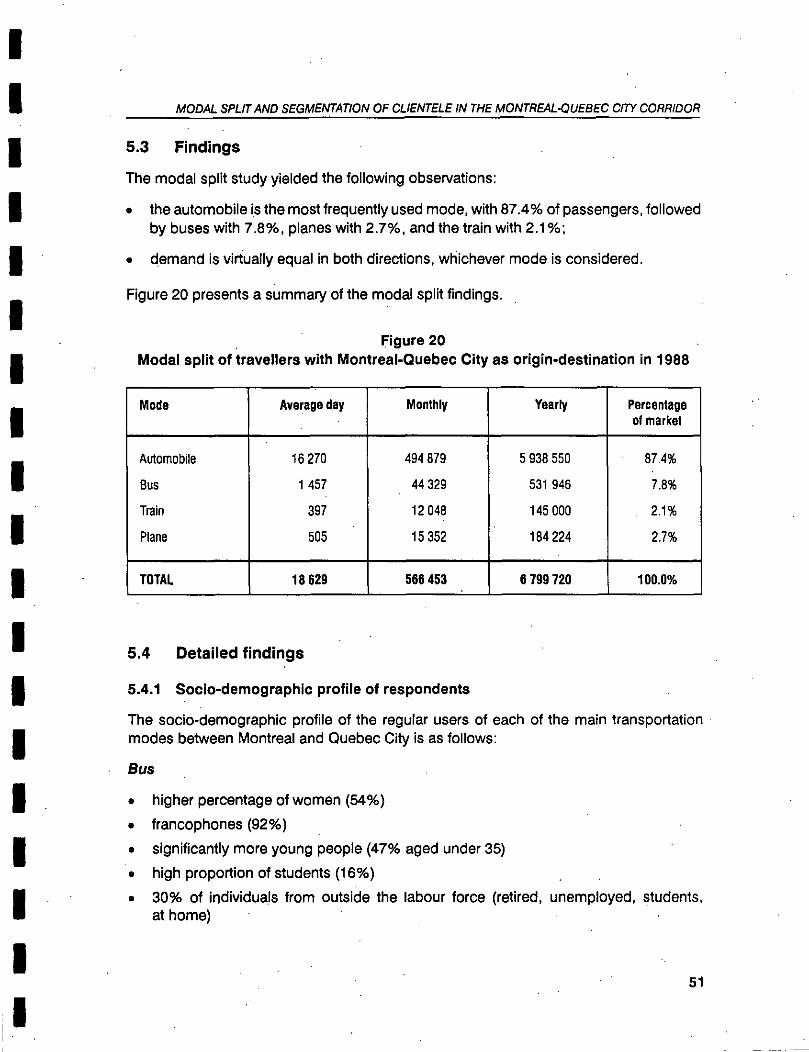
MODAL SPLIT AND SEGMENTATION OF CLIENTELE IN THE MONTREAL-OUEBEC CRY CORRIDOR
5.3 Findings
The modal split study yielded the following observations:
the automobile is the most frequently used mode, with 87.4% of passengers, followed by buses with 7.8%, planes with 2.7%, and the train with 2.1%;
demand is virtually equal in both directions, whichever mode is considered.
Figure 20 presents a summary of the modal split findings.
Figure 20 Modal split of travellers with Montreal-Quebec City as origin-destination in 1988
Mode Average dey Monthly Yearly Percentage of market
Automobile 16 270 494 879 5 938 550 87.4%
Bus 1 457 44 329 531 946 7.8%
Train 397 12 048 145 000 2.1%
Plane 505 15 352 184 224 2.7%
TOTAL 18629 566 453 6 799 720 100.0%
5.4 Detailed findings
5.4.1 Socio-demographic profile of respondents
The socio-demographic profile of the regular users of each of the main transportation modes between Montreal and Quebec City is as follows:
Bus
higher percentage of women (54%)
francophones (92%)
significantly more young people (47% aged under 35)
high proportion of students (16%)
30% of individuals from outside the labour force (retired, unemployed, students, at home)
51
MODAL SPLIT AND SEGMENTATION OF CLIENTELE IN THE MONTREAL-OUEBEC CITY CORRIDOR
75% have family income under $50 000, 46% under $30 000
35% have one or more children in their households
Plane 1
distinct but homogeneous clientele
high concentration of rien (73%)
non-francophones more common (26%)
aged over 45 (41%)
higher education (university studies: 72%)
high family income (more than $50 000: 66%)
white collarl (92%) from the private sector (49%)
from a household with at least one child (54%)
principal residence outside the two regions under study (Montreal and Quebec City) (38%)
Train 2
few common denominators; heterogeneous clientele
higher education (university studies: 71%)
white collar (77%)
public service (44%)
principal residence in central Quebec (42%)
no children (61%)
aged under 35 (44%)
Automobile
francophones (95%)
high concentration of men (74%)
lower level of education (college level or less: 44%)
1 The "white dollar" category includes: managers, administrators, professlonals, teachers, secretaries, office workers, sales personnel and technicians.
2 These data are flot necessarily representative of the overall segment of regular train users.
52
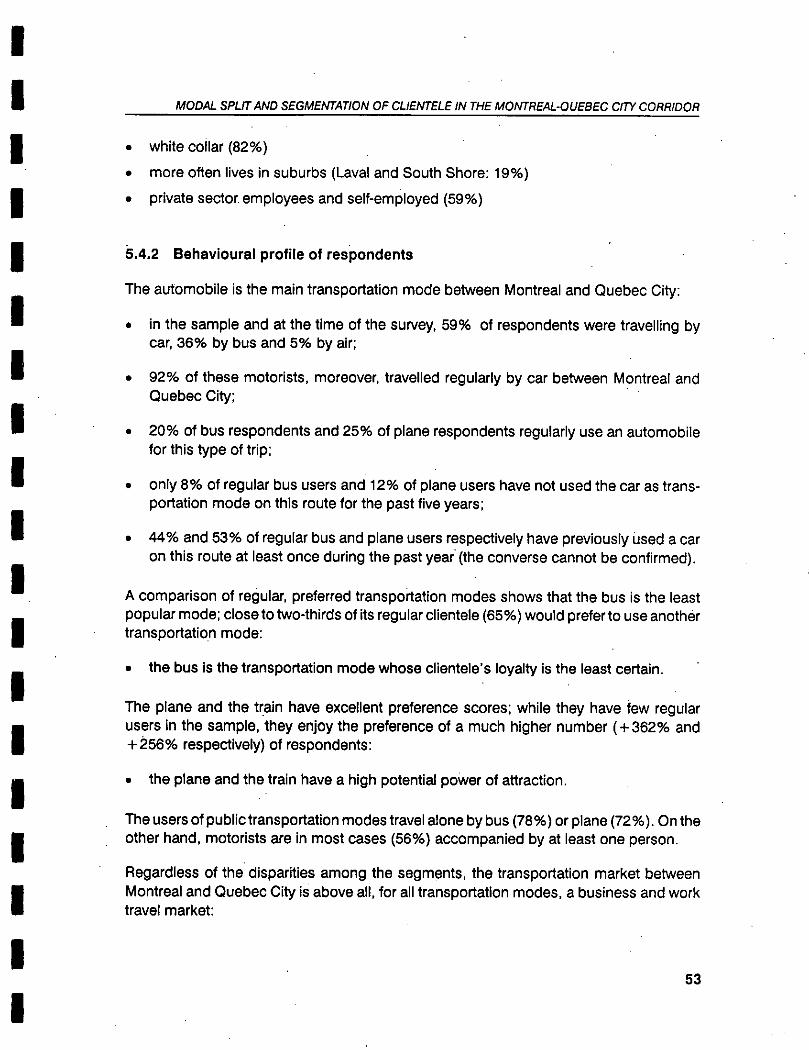
MODAL SPLIT AND SEGMENTATION OF CLIENTELE IN THE MONTREAL-OUEBEC CITY CORRIDOR
white collar (82%)
more often lives in suburbs (Laval and South Shore: 19%)
private sector employees and self-employed (59%)
I 5.4.2 Behavioural profile of respondents
The automobile is the main transportation mode between Montreal and Quebec City:
I • in the sample and at the time of the survey, 59% of respondents were travelling by car, 36% by bus and 5% by air;
I • 92% of these motorists, moreover, travelled regularly by car between Montreal and Quebec City;
I • 20% of bus respondents and 25% of plane respondents regularly use an automobile for this type of trip;
I • only 8% of regular bus users and 12% of plane users have not used the car as trans-portation mode on this route for the past five years;
I • 44% and 53% of regular bus and plane users respectively have previously used a car on this route at least once during the past year - (the converse cannot be confirmed).
A comparison of regular, preferred transportation modes shows that the bus is the least popular mode; close to two-thirds of its regular clientele (65%) would prefer to use another transportation mode:
the bus is the transportation mode whose clientele's loyalty is the least certain.
The plane and the train have excellent preference scores; while they have few regular users in the sample, they enjoy the preference of a much higher number ( +362% and +à56% respectively) of respondents:
the plane and the train have a high potential power of attraction.
The users of public transportation modes travel alone by bus (78%) or plane (72%). On the other hand, motorists are in most cases (56%) accompanied by at least one person.
Regardless of the disparities among the segments, the transportation market between Montreal and Quebec City is above ail, for all transportation modes, a business and work travel market:
53
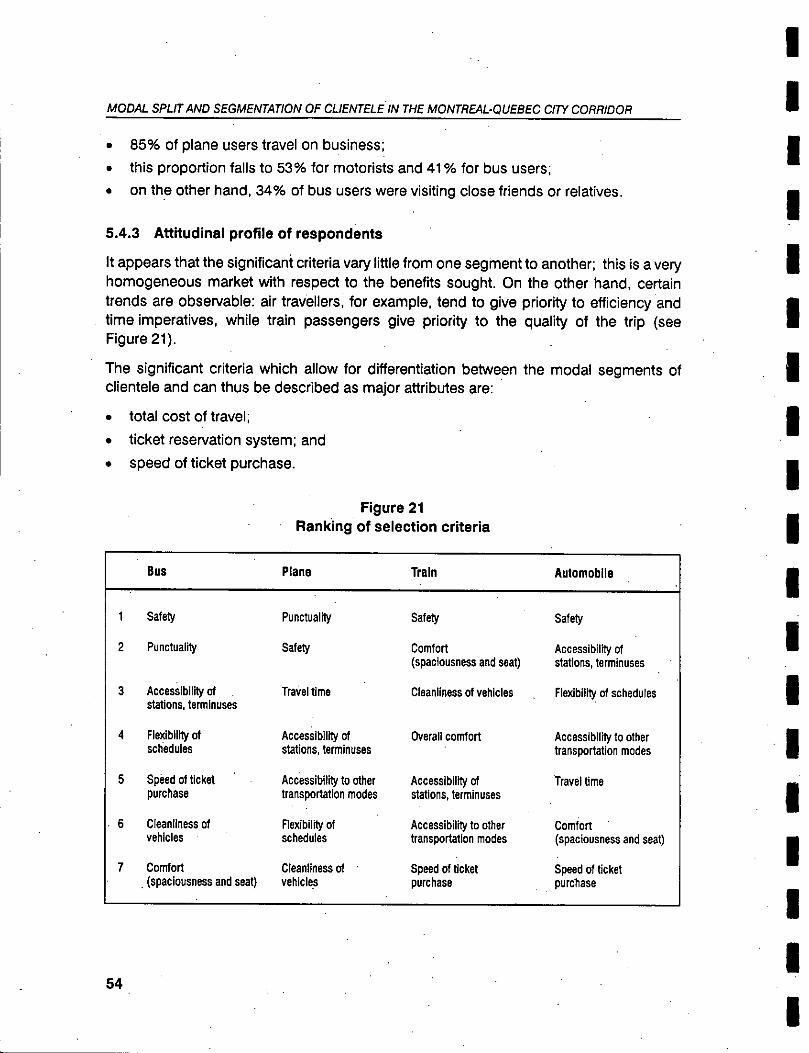
MODAL SPLIT AND SEGMENTATION OF CLIENTELE IN THE MONTREAL-QUEBEC CITY CORRIDOR
85% of plane users travel on business;
this proportion falls to 53% for motorists and 41% for bus users;
on the other hand, 34% of bus users were visiting close friends or relatives.
5.4.3 Attitudinal profile of respondents
It appears that the significant criteria vary little from one segment to another; this is a very homogeneous market with respect to the benefits sought. On the other hand, certain trends are observable: air travellers, for example, tend to give priority to efficiency and time imperatives, while train passengers give priority to the quality of the trip (see Figure 21).
The significant criteria which allow for differentiation between the modal segments of clientele and can thus be described as major attributes are:
total cost of travel;
ticket reservation system; and
speed of ticket purchase.
Figure 21 Ranking of selection criteria
4
5
6
7
Bus Plane Train Automobile
Safety Punctuality Safety Safety
Punctuality Safety Comfort (spaclousness and seat)
Accessibilfty of stations, terminuses
Accessibility of stations, terminuses
Travel time Cleanliness of vehicles Flexibilily of schedules
Flexibility of Accessibiltty of Overall cornfort Accessibility to other schedules stations, terminuses transportation modes
Speed of ticket Accessibility ta other Accessibility of Travel time purchase transportation modes stations, terminuses
Cleanliness of Flexibiley of Accessibility ta other Camion vehicles schedules transportation modes (spaciousness and seat)
Comfort Cleanliness of • Speed of ticket Speed of ticket (spaciousness and seat) vehicles purchase purchase
1
2
3
54
MODAL SPLIT AND SEGMENTATION OF CLIENTELE IN THE MONTREAL-OUEBEC CITY CORRIDOR
This leads to two conclusions:
The perception of transportation modes among respondents is remarkably stable;
I whichever clientele is concerned, two factors emerge: the "quality of the trip" and its "efficiency." Only air travellers stand out, through the substitution of "efficiency" with "comfort."
I • The respondents' travel perceptions and attitudes appear ta indicate high potential of the articulated coach which, owing to its intrinsic qualities, may allow the carrier
I ta rectify major shortcomings in its current positioning.
5.5 Trends in passenger levels
The Canadian intercity bus passenger transportation industry had its heyday in 1979, with 35.4 million passengers. Since then, it has posted an annual ridership decrease averaging 6.6%, reporting 19.1 million passengers in 1988.
During the same period, from 1978 ta 1988, preceding the introduction of the articulated coaches on the Montreal-Quebec City route, Voyageurs express routes were experiencing much the same fate as the overall Canadian industry, albeit at a slower rate of decline.
Figure 22 illustrates the trends in passenger levels on Voyageurs express routes for the decade from 1978 ta 1988. During that period, passenger levels on the Montreal-Quebec City route held relatively steady, with a decrease of 0.6% per year.
In the years immediately preceding the introduction of the articulated coaches on the Montreal-Quebec City route, that is, from mid-1985 to late 1988, passenger levels on this route were up slightly, and increasing at a yearly rate of approximately 2.5%. During this period, a number of factors exerted an upward or downward influence on passenger levels on this route:
strong economic growth;
the addition of 40 new Mirage vehicles in Voyageurs fleet in summer 1987;
I • the strike of Voyageur bus drivers in Ontario and of Montreal mechanics and office
personnel in 1988;
I • the improvement of VIA Rail service between Montreal and Quebec City with the
opening of the Gare du Palais in Quebec City and free on-board meal service.
I It is difficult, if not impossible, ta clearly quantify the exact impact of each of these factors.
55
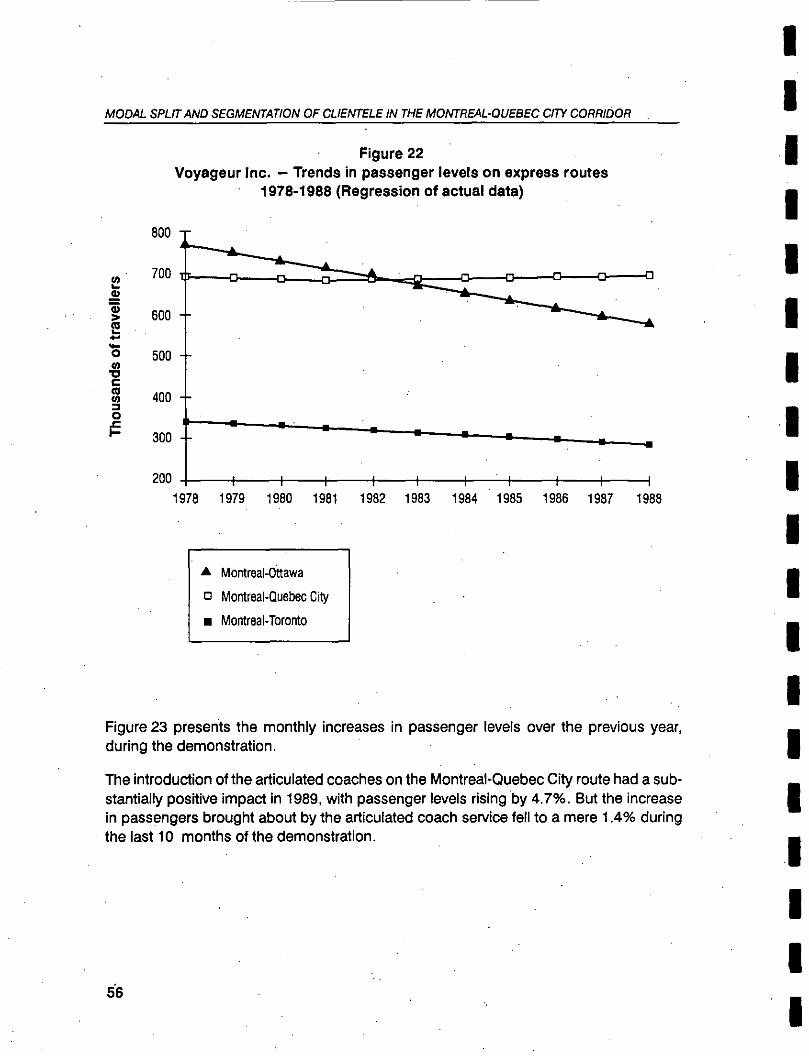
800
o
•
500 "o
400 o
300
200
MODAL SPLIT AND SEGMENTATION OF CLIENTELE IN THE MONTREAL-QUEBEC CITY CORRIDOR
Figure 22 Voyageur Inc. — Trends in passenger levels on express routes
1978-1988 (Regression of actuel data)
1978 1979 1980 1981 1982 1983 1984 1985 1986 1987 1988
Montreal-Ottawa
Montreal-Quebec City
Montreal-Toronto
Figure 23 presents the monthly increases in passenger levels over the previous year, during the demonstration.
The introduction of the articulated coaches on the Montreal-Quebec City route had a sub-stantially positive impact in 1989, with passenger levels rising by 4.7%. But the increase in passengers brought about by the articulated coach service fell to a mere 1.4% during the last 10 months of the demonstration.
58
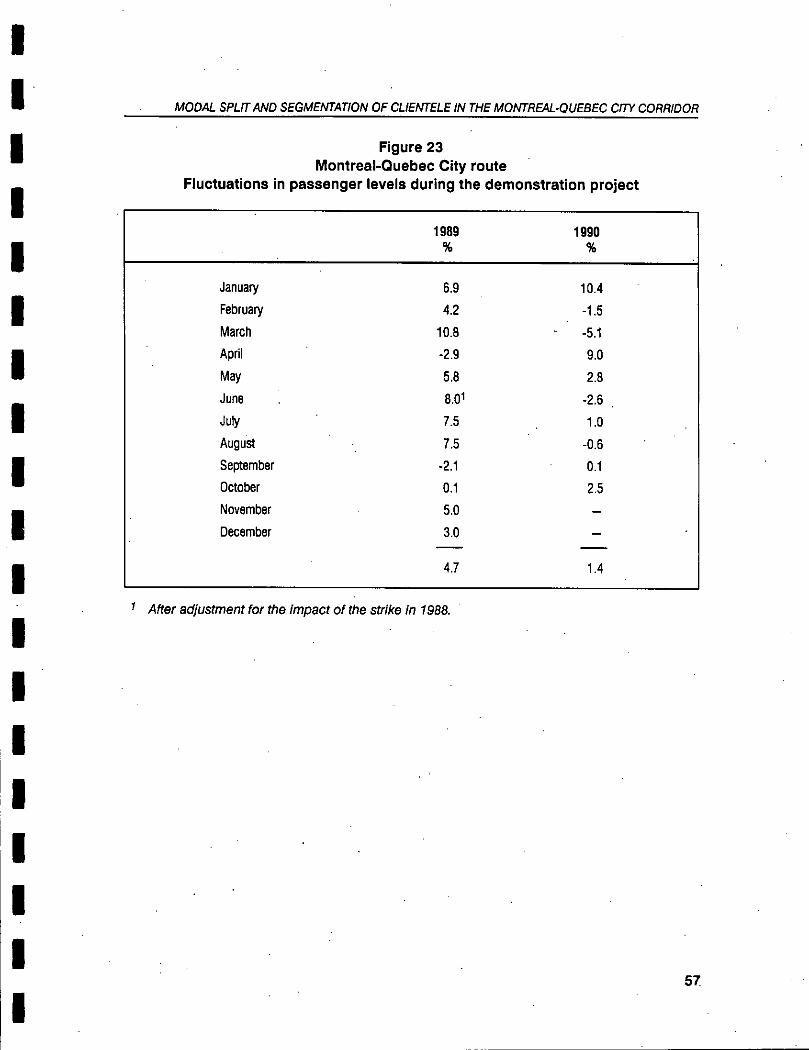
MODAL SPLIT AND SEGMENTATION OF CLIENTELE IN THE MONTREAL-OUEBEC CITY CORRIDOR
Figure 23 Montreal-Cluebec City route
Fluctuations in passenger levels during the demonstration project
1989 1990
January 6.9 10.4
February 4.2 -1.5
March 10.8 -5.1
April -2.9 9.0
May 5.8 2.8
June 8.01 -2.6
July 7.5 1.0
August 7.5 -0.6
September -2.1 0.1
October 0.1 2.5
November 5.0 —
December 3.0 —
4.7 1.4
1 Atter adjustment for the Impact of the strIke ln 1988.
57,
6. IMPACT ON CLIENTELE
6.1 Objectives
The impact of the articulated coach on clientele during the demonstration was estab-lished •by means of various surveys. The basic objective of these surveys was to establish whether there was any change in attitude, behaviour and opinion over the course of the demonstration and more specifically to compare the findings with those of the modal split study conducted by Sécor in dune 1988. The specific objectives were:
to find out travellers' interest in the articulated coach and the role of the coach in any increase in passenger levels;
to identify elements requiring improvement and the clientele's needs.
6.2 Methodology
The evaluation of the impact of the articulated coach on the clientele was conducted in three stages:
March 1989
Determination of the impact of the servis on the clientele of the Montreal-Quebec City corridor, and their evaluation of the service.
October 1989
Complementary analyses of the impact of the service on the clientele of the Montreal-Quebec City corridor, and their evaluation of the service.
November 1990
Determination of the impact of the service on the clientele of the Montreal-Quebec City corridor, and their evaluation of the service.
In addition, six focus-group meetings were held in the last week of May 1990. These meetings are documented in a report prepared by Sorécom Inc. in September 1990.
6.3 Findings
The first survey, conducted in 1989 by Sorécom, yielded the following conclusions:
the new articulated coach service helped to attract approximately 5% of Voyageur's clientele, while 15% of its clientele said they were travelling more frequently in the Montreal-Quebec City corridor since the start of the service;
58
IMPACT ON CLIENTELE
the new articulated coach service helped to attract or hold a total of approximately 16% of Voyageur's current clientele, consisting primarily of business travellers.
A second survey, conducted in September 1990 by Spectral Marketing, reached the fol-lowing conclusions:
the articulated coach service helped to attract approximately 6% of Orléans Express's clientele, while 20% of its clientele said they were travelling more frequently on the Montreal- Quebec City corridor since the start of this service, compared with 5% and 15% respectively in 1989;
the articulated coach service helped to attract or hold a total of approximately 23% of Orléans Express's current clientele, compared with 16% in 1989, but this was not primarily business clientele, as had been the case the previous year.
The findings of these surveys are not significantly different, except for the profile of the clientele whose loyalty was held, and they confirm the passenger level increases observed during the demonstration project. In tact, the total increase in passenger levels observed for the duration of the demonstration was about 6%, to ail intents and purposes matching the percentage of clientele that said in the 1990 survey they were travelling by bus solely because of the introduction of the articulated vehicle. As to customers saying that they travelled more often (or less often), it is difficult, if not impossible, to determine the impact of the articulated coaches, since this clientele may have travelled more or less often even without the articulated coaches.
6.4 Detailed findings
6.4.1 Findings of the Omnibus survey
The Omnibus survey conducted in March 1989 by Sorécom showed the importance of the clientele aged 18 to 24 and the potentiel of the articulated coach for attracting middle-income business clientele. In detailed terms, the survey showed the following:
Respondents aged between 18 and 24 were more likely to be users (14%), and this tendency increased with the level of education, from 5% among the least educated to 14% among those with 16 or more years of schooling.
Of those who said they were aware of the articulated coach, 15% planned to use it between Montreal and Quebec City in the next 12 months, and many although flot ail of these persons were aged between 18 and 24, anglophones, and residing outside Montreal, especially in the outlying regions.
59
IMPACT ON CLIENTELE
Similarly, professionals and technicians in particular (13%) were using these coaches and intended to use them in this corridor over the next year (34%).
Of course, it was mostly Voyageur clientele between these two cities who planned to use the coach in this corridor.
Of those who intended to use the articulated coach between Montreal and Quebec City, more than one-quarter (26%) said that they would do so especially because of the articulated coach service.
Those travelling specially owing to the articulated coach included a higher proportion of men and people aged between 25 and 34 or over 55, with between 10 and 12 years' schooling, and people from the Quebec City region.
Similarly, individuals from households with an income of between $20 000 and $29 999, as well as those working in the private sector, also showed a greater tendency to wish to travel between Montreal and Quebec City by coach because of the articulated•coach service.
6.4.2 Findings of the on-board surveys
Two surveys were conducted on the coaches: the first in March 1989, and the second in November 1990. These two studies revealed the opinions of the carrier's clientele in the Montreal-Ouebec City corridor as well as the changes that occurred during the course of the demonstration.
From these two surveys, the following main facts should be noted:
Users were d ivided into two main groups according to their reasons for travel: business travellers and those travelling for personal reasons.
Each of these two clientele groups has specific demographic characteristics.
The following gives a brief portrait of these two clienteles.
Business travellers Individuals travelling for personal reasons
Men Women
Aged over 35 Aged under 35
Higher level of education Lower level of education
High income Students or other occupations
Travel on weekdays Residents of Montreal
60
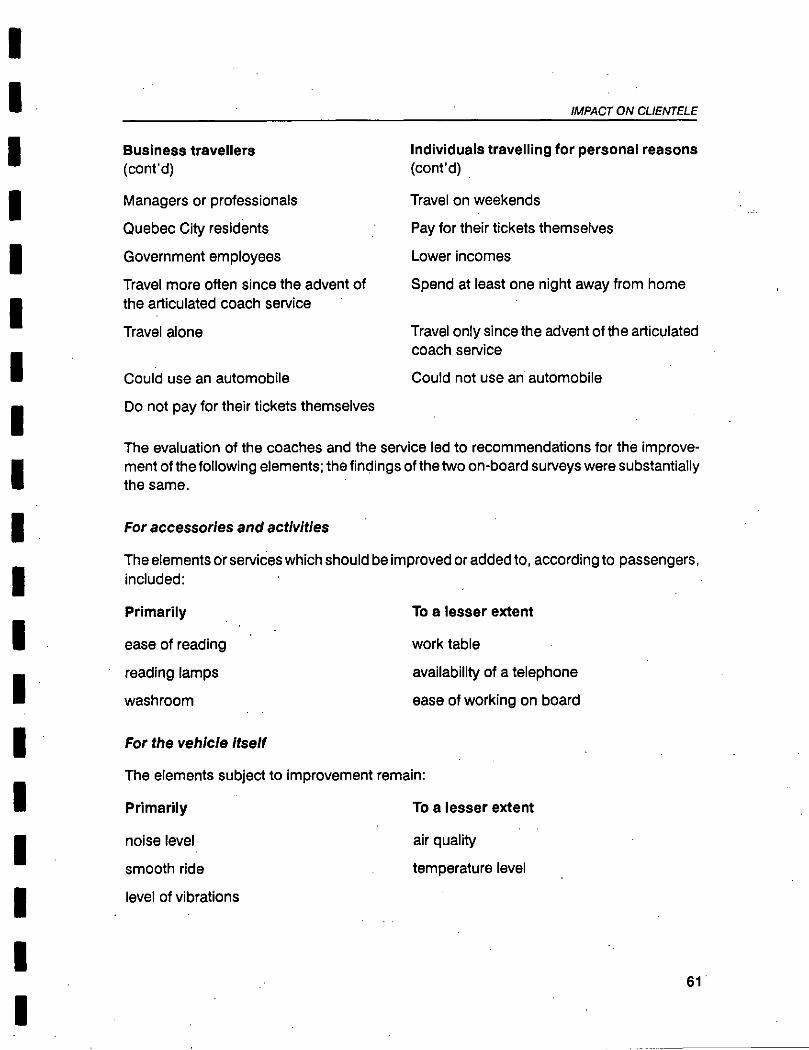
IMPACT ON CLIENTELE
Business travellers Individuels travelling for personal reasons (cont'd) (cont'd)
Managers or professionals Travel on weekends
Quebec City residents Pay for their tickets themselves
Government employees Lower incomes
Travel more often since the advent of Spend at least one night away from home the articulated coach service
Travel alone Travel only since the advent of the articulated coach service
Could use an automobile Could not use an automobile
Do not pay for their tickets themselves
The evaluation of the coaches and the service led to recommendations for the improve-ment of thefollowing elements; the findings of thetwo on-board surveys were substantially the same.
For accessorles and activities
The elements or services which should be improved or added to i according to passengers, included:
Primarily To a lesser extent
ease of reading work table
reading lamps avallability of a telephone
washroom ease of working on board
For the vehicle Itself
The elements subject to improvement remain:
Primarily To a lesser extent
noise level air quality
smooth ride temperature level
level of vibrations
61
IMPACT ON CLIENTELE
For the service
The elements criticized included:
ticket prices
poorly laid out waiting areas and poorly organized boarding procedures.
Finally, it should be noted that the automobile was found to be the most serious competing transportation mode among coach users, with close to one-third of total travel carried out with these two transportation modes in the Montreal-Quebec City corridor. The survey results indicated that approximately one-half of trips would have been made by automobile if the articulated coach service had flot existed.
6.4.3 Findings from group meetings
Six focus-group meetings were organized in Quebec City and Montreal in May 1990. Each group comprised 10 or 11 people. Some were users of the carriers intercity service, while others were not. These meetings made it possible:
to determine the attraction of the articulated coach, and particularly Voyageur's service, for these groups;
to Identity Voyageur's strengths and weaknesses;
to determine the groups' concerns and demands with respect to intercity bus travel;
to Identity the main reasons for travelling by bus, as well as future intentions;
to find out travellers' opinions concerning intercity buses (depending on the type available) in comparison with other transportation modes (car, train, plane).
With respect to habits, it was found:
that travellers planned their trips; they were not last-minute, spur-of-the-moment decisions.
For the vehicle:
Several of the disadvantages attributed to the bus diminish or disappear completely with the articulated coach, according to Voyageur users who have already used this coach.
Ail participants consider it a major step forward in bus travel: it is what many users expect of a coach. Nonetheless; several elements remain to be improved to satisfy these users fully.
62
IMPACT ON CLIENTELE
Most of these points are miner, but they would help to increase the satisfaction of users, who could subsequently encourage other travellers te use the bus. Thus, with respect te the vehicle itself, some fine-tuning should be carried out on the ventilation, ease of use of the telephone, availability of tables for working, washrooms, etc.
For the service:
Service improvements suggested by the focus groups included the possibility of knowing in advance when an articulated coach would be in service, the possibility of reserving a one-way seat or a table, etc. Some participants would also liketo see snack service and first-class service.
By playing up its advantages, as defined by users (in particular, frequency of depar-tures, duration of the trip, temperature, baggage handling, etc.), the carrier would be in a position te influence the choice of transportation mode.
Users, primarily those travelling on business, are used te a more personal and in particular more attentive service, which they do not find with the carrier. Without returning te the Grand Express as such, a better general quality of services te clientele appears necessary at every level.
Finally, the condition of the terminuses was raised as an important concern by partici-pants. In fact, although this is net expressed openly, the grubbiness of the terminuses contributes te keeping away a number of potential users owing te the image it gives te bus travel.
For marketing (ticket price and promotion):
Between one-quarter and one-half of the respondents, depending on the group, say they have flot abandoned the coach, or that they use it more often, or that they have been using it since the introduction of the articulated coach. Any change in the configu-ration of seats within the coach would definitely be poorly received, since it would be perceived as a loss of something valued. Approximately 5% te 15% of those travelling on business are prepared te pay more for their trip te ensure that the seat arrangement remains as it is.
The possibility of increasing the carrier's clientele necessarily involves attracting the business traveller, since the majority of those travelling for personal reasons appear much more sensitive te price. Nonetheless, a certain category of users travelling for personal reasons would possibly be interested in a system of bonus points providing reductions on the trip or in other service perks (snack, etc.).
It is imperative that a promotion campaign aimed at major organizations be undertaken in order te show them the advantages of travelling between Montreal and Quebec City
63
IMPACT ON CLIENTELE
by articulated coach. Many respondents who travel on business were not familiar with the articulated coach, and their reactions to the description given by those who do know it were very positive.
And generally speaking, ln terms of modal transfer:
A substantial market segment will always be unwilling to accept coach travel, but the articulated coach should be used to convince those who do not absolutely have to have their automobiles, especially once they reach their destinations;
The discussions made it clear that, even with a promotion campaign directed at companies, it is flot likely that ail business travellers would automatically use the articulated coach. However, even a reasonable proportion could increase the carrier' s clientele significantly.
64
7. BUSINESS CLIENTELE
The modal split study and the surveys on board the articulated and conventional coaches demonstrated that individuals travelling for work or on business constituted the majority in the different samplings. This clientele not only represents a significant segment, it also represents an attractive potential clientele for the new articulated coach service. In order to understand this clientele's modal choice, it was necessary to conduct a series of analyses to determine the business clientele's specific expectations of each competing trans-portation mode, as well as the expectations of the "decision-makers" responsible for determining the transportation mode used by their firms'employees ta travel on business between Montreal and Quebec City.
7.1 Objectives
These studies had two goals:
to develop a profile of the business clientele;
to determine the evolution of this clientele's opinions and criteria during the course of the demonstration.
7.2 Methodology
Two studies dealt specifically with the business clientele; a special section of the modal split study prepared by Sécor (October 1989), and the Spectral Marketing (December 1990) evaluation of the actual and potential articulated coach service in the Montreal-Quebec City corridor by travellers and corporate decision-makers in the Montreal area.
The findings of the Sécor study are based on the results of a questionnaire distributed in June 1988 to motorists and bus and airline users.
The findings of the Spectral Marketing study are based on a telephone survey carried out from November 29 ta December 7, 1990, involving 303 telephone interviews with indi-viduals responsible for the choice of transportation mode of other employees in their firms or, otherwise, individuals travelling for their work.
The sampling was designed ta be representative of firms whose names appear either in the list of the 500 largest corporations in Quebec in 1990 or in the 1990 directory of the Montreal Chamber of Commerce.
65
BUSINESS CLIENTELE
7.3 Findings
The studies clearly demonstrated that the automobile is the most frequently and regularly used mode (62%) in general, and is the mode preferred by business clientele.
Business dientele emphasize efficiency, viewing transportation from a primarily func-tional perspective. This is revealed in the following modal differentiation criteria, which serve ta define the priorities of corporate decision-makers and business travellers:
quality of the ticket reservation system,
speed of ticket purchase,
travel time.
It should be noted that the cost of the ticket is net a discriminant factor for regular auto-mobile and airline users.
The survey of business travellers and corporate decision-makers made it clear that this clientele has substantial potential for the carrier and that this potential could be developed through a specific service targetting the needs of these travellers.
7.4 Detailed findings
7.4.1 Findings of the market segmentation study .
The market segmentation study conducted by Sécor covered the differentiation criteria for the actual, usual and preferred transportation mode, with one part specifically dealing with the analysis of market segmentation as related to the business clientele.
Figure 24 shows the modal differentiation criteria for this clientele.
Highlights of the market segmentation study are:
Business clientele, in fact and in principle, prefer the automobile.
Automobile users, and more especially coach users, are sensitive to changes in transportation supply, since their preference scores are lower than their regular use scores.
Trains and planes have undeniable attraction potential.
In ail cases (actual, regular and preferred modal choice), emphasis is laid on the service offered in explaining the choice of mode.
66

BUSINESS CLIENTELE
Figure 24 Mode differentiation criteria
Criterion Score*
Bus Score* Plane
Score Automobile
On-board service 2.14 2.82 2.10
Total cost 3.13 2.86 2.67
Possibility of working 2.59 2.67 2.19
Ticket reservation system 3.02 3.38 3.28
Speed of ticket purchase 3.45 3.24 3.33
Services available 2.80 2.61 2.58
Travel time 3.42 3.63 3.54
Comfort (spaciousness and seats) 3.43 3.25 3.39
* On a sosie of four Bold type: The most important criterion for the cliente of a given mode
Under "service", the main attributes are:
the ticket reservation system (except for the coach)
speed of ticket purchase
- travel time
Business clientele stress efficiency of service,' $o their view of transportation is highly functional.
Cost is important for the coach clientele. As a result, this criterion must be seen as a factor in holding the existing clientele. On the other hand, before the introduction of the articulated coach, it had no potential for attracting the clientele from competing transportation modes.
7.4.2 Findings of the survey of travellers and corporate decision-makers
This survey, conducted in December 1990 by Spectral Marketing, highlighted the following salient facts, which corroborate the findings of the Sécor survey.
67
BUSINESS CLIENTELE
With respect to choice of mode:
An average of 13.1 people per company travel - on business between Montreal and Quebec City, and 10% of them do so by coach; the annual average number of trips of the latter respondents is 2.6 return trips between Montreal and Quebec City.
The automobile is the most frequently used mode of transport, while the plane ranks second, barely ahead of the bus, which is in third place.
This order (automobile, plane, bus) is indeed that recommended by corporate decision-makers as to transportation mode, owing primarily to the practical aspect and speed.
In terms of satisfaction:
The one-quarter of the sample that had used the bus between Montreal and Quebec City over the past year indicated high satisfaction (very or quite satisfactory), varying between 80% and 91% with respect to comfort, ease of ticket purchase and travel time.
With respect to ticketing:
Respondents indicated interest in an advance ticket reservation or delivery system.
Business service:
The significance assigned to each of the nine characteristics of the potential busi-ness service is uneven; work space and a reservation system are seen as the most significant, followed by the idea of a business service with articulated coach depar-tures from a downtown hotel with a waiting room; accessories are seen as being less important.
Compared with one-quarter of respondents who say there is a chance they or someone from their corporation will use the existing bus service between Montreal and Quebec City over the next year, one-half of respondents completing the interview replied they would use the business service; this becomes more than 4 out of 10 when total respon-dents are considered. This analysis involves associating those who lett the interview before the end with respondents who would not use this service.
68
8. ECONOMIC EVALUATION
This chapter presents a summary of the economic evaluation of articulated coaches and of the demonstration service in the Montreal-Quebec City corridor.
Three studies were conducted by Peat Marwick Stevenson & Kellogg. Some information concerning costs, market share and revenues is excluded from this report, owing to its confidential nature.
8.1 Objectives
The general objective of the economic evaluation is to determine whether the use of articulated coaches is viable for the Montreal-Quebec City route, compared with the use of conventional coaches. The specific objectives are:
evaluation and forecasting of the costs associated with the introduction and operation of articulated coaches, in comparison with the conventional coaches in the control group;
evaluation and forecasting of the revenues associated with the introduction and operation of articulated coaches on the Montreal-Quebec City route;
evaluation and forecasting of the viability of operating articulated coaches on the Montreal-Quebec City route.
8.2 Methodology
The economic evaluation involves comparing the various costs and revenues generated by the articulated coaches with those generated by conventional coaches. Figure 25 shows a flow chart of the methodology used for the economic evaluation.
The revenue, operating cost and investment cost differentials attributable to the articu-lated coaches are then used to calculate their viability. Calculation of the viability of the articulated coaches, expressed in terms of return on investment or net current value, requires an analysis of the cash flow differentials (revenues, operating costs and invest-ment costs). An economic evaluation model was developed for analysis over a 10-year period of the cash flow differentials between a service operated with conventional coaches and another with a mixed fleet of articulated and conventional coaches on the Montreal-Quebec City route.
In addition ta evaluating the viability of the articulated coaches over a period reflecting the expected life of the rolling stock, this chapter also presents the results of an economic evaluation of the two-year demonstration service.
69
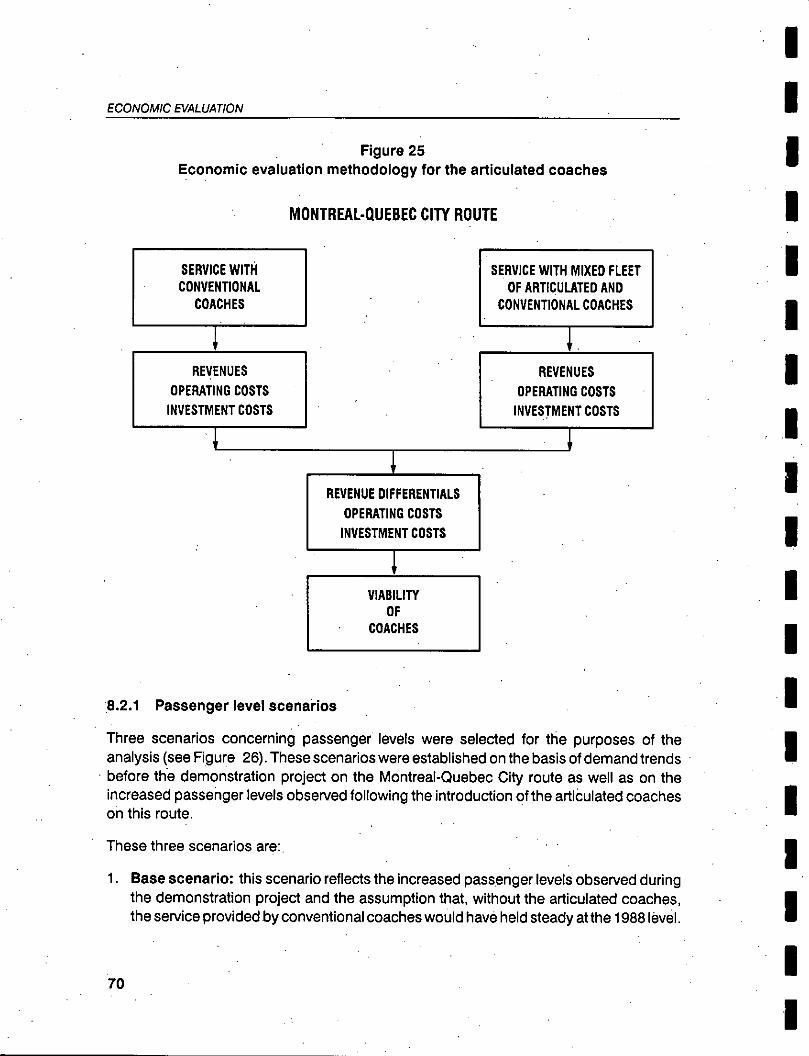
ECONOMIC EVALUATION
Figure 25 Economic evaluation methodology for the articulated coaches
MONTREAL-OLIEBEC CITY ROUTE
SERVICE WITH CON VENTIONAL
COACHES
SERVICE WITH MIXED FLEET OF ARTICUIITED AND
CON VENTIONAL COACHES
1
REVENUES OPERATING COSTS
INVESTMENT COSTS
REVENUES OPERATING COSTS
INVESTMENT COSTS
REVENUE DIFFERENTIALS OPERATING COSTS
INVESTMENT COSTS
VIABILITY OF
COACHES
8.2.1 Passenger level scenarios
Three scenarios concerning passenger levels were selected for the purposes of the analysis (see Figure 26). These scenarios were established on the basis of demand trends
• before the demonstration project on the Montreal-Quebec City route as well as on the increased passenger levels observed following the introduction of the articulated coaches on this route.
These three scenarios are:
1. Base scenario: this scenario reflects the increased passenger levels observed during the demonstration project and the assumption that, without the articulated coaches, the service provided by conventional coaches would have held steady at the 1988 level.
70
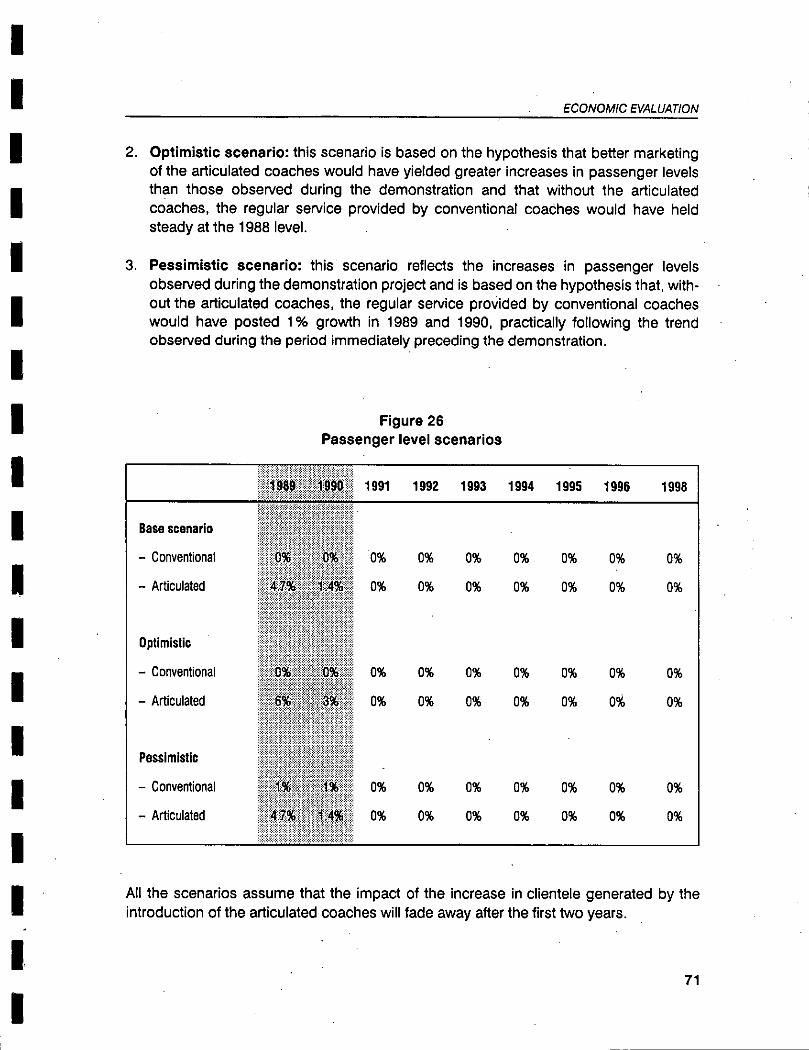
1991 1992 1993 1994 1995 1996 1998
0% 0% 0% 0% 0% 0% 0%
0% 0% 0% 0% 0% 0% 0%
0% 0% 0% 0% 0% 0% 0%
0% 0% 0% 0% 0% 0% 0%
0% 0% 0% 0% 0% 0% 0%
0% 0% 0% 0% 0% 0% 0%
Base scenario
Conventional
Articulated
Optimistic
Conventional
Articulated
Pessimistic
Conventional
Articulated
e)(191.,:990::: ,: ,:
ECONOMIC EVALUATION
Optimistic scenario: this scenario is based on the hypothesis that better marketing of the articulated coaches would have yielded greater increases in passenger levels than those observed during the demonstration and that without the articulated coaches, the regular service provided by conventional coaches would have held steady at the 1988 level.
Pessimistic scenario: this scenario reflects the increases in passenger levels observed during the demonstration project and is based on the hypothesis that, with-out the articulated coaches, the regular service provided by conventional coaches would have posted 1% growth in 1989 and 1990, practically following the trend observed during the period immediately preceding the demonstration.
Figure 26 Passenger level scenarios
Ail the scenarios assume that the impact of the increase in clientele generated by the introduction of the articulated coaches will fade away after the first two years.
71
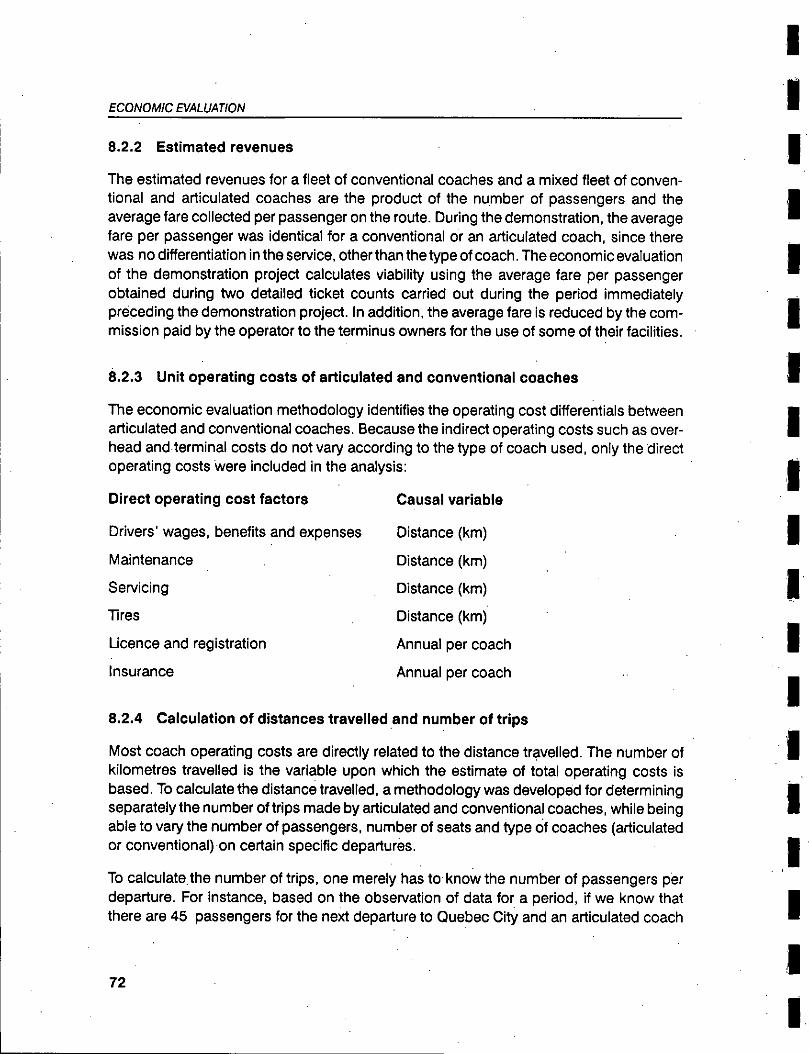
ECONOMIC EVALUATION
8.2.2 Estimated revenues
The estimated revenues for a fleet of conventional coaches and a mixed fleet of conven-tional and articulated coaches are the product of the number of passengers and the average fare collected per passenger on the route. During the demonstration, the average fare per passenger was identical for a conventional or an articulated coach, since there was no differentiation in the service, other than the type of coach. The economic evaluation of the demonstration project calculates viability using the average fare per passenger obtained during two detailed ticket counts carried out during the period immediately preceding the demonstration project. In addition, the average fare is reduced by the com-mission paid by the operator to the terminus owners for the use of some of their facilities.
8.2.3 Unit operating costs of articulated and conventional coaches
The economic evaluation methodology identifies the operating cost differentials between articulated and conventional coaches. Because the indirect operating costs such as over-head and terminal costs do net vary according te the type of coach used, only the direct operating costs were included in the analysis:
Direct operating cost factors Causal variable
Drivers' wages, benefits and expenses Distance (km)
Maintenance Distance (km)
Servicing Distance (km)
Tires Distance (km)
Licence and registration Annual per coach
lnsurance Annual per coach
8.2.4 Calculation of distances travelled and number of trips
Most coach operating costs are directly related te the distance travelled. The number of kilometres travelled is the variable upon which the estimate of total operating costs is based. Te calculate the distance travelled, a methodology was developed for determining separately the number of trips made by articulated and conventional coaches, while being able te vary the number of passengers, number of seats and type of coaches (articulated or conventional) on certain specific departures.
Te calculate the number of trips, one merely has te know the number of passengers per departure. For instance, based on the observation of data for a period, if we know that there are 45 passengers for the next departure te Quebec City and an articulated coach
72
ECONOMIC EVALUATION
has 48 seats, whereas a conventional coach has 43, it is easy to deduce that it will take two conventional trips, - or one articulated coach, or one conventional coach and a second articulated coach departure, depending on how the vehicles are used. By knowing the number of passengers on each departure, one can determine exactly the number of trips by articulated or conventional coaches, regardless of the number of seats or type of coach.
The methodology used te calculate the number of trips is illustrated in Figure 27. The economic evaluation is also based on a number of financial assumptions which are presented and discussed in Section 8.2.5.
8.2.5 Economic assumptions
The investment and start-up costs uSed in the economic evaluation of the articulated coach demonstration project include:
cost of purchasing the coaches (including 9% provincial sales tax in effect in 1988);
cost of parts (minimum inventory to be maintained);
costs of fitting out and altering infrastructure;
training costs;
cost of the cost-tracking computer system;
cost of advertising;
cost of studies; and
management costs.
The analysis also supposes that the rolling stock will have at the end of its useful life (10 years) a residual value equivalent to 20% of its replacement cost. The analysis includes no residual value with respect to infrastructure. The parts inventory reteins 100% of its original value, since the inventory is normally replaced over the years.
The viability calculations are carried out before and atter incarne tax.
This study used a general annuel inflation rate of 4%.
8.2.6 " Viability measurements
The viability measurements are the net current value and the return-on-investment rate, before and atter taxes. The project is deemed financially viable if the net current value is positive over the analysis period as a whole on the basis of a discount rate of 15%, cor-responding to the minimum return expected atter tax, or if the rate of return exceeds 15%. The 15% after-tax rate corresponds to a pre-tax rate of 22%.
73
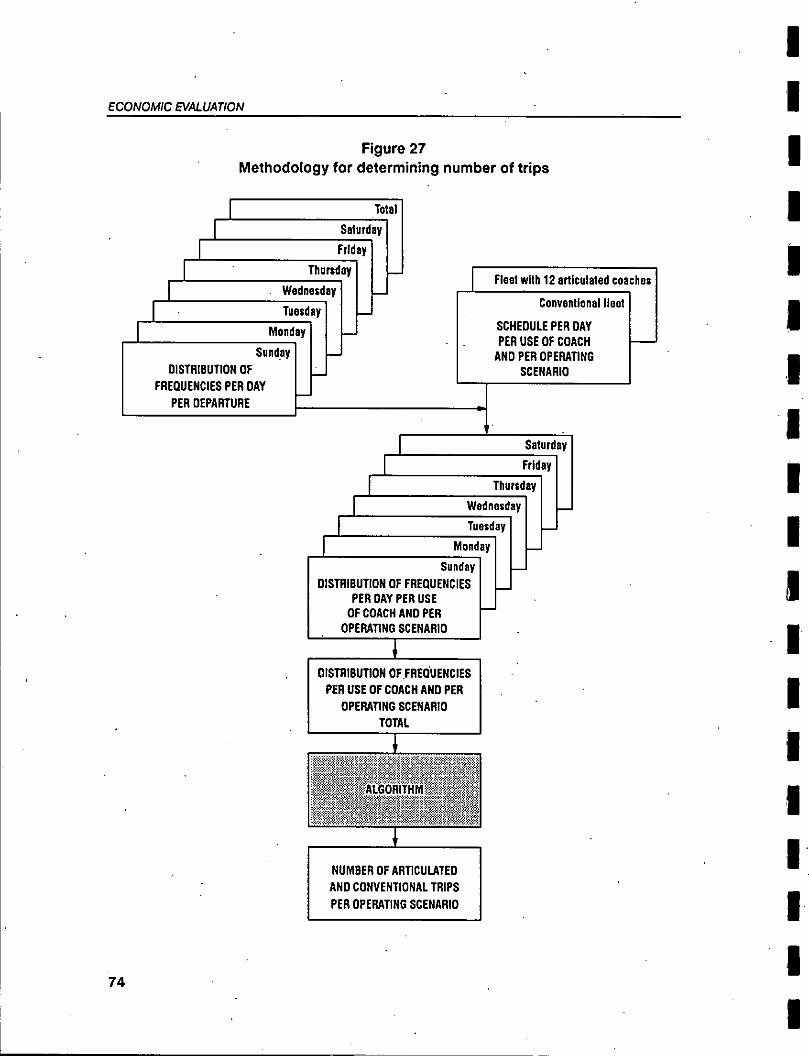
ECONOMIC EVALUATION
Figure 27 Methodology for determining number of trips
Total
Saturday
Friday
Thursday
Wednesday
Tuesday
Monday
Sunday DISTRIBUTION OF
FREGUENCIES PER DAY PER DEPARTURE
Fleet with 12 articulated coaches
Consentlenal Hut
SCHEDULE PER DAY PER USE OF COACH
AND PER OPERATING SCENARIO
Saturday
Friday
Thursday
Wednesday
Tuesday
Monday
Sunday DISTRIBUTION OF FREGUENCIES
PER DAY PER USE OF COACH AND PER
OPERATING SCENARIO
DISTRIBUTION OF FREOLIENCIES PER USE OF COACH AND PER
OPERATING SCENARIO TOTAL
NUMBER OF ARTICULATED AND CONVENTIONAL TRIPS PER OPERATING SCENARIO
74
ECONOM/C EVALUATION
The analysis uses revenue, operating cost and investment cost differentials and dis-counting of these cash flows to calculate the rate of return of the investment. Return on investment is calculated before and atter tax.
8.21 Combinations of assumptions
For the economic evaluation of the articulated coaches, the viability measurements were determined on the basis of several combinations of the following basic hypotheses:
number of seats (48, 51, 64, or 68);
three passenger level scenarios (base, optimistic or pessimistic);
other expenditures specific to the demonstration (e.g., training, computer systems [0% or 100%]);
operating costs at 100%, 90% or 110% of estimated costs for articulated coaches and conventional coaches.
8.3 Results of the economic evaluation
Over a 10-year period, assuming that a return on investment higher than 15% atter taxis required by the carrier for the purchase of articulated coaches on the Montreal-Quebec City route and by analysing the detailed results of the analysis of return on investment and net current values before and after grants, and before and atter tax, for 48 combinations of assumptions, the project may be seen to be viable in most cases (particularly coaches with 64 and 68 seats) when the grants are included in the analysis (that is, "atter grants", see Figure 28: Economic evaluation results). On the other hand, the project is barely viable except in some isolated cases (once again when 64 or 68-seater coaches are involved) if the grants are excluded from the analysis (i.e., "before grants"). More specifically, the results show that:
the 48-seater coach is viable only atter grants and combinations of the most favour-able assumptions (i.e., a combination of optimistic passenger levels, no expenditures specificto the demonstration, and operating costs of 90% or 100% of estimated costs).
The 51-seater coach is viable only when the grants are included in the analysis and only for certain combinations of assumptions. This type of coach is always viable aller g rants if passenger levels are optimistic, and even for the base level of passengers, if there are no expenditures specific to the demonstration and operating costs are 90% or 100% of estimated costs.
75
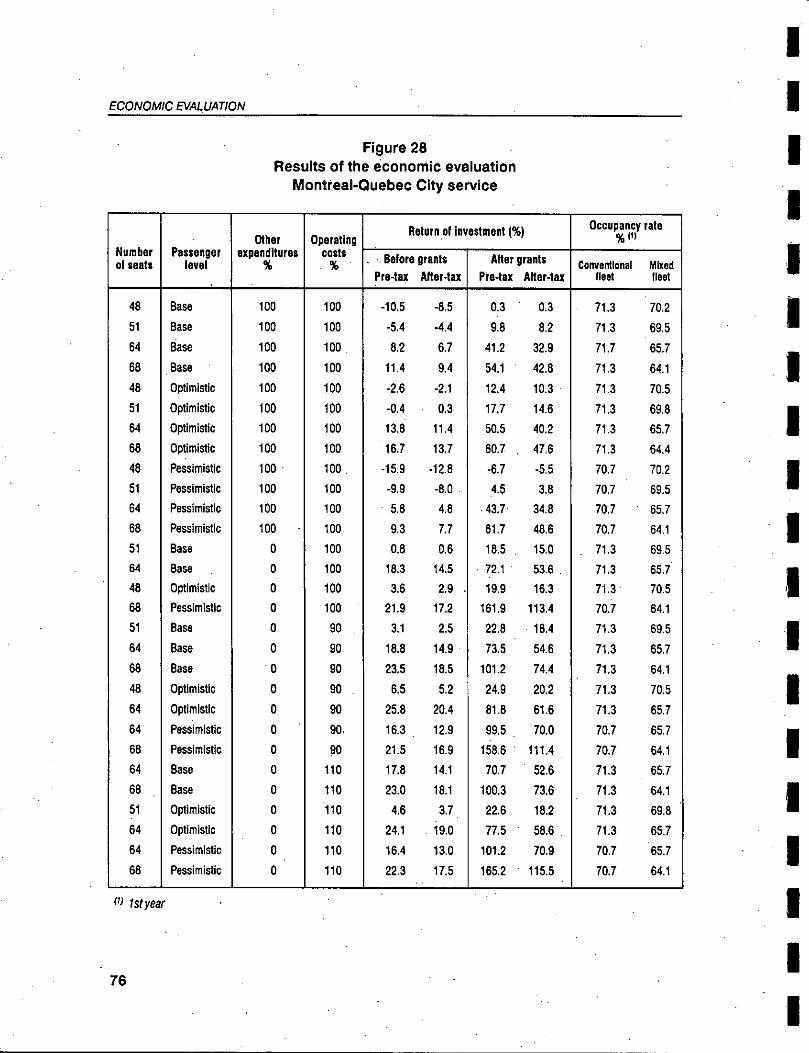
ECONOMIC EVALUATION
Figure 28 Results of the econornic evaluation
Montreal-Cluebec City service
Buffler ol seats
• Passenger
levai
Other expenditures
Operating costs
Return of investment (%) Occupancy rate% of
. Beforants
Pre-tax After-tax
B Atergrants
Pre-tax Alter-in
convention&
Ont
men
fluet
48 Base 100 100 -10.5 -8.5 0.3 0.3 71.3 70.2
51 Base 100 100 -5.4 -4.4 9.8 8.2 712 69.5
64 Base 100 100 8.2 6.7 41.2 32.9 71.7 65.7
68 Base 100 100 11.4 9.4 54.1 42.8 71.3 64.1
48 Optimiste 100 100 -2.6 -2.1 12.4 10.3 71.3 70.5
51 Optimiste 100 100 -0.4 0.3 17.7 14.6 71.3 69.8
64 Optimiste 100 100 13.8 11.4 50.5 40.2 71.3 65.7
68 Optimiste 100 100 16.7 13.7 60.7 47.6 71.3 64.4
48 Pes. simistic 100 100 -15.9 -12.8 -6.7 -5.5 70.7 70.2
51 Pessimiste 100 100 -9.9 -8.0 4.5 3.8 70.7 69.5
64 Pessimiste 100 100 5.8 4.8 . 43.7. 34.8 70.7 65.7
68 Pessimiste 100 100 9.3 7.7 61.7 48.6 70.7 64.1
51 Base 0 100 0.8 0.6 18.5 15.0 71.3 69.5
64 Base 0 100 18.3 14.5 - 72.1 53.6 71.3 65.7•
48 Optimiste 0 100 3.6 2.9 19.9 16.3 71.3' 70.5
68 Pessimiste 0 100 21.9 17.2 161.9 113.4 70.7 64.1
51 Base 0 90 3.1 2.5 22.8 18.4 71.3 69.5
64 Base 0 90 18.8 14.9 73.5 54.6 71.3 65.7
68 Base 0 90 23.5 18.5 101.2 74.4 71.3 64.1
48 Optimiste 0 90 . 6.5 5.2 24.9 20.2 71.3 70.5
64 Optimiste 0 90 25.8 20.4 81.8 61.6 71.3 65.7
64 Pessimiste 0 90 16.3 12.9 99.5 70.0 70.7 65.7
68 Pessimiste 0 90 21.5 16.9 153.6 111.4 70.7 64.1
64 Base 0 110 17.8 14.1 70.7 52.6 71.3 65.7
68 Base 0 110 23.0 18.1 100.3 73.6 71.3 64.1
51 Optimistic 0 110 4.6 3.7 22.6 18.2 71.3 69.8
64 Optimiste 0 110 24.1 19.0 77.5 58.6 71.3 65.7
64 Pessimiste 0 110 16.4 13.0 101.2 70.9 70.7 65.7
68 Pessimistic 0 110 22.3 17.5 165.2 115.5 70.7 64.1
(I) lstyear
76

ECONOMIC EVALLIATION
The 64-seater coach is always viable atter grants. Before grants, this type of coach is viable only for base and optimistic passengers levels when there are no expenditures specific to the demonstration and operating costs are 90% or 100% of estimated costs.
The 68--seater coach is the most viable. It is always viable atter grants. Before grants, this type of coach is also viable when there are no expenditures specific to the demonstration for the three passenger level scenarlos, even if operating costs are 100% of estimated costs.
The results of the analysis also enable us to make the following observations:
taking grants into account, the 64 and 68-seater articulated coaches are viable for ail cases, except for the 64-seater when passenger levels are pessimistic and operating costs are 110% of estimated costs;
the number of seats is the most important factor for the viability of the arliculated coaches. This factor makes it possible to reduce the number of trips and thereby the operating costs of the project. There is a substantial improvement especially when the number of seats is 64;
the other factors (expenditures associated with the demonstration, operating costs of the coaches) are less important;
the occupancy rate of the conventional fleet is higher than that of the mixed fleet in ail cases, particularly when 64 and 68-seater articulated coaches are used.
8.4 Economic evaluation of the demonstration
The specific period of the demonstration (22 months) was also the subject of an economic evaluation te compare the impact of the articulated coaches compared with that of the conventional coaches. These analyses are based on the same approach and the same methodology described in 8.2. The results of this analysis are presented in Figure 29.
ln relation to the 1988 passenger level, the mixed fleet of articulated and conventional coaches saved 357 trips compared with a fleet of conventional coaches. But in reality, given the higher passenger level, the mixed fleet saved 1 745 trips over the 22-month period.
8.5 Conclusion
The operation of 48-seater articulated coaches on the Montreal-Quebec City route does net appear financially justified given the impact on revenues due te operating costs and the assumptions of an economic analysis over 10 years.
77
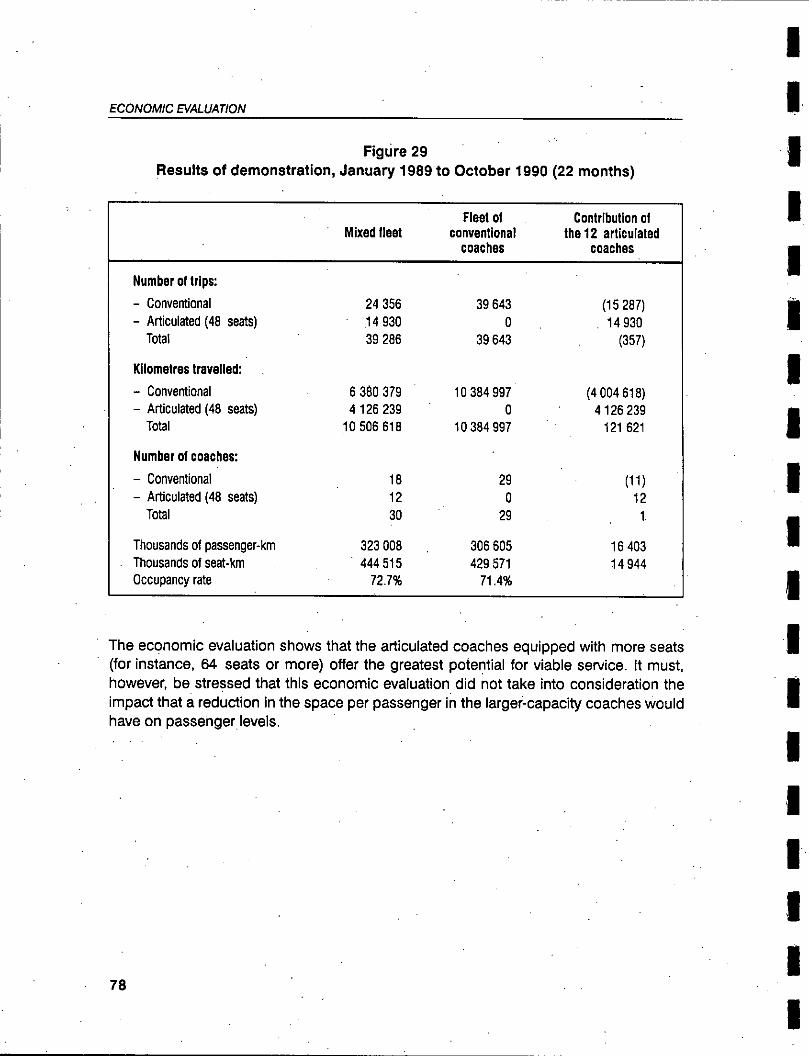
ECONOMIC EVALUATION
Figure 29 Results of demonstration, January 1989 to October 1990 (22 months)
Mixed fleat Fleet of
conventional coaches
Contribution of the 12 articulated
coaches
Number of trips:
— Conventional 24 356 39 643 (15 287) — Articulated (48 seats) 14 930 0 14 930
Total 39 286 39 643 (357)
Kilometres travelled:
— Conventional 6 380 379 10 384 997 (4 004 618) — Articulated (48 seats) 4 126 239 0 4 126 239
Total 10 506 618 10 384 997 121 621
Number of coaches:
— Conventional 18 29 (11) — Articulated (48 seats) 12 0 12
Total 30 H 29 1
Thousands of passenger-km 323 008 306 605 16 403 Thousands of seat-km 444 515 429 571 14 944 Occupancy rate 72.7% 71.4%
The economic evaluation shows that the articulated coaches equipped with more seats (for instance, 64 seats or more) offer the greatest potentiel for viable service. It must, however, be stressed that this economic evaluation did flot take into consideration the impact that a reduction in the space per passenger in the larger-capacity coaches would have on passenger levels.
78

9. POTENTIAL APPLICATIONS
This chapter presents the results of the economic evaluation of the articulated coach on the basis of three possible scenarios:
luXury service (Montreal and Quebec City);
high-density, low-frequency scheduled service (Montreal and Toronto);
charter service.
9.1 Luxury service
The economic evaluation of a luxury service with articulated coaches differs from the arti-culated coach demonstration project because it concerns the operation of a luxury service with articulated coaches in parallel with a reg ular service with conventional coaches. In fact, the demonstration project covered the evaluation of articulated coaches introduced into a scheduled service and flot as a distinct service. In the demonstration project, emphasis was on increasing passenger levels to make the purchase of the arliculated coaches viable, whereas price is the main factor for making articulated coaches viable in a luxury service.
The main objective of the analysis is to determine the viability of introducing and operating articulated coaches in a luxury service on a regular route.
The Montreal-Quebec City route is used to evaluate the viability of a luxury service served by articulated coaches.
9.1.1 Features of the luxury service
The luxury service has two essential features: ticket price, the main factor in making the operation of articulated coaches viable; and the target clientele, namely business travel-lers, because they have indicated in past and recent surveys that they are receptive to a form of luxury service and are prepared to pay for it. From the marketing viewpoint, it would appear that a 50% te 100% supplement on the price of the regular ticket would be accept-able for this market segment.
The other features of the luxury service are as follows:
a configuration of three seats per row fora total capacity of 48 seats (the other possible configurations, 51, 64 and 68 seats, were net analysed since they were considered incompatible with the concept of a luxury service);
a reservatiqn system, which could prove very popular with the business target clientele;
79
POTENTIAL APPLICATIONS
no on-board service (this means that relatively high costs for the wages of on-board personnel are not incurred);
seats equipped with folding tables similar to those on aircraft;
waiting rooms in major hotels to enhance the image of the service;
a video and audio system for passenger entertainment;
two possible frequencies: one return trip per day in each direction (4 one-way trips per day); and two return trips per day in each direction (8 one-way trips per day). In addition, the luxury service would operate on weekdays only, with no service on Saturdays and Sundays.
9.1.2 Methodology
In conceptual terms, flue methodology is similar to that used in the economic evaluation of the demonstration project; in both cases, the idea was to identify revenue, operating cost and investment cost differentials so as to calculate the return and net current value. The analysis considers a 10-year period corresponding to the estimated useful lite of the rolling stock and uses the financial principle of discounted net cash flow for the calculations of rate of return and net current value.
Figure 30 illustrates the approach and methodology for economic evaluation of the luxury service.
Regular service provided by conventional coaches alone was the reference scenario for calculating d ifferentials. Note that here we are flot looking at the service currently offered on the Montreal-Quebec City route, with a mixed fleet of conventional and articulated coaches, but rather at the situation that existed prior to the demonstration, when service was pro-vided with conventional coaches only.
The analysis considers two possible scenarios for introduction of a luxury service in parallel with the regular service; that is, the two frequencies of service described above. For each operating scenario, revenues have to be calculated, along with variable operating costs and investment costs, to identify cash flow differentials in relation to the reference scenario and to calculate rates of return and net current values.
The variable operating costs included in the estimate of total operating costs are similar to those in the economic evaluation of the demonstration project, but also include cost elements specific to the luxury service, such as the costs associated with waiting rooms and a reservation system.
80
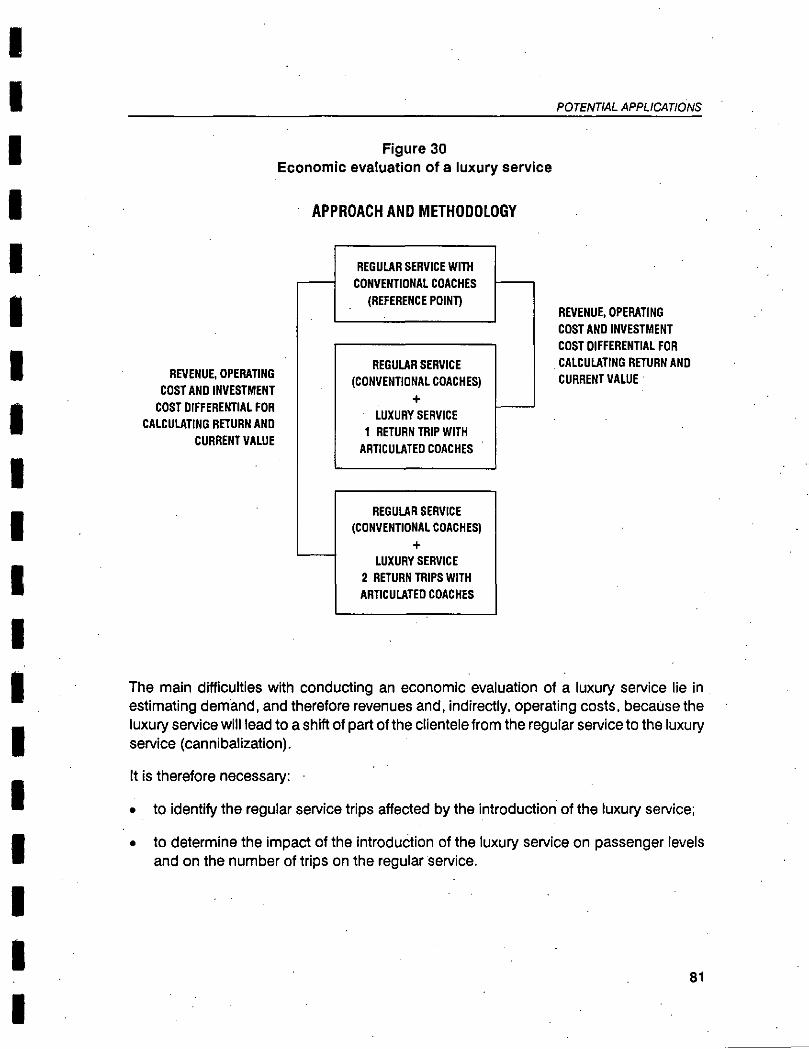
POTENTIAL APPLICATIONS
Figure 30
EconOmiC evaluatiOn Of a Iuxury service
APPROACH AND METHODOLOGY
REGULAR SERVICE WITH CONVENTIONAL COACHES
(REFERENCE POINT)
REVENUE, OPERATING COST AND INVESTMENT COST DIFFERENTIAL FOR CALCULATING RETURN AND CURRENT VALUE
REVENUE, OPERATING COST AND INVESTMENT
COST DIFFERENTIAL FOR CALCULATING RETURN AND
CURRENT VALUE
REGULAR SERVICE (CONVENTIONAL COACHES)
LUXURY SERVICE 1 RETURN TRIP WITH
ARTICULATED COACHES
REGULAR SERVICE (CONVENTIONAL COACHES)
LUXURY SERVICE 2 RETURN TRIPS WITH ARTICULATED COACHES
The main difficulties with conducting an economic evaluation of a luxury service lie in estimating demand, and therefore revenues and, indirectly, operating costs, because the luxury service will lead te a shift of part of the clientele from the regular service to the luxury service (cannibalization).
It is therefore necessary:
te identify the regular service trips affected by the introduction of the luxury service;
te determine the impact of the introduction of the luxury service on passenger levels and on the number of trips on the regular service.
81

POTENTIAL APPLICATIONS
9.1.3 Assumptions
Estirnate of demand and calculation of trips
The estimate of demand and calculation of trips depend on a series of assumptions concerning the engin of the clientele, cannibalization of the regular service by the luxury service, and the withdrawal of part àf the clientele from the regular service. These assumptions make it possible te estimate demand for the regular service and the luxury service, to calculate the number of coach trips required te meet this demand, and finally te calculate operating costs.
Estimate of operating costs
The economic analysis of a luxury service uses the unit costs obtained in the demonstration project and the costs specific te the introduction of this service, namely:
cost of servicing (washing and cleaning of coaches, disposai of toilet waste, etc.);
specifically for the luxury service:
cost of the reservation system per passenger,
cost of distributing coffee and newspapers to passengers in the waiting rooms, and
cost of distributing headsets for the audio-video system.
yearly fixed costs:
- for minimal promotion of the service,
- for rental of small waiting rooms in major hotels at each end of the route, and
equipment rental and access fees for operating the reservation system.
The analysis uses an average inflation rate of 4% for forecasting operating costs for the 10 years of the analysis period.
Estimate of investment costs
For the operating scenario represented by the regular service, investment costs are limited te the purchase of conventional coaches.
Investment costs for the luxury service include the sums associated with the purchase of articulated coaches and a parts inventory, and with the start-up costs for a reservation system.
The purchase cost of an articulated coach is estimated at $575 000 in 1990 and includes $15000 for work tables and $15000 for installation of an audio-video system. Te this
82
POTENTIAL APPLICATIONS
amount is added the 8% provincial tax applicable in 1991. The number of articulated coaches needed to operate the luxury service was estimated at 3 and 5 for the luxury ser-vices with 1 and 2 return trips respectively, and in each case includes a spare coach.
The analysis supposes that •a minimum investment of $50 000 ($25 000 at each end of the route) for a parts inventory is required te operate the luxury service.
Finally, the analysis of the luxury service includes $21 500 for costs associated with instal-làtion and start-up of the reservation system.
Calculation of vlability
The viability calculations are carried out before and atter income tax payable, using the same assumptions as the demonstration project.
The viability measurements used are rate of return on investment and net current value. It is presumed that returns of approximately 15% atter tax or 22% before tax are required for a project to be attractive for a potential investor. The net current values of cash flows are calculated atter and before tax using discount rates of 22% and 15% respectively. The analysis period is 10 years.
9.1.4 Results
The results were determined on the basis of several combinations of basic assumptions:
20%, 25% or 30% of passengers coming from other transportation modes;
single and double indirect cannibalization of 10% and 15% respectively, or 15% and 20% respectively;
ticket prices 50%, 70% or 90% higher than the regular fare (before deduction of commissions);
operating costs of conventional and articulated coaches at 100%, 90% or 110% of estimated costs;
maintenance costs of the articulated coaches 10% and 20% higher than estimated costs.
The results of the economic evaluation of the luxury service on the Montreal-Quebec City route indicate that a combination of optimistic assumptions is necessary for the service• to be viable, namely:
passenger levels including 25% te 30% new passengers and single and double cannibalization of 15% and 20% respectively;
83

POTENTIAL APPLICATIONS
operating costs at 90% or 100% of estimated costs;
fare levels 96% higher than regular fares.
The results are less sensitive to variations in operating costs. If costs are also 90% of estimated costs, some cases are viable with assumptions a little less optimistic than those mentioned above. On the other hand, if costs are 110% of estimated costs, the number of viable cases falls. A mere 10% or 20% increase in the maintenance costs of the articulated coaches reduces return on investment by 2% te 3%.
The two return trip scenario is always more viable than the one return trip scenario.
The occupancy rate of the regular service in the absence of a luxury service is 71.3% and is always higher than the combined occupancy rate of the regular service and the luxury service.
In ail cases, the occupancy rate for the luxury service with one return trip is higher than for the luxury service with two return trips (see Figures 31 and 32).
Moreover, the occupancy rate for the luxury service is always lower than for the regular service (following the introduction of the luxury service), except for the scenario of the luxury service with one return trip when the percentage of new passengers is 25% or 30% and indirect cannibalization is 15%.
In conclusion, the results of the economic evaluation of a luxury service on the Montreal-Quebec City route, using the assumptions chosen in this analysis, are not very positive and do not appear te justify the acquisition of articulated coaches. Very optimistic passenger levels combined with very high fares (two theoretically incompatible assump-tions) would be necessary for the project to be financially acceptable.
9.2 Scheduled high -density, low-frequency service
The main objective of this analysis is to study the viability of the introduction and operation of articulated coaches on a high-density, low-frequency route such as fV1ontreal-Toronto.
9.2.1 Methodology
The methodology used for this analysis is very similar te that used for the economic evaluation of the demonstration project. Essentially, the economic analysis identifies the revenue, operating cost and investment cost differentials that exist between a mixed fleet of articulated and conventional coaches and a fleet of conventional coaches, in order to determine the viability of the investment differential represented by the articulated coaches. The viability of the articulated coaches is assessed over a 10-year period by
84
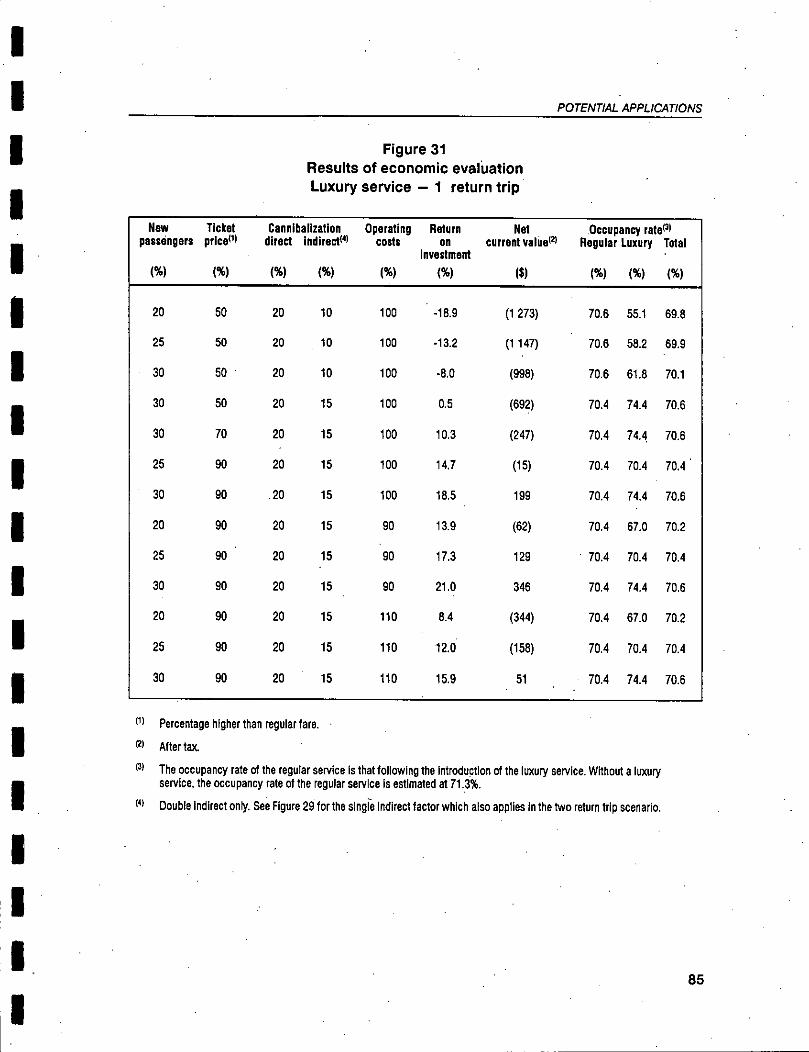
POTENTIAL APPLICATIONS
Figure 31 Results of economic evaluation Luxury service - 1 return trip
New passengers
Ticket price)
Cannibalization direct indirect(4)
Operating costs
Return on
Investment
Net carrent value
Occupancy rateal Regular Luxury Total
(k) (%) (%) (%) (%) (%) (s) (%) (%) MI
20 50 20 10 100 . -18.9 (1273) 70.6 55.1 69.8
25 50 20 10 100 -13.2 (11 , 47) 70.6 58.2 69.9
30 50 20 10 100 -8.0 (998) 70.6 61.8 70.1
30 50 20 15 100 0.5 (692) 70.4 74.4 70.6
30 70 20 15 100 10.3 (247) 70.4 74.4 70.6
25 90 20 15 100 14.7 (15) 70.4 70.4 70.4'
30 90 .20 15 100 18.5 199 70.4 74.4 70.6
20 90 20 15 90 13.9 (62) 70.4 67.0 70.2
25 90 20 15 90 17.3 129 70.4 70.4 70.4
30 90 20 15 90 21.0 346 70.4 74.4 70.6
20 90 20 15 110 8.4 (344) 70.4 67.0 70.2
25 90 20 15 110 12.0 (158) 70.4 70.4 70.4
30 90 20 15 110 15.9 51 70.4 74.4 70.6
Percentage higher than regular tare.
Alter tax
The occupancy rate of the regular service is that following the Introduction of the luxury service. Without a luxury service, the occupancy rate of the regular service is estlmated at 71.3%.
Double Indirect only. See Figure 29 for the sIngre Indirect factor which also applies In the two return trip scenario.
85
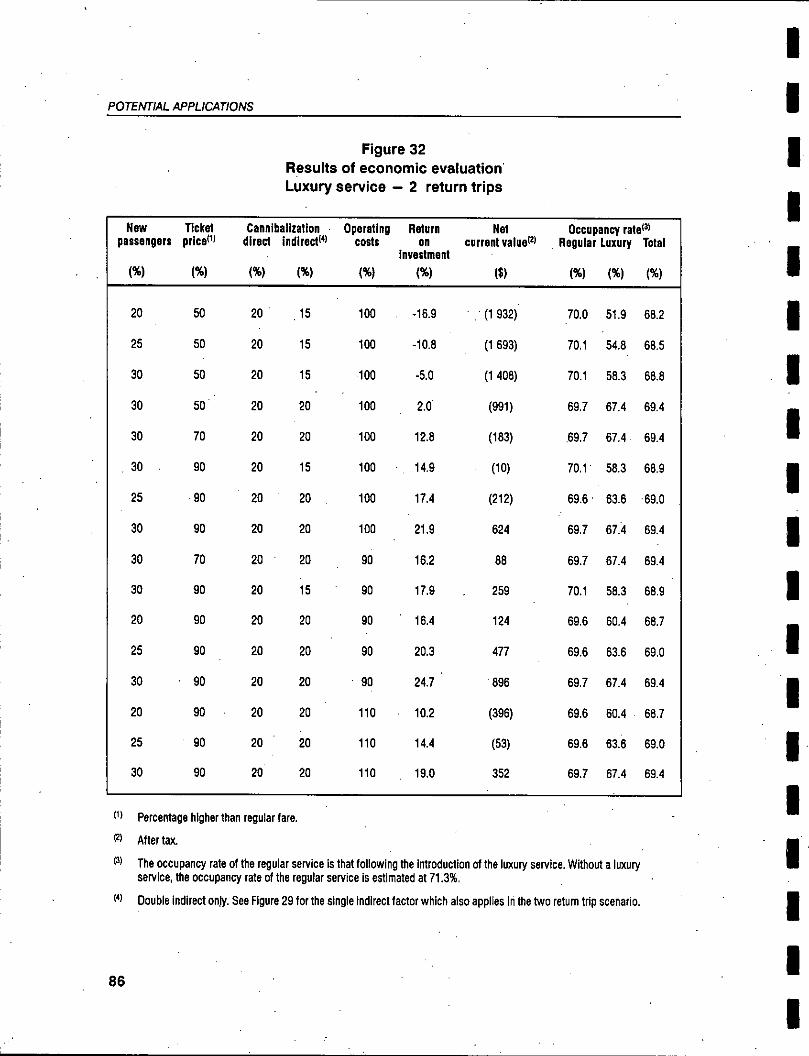
POTENTIAL APPLICATIONS
Figure 32 Results of economic evaluation Luxury service - 2 return trips
New passengers
Ticket price )
Cannibalization direct indirect (4)
Operating costs
Return on
Investment
Net current value )
Occupant/ rate (3) Regeler Luxury Total
(%) (%) (%) (%) (%) (%) (s) (%) (%) (%)
20 50 20 , 15 100 -16.9 (1932) . 70.0 51.9 68.2
25 50 20 15 100 -10.8 (1693) 70.1 54.8 68.5
30 50 20 15 100 -5.0 (1408) 70.1 58.3 68.8
30 50 20 20 100 2.0 (991) 69.7 67.4 69.4
30 70 20 20 100 12.8 (183) .69.7 67.4 69.4
30 . 90 20 15 100 14.9 (10) 70.1 58.3 68.9
25 90 20 20 100 17.4 (212) 69.6 ' 63.6 69.0
30 90 20 20 100 21.9 624 69.7 67.4 69.4
30 70 20 • 20 90 16.2 88 69.7 67.4 69.4
30 90 20 15 90 17.9 259 70.1 58.3 68.9
20 90 20 20 90 ' 16.4 124 69.6 60.4 68.7
25 90 20 20 90 20.3 477 69.6 63.6 69.0
30 90 20 20 90 24.7 . 896 69.7 67.4 69.4
20 90 • 20 20 110 , 10.2 (396) 69.6 60.4 68.7
25 90 20 20 110 14.4 (53) 69.6 63.6 69.0
30 90 20 20 110 19.0 352 69.7 67.4 69.4
Percentage higher than regular tare.
After tax
The occupancy rate of the regular service is that following the introduction of the luxury service. Without a luxury service, the occupancy rate of the regular service is estimated et 71.3%.
Double indirect only. See Figure 29 for the single indirect factor which also applies in the two return trip scenario.
86

POTENTIAL APPLICATIONS
estimating the increase in passenger levels, and thus revenues, attributable to the intro-duction of articulated coaches on this route, as well as the corresponding increase in total operating costs due ta the use of a mixed fleet of articulated and conventional coaches in comparison with the use of a homogeneous fleet of conventional coaches.
9.2.2 Methodological assumptions
Increase In passenger levels
The increase in passenger levels on the Montreal-Toronto route generated by the intro-duction of the articulated coaches was established in cooperation with the management committee for this study. Four passenger level scenarios were used (see Figure 33).
Figure 33 Passenger level scenarios on the Montreal-Toronto route
1991 1992 1993 1994 1995 1996 1997 1998 1999 2000
Base scene°
— ConventIonal 0% 0% 0% 0% 0% 0% 0% 0% 0% 0%
— Articulated 6.0% 5.0% 2.0% 1.0% 0% 0% 0% 0% 0% 0%
OptimIstic
— Conventional 0% 0% 0% 0% 0% 0% 0% 0% 0% 0% — Articulated 6.0% 5.0% 4.0% 3.0% 2.0% 1.0% 1.0% 1.0% 1.09 1.0%
PessimIstic
— Conventional 0% 0% 0% 0% 0% 0% 0% 0% 0% 0%
— Articulated. 5.0% 2.0% 0% 0% 0% 0% 0% 0% 0% 0%
Vary pessimistic
— Conventional 0% 0% 0% 0% 0% 0% 0% 0% 0% 0%
— Articulated 0% 0%' 0% 0% 0% 0% 0% 0% 0% 0%
Estimate of revenues
The estimate of revenues with a fleet of conventional coaches or a mixed fleet of conven-tional and articulated coaches is the product of the num ber of passengers and the average fare collected per passenger on the route. As in the case of the demonstration project be-tween Montreal and Quebec City, the average faré per passenger on the Montreal-Toronto route is identical for a conventional and an articulated coach, since there is no differen-tiation in the service, other than the type of coach.
87
POTENTIAL APPLICATIONS
Unit operating costs of articulated and conventlonal coaches
The economic evaluation of the Montreal-Toronto route uses the same operating costs for articulated and conventional coaches as those obtained in the demonstration project. Only direct operating costs are included in the analysis.
Calculation of distance travelled and number of trips
The methodology for the economic evaluation of the articulated coaches on the Montreal-Quebec City route was used for calculating distance travelled. This methodology enables us to determine separately the number of trips by articulated and conventional coaches while allowing us to vary the number of passengers, number of seats and type of coach (articulated or conventional) on certain specific departures.
Number of coaches required
Identification of the number of articulated and conventional coaches required is based on the schedule of use of the coaches, thetotal annual number of kilometres obtained from the calculation of distance, and an average annual distance travelled of 225 000 km per coach. The use of coaches on the Montreal-Toronto route is higher than on the Montreal-Quebec City route, since the distance is greater. Te respect the schedule of use of the articulated coaches as well as the annual distance travelled of 225 000 km, 11 coaches are necessary on the Montreal-Toronto route, including 3 spare coaches.
The number of coaches required is used for estimating the costs of permits, registration, insurance and investment.
With the total annual kilometres logged per type of coach and the number of each required, it is possible to calculate total operating costs for the scenarios of operation with conven-tional coaches and with a mixed fleet including 11 articulated coaches, and to identify the operating cost differentials between these two scenarios.
Financial assumptIons
The economic evaluation is based on a number of financial assumptions. The only as-sumptions that differ from those used for the previous analyses are:
$50 000 for the parts inventory (the only start-up cost for the articulated coaches aside from the purchase of the coaches);
no grant for the purchase of the articulated coaches;
a tax rate corresponding te an average weighting of Ontario and Quebec tax rates based on the percentage of kilometres logged in each province;
a calculation of revenues on the Montreal-Toronto route based on the average revenue per passenger on this corridor.
88
POTENTIAL APPLICATIONS
9.2.3 Results
Te conduct the economic evaluation of the articulated coaches on the Montreal-Toronto route, the viability measurements were determined on the basis of several combinations of the following basic assumptions:
number of seats (48, 51, 64 or 68);
passenger levels in the four scenarios•defined (1.e., base, optimistic, pessimistic and very pessimistic);
operating costs at 100%, 90% or 110% of estimated costs.
Supposing that a return on investment of more than 15% atter taxis required by the carrier te purchase articulated coaches for the Montreal-Toronto route, the service would be very profitable for 64 and 68-seater coaches but never viable for 48 and 51-seaters (see Figure 34). The impact of decreased comfort on passenger levels was net considered.
The occupancy rate of the two fleets is very high in ail cases. The 76.20% occupancy rate of the conventional fleet is stillhigher than that of the mixed fleet with 64 and 68-seater articu-lated coaches or when the level of passengers is very pessimistic. In ail other cases, the occupancy rate of the mixed fleet is higher than for the conventional fleet.
The economic evaluation of articulated coach service on the Montreal-Toronto route is encouraging, particularly for 64 and 68-seater coaches. The results show that the articu-lated coaches can be very profitable for regular, low-frequency service and high-density operations, even without an increase in passenger levels, as shown by the very pessimistic passenger level scenarios, which yield returns on investment of 23% and 28.8% respectively for 64 and 68-seater coaches, with operating costs equivalent to 100% of estimated costs. The more the operating costs increase for the fleet as a whole, the more it becomes viable to use 64 and 68-seater articulated coaches.
9.3 Economic evatuation of a charter service
The main objective of this analysis is te compare the use of articulated coaches with the use of conventional coaches for charter services.
9.3.1 Methodology
The approach for the economic evaluation of a charter service is different from that of the other analyses. Because the operation of a charter service is primarily focused on leasing coaches, it was necessary te calculate the "leasing rate" that an operator must charge to recover costs, including investment cost and a normal return on investment, for the two coach types.
89
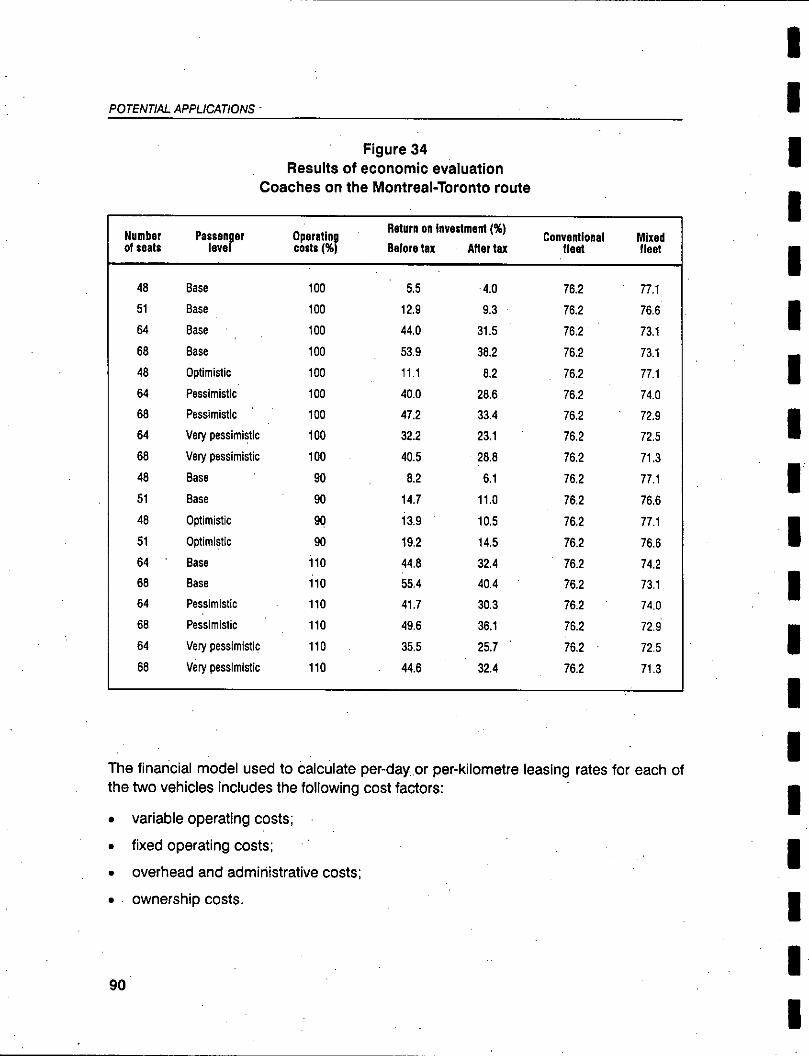
POTENTIAL APPLICATIONS
Figure 34 Results of economic evaluation
Coaches on the Montreal-Toronto route
Number of seats
Passenger levai
Operating costs (%)
Return on investment (%)
Berme tax Alter tu Conventions'
fie« Mixed fleet
48 Base 100 5.5 4.0 76.2 77.1
51 Base 100 12.9 9.3 76.2 76.6
64 Base 100 44.0 31.5 76.2 73.1
68 Base 100 53.9 38.2 76.2 73.1
48 Optimistic 100 11.1 8.2 76.2 77.1
64 Pessimiste 100 40.0 28.6 76.2 74.0
68 Pessimiste . 100 47.2 33.4 76.2 72.9
64 Very pessimiste 100 32.2 23.1 76.2 72.5
68 Very pessimistic 100 40.5 28.8 76.2 71.3
48 Base 90 8.2 6.1 762 77.1
51 Base 90 14.7 11.0 76.2 76.6
48 Optimistic 90 13.9 10.5 76.2 77.1
51 Optimiste 90 19.2 14.5 76.2 76.6
64 Base 110 44.8 32.4 76.2 74.2
68 Base 110 55.4 40.4 76.2 731
64 Pessimiste 110 41.7 30.3 76.2 74.0
68 Pessimistic 110 49.6 36.1 76.2 72.9
64 Very pessimistic 110 35.5 25.7 76.2 72.5
68 Very pessimiste 110 44.6 32.4 76.2 71.3
The financial model used to calculate per-day or per-kilometre leasing rates for each of the two vehicles includes the following cost factors:
variable operating costs;
fixed operating costs;
overhead and administrative costs;
ownership costs.
90
POTEIVTIAL APPLICATIONS
9.3.2 Financial assumptions
The following main financial assumptions were used:
Purchase cost, articulated coach $540 000
- Purchase cost, conventional coach $275 000
Required return on investment 15%
Useful life of equipment 10 years
Capital cost allowance 30%
- lncome tax 35.1%
- Residual value 20%
Number of days' activity or service per year 275 days
- Average kilometres logged per day 350 km
9.3.3 Results
The analysis shows that the articulated coach offers economic advantages for a charter service even though operating costs are higher than for a conventional coach on a per-day or per-kilometre basis. According te the results, the articulated coach must impose a supplement of approximately 35% over the conventional coach to achieve the same profitability.
There are two advantages to the articulated coach:
the cost per seat-kilometre may be less than for the conventional coach for several group sizes (see Figure 35), particularly in the . case of 64- and 68-seater coaches (see Figure 36);
for markets where the main considerations are comfort and spaciousness and where price is a secondary factor, articulated coach service could be viable.
91
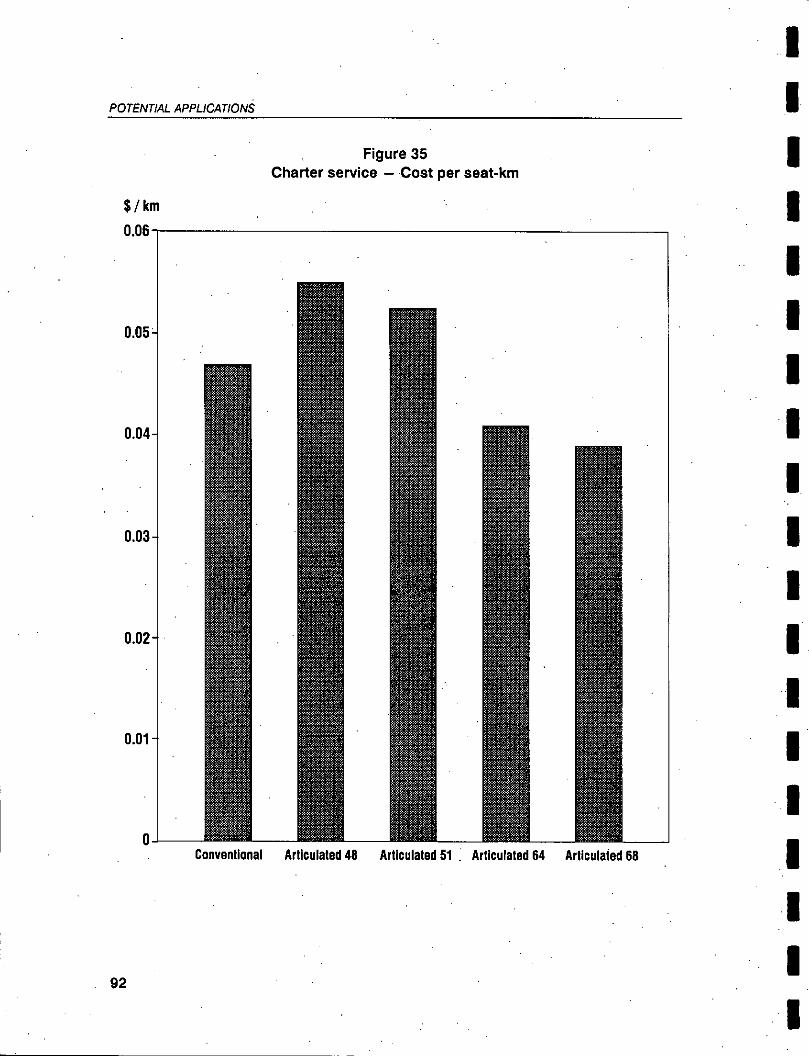
POTENTIAL APPLICATION
Figure 35 Charter service — •Cost per seat-km
$ / km
0.06
0.05
0.04
0.03
0.02
0.01
0 Conventional Articulated 48 Articulated 51 . Articulated 64 Articulated 68
92

$ / passenger•km
0.14
0.12-
Articulated 68 seats
0.10
0.08
0.06 -------
Conventional
0.04
0.02
o 20
30 40 50 60 70 80 90 100
POTENTIAL APPLICATIONS
Figure 36 Charter service — Cost per seat-km for various group sizes
Size of group
93
10. CONCLUSIONS
The overall results of the H5-60 articulated coach demonstration project are positive: the vehicle is a technical success, and the volume of clientele increased in the Montreal-Quebec City corridor during the demonstration period. Following analysis, however, it appears that use of the 48-seat articulated coach cannot be justified financially on the Montreal-Quebec City route in current operating conditions for a regular service. To be viable, the articulated coach must have more seats, or be used in a corridor with different characteristics or for purposes other than scheduled intercity service.
For the purposes of the demonstration, Voyageur Inc. and Orléans Express Inc. chose vehicles equipped with 48 seats in order to stop the erosion of their market share in the Montreal-Quebec City corridor by enhancing passenger comfort by means of a high-capacity, technically innovative, reliable and cost-effective coach. Prévost Car Inc.'s H5-60 articulated coach can, however, have 48 te 71 seatsl depending on vehicle configu-ration and the comfort desired.
10.1 Results of the technical assessment
The objective of the demonstration project was ta assess the technical viability of the H5-60 coach, its reliability, the implications of its introduction on maintenance and operations, and the feasibility of using it in commercial service on a scheduled route, and to deter-mine the reactions of drivers and maintenance personnel.
ln terms of technical reliability, the articulated coach performed particularly well. Each articulated coach logged an average of 366 000 km during the demonstration, or some 3 600 km per coach per week, compared with 3 750 km per week for the conventional coaches used as a contrai group. Several aspects of the vehicles were appreciated: city and autoroute handling, roadholding, suspension, effectiveness of the anti-lock braking system, and the durability and power of the engine. The articulation was reliable and effective. The stability of the rear section was considered satisfactory, but may be improved, and In fact has been improved on one of the vehicles. Several of the technical problems that arase during the demonstration were corrected by Prévost Car Inc., the manufacturer of the coach; indeed, Prévost worked constantly te resolve them. Most of these problems were caused by the new materials and components used te manufacture the vehicle, not by its design.
I The studies conducted within the framework of the demonstration considered a maximum of 68 seats.
94
CONCLUSIONS
The technical assessment of the coach made it possible to highlight the maintenance and operating cost differentials between the two types of coaches. For the articulated coach, it is estimated that net operating costs (maintenance, fuel and lubrication) in the medium term will be 35% higher than for the Mirage XL; this corresponds closely to Prévost's estimates. Given the number of seats, 48 seats for the articulated coach compared with 43 seats for the conventional coach, the net operating cost (maintenance, fuel and lubrica-tion) per seat is 22% higher for the articulated coach. If a 64-seater articulated coach were considered, the operating cost would then be 14% lower than for the conventional coach.
Drivers, while not unanimous, considered the articulated coach superior to the conven-tional coach. Maintenance personnel also consider the articulated coach to be superior overall, while expressing certain reservations concerning long-term maintenance and the durability of specific components.
Building on this experience, Prévost Car Inc. was able to develop a 12.2 m (40 feet) coach model, the H3-40, using the same structure and materlals as the 115-60.
10.2 Clientele
Another objective of the demonstration project was to measure the response of present and potential clientele, as well as changes in this response, to the articulated coaches during the demonstration.
In this regard, the demonstration results were also positive. The H5-60 coach not only stopped the erosion of the carrier's market share in the Montreal-Quebec City corridor, it also increased passenger levels by 6%.
At the end of the demonstration in 1990, the articulated coach service helped to attract or hold the loyalty of approximately 23% of Orléans Express's current clientele, compared with 16% one year atter the start of the demonstration, in 1989. However, those attracted or held were flot primarily business clientele, as had been the case in 1989.
The surveys conducted throughout the demonstration showed to what extent comfort and spaciousness on board the articulated coach were appreciated by the clientele, particularly business travellers.
Nonetheless, the real net impact of the articulated coach is difficult, if not impossible, to determine. On the one hand, the conditions which would have prevailed in the absence of an articulated coach are obviously not known. On the other hand, the strike of the carriers employees and the anticipated sale of Voyageur's assets limited the marketing program during the demonstration, and affected both the attraction of the coach for potential clientele and the passenger levels in the Montreal-Quebec City corridor. It may,
95

CONCLUSIONS
therefore, be concluded that the carrier largely succeeded in being able to increase its passenger levels by using an articulated coach with 48 seats, that is, with more space per passenger and greater comfort.
10.3 Viability
The goal of the economic evaluation studies was to evaluate the viability of the Montreal-Quebec City service and other potentiel uses of the articulated coaches compared with conventional coach services, and te evaluate the impact of the nu mber and arrangement of seats on the viability of the articulated coach.
The economic evaluation of the demonstration project and the three potentiel applications studied show that the articulated coach could be viable in certain specific markets. The application with the greatest potentiel is scheduled operation with low-frequency service and high density (more passengers per departure), like the Montreal-Toronto route. The articulated coach could aise find a substantiel market in charter services, provided the size of groups justifies the use of such a vehide or the comfort level justifies a cost increase per passenger. The results of the evaluation of the luxury service are less conclusive.
For ail the applications, except the luxury service the number of seats in the articulated coaches is the most important factor affecting viability. The second most important factor influencing the viability is the increase in passenger levels attributable to the introduction of the articulated coaches This is also the hardest factor te assess.
10.3.1 Viability of services offered within the framework of the demonstration
Despite the technical reliability of the articulated coach and the marked interest of clientele in this vehicle, it is concluded that the use of a 48-seater coach cannot be financially justified in the conditions currently prevailing in the Montreal-Quebec City corridor, on the basis of various scenarios for changes in passenger levels. The demonstration yielded an after-tax return on investment of a mere 0.3% over a 10-year analysis period, for an anticipated 6.1% rise in passenger levels. The return on investment rate considered acceptable is 15% atter tax.
10.3.2 Impact of the number and arrangement of seats
Te increase the viability of the route using articulated coaches, Orléans Express added three seats te a number of articulated coaches toward the end of the demonstration. The total number of seats thus went from 48 to 51, with one additional row. Profitability over 10 years would theoretically increase to 8%, without any negative impact on passenger levels since the same configuration of three seats per row is maintained. The economic
96

CONCLUSIONS
evaluation also shows that the articulated coaches equipped with more seats (for instance, 64 seats or more) offer the greatest potential for viable service. But it is impossible to assess the impact of the loss of space and comfort on passenger levels with 64- and 68-seater coaches. Considering the comfort aspect alone, one may, however, assume that operating 68-seater arliculated coaches would result in current passenger levels being held steady. The articulated coaches with fewer seats (for instance, 48 seats) appear to be better geared for specialized service (e.g., luxury service, tourism service) where comfort and spacious-ness are important te passengers.
10.3.3 Viability of potentiel uses
A luxury service between Montreal and Quebec City, a high-density, low-frequency service between Montreal and Toronto, and a charter service were the subject of a special analysis within the context of the project.
The results of the economic evaluation of a luxury service on the Montreal-Quebec City route, using assumptions employed in the analysis, are net very positive and do net justify the acquisition of articulated coaches. Very optimistic passenger levels combined with a fare levai 90% higher than regular fares are necessary for the luxury service on the Montreal-Quebec City route te be viable. It should also be noted that optimistic passenger levels and high fares have contradictory impacts.
The results of the economic evaluation for a high-density, low-frequency route such as Montreal-Toronto are very encouraging for high-capacity (64- and 68-seats) articulated coaches. The high-capacity coaches allow for considerably reduced operating costs per passenger and returns on investment substantially higher than 15%, despite no increase in passenger levels.
The results of the economic evaluation of a charter service show that the articulated coach offers advantages, but that it must impose a supplement of approximately 35% over the conventional coach to achieve the same profitability as a conventional coach. Depending on the size of the group, the cost per seat-kilometre may be less than for the conventional coach. Markets where the main considerations are comfort and spaciousness, and price is secondary, also represent a potential but limited market for the articulated coach in charter service.
10.4 Impact of the articulated coach on modal split in the Montreal-Quebec City corridor
Other objectives of the demonstra. tion project were te assess the contribution of the articulated coaches te the efficiency and performance of the passenger transportation system in Quebec and te evaluate its impact on choice of mode.
97
CONCLUSIONS
The segmentation study conducted from surveys in June 1988 showed that the total volume of trips with origin and destination in the immediate areas of Montreal and Quebec City was 6 million per year. The vast majority (87.4%) were by automobile, followed by the bus with 7.8%, with the remainder split between the plane and the train. This study showed, among other things, that the market is very homogeneous and that the bus is the transportation mode with the least loyal clientele.
On-board surveys and group interviews revealed that the articulated coach service helped to attract a new cl ientele and to hold the loyalty of coach users; this translated into an actual increase in passenger levels of 4.71% in 1989 and 1.7% in 1990. While encouraging, such increases were not sufficient to Identity a possible shift of clientele frorn one transportation mode to another, given the margin of errer of the initial modal split study based on a mail-in questionnaire.
10.5 Outlook
Intercity bus transportation has sustained major losses in passenger levels since 1980. The articulated coach showed that by improving passenger comfort it is possible to keep the existing clientele and even to attract a new clientele. The demonstration served to improve the image of intercity transportation and its quality of service.
The extensive use of articulated coaches on aine service allowed the coach transportation industry te become aware of the technical merits of the vehicle. For the manufacturer, the experience made it possible to develop a new vehicle of conventional length, built in the same workshops.
The key factors in the future success of the vehicle are capacity and comfort. On a line service, viability may essentially be ensured by taking advantage of the additional capacity offered by the vehicle. Otherwise, the articulated coach must target markets where comfort, and not lares, is the fundamental criterion affecting users' choice.
98
BIBLIOGRAPHY
Lalonde, Valois, Lamarre, Valois et associés Inc., Évaluation technique des autocars arti-culés l-I5-60 / Rapport d'étape I (Technical assessment of the H5-60 articulated coaches / Progress report l), June 1989, 44 p.
Lalonde, Valois, Lamarre, Valois et associés Inc., Évaluation technique des autocars arti-culés H5-60 / Rapport d'étape Il (Technical assessment of the H5-60 articulated coaches / Progress report II), November 1989, 51 p.
Lalonde, Valois, Lamarre, Valois et associés Inc., Évaluation technique des autocars arti-culés H5-60 / Rapport final — préliminaire (Technical assessment of the H5-60 articulated coaches / Final report — preliminary), February 1991, 80 p.
Lavalin/Transport Canada, Transportation Development Centre, Étude de segmentation du marché dans le corridor Montréal/Québec. Rapport d'étape no.1 (Market segmentation study of the Montreal-Quebec City corridor. Progress report I), September 1989,5 p. and Appendices 1, 2.1, 2.2 and 3
Lavali «Transport Canada, Transportation Development Centre, Étude de segmentation du marché dans le corridor MontréallQuébec. Addendum (Market segmentation study of the Montreal-Quebec City corridor. Addendum), ,December 20, 1989, 3 p.
Laval in/Transport Canada, Transportation Development Centre, Étude de segmentation du marché dans le corridor Montréal/Québec, procédures de traitement (Market segmenta- tion study of the Montreal-Quebec City corridor. Processing procedures), April 1990, n.p.
Peat, Marwick, Stevenson & Kellogg, Évaluation économique d'autocars articulés / projet de démonstration. Rapport d'étape ll (Economic evaluation of articulated coaches. Demonstration project. Progress report II), October 1989, 27 p.
Peat, Marwick, Stevenson & Kellogg, Évaluation économique d'autocars articulés / projet de démonstration. Rapport final (Economic evaluation of articulated coaches. Demon-stration project. Final report), April 30, 1991, 61 p. (confidential)
Prévost Car Inc., Articulated highway coach H5-60 (specifications), March 1990, n.p. (confidential)
Prévost Car Inc., Mirage XL / spécifications techniques (Mirage XL. Technical specifi-cations), May 1, 1990, 6 p. plus Appendix of 35 p. (confidential)
Prévost Car Inc., H5-60, manuel de l'opérateur (H5-60 operator's manual), n.d., n.p.
Sécor Inc., Enquête suries modes de transport utilisés dans le corridor Montréal/Québec (Survey on transportation modes used in the Montreal-Quebec City corridor), October 1989, 195 p. and Appendices 1 and 2 (confidential)
99
BIBLIOGRAPHY
Sorécom Inc., Voyageur inc. OMNIBUS — mars 1989 (Voyageur Inc. omnibus survey. March 1989), March 1989, 6 p. (confidentiel)
Sorécom Inc., VoyageurIOMNIBUS, tableaux informatiques — Volume! (Voyageur omni-bus survey, data tables — Vol. 1), March 1989, 10 p. (confidentiel)
Sorécom Inc., Les autocars articulés: impact et évaluation du service auprès de la clientèle du corridor Montréal/Québec (Articulated coaches: impact and evaluation of service, clientele of the Montreal-Quebec City corridor), April 1989, 38 p. (confidentiel)
Sorécom Inc., Rapport sur l'évaluation des perceptions et des attentes des usagers et des non-usagers de Voyageur entre Montréal et Québec suite à six rencontres de groupe (Report on the evaluation of perceptions and expectations of Voyageur users and non-users between Montreal and Quebec City), September 1990, 40 p. (confidentiel)
Sorécom Inc., Analyses complémentaires sur l'impact et l'évaluation du service auprès de la clientèle des autocars articulés du corridor Montréal/Québec (Further analyses of the impact and evaluation of service, articulated coach clientele of the Montreal-Quebec City corridor), October 1989, 31 p. (confidentiel)
Spectral Marketing Inc., Les autocars articulés : impact et évaluation du service auprès de la clientèle du corridor Montréal/Québec à l'automne 1990 (Articulated coaches: impact and evaluation of service, clientele of the Montreal-Quebec City corridor, fall 1990), November 1990, 46 p. (confidentiel)
Spectral Marketing Inc., Évaluation du service actuel et potentiel des autocars articulés dans le corridor Montréal/Québec par des voyageurs et des décideurs d'entreprises de la région de Montréal (Evaluation of existing and potentiel articulated coach service in the Montreal-Quebec City corridor by travellers and corporate decision-makers in the Montreal area), December 1990, 35 p. (confidentiel)
Voyageur Inc. , Rapport d'évaluation et d'épreuves d'endurance du prototype de l'autocar articulé H5-60 de Prévost Car — Phase I (Evaluation and endurance testing report, Prévost Car H5-60 articulated coach prototype — Phase I), March 1987, 126 p.
100

Bibliotheque du Mir istère des Transports
QTR A 029 411