Embed Size (px)
Citation preview
Demonstration of a Marine Biodiversity Observation Network (M-BON) in collaboration with the National Marine
Sanctuary Program
Leads: F. Muller-Karger University of South Florida (USF)F. Chavez Monterey Bay Aquarium
Research Institute (MBARI)
Co-PI’s: S. Doney, M. Kavanaugh,E. Montes, S. Gittings
Partners: (14+ collaborating institutions) M. Breitbart, L. Rosenfeld, M. Tartt,K. Thompson, M. Howard, B. Kirkpatrick,S. Donahue, A. DeVogelaere, J. Brown,J. Field, S. Bograd, E. Hazen, A. Boehm,K. O'Keife, G. Graettinger, J. Lamkin,B. Muhling, E. (Libby) Johns, M. Roffer
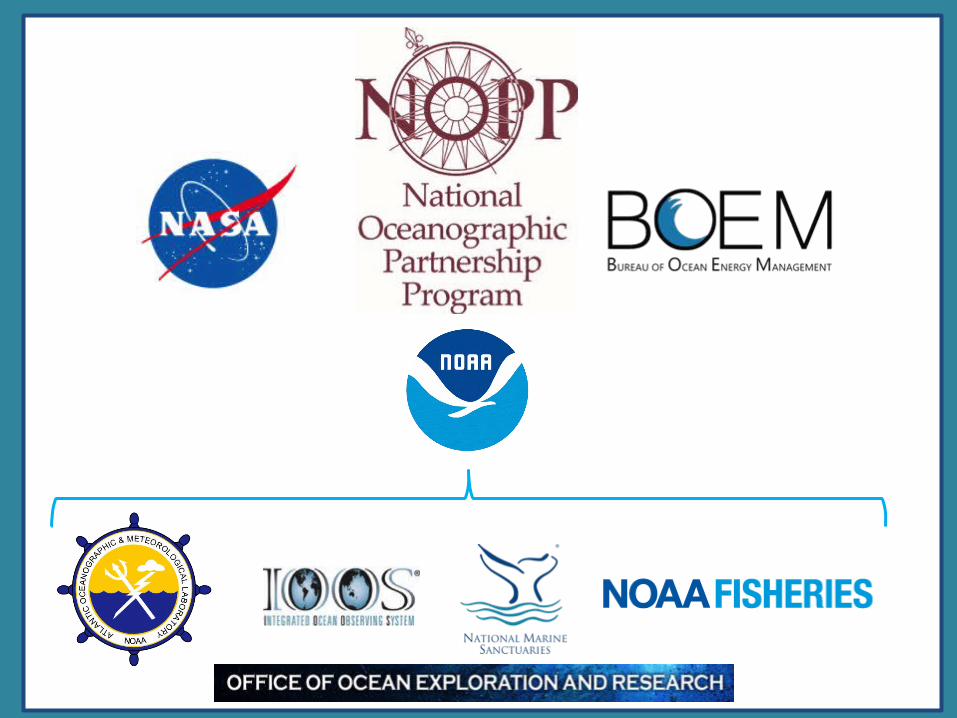
Florida Keys
Monterey Bay
Channel Islands
Chukchi Sea
IOOS MBON Demonstration
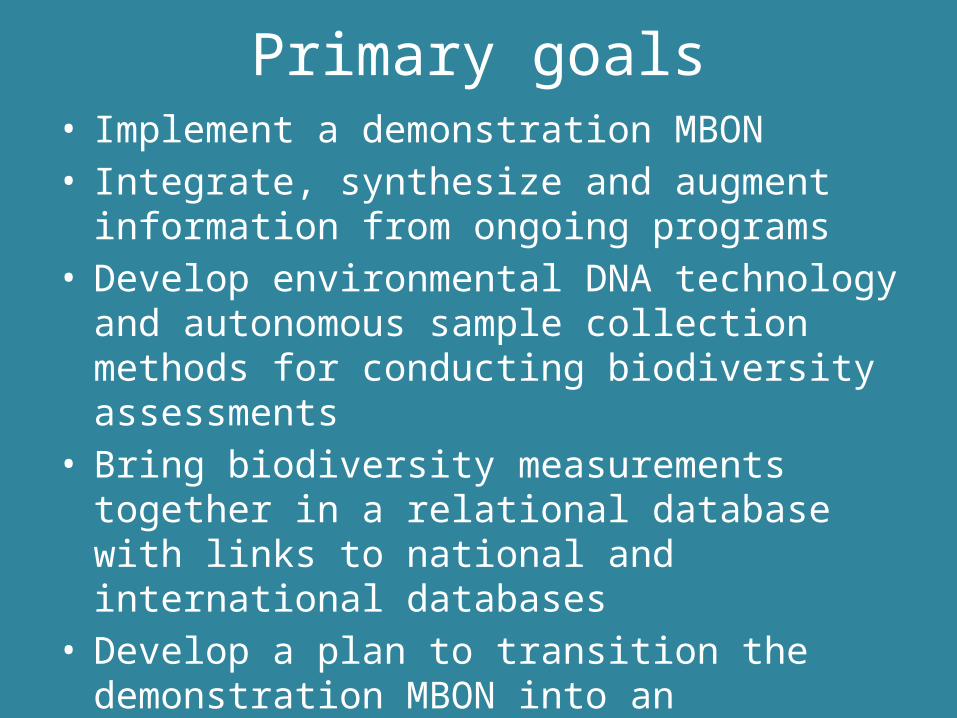
Primary goals• Implement a demonstration MBON• Integrate, synthesize and augment information from
ongoing programs• Develop environmental DNA technology and
autonomous sample collection methods for conducting biodiversity assessments
• Bring biodiversity measurements together in a relational database with links to national and international databases
• Develop a plan to transition the demonstration MBON into an operational system
• Link with international programs (GEO BON)
Critical Issues
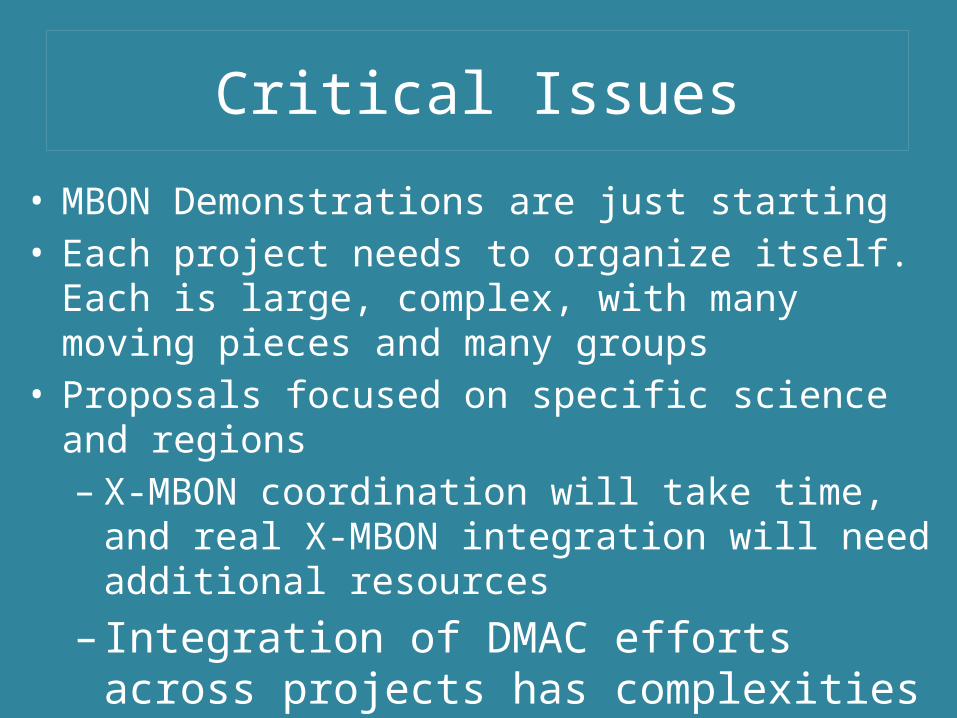
• MBON Demonstrations are just starting• Each project needs to organize itself. Each is large,
complex, with many moving pieces and many groups• Proposals focused on specific science and regions
– X-MBON coordination will take time, and real X-MBON integration will need additional resources
– Integration of DMAC efforts across projects has complexities and costs that were not expected
– Coordination/integration with GEOBON is complex and GEOBON WG5 (marine ecosystems) has no resources
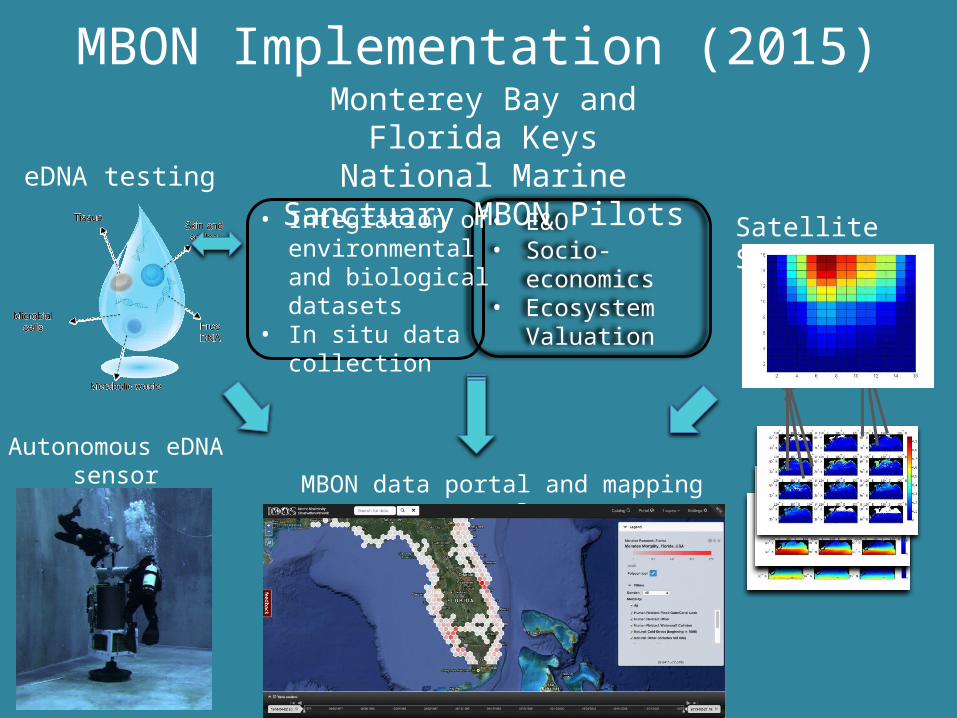
eDNA testing
• E&O• Socio-economics• Ecosystem
Valuation
MBON data portal and mapping tool
• Integration of environmental and biological datasets
• In situ data collection
MBON Implementation (2015)Monterey Bay and Florida Keys
National Marine Sanctuary MBON Pilots
Satellite Seascapes
Autonomous eDNA sensor
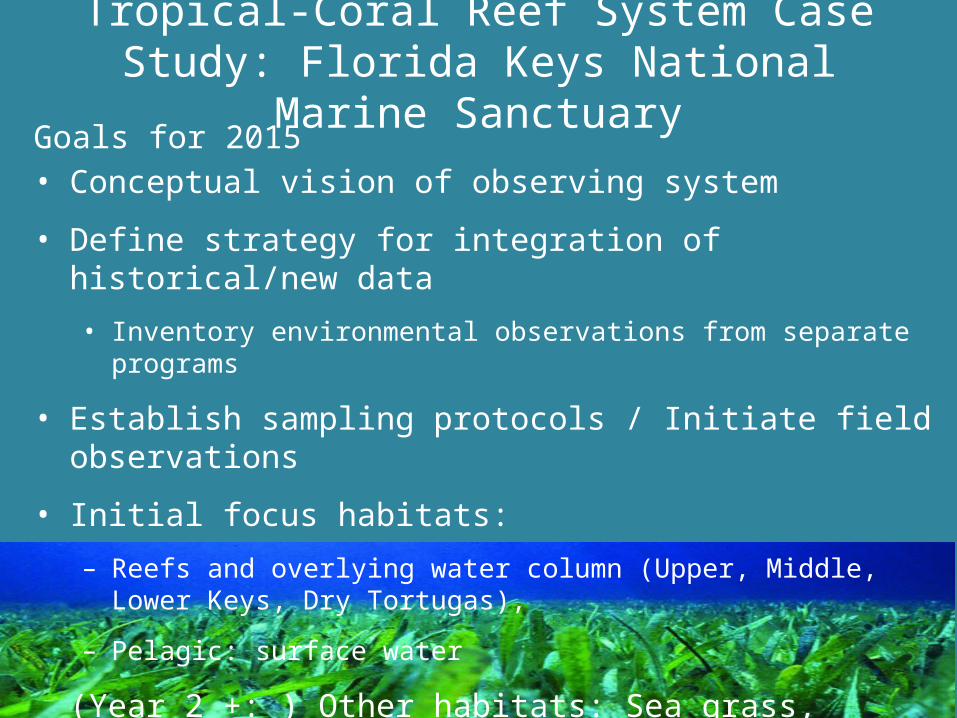
Tropical-Coral Reef System Case Study: Florida Keys National Marine Sanctuary
Goals for 2015• Conceptual vision of observing system
• Define strategy for integration of historical/new data
• Inventory environmental observations from separate programs
• Establish sampling protocols / Initiate field observations
• Initial focus habitats:
– Reefs and overlying water column (Upper, Middle, Lower Keys, Dry Tortugas),
– Pelagic: surface water
(Year 2 +: ) Other habitats: Sea grass, mangroves, hard bottom, +?
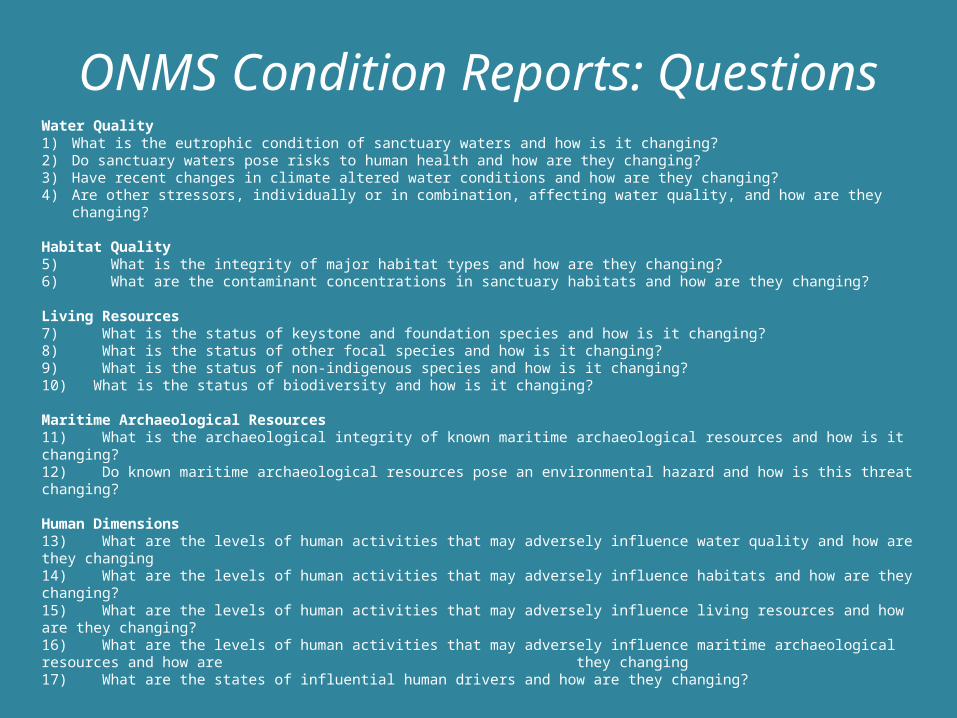
ONMS Condition Reports: QuestionsWater Quality1) What is the eutrophic condition of sanctuary waters and how is it changing? 2) Do sanctuary waters pose risks to human health and how are they changing? 3) Have recent changes in climate altered water conditions and how are they changing?4) Are other stressors, individually or in combination, affecting water quality, and how are they changing?
Habitat Quality5) What is the integrity of major habitat types and how are they changing?6) What are the contaminant concentrations in sanctuary habitats and how are they changing?
Living Resources7) What is the status of keystone and foundation species and how is it changing?8) What is the status of other focal species and how is it changing?9) What is the status of non-indigenous species and how is it changing? 10) What is the status of biodiversity and how is it changing?
Maritime Archaeological Resources 11) What is the archaeological integrity of known maritime archaeological resources and how is it changing?12) Do known maritime archaeological resources pose an environmental hazard and how is this threat changing?
Human Dimensions13) What are the levels of human activities that may adversely influence water quality and how are they changing14) What are the levels of human activities that may adversely influence habitats and how are they changing?15) What are the levels of human activities that may adversely influence living resources and how are they changing?16) What are the levels of human activities that may adversely influence maritime archaeological resources and how are they changing17) What are the states of influential human drivers and how are they changing?
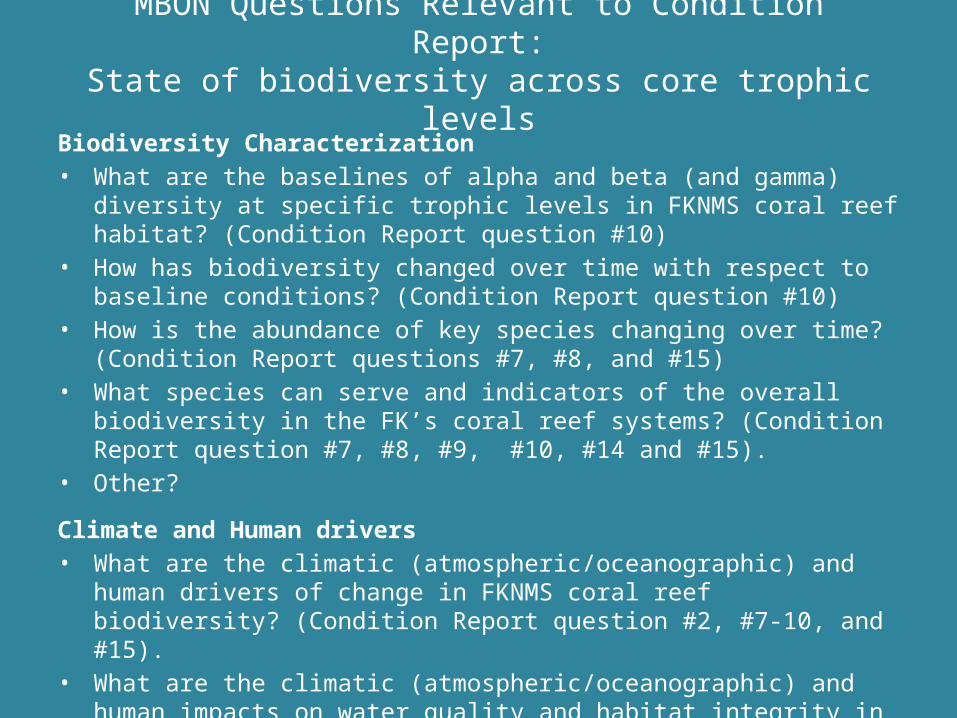
MBON Questions Relevant to Condition Report:State of biodiversity across core trophic levels
Biodiversity Characterization• What are the baselines of alpha and beta (and gamma) diversity at specific trophic
levels in FKNMS coral reef habitat? (Condition Report question #10)• How has biodiversity changed over time with respect to baseline conditions?
(Condition Report question #10)• How is the abundance of key species changing over time? (Condition Report
questions #7, #8, and #15)• What species can serve and indicators of the overall biodiversity in the FK’s coral
reef systems? (Condition Report question #7, #8, #9, #10, #14 and #15).• Other?
Climate and Human drivers• What are the climatic (atmospheric/oceanographic) and human drivers of change
in FKNMS coral reef biodiversity? (Condition Report question #2, #7-10, and #15).• What are the climatic (atmospheric/oceanographic) and human impacts on water
quality and habitat integrity in FK’s coral reefs? (Condition Report question #2, #3).• Other?
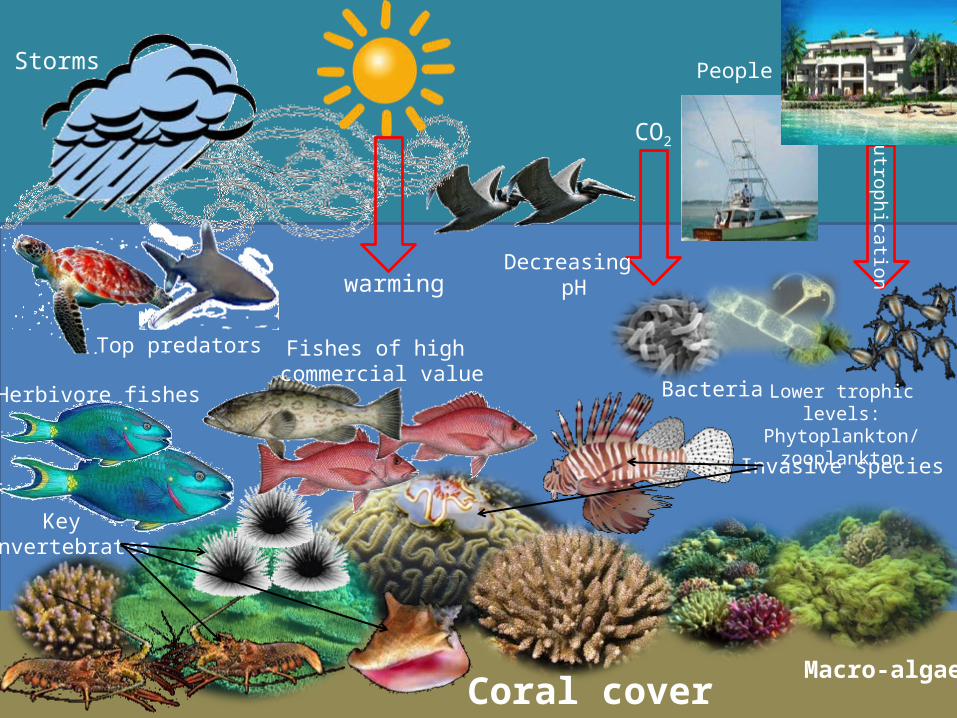
Eutrophication
Invasive species
Herbivore fishes
Key invertebrates
CO2
Decreasing pHwarming
People
Fishes of high commercial value
Storms
Coral coverMacro-algae
Bacteria Lower trophic levels:Phytoplankton/zooplankton
Top predators
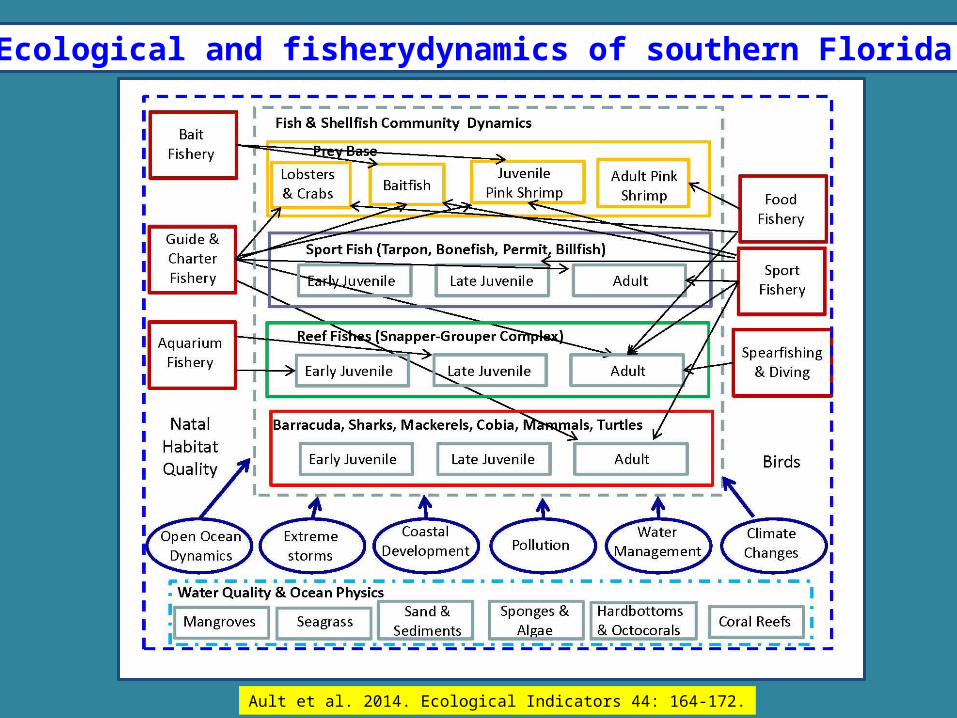
Ecological and fisherydynamics of southern Florida
Ault et al. 2014. Ecological Indicators 44: 164-172.
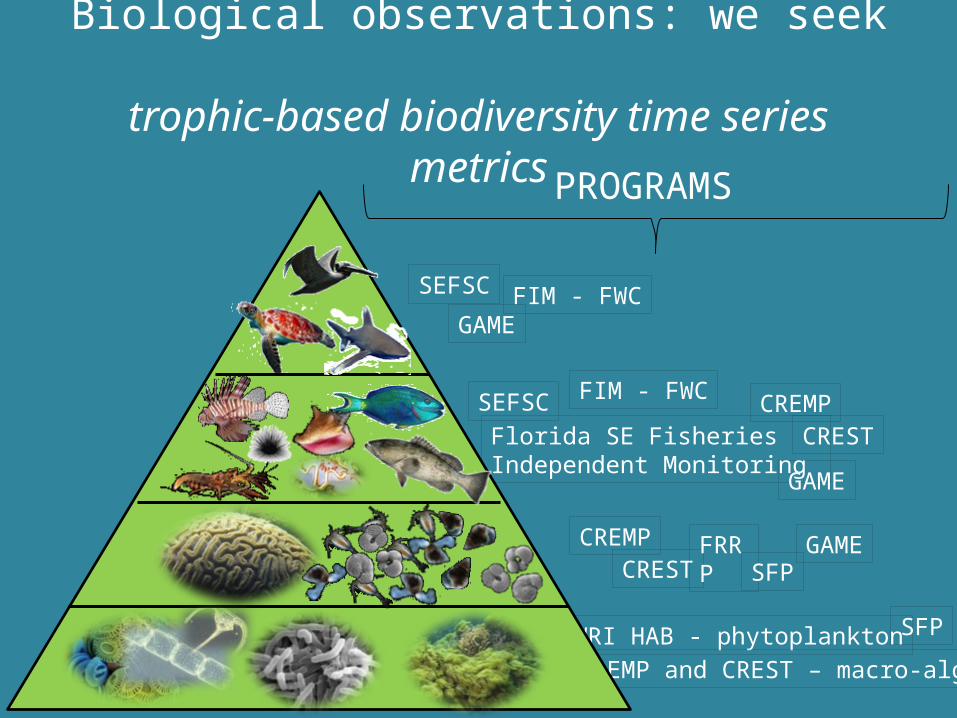
Biological observations: we seek trophic-based biodiversity time series metrics
CREMPCREST
FWRI HAB - phytoplanktonCREMP and CREST – macro-algae
SEFSC
SEFSC
FRRP
Florida SE Fisheries Independent Monitoring
CREMPCREST
SFP
SFP
GAME
GAME
GAME
FIM - FWC
FIM - FWC
PROGRAMS
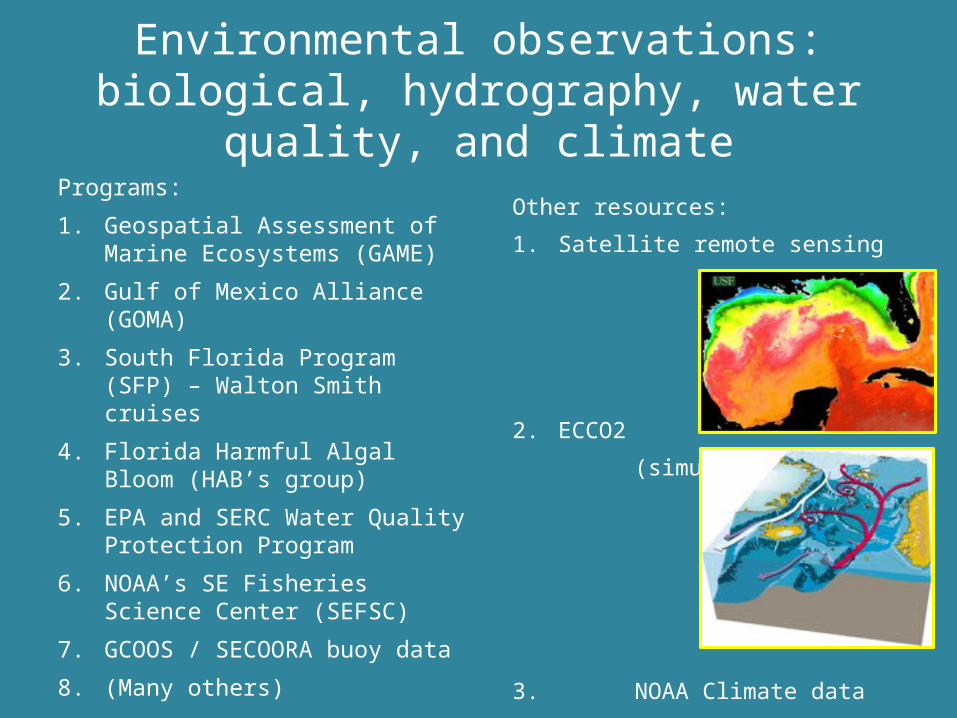
Programs:
1. Geospatial Assessment of Marine Ecosystems (GAME)
2. Gulf of Mexico Alliance (GOMA)
3. South Florida Program (SFP) – Walton Smith cruises
4. Florida Harmful Algal Bloom (HAB’s group)
5. EPA and SERC Water Quality Protection Program
6. NOAA’s SE Fisheries Science Center (SEFSC)
7. GCOOS / SECOORA buoy data
8. (Many others)
Environmental observations:biological, hydrography, water quality, and
climateOther resources:
1. Satellite remote sensing
2. ECCO2
(simulation)
3. NOAA Climate data
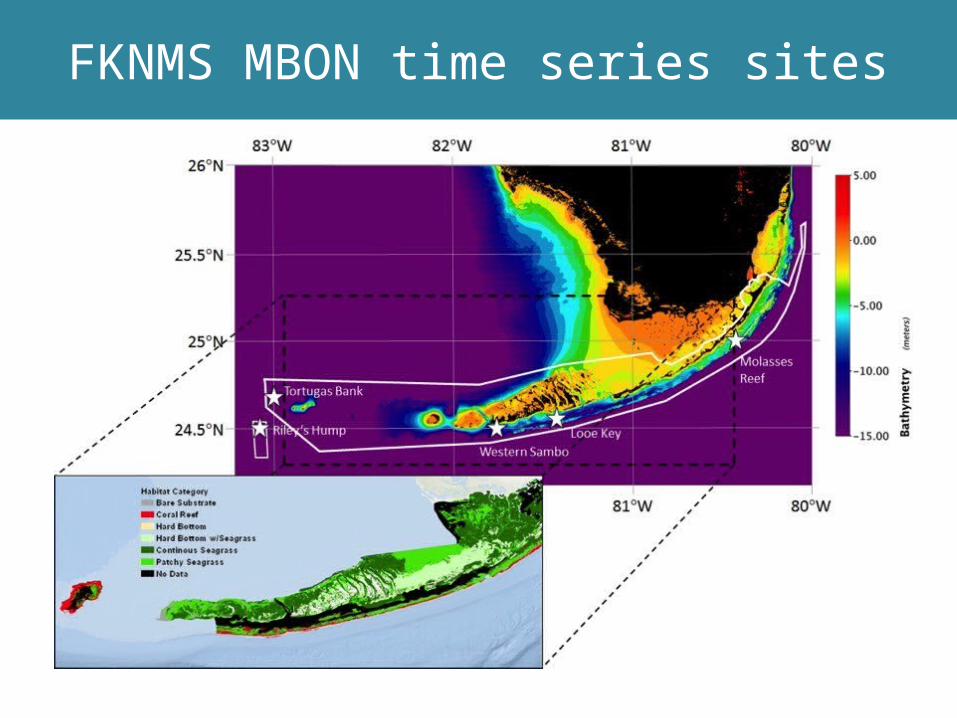
FKNMS MBON time series sites
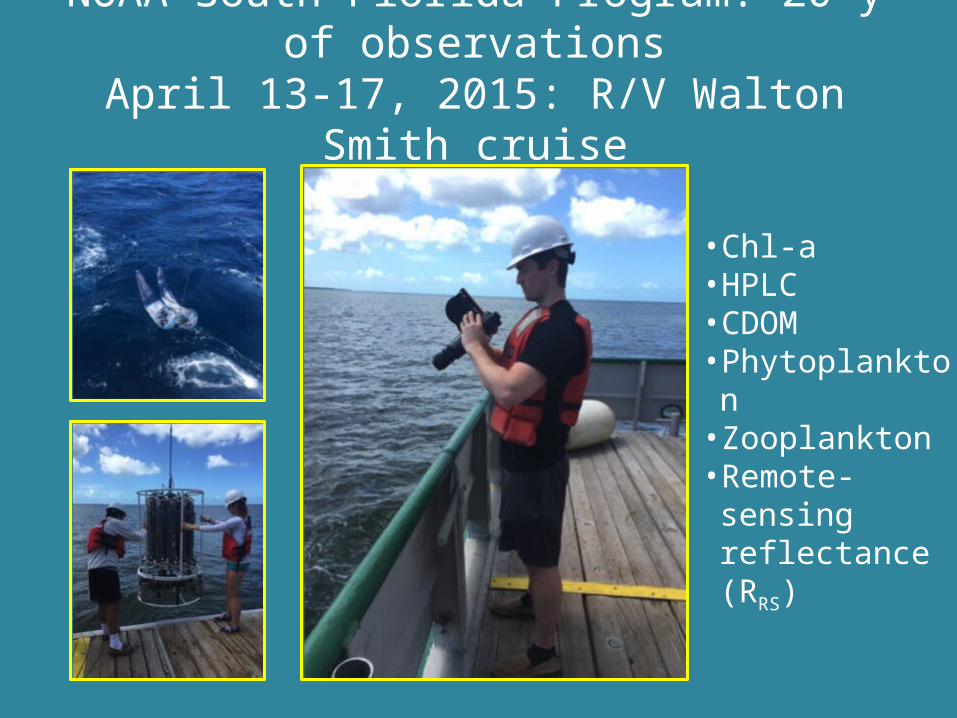
NOAA South Florida Program: 20 y of observationsApril 13-17, 2015: R/V Walton Smith cruise
• Chl-a• HPLC• CDOM• Phytoplankton• Zooplankton• Remote-sensing
reflectance (RRS)
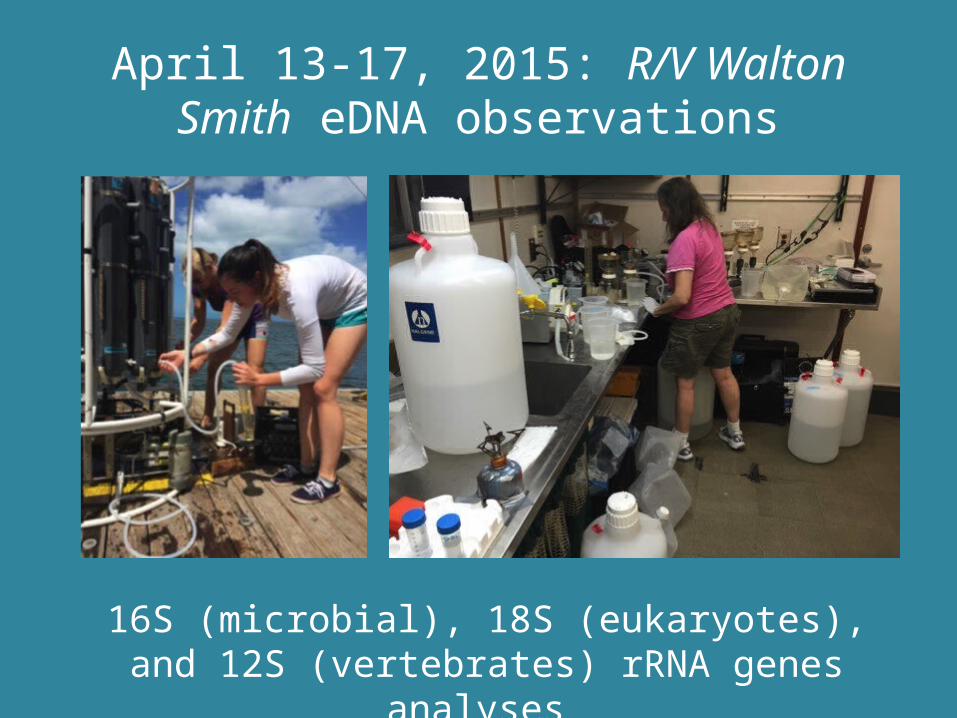
16S (microbial), 18S (eukaryotes), and 12S (vertebrates) rRNA genes analyses
April 13-17, 2015: R/V Walton Smith eDNA observations
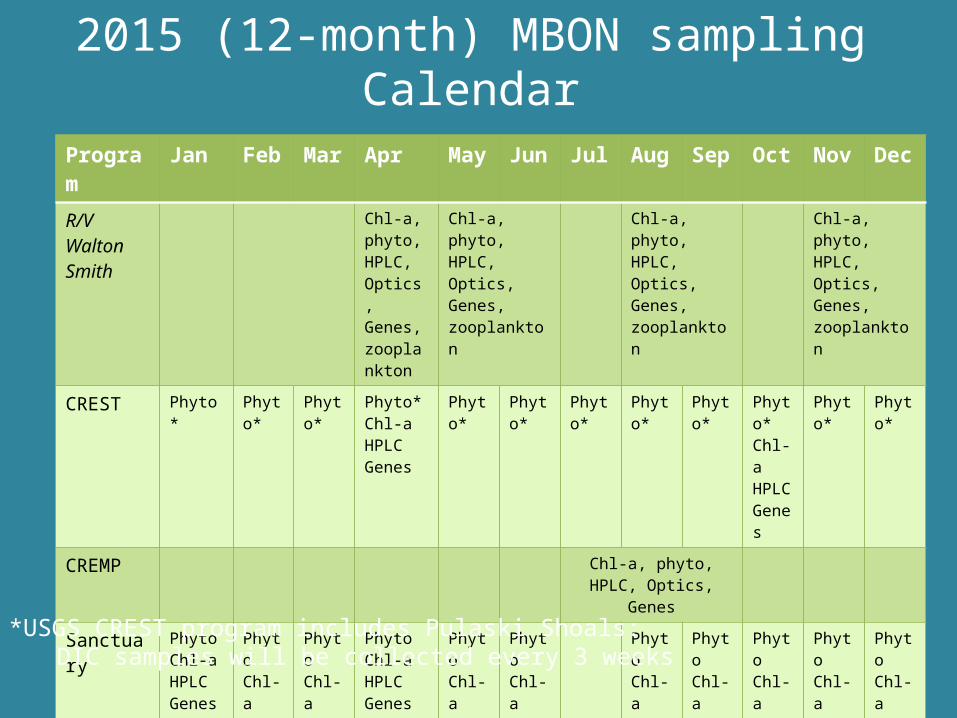
2015 (12-month) MBON sampling Calendar
Program Jan Feb Mar Apr May Jun Jul Aug Sep Oct Nov Dec
R/V Walton Smith
Chl-a, phyto,HPLC, Optics,Genes, zooplankton
Chl-a, phyto, HPLC, Optics, Genes, zooplankton
Chl-a, phyto,HPLC, Optics,Genes, zooplankton
Chl-a, phyto,HPLC, Optics,Genes, zooplankton
CREST Phyto* Phyto*
Phyto*
Phyto*Chl-aHPLCGenes
Phyto*
Phyto*
Phyto*
Phyto*
Phyto*
Phyto*Chl-aHPLCGenes
Phyto*
Phyto*
CREMP Chl-a, phyto, HPLC, Optics,Genes
Sanctuary PhytoChl-aHPLCGenes
PhytoChl-aHPLCGenes
PhytoChl-aHPLCGenes
PhytoChl-aHPLCGenes
PhytoChl-aHPLCGenes
PhytoChl-aHPLCGenes
PhytoChl-aHPLCGenes
PhytoChl-aHPLCGenes
PhytoChl-aHPLCGenes
PhytoChl-aHPLCGenes
PhytoChl-aHPLCGenes
*USGS CREST program includes Pulaski Shoals:DIC samples will be collected every 3 weeks
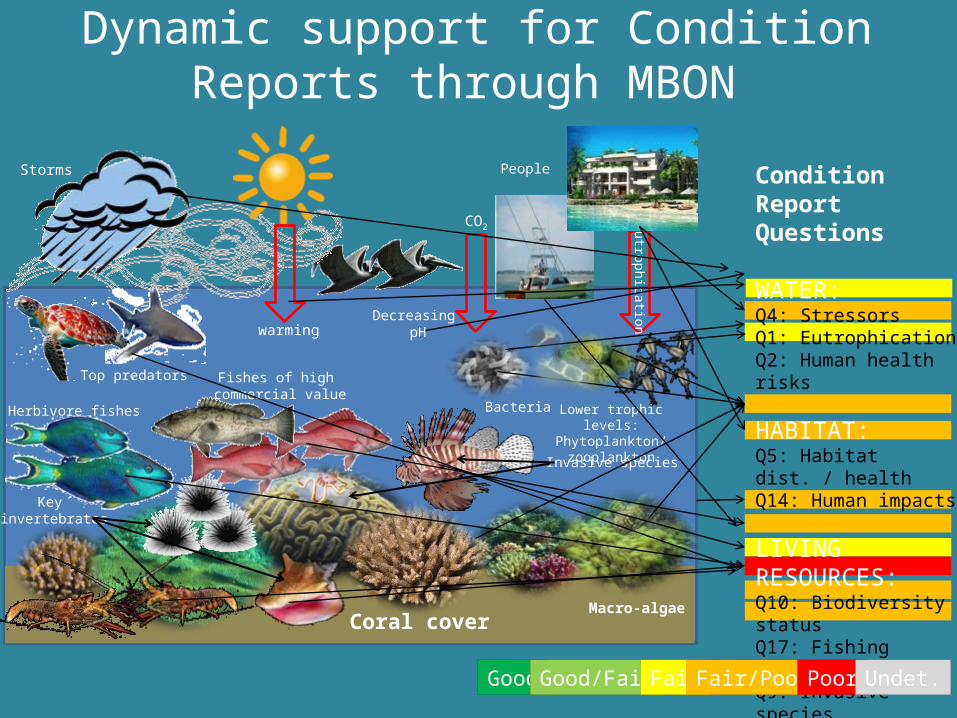
Condition Report Questions
WATER:Q4: StressorsQ1: EutrophicationQ2: Human health risks
HABITAT:Q5: Habitat dist. / healthQ14: Human impacts
LIVING RESOURCES:Q10: Biodiversity statusQ17: Fishing statusQ9: Invasive speciesQ7: Keystone speciesQ8: Focal speciesQ17: Human impacts
Eutrophication
Invasive species
Herbivore fishes
Key invertebrates
CO2
Decreasing pHwarming
People
Fishes of high commercial value
Storms
Coral coverMacro-algae
Bacteria Lower trophic levels:Phytoplankton/zooplankton
Top predators
Good Good/Fair Fair Fair/Poor Poor Undet.
Dynamic support for Condition Reports through MBON
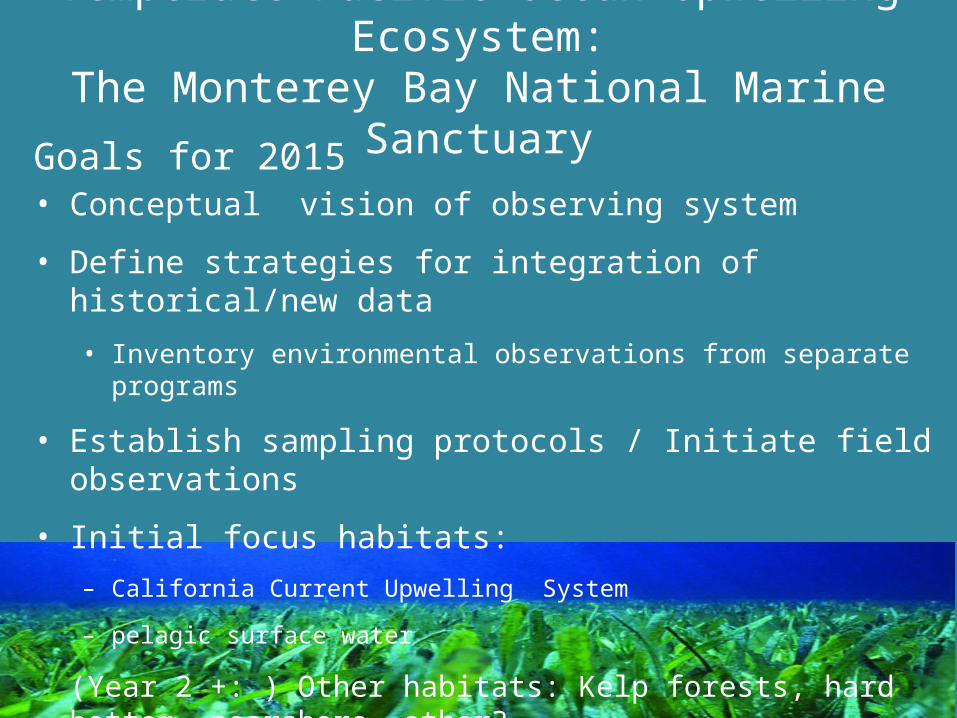
Temperate Pacific Ocean Upwelling Ecosystem:The Monterey Bay National Marine Sanctuary
Goals for 2015• Conceptual vision of observing system
• Define strategies for integration of historical/new data
• Inventory environmental observations from separate programs
• Establish sampling protocols / Initiate field observations
• Initial focus habitats:– California Current Upwelling System
– pelagic surface water
(Year 2 +: ) Other habitats: Kelp forests, hard bottom, nearshore, other?
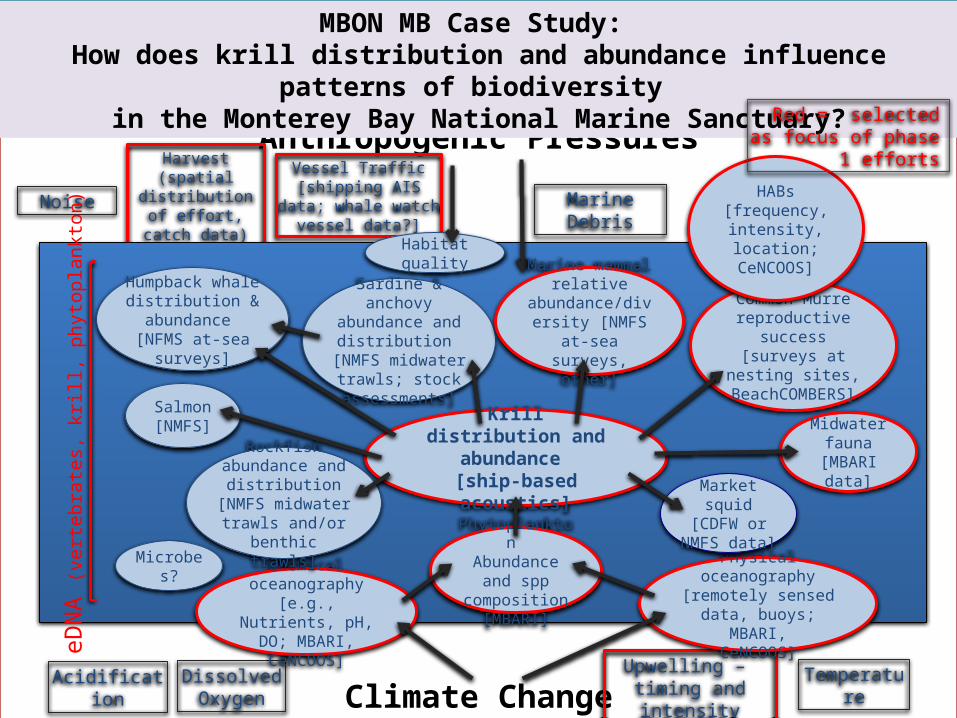
Anthropogenic Pressures
Climate Change
Marine Debris
Harvest(spatial distribution of effort, catch data)
Acidification TemperatureUpwelling – timing and intensity
Dissolved Oxygen
Vessel Traffic [shipping AIS data; whale watch
vessel data?]Noise
MBON MB Case Study: How does krill distribution and abundance influence patterns of biodiversity
in the Monterey Bay National Marine Sanctuary?
Phytoplankton Abundance and spp composition
[MBARI]
Krilldistribution and
abundance [ship-based acoustics]
Microbes?
Humpback whale distribution & abundance
[NFMS at-sea surveys]
Physical oceanography [remotely sensed data,
buoys; MBARI,CeNCOOS]
Chemical oceanography [e.g., Nutrients, pH, DO;
MBARI, CeNCOOS]
Habitat quality
Sardine & anchovyabundance and
distribution [NMFS midwater trawls;
stock assessments]
Common Murre reproductive success [surveys at nesting
sites, BeachCOMBERS]
Rockfish abundance and distribution [NMFS midwater
trawls and/or benthic trawls]
HABs [frequency, intensity, location;
CeNCOOS]
Marine mammal relative
abundance/diversity [NMFS at-sea surveys, other]
Salmon [NMFS]
Market squid [CDFW or
NMFS data]
eDN
A (v
erte
brat
es, k
rill,
phyt
opla
nkto
n)
Midwater fauna [MBARI
data]
Red = selected as focus of phase 1 efforts
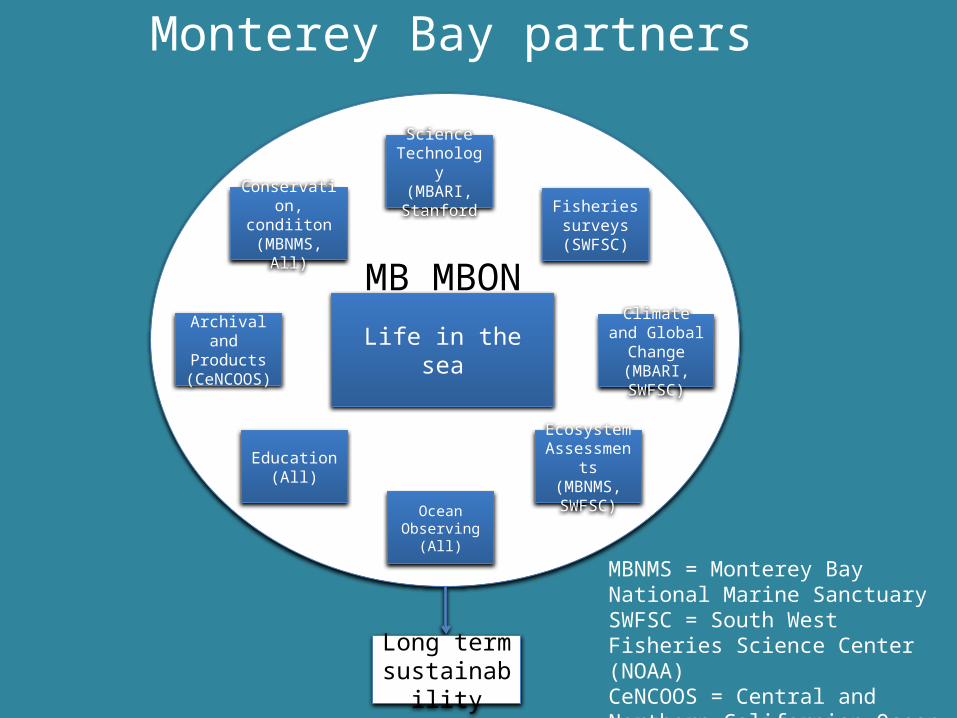
Life in the sea
Conservation, condiiton
(MBNMS, All)
Education(All)
Ocean Observing
(All)
Ecosystem Assessments
(MBNMS, SWFSC)
Climate and Global Change
(MBARI, SWFSC)
Fisheries surveys(SWFSC)
ScienceTechnology
(MBARI, Stanford
Archival and Products
(CeNCOOS)
MB MBON
Monterey Bay partners
Long term sustainability
MBNMS = Monterey Bay National Marine SanctuarySWFSC = South West Fisheries Science Center (NOAA)CeNCOOS = Central and Northern Californian Ocean Observing System
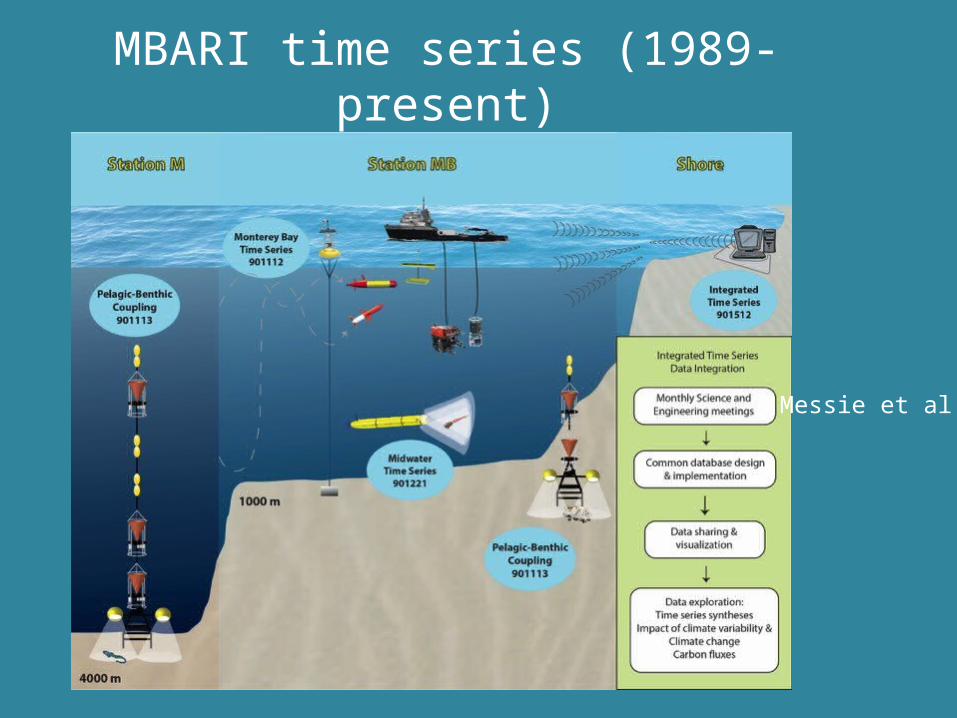
MBARI time series (1989-present)
Messie et al.
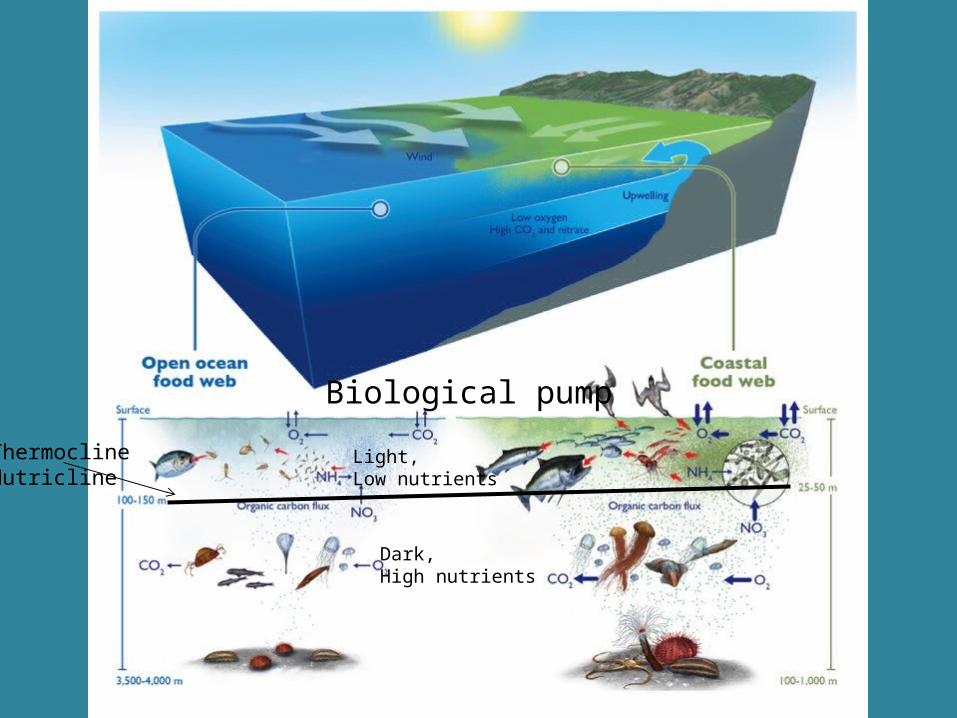
Biological pump
Dark,High nutrients
Light,Low nutrients
ThermoclineNutricline
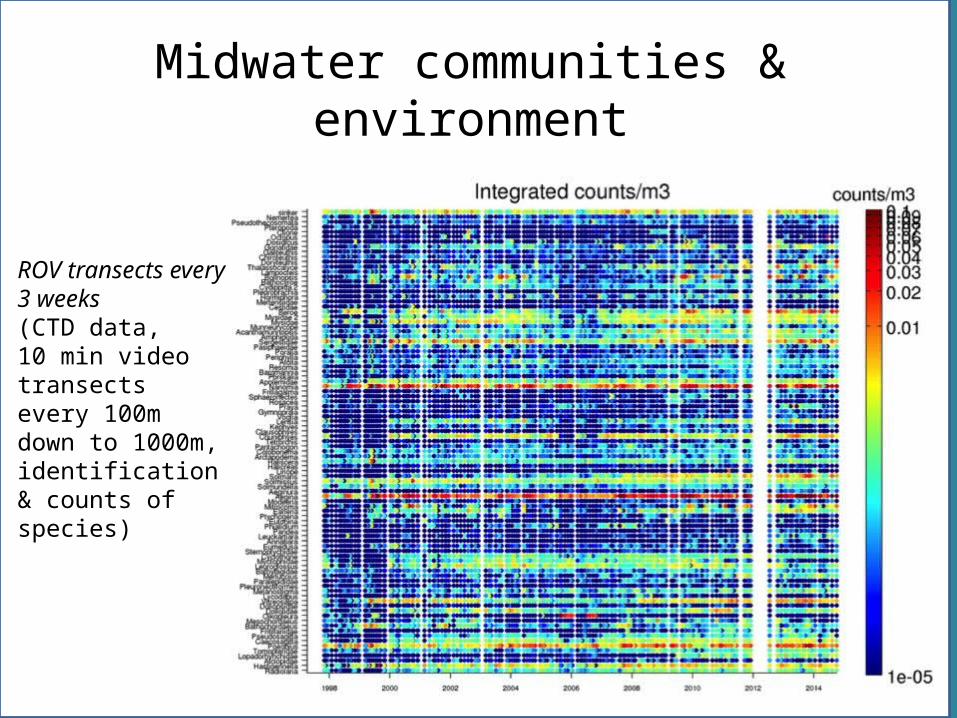
Midwater communities & environment
ROV transects every 3 weeks (CTD data, 10 min video transects every 100m down to 1000m, identification & counts of species)
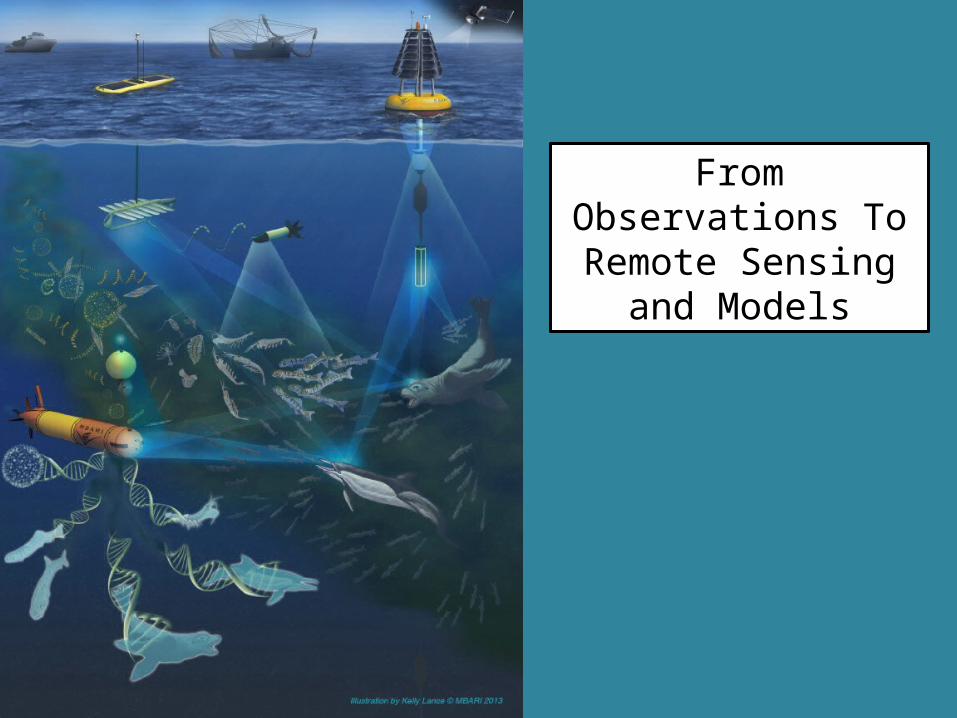
From Observations To Remote Sensing
and Models
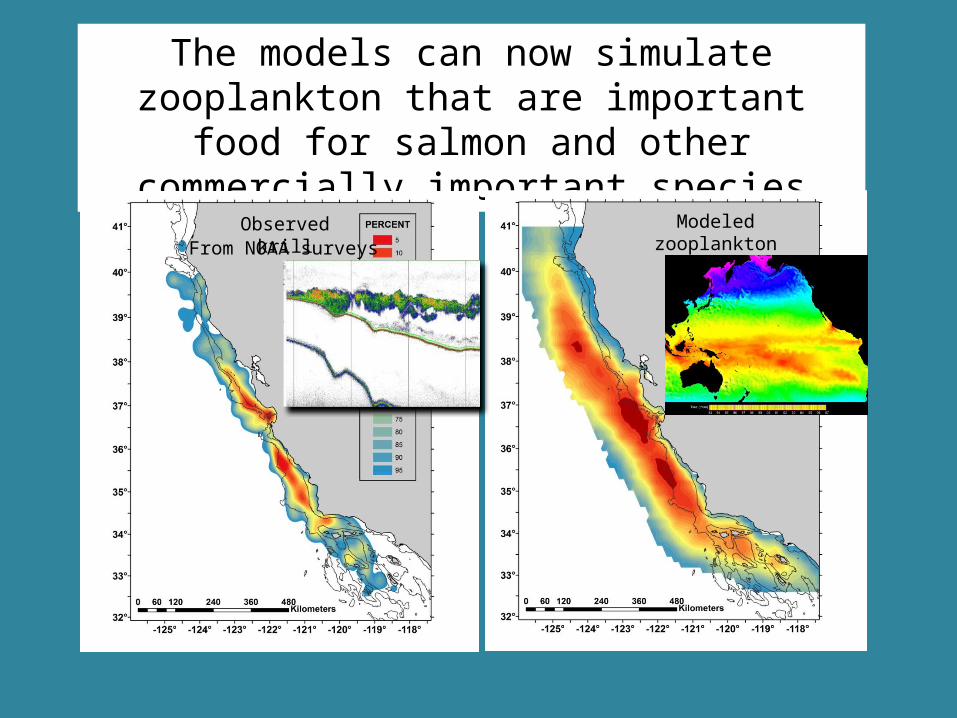
The models can now simulate zooplankton that are important food for salmon and other
commercially important species
Modeled zooplanktonObserved krillFrom NOAA surveys
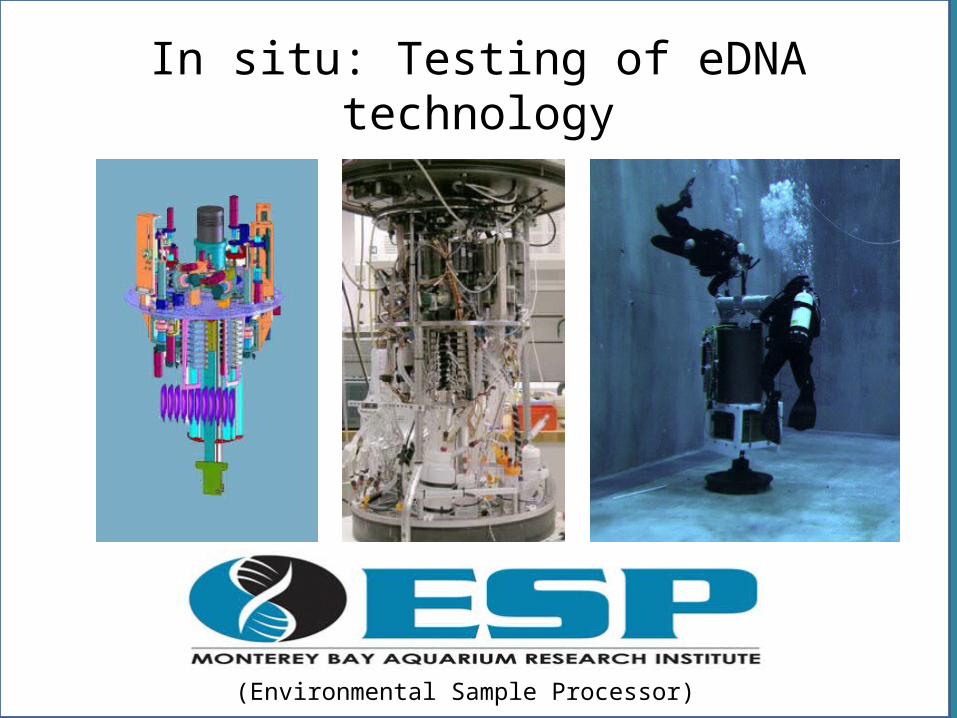
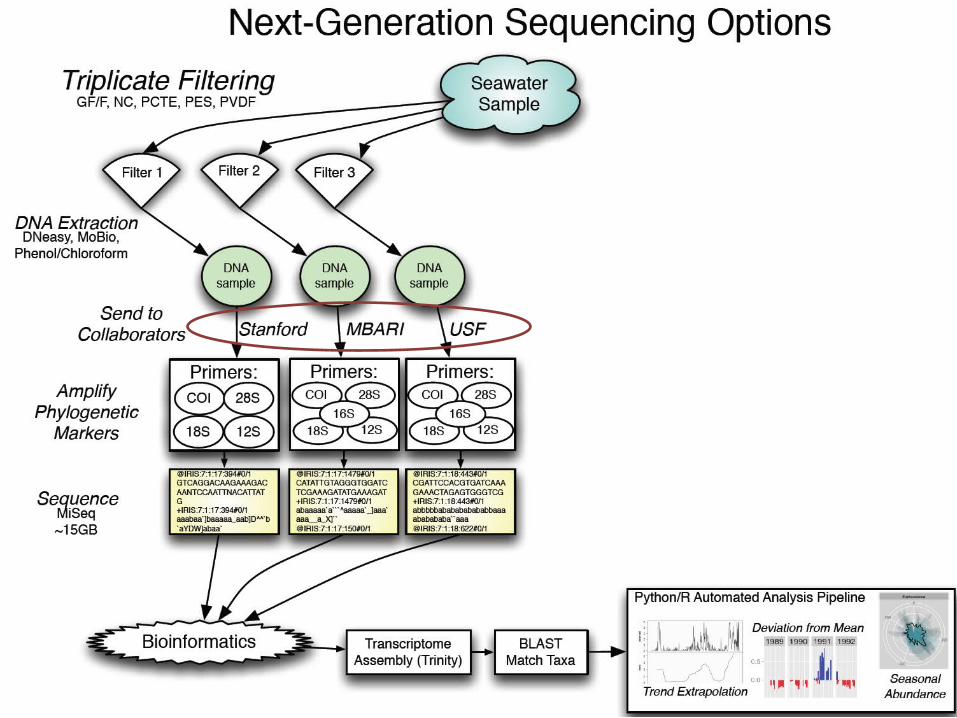
In situ: Testing of eDNA technology
(Environmental Sample Processor)
New tools - Genomics
• Pioneered by microbial scientists• Well integrated microbial approaches across
the three MBON projects• Sanctuary MBON leading the development of
genomics from plankton to whales• Present focus on establishing solid and
standard methods
Methods – can a single procedure be used from bacteria to whales?
• Identify primers for microbes, plankton (phyto and zoo) and vertebrates
• Test filters • Test nucleic acid extractions• Test for microbes, plankton (phyto and zoo)
and vertebrates using next generation sequencing
• Test across kelp beds to coral reefs
Leads
• Microbes – USF• Plankton – MBARI• Vertebrates – Stanford/Center for Ocean
Solutions
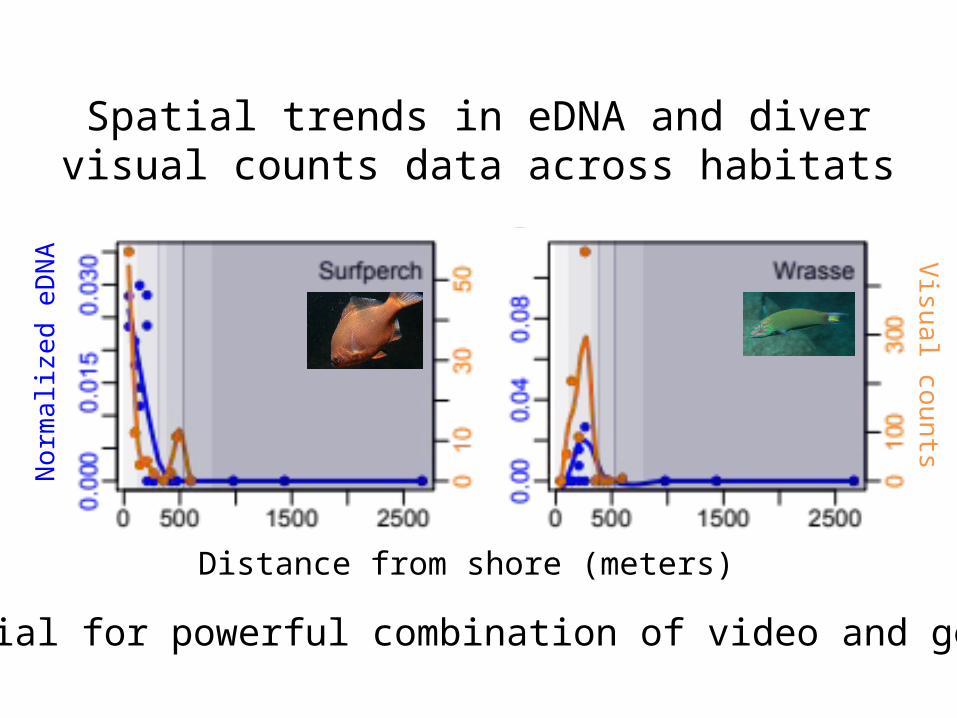
Spatial trends in eDNA and diver visual counts data across habitats
Distance from shore (meters)
Visual countsN
orm
alize
d eD
NA
Potential for powerful combination of video and genomics
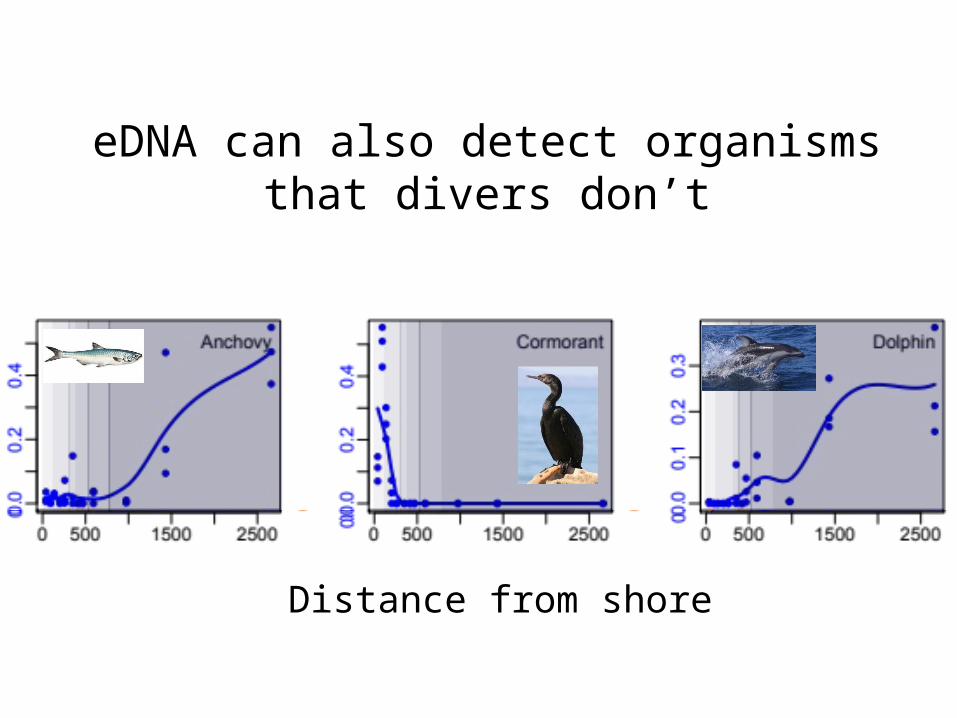
eDNA can also detect organisms that divers don’t
Distance from shore
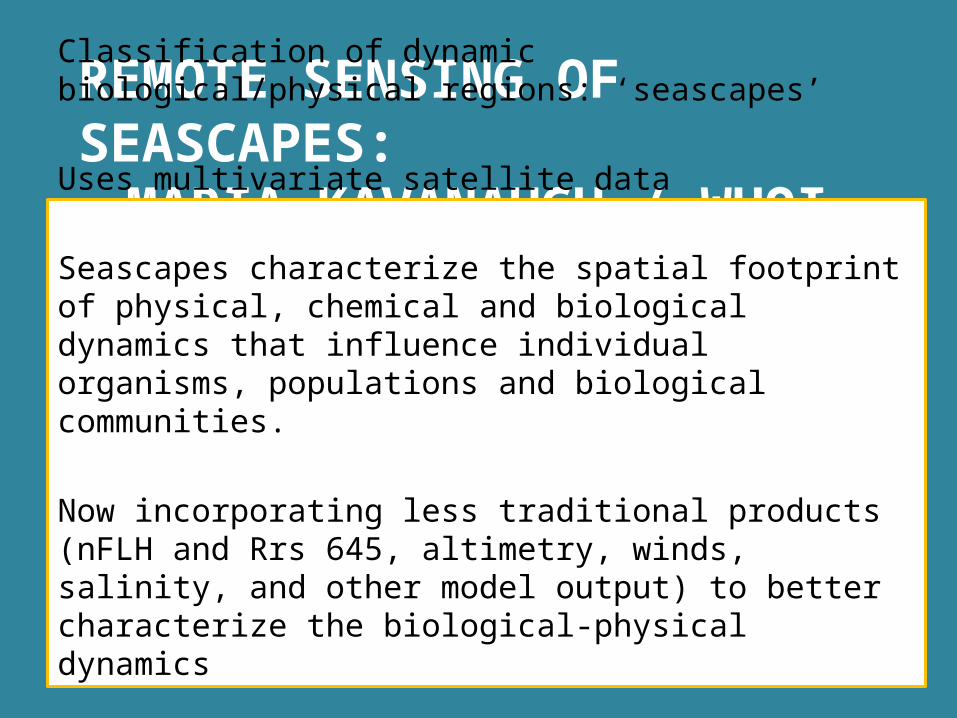
REMOTE SENSING OF SEASCAPES:MARIA KAVANAUGH / WHOI
Classification of dynamic biological/physical regions: ‘seascapes’
Uses multivariate satellite data
Seascapes characterize the spatial footprint of physical, chemical and biological dynamics that influence individual organisms, populations and biological communities.
Now incorporating less traditional products (nFLH and Rrs 645, altimetry, winds, salinity, and other model output) to better characterize the biological-physical dynamics
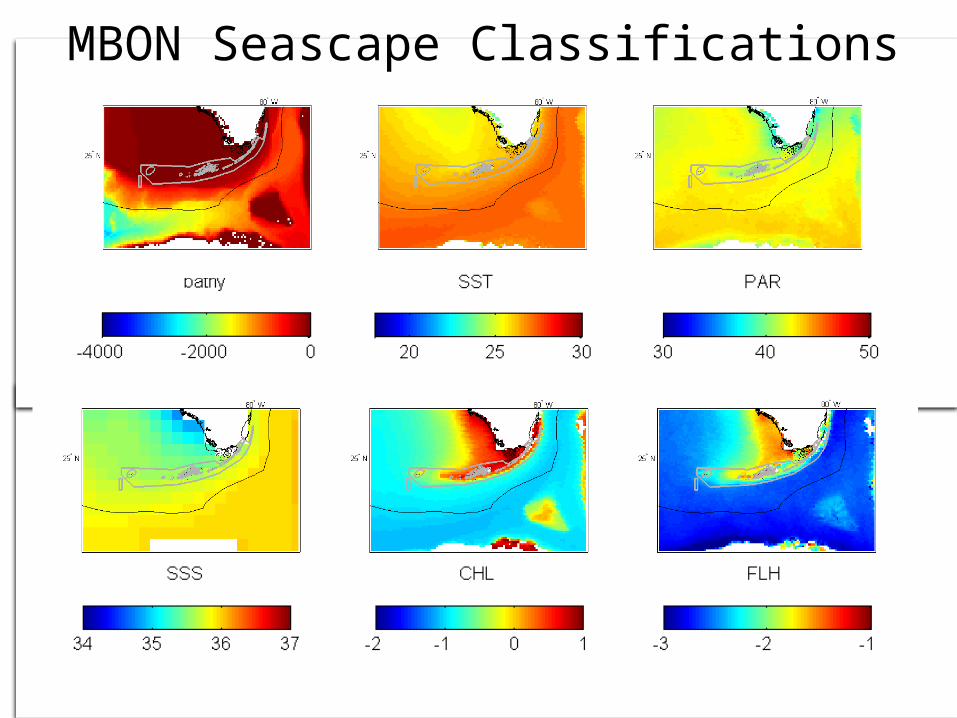
MBON Seascape Classifications
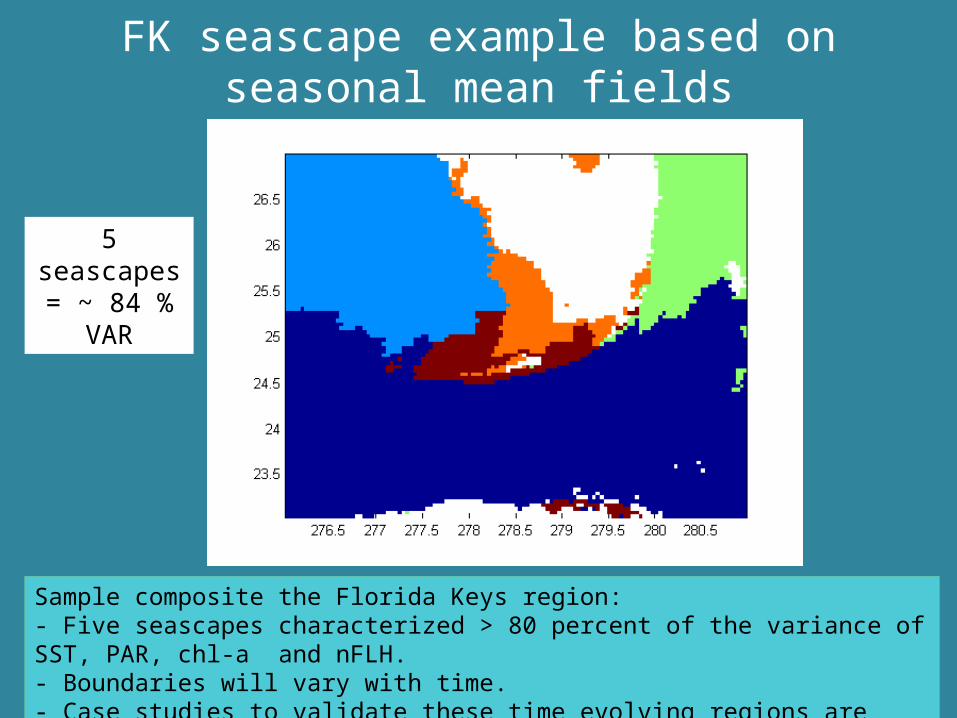
FK seascape example based onseasonal mean fields
5 seascapes= ~ 84 % VAR
Sample composite the Florida Keys region:- Five seascapes characterized > 80 percent of the variance of SST, PAR, chl-a and nFLH. - Boundaries will vary with time.- Case studies to validate these time evolving regions are underway.

Outreach and Education
• Focus on user needs• Co-design products and dissemination strategies
with federal, state, local partners• Better link and integrate existing resources
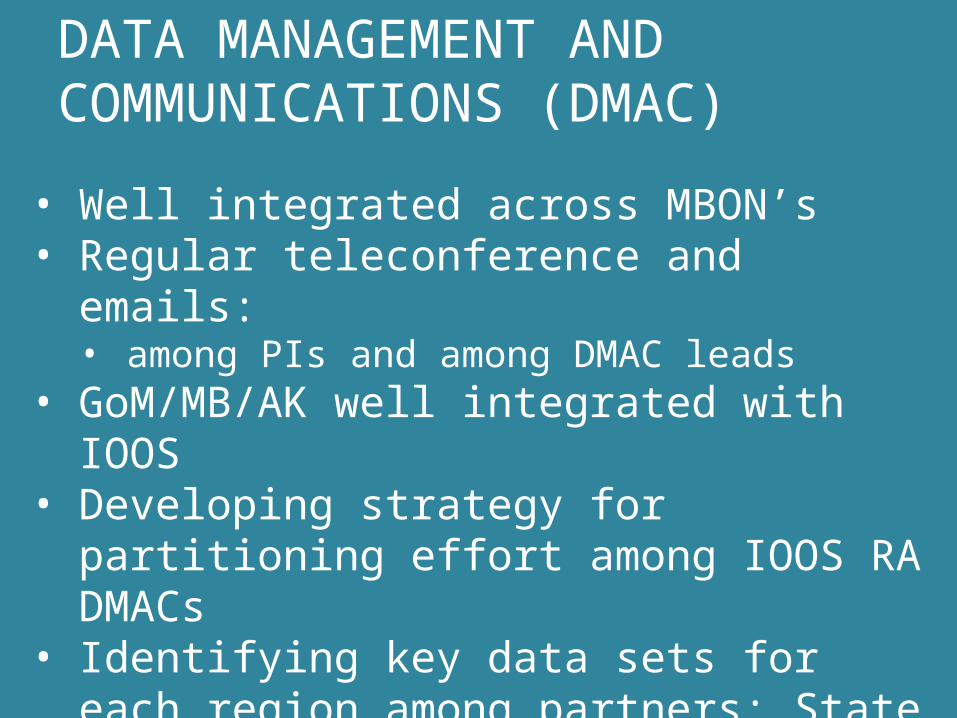
DATA MANAGEMENT AND COMMUNICATIONS (DMAC)
• Well integrated across MBON’s• Regular teleconference and emails:
• among PIs and among DMAC leads• GoM/MB/AK well integrated with IOOS• Developing strategy for partitioning effort
among IOOS RA DMACs• Identifying key data sets for each region among
partners: State agencies, NASA, NOAA, USGS• Developing means of dealing with genomics• Linkages: NOAA NODC, OBIS and IOBIS, GEOBON
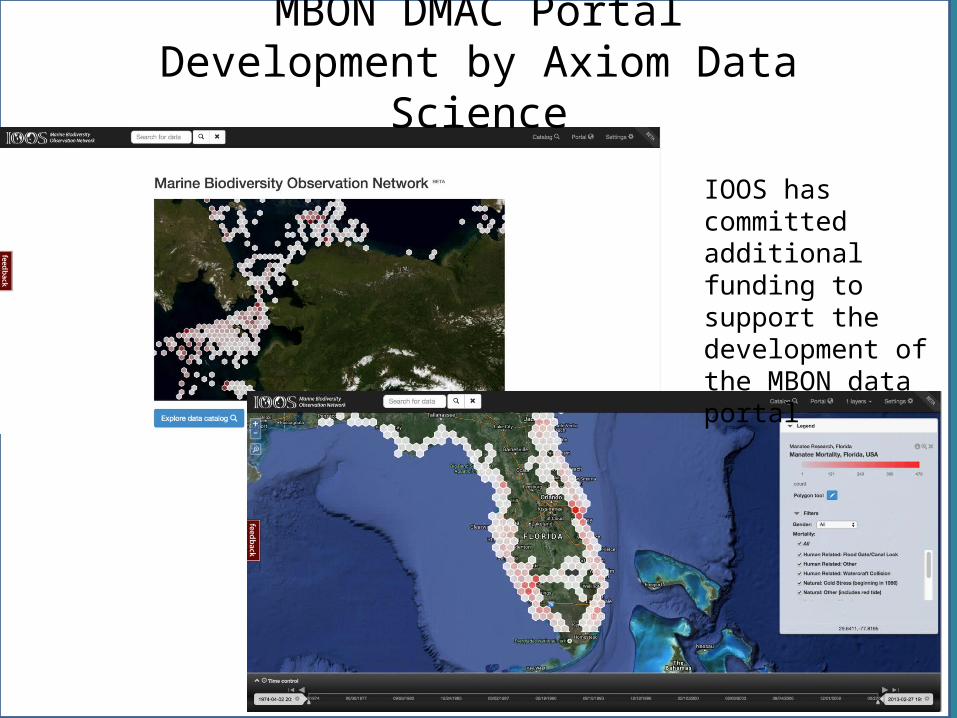
MBON DMAC PortalDevelopment by Axiom Data Science
IOOS has committed additional funding to support the development of the MBON data portal
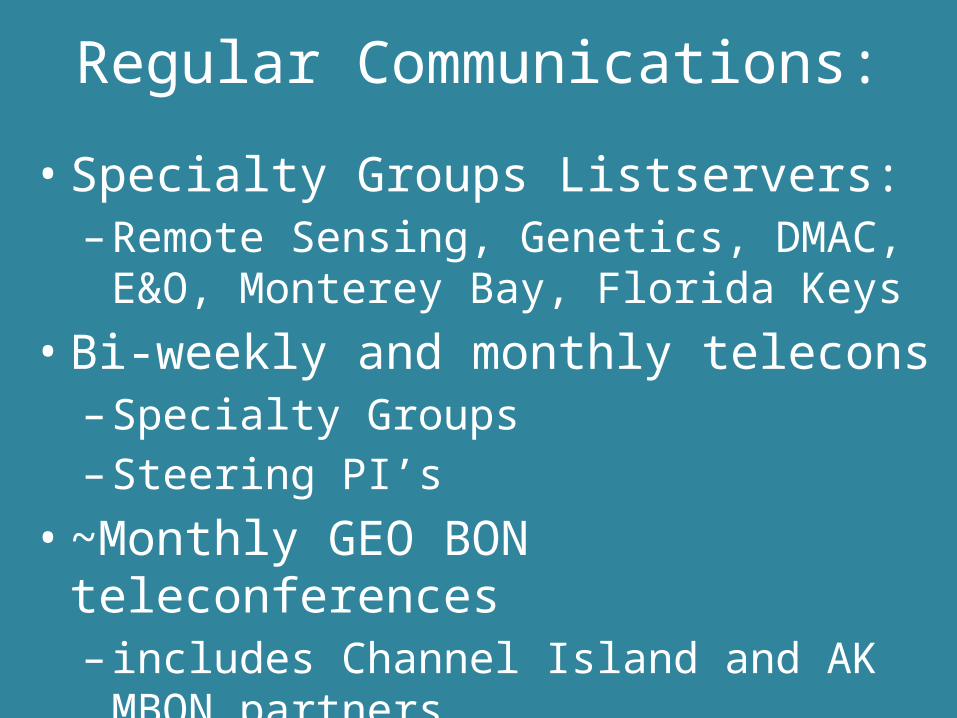
Regular Communications:
• Specialty Groups Listservers:– Remote Sensing, Genetics, DMAC, E&O,
Monterey Bay, Florida Keys• Bi-weekly and monthly telecons
– Specialty Groups– Steering PI’s
• ~Monthly GEO BON teleconferences– includes Channel Island and AK MBON partners
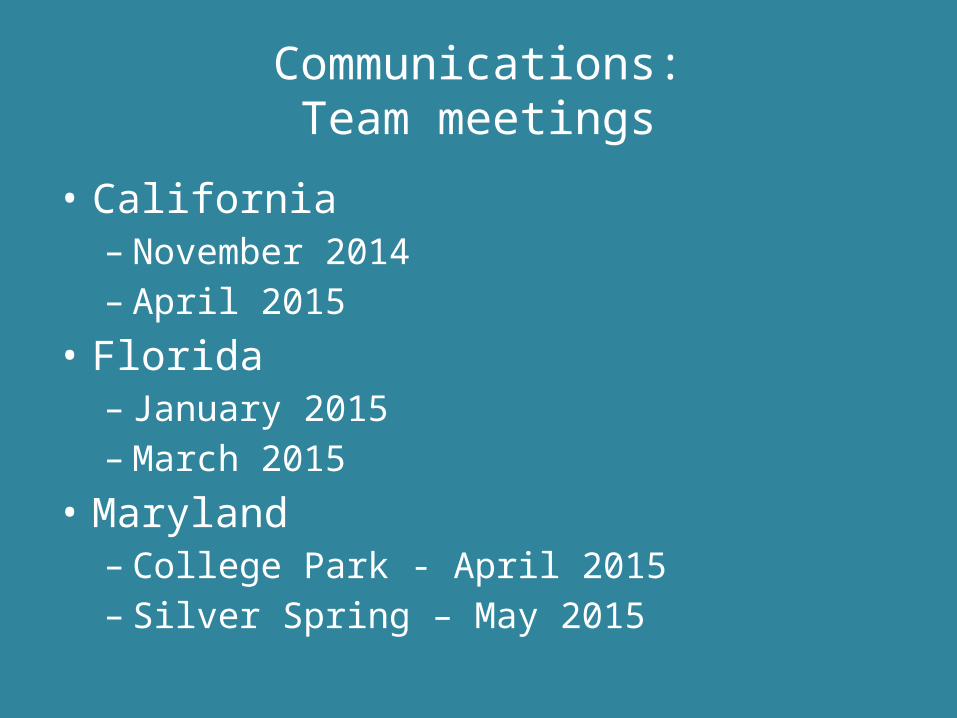
Communications:Team meetings
• California– November 2014– April 2015
• Florida– January 2015– March 2015
• Maryland– College Park - April 2015– Silver Spring – May 2015
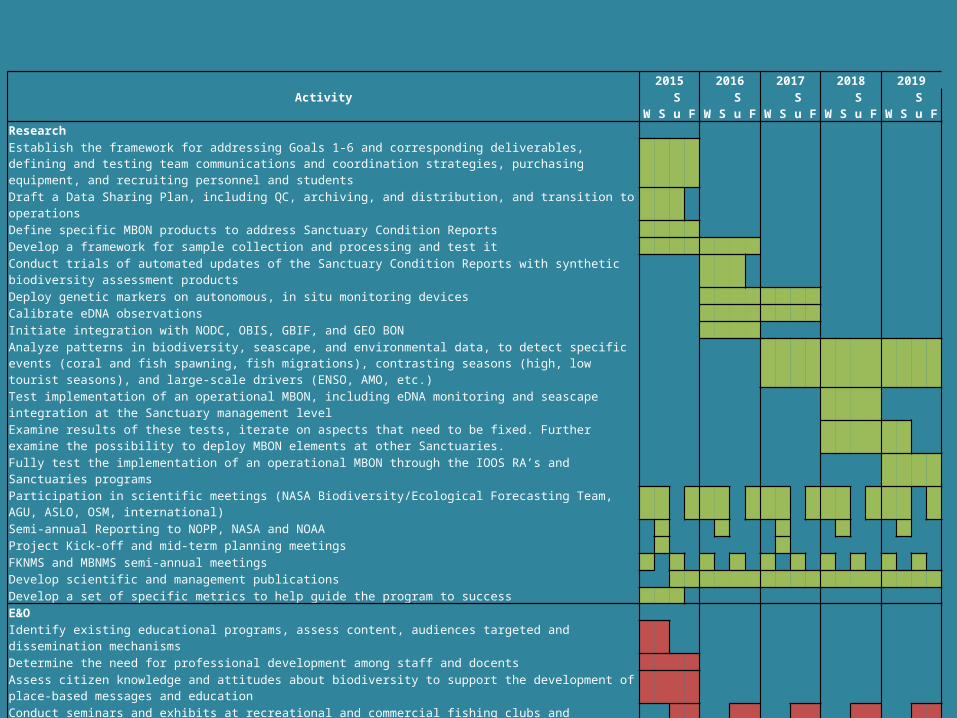
Activity2015 2016 2017 2018 2019
W S Su F W S Su F W S Su F W S Su F W S Su FResearch Establish the framework for addressing Goals 1-6 and corresponding deliverables, defining and testing team communications and coordination strategies, purchasing equipment, and recruiting personnel and students Draft a Data Sharing Plan, including QC, archiving, and distribution, and transition to operations Define specific MBON products to address Sanctuary Condition Reports Develop a framework for sample collection and processing and test it Conduct trials of automated updates of the Sanctuary Condition Reports with synthetic biodiversity assessment products Deploy genetic markers on autonomous, in situ monitoring devices Calibrate eDNA observations Initiate integration with NODC, OBIS, GBIF, and GEO BON Analyze patterns in biodiversity, seascape, and environmental data, to detect specific events (coral and fish spawning, fish migrations), contrasting seasons (high, low tourist seasons), and large-scale drivers (ENSO, AMO, etc.) Test implementation of an operational MBON, including eDNA monitoring and seascape integration at the Sanctuary management level Examine results of these tests, iterate on aspects that need to be fixed. Further examine the possibility to deploy MBON elements at other Sanctuaries. Fully test the implementation of an operational MBON through the IOOS RA’s and Sanctuaries programs Participation in scientific meetings (NASA Biodiversity/Ecological Forecasting Team, AGU, ASLO, OSM, international) Semi-annual Reporting to NOPP, NASA and NOAA Project Kick-off and mid-term planning meetings FKNMS and MBNMS semi-annual meetings Develop scientific and management publications Develop a set of specific metrics to help guide the program to success E&O Identify existing educational programs, assess content, audiences targeted and dissemination mechanisms Determine the need for professional development among staff and docents Assess citizen knowledge and attitudes about biodiversity to support the development of place-based messages and education Conduct seminars and exhibits at recreational and commercial fishing clubs and association trade shows Develop and implement of a program for middle schools, Sanctuary learning centers, and informal science education institutions lead by MBNMS Adapt and implement content of USF's Oceanography Camp for Girls (OCG), Girls Inc., and Girl Scouts programs to FKNMS and MBNMS Host workshops at MBNMS and FKNMS to engage the regional informal science education network and provide materials to support staff and docent training GCOOS will deploy its interactive conservation game “Are You an Eco Hero” to the FKNMS visitor centers, Florida state parks, and other informal education venues Conduct professional development sessions for ERMA stakeholders about MBON data Develop and implement a Story Map focused on marine biodiversity research using GIS tools
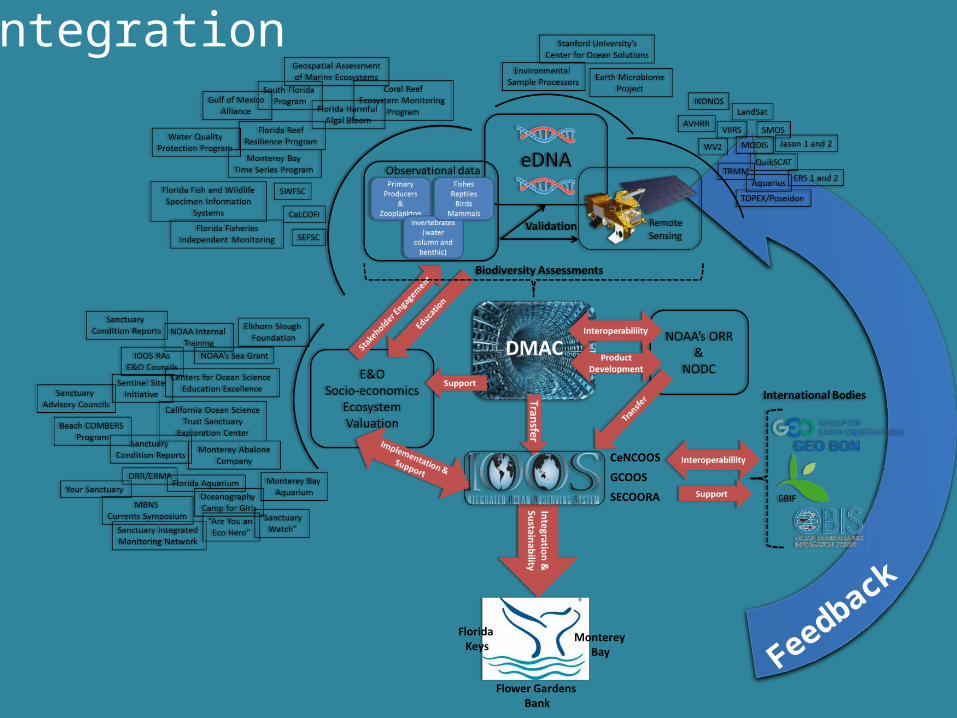
Integration
Feedback
Backup
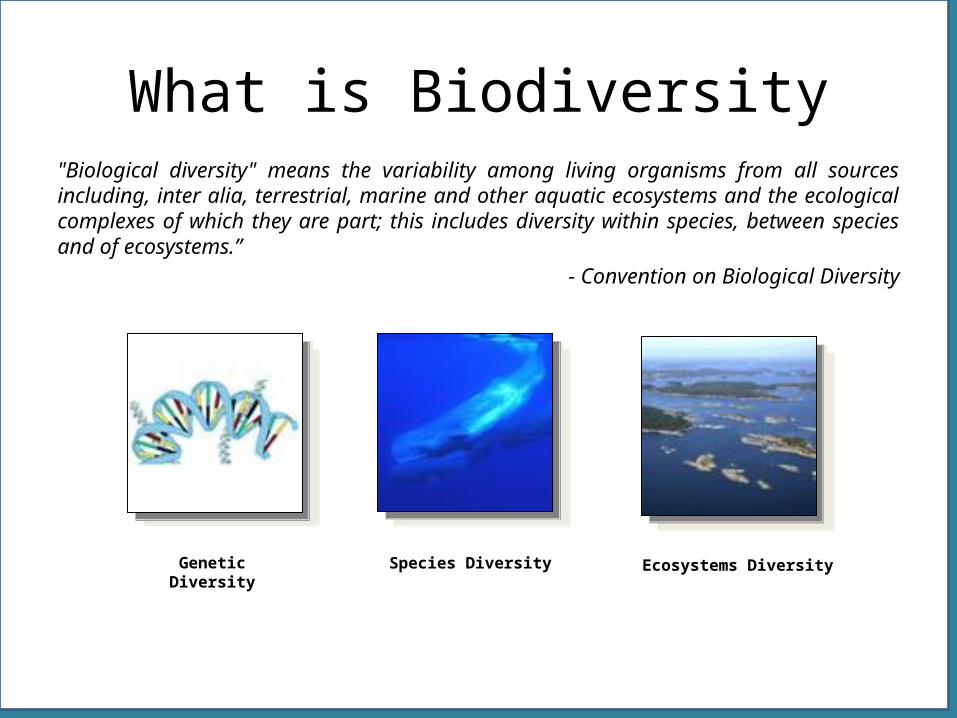
What is Biodiversity"Biological diversity" means the variability among living organisms from all sources including, inter alia, terrestrial, marine and other aquatic ecosystems and the ecological complexes of which they are part; this includes diversity within species, between species and of ecosystems.”
- Convention on Biological Diversity
Ecosystems DiversitySpecies DiversityGenetic Diversity
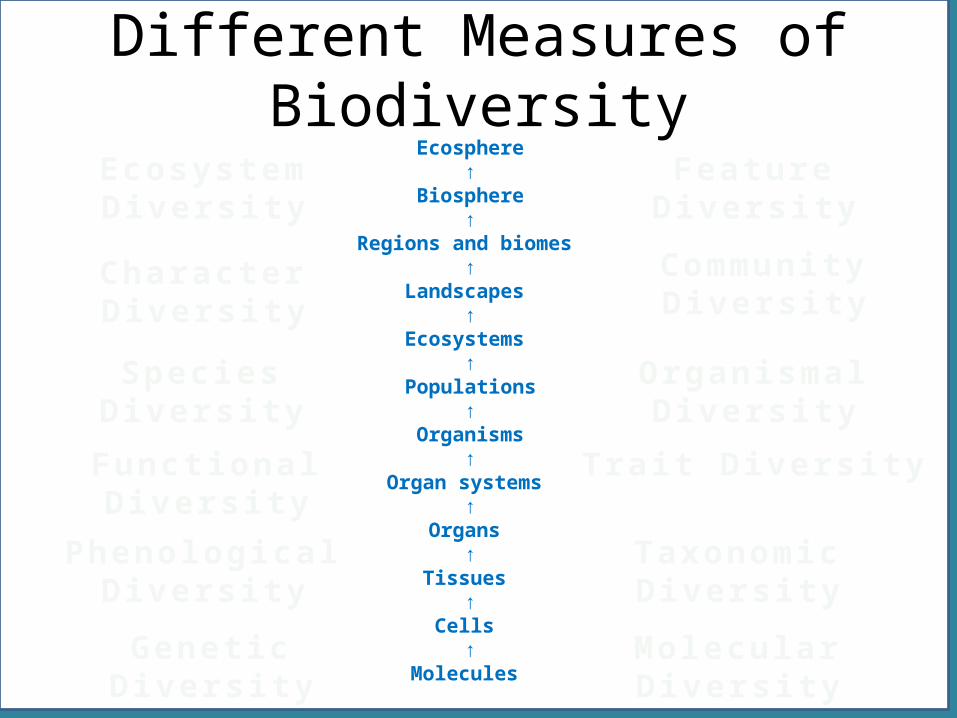
Different Measures of BiodiversityEcosphere
↑Biosphere
↑Regions and biomes
↑Landscapes
↑Ecosystems
↑Populations
↑Organisms
↑Organ systems
↑Organs
↑Tissues
↑Cells
↑Molecules
Fe a t u r e D i v e r s i t y
C o m m u n i t y D i v e r s i t y
S p e c i e s D i v e r s i t y O r ga n i s m a l D i v e r s i t y
G e n e ti c D i v e r s i t y M o l e c u l a r D i v e r s i t y
C h a ra c t e r D i v e r s i t y
Ec o sy s te m D i v e r s i t y
F u n c ti o n a l D i v e r s i t y Tra i t D i v e r s i t y
Ta xo n o m i c D i v e r s i t yP h e n o l o g i c a l D i v e r s i t y
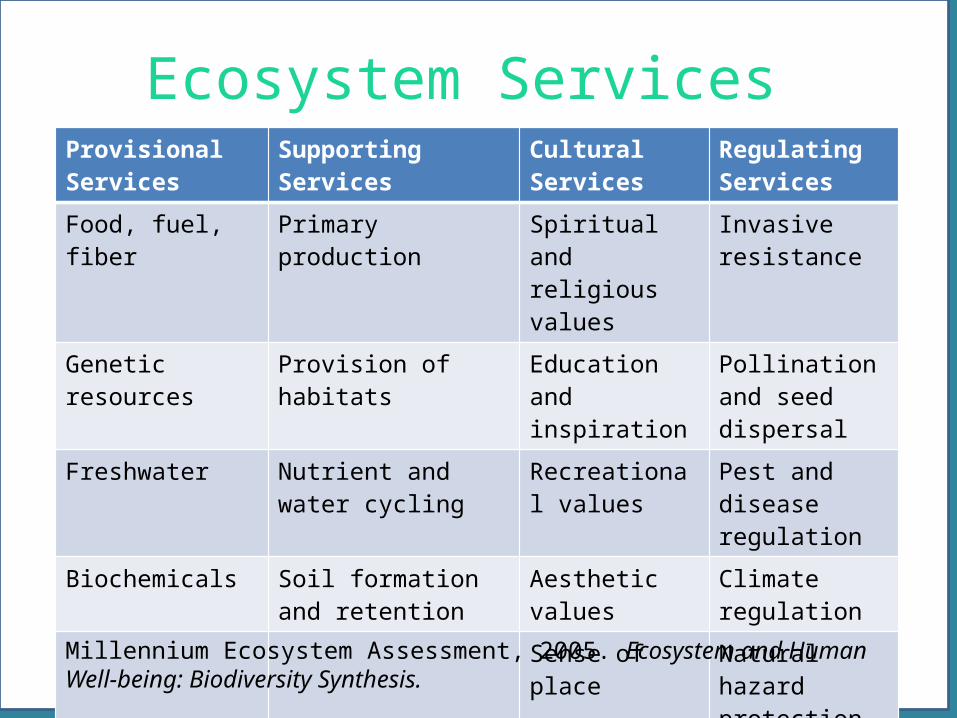
Ecosystem Services Provisional Services
Supporting Services Cultural Services Regulating Services
Food, fuel, fiber Primary production Spiritual and religious values
Invasive resistance
Genetic resources Provision of habitats Education and inspiration
Pollination and seed dispersal
Freshwater Nutrient and water cycling
Recreational values
Pest and disease regulation
Biochemicals Soil formation and retention
Aesthetic values Climate regulation
Sense of place Natural hazard protection
Water purification
Millennium Ecosystem Assessment, 2005. Ecosystem and Human Well-being: Biodiversity Synthesis.
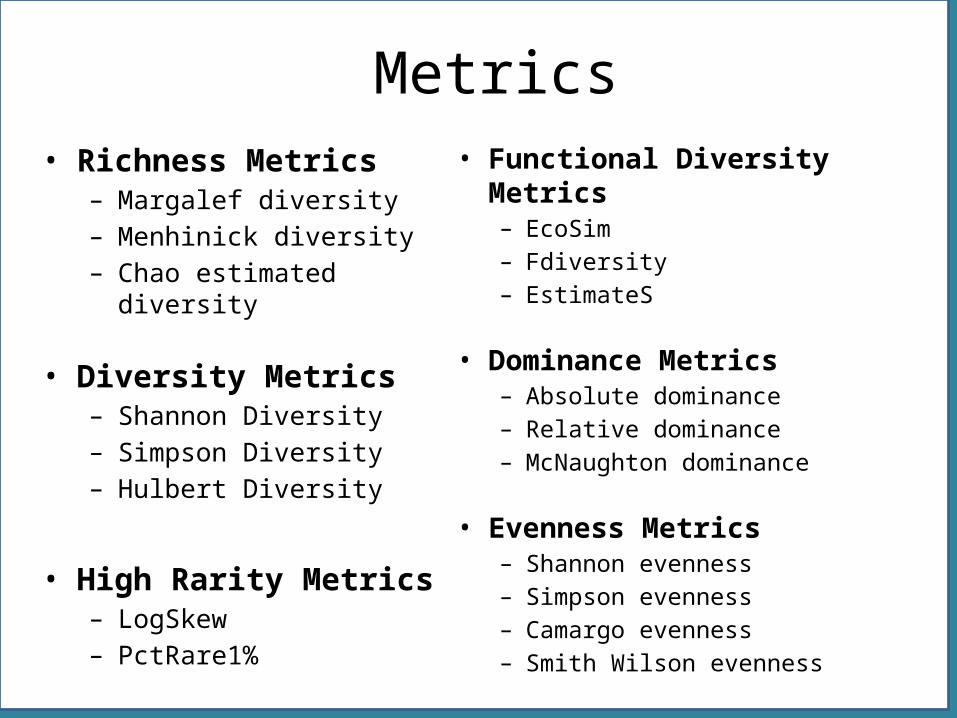
Metrics• Richness Metrics
– Margalef diversity– Menhinick diversity – Chao estimated diversity
• Diversity Metrics – Shannon Diversity – Simpson Diversity– Hulbert Diversity
• High Rarity Metrics– LogSkew– PctRare1%
• Functional Diversity Metrics– EcoSim– Fdiversity– EstimateS
• Dominance Metrics– Absolute dominance– Relative dominance– McNaughton dominance
• Evenness Metrics – Shannon evenness– Simpson evenness– Camargo evenness– Smith Wilson evenness
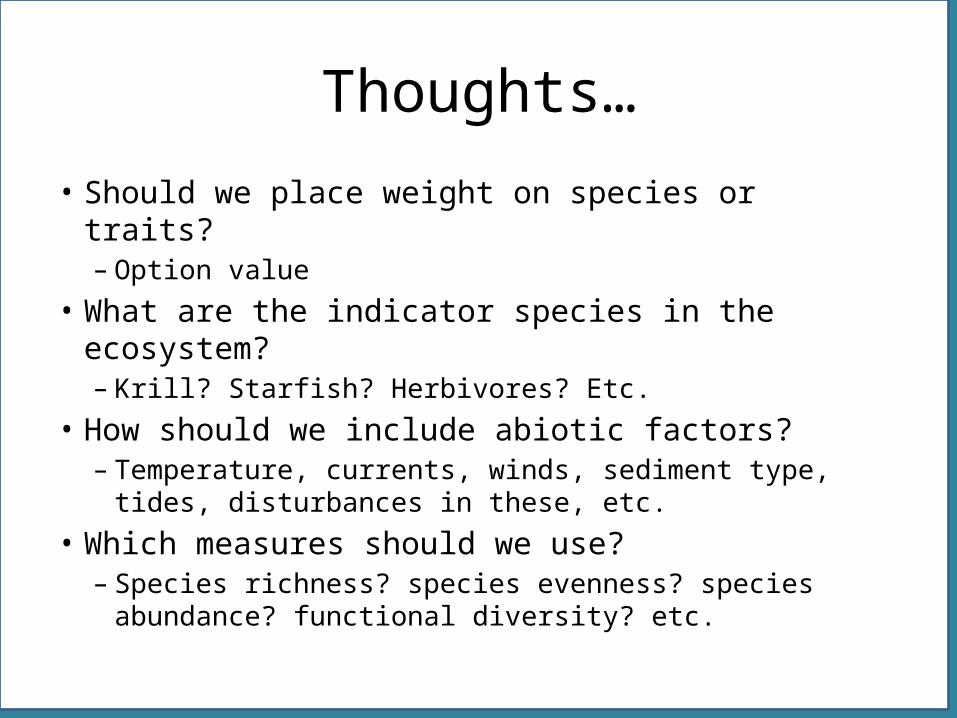
Thoughts…
• Should we place weight on species or traits?– Option value
• What are the indicator species in the ecosystem? – Krill? Starfish? Herbivores? Etc.
• How should we include abiotic factors? – Temperature, currents, winds, sediment type, tides,
disturbances in these, etc. • Which measures should we use?
– Species richness? species evenness? species abundance? functional diversity? etc.
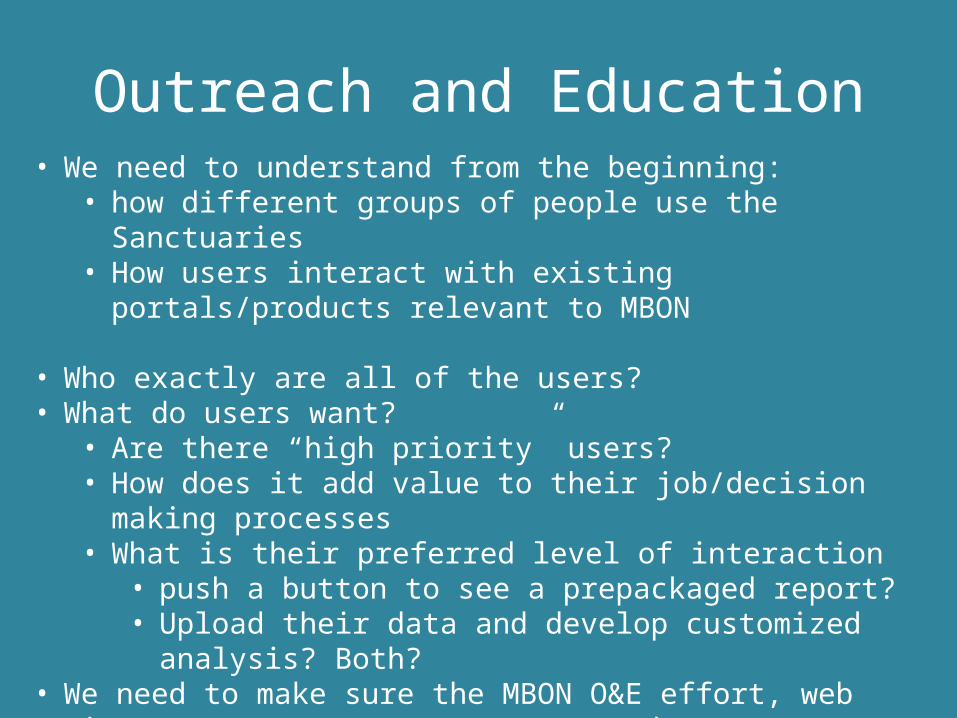
Outreach and Education• We need to understand from the beginning:
• how different groups of people use the Sanctuaries• How users interact with existing portals/products relevant to MBON
• Who exactly are all of the users?• What do users want?
• Are there “high priority” users?• How does it add value to their job/decision making processes • What is their preferred level of interaction
• push a button to see a prepackaged report?• Upload their data and develop customized analysis? Both?
• We need to make sure the MBON O&E effort, web site content, etc. meets user needs
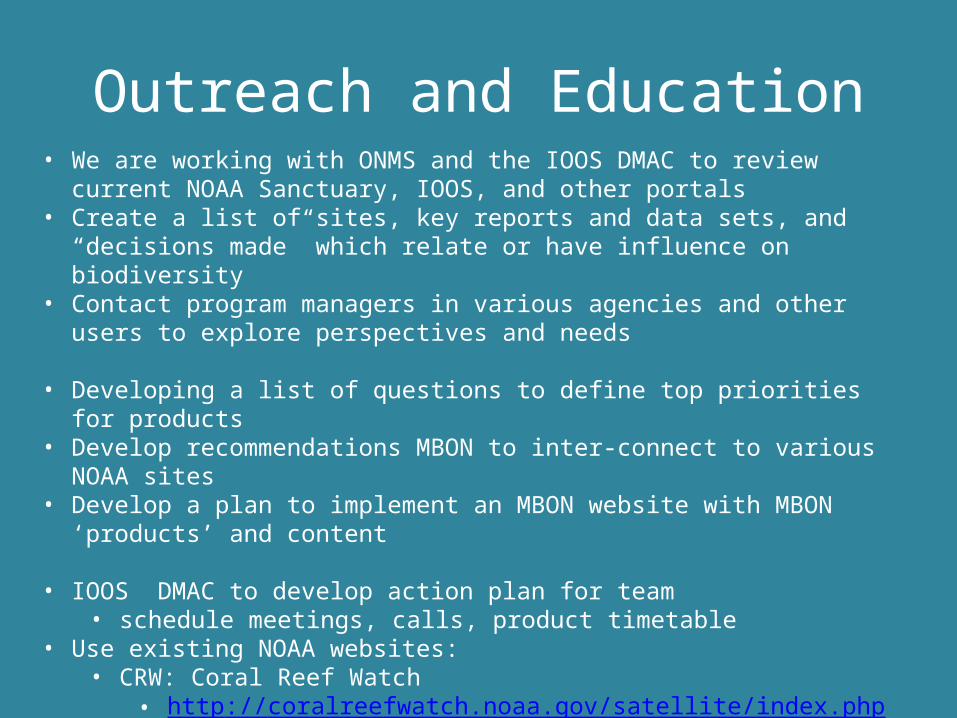
Outreach and Education• We are working with ONMS and the IOOS DMAC to review current NOAA Sanctuary,
IOOS, and other portals• Create a list of sites, key reports and data sets, and “decisions made” which relate or
have influence on biodiversity• Contact program managers in various agencies and other users to explore
perspectives and needs
• Developing a list of questions to define top priorities for products• Develop recommendations MBON to inter-connect to various NOAA sites• Develop a plan to implement an MBON website with MBON ‘products’ and content
• IOOS DMAC to develop action plan for team• schedule meetings, calls, product timetable
• Use existing NOAA websites: • CRW: Coral Reef Watch
• http://coralreefwatch.noaa.gov/satellite/index.php• CREMP: Florida Keys Coral Reef Evaluation and Monitoring Project (CREMP)
• http://ocean.floridamarine.org/FKNMS_WQPP/pages/cremp.html
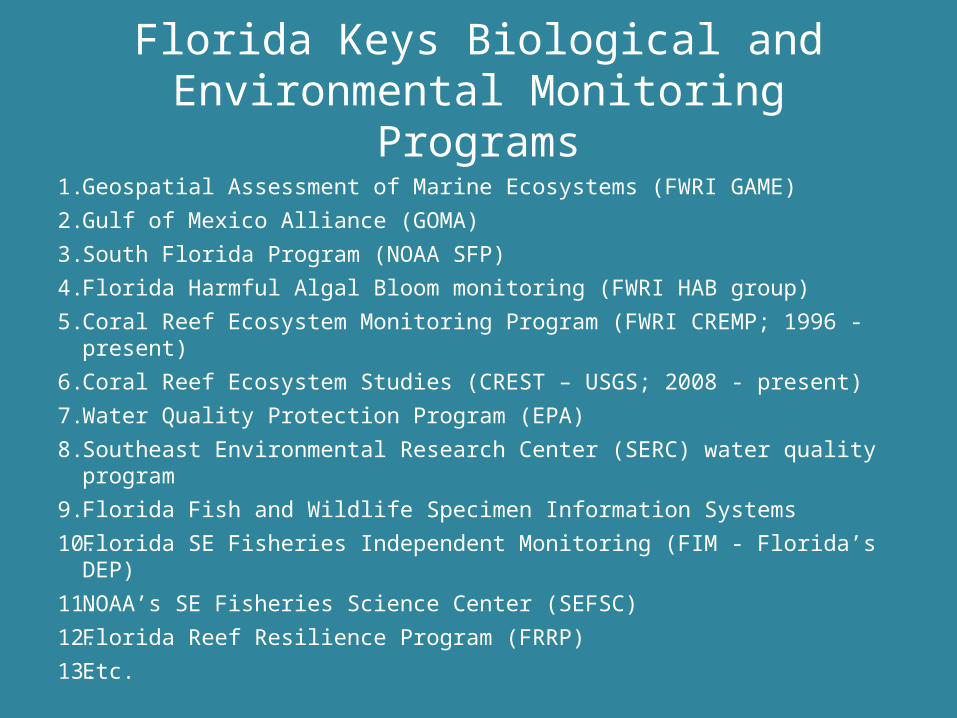
1. Geospatial Assessment of Marine Ecosystems (FWRI GAME)
2. Gulf of Mexico Alliance (GOMA)
3. South Florida Program (NOAA SFP)
4. Florida Harmful Algal Bloom monitoring (FWRI HAB group)
5. Coral Reef Ecosystem Monitoring Program (FWRI CREMP; 1996 - present)
6. Coral Reef Ecosystem Studies (CREST – USGS; 2008 - present)
7. Water Quality Protection Program (EPA)
8. Southeast Environmental Research Center (SERC) water quality program
9. Florida Fish and Wildlife Specimen Information Systems
10. Florida SE Fisheries Independent Monitoring (FIM - Florida’s DEP)
11. NOAA’s SE Fisheries Science Center (SEFSC)
12. Florida Reef Resilience Program (FRRP)
13. Etc.
Florida Keys Biological and Environmental Monitoring Programs