Embed Size (px)
Citation preview
Demonstration Assessment of Light Emitting Diode (LED) Street Lighting
Host Site: City of Oakland, California Final Report prepared in support of the U.S. DOE Solid-State Lighting Technology Demonstration Gateway Program and PG&E Emerging Technologies Program Study Participants: U.S. Department of Energy Pacific Gas & Electric City of Oakland, California Energy Solutions Beta LED, Inc. January 2008 Prepared for the U.S. Department of Energy and Pacific Gas & Electric by Energy Solutions

Pacific Gas and Electric Company
Emerging Technologies Program
Application Assessment Report #0714
LED Street Lighting Oakland, CA
Issued: January 2008
Project Manager: Mary Matteson Bryan, P.E.
Pacific Gas and Electric Company
Prepared By: Tyson Cook, Project Manager
Anna Sommer, Project Manager
Terrance Pang, Director
Energy Solutions
1610 Harrison St.
Oakland, CA 94612
(510) 482-4420
© Copyright, 2008, Pacific Gas and Electric Company. All rights reserved. L E G A L N O T I C E
This report was prepared by Pacific Gas and Electric Company for exclusive use by its employees and agents. Neither Pacific Gas and Electric Company nor any of its employees and agents:
(1) makes any written or oral warranty, expressed or implied, including, but not limited to those concerning merchantability or fitness for a particular purpose;
(2) assumes any legal liability or responsibility for the accuracy, completeness, or usefulness of any information, apparatus, product, process, method, or policy contained herein; or
(3) represents that its use would not infringe any privately owned rights, including, but not limited to, patents, trademarks, or copyrights.
© Copyright, 2008, Pacific Gas and Electric Company. All rights reserved.
Tab l e o f C o n t e n t s T A B L E O F C O N T E N T S . . . . . . . . . . . . . . . . . . . . . . . . . . . . . . . . . . . . . . . . . . . . . . . . . . . . . . . . . . . . . . . . . . . . . . . . . . . A P R E F A C E . . . . . . . . . . . . . . . . . . . . . . . . . . . . . . . . . . . . . . . . . . . . . . . . . . . . . . . . . . . . . . . . . . . . . . . . . . . . . . . . . . . . . . . . . . . . B
ACKNOWLEDGEMENTS .............................................................................................................................................B E X E C U T I V E S U M M A R Y . . . . . . . . . . . . . . . . . . . . . . . . . . . . . . . . . . . . . . . . . . . . . . . . . . . . . . . . . . . . . . . . . . . . . . . . . . 1 P R O J E C T B A C K G R O U N D . . . . . . . . . . . . . . . . . . . . . . . . . . . . . . . . . . . . . . . . . . . . . . . . . . . . . . . . . . . . . . . . . . . . . . . . 1
PROJECT OVERVIEW................................................................................................................................................... 1 TECHNOLOGICAL OVERVIEW .................................................................................................................................. 1 MARKET OVERVIEW................................................................................................................................................... 1
P R O J E C T O B J E C T I V E S . . . . . . . . . . . . . . . . . . . . . . . . . . . . . . . . . . . . . . . . . . . . . . . . . . . . . . . . . . . . . . . . . . . . . . . . . . 3 M E T H O D O L O G Y . . . . . . . . . . . . . . . . . . . . . . . . . . . . . . . . . . . . . . . . . . . . . . . . . . . . . . . . . . . . . . . . . . . . . . . . . . . . . . . . . . 4
HOST SITE INFORMATION ......................................................................................................................................... 4 MONITORING PLAN ................................................................................................................................................... 4
P R O J E C T R E S U L T S A N D D I S C U S S I O N . . . . . . . . . . . . . . . . . . . . . . . . . . . . . . . . . . . . . . . . . . . . . . . . . . . . . . . 6 ELECTRICAL DEMAND AND ENERGY SAVINGS.................................................................................................... 6 LIGHTING PERFORMANCE........................................................................................................................................ 7 ECONOMIC PERFORMANCE.................................................................................................................................... 17
D I S C U S S I O N . . . . . . . . . . . . . . . . . . . . . . . . . . . . . . . . . . . . . . . . . . . . . . . . . . . . . . . . . . . . . . . . . . . . . . . . . . . . . . . . . . . . . 2 1 C O N C L U S I O N . . . . . . . . . . . . . . . . . . . . . . . . . . . . . . . . . . . . . . . . . . . . . . . . . . . . . . . . . . . . . . . . . . . . . . . . . . . . . . . . . . . . 2 3 A P P E N D I X A : P H A S E 2 M O N I T O R I N G D A T A . . . . . . . . . . . . . . . . . . . . . . . . . . . . . . . . . . . . . . . . . . . . . I A P P E N D I X B : M O N I T O R I N G L A Y O U T . . . . . . . . . . . . . . . . . . . . . . . . . . . . . . . . . . . . . . . . . . . . . . . . . . . . I X A P P E N D I X C : A D D I T I O N A L S I T E P H O T O G R A P H S . . . . . . . . . . . . . . . . . . . . . . . . . . . . . . . . . . . . X I A P P E N D I X D : C O N S U M E R S U R V E Y . . . . . . . . . . . . . . . . . . . . . . . . . . . . . . . . . . . . . . . . . . . . . . . . . . . . . . X I I I A P P E N D I X E : A D D I T I O N A L E C O N O M I C D A T A A N D S C E N A R I O S . . . . . . . . . . . . . X V I I I A P P E N D I X F : A C R Y L I C W E A T H E R I N G I N F O R M A T I O N . . . . . . . . . . . . . . . . . . . . . . . . . . . . . X X I A P P E N D I X G : P G & E L S - 2 R A T E S C H E D U L E . . . . . . . . . . . . . . . . . . . . . . . . . . . . . . . . . . . . . . . . X X I I
P r e f a c e Energy Solutions provided monitoring, data collection, and data analysis services for an LED Street Lighting Assessment project under contract to the Emerging Technologies Program of Pacific Gas and Electric Company. The project replaced high pressure sodium luminaires in an Oakland, CA neighborhood with new ‘Beta’ LED luminaires from Ruud Lighting.
Acknowledgements This project was funded by the Emerging Technologies Program of Pacific Gas and Electric Company. Energy Solutions would like to gratefully acknowledge the direction and assistance of Pacific Gas and Electric Company, the City of Oakland, Pacific Northwest National Laboratory (representing the United States Department of Energy), and Ruud Lighting for their participation and support of this project.
E xe c u t ive S u m m a r y This report summarizes an LED street lighting assessment project conducted to study the applicability of LED luminaires in a street lighting application. In the first of two phases, the project team took pre- and post-installation measurements in a parking lot owned by the City of Oakland to assess the likelihood of any negative safety impacts from the installation of the LED luminaires on a public street. With no significant concerns so identified, the project progressed to the second phase involving installation on actual public roadways. Quantitative and qualitative light and electrical power measurements were taken on all streets, and economic costs estimated and qualitative satisfaction gauged with a resident survey. This report documents the results of this second phase1.
In Phase 2 of the project, fifteen 78 watt LED luminaries replaced a like number of 121 watt high pressure sodium (HPS) luminaires (100 nominal watts) on Sextus and Tunis roads between Empire Rd and Coral Rd in a residential area of Oakland. To allow a variety of comparisons, Sextus Rd was illuminated with fresh HPS luminaires on the eastern half and LED luminaires on the western half, and Tunis Rd was illuminated exclusively with LED luminaires, while the adjacent Cairo Rd was entirely relamped with new HPS lamps. All luminaires have heights of 28.5’ above the road surface, with spacings of approximately 110’, 120’, or 165’ between luminaires.
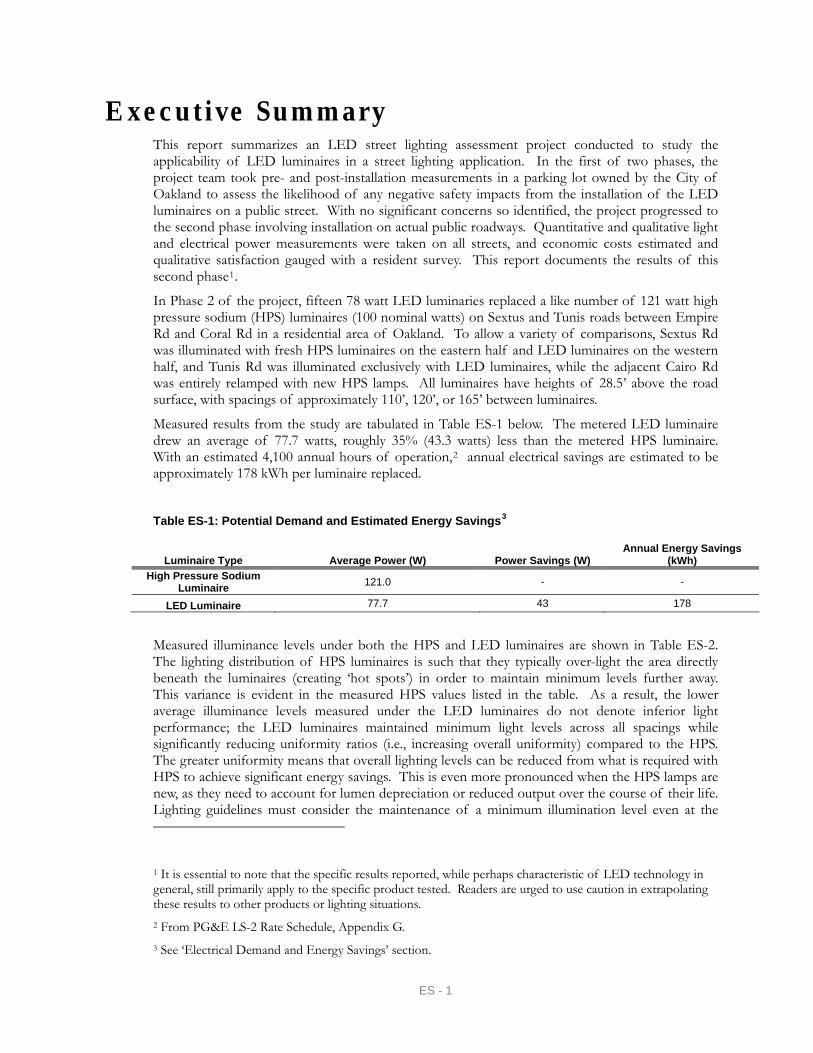
Measured results from the study are tabulated in Table ES-1 below. The metered LED luminaire drew an average of 77.7 watts, roughly 35% (43.3 watts) less than the metered HPS luminaire. With an estimated 4,100 annual hours of operation,2 annual electrical savings are estimated to be approximately 178 kWh per luminaire replaced.
Table ES-1: Potential Demand and Estimated Energy Savings3
Luminaire Type Average Power (W) Power Savings (W) Annual Energy Savings
(kWh) High Pressure Sodium
Luminaire 121.0 - -
LED Luminaire 77.7 43 178
Measured illuminance levels under both the HPS and LED luminaires are shown in Table ES-2. The lighting distribution of HPS luminaires is such that they typically over-light the area directly beneath the luminaires (creating ‘hot spots’) in order to maintain minimum levels further away. This variance is evident in the measured HPS values listed in the table. As a result, the lower average illuminance levels measured under the LED luminaires do not denote inferior light performance; the LED luminaires maintained minimum light levels across all spacings while significantly reducing uniformity ratios (i.e., increasing overall uniformity) compared to the HPS. The greater uniformity means that overall lighting levels can be reduced from what is required with HPS to achieve significant energy savings. This is even more pronounced when the HPS lamps are new, as they need to account for lumen depreciation or reduced output over the course of their life. Lighting guidelines must consider the maintenance of a minimum illumination level even at the
1 It is essential to note that the specific results reported, while perhaps characteristic of LED technology in general, still primarily apply to the specific product tested. Readers are urged to use caution in extrapolating these results to other products or lighting situations. 2 From PG&E LS-2 Rate Schedule, Appendix G. 3 See ‘Electrical Demand and Energy Savings’ section.
ES - 1
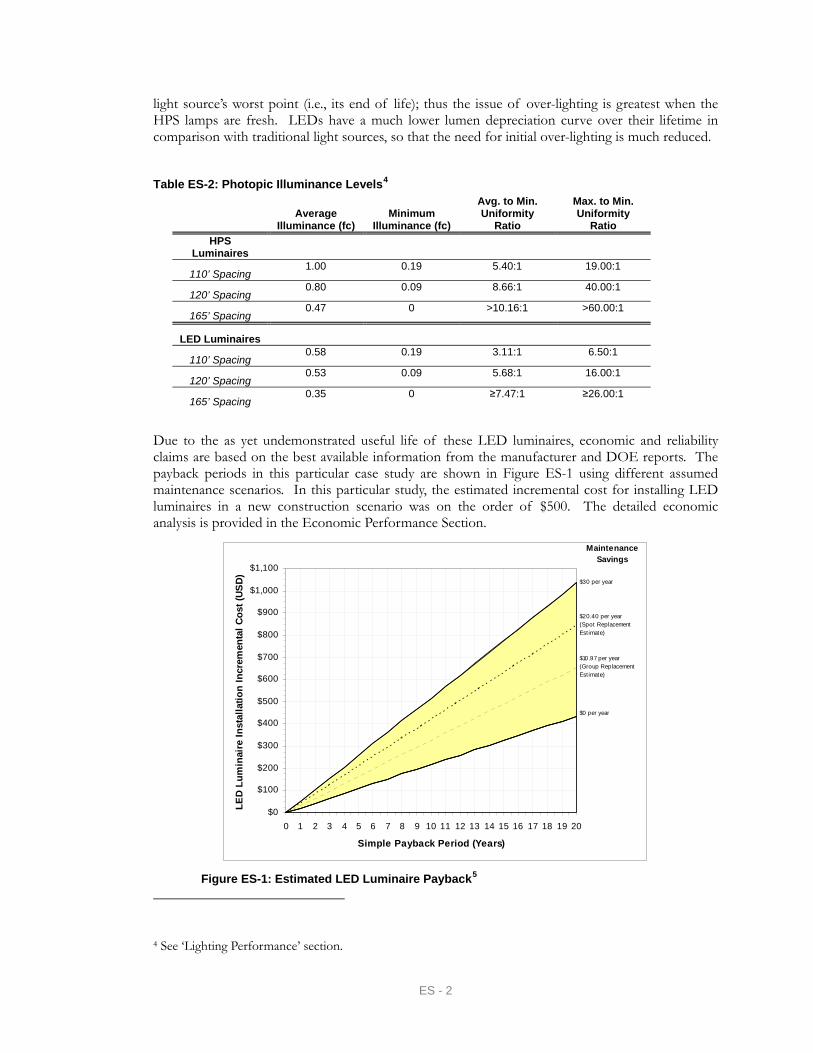
light source’s worst point (i.e., its end of life); thus the issue of over-lighting is greatest when the HPS lamps are fresh. LEDs have a much lower lumen depreciation curve over their lifetime in comparison with traditional light sources, so that the need for initial over-lighting is much reduced.
Table ES-2: Photopic Illuminance Levels4
Average
Illuminance (fc) Minimum
Illuminance (fc)
Avg. to Min. Uniformity
Ratio
Max. to Min. Uniformity
Ratio HPS
Luminaires
110’ Spacing 1.00 0.19 5.40:1 19.00:1
120’ Spacing 0.80 0.09 8.66:1 40.00:1
165’ Spacing 0.47 0 >10.16:1 >60.00:1
LED Luminaires
110’ Spacing 0.58 0.19 3.11:1 6.50:1
120’ Spacing 0.53 0.09 5.68:1 16.00:1
165’ Spacing 0.35 0 ≥7.47:1 ≥26.00:1
Due to the as yet undemonstrated useful life of these LED luminaires, economic and reliability claims are based on the best available information from the manufacturer and DOE reports. The payback periods in this particular case study are shown in Figure ES-1 using different assumed maintenance scenarios. In this particular study, the estimated incremental cost for installing LED luminaires in a new construction scenario was on the order of $500. The detailed economic analysis is provided in the Economic Performance Section.
$0
$100
$200
$300
$400
$500
$600
$700
$800
$900
$1,000
$1,100
0 1 2 3 4 5 6 7 8 9 10 11 12 13 14 15 16 17 18 19 20
Simple Payback Period (Years)
LED
Lum
inai
re In
stal
latio
n In
crem
enta
l Cos
t (US
D)
$0 per year
$30 per year
Maintenance Savings
$10.97 per year(Group Replacement Est imate)
$20.40 per year(Spot Replacement Est imate)
Figure ES-1: Estimated LED Luminaire Payback5
4 See ‘Lighting Performance’ section.
ES - 2
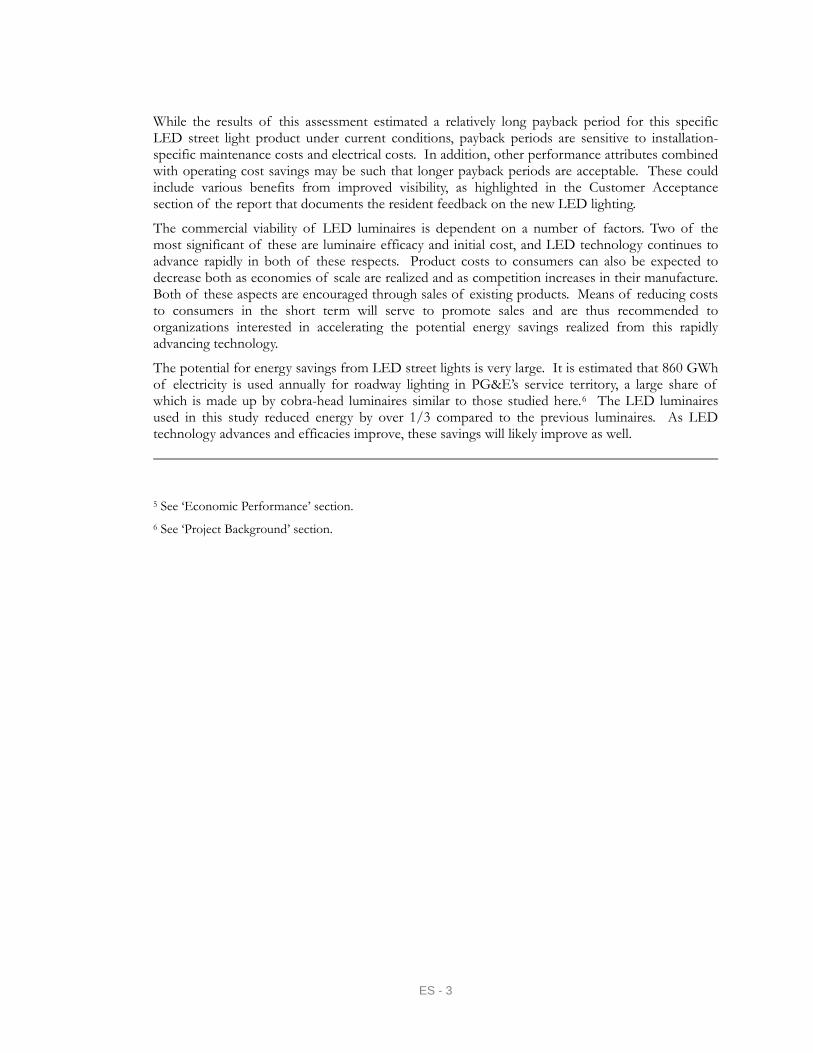
While the results of this assessment estimated a relatively long payback period for this specific LED street light product under current conditions, payback periods are sensitive to installation-specific maintenance costs and electrical costs. In addition, other performance attributes combined with operating cost savings may be such that longer payback periods are acceptable. These could include various benefits from improved visibility, as highlighted in the Customer Acceptance section of the report that documents the resident feedback on the new LED lighting.
The commercial viability of LED luminaires is dependent on a number of factors. Two of the most significant of these are luminaire efficacy and initial cost, and LED technology continues to advance rapidly in both of these respects. Product costs to consumers can also be expected to decrease both as economies of scale are realized and as competition increases in their manufacture. Both of these aspects are encouraged through sales of existing products. Means of reducing costs to consumers in the short term will serve to promote sales and are thus recommended to organizations interested in accelerating the potential energy savings realized from this rapidly advancing technology.
The potential for energy savings from LED street lights is very large. It is estimated that 860 GWh of electricity is used annually for roadway lighting in PG&E’s service territory, a large share of which is made up by cobra-head luminaires similar to those studied here.6 The LED luminaires used in this study reduced energy by over 1/3 compared to the previous luminaires. As LED technology advances and efficacies improve, these savings will likely improve as well.
5 See ‘Economic Performance’ section. 6 See ‘Project Background’ section.
ES - 3
P r o j e c t B a c k g r o u n d
Project Overview The LED Street Lighting Assessment project studied the applicability of light-emitting-diode (LED) luminaires on existing street light poles. High pressure sodium (HPS) luminaires were replaced with new LED luminaires on a street located in Oakland. The applicability of the technology was determined by light output, energy and power usage, economic factors, and qualitative satisfaction. The LED Street Lighting Assessment project was conducted as part of the Emerging Technologies Program of Pacific Gas and Electric Company. The Emerging Technologies program “is an information-only program that seeks to accelerate the introduction of innovative energy efficient technologies, applications and analytical tools that are not widely adopted in California…. [The] information includes verified energy savings and demand reductions, market potential and market barriers, incremental cost, and the technology’s life expectancy.”7
Technological Overview At the time of this assessment, LEDs are beginning to be installed in outdoor settings because of luminaire ability to provide greater control of light dispersion and greater maintenance savings compared to traditional sources, as well as changing industry perception of higher quality light for exterior use. One corresponding application is street and roadway luminaires. Currently, streets are illuminated with high pressure sodium, and less frequently metal halide, low pressure sodium, or other lights. HPS lights are used primarily because of their long rated life and high efficiency relative to other conventional options, but have low color rendition. LEDs have the potential for even longer life than HPS, reduced maintenance, high color rendition, and reduced operating cost including lower energy usage. Currently however, the initial cost of LEDs is much higher than conventional light sources. The US Department of Energy reports the technology is changing at a rapid pace. Overall, the performance of LED luminaires is advancing in efficiency at a rate of approximately 35% annually, with costs decreasing at a rate of 20% annually.8
Market Overview A report by Navigant Consulting in 2002 estimates that lighting makes up approximately 22% of IOU kWh sales on a national scale. Of that amount roughly 4%, or 1% of total IOU kWh sales, are for roadway lighting.9 Using kWh sales figures from a 2006 study,10 the total consumption in PG&E’s service territory for lighting is calculated to be on the order of 21,500 GWh in 2002, with a resulting 860 GWh for roadway lighting. Although these figures are not exclusively for the cobra-
7 Pacific Gas and Electric Company (2006). Program Descriptions, Market Integrated Demand Side Management, Emerging Technologies. PGE2011 8 Navigant Consulting, Inc. (2006). “Solid State Lighting Research and Development Portfolio. Multi-Year Development Plan. FY’07-FY’12.” 9 Navigant Consulting, Inc. (2002). “US Lighting Market Characterization, Volume I.” 10 Itron Inc., et al (2006). “California Energy Efficiency Potential Study.”
1

head luminaires analyzed in this study, cobra-head luminaires represent a large share of this energy usage.
2
P r o j e c t O b j e c t ive s The objectives of the project were to examine electrical, lighting, and economic performance of cobra-head HPS luminaires as compared to LED luminaires. The potential electrical demand and energy savings were measured in terms of average wattage and estimated annual kWh usage. Lighting performance was measured in terms of illuminance, uniformity, correlated color temperature (in Kelvin), and by the satisfaction and concerns of interested parties. Finally, economic performance was calculated as simple-payback for substitution in new installation or replacement scenarios, accounting for lamp life-span, maintenance costs, and electrical costs.
3
M e t h o d o l og y
Host site information Fifteen LED luminaires were installed on Sextus and Tunis roads between Empire Rd and Coral Rd near the Oakland International Airport in Oakland, California. To allow a variety of comparisons, Sextus Rd was illuminated with fresh HPS luminaires on the eastern half and LED luminaires on the western half, and Tunis Rd was illuminated exclusively with LED luminaires, while the adjacent Cairo Rd was entirely relamped with new HPS lamps. The pre-installation streetlights on Tunis Road were high pressure sodium cobra-head luminaires.
This is a residential neighborhood, where all luminaires have heights of approximately 28.5’ above the road surface, with spacings of approximately 110’, 120’, or 165’ between luminaires.
Monitoring Plan Two similar Monitoring Plans for each phase were developed for this assessment. Each called for pre-installation and post-installation field visits. In both cases, the monitoring area was set-up during our first site visit but before taking measurements. In the first phase, the project team took pre- and post-installation measurements in a parking lot owned by the City of Oakland to assess the likelihood of any negative safety impacts from the installation of the LED luminaires on a public street. With no significant concerns so identified, the project progressed to the second phase involving installation on actual public roadways. Therefore, the following describes the Phase 2 Monitoring Plan.
The pre-installation field visit and grid set-up were combined and occurred prior to installation of the LED luminaires. It was intended to document the existing condition of the lighting system. The HPS lamps had been replaced and the luminaires had been cleaned in anticipation of this work. The HPS lamps were burned in for approximately 100 hours prior to installation. All light measurements were taken after dusk.
Photopic and scotopic illuminance measurements were taken on a 395’ x 36’ grid over an area containing four luminaires. The distance between the first and second luminaires is 110’, the distance between the second and third luminaires is 165', and finally the distance between the third and fourth luminaires is 120'. Ideally, luminaires are spaced equally for lighting uniformity, but in reality, street lights tend to be located at the intersection of property lines so that the street light is not solely located in one yard. The grid spacing was 12’ north-south over the entire area, modified from the planned 10' because of the street width. Grid spacing in the area between the luminaires located 120' apart was 12’ east-west and 10' apart in the areas between the luminaires located 165’ and 110’ apart. The measurement area is visually depicted in Appendix B.
The luminaires were located approximately 28.5' above the finished grade, on 6’ mounting arms from wood poles. The illuminance levels were taken with a Solar Light PMA220 meter with photopic and scotopic detectors at a height of 18” above ground. This meter has a precision of 1 lux (0.09 foot-candles).
It should be noted that the measurements taken differ slightly from those defined in the “IESNA Guide for Photometric Measurement of Roadway Lighting Installations.” The Illuminating Engineering Society of North America (IESNA) recommends that the grid be laid out so that measurements are taken beginning at one-half the grid spacing from the spot directly beneath the luminaire. In this study, the measurement grid was laid out such that measurements were taken at the areas directly underneath luminaires and the midpoints between luminaires, corresponding to the predicted maximum and minimum illuminance levels in the test area. This was done to capture
4
the full effect of differing uniformity in the HPS and LED luminaires. IESNA also recommends that care be taken to level the detector before each measurement and that the detector be less than 6” off the ground. The monitoring team determined that the former recommendation was of greater import, so measurements were taken at 18” – the lowest level that could achieved with the combination of leveling tripod and detectors.
Periodic temperature measurements were also taken throughout the testing period. These measurements were taken approximately every 20 minutes with a digital thermometer for both the HPS and LED measurements. In addition, during the night of the LED measurements, relative humidity and additional temperature measurements were taken every 30 second with a HOBO Instruments U12 datalogger.
For measurement locations and geometry, see Appendix B1. Measurements were taken consistent with Appendix B2. The information gathered at each of the HPS and LED field visits was:
1. On-site photographs
2. Power, illumination, correlated color temperature and ambient temperature readings
The following monitoring equipment used in the execution of this Monitoring Plan was obtained from the Pacific Energy Center:
I L L U M I N A N C E M E T E R Solar Light SnP Meter (PMA220) with Photopic Detector (PMA2130) and Scotopic Detection (PMA2131), last calibrated 10/2007
C O R R E L A T E D C O L O R T E M P E R A T U R E M E T E R Konica Minolta Chroma Meter, Model CL-200, last calibrated 10/2007
P O W E R M E T E R Dent ElitePro Datalogger, last calibrated 4/2007
A M B I E N T T E M P E R A T U R E Digital Thermometer (GE61290DWT)
Hobo Instruments U12 Datalogger, last calibration unknown
5
P r o j e c t R e s u l t s a n d D i s c u s s i o n
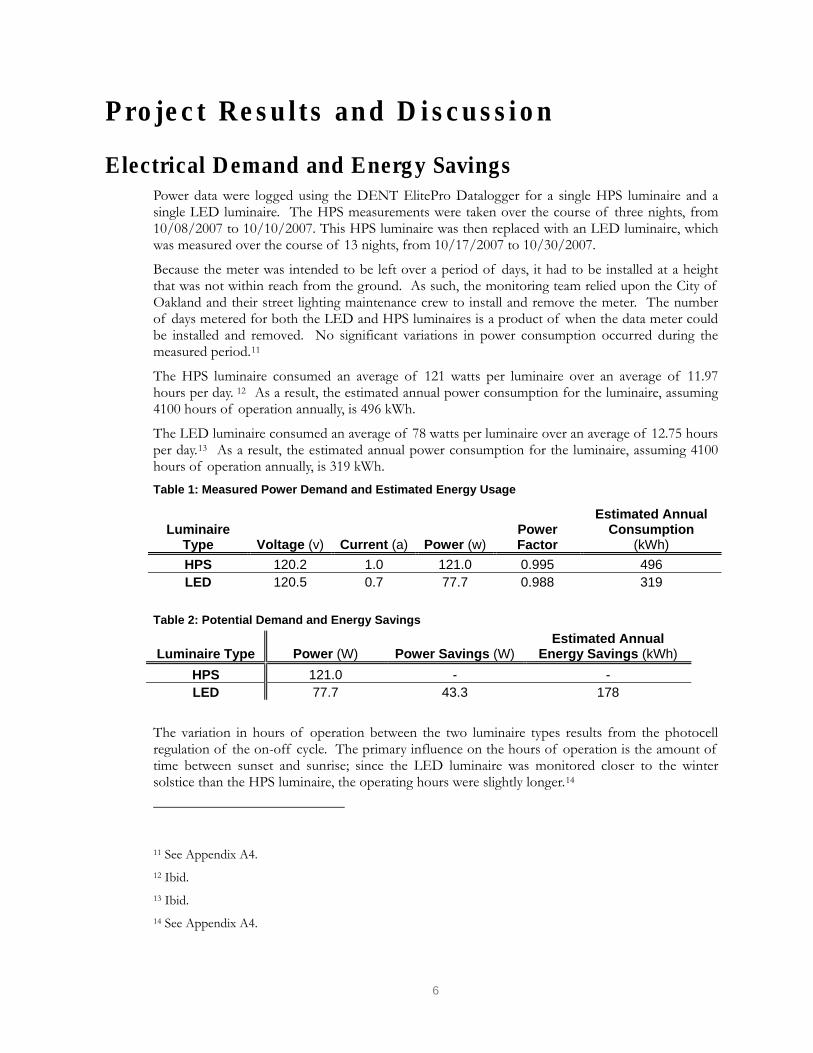
Electrical Demand and Energy Savings Power data were logged using the DENT ElitePro Datalogger for a single HPS luminaire and a single LED luminaire. The HPS measurements were taken over the course of three nights, from 10/08/2007 to 10/10/2007. This HPS luminaire was then replaced with an LED luminaire, which was measured over the course of 13 nights, from 10/17/2007 to 10/30/2007.
Because the meter was intended to be left over a period of days, it had to be installed at a height that was not within reach from the ground. As such, the monitoring team relied upon the City of Oakland and their street lighting maintenance crew to install and remove the meter. The number of days metered for both the LED and HPS luminaires is a product of when the data meter could be installed and removed. No significant variations in power consumption occurred during the measured period.11
The HPS luminaire consumed an average of 121 watts per luminaire over an average of 11.97 hours per day. 12 As a result, the estimated annual power consumption for the luminaire, assuming 4100 hours of operation annually, is 496 kWh.
The LED luminaire consumed an average of 78 watts per luminaire over an average of 12.75 hours per day.13 As a result, the estimated annual power consumption for the luminaire, assuming 4100 hours of operation annually, is 319 kWh. Table 1: Measured Power Demand and Estimated Energy Usage
Luminaire Type Voltage (v) Current (a) Power (w)
Power Factor
Estimated Annual Consumption
(kWh) HPS 120.2 1.0 121.0 0.995 496 LED 120.5 0.7 77.7 0.988 319
Table 2: Potential Demand and Energy Savings
Luminaire Type Power (W) Power Savings (W) Estimated Annual
Energy Savings (kWh) HPS 121.0 - - LED 77.7 43.3 178
The variation in hours of operation between the two luminaire types results from the photocell regulation of the on-off cycle. The primary influence on the hours of operation is the amount of time between sunset and sunrise; since the LED luminaire was monitored closer to the winter solstice than the HPS luminaire, the operating hours were slightly longer.14
11 See Appendix A4. 12 Ibid. 13 Ibid. 14 See Appendix A4.
6
Lighting Performance
ILLUMINANCE
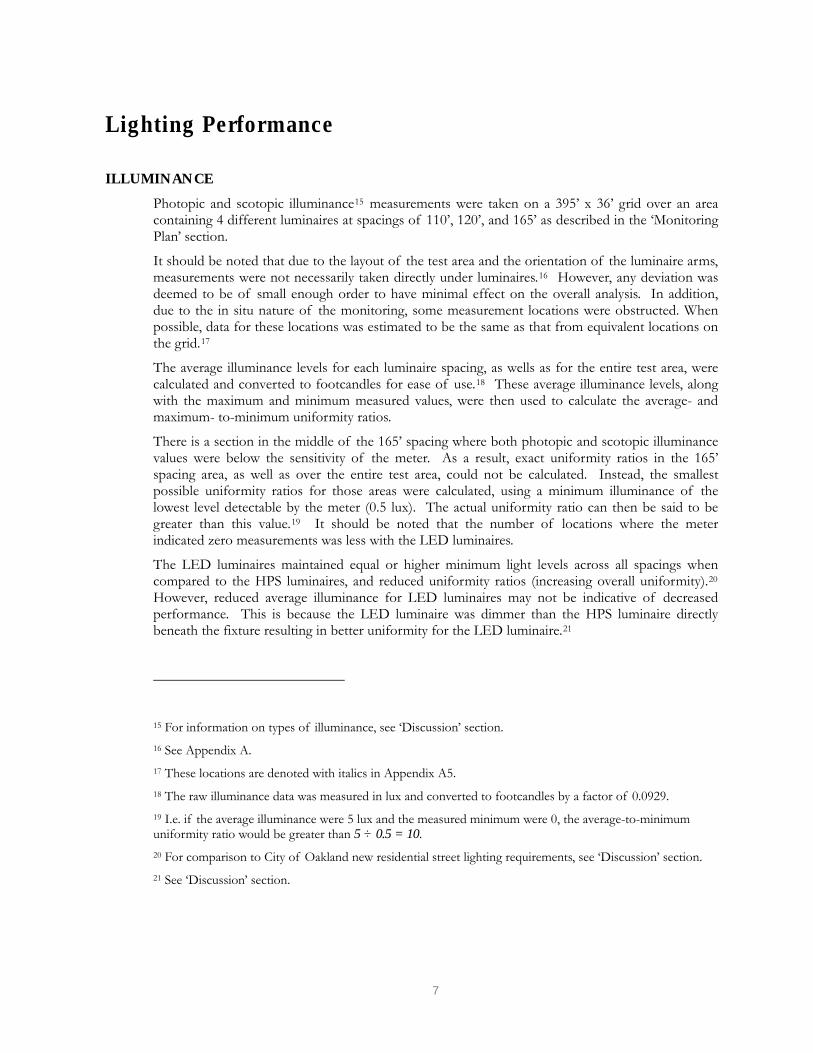
Photopic and scotopic illuminance15 measurements were taken on a 395’ x 36’ grid over an area containing 4 different luminaires at spacings of 110’, 120’, and 165’ as described in the ‘Monitoring Plan’ section.
It should be noted that due to the layout of the test area and the orientation of the luminaire arms, measurements were not necessarily taken directly under luminaires.16 However, any deviation was deemed to be of small enough order to have minimal effect on the overall analysis. In addition, due to the in situ nature of the monitoring, some measurement locations were obstructed. When possible, data for these locations was estimated to be the same as that from equivalent locations on the grid.17
The average illuminance levels for each luminaire spacing, as wells as for the entire test area, were calculated and converted to footcandles for ease of use.18 These average illuminance levels, along with the maximum and minimum measured values, were then used to calculate the average- and maximum- to-minimum uniformity ratios.
There is a section in the middle of the 165’ spacing where both photopic and scotopic illuminance values were below the sensitivity of the meter. As a result, exact uniformity ratios in the 165’ spacing area, as well as over the entire test area, could not be calculated. Instead, the smallest possible uniformity ratios for those areas were calculated, using a minimum illuminance of the lowest level detectable by the meter (0.5 lux). The actual uniformity ratio can then be said to be greater than this value.19 It should be noted that the number of locations where the meter indicated zero measurements was less with the LED luminaires.
The LED luminaires maintained equal or higher minimum light levels across all spacings when compared to the HPS luminaires, and reduced uniformity ratios (increasing overall uniformity).20 However, reduced average illuminance for LED luminaires may not be indicative of decreased performance. This is because the LED luminaire was dimmer than the HPS luminaire directly beneath the fixture resulting in better uniformity for the LED luminaire.21
15 For information on types of illuminance, see ‘Discussion’ section. 16 See Appendix A. 17 These locations are denoted with italics in Appendix A5. 18 The raw illuminance data was measured in lux and converted to footcandles by a factor of 0.0929. 19 I.e. if the average illuminance were 5 lux and the measured minimum were 0, the average-to-minimum uniformity ratio would be greater than 5 ÷ 0.5 = 10. 20 For comparison to City of Oakland new residential street lighting requirements, see ‘Discussion’ section. 21 See ‘Discussion’ section.
7
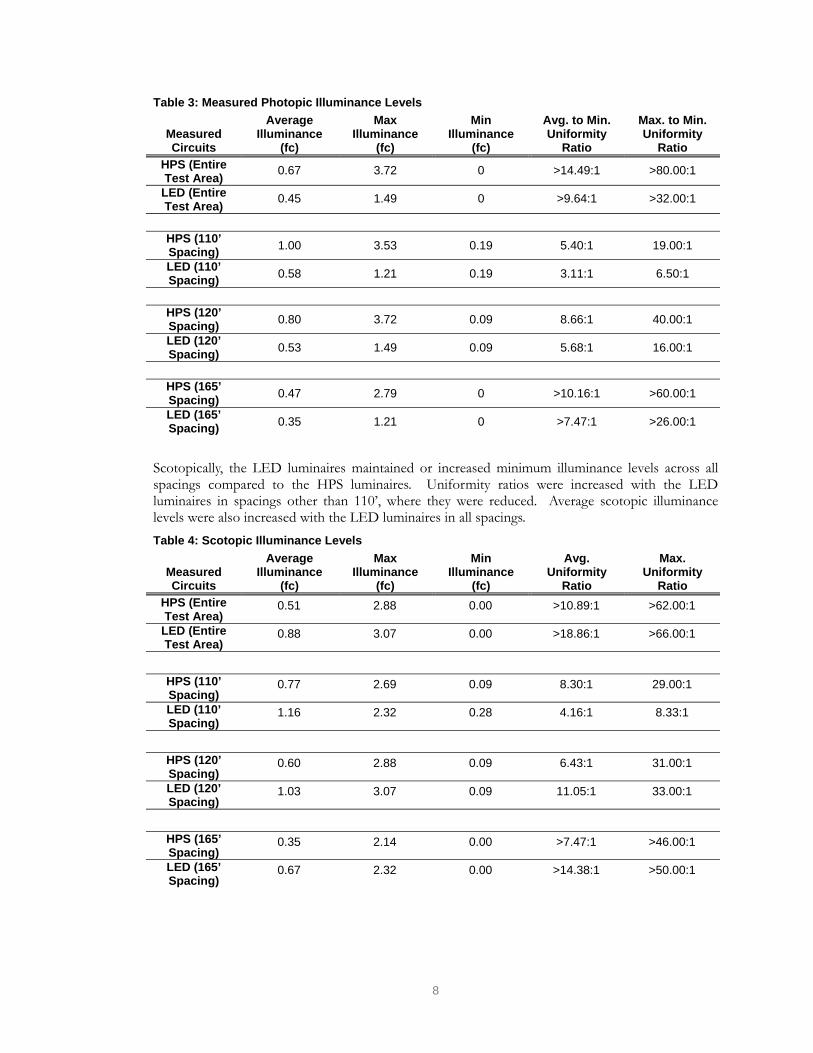
Table 3: Measured Photopic Illuminance Levels
Measured Circuits
Average Illuminance
(fc)
Max Illuminance
(fc)
Min Illuminance
(fc)
Avg. to Min. Uniformity
Ratio
Max. to Min. Uniformity
Ratio HPS (Entire Test Area) 0.67 3.72 0 >14.49:1 >80.00:1
LED (Entire Test Area) 0.45 1.49 0 >9.64:1 >32.00:1
HPS (110’ Spacing) 1.00 3.53 0.19 5.40:1 19.00:1
LED (110’ Spacing) 0.58 1.21 0.19 3.11:1 6.50:1
HPS (120’ Spacing) 0.80 3.72 0.09 8.66:1 40.00:1
LED (120’ Spacing) 0.53 1.49 0.09 5.68:1 16.00:1
HPS (165’ Spacing) 0.47 2.79 0 >10.16:1 >60.00:1
LED (165’ Spacing) 0.35 1.21 0 >7.47:1 >26.00:1
Scotopically, the LED luminaires maintained or increased minimum illuminance levels across all spacings compared to the HPS luminaires. Uniformity ratios were increased with the LED luminaires in spacings other than 110’, where they were reduced. Average scotopic illuminance levels were also increased with the LED luminaires in all spacings. Table 4: Scotopic Illuminance Levels
Measured Circuits
Average Illuminance
(fc)
Max Illuminance
(fc)
Min Illuminance
(fc)
Avg. Uniformity
Ratio
Max. Uniformity
Ratio HPS (Entire Test Area)
0.51 2.88 0.00 >10.89:1 >62.00:1
LED (Entire Test Area)
0.88 3.07 0.00 >18.86:1 >66.00:1
HPS (110’ Spacing)
0.77 2.69 0.09 8.30:1 29.00:1
LED (110’ Spacing)
1.16 2.32 0.28 4.16:1 8.33:1
HPS (120’ Spacing)
0.60 2.88 0.09 6.43:1 31.00:1
LED (120’ Spacing)
1.03 3.07 0.09 11.05:1 33.00:1
HPS (165’ Spacing)
0.35 2.14 0.00 >7.47:1 >46.00:1
LED (165’ Spacing)
0.67 2.32 0.00 >14.38:1 >50.00:1
8
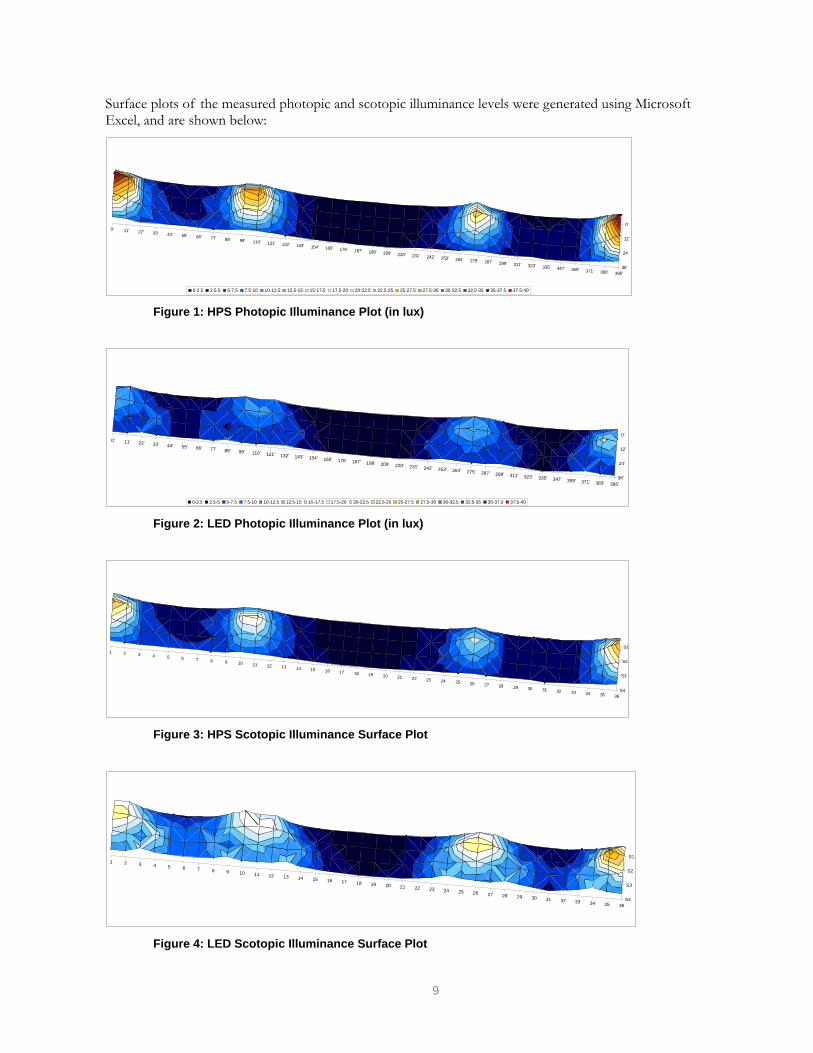
Surface plots of the measured photopic and scotopic illuminance levels were generated using Microsoft Excel, and are shown below:
0' 11' 22' 33' 44' 55' 66' 77' 88' 99' 110' 121' 132' 143' 154' 165' 176' 187' 198' 209' 220' 231' 242' 253' 264' 275' 287' 299' 311' 323' 335' 347' 359' 371' 383' 395'
0'
12'
24'
36'
0-2.5 2.5-5 5-7.5 7.5-10 10-12.5 12.5-15 15-17.5 17.5-20 20-22.5 22.5-25 25-27.5 27.5-30 30-32.5 32.5-35 35-37.5 37.5-40 Figure 1: HPS Photopic Illuminance Plot (in lux)
0' 11' 22' 33' 44' 55' 66' 77' 88' 99' 110' 121' 132' 143' 154' 165' 176' 187' 198' 209' 220' 231' 242' 253' 264' 275' 287' 299' 311' 323' 335' 347' 359' 371' 383' 395'
0'
12'
24'
36'
0-2.5 2.5-5 5-7.5 7.5-10 10-12.5 12.5-15 15-17.5 17.5-20 20-22.5 22.5-25 25-27.5 27.5-30 30-32.5 32.5-35 35-37.5 37.5-40 Figure 2: LED Photopic Illuminance Plot (in lux)
1 2 3 4 5 6 7 8 9 10 11 12 13 14 15 16 17 18 19 20 21 22 23 24 25 26 27 28 29 30 31 32 33 34 35 36
S1
S2
S3
S4
Figure 3: HPS Scotopic Illuminance Surface Plot
1 2 3 4 5 6 7 8 9 10 11 12 13 14 15 16 17 18 19 20 21 22 23 24 25 26 27 28 29 30 31 32 33 34 35 36
S1
S2
S3
S4
Figure 4: LED Scotopic Illuminance Surface Plot
9
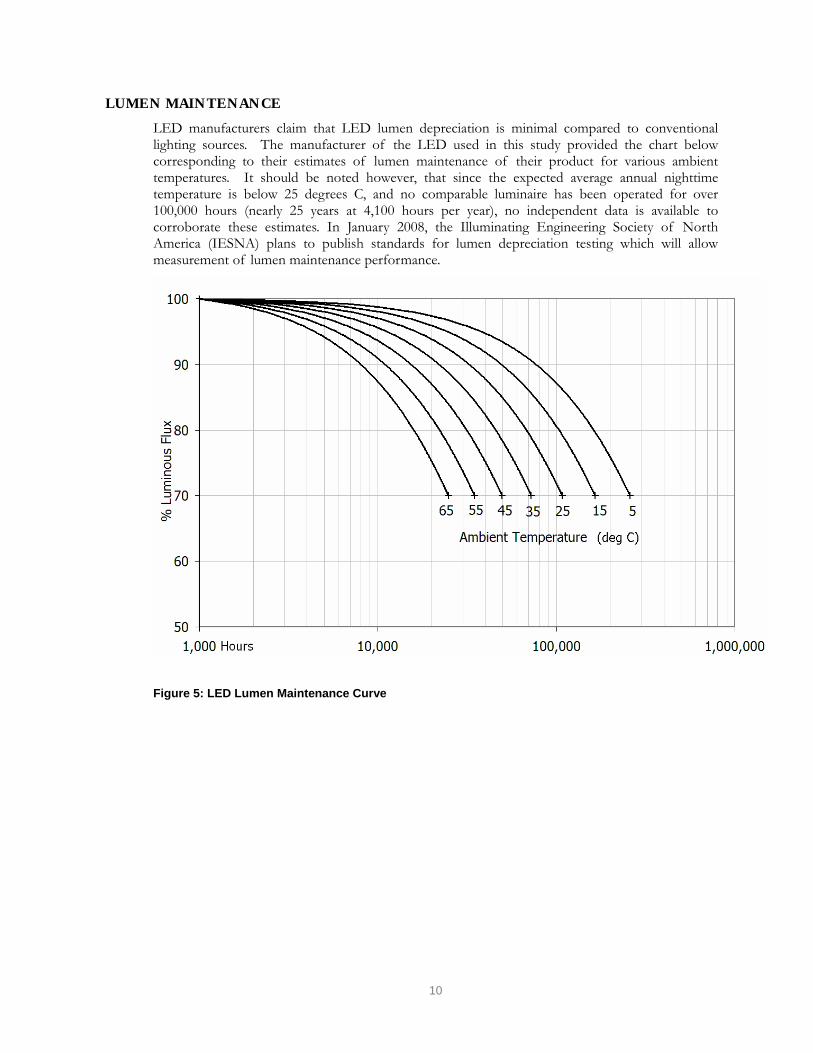
LUMEN MAINTENANCE
LED manufacturers claim that LED lumen depreciation is minimal compared to conventional lighting sources. The manufacturer of the LED used in this study provided the chart below corresponding to their estimates of lumen maintenance of their product for various ambient temperatures. It should be noted however, that since the expected average annual nighttime temperature is below 25 degrees C, and no comparable luminaire has been operated for over 100,000 hours (nearly 25 years at 4,100 hours per year), no independent data is available to corroborate these estimates. In January 2008, the Illuminating Engineering Society of North America (IESNA) plans to publish standards for lumen depreciation testing which will allow measurement of lumen maintenance performance.
Figure 5: LED Lumen Maintenance Curve
10
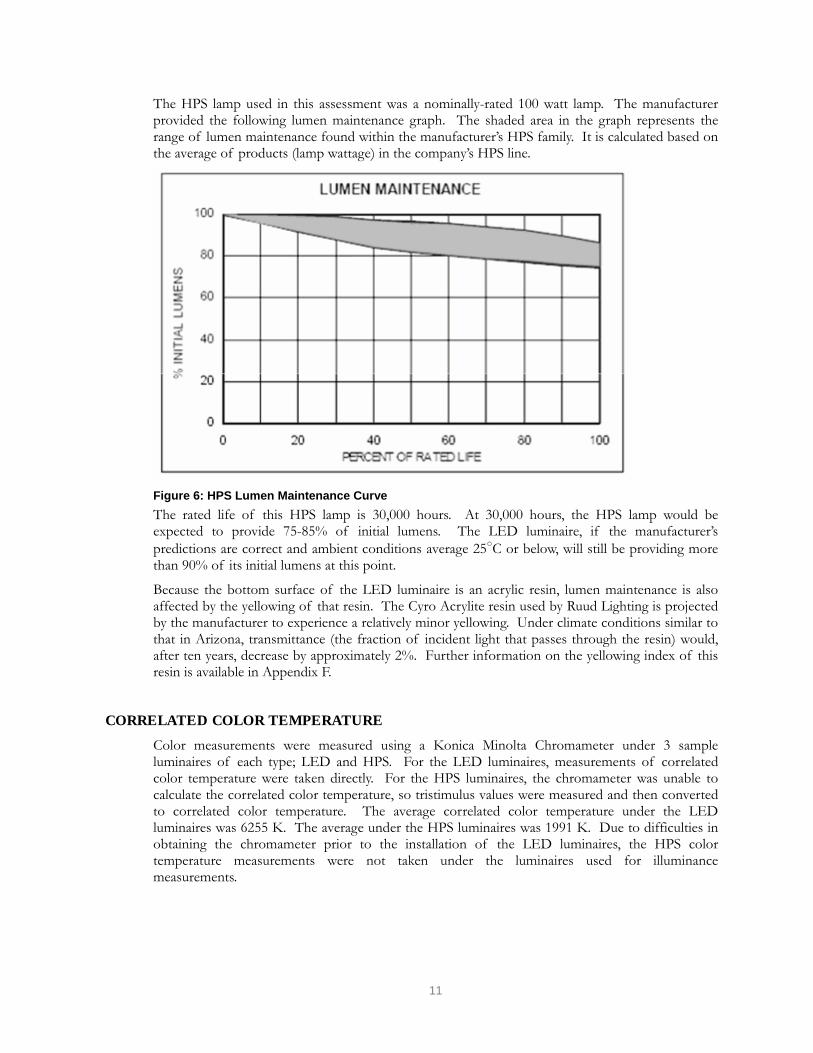
The HPS lamp used in this assessment was a nominally-rated 100 watt lamp. The manufacturer provided the following lumen maintenance graph. The shaded area in the graph represents the range of lumen maintenance found within the manufacturer’s HPS family. It is calculated based on the average of products (lamp wattage) in the company’s HPS line.
Figure 6: HPS Lumen Maintenance Curve The rated life of this HPS lamp is 30,000 hours. At 30,000 hours, the HPS lamp would be expected to provide 75-85% of initial lumens. The LED luminaire, if the manufacturer’s predictions are correct and ambient conditions average 25○C or below, will still be providing more than 90% of its initial lumens at this point.
Because the bottom surface of the LED luminaire is an acrylic resin, lumen maintenance is also affected by the yellowing of that resin. The Cyro Acrylite resin used by Ruud Lighting is projected by the manufacturer to experience a relatively minor yellowing. Under climate conditions similar to that in Arizona, transmittance (the fraction of incident light that passes through the resin) would, after ten years, decrease by approximately 2%. Further information on the yellowing index of this resin is available in Appendix F.
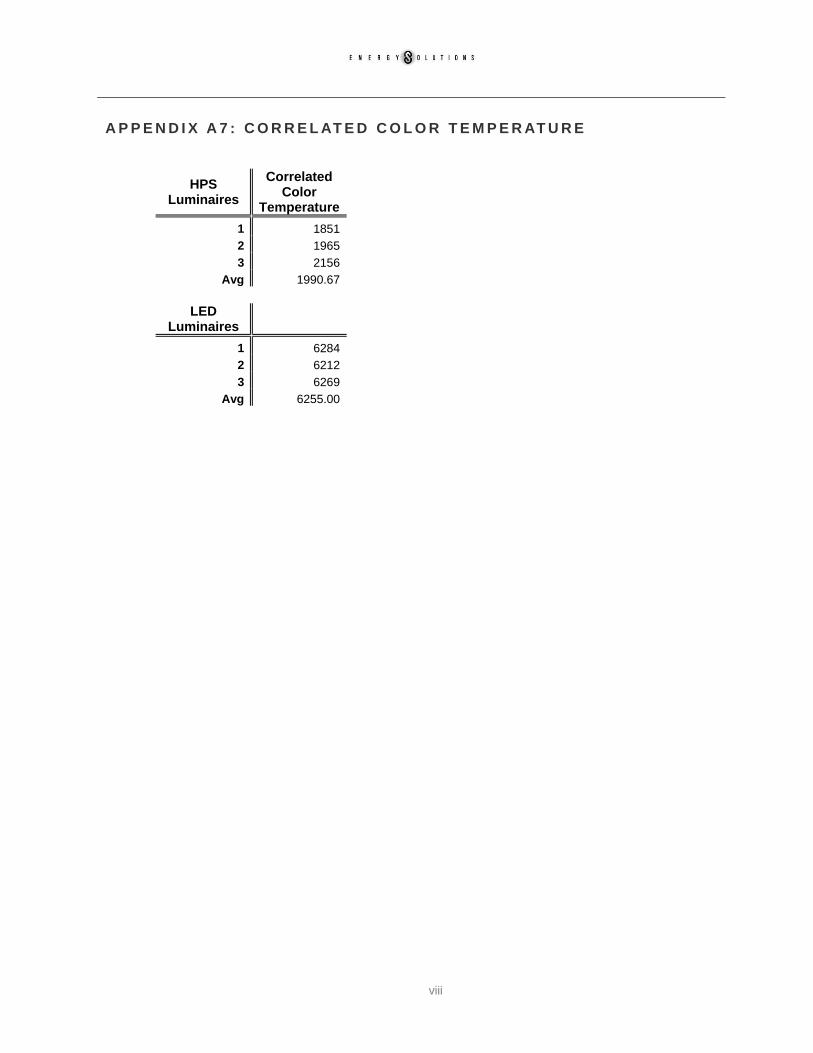
CORRELATED COLOR TEMPERATURE
Color measurements were measured using a Konica Minolta Chromameter under 3 sample luminaires of each type; LED and HPS. For the LED luminaires, measurements of correlated color temperature were taken directly. For the HPS luminaires, the chromameter was unable to calculate the correlated color temperature, so tristimulus values were measured and then converted to correlated color temperature. The average correlated color temperature under the LED luminaires was 6255 K. The average under the HPS luminaires was 1991 K. Due to difficulties in obtaining the chromameter prior to the installation of the LED luminaires, the HPS color temperature measurements were not taken under the luminaires used for illuminance measurements.
11
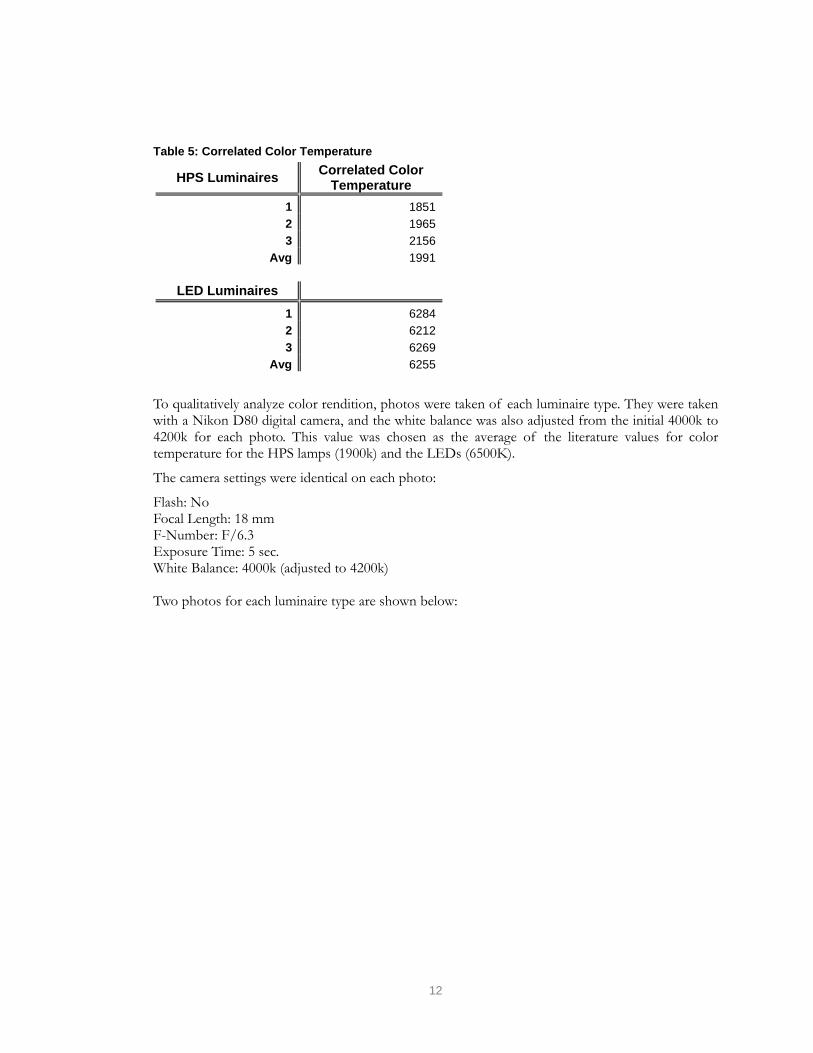
Table 5: Correlated Color Temperature
HPS Luminaires Correlated Color Temperature
1 1851 2 1965 3 2156
Avg 1991
LED Luminaires 1 6284 2 6212 3 6269
Avg 6255
To qualitatively analyze color rendition, photos were taken of each luminaire type. They were taken with a Nikon D80 digital camera, and the white balance was also adjusted from the initial 4000k to 4200k for each photo. This value was chosen as the average of the literature values for color temperature for the HPS lamps (1900k) and the LEDs (6500K).
The camera settings were identical on each photo:
Flash: No Focal Length: 18 mm F-Number: F/6.3 Exposure Time: 5 sec. White Balance: 4000k (adjusted to 4200k) Two photos for each luminaire type are shown below:
12
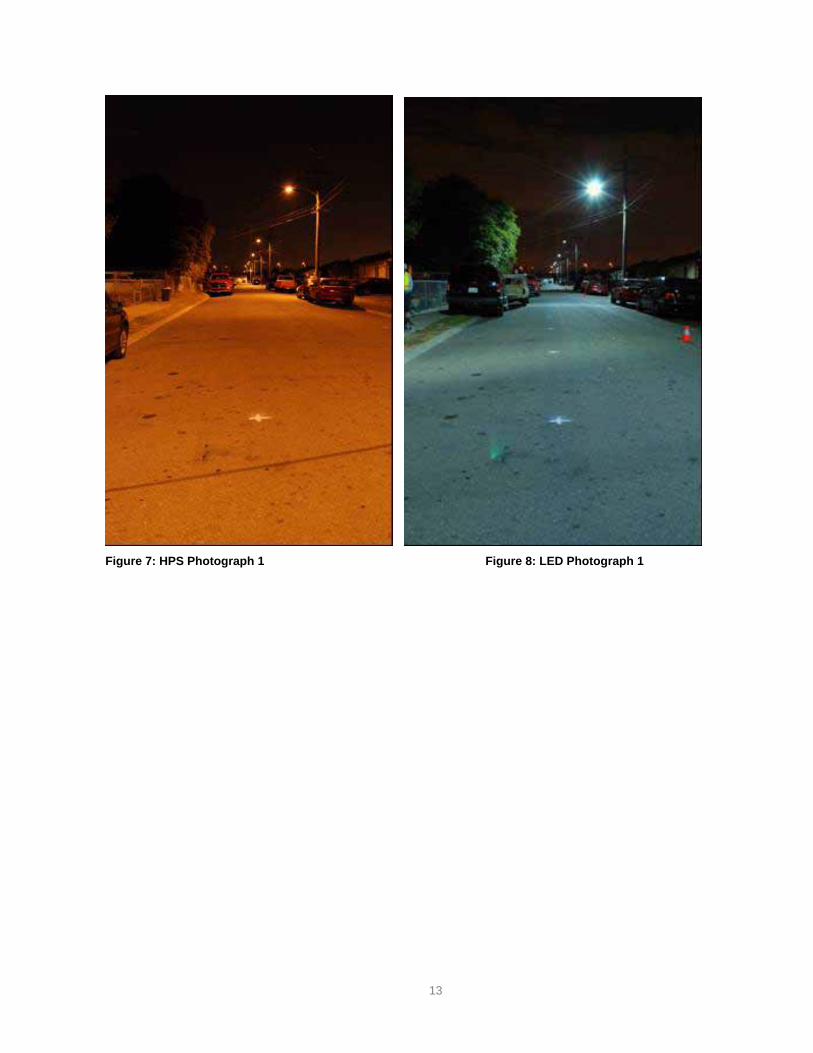
Figure 7: HPS Photograph 1 Figure 8: LED Photograph 1
13
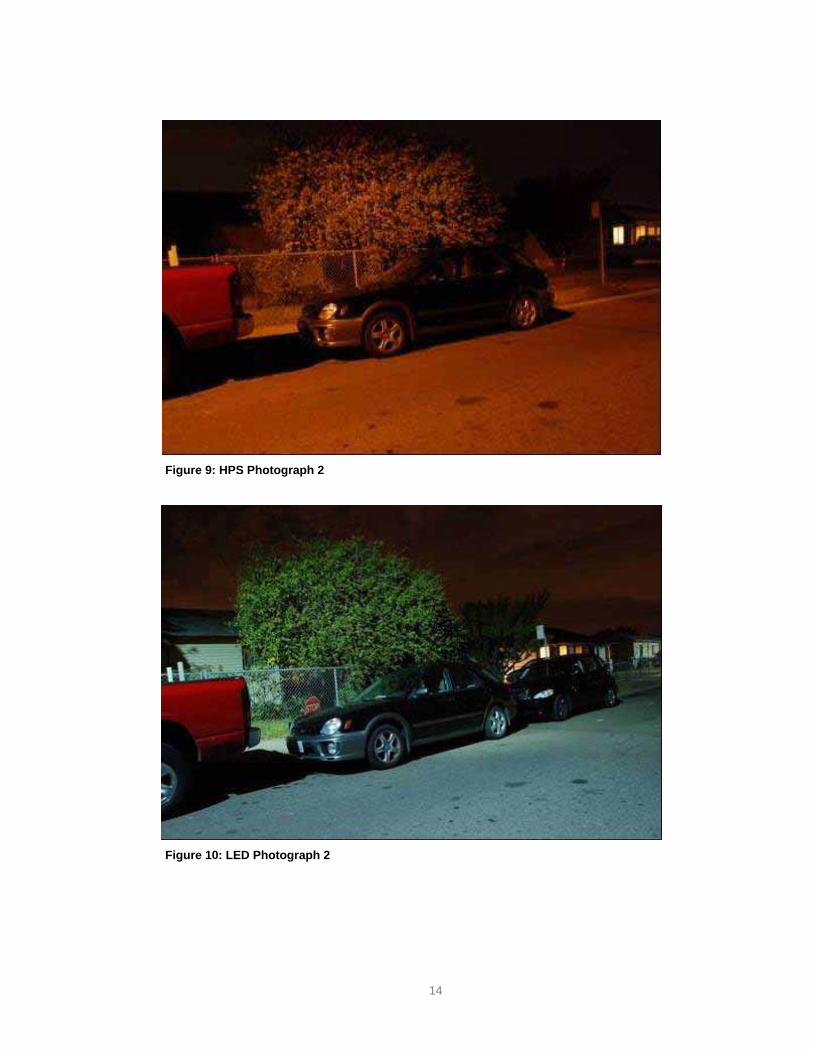
Figure 9: HPS Photograph 2
Figure 10: LED Photograph 2
14
CUSTOMER ACCEPTANCE
The Pacific Northwest National Laboratory managed the customer opinion survey for this assessment. A public opinion research firm, Fairbank, Maslin, Maullin & Associates, was engaged to contact residents of the neighborhood by telephone and obtain their feedback on the new lights. Phone numbers were obtained for 49 of the households on streets with new streetlights on their blocks, and for 106 of the households elsewhere in the neighborhood. Contact was attempted during the period November 30 through December 19, and reached 60 households in total. A copy of the survey, as well as full results, are presented in Appendix D.
The first question asked of residents was if they had in fact noticed the change in street lighting. A “no” to this question meant skipping most of the rest of the questions, other than the final demographic questions on age and gender. Ultimately, only 16 residences on the streets directly under the lighting and 4 residences elsewhere in the neighborhood were reached that reported noticing the new lights. The results below are therefore limited to 20 responses; a number sufficient to note any overwhelming trends but insufficient to perform any statistical extrapolation to a larger population.
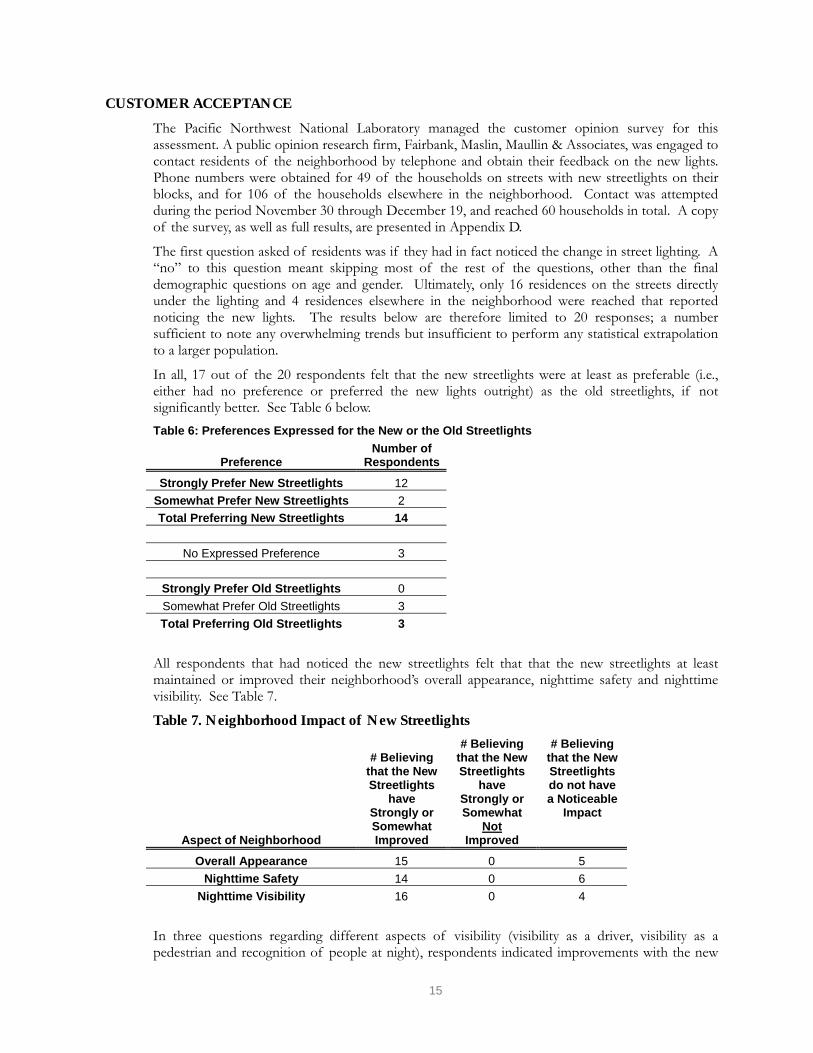
In all, 17 out of the 20 respondents felt that the new streetlights were at least as preferable (i.e., either had no preference or preferred the new lights outright) as the old streetlights, if not significantly better. See Table 6 below. Table 6: Preferences Expressed for the New or the Old Streetlights
Preference Number of
Respondents
Strongly Prefer New Streetlights 12 Somewhat Prefer New Streetlights 2 Total Preferring New Streetlights 14
No Expressed Preference 3
Strongly Prefer Old Streetlights 0 Somewhat Prefer Old Streetlights 3 Total Preferring Old Streetlights 3
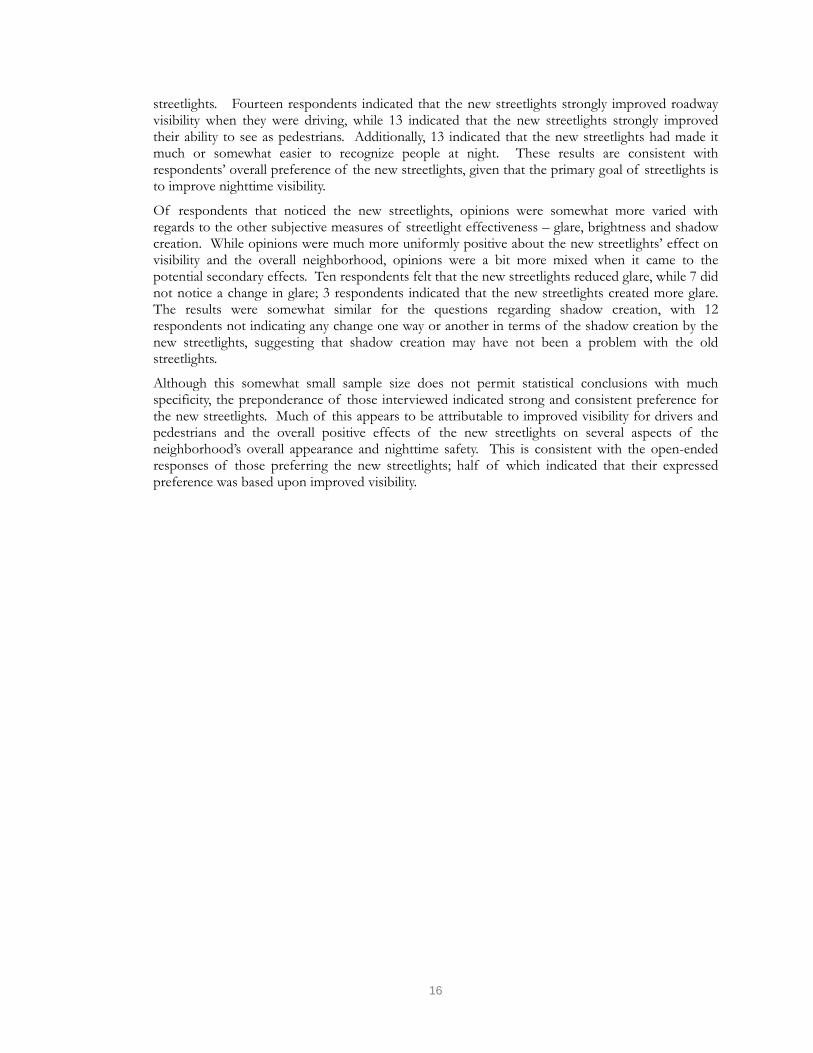
All respondents that had noticed the new streetlights felt that that the new streetlights at least maintained or improved their neighborhood’s overall appearance, nighttime safety and nighttime visibility. See Table 7.
Table 7. Neighborhood Impact of New Streetlights
Aspect of Neighborhood
# Believing that the New Streetlights
have Strongly or Somewhat Improved
# Believing that the New Streetlights
have Strongly or Somewhat
Not Improved
# Believing that the New Streetlights do not have a Noticeable
Impact
Overall Appearance 15 0 5 Nighttime Safety 14 0 6
Nighttime Visibility 16 0 4
In three questions regarding different aspects of visibility (visibility as a driver, visibility as a pedestrian and recognition of people at night), respondents indicated improvements with the new
15
streetlights. Fourteen respondents indicated that the new streetlights strongly improved roadway visibility when they were driving, while 13 indicated that the new streetlights strongly improved their ability to see as pedestrians. Additionally, 13 indicated that the new streetlights had made it much or somewhat easier to recognize people at night. These results are consistent with respondents’ overall preference of the new streetlights, given that the primary goal of streetlights is to improve nighttime visibility.
Of respondents that noticed the new streetlights, opinions were somewhat more varied with regards to the other subjective measures of streetlight effectiveness – glare, brightness and shadow creation. While opinions were much more uniformly positive about the new streetlights’ effect on visibility and the overall neighborhood, opinions were a bit more mixed when it came to the potential secondary effects. Ten respondents felt that the new streetlights reduced glare, while 7 did not notice a change in glare; 3 respondents indicated that the new streetlights created more glare. The results were somewhat similar for the questions regarding shadow creation, with 12 respondents not indicating any change one way or another in terms of the shadow creation by the new streetlights, suggesting that shadow creation may have not been a problem with the old streetlights.
Although this somewhat small sample size does not permit statistical conclusions with much specificity, the preponderance of those interviewed indicated strong and consistent preference for the new streetlights. Much of this appears to be attributable to improved visibility for drivers and pedestrians and the overall positive effects of the new streetlights on several aspects of the neighborhood’s overall appearance and nighttime safety. This is consistent with the open-ended responses of those preferring the new streetlights; half of which indicated that their expressed preference was based upon improved visibility.
16
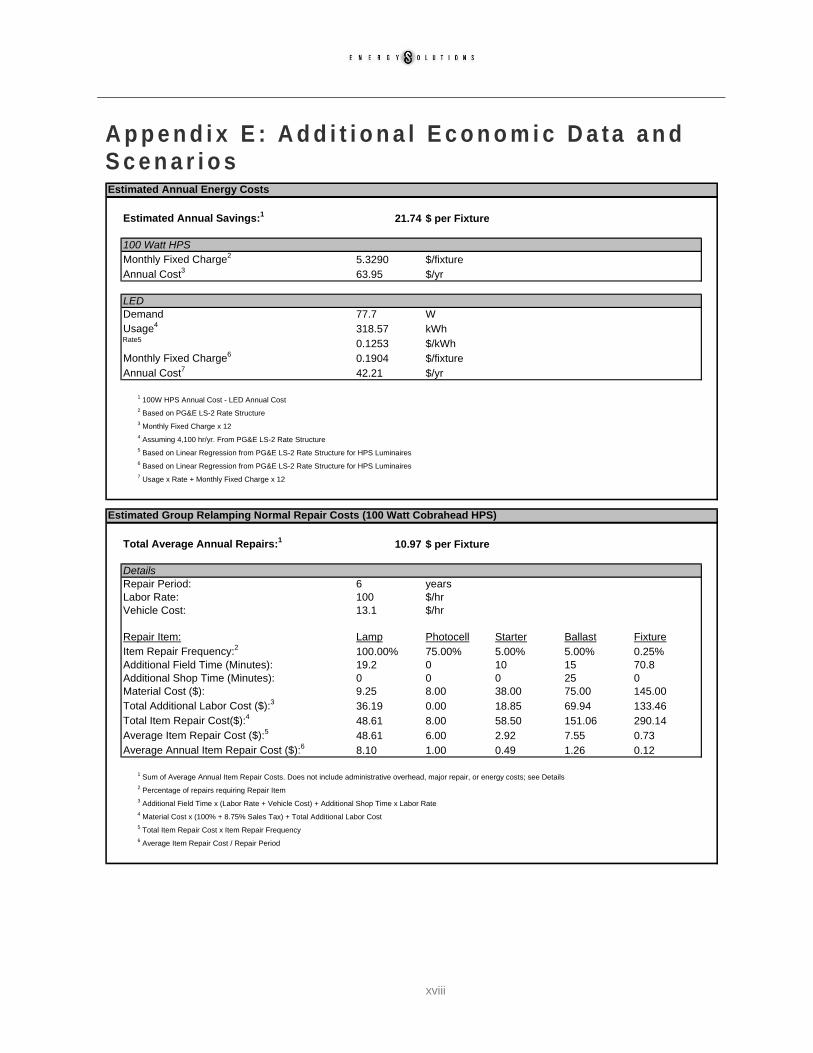
Economic Performance Economic performance was evaluated primarily by simple payback of the LED luminaires versus the HPS luminaires. To calculate this, maintenance and energy costs were taken into account assuming current energy and materials costs.
To estimate energy cost, a 2007 PG&E LS-2 rate schedule was used.22 Under this rate schedule, streetlights are billed a monthly set rate based on the type of lamp and an assumed 4100 hours of annual operation. One hundred-twenty volt, nominal 100 watt HPS luminaires are billed at a rate of $5.329 per luminaire month. While PG&E is planning to generate rates for LED lamp types not presently covered, currently there is no available rate for luminaires comparable to the LED luminaires tested. As a result, the HPS rate schedule was broken down into its component charges of $0.12533 per kWh and a fixed $0.1904 per luminaire per month. The energy costs for the LED luminaires were then calculated assuming these charges, corresponding to $3.5175 per luminaire per month.
Maintenance estimates for HPS luminaires include lamp, photodiode, starter, ballast, and fixture material costs, as well as estimated labor and vehicular costs for the work performed. In accordance with information from the City of Oakland, lamps were assumed to be replaced during each maintenance visit. Estimates from the City of Oakland were then used for the frequency with which the other items must be replaced concurrent with the lamps. The City of Oakland is using a ‘group replacement’ maintenance scheme in which working lamps will be replaced every 6 years. In this scheme, an electrician is estimated to be able to replace 25 lamps in 8 hours.
Maintenance costs were also estimated for another common maintenance scheme, ‘spot replacement’, in which lamps are replaced on an individual basis at failure. For this scheme, the assumed replacement period is the rated life of roughly 7 years (30,000 hours at 4,100 hours per year). This is a conservative estimate, because the lamp would also be replaced if the failure was caused by any other item. Estimates of other item failure frequencies were assumed to be the same as in group replacement. This is also a conservative estimate, because with the lengthened replacement period, the likelihood that an item other than the lamp has caused the maintenance visit is increased.
It should be noted that some spot replacement will still take place in the group replacement scheme upon the premature failure of lamps, making the group replacement maintenance estimates also conservative.
Of the total maintenance cost per luminaire, not all components can be assumed to vary greatly with the performance characteristics of the luminaire. For example, administrative overhead is not likely to be significantly decreased as a result of decreased lamp failure rates. In addition, organization-wide maintenance cost averages may be skewed by a small number of luminaires that are more expensive to maintain than 100 watt HPS luminaires. For this analysis, estimates were used of the variable portion of the maintenance cost per 100 watt HPS luminaire on a non-discounted annualized basis.
The LED luminaires were assumed to have zero regular maintenance cost over the course of their useful life, due to the robust nature of LED technology and its tendency towards rare catastrophic failure.23 In addition, the dramatic downward trend in LED luminaire costs and the uncertainty
22 See Appendix G. 23 This is a common assumption, but is acknowledged to be speculative at this point due to the lack of actual field experience.
17
regarding the useful life of the luminaires are such that LED luminaire replacement was not incorporated into maintenance estimates. Normally this cost could be annualized, effectively saving money each year toward eventual luminaire replacement. Since this was not done, there were no variable maintenance costs for the LED luminaires.
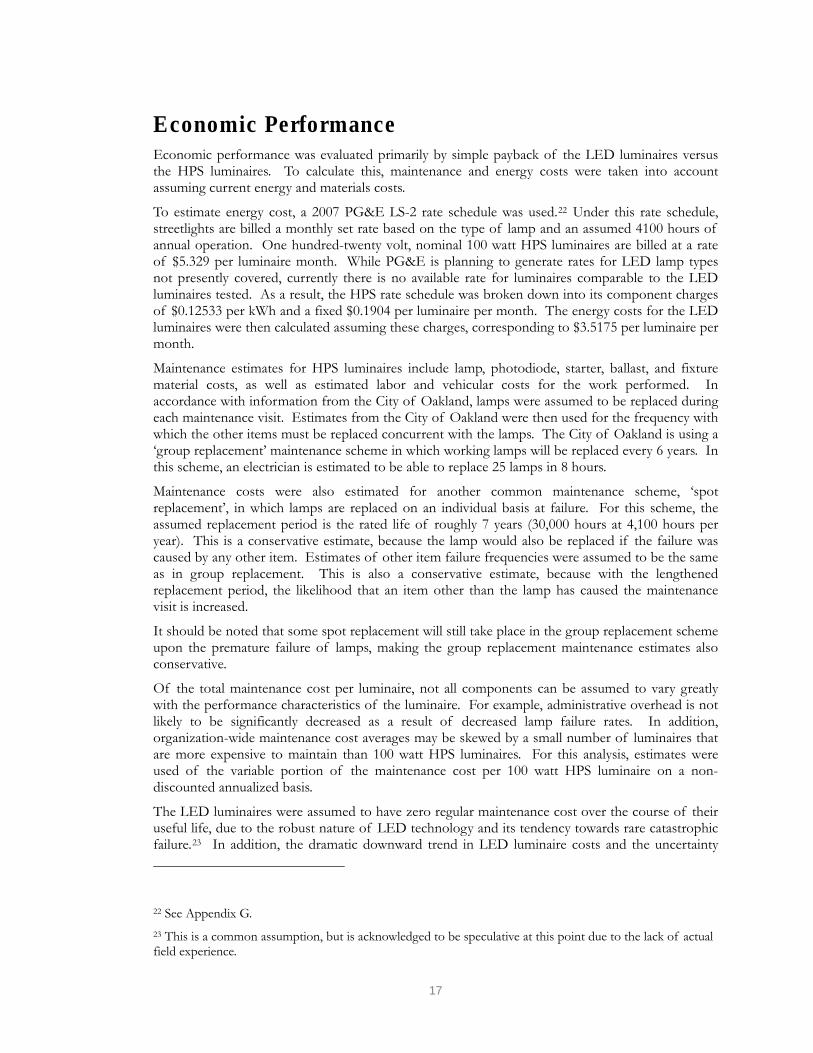
For the HPS luminaires, maintenance accounted for roughly 25% of the total annual cost under the spot replacement scheme. With the group replacement scheme, maintenance accounted for roughly 15% of the total annual cost. Since variable maintenance costs for the LED luminaires were effectively assumed to be zero, the energy costs accounted for 100% of the annual cost.24
Table 8: Annual Luminaire Costs
Luminaire Type
Annual Maintenance Cost
(per Luminaire) Annual Energy Cost
(per Luminaire) Total Annual Cost
(per Luminaire) HPS (with Spot Replacement) $20.40 $63.95 $84.34 HPS (with Group Replacement) $10.97 $63.95 $74.92 LED $0.00 $42.21 $42.21
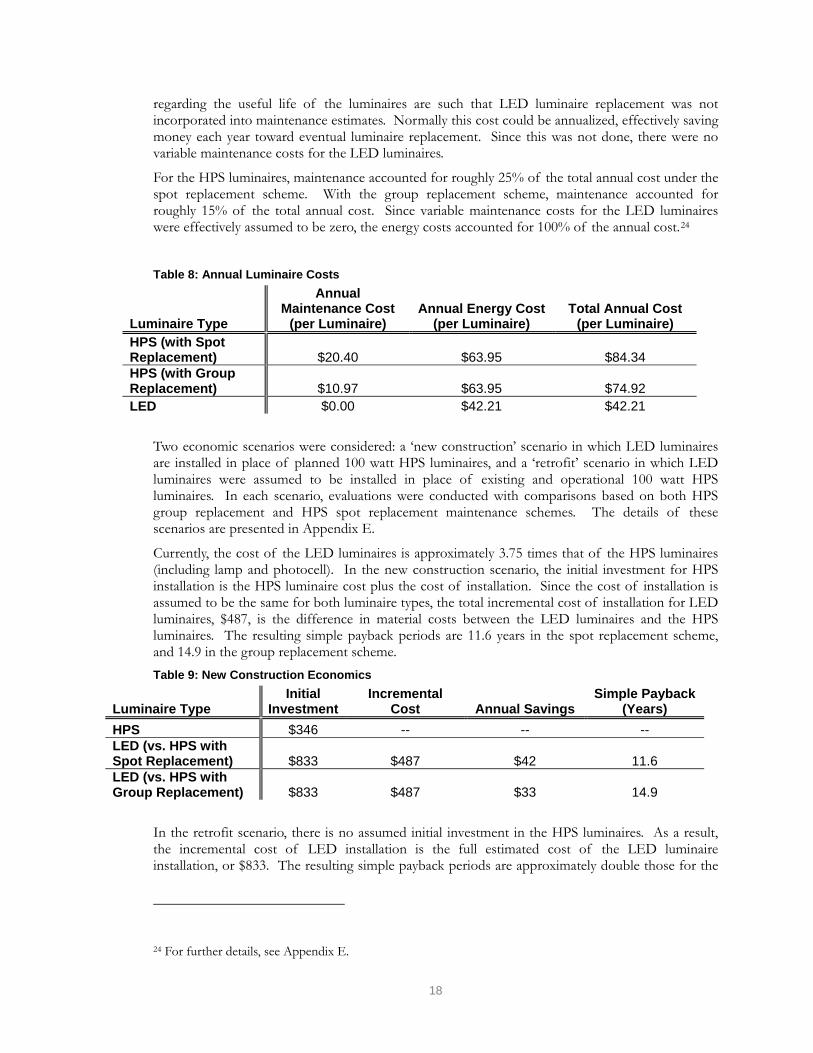
Two economic scenarios were considered: a ‘new construction’ scenario in which LED luminaires are installed in place of planned 100 watt HPS luminaires, and a ‘retrofit’ scenario in which LED luminaires were assumed to be installed in place of existing and operational 100 watt HPS luminaires. In each scenario, evaluations were conducted with comparisons based on both HPS group replacement and HPS spot replacement maintenance schemes. The details of these scenarios are presented in Appendix E.
Currently, the cost of the LED luminaires is approximately 3.75 times that of the HPS luminaires (including lamp and photocell). In the new construction scenario, the initial investment for HPS installation is the HPS luminaire cost plus the cost of installation. Since the cost of installation is assumed to be the same for both luminaire types, the total incremental cost of installation for LED luminaires, $487, is the difference in material costs between the LED luminaires and the HPS luminaires. The resulting simple payback periods are 11.6 years in the spot replacement scheme, and 14.9 in the group replacement scheme. Table 9: New Construction Economics
Luminaire Type Initial
InvestmentIncremental
Cost Annual Savings Simple Payback
(Years) HPS $346 -- -- -- LED (vs. HPS with Spot Replacement) $833 $487 $42 11.6 LED (vs. HPS with Group Replacement) $833 $487 $33 14.9
In the retrofit scenario, there is no assumed initial investment in the HPS luminaires. As a result, the incremental cost of LED installation is the full estimated cost of the LED luminaire installation, or $833. The resulting simple payback periods are approximately double those for the
24 For further details, see Appendix E.
18
new construction scenario: 19.8 years in the spot replacement scheme, and 25.5 in the group replacement scheme.
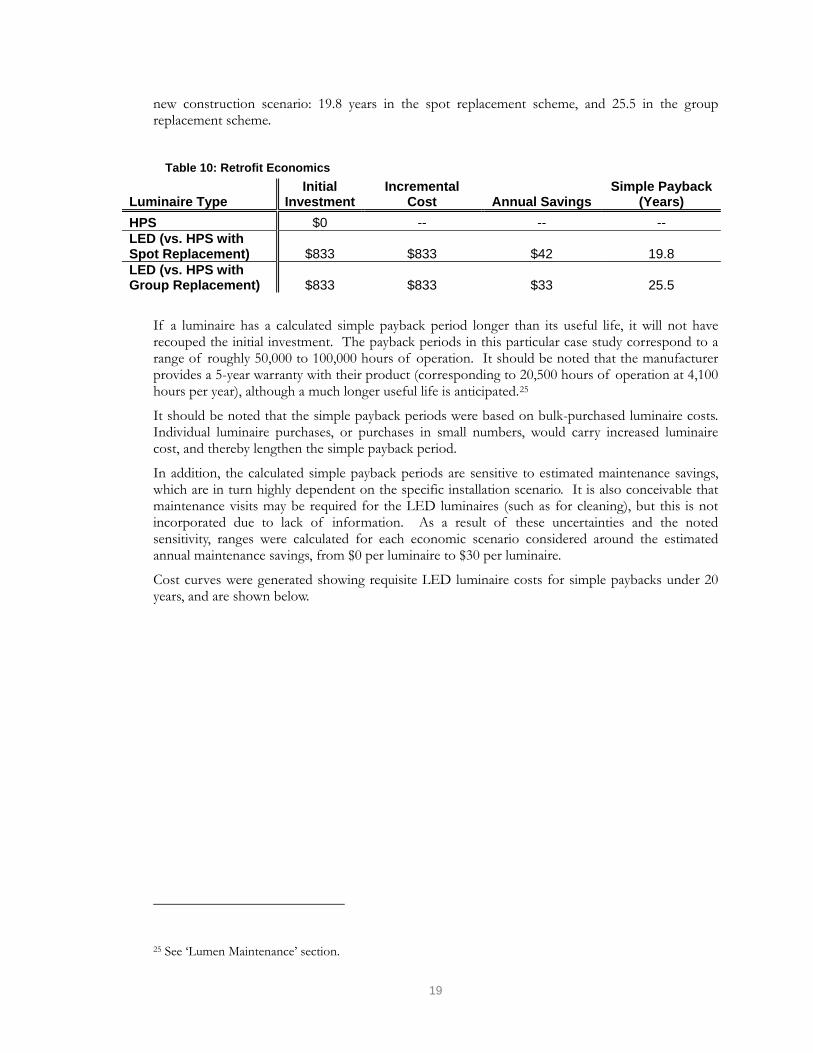
Table 10: Retrofit Economics
Luminaire Type Initial
InvestmentIncremental
Cost Annual Savings Simple Payback
(Years) HPS $0 -- -- -- LED (vs. HPS with Spot Replacement) $833 $833 $42 19.8 LED (vs. HPS with Group Replacement) $833 $833 $33 25.5
If a luminaire has a calculated simple payback period longer than its useful life, it will not have recouped the initial investment. The payback periods in this particular case study correspond to a range of roughly 50,000 to 100,000 hours of operation. It should be noted that the manufacturer provides a 5-year warranty with their product (corresponding to 20,500 hours of operation at 4,100 hours per year), although a much longer useful life is anticipated.25
It should be noted that the simple payback periods were based on bulk-purchased luminaire costs. Individual luminaire purchases, or purchases in small numbers, would carry increased luminaire cost, and thereby lengthen the simple payback period.
In addition, the calculated simple payback periods are sensitive to estimated maintenance savings, which are in turn highly dependent on the specific installation scenario. It is also conceivable that maintenance visits may be required for the LED luminaires (such as for cleaning), but this is not incorporated due to lack of information. As a result of these uncertainties and the noted sensitivity, ranges were calculated for each economic scenario considered around the estimated annual maintenance savings, from $0 per luminaire to $30 per luminaire.
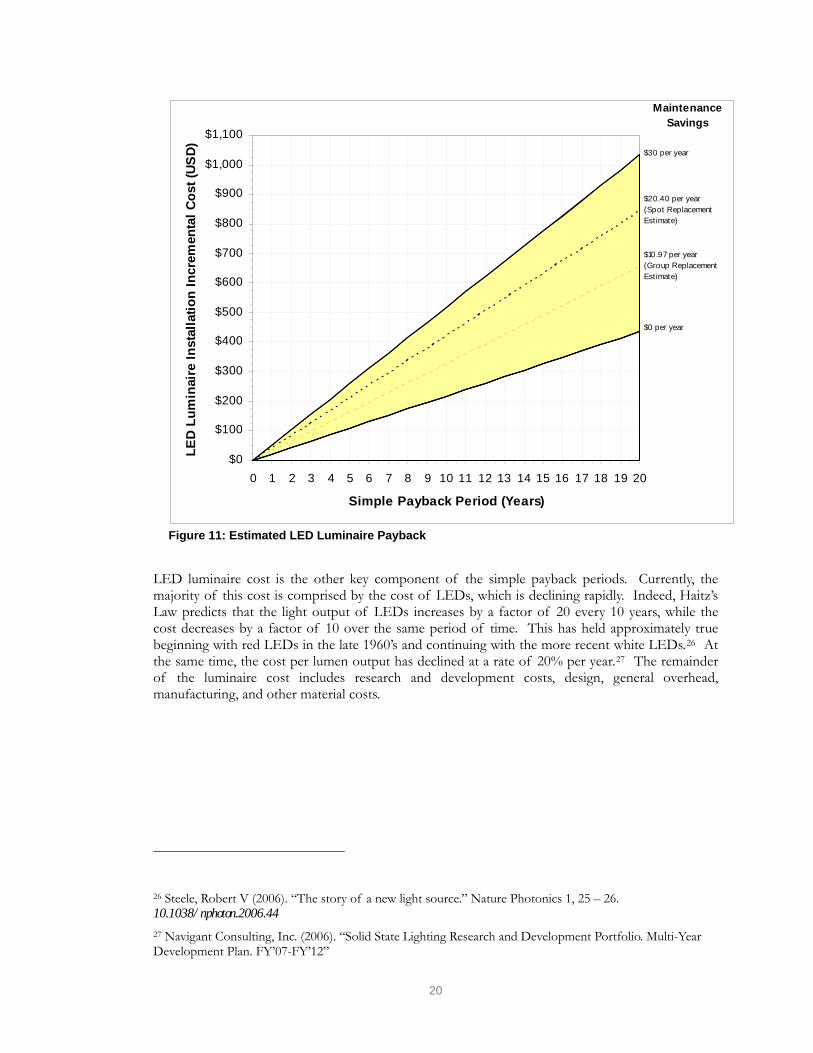
Cost curves were generated showing requisite LED luminaire costs for simple paybacks under 20 years, and are shown below.
25 See ‘Lumen Maintenance’ section.
19
$0
$100
$200
$300
$400
$500
$600
$700
$800
$900
$1,000
$1,100
0 1 2 3 4 5 6 7 8 9 10 11 12 13 14 15 16 17 18 19 20
Simple Payback Period (Years)
LED
Lum
inai
re In
stal
latio
n In
crem
enta
l Cos
t (US
D)
$0 per year
$30 per year
Maintenance Savings
$10.97 per year(Group Replacement Est imate)
$20.40 per year(Spot Replacement Est imate)
Figure 11: Estimated LED Luminaire Payback
LED luminaire cost is the other key component of the simple payback periods. Currently, the majority of this cost is comprised by the cost of LEDs, which is declining rapidly. Indeed, Haitz’s Law predicts that the light output of LEDs increases by a factor of 20 every 10 years, while the cost decreases by a factor of 10 over the same period of time. This has held approximately true beginning with red LEDs in the late 1960’s and continuing with the more recent white LEDs.26 At the same time, the cost per lumen output has declined at a rate of 20% per year.27 The remainder of the luminaire cost includes research and development costs, design, general overhead, manufacturing, and other material costs.
26 Steele, Robert V (2006). “The story of a new light source.” Nature Photonics 1, 25 – 26. 10.1038/nphoton.2006.44 27 Navigant Consulting, Inc. (2006). “Solid State Lighting Research and Development Portfolio. Multi-Year Development Plan. FY’07-FY’12”
20
D i s c u s s i o n LED luminaires offer potential energy savings in outdoor lighting while maintaining or improving lighting performance. The LED luminaires used in this particular study each drew 43 watts less power than the 121 watt HPS luminaires they replaced (100-watt nominal lamp), providing approximately 36% percent electrical savings. If the same savings could be achieved with 1/2 of the estimated electrical usage for roadway lighting in PG&E’s service territory, the resulting savings would be over 150 GWh.
The HPS luminaires used in this study had an estimated maintained efficacy of roughly 60 lumens per watt, based on the rated mean lamp lumens (8550 lumens), average cobra-head downward efficiency (85%28), and measured power usage (121 watts). While the LED luminaires used in this study had an efficacy of 57.5 lumens per watt, slightly less than the HPS luminaires, they enhanced lighting quality such that sufficient lighting performance could be achieved with reduced (photopic) lumen output, and therefore reduced power. There is also potential for further savings as LEDs become more efficacious. In addition, the use of LED light sources will allow for advanced operating procedures such as bi-level operation or dimming in accordance with prescribed conditions.
The LED luminaires provided sufficient illumination to meet the City of Oakland’s street lighting requirements, and proved to be a practicable replacement for the 100 watt HPS luminaires. The City of Oakland standards for new residential installations require an average photopic illuminance of greater than 0.4 footcandles and max to min uniformity ratio of less than 6:1. These standards were generally met by the LED luminaires, with the exception of the uniformity ratio at the largest spacing. It should be noted that these standards apply to new, residential installations, which may not be the same as those that applied at the time that the poles were installed. The full standards for new street lighting installations are available at http://www.oaklandpw.com/Asset550.aspx.
While the LED luminaires had decreased average photopic illuminance, this does not necessarily denote inferior light performance. This is because the lighting distribution of HPS luminaires is such that they must over-light the area directly below (creating ‘hot spots’) in order to maintain minimum levels further away. Indeed, compared to the HPS luminaires, the LED luminaires maintained minimum photopic light levels across all spacings, while reducing uniformity ratios (i.e., increasing overall uniformity).
Human perception of light follows two distinct spectral response curves, depending on the light level. The spectral response curve that dominates during typical daytime conditions is the photopic response curve, and results from the “cones” in human eyes. During very low light conditions, perception follows the scotopic response curve, which in contrast results from the “rods” in the human eye. The peak spectral luminous efficacy of the scotopic response curve (1700 lumens per watt, at 507 nanometers) is significantly greater than that of the photopic response curve (683 lumens per watt, at 555 nanometers).
Traditionally, light levels have only been measured in accordance with the photopic response curve. In recent years however, interest has grown in scotopic light due to the human eye’s ability to perceive objects more clearly from sources with enhanced scotopic quality, particularly at night. In this study light levels were measured according to both the photopic and scotopic spectral response curves, resulting in two sets of values: ‘photopic illuminance’ and ‘scotopic illuminance’.
28 Lighting Research Center (2004). “Parking Lot and Area Luminaires.” National Lighting Product Information Program Specifier Reports, Vol 9, Num 1.
21
The relative importance of scotopic illuminance and photopic illuminance at low light levels are still uncertain.29 However, it is reasonable to assume that better lighting performance will result if photopic illuminance is maintained while scotopic illuminance is increased. In this study minimum photopic levels were maintained, as mentioned above, and scotopic illuminance levels were either maintained or increased.
Despite the electrical savings, the present high upfront cost of LED street lighting luminaires may be a barrier to their current adoption. In choosing between an HPS or LED luminaire for new poles, the simple payback of the LED luminaire in this particular study would be on the order of 15 years. Under a scenario in which the customer had the option to replace a fully operational HPS luminaire with a new LED luminaire, the simple payback would be on the order of 26 years. To meet a simple payback of 2 years or less, the cost of an LED luminaire would need to be on the order of $250 in the new construction scenario (not including installation costs, which are assumed to be the same for both LED and HPS luminaires). To meet a simple payback period of 5 years or less, the LED luminaire cost would need to be near $350. Due to installation costs in the given retrofit scenario, it would be difficult for the LED luminaire to meet a 2 year simple payback period, and the price would have to be below $100 to meet a 5 year simple payback.
However as previously noted, these simple paybacks are sensitive to the maintenance costs associated in specific circumstances. Group replacement procedures for HPS lamps have the potential to reduce maintenance costs by replacing lamps slightly before failure, because the largest maintenance expense is for labor. This would result in a less favorable comparative economic performance for the LED luminaires. In addition, with the rapid advancements in LED efficacy and a reduction in the cost of semi-conductors, the payback of any LED luminaire installation can be expected to improve in the future. Various incentive programs could also help bring the price down to this level for consumers even sooner.
PG&E uses this and other Emerging Technologies assessments to support development of potential incentives for emerging energy efficient solutions. Because the performance and quality of the LED fixtures are critical to the long-term delivery of energy savings, it is important that incentive programs include quality control mechanisms. Incentive programs should include performance standards for qualifying products that include minimum criteria for warranty, efficacy, light distribution, and other important criteria.
29 For more information, see mesopic results and discussion in Appendices A1 and A6.
22
C o n c l u s i o n LED street lighting has great potential for energy savings. While this demonstration provides further evidence of the improvements in performance of LED luminaires, the particulars of costs and savings for this demonstration show economics that are still at the outskirts of acceptability for the majority of commercial customers. Performance of the LED luminaires combined with growing industry acceptance of their higher performance vs. high pressure sodium luminaires may provide early adopters the impetus to invest in the emerging technology. Utility or government incentive programs could also help to tip the scale towards greater adoption of LED luminaires for streetlight applications by reducing the initial investment. These utility incentive programs should require minimum performance standards for qualifying products in order to ensure long-term energy savings.
23
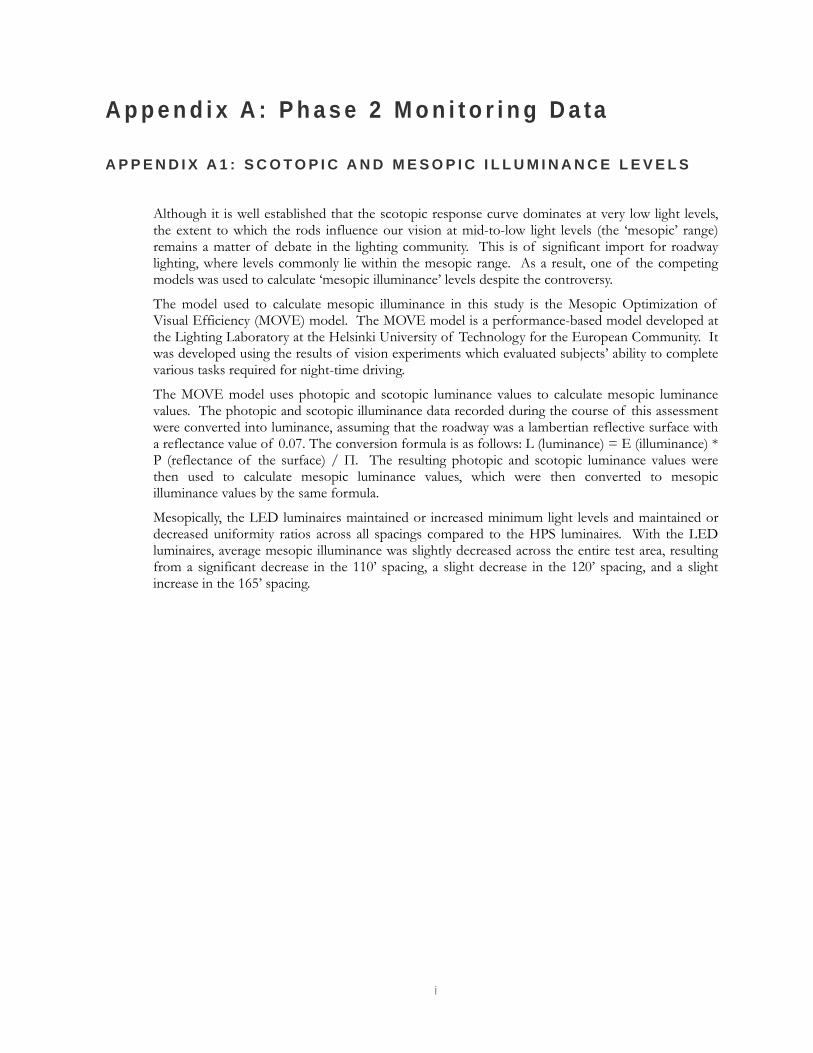
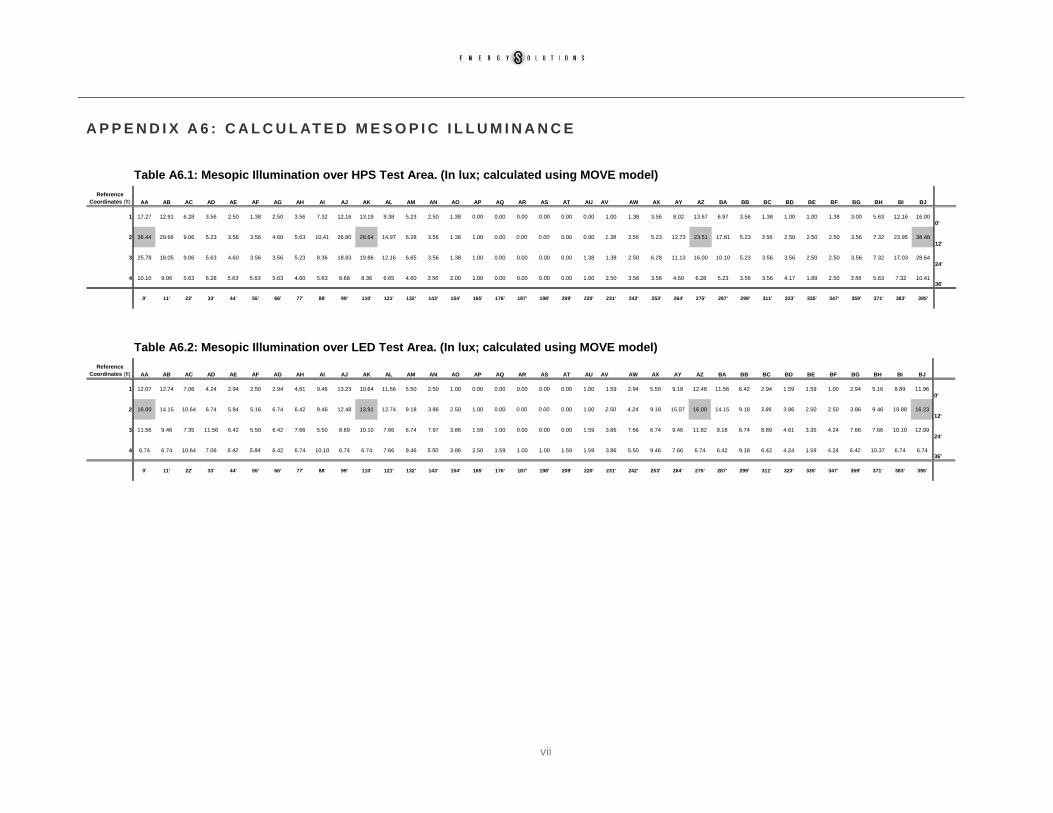
A p p e n d i x A : P h a s e 2 M o n i t o r i n g D a ta A P P E N D I X A 1 : S C O T O P I C A N D M E S O P I C I L L U M I N A N C E L E V E L S
Although it is well established that the scotopic response curve dominates at very low light levels, the extent to which the rods influence our vision at mid-to-low light levels (the ‘mesopic’ range) remains a matter of debate in the lighting community. This is of significant import for roadway lighting, where levels commonly lie within the mesopic range. As a result, one of the competing models was used to calculate ‘mesopic illuminance’ levels despite the controversy.
The model used to calculate mesopic illuminance in this study is the Mesopic Optimization of Visual Efficiency (MOVE) model. The MOVE model is a performance-based model developed at the Lighting Laboratory at the Helsinki University of Technology for the European Community. It was developed using the results of vision experiments which evaluated subjects’ ability to complete various tasks required for night-time driving.
The MOVE model uses photopic and scotopic luminance values to calculate mesopic luminance values. The photopic and scotopic illuminance data recorded during the course of this assessment were converted into luminance, assuming that the roadway was a lambertian reflective surface with a reflectance value of 0.07. The conversion formula is as follows: L (luminance) = E (illuminance) * Ρ (reflectance of the surface) / Π. The resulting photopic and scotopic luminance values were then used to calculate mesopic luminance values, which were then converted to mesopic illuminance values by the same formula.
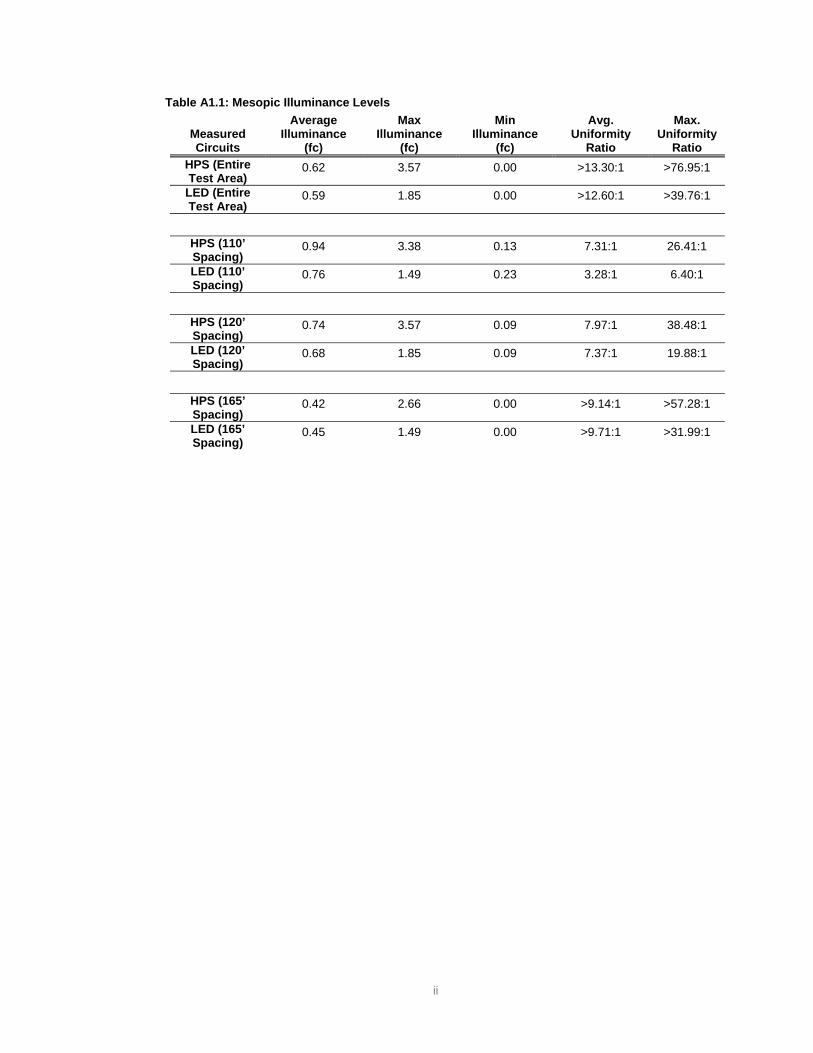
Mesopically, the LED luminaires maintained or increased minimum light levels and maintained or decreased uniformity ratios across all spacings compared to the HPS luminaires. With the LED luminaires, average mesopic illuminance was slightly decreased across the entire test area, resulting from a significant decrease in the 110’ spacing, a slight decrease in the 120’ spacing, and a slight increase in the 165’ spacing.
i
ii
Table A1.1: Mesopic Illuminance Levels
Measured Circuits
Average Illuminance
(fc)
Max Illuminance
(fc)
Min Illuminance
(fc)
Avg. Uniformity
Ratio
Max. Uniformity
Ratio HPS (Entire Test Area)
0.62 3.57 0.00 >13.30:1 >76.95:1
LED (Entire Test Area)
0.59 1.85 0.00 >12.60:1 >39.76:1
HPS (110’ Spacing)
0.94 3.38 0.13 7.31:1 26.41:1
LED (110’ Spacing)
0.76 1.49 0.23 3.28:1 6.40:1
HPS (120’ Spacing)
0.74 3.57 0.09 7.97:1 38.48:1
LED (120’ Spacing)
0.68 1.85 0.09 7.37:1 19.88:1
HPS (165’ Spacing)
0.42 2.66 0.00 >9.14:1 >57.28:1
LED (165’ Spacing)
0.45 1.49 0.00 >9.71:1 >31.99:1
1 2 3 4 5 6 7 8 9 10 11 12 13 14 15 16 17 18 19 20 21 22 23 24 25 26 27 28 29 30 31 32 33 34 35 36
S1
S2
S3
S4
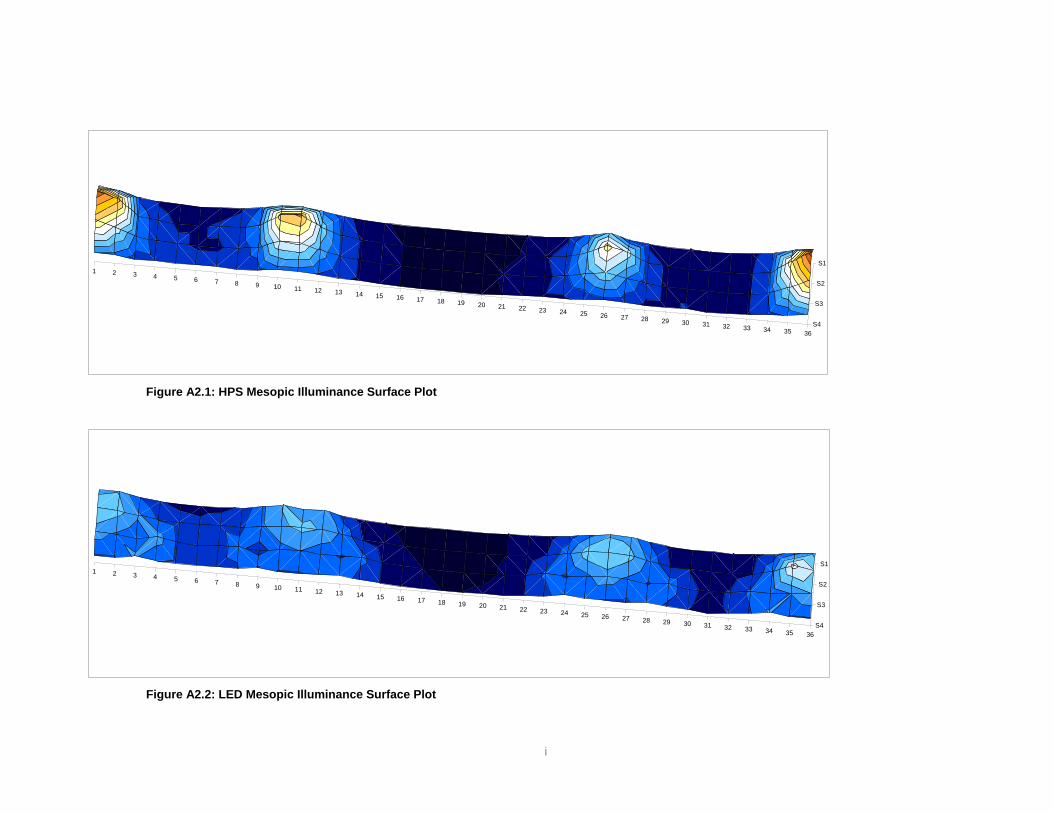
Figure A2.1: HPS Mesopic Illuminance Surface Plot
1 2 3 4 5 6 7 8 9 10 11 12 13 14 15 16 17 18 19 20 21 22 23 24 25 26 27 28 29 30 31 32 33 34 35 36
S1
S2
S3
S4
Figure A2.2: LED Mesopic Illuminance Surface Plot
i

ii
A P P E N D I X A 3 : A M B I E N T D ATA
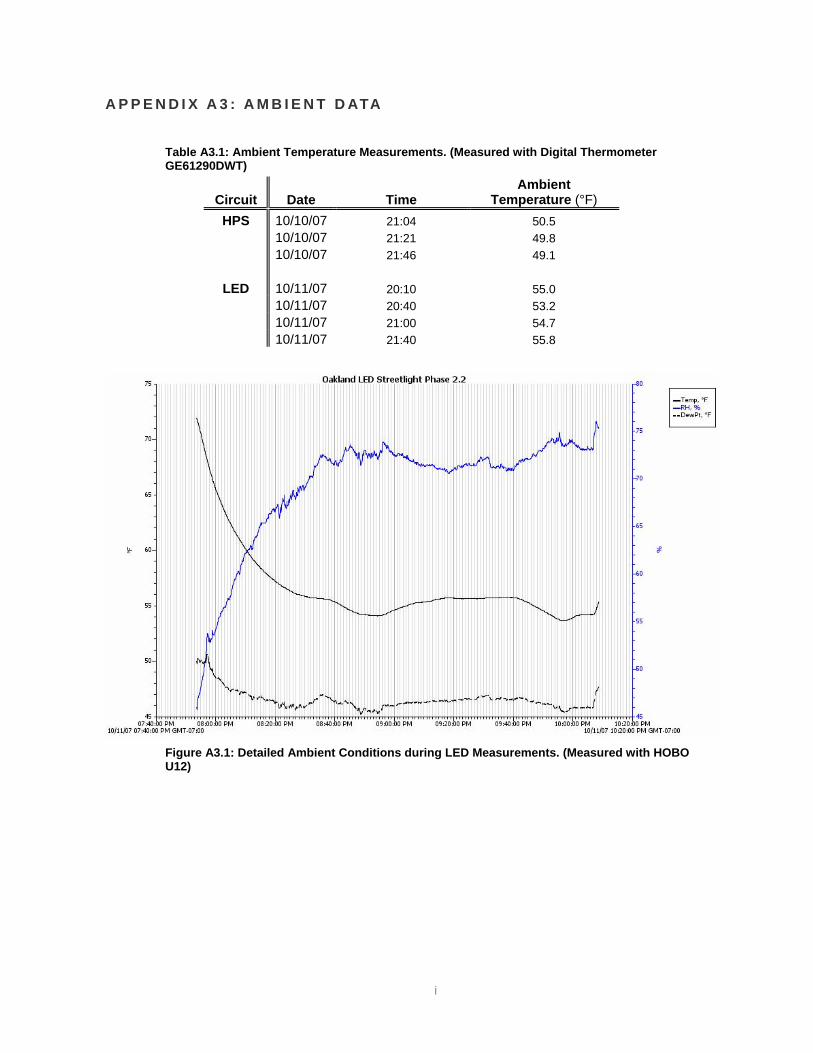
Table A3.1: Ambient Temperature Measurements. (Measured with Digital Thermometer GE61290DWT)
Circuit Date Time Ambient
Temperature (°F) HPS 10/10/07 21:04 50.5
10/10/07 21:21 49.8 10/10/07 21:46 49.1
LED 10/11/07 20:10 55.0 10/11/07 20:40 53.2 10/11/07 21:00 54.7 10/11/07 21:40 55.8
Figure A3.1: Detailed Ambient Conditions during LED Measurements. (Measured with HOBO U12)
i
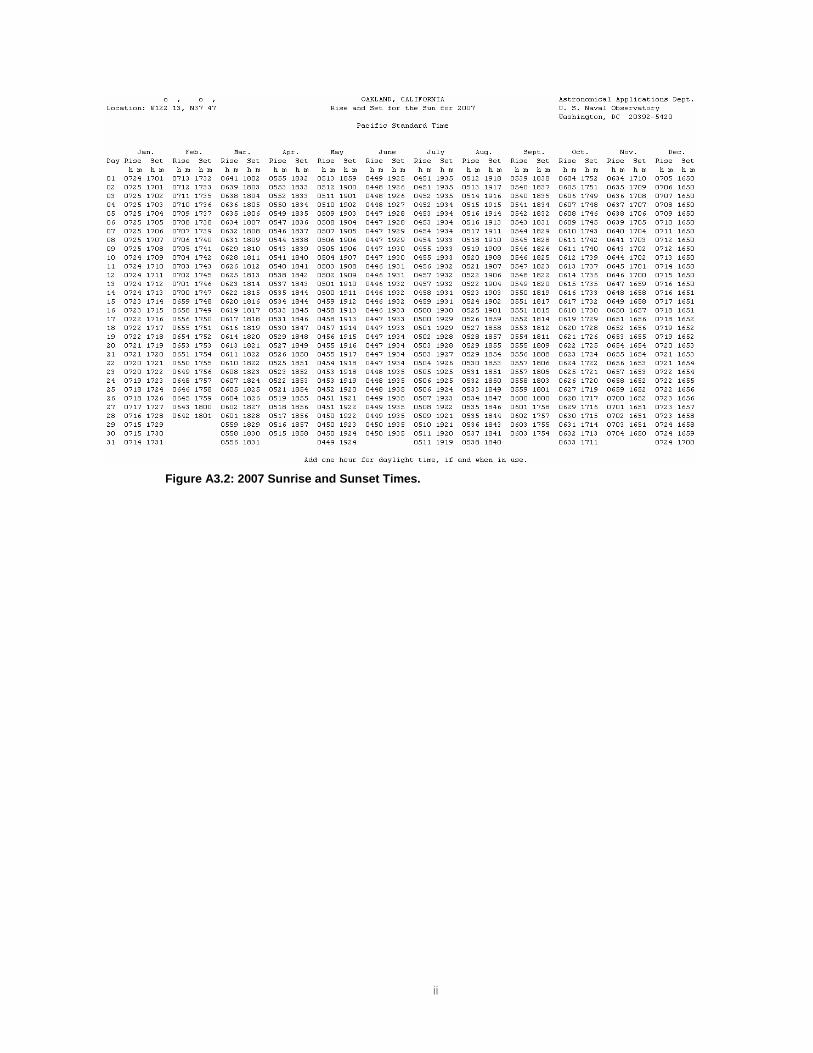
Figure A3.2: 2007 Sunrise and Sunset Times.
ii
iii
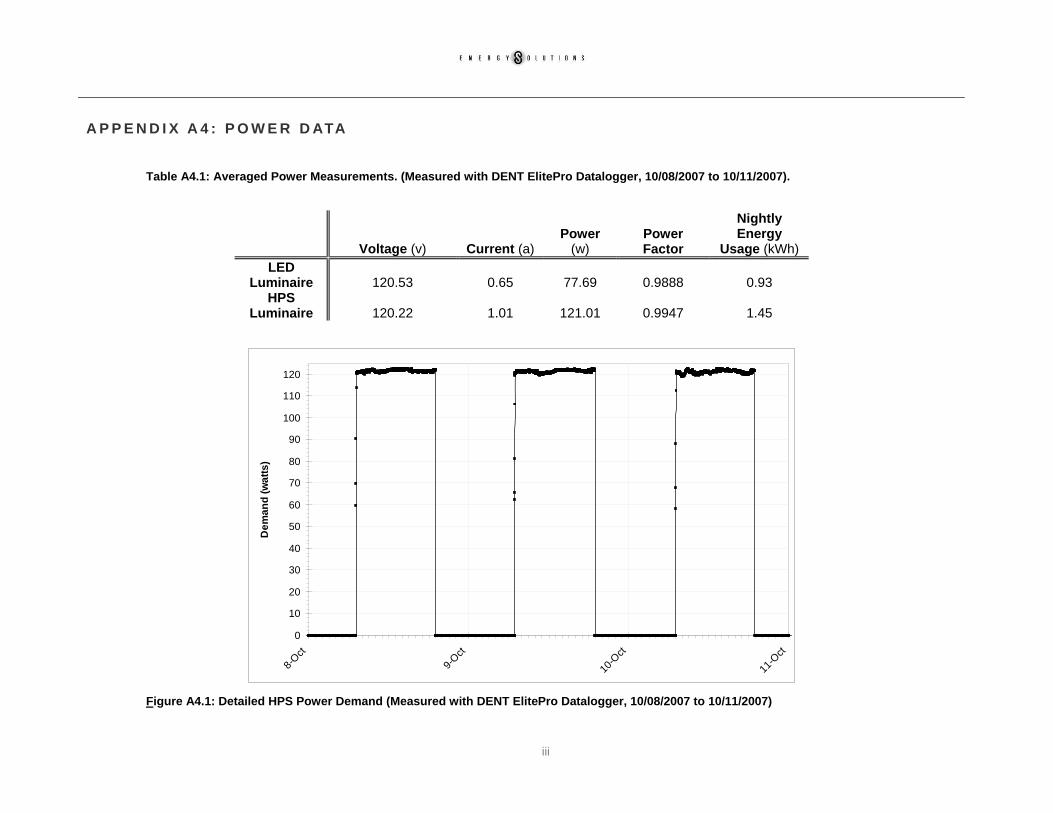
A P P E N D I X A 4 : P O W E R D ATA
Table A4.1: Averaged Power Measurements. (Measured with DENT ElitePro Datalogger, 10/08/2007 to 10/11/2007).
Voltage (v) Current (a) Power
(w) Power Factor
Nightly Energy
Usage (kWh) LED
Luminaire 120.53 0.65 77.69 0.9888 0.93 HPS
Luminaire 120.22 1.01 121.01 0.9947 1.45
0
10
20
30
40
50
60
70
80
90
100
110
120
8-Oct
9-Oct
10-O
ct
11-O
ctD
eman
d (w
atts
)
Figure A4.1: Detailed HPS Power Demand (Measured with DENT ElitePro Datalogger, 10/08/2007 to 10/11/2007)
iv
0
10
20
30
40
50
60
70
80
17-O
ct18
-Oct
19-O
ct20
-Oct
21-O
ct22
-Oct
23-O
ct24
-Oct
25-O
ct26
-Oct
27-O
ct28
-Oct
29-O
ct30
-Oct
Dem
and
(wat
ts)
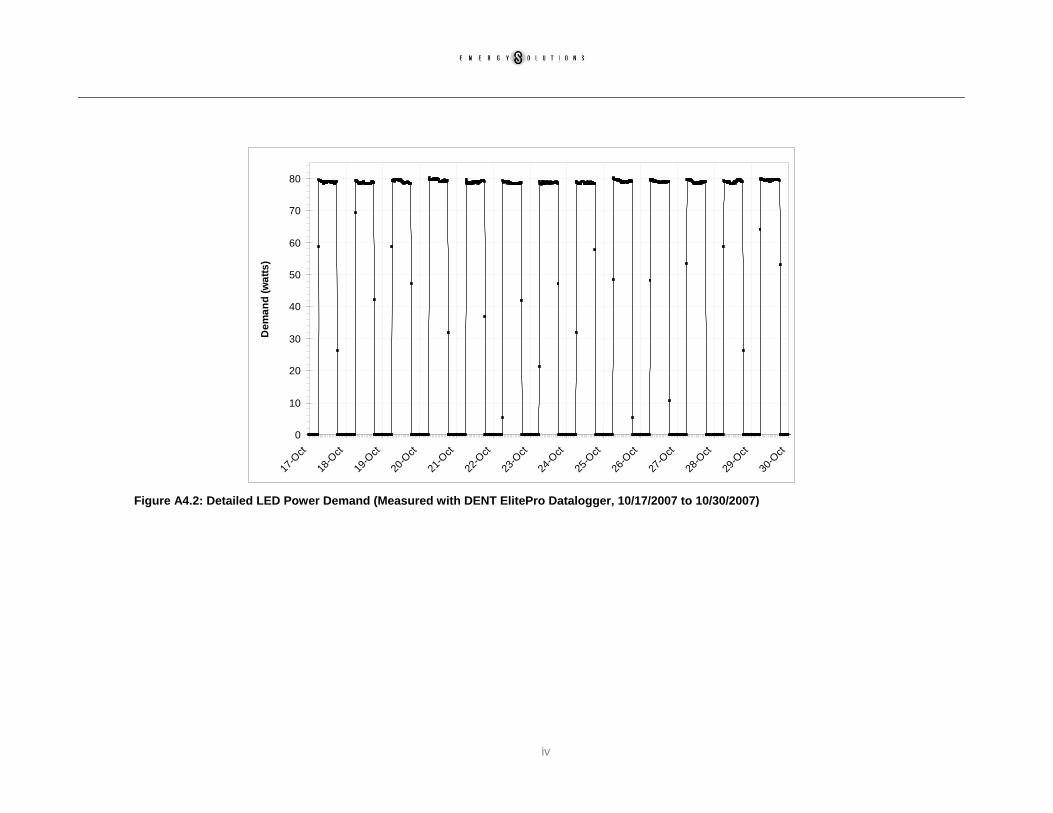
Figure A4.2: Detailed LED Power Demand (Measured with DENT ElitePro Datalogger, 10/17/2007 to 10/30/2007)
v
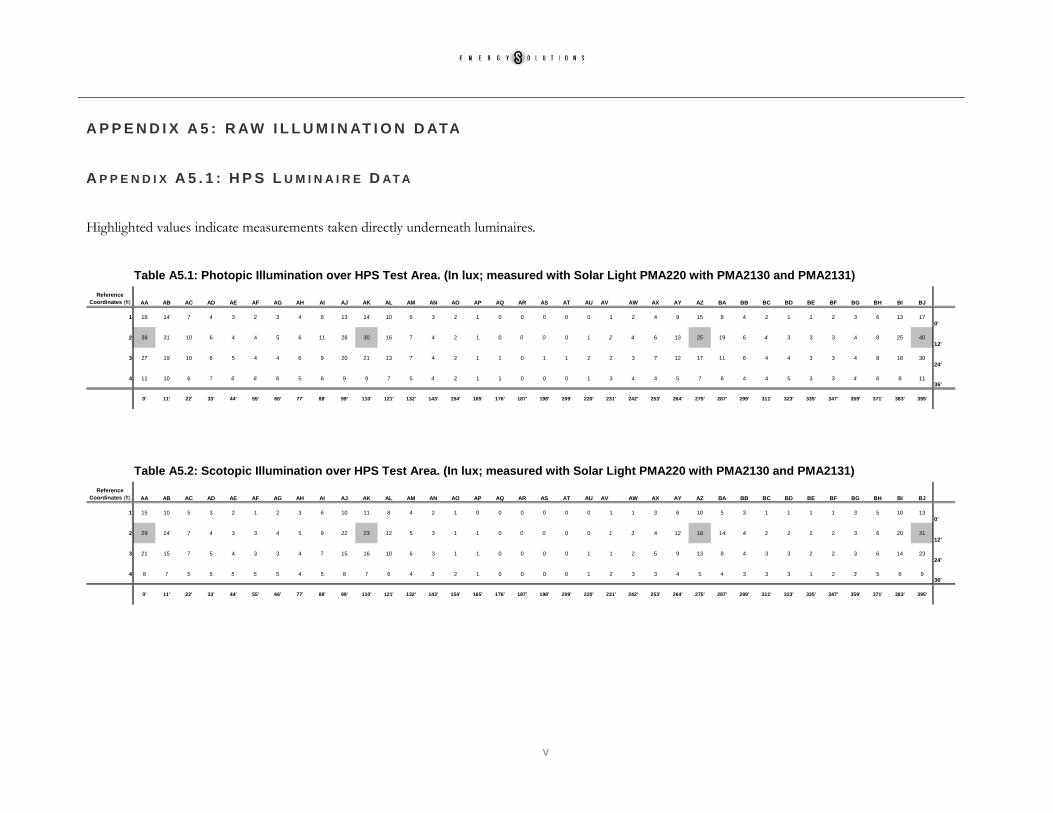
A P P E N D I X A 5 : R AW I L L U M I N AT I O N D ATA A P P E N D I X A 5 . 1 : H P S L U M I N A I R E D AT A
Highlighted values indicate measurements taken directly underneath luminaires.
Table A5.1: Photopic Illumination over HPS Test Area. (In lux; measured with Solar Light PMA220 with PMA2130 and PMA2131)
Reference Coordinates (ft) AA AB AC AD AE AF AG AH AI AJ AK AL AM AN AO AP AQ AR AS AT AU AV AW AX AY AZ BA BB BC BD BE BF BG BH BI BJ
1 18 14 7 4 3 2 3 4 8 13 14 10 6 3 2 1 0 0 0 0 0 1 2 4 9 15 8 4 2 1 1 2 3 6 13 170'
2 38 31 10 6 4 4 5 6 11 28 30 16 7 4 2 1 0 0 0 0 1 2 4 6 13 25 19 6 4 3 3 3 4 8 25 4012'
3 27 19 10 6 5 4 4 6 9 20 21 13 7 4 2 1 1 0 1 1 2 2 3 7 12 17 11 6 4 4 3 3 4 8 18 3024'
4 11 10 6 7 6 6 6 5 6 9 9 7 5 4 2 1 1 0 0 0 1 3 4 4 5 7 6 4 4 5 3 3 4 6 8 1136'
0' 11' 22' 33' 44' 55' 66' 77' 88' 99' 110' 121' 132' 143' 154' 165' 176' 187' 198' 209' 220' 231' 242' 253' 264' 275' 287' 299' 311' 323' 335' 347' 359' 371' 383' 395'
Table A5.2: Scotopic Illumination over HPS Test Area. (In lux; measured with Solar Light PMA220 with PMA2130 and PMA2131)
Reference Coordinates (ft) AA AB AC AD AE AF AG AH AI AJ AK AL AM AN AO AP AQ AR AS AT AU AV AW AX AY AZ BA BB BC BD BE BF BG BH BI BJ
1 15 10 5 3 2 1 2 3 6 10 11 8 4 2 1 0 0 0 0 0 0 1 1 3 6 10 5 3 1 1 1 1 3 5 10 130'
2 29 24 7 4 3 3 4 5 9 22 23 12 5 3 1 1 0 0 0 0 0 1 3 4 12 18 14 4 3 2 2 2 3 6 20 3112'
3 21 15 7 5 4 3 3 4 7 15 16 10 6 3 1 1 0 0 0 0 1 1 2 5 9 13 8 4 3 3 2 2 3 6 14 2324'
4 8 7 5 5 5 5 5 4 5 8 7 6 4 3 2 1 0 0 0 0 1 2 3 3 4 5 4 3 3 3 1 2 3 5 6 936'
0' 11' 22' 33' 44' 55' 66' 77' 88' 99' 110' 121' 132' 143' 154' 165' 176' 187' 198' 209' 220' 231' 242' 253' 264' 275' 287' 299' 311' 323' 335' 347' 359' 371' 383' 395'
vi
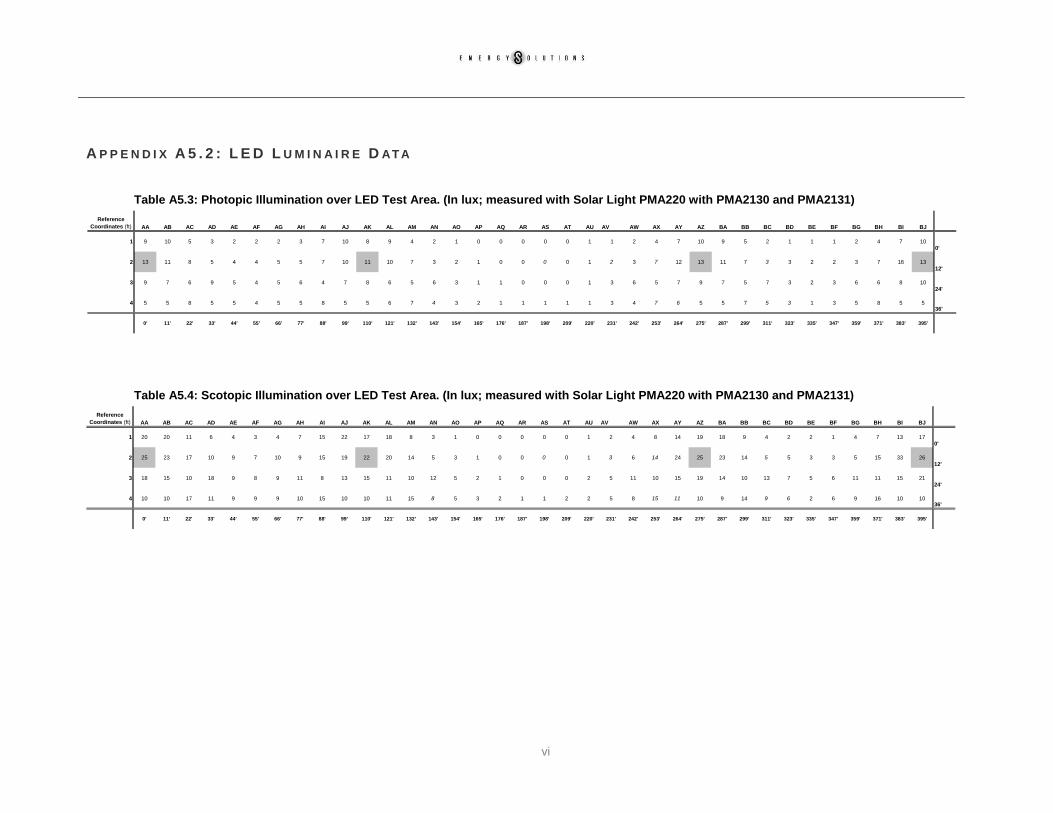
A P P E N D I X A 5 . 2 : L E D L U M I N A I R E D AT A
Table A5.3: Photopic Illumination over LED Test Area. (In lux; measured with Solar Light PMA220 with PMA2130 and PMA2131)
Reference Coordinates (ft) AA AB AC AD AE AF AG AH AI AJ AK AL AM AN AO AP AQ AR AS AT AU AV AW AX AY AZ BA BB BC BD BE BF BG BH BI BJ
1 9 10 5 3 2 2 2 3 7 10 8 9 4 2 1 0 0 0 0 0 1 1 2 4 7 10 9 5 2 1 1 1 2 4 7 100'
2 13 11 8 5 4 4 5 5 7 10 11 10 7 3 2 1 0 0 0 0 1 2 3 7 12 13 11 7 3 3 2 2 3 7 16 1312'
3 9 7 6 9 5 4 5 6 4 7 8 6 5 6 3 1 1 0 0 0 1 3 6 5 7 9 7 5 7 3 2 3 6 6 8 1024'
4 5 5 8 5 5 4 5 5 8 5 5 6 7 4 3 2 1 1 1 1 1 3 4 7 6 5 5 7 5 3 1 3 5 8 5 536'
0' 11' 22' 33' 44' 55' 66' 77' 88' 99' 110' 121' 132' 143' 154' 165' 176' 187' 198' 209' 220' 231' 242' 253' 264' 275' 287' 299' 311' 323' 335' 347' 359' 371' 383' 395'
Table A5.4: Scotopic Illumination over LED Test Area. (In lux; measured with Solar Light PMA220 with PMA2130 and PMA2131)
Reference Coordinates (ft) AA AB AC AD AE AF AG AH AI AJ AK AL AM AN AO AP AQ AR AS AT AU AV AW AX AY AZ BA BB BC BD BE BF BG BH BI BJ
1 20 20 11 6 4 3 4 7 15 22 17 18 8 3 1 0 0 0 0 0 1 2 4 8 14 19 18 9 4 2 2 1 4 7 13 170'
2 25 23 17 10 9 7 10 9 15 19 22 20 14 5 3 1 0 0 0 0 1 3 6 14 24 25 23 14 5 5 3 3 5 15 33 2612'
3 18 15 10 18 9 8 9 11 8 13 15 11 10 12 5 2 1 0 0 0 2 5 11 10 15 19 14 10 13 7 5 6 11 11 15 2124'
4 10 10 17 11 9 9 9 10 15 10 10 11 15 8 5 3 2 1 1 2 2 5 8 15 11 10 9 14 9 6 2 6 9 16 10 1036'
0' 11' 22' 33' 44' 55' 66' 77' 88' 99' 110' 121' 132' 143' 154' 165' 176' 187' 198' 209' 220' 231' 242' 253' 264' 275' 287' 299' 311' 323' 335' 347' 359' 371' 383' 395'
vii
Reference Coordinates (ft) AA AB AC AD AE AF AG AH AI AJ AK AL AM AN AO AP AQ AR AS AT AU AV AW AX AY AZ BA BB BC BD BE BF BG BH BI BJ
1 17.27 12.91 6.28 3.56 2.50 1.38 2.50 3.56 7.32 12.16 13.19 9.38 5.23 2.50 1.38 0.00 0.00 0.00 0.00 0.00 0.00 1.00 1.38 3.56 8.02 13.67 6.97 3.56 1.38 1.00 1.00 1.38 3.00 5.63 12.16 16.000'
2 36.44 29.66 9.06 5.23 3.56 3.56 4.60 5.63 10.41 26.80 28.64 14.97 6.28 3.56 1.38 1.00 0.00 0.00 0.00 0.00 0.00 1.38 3.56 5.23 12.73 23.51 17.81 5.23 3.56 2.50 2.50 2.50 3.56 7.32 23.95 38.4812'
3 25.78 18.05 9.06 5.63 4.60 3.56 3.56 5.23 8.36 18.83 19.86 12.16 6.65 3.56 1.38 1.00 0.00 0.00 0.00 0.00 1.38 1.38 2.50 6.28 11.13 16.00 10.10 5.23 3.56 3.56 2.50 2.50 3.56 7.32 17.03 28.6424'
4 10.10 9.06 5.63 6.28 5.63 5.63 5.63 4.60 5.63 8.68 8.36 6.65 4.60 3.56 2.00 1.00 0.00 0.00 0.00 0.00 1.00 2.50 3.56 3.56 4.60 6.28 5.23 3.56 3.56 4.17 1.89 2.50 3.56 5.63 7.32 10.4136'
0' 11' 22' 33' 44' 55' 66' 77' 88' 99' 110' 121' 132' 143' 154' 165' 176' 187' 198' 209' 220' 231' 242' 253' 264' 275' 287' 299' 311' 323' 335' 347' 359' 371' 383' 395'
Reference Coordinates (ft) AA AB AC AD AE AF AG AH AI AJ AK AL AM AN AO AP AQ AR AS AT AU AV AW AX AY AZ BA BB BC BD BE BF BG BH BI BJ
1 12.07 12.74 7.06 4.24 2.94 2.50 2.94 4.61 9.46 13.23 10.64 11.56 5.50 2.50 1.00 0.00 0.00 0.00 0.00 0.00 1.00 1.59 2.94 5.50 9.18 12.48 11.56 6.42 2.94 1.59 1.59 1.00 2.94 5.16 8.89 11.960'
2 16.00 14.15 10.64 6.74 5.84 5.16 6.74 6.42 9.46 12.48 13.91 12.74 9.18 3.86 2.50 1.00 0.00 0.00 0.00 0.00 1.00 2.50 4.24 9.18 15.07 16.00 14.15 9.18 3.86 3.86 2.50 2.50 3.86 9.46 19.88 16.2312'
3 11.56 9.46 7.35 11.56 6.42 5.50 6.42 7.66 5.50 8.89 10.10 7.66 6.74 7.97 3.86 1.59 1.00 0.00 0.00 0.00 1.59 3.86 7.66 6.74 9.46 11.82 9.18 6.74 8.89 4.61 3.35 4.24 7.66 7.66 10.10 12.9924'
4 6.74 6.74 10.64 7.06 6.42 5.84 6.42 6.74 10.10 6.74 6.74 7.66 9.46 5.50 3.86 2.50 1.59 1.00 1.00 1.59 1.59 3.86 5.50 9.46 7.66 6.74 6.42 9.18 6.42 4.24 1.59 4.24 6.42 10.37 6.74 6.7436'
0' 11' 22' 33' 44' 55' 66' 77' 88' 99' 110' 121' 132' 143' 154' 165' 176' 187' 198' 209' 220' 231' 242' 253' 264' 275' 287' 299' 311' 323' 335' 347' 359' 371' 383' 395'
Table A6.1: Mesopic Illumination over HPS Test Area. (In lux; calculated using MOVE model)
Table A6.2: Mesopic Illumination over LED Test Area. (In lux; calculated using MOVE model)
A P P E N D I X A 6 : C A L C U L AT E D M E S O P I C I L L U M I N A N C E
viii
A P P E N D I X A 7 : C O R R E L AT E D C O L O R T E M P E R AT U R E
HPS Luminaires
Correlated Color
Temperature 1 1851 2 1965 3 2156
Avg 1990.67
LED Luminaires
1 6284 2 6212 3 6269
Avg 6255.00
ix
A p p e n d i x B : M o n i t o r i n g L a y o u t
A P P E N D I X B 1 : FA C I L I T Y A N D M O N I T O R I N G L AY O U T
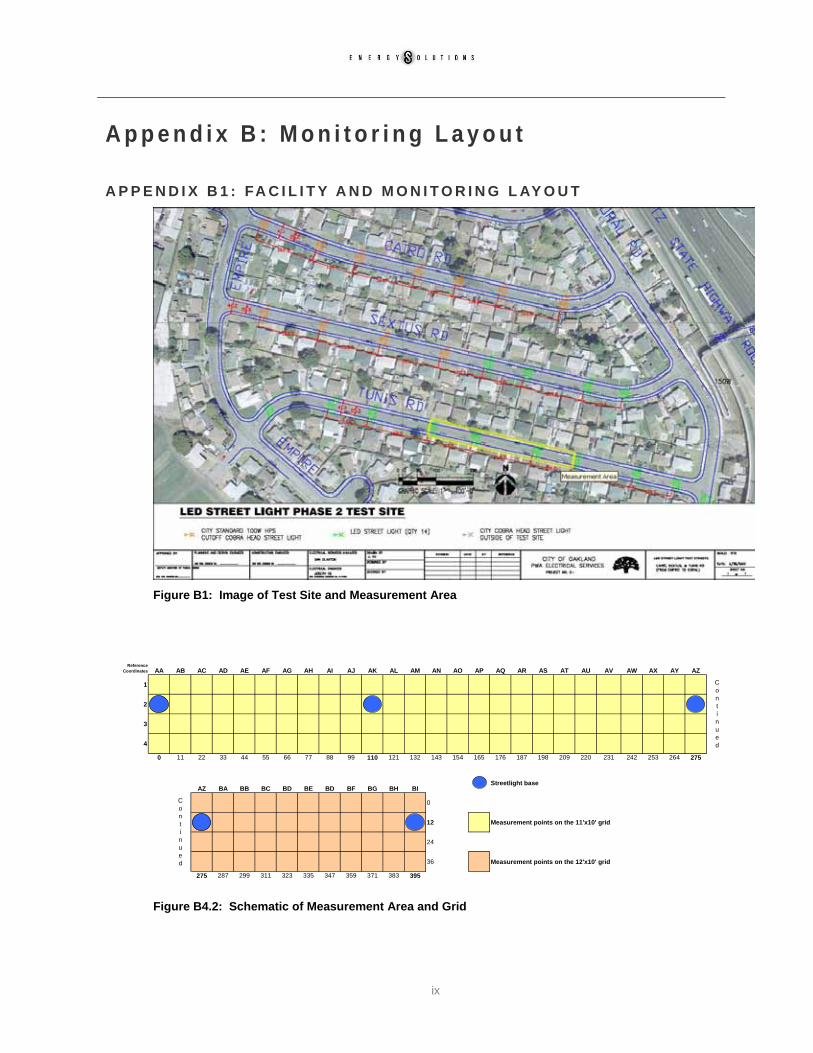
Figure B1: Image of Test Site and Measurement Area
AA AB AC AD AE AF AG AH AI AJ AK AL AM AN AO AP AQ AR AS AT AU AV AW AX AY AZ
1
2
3
4
0 11 22 33 44 55 66 77 88 99 110 121 132 143 154 165 176 187 198 209 220 231 242 253 264 275
AZ BA BB BC BD BE BD BF BG BH BIStreetlight base
0
12 Measurement points on the 11'x10' grid
24
36 Measurement points on the 12'x10' grid
275 287 299 311 323 335 347 359 371 383 395
Continued
Reference Coordinates
Continued
Figure B4.2: Schematic of Measurement Area and Grid

x
A P P E N D I X B 2 : D ATA C O L L E C T I O N F O R M LED Street Light Fixture - PHASE 2 Page: 1 of 3
Field Collection Form Initial Visit Date
Second Visit Date
Location: Tunis Road, Oakland, CA Meter 1 Type: Model:
Initial Visit Team: Meter 2 Type: Model:
Second Visit Team: Meter 3 Type: Model:
FIXTURE Illumination Color Temp NOTES
TypeAt Ground on Grid (Attached)
Of Light In Space (midway)
Circuit 1: ______________ Page 1 N/A
Circuit 2: ______________ Page 2 N/A
Delta Value N/A N/A
LIGHTING CIRCUIT POWER VOLTAGE CURRENT POWER FACTOR NOTES
Circuit 1: ______________
Pre-installation Value
Post-install ation Value
Delta Value
Circuit 2: ______________
Pre-installation Value
Post-install ation Value
Delta Value
LIGHTING CIRCUITFixture Type NOTES
Circuit 1: ______________
Pre-installation Value
Post-install ation Value
Delta Value
Circuit 2: ______________
Pre-installation Value
Post-install ation Value
Delta Value
OTHER MEASUREMENTS
NUMBER OF FIXTURES
xi
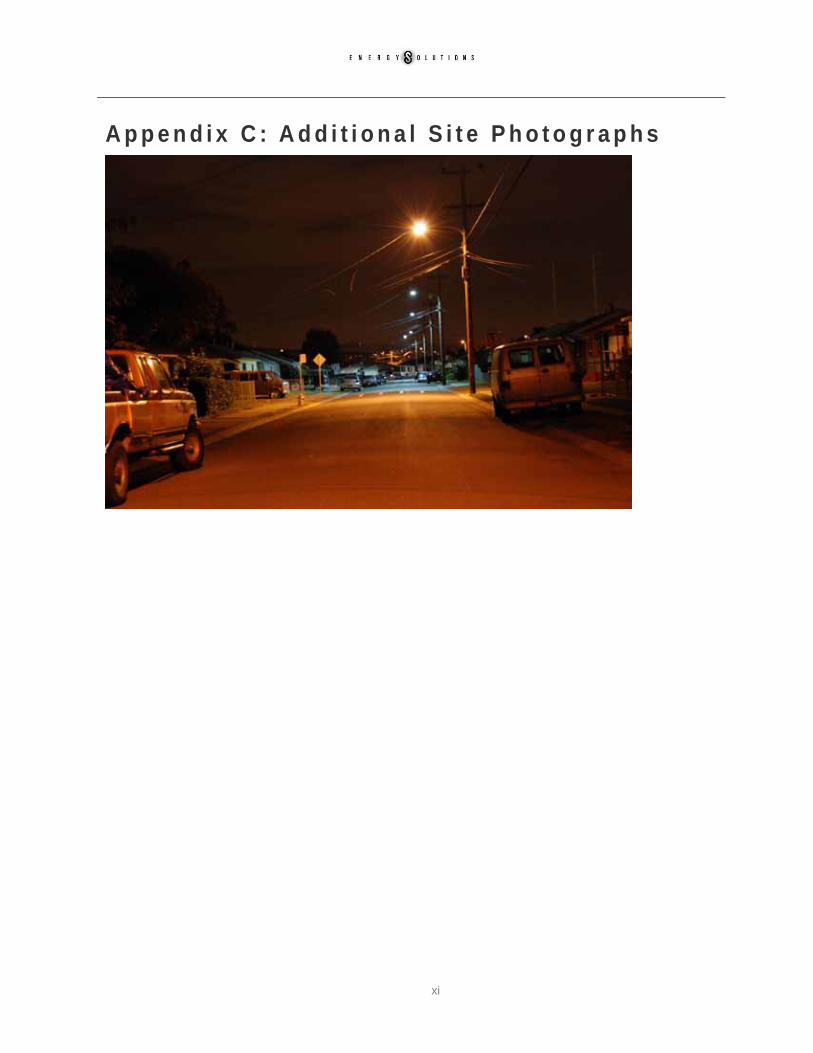
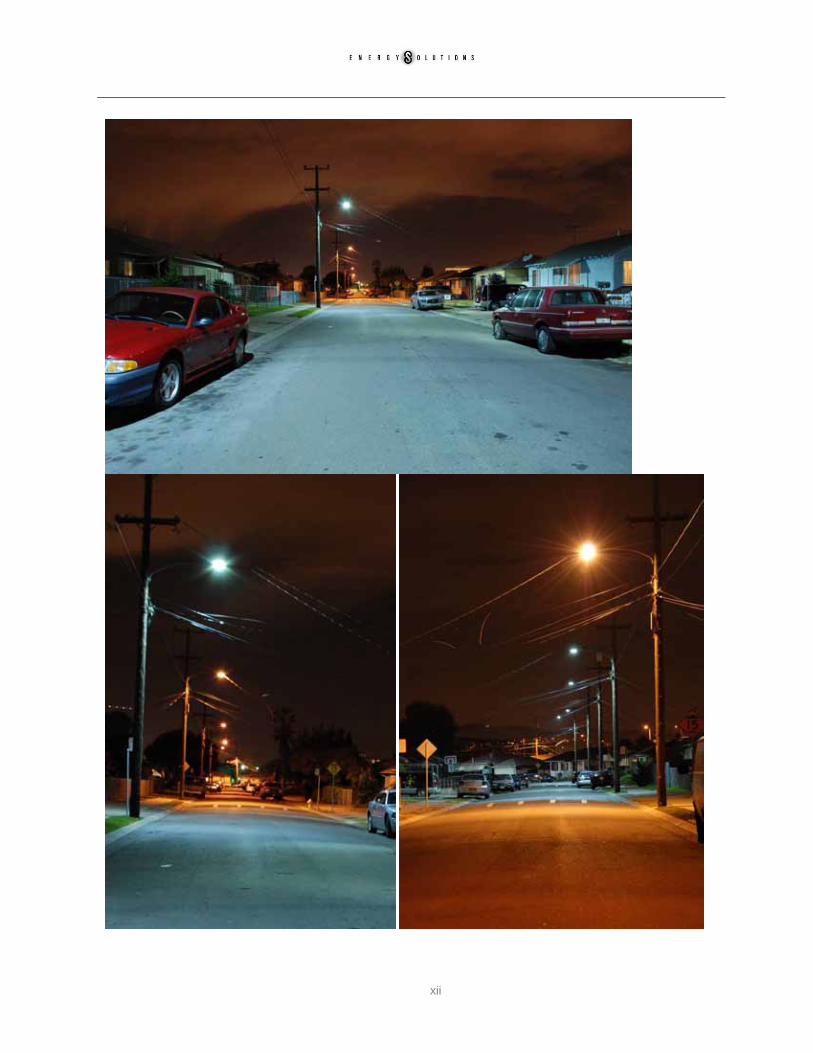
A p p e n d i x C : A d d i t i o n a l S i t e P h o t o g r a p h s
xii

xiii
A p p e n d i x D : C o n s u m e r S u r v e y
PACIFIC NORTHWEST NATIONAL LABORATORY LED STREETLIGHT QUESTIONNAIRE
JOB # 320-341 FINAL
UFT N=60
Hello, I'm __________ from FMMA, a public opinion research company. We're conducting a short public opinion survey about the new streetlights the City of Oakland installed in your neighborhood this past October. I am not trying to sell you anything and I will not ask you for a donation or contribution of any kind. May I please briefly speak about these streetlights with the adult in the household who is 18 years of age or older and that most recent celebrated a birthday? (IF NOT AVAILABLE, ASK:) “May I speak to another adult in the household about these streetlights?” (VERIFY THAT THE PERSON LIVES AT THE ADDRESS LISTED; OTHERWISE, ASK TO SPEAK TO SOMEONE THAT LIVES AT THE ADDRESS LISTED AND RESTATE THE INTRODUCTION.)
1. Have you noticed that new streetlights were installed in your neighborhood this past October?
Yes -------------------------------------------------------- 33%
No ------------------------------------ (SKIP TO Q11) 67%
(DON'T KNOW/NA) ---------------(SKIP TO Q11) 0%
(ASK Q2-Q10 ONLY IF YES IN Q1)
2. Do you feel that the new streetlights installed this past October have improved or not improved visibility for you as a driver? (IF IMPROVED/NOT IMPROVED, ASK:) "Is that strongly or just somewhat?"
Strongly improved ------------------------------------- 70%
Somewhat improved ---------------------------------- 10%
Somewhat not improved -------------------------------5%
Strongly not improved-----------------------------------0%
(DON'T READ) No change/about the same ------5%
(DON'T READ) DK/NA ------------------------------- 10%

xiv
3. Do you feel that the new streetlights installed this past October have improved or not improved visibility for you as a pedestrian? (IF IMPROVED/NOT IMPROVED, ASK:) "Is that strongly or just somewhat?"
Strongly improved ------------------------------------- 65%
Somewhat improved ---------------------------------- 10%
Somewhat not improved ----------------------------- 10%
Strongly not improved-----------------------------------0%
(DON'T READ) No change/about the same ---- 10%
(DON'T READ) DK/NA ---------------------------------5%
4. Do you feel that the new streetlights installed this past October have made it easier or more difficult to recognize people at night under the streetlights? (IF EASIER/MORE DIFFICULT, ASK:) "Is that much easier/more difficult or just somewhat easier/more difficult?"
Much easier --------------------------------------------- 50%
Somewhat easier--------------------------------------- 15%
Somewhat more difficult -------------------------------5%
Much more difficult --------------------------------------0%
(DON'T READ) No change/about the same ---- 20%
(DON'T READ) DK/NA ------------------------------- 10%
5. Do you feel that the new streetlights installed this past October create less glare or more
glare? (IF MORE/LESS, ASK:) "Is that much or just somewhat less/more glare?"
Much less glare----------------------------------------- 25%
Somewhat less glare---------------------------------- 25%
Somewhat more glare ----------------------------------5%
Much more glare -------------------------------------- 10%
(DON'T READ) About the same as old lights--- 25%
(DON'T READ) DK/NA ------------------------------- 10%
6. Do you feel that the new streetlights installed this past October give off the right amount of light or are they too bright or too dim? (IF TOO BRIGHT/DIM, ASK:) "Is that much or just somewhat too bright/dim?"
Right amount of light ---------------------------------- 80%
Much too bright ------------------------------------------0%
Somewhat too bright ------------------------------------0%
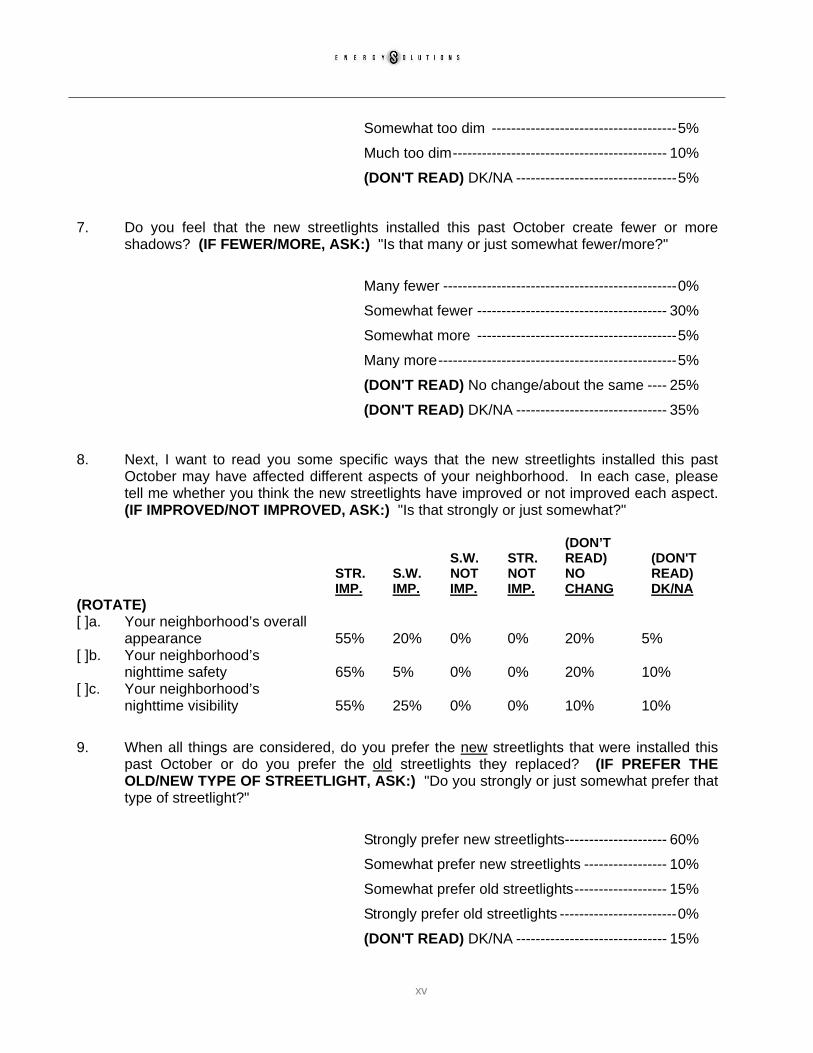
xv
Somewhat too dim --------------------------------------5%
Much too dim-------------------------------------------- 10%
(DON'T READ) DK/NA ---------------------------------5%
7. Do you feel that the new streetlights installed this past October create fewer or more shadows? (IF FEWER/MORE, ASK:) "Is that many or just somewhat fewer/more?"
Many fewer ------------------------------------------------0%
Somewhat fewer --------------------------------------- 30%
Somewhat more -----------------------------------------5%
Many more-------------------------------------------------5%
(DON'T READ) No change/about the same ---- 25%
(DON'T READ) DK/NA ------------------------------- 35%
8. Next, I want to read you some specific ways that the new streetlights installed this past October may have affected different aspects of your neighborhood. In each case, please tell me whether you think the new streetlights have improved or not improved each aspect. (IF IMPROVED/NOT IMPROVED, ASK:) "Is that strongly or just somewhat?"
(DON’T S.W. STR. READ) (DON'T STR. S.W. NOT NOT NO READ) IMP. IMP. IMP. IMP. CHANG DK/NA (ROTATE) [ ]a. Your neighborhood’s overall
appearance 55% 20% 0% 0% 20% 5% [ ]b. Your neighborhood’s
nighttime safety 65% 5% 0% 0% 20% 10% [ ]c. Your neighborhood’s
nighttime visibility 55% 25% 0% 0% 10% 10%
9. When all things are considered, do you prefer the new streetlights that were installed this past October or do you prefer the old streetlights they replaced? (IF PREFER THE OLD/NEW TYPE OF STREETLIGHT, ASK:) "Do you strongly or just somewhat prefer that type of streetlight?"
Strongly prefer new streetlights--------------------- 60%
Somewhat prefer new streetlights ----------------- 10%
Somewhat prefer old streetlights------------------- 15%
Strongly prefer old streetlights ------------------------0%
(DON'T READ) DK/NA ------------------------------- 15%
xvi
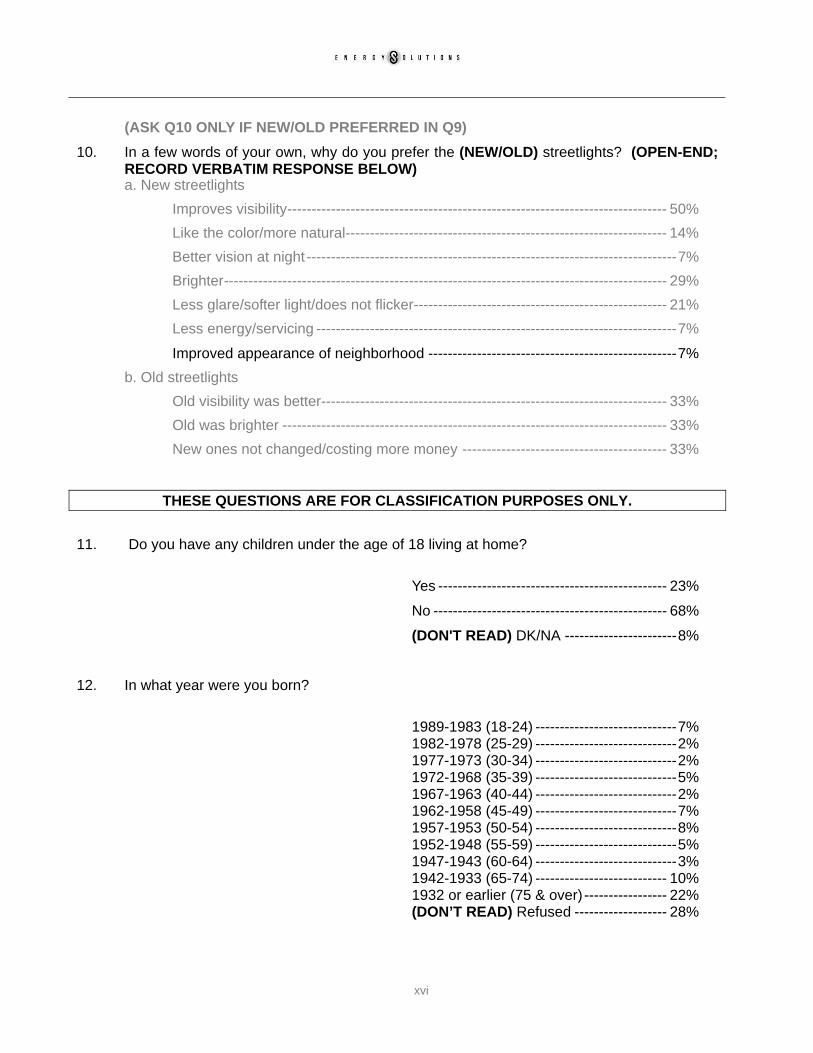
(ASK Q10 ONLY IF NEW/OLD PREFERRED IN Q9) 10. In a few words of your own, why do you prefer the (NEW/OLD) streetlights? (OPEN-END;
RECORD VERBATIM RESPONSE BELOW) a. New streetlights
Improves visibility------------------------------------------------------------------------------ 50% Like the color/more natural------------------------------------------------------------------ 14% Better vision at night ----------------------------------------------------------------------------7% Brighter------------------------------------------------------------------------------------------- 29% Less glare/softer light/does not flicker---------------------------------------------------- 21% Less energy/servicing --------------------------------------------------------------------------7%
Improved appearance of neighborhood ---------------------------------------------------7% b. Old streetlights
Old visibility was better----------------------------------------------------------------------- 33% Old was brighter ------------------------------------------------------------------------------- 33% New ones not changed/costing more money ------------------------------------------ 33%
THESE QUESTIONS ARE FOR CLASSIFICATION PURPOSES ONLY.
11. Do you have any children under the age of 18 living at home?
Yes ----------------------------------------------- 23%
No ------------------------------------------------ 68%
(DON'T READ) DK/NA -----------------------8%
12. In what year were you born?
1989-1983 (18-24) -----------------------------7% 1982-1978 (25-29) -----------------------------2% 1977-1973 (30-34) -----------------------------2% 1972-1968 (35-39) -----------------------------5% 1967-1963 (40-44) -----------------------------2% 1962-1958 (45-49) -----------------------------7% 1957-1953 (50-54) -----------------------------8% 1952-1948 (55-59) -----------------------------5% 1947-1943 (60-64) -----------------------------3% 1942-1933 (65-74) --------------------------- 10% 1932 or earlier (75 & over) ----------------- 22% (DON’T READ) Refused ------------------- 28%

xvii
13. Do you have a driver’s license and currently drive?
Yes ----------------------------------------------- 60%
No ------------------------------------------------ 23%
(DON'T READ) DK/NA --------------------- 17%
THANK AND TERMINATE
GENDER (BY OBSERVATION): Male --------------------------------------------- 40%
Female ------------------------------------------ 60%
LIST (BY PHONE LIST): List 1 (Light group)--------------------------- 27%
List 2 (Non-light group) --------------------- 73%
xviii
A p p e n d i x E : A d d i t i o n a l E c o n o m i c D a ta a n d S c e n a r i o s Estimated Annual Energy Costs
Estimated Annual Savings:1 21.74 $ per Fixture
100 Watt HPSMonthly Fixed Charge2 5.3290 $/fixtureAnnual Cost3 63.95 $/yr
LEDDemand 77.7 WUsage4 318.57 kWhRate5 0.1253 $/kWhMonthly Fixed Charge6 0.1904 $/fixtureAnnual Cost7 42.21 $/yr
1 100W HPS Annual Cost - LED Annual Cost2 Based on PG&E LS-2 Rate Structure3 Monthly Fixed Charge x 124 Assuming 4,100 hr/yr. From PG&E LS-2 Rate Structure5 Based on Linear Regression from PG&E LS-2 Rate Structure for HPS Luminaires6 Based on Linear Regression from PG&E LS-2 Rate Structure for HPS Luminaires7 Usage x Rate + Monthly Fixed Charge x 12
Estimated Group Relamping Normal Repair Costs (100 Watt Cobrahead HPS)
Total Average Annual Repairs:1 10.97 $ per Fixture
DetailsRepair Period: 6 yearsLabor Rate: 100 $/hrVehicle Cost: 13.1 $/hr
Repair Item: Lamp Photocell Starter Ballast FixtureItem Repair Frequency:2 100.00% 75.00% 5.00% 5.00% 0.25%Additional Field Time (Minutes): 19.2 0 10 15 70.8Additional Shop Time (Minutes): 0 0 0 25 0Material Cost ($): 9.25 8.00 38.00 75.00 145.00Total Additional Labor Cost ($):3 36.19 0.00 18.85 69.94 133.46Total Item Repair Cost($):4 48.61 8.00 58.50 151.06 290.14Average Item Repair Cost ($):5 48.61 6.00 2.92 7.55 0.73Average Annual Item Repair Cost ($):6 8.10 1.00 0.49 1.26 0.12
1 Sum of Average Annual Item Repair Costs. Does not include administrative overhead, major repair, or energy costs; see Details2 Percentage of repairs requiring Repair Item3 Additional Field Time x (Labor Rate + Vehicle Cost) + Additional Shop Time x Labor Rate4 Material Cost x (100% + 8.75% Sales Tax) + Total Additional Labor Cost5 Total Item Repair Cost x Item Repair Frequency6 Average Item Repair Cost / Repair Period
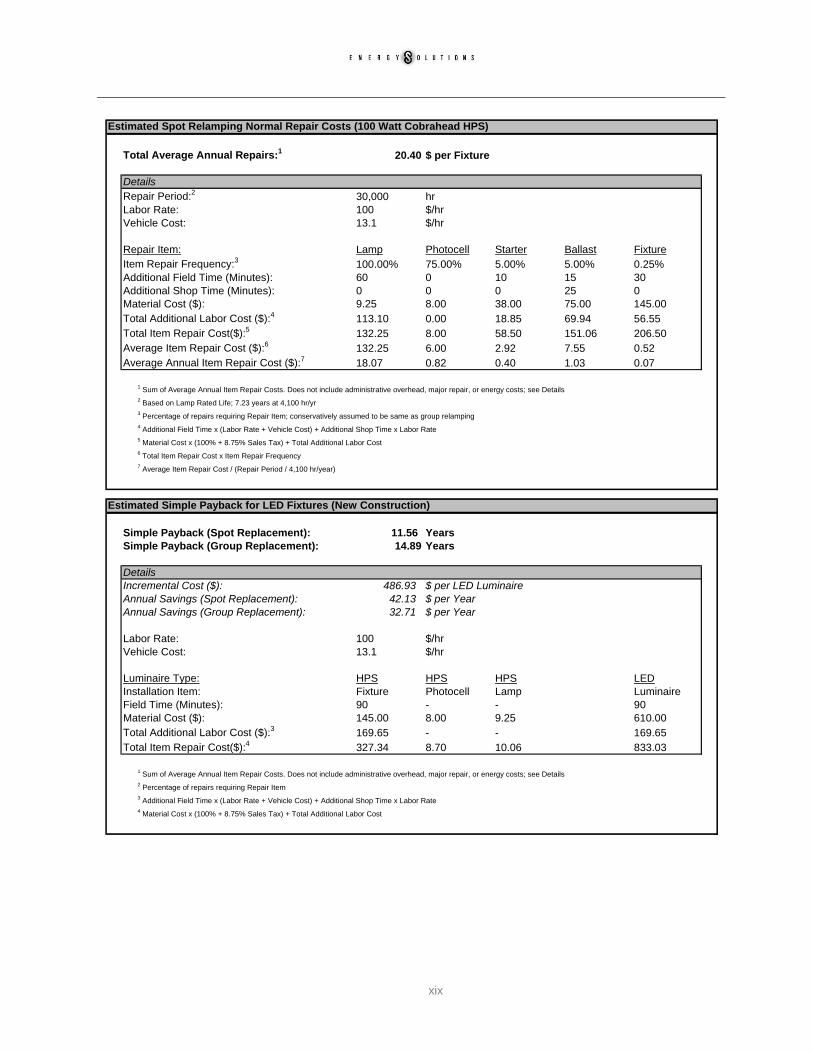
xix
Estimated Spot Relamping Normal Repair Costs (100 Watt Cobrahead HPS)
Total Average Annual Repairs:1 20.40 $ per Fixture
DetailsRepair Period:2 30,000 hrLabor Rate: 100 $/hrVehicle Cost: 13.1 $/hr
Repair Item: Lamp Photocell Starter Ballast FixtureItem Repair Frequency:3 100.00% 75.00% 5.00% 5.00% 0.25%Additional Field Time (Minutes): 60 0 10 15 30Additional Shop Time (Minutes): 0 0 0 25 0Material Cost ($): 9.25 8.00 38.00 75.00 145.00Total Additional Labor Cost ($):4 113.10 0.00 18.85 69.94 56.55Total Item Repair Cost($):5 132.25 8.00 58.50 151.06 206.50Average Item Repair Cost ($):6 132.25 6.00 2.92 7.55 0.52Average Annual Item Repair Cost ($):7 18.07 0.82 0.40 1.03 0.07
1 Sum of Average Annual Item Repair Costs. Does not include administrative overhead, major repair, or energy costs; see Details2 Based on Lamp Rated Life; 7.23 years at 4,100 hr/yr3 Percentage of repairs requiring Repair Item; conservatively assumed to be same as group relamping4 Additional Field Time x (Labor Rate + Vehicle Cost) + Additional Shop Time x Labor Rate5 Material Cost x (100% + 8.75% Sales Tax) + Total Additional Labor Cost6 Total Item Repair Cost x Item Repair Frequency7 Average Item Repair Cost / (Repair Period / 4,100 hr/year)
Estimated Simple Payback for LED Fixtures (New Construction)
Simple Payback (Spot Replacement): 11.56 YearsSimple Payback (Group Replacement): 14.89 Years
DetailsIncremental Cost ($): 486.93 $ per LED LuminaireAnnual Savings (Spot Replacement): 42.13 $ per YearAnnual Savings (Group Replacement): 32.71 $ per Year
Labor Rate: 100 $/hrVehicle Cost: 13.1 $/hr
Luminaire Type: HPS HPS HPS LEDInstallation Item: Fixture Photocell Lamp LuminaireField Time (Minutes): 90 - - 90Material Cost ($): 145.00 8.00 9.25 610.00Total Additional Labor Cost ($):3 169.65 - - 169.65Total Item Repair Cost($):4 327.34 8.70 10.06 833.03
1 Sum of Average Annual Item Repair Costs. Does not include administrative overhead, major repair, or energy costs; see Details2 Percentage of repairs requiring Repair Item3 Additional Field Time x (Labor Rate + Vehicle Cost) + Additional Shop Time x Labor Rate4 Material Cost x (100% + 8.75% Sales Tax) + Total Additional Labor Cost
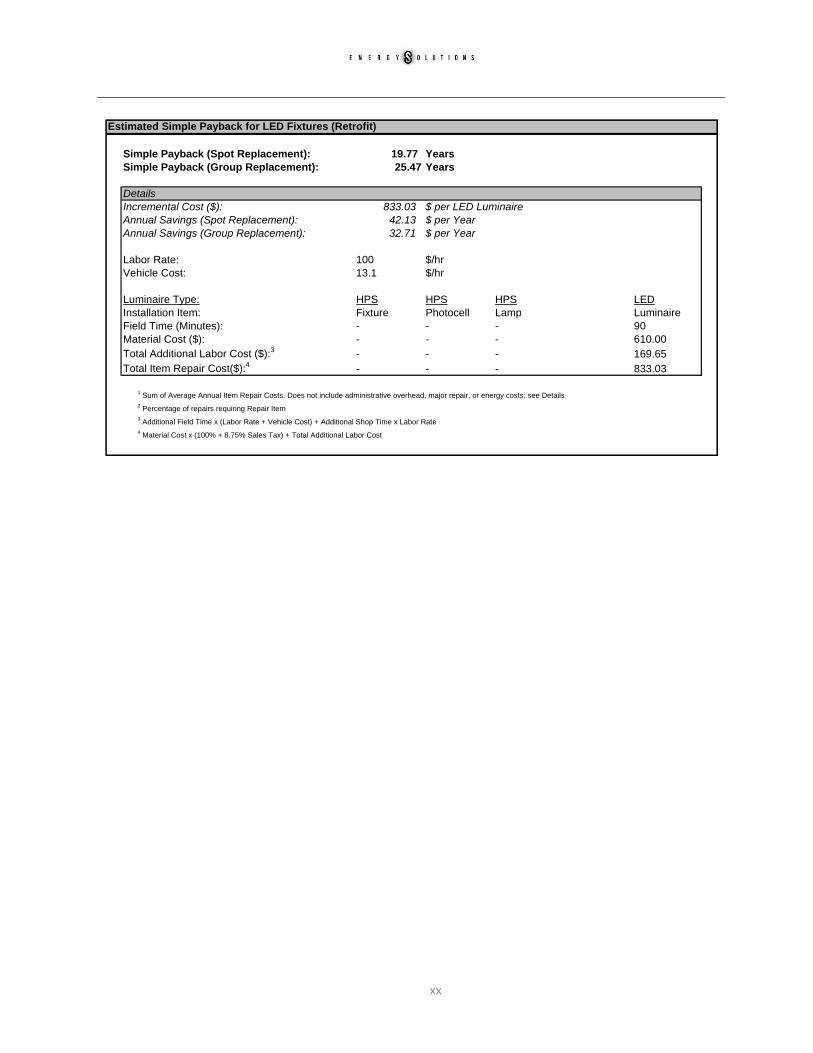
xx
Estimated Simple Payback for LED Fixtures (Retrofit)
Simple Payback (Spot Replacement): 19.77 YearsSimple Payback (Group Replacement): 25.47 Years
DetailsIncremental Cost ($): 833.03 $ per LED LuminaireAnnual Savings (Spot Replacement): 42.13 $ per YearAnnual Savings (Group Replacement): 32.71 $ per Year
Labor Rate: 100 $/hrVehicle Cost: 13.1 $/hr
Luminaire Type: HPS HPS HPS LEDInstallation Item: Fixture Photocell Lamp LuminaireField Time (Minutes): - - - 90Material Cost ($): - - - 610.00Total Additional Labor Cost ($):3 - - - 169.65Total Item Repair Cost($):4 - - - 833.03
1 Sum of Average Annual Item Repair Costs. Does not include administrative overhead, major repair, or energy costs; see Details2 Percentage of repairs requiring Repair Item3 Additional Field Time x (Labor Rate + Vehicle Cost) + Additional Shop Time x Labor Rate4 Material Cost x (100% + 8.75% Sales Tax) + Total Additional Labor Cost
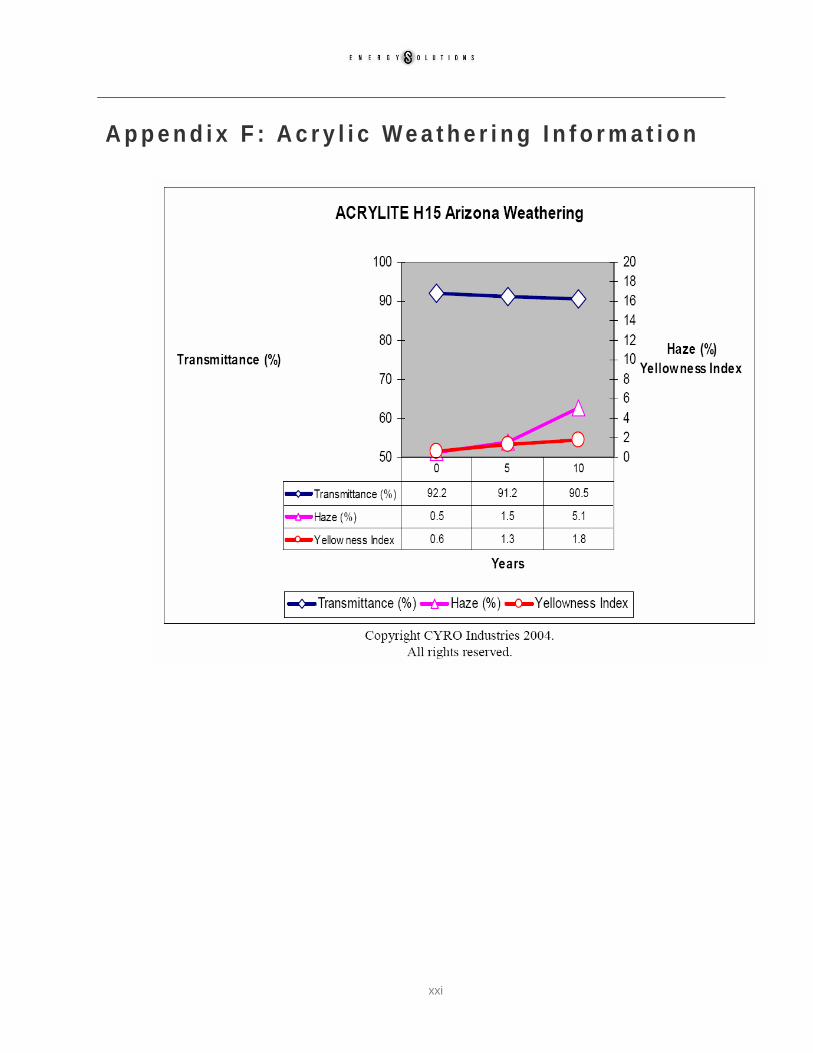
A p p e n d i x F : A c r y l i c W e a t h e r i n g I n f o r m a t i o n
xxi
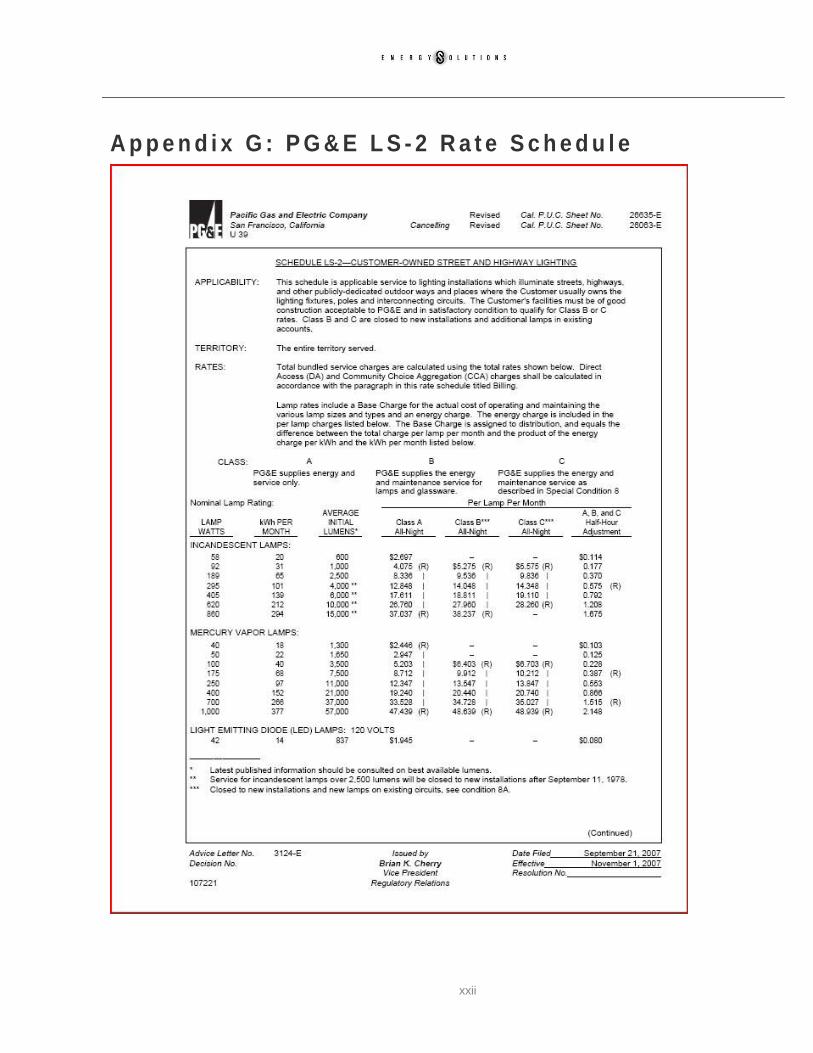
A p p e n d i x G : P G & E L S - 2 R a t e S c h e d u l e
xxii
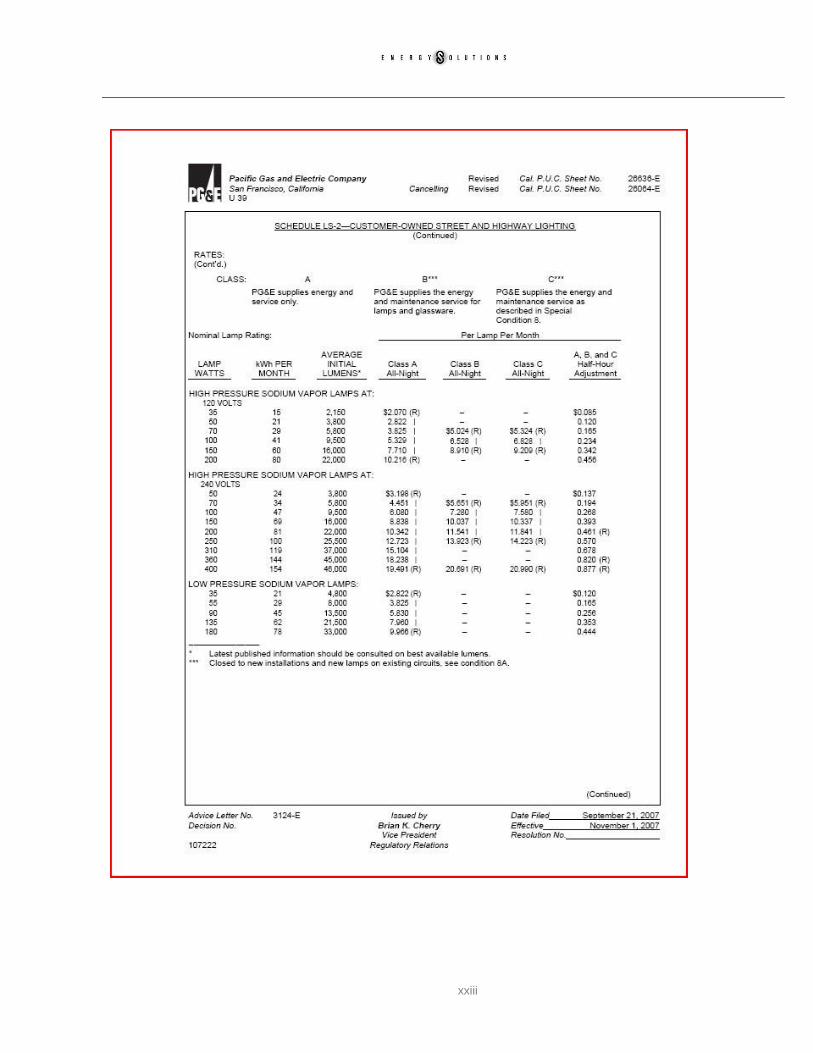
xxiii
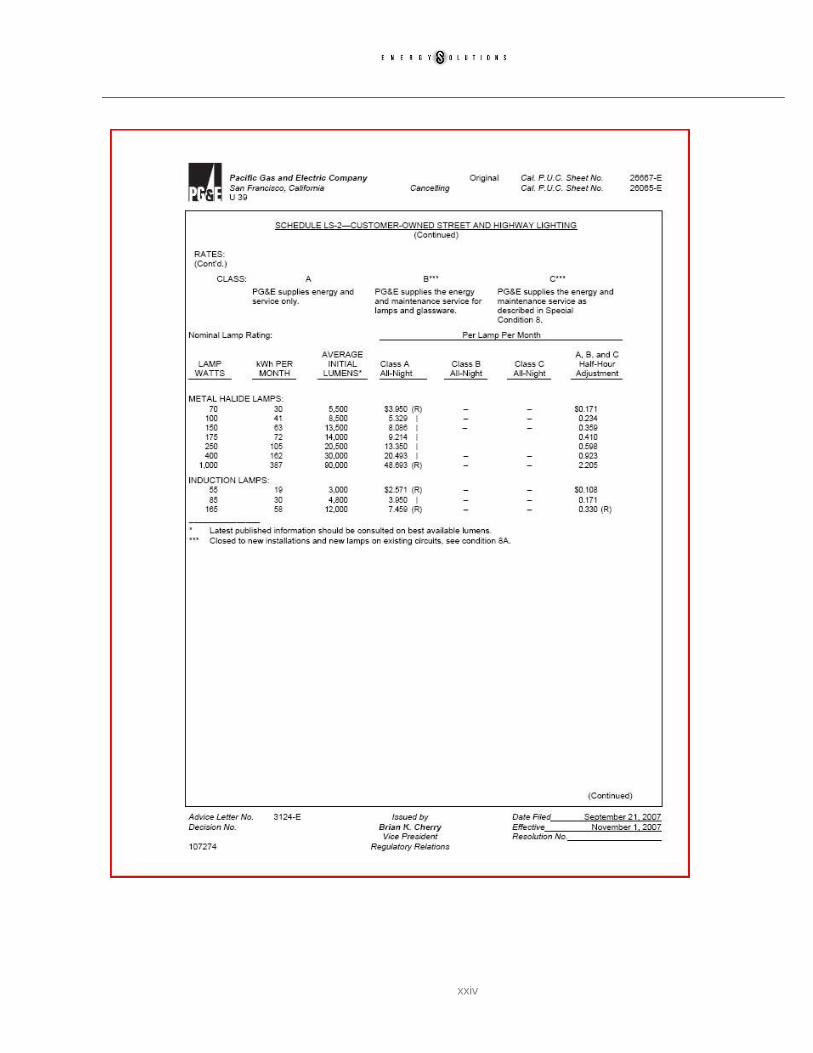
xxiv
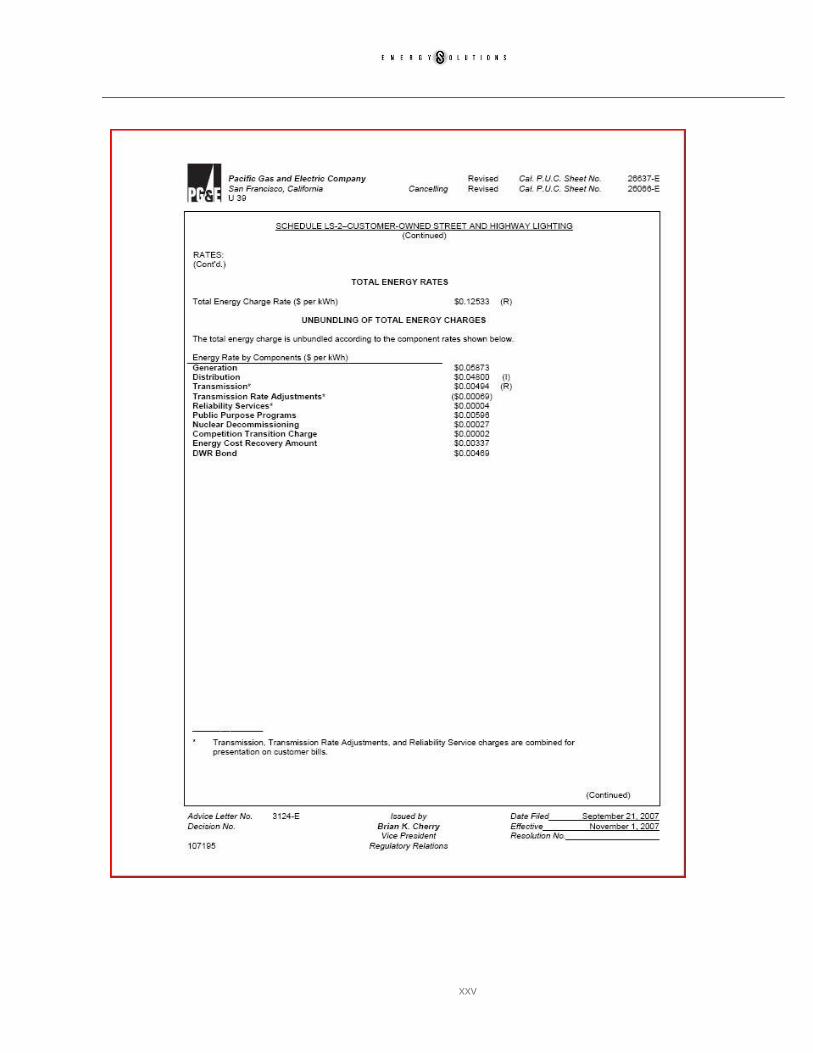
xxv
xxvi
xxvii
xxviii
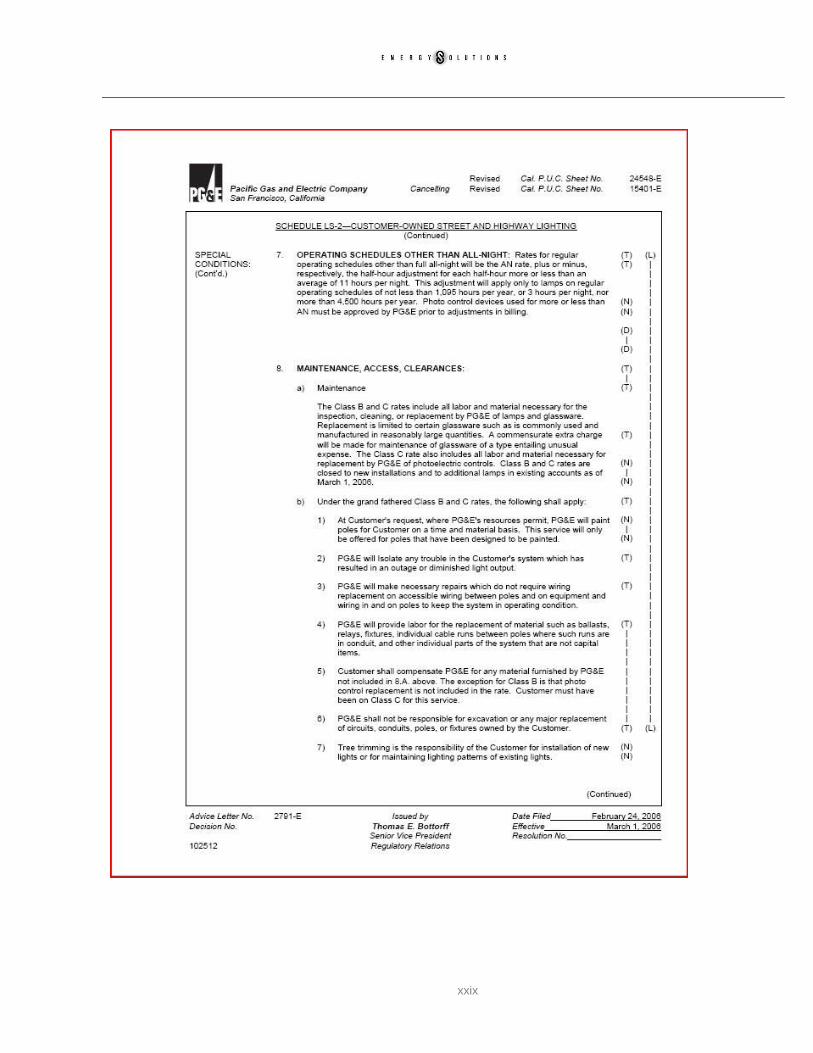
xxix
xxx
xxxi
xxxii