Embed Size (px)
Citation preview

Demonstrating A Geophysics Strategy for Minimally Invasive Remediation Performance Assessment
Johnson ‐ 1
Demonstrating A Geophysics Strategy for Minimally Invasive Remediation Performance Assessment
October 28, 2016 1
TIM C. JOHNSON1, FRED D. DAY-LEWIS2, LEE D. SLATER3, PAULINE KESSOURI3, STEVEN HAMMETT4, DIMITRIS NTARLAGIANNIS3, AND BRADY LEE1
1 Pacific Northwest National Laboratory2 U.S. Geological Survey3 Rutgers University4 Naval Facilities Engineering Command
Federal Remediation Technology Roundtable, November 2, 2016
Outline
Basic Theory and OperationDeployment, measurements, processing
Application SamplerCharacterization Imaging
Time lapse Imaging
October 28, 2016 2
Time-lapse Imaging
Real Time Imaging
Managing Expectations, Limitations and PitfallsConsequences of Limited Resolution
Tools and Approaches for Reducing Risk
Case StudyBrandywine M.D. Defense Reutilization Marketing Office
Electrical Imaging Step 1: Deploy Data Collection Hardware
Surface Electrode Array
electrode lines
Step 1: Electrode arrays are installed in the field and connected to a data collection system.
October 28, 2016 3
Borehole Electrode Array
Data Collection System
Step 2: Collect Tomographic Data
Current Injection and Potential Field
current flow lines
Step 2:
• Current is inject between a pair of electrodes
October 28, 2016 4
Current Source
Current Sink
Subsurface Potential (Volts)
• Voltage is measured across another pair
• Many such measurements are collected to form a tomographic data set.
Step 3: Convert measurements to images via tomographic inversion
M0
M1
TomographicDatasets
T hi
TomographicImage(s)
Step 3:
• Data sets are inverted to recover “images” of electrical properties
October 28, 2016 5October 28, 2016
D1
D2
D3
DN
.
.
.
Time‐lapse data
...
M2
M3
M4
TomographicInversion
• Static images show absolute properties
• Time-lapse images show changes over time
• Conductive and capacitive properties
What can electrical properties tell us about the subsurface?
Electrical
Moisture content ()
Groundwater
A geophysical property dependent on many subsurface properties….
Fluid d ti it
Saturation(S = /)
Surface area (Sp)
October 28, 2016 6
6
Electrical conductivity
Groundwater composition
Porosity (int) Temperature (T)
TSSST wpsurfnm
wearth
earth w,,,
1int
conductivity (w)
m and n are exponents related to pore space connectivity/tortuosity

Demonstrating A Geophysics Strategy for Minimally Invasive Remediation Performance Assessment
Johnson ‐ 2
The Detection Problem: Finding a plume
Electrical Resistivity Anomaly (plume)
ohm‐m ohm‐m
Electrical Resistivity Cross section
Electrical Resistivity Tomogram
October 28, 2016
“The Needle” “The haystack + needle” “Blurry Haystack”
Plume is masked by geologic heterogeneity
Time Lapse Difference Imaging
Electrical
Resistivity
BEFOREAFTER ohm‐m
8Plume is revealed by subtracting out pre‐injection background, removing unrelated spatial contrasts; i.e., we removed the haystack
Absolute
Tomogram
s
ohm‐m
‐
Difference Tomogram
Implementation Example 1: Imaging Vadose Zone Contamination (Hanford)
High conductivity zones correspond to elevated saturation and high nitrate concentrations from past waste infiltration.
2006/2007 Surface ER Survey
9October 28, 2016October 28, 2016 Data courtesy HydroGeophysics, Inc.
Implementation Example 1: B-Complex 3D-ERT Fly around View
animation
Example 2: Time-lapse monitoring of stage-driven river water intrusion
Fluid conductivity (e.g. specific conductance) contrast between river water and groundwater enables river water to be imaged as it infiltrates into the aquifer during high stage.
Easting (m)
Northing (m
)
Hanford 300 Area
animation
Example 3: Real-Time monitoring of amendment delivery via surface infiltration
Photo at A facing A’Plan view of 300 Area Treatment Site
Phosphate tanks
• ~ 10 m thick uranium contaminated vadose zone• saturated zone hydraulically connected to Columbia River• phosphate amendment binds uranium to sediments

Demonstrating A Geophysics Strategy for Minimally Invasive Remediation Performance Assessment
Johnson ‐ 3
Example 3: Results
October 28, 2016 13
animation
Example 3: Real Time Web Delivery
October 28, 2016 14
October 28, 2016
New image every 12 minutes
Solute velocity and arrival time analysis
October 28, 2016 15
October 28, 2016
High K zone Low K zone
Developing Realistic Expectations
Pros: Minimally invasive Relatively low cost Can cover a large area ‘Sees’ in between wells Good at the “when and where”
Note: There is NO
16
Note: There is NO such thing as
geophysical X‐ray vision! No silver
bullets!
Developing Realistic Expectations
Pros: Minimally invasive Relatively low cost Can cover a large area ‘Sees’ in between wells Good at the “when and where”
Note: There is NO
17
Cons: Indirect – correlation or
interpretation requires Limited resolution Not good at the “what”
Not an either/or proposition!Geophysics is most powerful when used in combination with conventional measurements!
Note: There is NO such thing as
geophysical X‐ray vision! No silver
bullets!
Consequences of Limited Resolution
TrueConductivity
3D Images
Increase
Consequences of limited resolution
• Images are smeared versions of reality
• Averaging (high values are under‐predicted low values are overlevel o
f prio
r inform
ation
Conductivity (S/m)
predicted, low values are over‐predicted)
• Laboratory scale measurements do not translate directly to field scale
• Resolution decreases with distance from electrodes
• Prior information can improve resolution (buyer beware)

Demonstrating A Geophysics Strategy for Minimally Invasive Remediation Performance Assessment
Johnson ‐ 4
Beware of Misuse/Overselling
• Blatant overselling of capabilities by service providers is common
• Tools and approaches are available to test feasibility and reduce risk
Managing expectations and reducing risk through pre-modelling feasibility assessment
Note … represents best case scenario
Example: Pre-modelling a DNAPL Spill
https://www.serdp‐estcp.org/Tools‐and‐Training/Webinar‐Series/07‐28‐2016
https://www.serdp‐estcp.org/Tools‐
More info at:
Borehole electrodes substantially improve resolution of the plume
https://www.serdp estcp.org/Toolsand‐Training/Webinar‐Series/06‐30‐2016
http://water.usgs.gov/ogw/frgt
http://e4d.pnnl.gov
Case Study: Brandywine M.D. DRMO
Wash. D.C.
Andrews A.F.B
Brandywine, MD
Brandywine Defense Reutilization Marketing Office (DRMO)
• Eight‐acre former storage facility owned by Andrews AFB
• Contaminated with PCE (soil) and TCE (groundwater), both onsite and offsite
October 28, 2016 22
22
• Record Of Decision specified enhanced bioremediation
• Amendment injections occurred 2008‐2010
• Original ESTCP project: Optimized Enhanced Bioremediation Through 4D Geophysical Monitoring and Autonomous Data Collection, Processing and Analysis (ER200717), Major et al. (2014)
ER 200717 Project Summary
Primary Objective: Demonstrate the capability to autonomously image 3D bio‐amendment distribution with time.
Test Site Configuration Baseline ERT Image
ER 200717 Imaging Results
Summary
• Successfully imaged the 3D emplacement and migration of amendment.
• Observed secondary increase in
Injection points
24
• Observed secondary increase in conductivity within the treatment zone after about 1 year.
• Validated the cause of the secondary increase to be bio‐induced solid‐phase transformation (likely FeS precipitation).
Johnson, T.C., Versteeg,R.J., Day‐Lewis, F.D., Major, W., and Lane, J.W., 2015. “Time‐Lapse Electrical Geophysical Monitoring of Amendment Emplacement for Biostimulation”, Ground Water53(6):920‐932. doi:10.1111/gwat.12291
animation
Demonstrating A Geophysics Strategy for Minimally Invasive Remediation Performance Assessment
Johnson ‐ 5
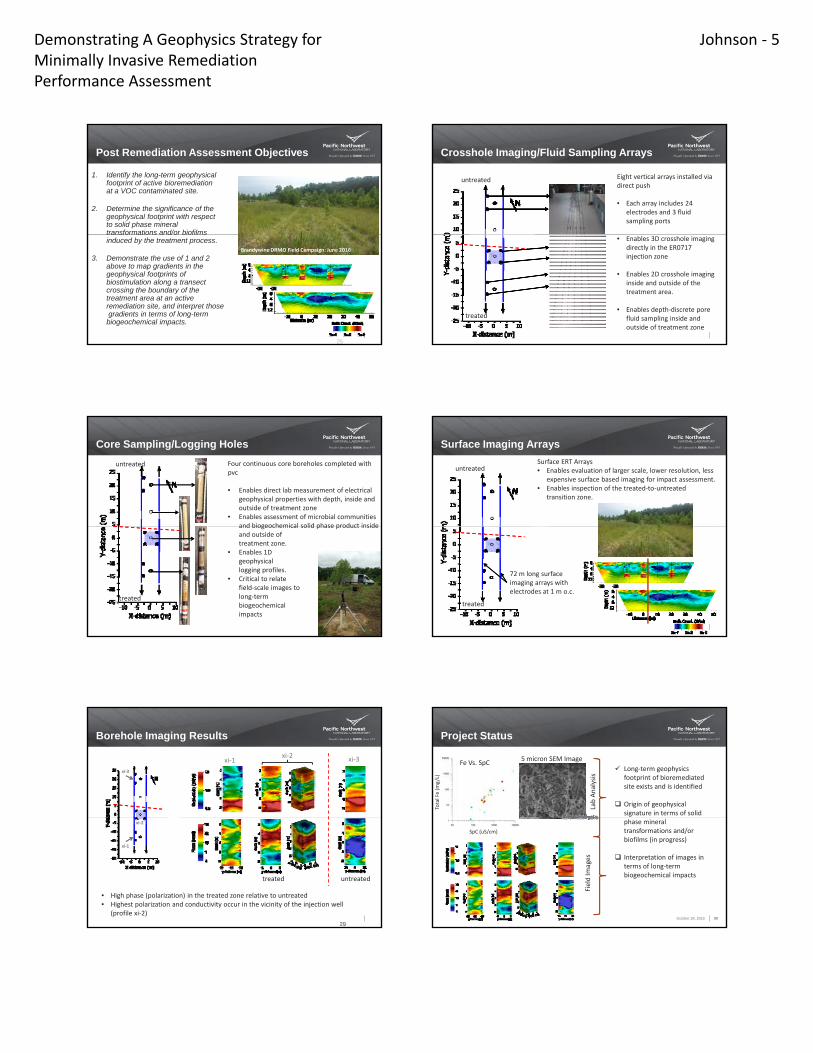
Post Remediation Assessment Objectives
1. Identify the long-term geophysicalfootprint of active bioremediation at a VOC contaminated site.
2. Determine the significance of the geophysical footprint with respectto solid phase mineral transformations and/or biofilms
25
transformations and/or biofilms induced by the treatment process.
3. Demonstrate the use of 1 and 2 above to map gradients in the geophysical footprints of biostimulation along a transect crossing the boundary of the treatment area at an active remediation site, and interpret thosegradients in terms of long-term biogeochemical impacts.
Brandywine DRMO Field Campaign: June 2016
Crosshole Imaging/Fluid Sampling Arrays
untreated Eight vertical arrays installed via direct push
• Each array includes 24 electrodes and 3 fluid sampling ports
treated
• Enables 3D crosshole imaging directly in the ER0717 injection zone
• Enables 2D crosshole imaging inside and outside of the treatment area.
• Enables depth‐discrete pore fluid sampling inside and outside of treatment zone
Core Sampling/Logging Holes
untreated Four continuous core boreholes completed with pvc
• Enables direct lab measurement of electrical geophysical properties with depth, inside and outside of treatment zone
• Enables assessment of microbial communities and biogeochemical solid phase product inside
27
treated
and biogeochemical solid phase product inside and outside of treatment zone.
• Enables 1D geophysical logging profiles.
• Critical to relate field‐scale images tolong‐term biogeochemicalimpacts
Surface Imaging Arrays
untreatedSurface ERT Arrays• Enables evaluation of larger scale, lower resolution, less
expensive surface based imaging for impact assessment. • Enables inspection of the treated‐to‐untreated
transition zone.
28
treated
72 m long surface imaging arrays with electrodes at 1 m o.c.
Borehole Imaging Results
xi‐3
xi‐1xi‐2 xi‐3
292929
xi‐1
xi‐2
• High phase (polarization) in the treated zone relative to untreated• Highest polarization and conductivity occur in the vicinity of the injection well
(profile xi‐2)
treated untreated
Project Status
Total Fe (mg/L)
Fe Vs. SpC5 micron SEM Image
Lab Analysis
Long‐term geophysics footprint of bioremediated site exists and is identified
Origin of geophysical signature in terms of solid
October 28, 2016 30
SpC (uS/cm)
Field Im
ages
phase mineral transformations and/or biofilms (in progress)
Interpretation of images in terms of long‐term biogeochemical impacts
Demonstrating A Geophysics Strategy for Minimally Invasive Remediation Performance Assessment
Johnson ‐ 6
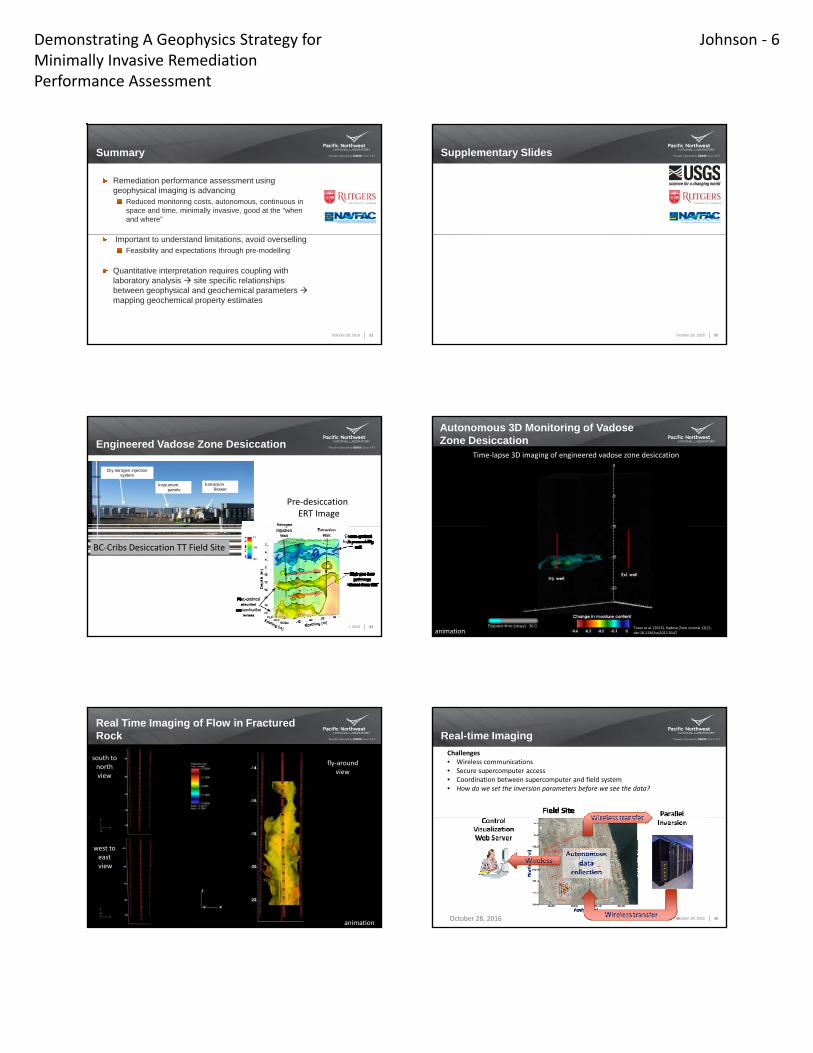
Summary
Remediation performance assessment using geophysical imaging is advancing
Reduced monitoring costs, autonomous, continuous in space and time, minimally invasive, good at the “when and where”
October 28, 2016 31
Important to understand limitations, avoid oversellingFeasibility and expectations through pre-modelling
Quantitative interpretation requires coupling with laboratory analysis site specific relationships between geophysical and geochemical parameters mapping geochemical property estimates
Supplementary Slides
October 28, 2016 32
Engineered Vadose Zone Desiccation
Dry nitrogen injection system
Instrument panels
Extraction Blower
Pre‐desiccation ERT Image
October 28, 2016 33
BC‐Cribs Desiccation TT Field Site
Autonomous 3D Monitoring of Vadose Zone Desiccation
Time‐lapse 3D imaging of engineered vadose zone desiccation
October 28, 2016 34Truex et al. (2013), Vadose Zone Journal 12(2):, doi:10.2136/vzj2012.0147animation
Real Time Imaging of Flow in Fractured Rock
south to north view
fly‐around view
October 28, 2016 35
west to eastview
animation
Real-time Imaging
Challenges• Wireless communications• Secure supercomputer access• Coordination between supercomputer and field system• How do we set the inversion parameters before we see the data?
October 28, 2016 36October 28, 2016 36

Demonstrating A Geophysics Strategy for Minimally Invasive Remediation Performance Assessment
Johnson ‐ 7
http://e4d.pnl.gov
October 28, 2016 37