Embed Size (px)
DESCRIPTION
Â
Citation preview

SECONDARY RETAIL TRADE AREA DEMOGRAPHIC PROFILENorman, Oklahoma
Prepared forCity of NormanMay 2014

2
Copyright © and (P) 1988–2012 Microsoft Corporation and/or its suppliers. All rights reserved. http://www.microsoft.com/mappoint/Certain mapping and direction data © 2012 NAVTEQ. All rights reserved. The Data for areas of Canada includes information taken with permission from Canadian authorities, including: © Her Majesty the Queen in Right of Canada, © Queen's Printer for Ontario. NAVTEQ and NAVTEQ ON BOARD are trademarks of NAVTEQ. © 2012 Tele Atlas North America, Inc. All rights reserved. Tele Atlas and Tele Atlas North America are trademarks of Tele Atlas, Inc. © 2012 by Applied Geographic Solutions. All rights reserved. Portions © Copyright 2012 by Woodall Publications Corp. All rights reserved.
NormanOK_PrimRTA_Map_2014
0 mi 5 10 15 20 25Contact InformationTerry Floyd, Development CoordinatorCity of Norman201 West Gray StreetNorman, Oklahoma 73069
Phone 405.366.5446Fax [email protected]
Secondary Retail Trade AreaNorman, Oklahoma
NORMAN
3
DESCRIPTION DATA %
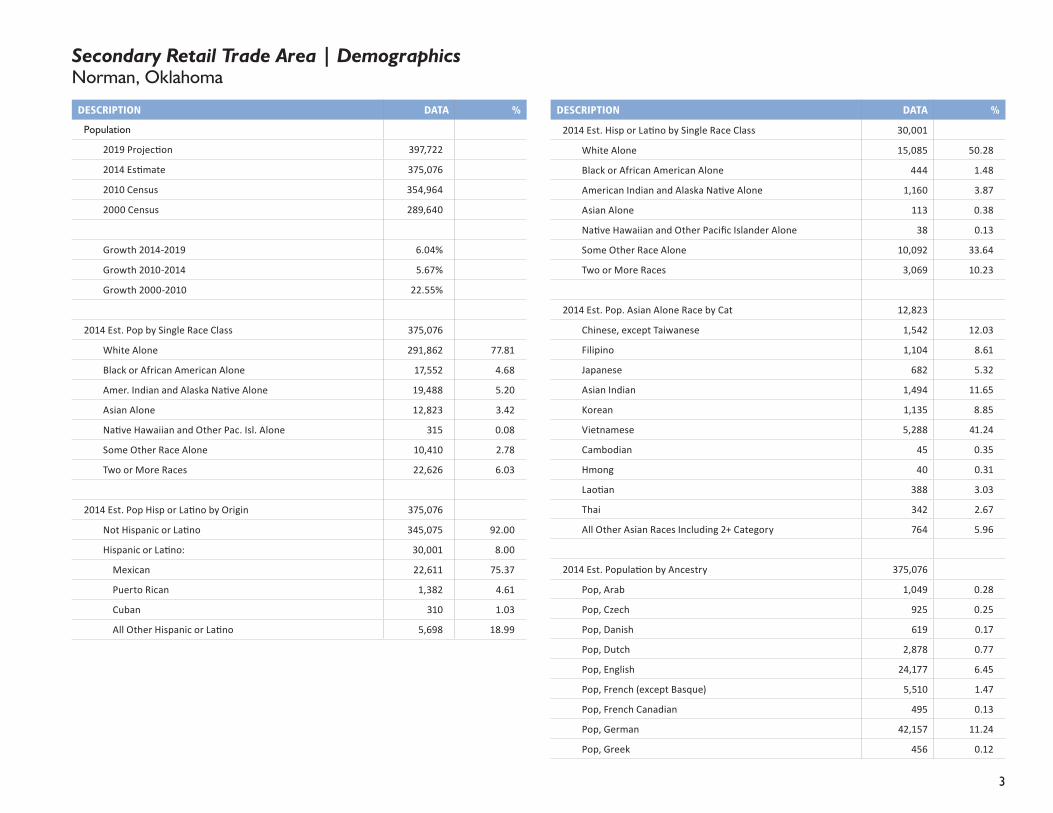
Population
2019 Projection 397,722
2014 Estimate 375,076
2010 Census 354,964
2000 Census 289,640
Growth 2014-2019 6.04%
Growth 2010-2014 5.67%
Growth 2000-2010 22.55%
2014 Est. Pop by Single Race Class 375,076
White Alone 291,862 77.81
Black or African American Alone 17,552 4.68
Amer. Indian and Alaska Native Alone 19,488 5.20
Asian Alone 12,823 3.42
Native Hawaiian and Other Pac. Isl. Alone 315 0.08
Some Other Race Alone 10,410 2.78
Two or More Races 22,626 6.03
2014 Est. Pop Hisp or Latino by Origin 375,076
Not Hispanic or Latino 345,075 92.00
Hispanic or Latino: 30,001 8.00
Mexican 22,611 75.37
Puerto Rican 1,382 4.61
Cuban 310 1.03
All Other Hispanic or Latino 5,698 18.99
DESCRIPTION DATA %
2014 Est. Hisp or Latino by Single Race Class 30,001
White Alone 15,085 50.28
Black or African American Alone 444 1.48
American Indian and Alaska Native Alone 1,160 3.87
Asian Alone 113 0.38
Native Hawaiian and Other Pacific Islander Alone 38 0.13
Some Other Race Alone 10,092 33.64
Two or More Races 3,069 10.23
2014 Est. Pop. Asian Alone Race by Cat 12,823
Chinese, except Taiwanese 1,542 12.03
Filipino 1,104 8.61
Japanese 682 5.32
Asian Indian 1,494 11.65
Korean 1,135 8.85
Vietnamese 5,288 41.24
Cambodian 45 0.35
Hmong 40 0.31
Laotian 388 3.03
Thai 342 2.67
All Other Asian Races Including 2+ Category 764 5.96
2014 Est. Population by Ancestry 375,076
Pop, Arab 1,049 0.28
Pop, Czech 925 0.25
Pop, Danish 619 0.17
Pop, Dutch 2,878 0.77
Pop, English 24,177 6.45
Pop, French (except Basque) 5,510 1.47
Pop, French Canadian 495 0.13
Pop, German 42,157 11.24
Pop, Greek 456 0.12
Secondary Retail Trade Area | DemographicsNorman, Oklahoma

4
DESCRIPTION DATA %
Pop, Hungarian 349 0.09
Pop, Irish 34,417 9.18
Pop, Italian 5,183 1.38
Pop, Lithuanian 60 0.02
Pop, United States or American 39,840 10.62
Pop, Norwegian 1,242 0.33
Pop, Polish 2,618 0.70
Pop, Portuguese 376 0.10
Pop, Russian 625 0.17
Pop, Scottish 5,084 1.36
Pop, Scotch-Irish 3,046 0.81
Pop, Slovak 44 0.01
Pop, Subsaharan African 2,005 0.53
Pop, Swedish 1,658 0.44
Pop, Swiss 446 0.12
Pop, Ukrainian 331 0.09
Pop, Welsh 890 0.24
Pop, West Indian (exc Hisp groups) 1,149 0.31
Pop, Other ancestries 132,677 35.37
Pop, Ancestry Unclassified 64,768 17.27
2014 Est. Pop Age 5+ by Language Spoken At Home 351,129
Speak Only English at Home 318,571 90.73
Speak Asian/Pac. Isl. Lang. at Home 8,507 2.42
Speak IndoEuropean Language at Home 5,379 1.53
Speak Spanish at Home 16,309 4.64
Speak Other Language at Home 2,363 0.67
2014 Est. Population by Sex 375,076
Male 186,823 49.81
Female 188,253 50.19
DESCRIPTION DATA %
2014 Est. Population by Age 375,076
Age 0 - 4 23,947 6.38
Age 5 - 9 24,287 6.48
Age 10 - 14 24,311 6.48
Age 15 - 17 15,004 4.00
Age 18 - 20 19,713 5.26
Age 21 - 24 27,351 7.29
Age 25 - 34 54,800 14.61
Age 35 - 44 47,658 12.71
Age 45 - 54 47,901 12.77
Age 55 - 64 43,767 11.67
Age 65 - 74 27,851 7.43
Age 75 - 84 13,619 3.63
Age 85 and over 4,869 1.30
Age 16 and over 297,621 79.35
Age 18 and over 287,527 76.66
Age 21 and over 267,815 71.40
Age 65 and over 46,338 12.35
2014 Est. Median Age 34.7
2014 Est. Average Age 36.80
Secondary Retail Trade Area | DemographicsNorman, Oklahoma
5
DESCRIPTION DATA %
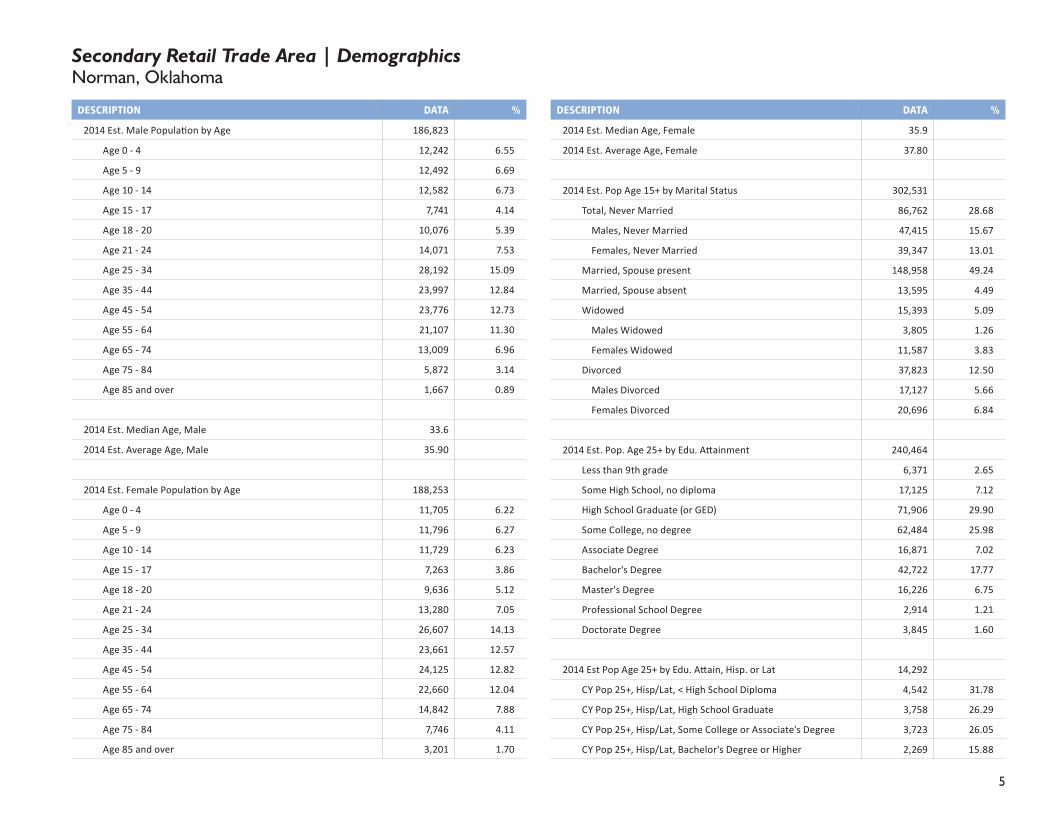
2014 Est. Male Population by Age 186,823
Age 0 - 4 12,242 6.55
Age 5 - 9 12,492 6.69
Age 10 - 14 12,582 6.73
Age 15 - 17 7,741 4.14
Age 18 - 20 10,076 5.39
Age 21 - 24 14,071 7.53
Age 25 - 34 28,192 15.09
Age 35 - 44 23,997 12.84
Age 45 - 54 23,776 12.73
Age 55 - 64 21,107 11.30
Age 65 - 74 13,009 6.96
Age 75 - 84 5,872 3.14
Age 85 and over 1,667 0.89
2014 Est. Median Age, Male 33.6
2014 Est. Average Age, Male 35.90
2014 Est. Female Population by Age 188,253
Age 0 - 4 11,705 6.22
Age 5 - 9 11,796 6.27
Age 10 - 14 11,729 6.23
Age 15 - 17 7,263 3.86
Age 18 - 20 9,636 5.12
Age 21 - 24 13,280 7.05
Age 25 - 34 26,607 14.13
Age 35 - 44 23,661 12.57
Age 45 - 54 24,125 12.82
Age 55 - 64 22,660 12.04
Age 65 - 74 14,842 7.88
Age 75 - 84 7,746 4.11
Age 85 and over 3,201 1.70
DESCRIPTION DATA %
2014 Est. Median Age, Female 35.9
2014 Est. Average Age, Female 37.80
2014 Est. Pop Age 15+ by Marital Status 302,531
Total, Never Married 86,762 28.68
Males, Never Married 47,415 15.67
Females, Never Married 39,347 13.01
Married, Spouse present 148,958 49.24
Married, Spouse absent 13,595 4.49
Widowed 15,393 5.09
Males Widowed 3,805 1.26
Females Widowed 11,587 3.83
Divorced 37,823 12.50
Males Divorced 17,127 5.66
Females Divorced 20,696 6.84
2014 Est. Pop. Age 25+ by Edu. Attainment 240,464
Less than 9th grade 6,371 2.65
Some High School, no diploma 17,125 7.12
High School Graduate (or GED) 71,906 29.90
Some College, no degree 62,484 25.98
Associate Degree 16,871 7.02
Bachelor's Degree 42,722 17.77
Master's Degree 16,226 6.75
Professional School Degree 2,914 1.21
Doctorate Degree 3,845 1.60
2014 Est Pop Age 25+ by Edu. Attain, Hisp. or Lat 14,292
CY Pop 25+, Hisp/Lat, < High School Diploma 4,542 31.78
CY Pop 25+, Hisp/Lat, High School Graduate 3,758 26.29
CY Pop 25+, Hisp/Lat, Some College or Associate's Degree 3,723 26.05
CY Pop 25+, Hisp/Lat, Bachelor's Degree or Higher 2,269 15.88
Secondary Retail Trade Area | DemographicsNorman, Oklahoma

6
DESCRIPTION DATA %
Households
2019 Projection 153,209
2014 Estimate 144,224
2010 Census 136,239
2000 Census 110,758
Growth 2014-2019 6.23%
Growth 2010-2014 5.86%
Growth 2000-2010 23.01%
2014 Est. Households by Household Type 144,224
Family Households 96,826 67.14
Nonfamily Households 47,398 32.86
2014 Est. Group Quarters Population 11,886
2014 HHs by Ethnicity, Hispanic/Latino 8,288 5.75
2014 Est. HHs by HH Income 144,224
CY HHs, Inc < $15,000 16,957 11.76
CY HHs, Inc $15,000 - $24,999 13,863 9.61
CY HHs, Inc $25,000 - $34,999 15,469 10.73
CY HHs, Inc $35,000 - $49,999 21,910 15.19
CY HHs, Inc $50,000 - $74,999 28,920 20.05
CY HHs, Inc $75,000 - $99,999 18,892 13.10
CY HHs, Inc $100,000 - $124,999 12,315 8.54
CY HHs, Inc $125,000 - $149,999 6,711 4.65
CY HHs, Inc $150,000 - $199,999 5,344 3.71
CY HHs, Inc $200,000 - $249,999 1,736 1.20
CY HHs, Inc $250,000 - $499,999 1,706 1.18
CY HHs, Inc $500,000+ 401 0.28
DESCRIPTION DATA %
2014 Est. Average Household Income $66,885
2014 Est. Median Household Income $53,382
2014 Median HH Inc by Single Race Class. or Ethn
White Alone 54,962
Black or African American Alone 39,599
American Indian and Alaska Native Alone 51,461
Asian Alone 47,475
Native Hawaiian and Other Pacific Islander Alone 24,481
Some Other Race Alone 49,868
Two or More Races 49,320
Hispanic or Latino 44,413
Not Hispanic or Latino 54,019
2014 Est. Family HH Type, Presence Own Children 96,826
Married-Couple Family, own children 31,183 32.21
Married-Couple Family, no own children 43,258 44.68
Male Householder, own children 3,724 3.85
Male Householder, no own children 3,114 3.22
Female Householder, own children 8,905 9.20
Female Householder, no own children 6,643 6.86
2014 Est. Households by Household Size 144,224
1-person household 36,833 25.54
2-person household 49,579 34.38
3-person household 24,887 17.26
4-person household 19,614 13.60
5-person household 8,525 5.91
6-person household 3,211 2.23
7 or more person household 1,575 1.09
Secondary Retail Trade Area | DemographicsNorman, Oklahoma
7
DESCRIPTION DATA %
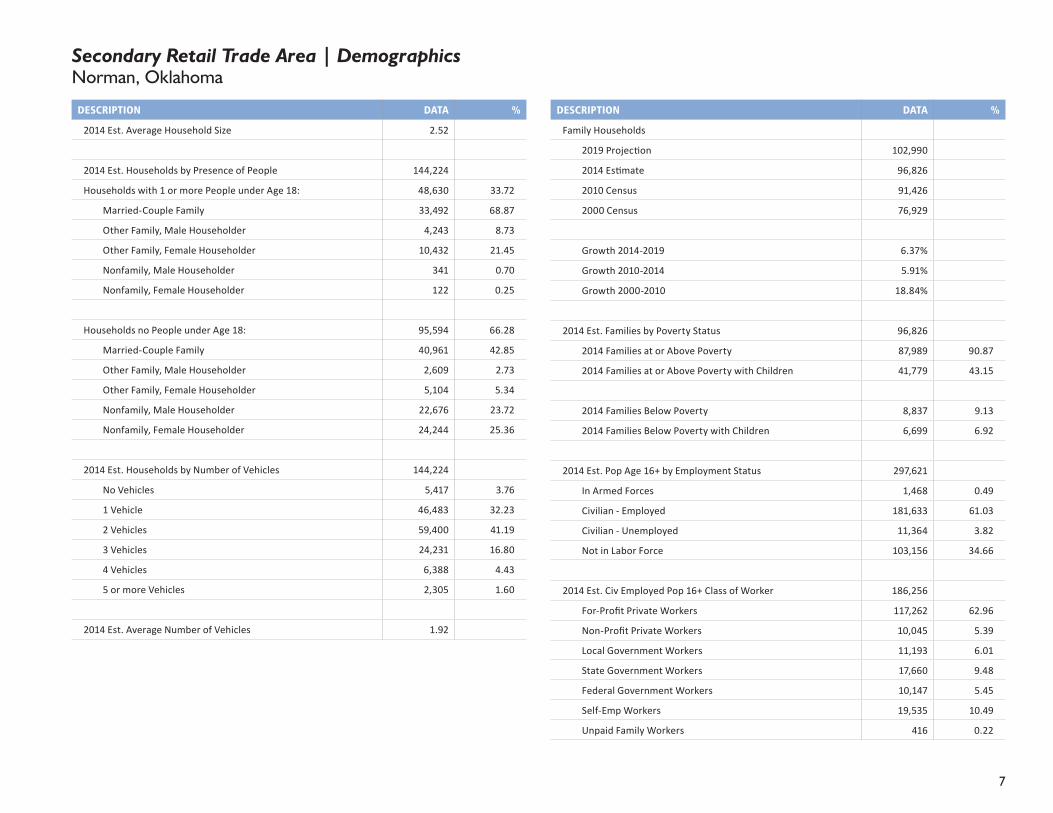
2014 Est. Average Household Size 2.52
2014 Est. Households by Presence of People 144,224
Households with 1 or more People under Age 18: 48,630 33.72
Married-Couple Family 33,492 68.87
Other Family, Male Householder 4,243 8.73
Other Family, Female Householder 10,432 21.45
Nonfamily, Male Householder 341 0.70
Nonfamily, Female Householder 122 0.25
Households no People under Age 18: 95,594 66.28
Married-Couple Family 40,961 42.85
Other Family, Male Householder 2,609 2.73
Other Family, Female Householder 5,104 5.34
Nonfamily, Male Householder 22,676 23.72
Nonfamily, Female Householder 24,244 25.36
2014 Est. Households by Number of Vehicles 144,224
No Vehicles 5,417 3.76
1 Vehicle 46,483 32.23
2 Vehicles 59,400 41.19
3 Vehicles 24,231 16.80
4 Vehicles 6,388 4.43
5 or more Vehicles 2,305 1.60
2014 Est. Average Number of Vehicles 1.92
DESCRIPTION DATA %
Family Households
2019 Projection 102,990
2014 Estimate 96,826
2010 Census 91,426
2000 Census 76,929
Growth 2014-2019 6.37%
Growth 2010-2014 5.91%
Growth 2000-2010 18.84%
2014 Est. Families by Poverty Status 96,826
2014 Families at or Above Poverty 87,989 90.87
2014 Families at or Above Poverty with Children 41,779 43.15
2014 Families Below Poverty 8,837 9.13
2014 Families Below Poverty with Children 6,699 6.92
2014 Est. Pop Age 16+ by Employment Status 297,621
In Armed Forces 1,468 0.49
Civilian - Employed 181,633 61.03
Civilian - Unemployed 11,364 3.82
Not in Labor Force 103,156 34.66
2014 Est. Civ Employed Pop 16+ Class of Worker 186,256
For-Profit Private Workers 117,262 62.96
Non-Profit Private Workers 10,045 5.39
Local Government Workers 11,193 6.01
State Government Workers 17,660 9.48
Federal Government Workers 10,147 5.45
Self-Emp Workers 19,535 10.49
Unpaid Family Workers 416 0.22
Secondary Retail Trade Area | DemographicsNorman, Oklahoma

8
DESCRIPTION DATA %
2014 Est. Civ Employed Pop 16+ by Occupation 186,256
Architect/Engineer 3,215 1.73
Arts/Entertain/Sports 2,636 1.42
Building Grounds Maint 6,478 3.48
Business/Financial Ops 8,477 4.55
Community/Soc Svcs 3,041 1.63
Computer/Mathematical 4,075 2.19
Construction/Extraction 11,978 6.43
Edu/Training/Library 13,235 7.11
Farm/Fish/Forestry 663 0.36
Food Prep/Serving 10,680 5.73
Health Practitioner/Tec 10,693 5.74
Healthcare Support 4,629 2.49
Maintenance Repair 8,208 4.41
Legal 2,173 1.17
Life/Phys/Soc Science 1,658 0.89
Management 15,972 8.58
Office/Admin Support 27,693 14.87
Production 10,088 5.42
Protective Svcs 4,938 2.65
Sales/Related 20,169 10.83
Personal Care/Svc 6,129 3.29
Transportation/Moving 9,430 5.06
2014 Est. Pop 16+ by Occupation Classification 186,256
Blue Collar 39,704 21.32
White Collar 113,035 60.69
Service and Farm 33,517 18.00
DESCRIPTION DATA %
2014 Est. Workers Age 16+, Transp. To Work 184,148
Drove Alone 153,833 83.54
Car Pooled 18,112 9.84
Public Transportation 599 0.33
Walked 3,367 1.83
Bicycle 883 0.48
Other Means 1,891 1.03
Worked at Home 5,463 2.97
2014 Est. Workers Age 16+ by Travel Time to Work *
Less than 15 Minutes 53,358
15 - 29 Minutes 67,751
30 - 44 Minutes 37,154
45 - 59 Minutes 11,887
60 or more Minutes 8,104
2014 Est. Avg Travel Time to Work in Minutes 25.39
2014 Est. Tenure of Occupied Housing Units 144,224
Owner Occupied 98,764 68.48
Renter Occupied 45,460 31.52
2014 Owner Occ. HUs: Avg. Length of Residence 14.8
2014 Renter Occ. HUs: Avg. Length of Residence 6.1
Secondary Retail Trade Area | DemographicsNorman, Oklahoma
9
DESCRIPTION DATA %
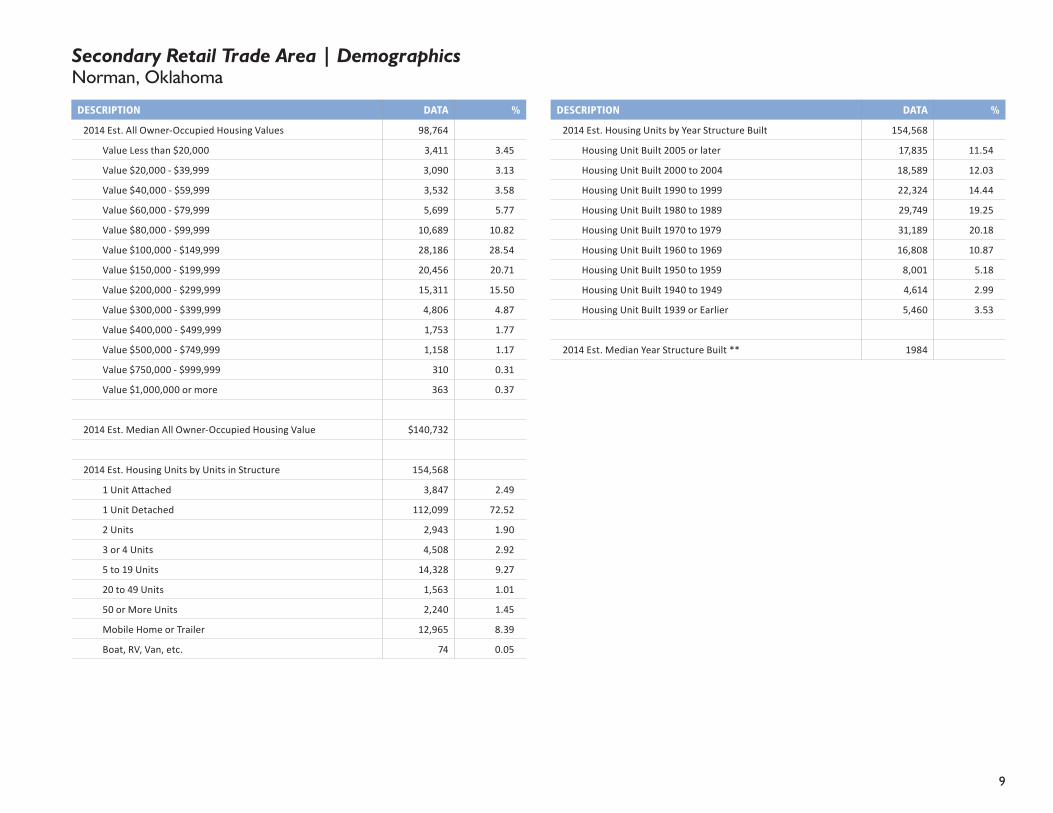
2014 Est. All Owner-Occupied Housing Values 98,764
Value Less than $20,000 3,411 3.45
Value $20,000 - $39,999 3,090 3.13
Value $40,000 - $59,999 3,532 3.58
Value $60,000 - $79,999 5,699 5.77
Value $80,000 - $99,999 10,689 10.82
Value $100,000 - $149,999 28,186 28.54
Value $150,000 - $199,999 20,456 20.71
Value $200,000 - $299,999 15,311 15.50
Value $300,000 - $399,999 4,806 4.87
Value $400,000 - $499,999 1,753 1.77
Value $500,000 - $749,999 1,158 1.17
Value $750,000 - $999,999 310 0.31
Value $1,000,000 or more 363 0.37
2014 Est. Median All Owner-Occupied Housing Value $140,732
2014 Est. Housing Units by Units in Structure 154,568
1 Unit Attached 3,847 2.49
1 Unit Detached 112,099 72.52
2 Units 2,943 1.90
3 or 4 Units 4,508 2.92
5 to 19 Units 14,328 9.27
20 to 49 Units 1,563 1.01
50 or More Units 2,240 1.45
Mobile Home or Trailer 12,965 8.39
Boat, RV, Van, etc. 74 0.05
DESCRIPTION DATA %
2014 Est. Housing Units by Year Structure Built 154,568
Housing Unit Built 2005 or later 17,835 11.54
Housing Unit Built 2000 to 2004 18,589 12.03
Housing Unit Built 1990 to 1999 22,324 14.44
Housing Unit Built 1980 to 1989 29,749 19.25
Housing Unit Built 1970 to 1979 31,189 20.18
Housing Unit Built 1960 to 1969 16,808 10.87
Housing Unit Built 1950 to 1959 8,001 5.18
Housing Unit Built 1940 to 1949 4,614 2.99
Housing Unit Built 1939 or Earlier 5,460 3.53
2014 Est. Median Year Structure Built ** 1984
Secondary Retail Trade Area | DemographicsNorman, Oklahoma

10
About The Retail Coach
The Retail Coach, LLC, is a national retail analytics and locational intelligence firm that specializes in all aspects of retail market analyses and recruitment, from “macro to micro” trade area assessment to actively recruiting retailers on behalf of our clients.
Through its unique Retail:360 process, The Retail Coach offers a dynamic system of products and services that better enable communities to maximize their retail development potential.
Retail:360 Process
Providing more than simple data reports of psychographic and demographic trends, The Retail Coach goes well beyond other retail consulting and market research firms’ offerings by combining current national and statewide demographics and trend data with real-world, “on-the-ground” data gathered through extensive visits within our clients’ communities.
Every community is different, and there is no “one size fits all” retail recruitment solution. Compiling the gathered data into client-tailored information packets that are uniquely designed for, and targeted to, specific retailers and restaurants who meet the community’s needs helps assure our clients that they are receiving the latest and best information for their retail recruitment efforts — all with personal service and coaching guidance that continues beyond the initial project scope and timeline.
Our Retail:360 process assures that communities get timely, accurate and relevant information. Translating that data into the information that retailers need and seek assures our clients even better possibilities for tremendous retail growth and success.
The Retail Coach -It’s not about data. It’s about your success.
The Retail Coach, LLC | P. O. Box 7272 | Tupelo, Mississippi 38802tel 800.851.0962 | fax 662.844.2738 | e-mail [email protected] | web www.theretailcoach.net
C. Kelly Cofer President & CEO
The Retail Coach, LLC

11
Acknowledgements
The observations, conclusions and recommendations contained in this study are solely those of The Retail Coach, LLC and should not be construed to represent the opinions of others, including its clients, or any other entity prior to such entity’s express approval of this study.
Sources used in completing this study include: infoUSA™, Applied Geographic Solutions, Nielsen 2013/2014, ESRI 2013, U.S. Census Bureau, Economy.com, CensusViewer.com, International Council of Shopping Centers, and/or U.S. Bureau of Labor and Statistics.
To better represent current data, where applicable, portions of estimated actual sales may be calculated using an average sales per square foot model.
Mapping data is provided by MapInfo, Nielsen, ESRI and/or Microsoft Corporation.
All information furnished is from sources deemed reliable and is submitted subject to errors, omissions, change of terms and/or conditions.