Embed Size (px)
Citation preview

DISCUSSION PAPER SERIES
No. 10887
DEMOGRAPHICS AND THE SECULAR STAGNATION HYPOTHESIS IN EUROPE
Carlo A. Favero and Vincenzo Galasso
INTERNATIONAL MACROECONOMICS AND FINANCE

ISSN 0265-8003
DEMOGRAPHICS AND THE SECULAR STAGNATION HYPOTHESIS IN EUROPE
Carlo A. Favero and Vincenzo Galasso
Discussion Paper No. 10887
October 2015 Submitted 05 October 2015
Centre for Economic Policy Research
77 Bastwick Street, London EC1V 3PZ, UK
Tel: (44 20) 7183 8801
www.cepr.org
This Discussion Paper is issued under the auspices of the Centre’s research programme in INTERNATIONAL MACROECONOMICS AND FINANCE. Any opinions expressed here are those of the author(s) and not those of the Centre for Economic Policy Research. Research disseminated by CEPR may include views on policy, but the Centre itself takes no institutional policy positions.
The Centre for Economic Policy Research was established in 1983 as an educational charity, to promote independent analysis and public discussion of open economies and the relations among them. It is pluralist and non‐partisan, bringing economic research to bear on the analysis of medium‐ and long‐run policy questions.
These Discussion Papers often represent preliminary or incomplete work, circulated to encourage discussion and comment. Citation and use of such a paper should take account of its provisional character.
Copyright: Carlo A. Favero and Vincenzo Galasso

DEMOGRAPHICS AND THE SECULAR STAGNATION HYPOTHESIS IN EUROPE†
Abstract
Demographic trends in Europe do not support empirically the secular stagnation hypothesis. Our evidence shows that the age structure of population generates less long‐term growth but positive real rates. Policies for growth become very important. We assess the relevance of the demographic structure for the choice between macro adjustements and structural reforms. We show that middle aged and elderly individuals have a more negative view of reforms, competitiveness and globalization than young. Our results suggest that older countries ‐‐ in terms of share of elderly people ‐‐ should lean more towards macroeconomic adjustments, whereas younger nations will be more supportive of structural reforms.
JEL Classification: J11 and J14 Keywords: Europe, growth, real interest rates and stochastic mortality
Carlo A. Favero [email protected] Deutsche Bank Chair in Asset Pricing and Quantitative Finance, Università Bocconi, IGIER and CEPR
Vincenzo Galasso [email protected] Università bocconi, Dondena Center IGIER and CEPR
† Paper prepared for Conference on the Euro Economy, Bank of Portugal, Lisbon May 2015. We thank paprticipants to the Conference and Francesco Caselli for useful comments and suggestions. Gualtiero Azzalini and Vito Gervasi provided excellent research assistance. Vincenzo Galasso acknowledges financial support from Progetto MIUR-PRIN year 2010-11 protocol number 2010T8XAXB_008.
1 Introduction
Do demographic trends support the secular stagnation hypothesis for the euro
area? The issue of secular stagnation was �rst raised in 1938 by Alvin Hansen
(1939) in his presidential address "Economic progress and declining population
growth", delivered nine years after the onset of the Great Depression, when he
worried that low population growth would produce a situation of persistently in-
adequate output growth. The wording has been recently revamped by Larry Sum-
mers (see Teulings and Baldwin, 2014) who argued that negative real interest rates
are currently needed to equate saving and investment with full employment. With
low in�ation and zero lower bound on policy interest rates it may be impossible for
an economy to achieve full employment, satisfactory growth and �nancial stability
(as low real rates increase the probability of bubbles). The rate of growth of pop-
ulation has traditionally been the main concern of economists, and Alvin Hansen
made no exception. Demographers (see, for example, Bloom, Canning and Sevilla,
2003) take a di¤erent view and insist on the importance of the age structure of the
population (that is, the way in which the population is distributed across di¤erent
age groups) for growth and real rates. In this paper, we assess the importance of
the age structure of population for the secular stagnation hypothesis by deriving
a mortality trend from a standard model of mortality, the Lee-Carter model, and
combining it with the projected age structure of population to generate long-term
projections for the trend in output per capita and real interest rates for euro area
economies. Our evidence shows that demographic-based projections deliver for the
next twenty years a lower long-run potential growth rate but a reversion of real
interest rates to their historical mean. The increase in life expectancy with lower
2

fertility increases the supply of loanable funds savings, but ageing and a higher
share of old age population more than compensate this e¤ect to deliver projected
higher real rates. Evidence on real rates is that they moved from 5% in the 1980s to
2% in the 1990s to an average of -1% after the Lehman collapse; the demographics
based projected rates are back in the positive range for the next ten years with a
between country variability that re�ects the heterogeneity in the age structure of
population.
On the basis of this evidence, we proceed to assess the role of age structure on
productivity and labour markets, to understand to what extent the evidence on
the empirical relationship between age structure and long-term growth could be
related to the impact of age structure on reforms in labour and product market.
First, we exploit OECD labor and product market indicators to show that a large
share of middle aged and elderly individuals in the population is associated with a
lower reform e¤ort. Second, using Eurobarometer data, we show that middle aged
and elderly individuals have a more negative view of reforms, competitiveness and
globalization than young. We conclude by evaluating the importance of our results
for the debate on the best strategy to promote growth in the current macroeco-
nomic conditions. In particular we discuss the importance of our evidence for the
two di¤erent views that are currently debated: the structural reforms view versus
the macroeconomic adjustment view. The �rst one underlines the relevance of
structural policies to promote growth in potential output after the crisis while the
macro adjustment view suggests that structural reforms may prove detrimental
if more �exibility in the labour market cannot be accommodated by the central
bank with expansionary policy that cannot in any case deliver the negative real
rates necessary to restore equilibrium. Our results suggest that the real interest
3

rates projected by taking into account the age structure of the population will be
positive and moderately raising over the next decade. However, the implementa-
tion of product and labour market reforms will not be facilitated by the same age
structure of population.
2 The Demographic Scenario for Europe
Demographic dynamics is seldom empirically modelled in economics, we shall make
an exception here and base our analysis of the demographic scenario on an explicit
dynamic model of mortality. We consider the Lee-Carter (1992) mortality model to
derive a mortality trend that we will combine with the age structure of population
in Europe1 to generate demographic-driven trends for real output and real interest
rates. We analyze �fteen European countries (Austria, Belgium, Denmark, Spain,
Finland, France, Great Britain, Germany, Ireland, Italy, The Netherlands, Norway,
Portugal, Switzerland and Sweden) to generate a sample of 10 euro area countries
and 5 non euro area countries. Data on mortality for the sample 1956-2009 are
taken from the Berkeley Human Mortality Database website.2 The data are annual
observations of central mortality rates. mx;t denotes the mortality for individuals
of age x in year t, where mortality is the probability that a person aged x and alive
at the beginning of the year dies within the end of the year. s(x; t) is instead the
survivor probability for individuals of age x in year t, which is the probability that
an individual will be alive at age x given that he has survived up to age x�1. Given
mortality rates, survivor probabilities are derived recursively for individuals aged T
and over: If x = T then s(x; t) = 1�mx;t; if x > T then s(x; t) = s(x�1; t)[1�mx;t].
1We thererefore model the demographic dynamics only partially as we do not explicitly com-bine our mortality model with a migration model and a natality model.
2www.mortality.org
4

Frequencies of death for individuals of age x at time t are determined as �rst
di¤erences of survival probabilities: fod(x; t) = s(x; t) � s(x + 1; t). Finally, life
expectancy at age x in period t is de�ned as follows Ex;t =1�j=1s(x+ j; t+ j):
The Lee-Carter (1992) model consists of a system of equations for logarithms
of mortality rates for age cohort x at time t; ln[mx;t]; and a time-series equation
for an unobservable time-varying mortality index kt:
ln (mx;t) = ax + bxkt + �x;t (1)
kt= c0 + c1kt�1 + et
�x;tsNID�0; �2�
�etsMeanZero - Stationary Process
where ax and bx are age-speci�c constants. The error term �x;t captures cross-
sectional errors in the model based prediction for mortality of di¤erent cohorts,
while the error term et captures random �uctuations in the time series of the
common factor kt driving mortality at all ages. This common factor, usually
known as the unobservable mortality index, evolves over time as an autoregressive
process and the favorite Lee-Carter speci�cation makes it a unit-root process by
setting c1 = 1: The model allows to identify the unobservable stochastic mortality
trend, common to all cohorts, and to construct empirical counterparts for survivor
probabilities, frequencies of death and life expectancy at every age.3
The model �ts well the data for all countries considered in our sample and
the results form estimation and model projection are very helpful in describing the
3Identi�cation and estimation of the Lee-Carter model are discussed in Appendix B.
5

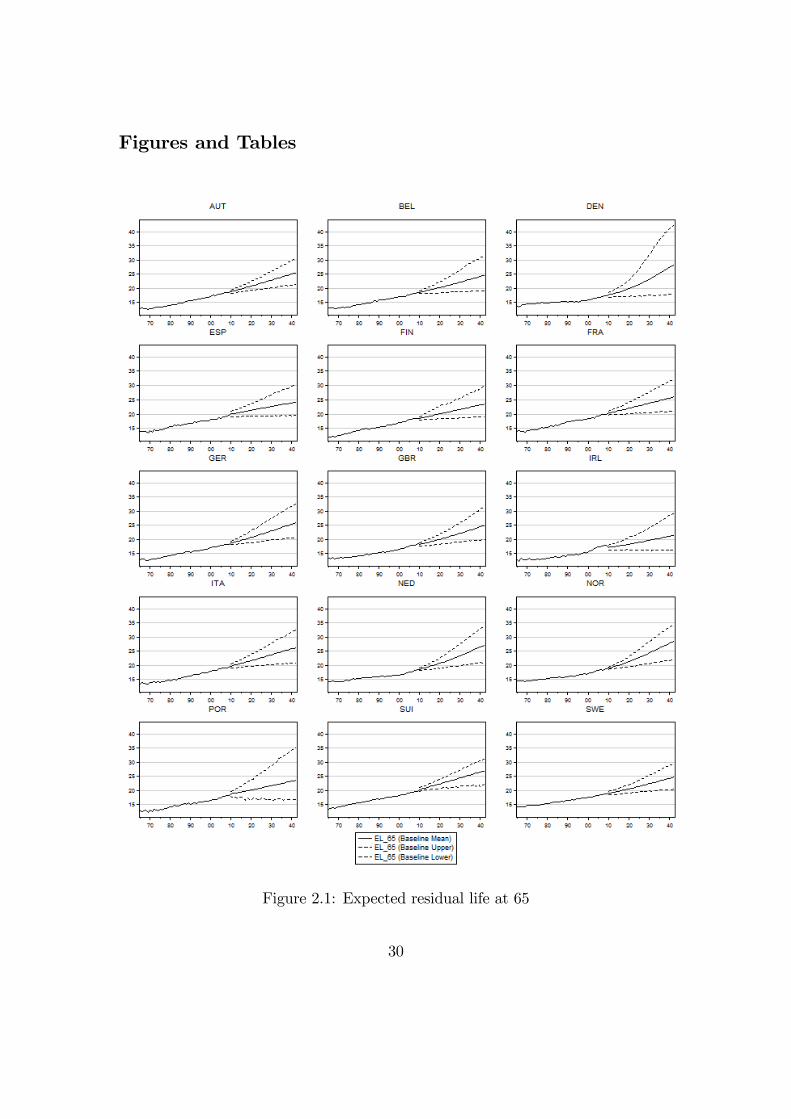
demographic scenario for Europe. Figure 2.1 reports historical data and projections
(with associated 95 per cent con�dence intervals) for expected residual lifetime at
65 years. The typical scenario of an increase of expected lifetime of "six hours
a day" is con�rmed for all countries and also projected to continue in the future
with a considerable longevity risk surrounding the point estimates. Figure 2.2
reports the frequency of death from 65 onwards in 1980 and 2009, which shows
how the increasing concentration of death around the mode of the curve of deaths
( "compression of morbidity", see, for example, Robine et al., 2008) has made
the pro�le of frequencies of death for ages above the mode closer and closer to a
straight vertical line on the left of the range.
Insert Figures 2.1-2.2-2.3 here
Figure 2.3 complements the picture by reporting the observed and projected
age distribution of population based on the databases of the UN Population Di-
vision and of the US Census Bureau; we consider four age groups: 0-19, 20-39,
40-59 and over 60. The trend of share of total population in each group shows a
clear upward movement in the over 60, a downward movement in the 0-19 group,
and humps shaped patterns in the 20-39 and 40-59 groups, who have already both
peaked respectively at the beginning of the eighties and at the beginning of the
new millenium. Ageing and the increased expected lifetime are the two major
demographic forces at work. These two major forces might have heterogenous
economic consequences. Consider, for example, the impact on savings and real
interest rates: on the one hand the increase in expected lifetime at middle-age
has an expansionary e¤ect on the supply of savings and pushes downward the
equilibrium real rates, on the other hand the increase in longevity and the higher
6

share of population in retirement age decreases the supply of saving and pushes the
equilibrium real rates upward. Quantifying these e¤ects is crucial to understand
the impact of demographic trends on equilibrium real rates. Similar arguments
apply to the output e¤ect of demographic trends. On the one hand, the increased
expected lifetime might re�ect technological progress that generates higher out-
put per capita but, on the other hand, productivity decreases with age and the
equilibrium output might be lowered by an ageing population.
In section 3 we shall try to quantify the e¤ect of demographic forces on output
and real rates by specifying demographically driven models for these variables.
3 Demographic-Based Projections for Output and Real In-
terest Rates
To derive demographically based trends for output and real interest rates we take
annual data from the Penn World Table 8 database for Expenditure-side Real
GDP at Chained PPP (Millions of 2005 US$) and Total Population (Millions) and
data for Long-Term Nominal Interest Rates, and GDP de�ator (OECD base year
i.e. 2005) from the OECD statistics.
We consider log of real per capita output at chained PPP, and we derive real
long-term rates using dynamic forecasts for in�ation from a country speci�c recur-
sively estimated �rst order autoregressive model.
We then adopt a model for a panel regression in levels of the logarithm of per
capita GDP at PPP US dollars, yi;t; and the real long-term interest rate, rri;t; on
the logarithms of age shares, aj;i;t; and the Lee-Carter country-speci�c mortality
trend ki;t:
7

zi;t= �1ki;t +60+X
j=0�19�jaj;i;t + �i + �t + ui;t
ki;t= c0;i + c1;iki;t�1 + ei;t (2)
where j = 0� 19; 20� 39; 40� 59; 60+; zi;t = yi;t; rri;t: The speci�cation also
includes a country �xed e¤ect and time-dummies; the model is estimated by SURE
to deal with cross-country correlations of residuals ui;t:We use the model to project
within sample and out-of-sample the variables of our interest, by taking the age
shares as exogenous and using the US Census Bureau projections. The results
from estimation (over the sample 1956-2009 for yi;t and over the sample 1971-2014
for rri;t) are reported in Table 2.1.
Insert Table 2.1 here
The estimation results show a positive impact of the longevity trend both on
output and interest rates, the coe¢ cients on age-shares show that the replacement
of population aged 40-59 with population aged 60 and over has a negative impact
on outptut and a positive impact on real rates. Impact on output trend is linearly
related to the age structure with a uniformly decreasing impact of the coe¢ cient
of age-shares on the trend for individuals aged 20 and over, while the e¤ect on real
rates is U-shaped with a trough at the 40-59 age share, that is the phase in life
in which most savings should be cumulated. To provide further model evaluation
and further insight on the implications of the empirical estimates, we perform
within-sample and out-of sample dynamic simulations for the two variables of our
interest. Out-of-sample projections are based on the predicted shares of population
8

made available by the US Census Bureau and the out-of-sample predicted common
stochastic trend generated by our estimated Lee-Carter model. The results are
reported in Figures 2.4 and 2.5.
Insert Figures 2.4-2.5 here
Figure 2.4 shows that the estimated model is capable of �tting well the observed
trend in output within the estimation sample and that it predicts a clear break
in this trend for the out-of-sample simulation: the trend output consistent with
the age structure of population has a clear di¤erent and �atter slope in the out-
of-sample simulations. This �atter slope is driven by the progressive increased
importance of the 60+ share over time in the out-of-sample period and by the
signi�cantly smaller coe¢ cient of this age share in the estimated equation for
output. The tipping point in the output trend is naturally related to baby boomers
reaching retirement age, with the subsequent increase in the share of the population
in retirement age and the decrease in the share of population in working age. This
evidence is consistent with the results in Aksoy et al. (2015), who investigate
the relation between demographic structure and macroeconomic trends in a Panel
VAR framework that features a richer dynamic speci�cation for the macroeconomic
variables but a more parsimoniuos one for the demographic structure, limited to the
inclusion of the age share with no mortality trend. Similar within sample evidence
is observed for real rates but the implications for the out-of sample simulations are
cleary in constrast with the "secular stagnation" hypothesis. The impact of the
overall ageing population on real rates dominates that of longer expected lifetime
of the savers. As a consequence real rates are predicted to increase out-of-sample.
The overall demographic "new normal" is one with slower trend growth (if any)
9

and higher real interest rates.
3.1 Demographic Structure and Real Rates: Some Further Evidence
The evidence reported on demographics and real rates so far for all countries in
our sample is based only on domestic demographic factors. However, domestic
debt is also held by foreign investors and therefore our results can be a¤ected by
the omission of demographic trends that are relevant to determine the share of
domestic debt held by foreigners.
We address this issue by considering an alternative construction of our shares.
Given the availability of data on foreign holdings of sovereign debt in advanced
economies (Ali Abbas et al., 2014, Arslanalp and Tsuda, 2012) we have recon-
struced the population of debt holders for each country as the weighted average of
domestic and world population with time-varying weigths determined by the share
of domestic debt held abroad. Over the estimation sample we have adopted the
sum of the population in Europe, US and Japan as the relevant world population,
while in the out-of-sample simulation we have also included China to determine the
relevant world population aggregate. We have therefore implictly assumed that
demographic changes in China have been so far less relevant than demographic
changes in individual EU countries in the determination of bond prices, but we
have removed this assumption for future projections. Importantly, although the
composition of the relevant population changes from the estimation period to the
out-of-sample simulation period, the share of domestic debt held abroad out-of-
sample is kept �xed at the last within sample observation.
Insert Table 2.2 here
Table 2.2 shows that the patterns of the coe¢ cients of the shares and of the
10

stochastic mortality trends using the domestic population and the relevant world
population are similar. Figure 2.6 illustrates that out-of-sample real rates projected
using the shares in the relevant world population (including China) are not very
di¤erent from our baseline projections based on the domestic population shares,
although in general real rates are projected at a positive but lower level than those
in the baseline simulation.
Insert Figure 2.6 here
4 Age Structure, Productivity and Labour Markets
During the last few decades, particularly in Europe, the quest for more economic
growth has often been associated with the need of structural reforms (see Eggerts-
son et al., 2014, for a critical review of this argument). Deep institutional changes
took place in the nineties, such as the creation of the European Single Market or
the adoption of the Euro, which limited the role played by �scal and monetary
policy in accommodating national shocks. As a result, large emphasis has been
attributed to more structural, microeconomic adjustments, needed to reduce the
rigidities in the labor and product market and ultimately to foster competition
on output and input markets, and to increase economic e¢ ciency (Nicoletti and
Scarpetta, 2003). Several contributions discussed how structural reforms would
have been incentivized by the introduction of the Euro (see Bean, 1998, Obstfeld,
1997), while others were more critical (Saint-Paul and Bentolila, 2000).
In the last two decades, a growing literature has analyzed these structural re-
forms. Many contributions have highlighted the pattern of liberalization in prod-
uct, labor and �nancial markets in di¤erent countries. As shown in Figure 2.7,
11

which displays the magnitude of the liberalization process between 1975 and 2013,
product market regulations, as measured by the OECD index (see Conway and
Nicoletti, 2006), have dropped, albeit to a di¤erent degree, in several countries.
Besides the UK, which represented an early mover, most European countries be-
gan to liberalize their product market in the nineties following the introduction
of the EU�s internal market program and of the Euro (see Alesina et al., 2009).
Liberalization of the labor market, as measured by the Employment Protection
Legislation (EPL) index (OECD, 2006) has instead proved to be more di¢ cult to
achieve. As shown in Figure 2.8, which displays the degree of EPL in 1985 and
in 2013 for regular workers, few countries have reduced labor market rigidities for
regular workers, although some liberalizations have instead taken place for the
temporary workers.
Insert Figures 2.7-2.8 here
Other contributions have focused on the economic and political determinants
of the structural reforms.
Large emphasis has been given to the incentive provided by institutional changes,
such as the entrance in the European Single Market or the adoption of the Euro.
Alesina et al. (2009) found that the adoption of the Euro increased the deregu-
lations in the product market, particularly in countries such as France and Italy,
and sectors such as energy and communication, which featured higher initial levels
of regulation. The adoption of the Euro was instead not associated with major
reforms in the labor market.
Economic crises have been shown to lead to labor market reforms (IMF, 2004,
Duval and Elmeskov, 2005, Høj et al., 2006), yet with opposite e¤ects for labor
12

market insiders and outsiders. In particular, increases in the long-term unem-
ployment rates are associated with lower employment protection for temporary
workers and more generous unemployment bene�ts, but have no e¤ect on EPL
for regular workers. Countries with more rigid labor markets enjoyed more reform
e¤orts. Economic crises are also associated to deregulation in the product markets
(Hoj et al., 2006). Interestingly, also good �scal positions have been shown to be
bene�cial for reforms in labor and product markets (Duval and Elmeskov, 2005,
and IMF, 2004), perhaps as they provide the �scal capabilities to compensate the
losers from the reforms.
Unsurprisingly, politics is crucial to reform. Ideology seems to matter, as right-
wing governments are more active in reforming the labor market (IMF, 2004),
adopt more liberalizations in the product market and reduce generous unemploy-
ment bene�ts (Høj et al., 2006). However, during economic crisis, right-wing par-
ties refrain from promoting privatizations, while center and left wing governments
are more keen on liberalizing and privatizing (Galasso, 2014). Finally, Buti et al.
(2008) �nd no empirical support for the idea that reforming governments pay an
electoral cost.
Little emphasis has instead been given to the role played by demographic vari-
ables, besides perhaps controlling for the share of the elderly in the empirical
studies. In this paper, we instead give a closer look at how demographic elements
may a¤ect structural reforms. We augment the standard panel regressions used
in this literature (IMF, 2004, Høj et al., 2006) with two di¤erent types of demo-
graphic indicators. First, we include a trend to capture the aging process. In
one set of regressions, we consider a simple linear time trend; in another set of
regression, we instead use the mortality trend estimated in section 2. While this
13

latter trend is perhaps more accurate, it has the drawback of reducing the number
of observations for the empirical analysis, as three countries are dropped from the
sample. Second, we include a set of dummy variables to capture the age structure
of the population. We consider the relative share of the population in four age
groups: 0-19, 20-39, 40-59 and 60+, as displayed at Figure 2.3.
On a theoretical ground, there are at least two channels through which the
age composition of the population may a¤ect the structural reforms. An economic
channel will consist of the impact that changes in the age composition may have on
the (economic) costs and bene�ts of the status quo or of the reforms. A political
channel will instead be given by how changes in the age composition a¤ect the
political representation, and thereby the political support for the status quo or
the reforms. To see this, consider the PAYG pension systems. Population aging
induces an increase in the share of the elderly, and a contemporaneous drop in the
share of the young workers. The economic channel would thus suggest pension
generosity to be reduced, in order to secure the �nancial sustainability of a PAYG
pension scheme. Yet, in the political arena, a larger share of elderly increases
the political support for generous pension schemes. In this case, aging thus has
opposite economic and political e¤ects (see Galasso, 2006).
4.1 Data Description
In our empirical analysis, we examine the structural reforms in product and la-
bor markets, and in the welfare state. We restrict the analysis to 18 European
countries, more speci�cally to Austria, Belgium, Denmark, Finland, France, Ger-
many, Greece, Iceland, Ireland, Italy, Luxembourg, Netherlands, Norway, Portu-
14

gal, Spain, Sweden, Switzerland, and United Kingdom.4
For the product market, reforms are measured as changes in the OECD indi-
cators of sectoral product market regulation. These indicators were constructed
by Conway and Nicoletti (2006) and later updated. We consider indicators for
energy, communications and transports from 1975 to 2013. These product market
regulation indicators summarize information about entry regulation, public own-
ership, market structure, vertical integration and price controls with reference to
these three sectors, which are composed of seven industries: (i) energy (electricity,
gas); (ii) communications (telecoms, post), and (iii) transport (rail, air transport
and road). A score, on a scale from 0 to 6, is attributed to each regulatory aspect,
where the lowest possible score stands for the maximum deregulation. As in Høj
et al. (2006), an overall regulation indicator that excludes public ownership index
is used.
For labor market reforms, we use OECD indicators of strictness of employment
protection. These indicators are intended to measure the legally envisaged con-
straints that employers face in hiring or �ring workers. Data are available for the
1985-2013 period. On a scale from 0 to 6, they quantify three speci�c aspects of
labor market regulation: (i) procedural inconveniences; (ii) notice and severance
payments requirements; and (iii) di¢ culty of dismissal, such as litigations costs,
restrictions on �ring, due compensation for unfair dismissal. These indicators refer
to permanent workers (EPLR), to temporary workers (EPLT), i.e., those workers
hired on �xed-term or temporary work agency contracts, and to an average of the
two (EPL). The OECD provides data also on union density, from 1975 to 2013,
which we use in our regressions.
4Greece, Iceland and Luxembourg are dropped when we use the mortality trend.
15
Unfortunately, OECD statistics do not provide long-series data on other labor
market policies. We thus rely on the Comparative Welfare Entitlements Dataset
assembled by Scruggs et al. (2014) to obtain comparable data upon national
welfare programs for our sample of countries over 1970-2011. In particular, we
have data on three social insurance programs: Unemployment Insurance, Sick Pay
Insurance and Public Pension. Unemployment insurance consists only of national
insurance provisions, and pensions include only mandatory public programs. For
the sick pay insurance, which consists of the bene�ts paid in case of temporary non-
occupational illness or injury, we consider both public provisions and provisions
for mandatory private bene�ts. For each of these three social insurance programs,
information on bene�t replacement rates, qualifying condition, and coverage are
collected and aggregated into bene�t generosity scores.
For product and labor markets, variations in the respective indicators denote
structural reforms. A negative variation in indicator for product and labor market
regulation represents deregulation. Our welfare state indicators denote instead
generosity.
Consistently with previous empirical studies on structural reforms, we consider
several control variables. We include in our regressions, economic crisis, measured
as one standard deviation reduction in output gap, a dummy variable respectively
for the adoption of the European Single Market (singlemkt) and of the Euro (emu),
a measure of the country openness, the logarithm of the real per-capita GDP, and
a dummy variable for a right-wing government in power. Table 2.3 provides the
summary statistics relative to our measures of labor and product market regula-
tion, welfare state generosity, and to these control variables.
16

Insert Table 2.3 here
4.2 Results
Table 2.4 shows the results of our panel regression for the product market using
year and country �xed e¤ects, and respectively the linear and the mortality trend.
The age composition of the population turns out to be an important determinant
of reforms in the product market. In particular, a larger share of individuals in
working age � namely aged 20-39 and even more 40-59 � is associated with a
strong reduction in the overall product market regulator indicator. These results
are robust to using linear or mortality trend.
Insert Table 2.4 here
Why would a larger share of the working population be associated with more
product market reforms? Di¤erent interpretations can be provided. A �rst, static
explanation hinges on the observation that the sectors measured in the OECD
product market regulation index are all non-manufacturing sectors. Hence, the
rents associated with the dominant positions in sectors such as energy or trans-
portation translate into higher costs for other manufacturing industries, and per-
haps to lower employment opportunities. Thus, a larger share of the working pop-
ulation, who is to some extent negatively a¤ected by these higher costs, may put
pressure for liberalizing the non-manufacturing sectors. A second, more dynamic
explanation relies on the idea that microeconomic adjustments induce long-term
growth, although they have current costs for those employers and employees who
bene�t from the rents associated with the dominant market position. In this case,
a larger share of workers �particularly the younger ones �may tilt the aggregate
preferences more towards future growth perspectives.
17

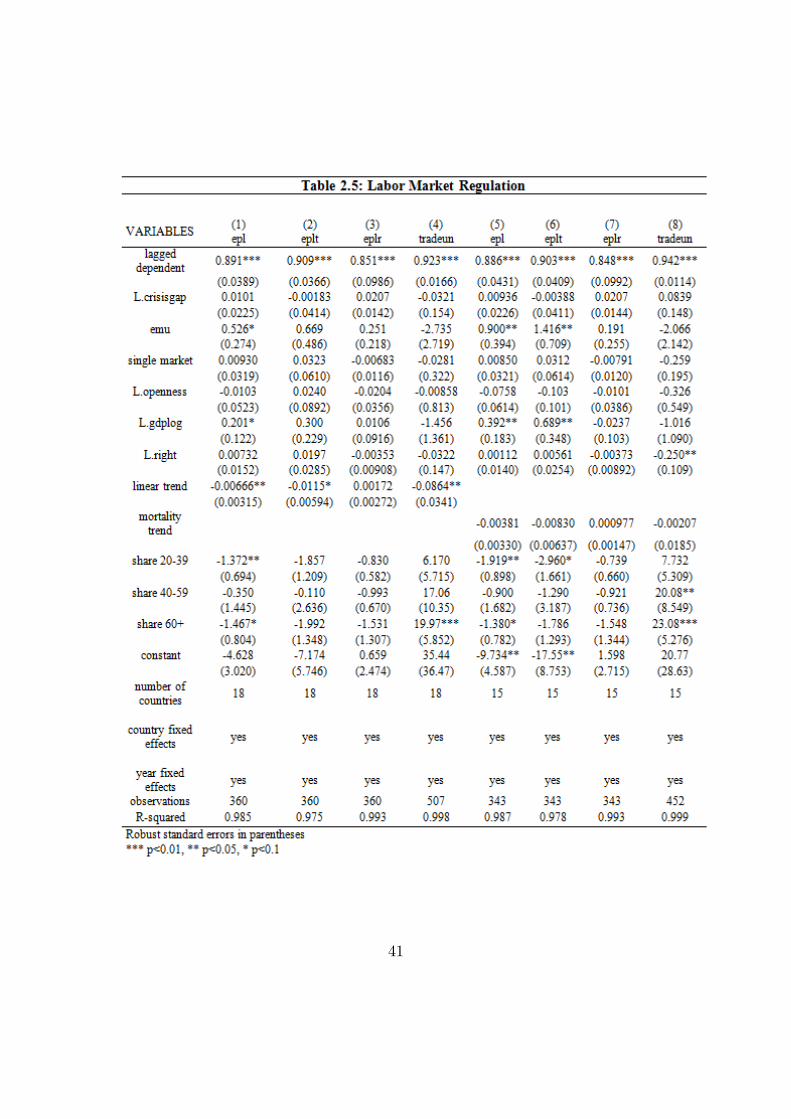
Insert Table 2.5 here
The age composition of the population seems to matter also for the labor
market reforms, as shown in Table 2.5. The overall employment protection drops
as the share of the young individuals �aged 20 to 39 �increases (columns 1 and 5).
Unsurprisingly, this e¤ect is mostly driven by the deregulation for the temporary
contracts (columns 2 and 6). This evidence thus suggests that an increase in
the share of young individuals, who represent potential entrants into the labor
market, puts pressure on designing reforms that may indeed facilitate their entry.
It is also interesting to notice that the degree of union density (columns 4 and
8) is increasing in the share of the elderly �aged 60+, most of whom are indeed
retired �and thereby out of the labor force. This evidence is however consistent
with the drop in union density among the current young workers, and may indeed
be driven by a cohort e¤ect, with past generation of workers being more heavily
unionized. As before, these results are robust to using a linear or mortality trend.
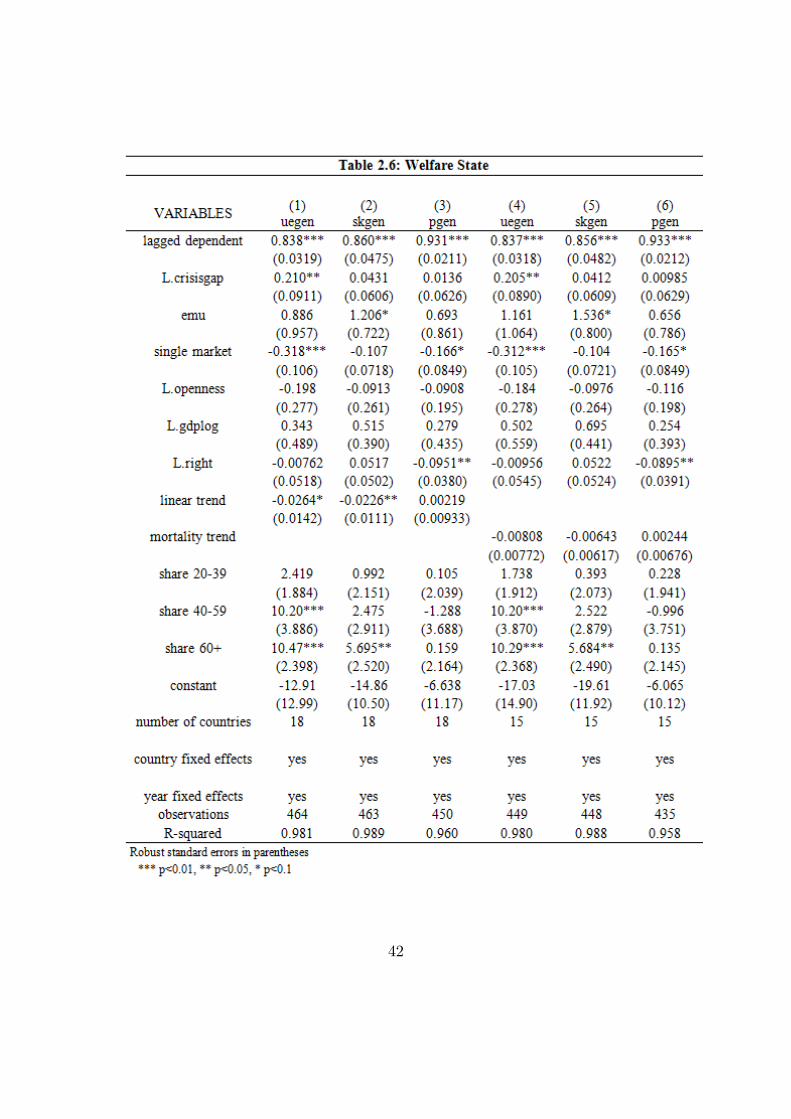
Insert Table 2.6 here
Table 2.6 presents our evidence on the generosity of three social insurance pro-
grams, namely unemployment insurance, sick pay insurance and public pensions.
An increase in the share of the "older" working population, aged 40-59, is associ-
ated with more generous unemployment bene�ts. Indeed, even a larger share of
the elderly �aged 60 years old or more �is correlated with more unemployment
bene�ts. This is however not very surprisingly, as many elderly workers have used
unemployment insurance as an early pathway out of the labor market. All these
individuals, albeit to di¤erent degrees, thus seem to support more generous un-
employment insurance system. The support for more generous sick pay insurance
18

is instead stronger among the elderly. Perhaps surprisingly, the generosity of the
pension system �a program clearly targeted to the elderly � is not a¤ected by
the age composition. This may well be due to the opposite economic and political
e¤ects of aging. In other words, while the elderly would support a more generous
pension scheme, the aging process makes it �nancially impossible to sustain such
a system.
5 The Political Economy of the Age Structure of Popula-
tion
Two di¤erent schools of thought have receintly emerged on how to exit from the
current economic crisis and on the determinants of growth. Several scholars and
institutions �including the Governor of the European Central Bank, Mario Draghi,
have emphasized the crucial role of the structural reforms in fostering competition
in the product and labor markets. These microeconomic adjustments are deemed
to be necessary to increase economic e¢ ciency (Nicoletti and Scarpetta, 2003).
This is particularly the case in the southern European countries strongly hit by
the crisis, in which larger price adjustments are needed. Other scholars have in-
stead argued that the current crisis needs to be addressed with macroeconomic
adjustments. Eggertsson et al. (2014) go even further to suggest that structural
reforms may indeed prove detrimental in the short run, if decreases in wages lead to
de�ationary policies that cannot be accomodated by the central bank with a reduc-
tion in the interest rate. Gali and Monacelli (2014) have remarked that structural
reforms, when asymmetric across countries, require asymmetric monetary policy
to accompany them. Such policies cannot be implemented in a common currency
area.
19

Regardless of the relative merits of these two arguments, however, section 4
suggests that there may be political economy motivations to support one school
of thought or the other. And these motivations are likely to di¤er mainly across
generations.
To address this intergenerational issue, we use data from the Eurobarometer �
a survey run by the European Commission, to learn the opinions of the citizens in
the EU countries on several issues. We exploit the 2014 Eurobarometer survey for
the seventeen countries examined in the analysis at section 4 (we have no data for
Switzerland) on three broad issues: reforms, competition and globalization. The
questions asked in the Eurobarometer allow us to obtain information on the indi-
vidual perceptions about the relevance of reforms, competition and globalization
for economic growth, as well as on their preferences for reforms, free trade, liber-
alization and competition. We regress the individual responses to these questions
on several individual characteristics, such as gender, marital status, employment
status, self-declared social status and political orientation, and of course on an
age indicator. In particular, in all regressions, we identify the individuals younger
than 40 year old as our reference group, and include middle aged (40-59) and old
(60+) among the regressors. We always use country �xed e¤ects to exploit only
within country variation.
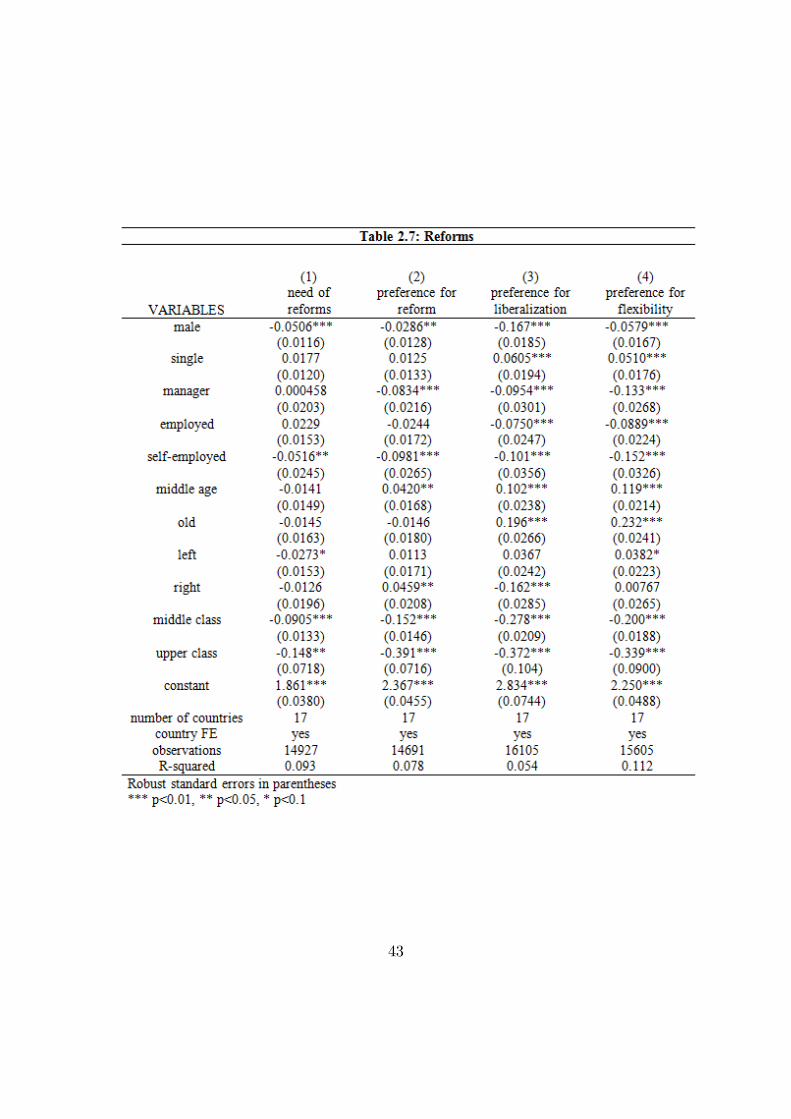
Insert Table 2.7 here
Table 2.7 presents the results of our empirical analysis on the reforms. In col-
umn (1), we consider as dependent variable the individual responsed to a question
in which individuals assign a value between 1 (totally agree) and 4 (totally dis-
agree) to the following statement "Our country needs reforms to face the future".
20

Awarness about the need of reforming is higher among males, self-employed and
among middle and upper class individuals, while no di¤erence emerges across age
groups. Columns (2), (3) and (4) show instead the results related to individual
preferences for reforms, liberalization and �exibility. For these questions, individ-
uals assign a value between 1 (very positive) and 4 (very negative) to the following
statement: "Could you please tell me whether the following term �respectively
reforms for column (2), liberalization for column (3) and �exibility for column (4)
�brings to mind something very positive, fairly positive, fairly negative or very
negative?". In all three cases, males, managers, self-employed and middle and up-
per class individuals tend to have a more positive view. Preferences strongly di¤er
by age groups. For middle age individuals, reforms, liberalization and �exibility
are considered strongly more negatively than for the young. And the same holds
true for the old, except for the case of reforms.variation.
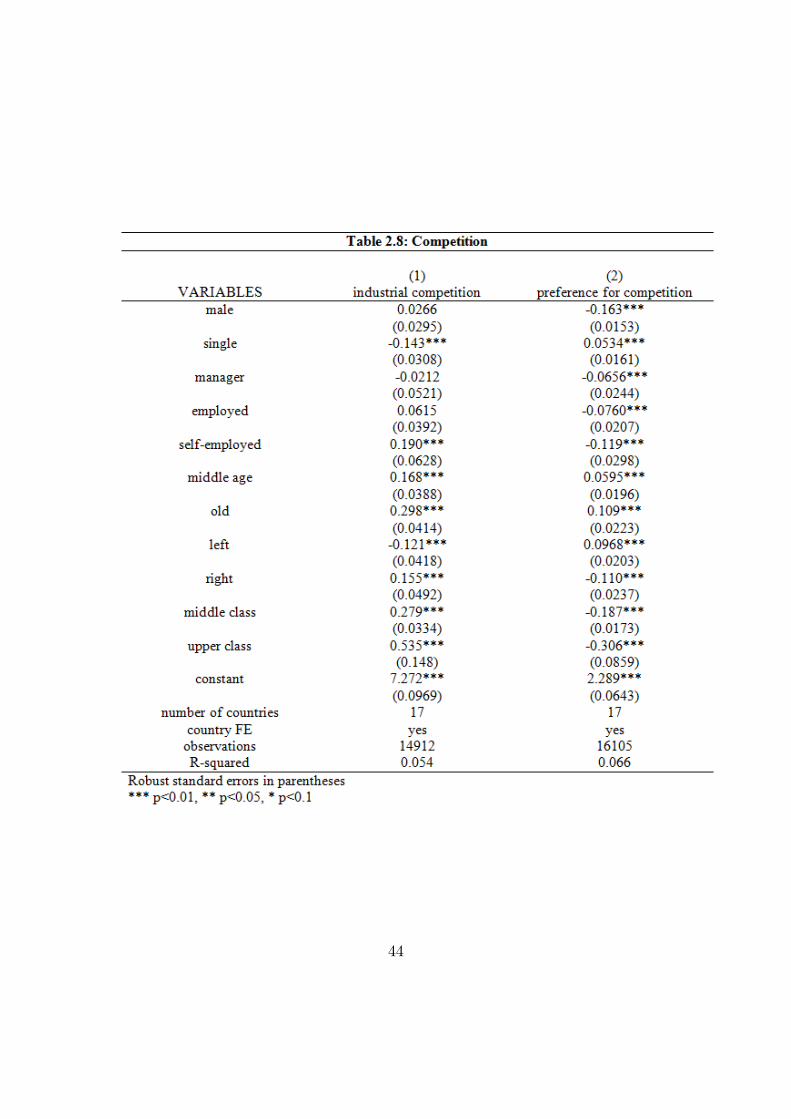
Insert Table 2.8 here
At Table 2.8, we show the results for our empirical analysis on competition.
Column (1) reports the results related to the question in which individuals assign
a value between 1 (not at all important) and 10 (very important) to the following
statement "Please tell me how important or not you think in order for the EU to
exit the present �nancial and economic crisis and prepare for the next decade is to
help the EU�s industrial base to be more competitive by promoting entrepreneur-
ship and developing new skills". Unsurprisingly, self-employed, middle and upper
class individuals endorse the relevance of competition to exit the crisis. Individu-
als with right-wing political views also believe competition to be important, while
left-wing individuals do not. A, perhaps surprising, di¤erence emerges also across
21

age groups: middle age, and even more elderly individuals deem competition to
be relevant more than young individuals do. This awarness by the elderly, how-
ever, does not translate into more preference for competition. Column (2) shows
the results related to individual responses to the following statement: "Could you
please tell me whether competition brings to mind something very positive, fairly
positive, fairly negative or very negative?", where 1 indicates very positive and 4
very negative. Consistently with the answer to the previous question (column 1),
self-employed, right-wing and middle and upper class individuals tend to have a
more positive view of competition. Middle aged and elderly individuals instead
have a more negative view of competition than the young, despite the fact that
they seem to be aware of its relevance for economic growth.
Insert Table 2.9 here
Finally, at Table 2.9, we concentrate on our empirical analysis on glabalization.
Column (1) reports the results related to the Eurobarometer question in which
individuals assign a value between 1 (totally agree) and 4 (totally disagree) to the
following statement "Globalisation is an opportunity for economic growth". Males,
managers and middle and upper class individuals are more likely to agree with this
statement; left-wing and singles to disagree. A strong di¤erence about the merit
of globalization emerges also by age group, as middle aged and elderly individuals
strongly disagree with the above statement. Columns (2) and (3) report the results
of the individual responses to the following statement: "Could you please tell me
whether globalization (column 2) or free trade (column 3) bring to mind something
very positive, fairly positive, fairly negative or very negative?", where 1 indicates
very positive and 4 very negative. Consistently with the previous answers, middle
22

aged and elderly individuals view globalization and free trade more negatively than
the young.
In a nutshell, our analysis with Eurobarometer data suggests that, regardless
of their awarness on the relevance of reforms, competitiveness and globalization for
economic growth, middle aged and elderly individuals have much stronger views
against reforms, liberalization, �exibility, competitiveness, globalization and free
trade than the young may have. These �ndings are consistent with the idea that
structural reforms in the labor and product markets, as well as the retrenchment
of the welfare state, have clear redistributive consequences. Labor market liber-
alizations may increase hiring, but they reduce the degree of production of the
insiders. Analogously, less generous unemployment bene�ts reduce the degree of
insurance for those workers who were initially protected. As a clear age cleavage
emerges among labor market insiders and outsiders, these labor market policies
may bene�t the younger generation but they tend to impose a cost on the elderly
workers. Our empirical results on both aggregate outcome and individual percep-
tions are in line with this interpretation. Product market deregulations instead
reduce the economic rents enjoyed in these protected markets. Economic theory
suggests that these rents are shared between employees and employers active in
the protected sectors. Also product market liberalizations thus have redistributive
consequences. To the extent that elderly workers in these protected sectors are
able to extract more rents, again an age cleavage may emerge. The same age di-
vide would emerge in the preferences for welfare state retrenchment, since in most
countries �particularly in Southern Europe �current social spending is massively
targeted to the elderly. Finally, to the extent that structural reforms are able to
spur future growth, the main bene�ciaries of this economic growth would still be
23

the young generations. As a result, structural reforms may obtain the political
support of the young generations, but they most likely get the opposition of the
elderly (insiders).
Neo-Keneysian macroeconomic adjustments, on the other hand, may be less
divisive, to the extent that all generations are allowed to bene�t from more public
spending and easier access to credit. However, given the large in�uence that elderly
and insiders have on the political process that allocates public resources, these
macroeconomic adjustments would most likely bene�t the older generations, rather
than the younger ones. Moreover, our evidence on real rates and demographic
structure does not support the concern of the existence of a negative equilibrium
for real rates that cannot be achieved in the presence of a zero lower bound on
policy rates.
6 Conclusions
The main tenet of secular stagnation is that negative real interest rates are needed
to equate saving and investment with full employment. Demographics is often
referred to as one of the potential causes of secular stagnation. In this paper we
have addressed the relationship between the age structure of population and long-
term growth and real rates. We have estimated a standard model of mortality, the
Lee-Carter model, to generate a mortality trend for �fteeen European countries
and combine it with the projected age structure of population to generate long-
term projections for the trend in output per capita and real interest rates for euro
area economies. Our evidence shows that demographic-based projections deliver
for the next twenty years a lower long-run potential growth rate but a reversion
of real interest rates to their historical mean. Within this framework, polices
24

for growth become of crucial importance and we therefore address the debate on
structural reforms versus macroeconomic adjustment.
On the basis of this evidence, we have assessed the role of the age structure in
promoting or hindering reforms in labour and product markets, which have been
advocated to increase long-term growth. Our results suggest that the implementa-
tion of such reforms will not be facilitated by the age structure of population. In a
world of ageing population, structural reforms should obtain the political support
of the young generations, but they will most likely get the opposition of the elderly.
Our evidence on the feasibility of Neo-Keynesian macroeconomic adjustment
given projected positive real rates paired with the projection for an increasing
share of the old age bracket leads us to conclude that, given the large in�uence
that elderly and insiders have on the political process that allocates public re-
sources, these macroeconomic adjustments would most likely bene�t the older
generations, rather than the younger ones. Di¤erent policy recipes may have dif-
ferent intellectual and academic backgrounds, but they also seem to have di¤erent
redistributive consequences. It should thus not be surprising if the older countries
�in terms of share of elderly people �lean more towards macroeconomic adjust-
ments, whereas younger nations �again in terms of population share, are more
supportive of structural reforms.
25

References
Aksoy, Y., H.S.Basso, T.Grasl and R.P.Smith (2015), "Demographic Structure
andMacroeconomic Trends", mimeo Birkbeck College, University of London.
Alesina, A., S.Ardagna and V.Galasso (2009), "The Euro and Structural Re-
forms", in A. Alesina and F Giavazzi (eds.) Europe and the Euro, University
of Chicago Press and NBER.
Ali Abbas, S.M., L.Blattner, M.De Broeck, A.El-Ganainy, and M.Hu (2014),
"Sovereign Debt Composition in Advanced Economies: A Historical Per-
spective", IMF Working Paper No. 14/162, Washington DC.
Arslanalp, S. and T.Tsuda (2012), "Tracking Global Demand for Advanced Econ-
omy Sovereign Debt", IMF Working Paper No. 12/284, Washington DC.
Available at www.imf.org/external/pubs/cat/longres.aspx?sk=40135.0.
Attard, B. (2007), "New Estimates of Australian Public Borrowing and Capital
Raised in London, 1849-1914", Australian Economic History Review 47: 155-
177.
Auerbach, A.J. and L.J.Kotliko¤ (1987), Dynamic Fiscal Policy. Cambridge, UK:
Cambridge University Press.
Auerbach, A.J., L.J.Kotliko¤ and W.Leibfritz (1999), Generational Accounting
Around the World, The University of Chicago Press.
Bean, C. (1998), "The Interaction of Aggregate-Demand Policies and Labour-
Market Reform". Swedish Economic Policy Review 5: 353-382.
26

Bloom, D.E., D.Canning and J.Sevilla (2003), The Demographic Dividend: a new
perspective on the economic consequences of population change, RAND.
Buti, M., A.Turrini, P.van den Noord and P.Biroli (2008), "Defying the Juncker
Curse: Can Reformist Governments Be Re-Elected?" European Economy
Economic Papers 324.
Canudas-Romo, V. (2008), "The Modal Age at Death and the Shifting Mortality
Hypothesis", Demographic Research 19(30): 1179-1204.
Canudas-Romo, V. and M.Engelman (2009), "Maximum life expectancies: Re-
visiting the best practice trends", Genus 65(1): 59-79.
Conway, P. and G.Nicoletti (2006), "Product Market Regulation in the Non-
Manufacturing Sectors of OECD Countries: Measurement and Highlights",
OECD Economics Department Working Paper No. 530.
Duval, R. and J.Elmeskov (2005), "The E¤ects of EMU on Structural Reforms
in Labour and Product Markets", OECD Economics Department Working
Papers No. 438.
Eggertsson, G., A.Ferrero and A.Ra¤o (2014), "Can structural reforms help Eu-
rope?", Journal of Monetary Economics 61: 2-22.
Galasso, V. (2006), The Political Future of Social Security in Aging Societies,
The MIT Press.
Galasso, V. (2014), "The role of political partisanship during economic crises",
Public Choice 158: 143-165.
27
Gali, J. and T.Monacelli (2014), "Understanding the Gains fromWage Flexibility:
the Exchange Rate Connection", available at www.igier.unibocconi.it/monacelli.
Giacometti R., M.Bertocchi, S.T.Rachev and F.J.Fabbozzi (2010), "A compari-
son of the Lee-Carter model and AR-ARCH model for forecasting mortality
rates", Working Paper.
Girosi, F. and G.King (2007), "Understanding the Lee-Carter mortality forecast-
ing method", Working paper.
Hansen, A.H. (1939), "Economic Progress and Declining Population Growth",
American Economic Review 29: 1-15.
Høj J., V.Galasso, G.Nicoletti and T.Dang (2006), "The Political Economy of
Structural Reform: Empirical Evidence from OECD Countries", OECD Eco-
nomics Department Working Papers No. 501.
IMF (2004), "Fostering Structural Reforms in Industrial Countries", chapter III
of World Economic Outlook: Advancing Structural Reforms, International
Monetary Fund, Washington DC.
IMF (2012), "The Financial Impact of Longevity Risk", Ch.4 in IMF Global
Financial Stability Report, April, 1-31.
Kotliko¤, L.J. (1993), Generational Accounting, The Free Press, New York.
Kotliko¤, L.J. and S.Burns (2004), The Coming Generational Storm, MIT Press.
Lee, R.D. and R.L.Carter (1992), "Modeling and Forecasting U.S. Mortality",
Journal of the American Statistical Association 87: 659-671.
28

Nicoletti, G. and S.Scarpetta (2003), "Regulation, Productivity and Growth:
OECD Evidence", Economic Policy 18, No. 36.
Obstfeld, M. (1997), "Europe�s Gamble", Brookings Papers on Economic Activ-
ity, The Brookings Institution, Washington DC.
OECD (2006), OECD Employment Outlook 2006, OECD, Paris.
Ouellette, N. (2009), "Changes in age-at-death distribution in low mortality coun-
tries: a nonparametric approach", presented at the XXVI International Pop-
ulation Conference of the International Union for the Scienti�c Study of
Population.
Ouellette, N. (2011), "Smoothing mortality data and summarizing recent trends
at older ages in low mortality countries", presented at the Institut Louis
Bachelier Conference: Longevity Modeling an Interdisciplinary Approach.
Robine, J., J.P.Michel and S.Institut (2008), "Has there been a compression of
morbidity in countries with low mortality?", Prevention of Functional De-
pendency: 139-148.
Saint-Paul, G. and S.Bentolila (2000), "Will EMU Increase Eurosclerosis?", CEPR
Discussion Paper No. 2423.
Scruggs, L., D.Jahn and K.Kuitto (2014), "Comparative Welfare Entitlement
Dataset 2, Version 2014-03. Codebook", available at http://cwed2.org/.
Teulings, C. and R.Baldwin (2014), "Secular Stagnation: Facts, Causes and
Cures", CEPR PREss, A Voxeu.org ebook.
29
Figures and Tables
Figure 2.1: Expected residual life at 65
30

Figure 2.2: Frequencies of death from 65 onwards
31
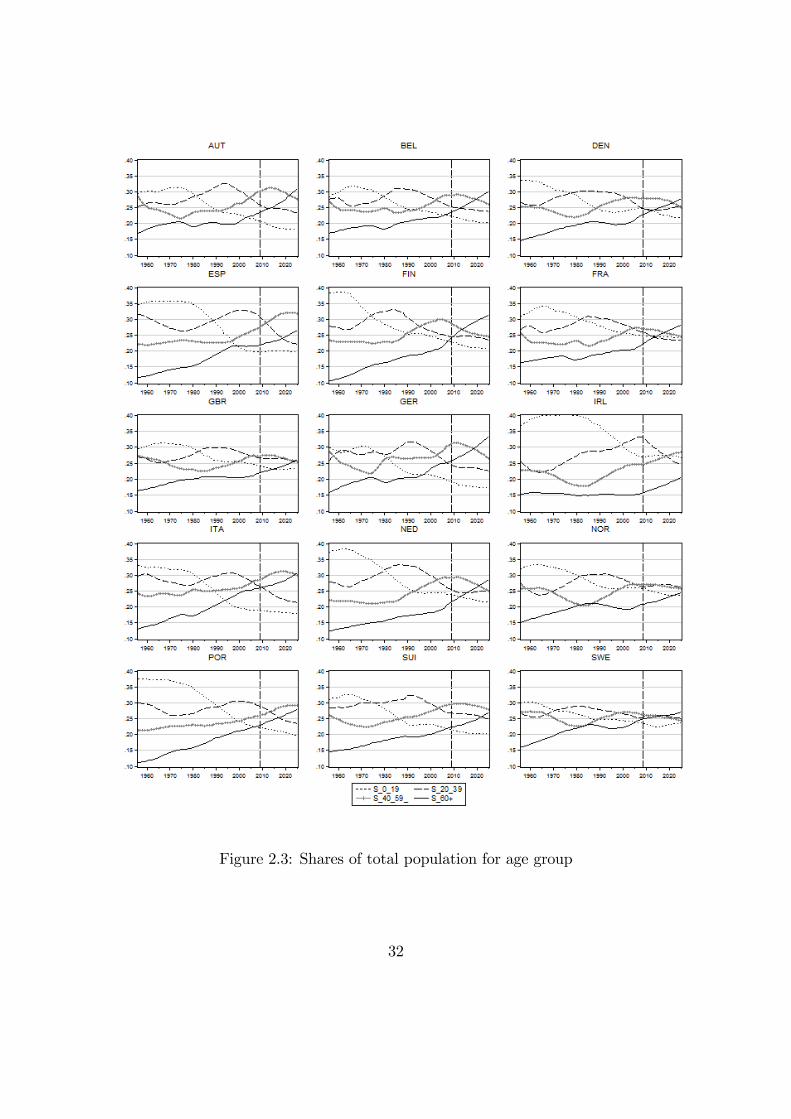
Figure 2.3: Shares of total population for age group
32

Figure 2.4: Demographic-based projections for log per capita output
33

Figure 2.5: Demographic-based projections for real long-term (10 year) rates
34

Figure 2.6: Demographic-based projections for real long-term (10 year) rates
based on world (US, Europe, Japan and China) shares
35

Figure 2.7: Convergence in product market regulation
Figure 2.8: Labor market reforms
36

37

38

39

40
41
42
43
44

45

Appendix A: Data Sources
Series for Expenditure-side Real GDP at Chained PPP (Millions of 2005 US$)
and Total Population (Millions) were downloaded from the Penn World Table 8
database; . Data for Long-Term Nominal Interest Rates, Nominal and Real GDP
(OECD base year i.e. 2005) in national currencies were downloaded from the
databases in OECD Statistics. Data on GDP from OECD were used to compute
the GDP de�ator. Series for population�s age structure were obtained by combining
databases from the UN Population Division and the US Census Bureau. Data on
mortality were downloaded from The Human Mortality Database.
46

Appendix B: Identi�cation and Estimation of the Lee-Carter
Model
The Lee-Carter (1992) model consists of a system of equations for logarithms of
mortality rates for age cohort x at time t; ln[mx;t]; and a time-series equation for
an unobservable time-varying mortality index kt:
ln (mx;t) = ax + bxkt + �x;t (3)
kt= c0 + c1kt�1 + et
�x;tsNID�0; �2�
�etsMeanZero - Stationary Process
where ax and bx are age-speci�c constants. The error term �x;t captures cross-
sectional errors in the model based prediction for mortality of di¤erent cohorts,
while the error term et captures random �uctuations in the time series of the
common factor kt driving mortality at all ages. Identi�cation of the parameters
of interest is achieved by imposing the restrictionsP
t kt = 0 andP
x bx = 1;
so that the unobserved mortality index kt is estimated through Singular Value
Decomposition (SVD). SVD is a technique based on a theorem of linear algebra
stating that a (m�n) rectangular matrixM can be broken down into the product
of three matrices - an (m �m) orthogonal matrix U , a diagonal (m � n) matrix
S, and the transpose of an orthogonal (n� n) matrix V . The SVD of the matrix
M will be therefore be given by M = USV 0 where U 0U = I and V 0V = I.
The columns of U are orthonormal eigenvectors of AA0 , the columns of V are
47
orthonormal eigenvectors of A0A, and S is a diagonal matrix whose elements are
the square roots of eigenvalues from U or V in descending order. The restrictionPt kt = 0 implies that ax is the average across time of ln (mx;t), and Equation 3
can be rewritten in terms of the mean-centered log-mortality rate as
mx;t �mx;t � ~mx;t = bxkt + �x;t: (4)
Grouping all the ~mx;t in a unique (X�T )matrix ~m (where the columns are mortal-
ity rates at time-t ordered by age groups and the rows are mortality rates through
time for a speci�c age-group x), leads naturally to use SVD to obtain estimates of
bx and kt. In particular, if ~m can be decomposed as ~m = USV 0, b = [b0; b1; : : : ; bX ]
is represented by the normalized �rst column of U, u1 = [u0;1; u1;1; : : : ; uX;1], so
that
b =u1PX
x=0 ux;1:
On the other hand the mortality index vector k = [k1; k2; : : : ; kT ] is given by
k = �1(XXx=0
ux;1)�1
where �1 = [�1;1; �1;2; : : : ; �1;T ]0 is the �rst column of the V matrix and �1 is
the highest eigenvalue of the matrix S (see Girosi and King, 2007, Giacometti et
al., 2010) where �1 = [�1;1; �1;2; : : : ; �1;T ]0 is the �rst column of the V matrix and
�1 is the highest eigenvalue of the matrix S.
48