Embed Size (px)
Citation preview
Bequest Donors:
Demographics and Motivations of
Potential and Actual Donors
A Report Prepared for
March 2007
Researched and written at
by the Campbell & Company Research Fellow
Emily Krauser March 1, 2007
2
Acknowledgements
This research is made possible through the Campbell and Company Research
Fellowship at the Center on Philanthropy. Thank you to Campbell and Company for
funding research to support the mission of the Center on Philanthropy to increase the
understanding of Philanthropy.
My most sincere appreciation goes to those who have made comments on this
report: Melissa Brown, Patrick Rooney, Heidi Fredrick, Christine Weisenbach, and Joyce
Krauser. However, I am solely responsible for any errors or omissions. Thank you to
each individual who has contributed to this research.
3
Table of Contents
Executive Summary ........................................................................4
Introduction ...................................................................................11
Overview .......................................................................................11
Data Sources .................................................................................14
Method ..........................................................................................16
Results ...........................................................................................18
- Differences in giving: Those with and
without charities in a will 18
- Age 20
- Education 25
- Motivation 29
- Income 32
Archetypes ....................................................................................34
Conclusion .....................................................................................36
Discussion .................................................................................... 38
Appendices ....................................................................................40
References .....................................................................................42
4
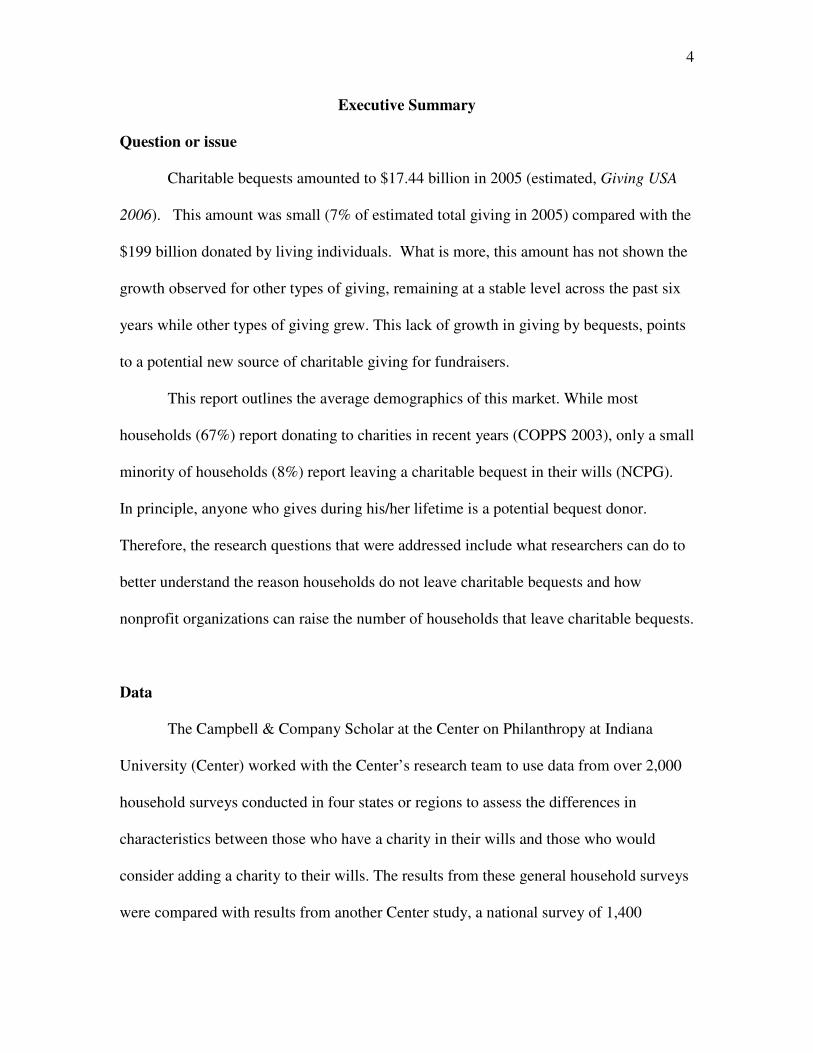
Executive Summary
Question or issue
Charitable bequests amounted to $17.44 billion in 2005 (estimated, Giving USA
2006). This amount was small (7% of estimated total giving in 2005) compared with the
$199 billion donated by living individuals. What is more, this amount has not shown the
growth observed for other types of giving, remaining at a stable level across the past six
years while other types of giving grew. This lack of growth in giving by bequests, points
to a potential new source of charitable giving for fundraisers.
This report outlines the average demographics of this market. While most
households (67%) report donating to charities in recent years (COPPS 2003), only a small
minority of households (8%) report leaving a charitable bequest in their wills (NCPG).
In principle, anyone who gives during his/her lifetime is a potential bequest donor.
Therefore, the research questions that were addressed include what researchers can do to
better understand the reason households do not leave charitable bequests and how
nonprofit organizations can raise the number of households that leave charitable bequests.
Data
The Campbell & Company Scholar at the Center on Philanthropy at Indiana
University (Center) worked with the Center’s research team to use data from over 2,000
household surveys conducted in four states or regions to assess the differences in
characteristics between those who have a charity in their wills and those who would
consider adding a charity to their wills. The results from these general household surveys
were compared with results from another Center study, a national survey of 1,400
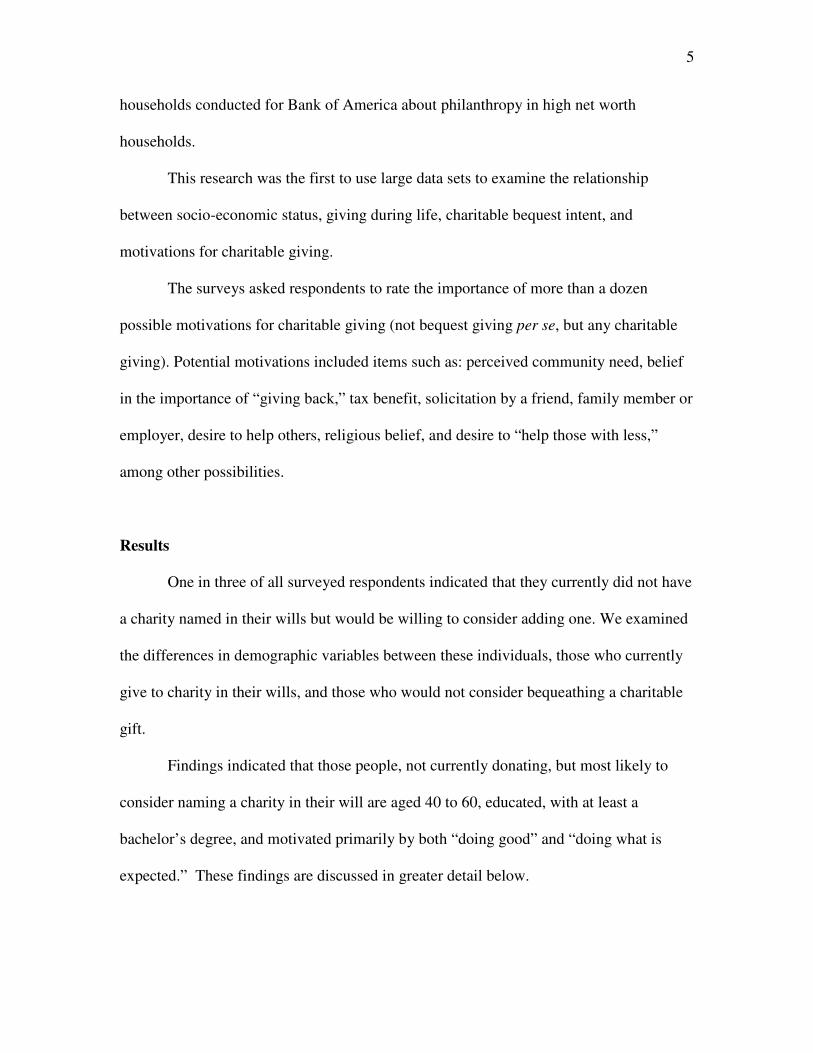
5
households conducted for Bank of America about philanthropy in high net worth
households.
This research was the first to use large data sets to examine the relationship
between socio-economic status, giving during life, charitable bequest intent, and
motivations for charitable giving.
The surveys asked respondents to rate the importance of more than a dozen
possible motivations for charitable giving (not bequest giving per se, but any charitable
giving). Potential motivations included items such as: perceived community need, belief
in the importance of “giving back,” tax benefit, solicitation by a friend, family member or
employer, desire to help others, religious belief, and desire to “help those with less,”
among other possibilities.
Results
One in three of all surveyed respondents indicated that they currently did not have
a charity named in their wills but would be willing to consider adding one. We examined
the differences in demographic variables between these individuals, those who currently
give to charity in their wills, and those who would not consider bequeathing a charitable
gift.
Findings indicated that those people, not currently donating, but most likely to
consider naming a charity in their will are aged 40 to 60, educated, with at least a
bachelor’s degree, and motivated primarily by both “doing good” and “doing what is
expected.” These findings are discussed in greater detail below.
6
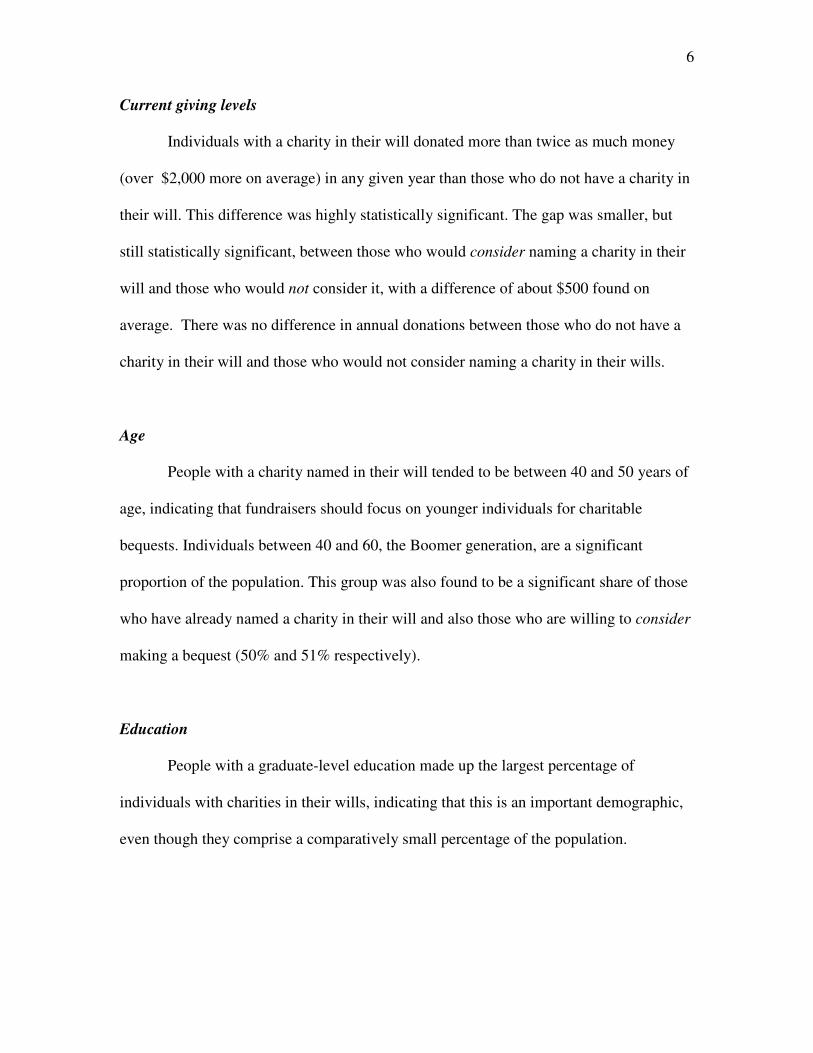
Current giving levels
Individuals with a charity in their will donated more than twice as much money
(over $2,000 more on average) in any given year than those who do not have a charity in
their will. This difference was highly statistically significant. The gap was smaller, but
still statistically significant, between those who would consider naming a charity in their
will and those who would not consider it, with a difference of about $500 found on
average. There was no difference in annual donations between those who do not have a
charity in their will and those who would not consider naming a charity in their wills.
Age
People with a charity named in their will tended to be between 40 and 50 years of
age, indicating that fundraisers should focus on younger individuals for charitable
bequests. Individuals between 40 and 60, the Boomer generation, are a significant
proportion of the population. This group was also found to be a significant share of those
who have already named a charity in their will and also those who are willing to consider
making a bequest (50% and 51% respectively).
Education
People with a graduate-level education made up the largest percentage of
individuals with charities in their wills, indicating that this is an important demographic,
even though they comprise a comparatively small percentage of the population.
7
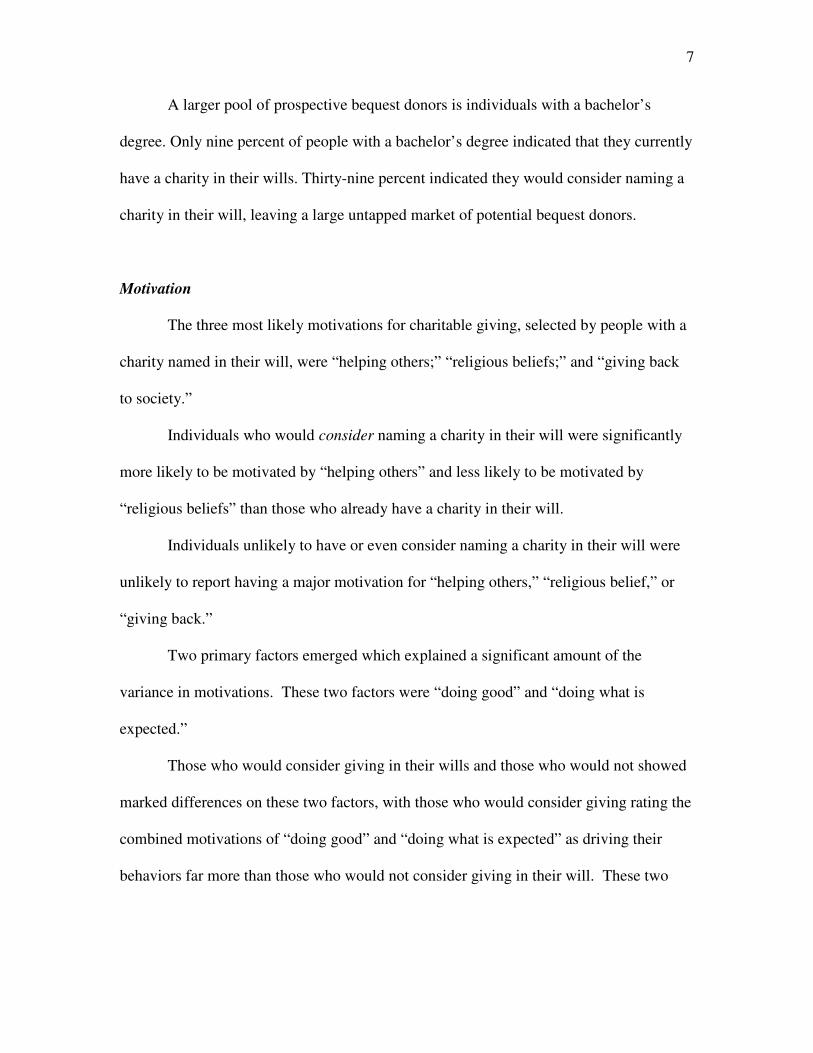
A larger pool of prospective bequest donors is individuals with a bachelor’s
degree. Only nine percent of people with a bachelor’s degree indicated that they currently
have a charity in their wills. Thirty-nine percent indicated they would consider naming a
charity in their will, leaving a large untapped market of potential bequest donors.
Motivation
The three most likely motivations for charitable giving, selected by people with a
charity named in their will, were “helping others;” “religious beliefs;” and “giving back
to society.”
Individuals who would consider naming a charity in their will were significantly
more likely to be motivated by “helping others” and less likely to be motivated by
“religious beliefs” than those who already have a charity in their will.
Individuals unlikely to have or even consider naming a charity in their will were
unlikely to report having a major motivation for “helping others,” “religious belief,” or
“giving back.”
Two primary factors emerged which explained a significant amount of the
variance in motivations. These two factors were “doing good” and “doing what is
expected.”
Those who would consider giving in their wills and those who would not showed
marked differences on these two factors, with those who would consider giving rating the
combined motivations of “doing good” and “doing what is expected” as driving their
behaviors far more than those who would not consider giving in their will. These two

8
motivations were found to occur together for individuals who would consider naming a
charity in their will.
Income
Income was not found to affect the likelihood that a donor would bequest, or
consider the bequest of a charitable gift in his/her will. This finding indicates that
fundraisers should not focus only on those with high incomes, regardless of income,
fundraisers have between a one-in-three and one-in-four chance of speaking with an
individual who would consider giving to a charity in a will.
Synthesis of donor characteristics and motivating factors into “archetypes”
Relationships between socioeconomic status, motivation, and bequest intention
may be better described by archetypes, or models, of individuals in different income and
age ranges. We have identified three primary archetypes with different likelihoods of
leaving a charitable bequest. Archetypes include: “community core,” “climber,” and
“retiree.”
Community Core
The community core consisted of individuals between 40 and 60 years of age who
were employed and had a household income between $50,000 and $75,000. People in this
group were among the most likely prospects for planned gift opportunities. This group’s
age range and endorsed motivations of “doing good” and “doing what is expected”
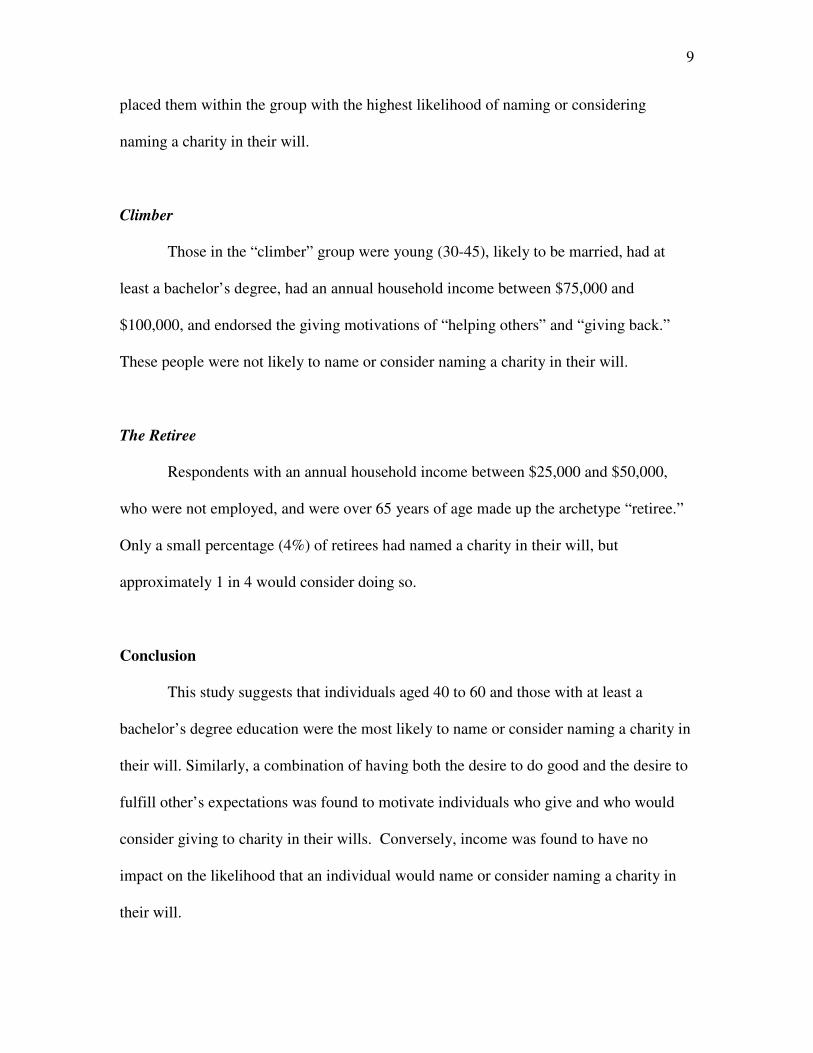
9
placed them within the group with the highest likelihood of naming or considering
naming a charity in their will.
Climber
Those in the “climber” group were young (30-45), likely to be married, had at
least a bachelor’s degree, had an annual household income between $75,000 and
$100,000, and endorsed the giving motivations of “helping others” and “giving back.”
These people were not likely to name or consider naming a charity in their will.
The Retiree
Respondents with an annual household income between $25,000 and $50,000,
who were not employed, and were over 65 years of age made up the archetype “retiree.”
Only a small percentage (4%) of retirees had named a charity in their will, but
approximately 1 in 4 would consider doing so.
Conclusion
This study suggests that individuals aged 40 to 60 and those with at least a
bachelor’s degree education were the most likely to name or consider naming a charity in
their will. Similarly, a combination of having both the desire to do good and the desire to
fulfill other’s expectations was found to motivate individuals who give and who would
consider giving to charity in their wills. Conversely, income was found to have no
impact on the likelihood that an individual would name or consider naming a charity in
their will.

10
In sum, to increase the number of wills that include charities, the nonprofit sector
must cultivate younger donors (ages 40 – 60), and focus on individuals who are educated
and motivated by both a desire to do good and a desire to meet others expectations. A
large number (approximately 1 in 3) of surveyed respondents indicated a willingness to
consider naming a charity in their wills. It is up to fundraisers from all types of
nonprofits to turn that donor’s consideration into action. Because of the labor-intensive
nature of fund raising, asking the correct people for planned gifts is important. These
results provide insight on whom to approach in order to more effectively accomplish the
goal of increasing the number of charitable bequests.
For more information contact Campbell & Company at 877-957-000 toll-free, email
[email protected] or visit www.campbellcompany.com.
11
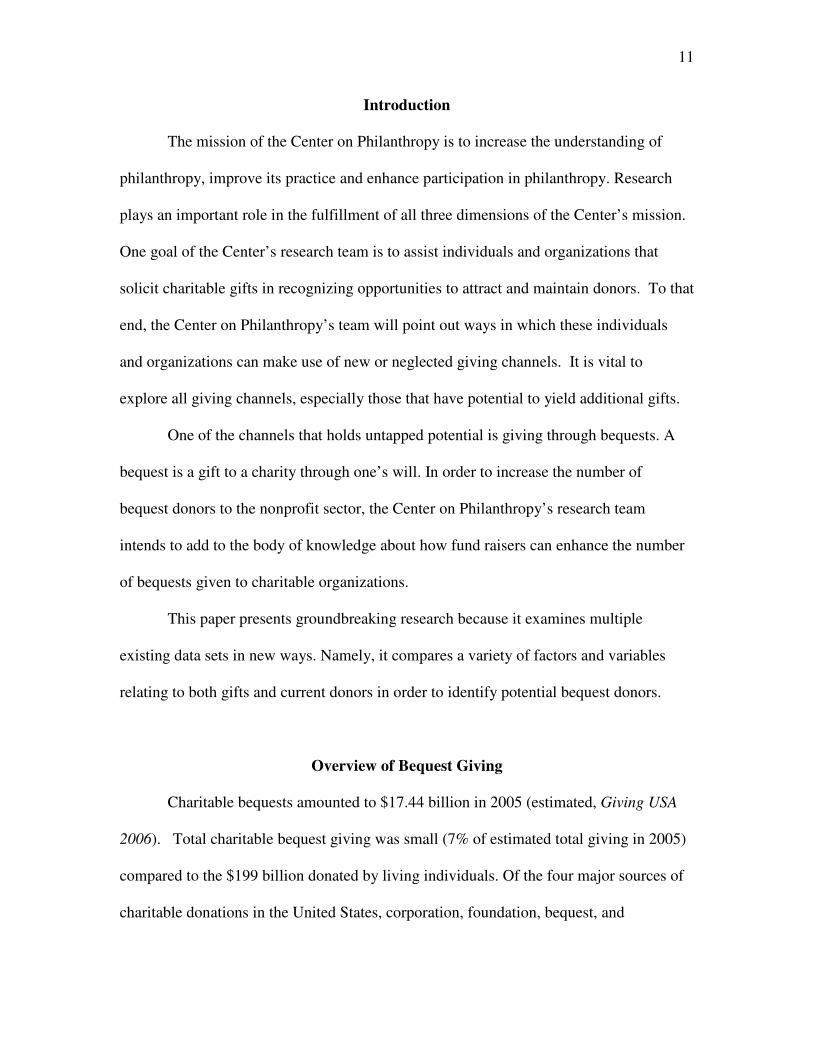
Introduction
The mission of the Center on Philanthropy is to increase the understanding of
philanthropy, improve its practice and enhance participation in philanthropy. Research
plays an important role in the fulfillment of all three dimensions of the Center’s mission.
One goal of the Center’s research team is to assist individuals and organizations that
solicit charitable gifts in recognizing opportunities to attract and maintain donors. To that
end, the Center on Philanthropy’s team will point out ways in which these individuals
and organizations can make use of new or neglected giving channels. It is vital to
explore all giving channels, especially those that have potential to yield additional gifts.
One of the channels that holds untapped potential is giving through bequests. A
bequest is a gift to a charity through one’s will. In order to increase the number of
bequest donors to the nonprofit sector, the Center on Philanthropy’s research team
intends to add to the body of knowledge about how fund raisers can enhance the number
of bequests given to charitable organizations.
This paper presents groundbreaking research because it examines multiple
existing data sets in new ways. Namely, it compares a variety of factors and variables
relating to both gifts and current donors in order to identify potential bequest donors.
Overview of Bequest Giving
Charitable bequests amounted to $17.44 billion in 2005 (estimated, Giving USA
2006). Total charitable bequest giving was small (7% of estimated total giving in 2005)
compared to the $199 billion donated by living individuals. Of the four major sources of
charitable donations in the United States, corporation, foundation, bequest, and
12
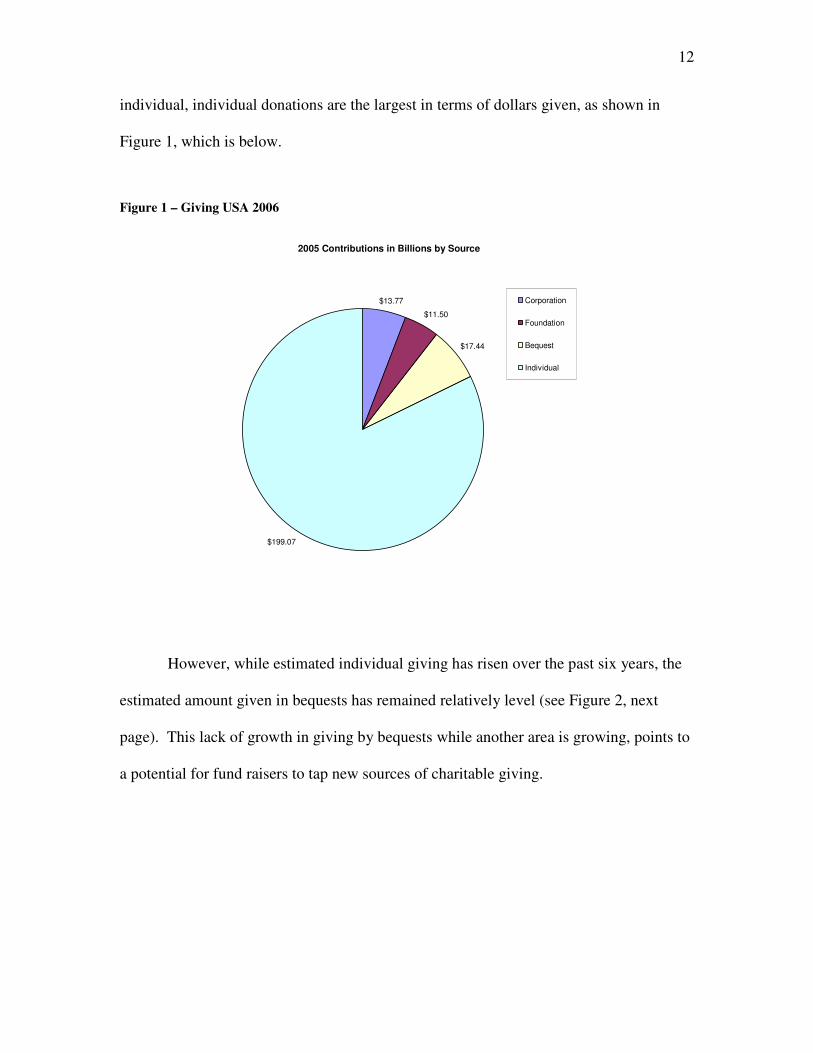
individual, individual donations are the largest in terms of dollars given, as shown in
Figure 1, which is below.
Figure 1 – Giving USA 2006
2005 Contributions in Billions by Source
$13.77
$11.50
$17.44
$199.07
Corporation
Foundation
Bequest
Individual
However, while estimated individual giving has risen over the past six years, the
estimated amount given in bequests has remained relatively level (see Figure 2, next
page). This lack of growth in giving by bequests while another area is growing, points to
a potential for fund raisers to tap new sources of charitable giving.
13
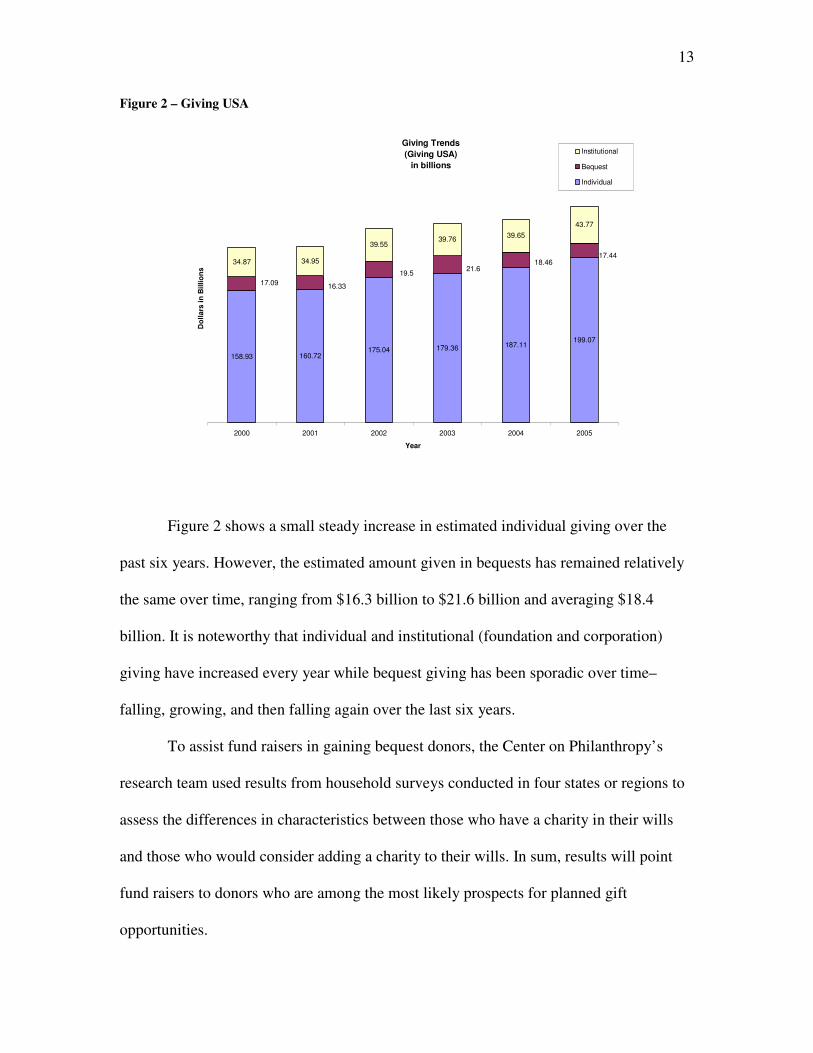
Figure 2 – Giving USA
Giving Trends
(Giving USA)
in billions
158.93 160.72175.04 179.36 187.11
199.07
34.87 34.95
39.5539.76
39.65
43.77
17.4418.46
21.619.5
17.09 16.33
2000 2001 2002 2003 2004 2005
Year
Do
llars
in
Bil
lio
ns
Institutional
Bequest
Individual
Figure 2 shows a small steady increase in estimated individual giving over the
past six years. However, the estimated amount given in bequests has remained relatively
the same over time, ranging from $16.3 billion to $21.6 billion and averaging $18.4
billion. It is noteworthy that individual and institutional (foundation and corporation)
giving have increased every year while bequest giving has been sporadic over time–
falling, growing, and then falling again over the last six years.
To assist fund raisers in gaining bequest donors, the Center on Philanthropy’s
research team used results from household surveys conducted in four states or regions to
assess the differences in characteristics between those who have a charity in their wills
and those who would consider adding a charity to their wills. In sum, results will point
fund raisers to donors who are among the most likely prospects for planned gift
opportunities.
14
In principle, anyone who gives during his/her lifetime is a potential bequest
donor. However, a large gap exists between the percentage of individuals who donate to
charity in any given year and the percentage of those who have a charity in their will. In
household surveys conducted by the Center on Philanthropy, 67% of respondents donate
to a charity in any given year (Center on Philanthropy Panel Study, 2003). However, the
National Committee on Planned Giving (NCPG) estimates that only 8% of individuals
report having a charity named in their will (Giving USA 2006). Based on the NCPG
estimate that 50% of people have wills, individuals with a charity in their will amount to
16% of those with wills.
Data Sources
This research is the first to use two large data sets, a combined file of household
surveys and the Bank of America Study of High Net-Worth Philanthropy, to examine the
relationship between socio-economic status, charitable bequest intent, and motivations
for giving.
The combined file has 2,279 respondents (n) from household giving surveys
conducted in New Hampshire (giving in 2003, n = 531), Indiana (giving in 2003, n =
736), Memphis (giving in 2002, n = 511), and St. Louis (giving in 2002, n = 501) by the
Center on Philanthropy at Indiana University. The giving surveys were done by
telephone, and each used a random sample of households in the specified region.
Responses to the Giving in Illinois study were not used in this combined set due to the
omission of a question regarding age as well as differences in question wording.
15
The other data set used is the Bank of America Study on High Net-Worth
Philanthropy (n=1,145) which asked about giving in 2005. This mail survey randomly
sampled from neighborhoods where households investable net worth was $3 million or
more and included respondents with an annual household income over $200,000 and/or a
net worth over $1 million.
The combined file is used to provide information about charitable bequest intent,
and the High Net-Worth Study was used to add additional insight into certain results
found in the combined data set. Both of these studies included one or more of the
following questions about bequest giving:
• Do you have a will?
• Do you have a charity named in your will? or Have you made provisions for
charity in your will? and
• Would you consider naming a charity in your will? (Respondents in New
Hampshire were not asked this question.)
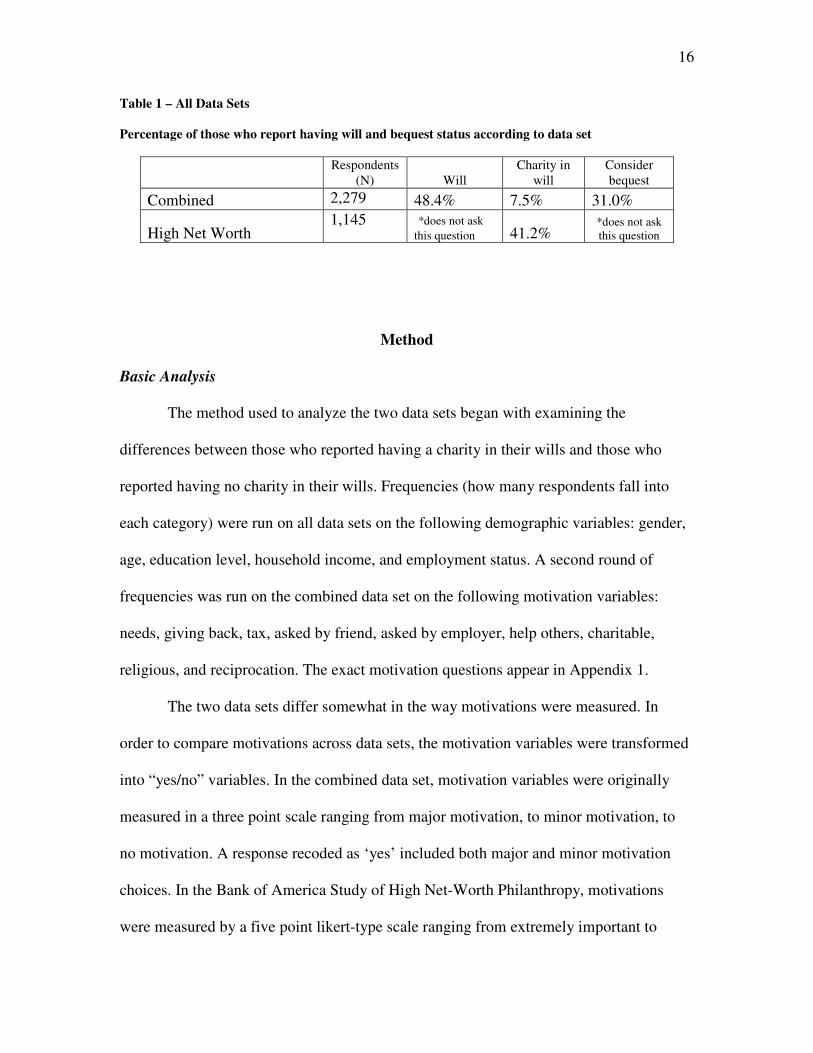
The data used for this analysis allow for many different types of analysis. Table 1
(next page) provides a summary of some of descriptive statistics in these data sets. The
combined data set allows exploration of the relationships between those who have or
would consider a charity in their wills, socioeconomic status, and motivations for giving.
On the other hand, data from the High Net-Worth Study allows us to test findings about
individuals with a charity named in their wills as well as to explore underlying
motivational factors for giving.
16
Table 1 – All Data Sets
Percentage of those who report having will and bequest status according to data set
Respondents
(N) Will Charity in
will Consider bequest
Combined 2,279 48.4% 7.5% 31.0%
High Net Worth 1,145 *does not ask
this question 41.2% *does not ask this question
Method
Basic Analysis
The method used to analyze the two data sets began with examining the
differences between those who reported having a charity in their wills and those who
reported having no charity in their wills. Frequencies (how many respondents fall into
each category) were run on all data sets on the following demographic variables: gender,
age, education level, household income, and employment status. A second round of
frequencies was run on the combined data set on the following motivation variables:
needs, giving back, tax, asked by friend, asked by employer, help others, charitable,
religious, and reciprocation. The exact motivation questions appear in Appendix 1.
The two data sets differ somewhat in the way motivations were measured. In
order to compare motivations across data sets, the motivation variables were transformed
into “yes/no” variables. In the combined data set, motivation variables were originally
measured in a three point scale ranging from major motivation, to minor motivation, to
no motivation. A response recoded as ‘yes’ included both major and minor motivation
choices. In the Bank of America Study of High Net-Worth Philanthropy, motivations
were measured by a five point likert-type scale ranging from extremely important to
17
extremely unimportant. A response recoded as ‘yes’ included the choices “extremely
important” and “somewhat important,” but not the unimportant choices.
After frequencies and descriptive statistics were run on all data sets, the research
team searched for:
1. General information on those who report giving to charity via bequest;
2. Demographic information that is inconsistent with theory or past findings;
3. Differences between those who have a charity named in their will and those
who do not;
4. Differences between those who have a charity named in their will and those
who don’t, but would consider adding one; and
5. Differences between those who consider naming a charity in their will and
those who do not.
Cross tabulation
Follow-up analyses were then run on results from each of the five categories
above. One type of follow-up analysis used is a cross tabulation, which shows
interactions between two variables. For instance, a cross tabulation was run on education
level and income level to assess the difference in frequency of respondents who fell into
each category. Then, findings from the Bank of America Study of High Net-Worth
Philanthropy were used to supplement findings from our main data set.
Factor Analysis
Information from the High Net-Worth Study was used to identify clusters of
motivations of those who give by bequest. Factor analysis is the method used to find
archetypes in the High Net-Worth study (forthcoming from Bank of America).
18
Archetypes, or motivation clusters, were then tested in the combined data file to assure
that they held true in a different type of donor sample. This analysis provides evidence of
two underlying motivation constructs, “others expectations” and a desire to “do good.”
The clusters of motivation questions that make up each factor appear in Appendix 2.
For readers knowledgeable about factor analysis, coefficient alpha was used to
assess the internal reliability of the constructs created from the results of the exploratory
factor analyses. Factors were calculated to include any response of major or minor
motivation on all questions that load on the factor. In exploratory research in the social
sciences, coefficient alpha levels (α) over .6 are considered “adequate” and over .8 are
considered “good” (NCSU website). Analyses on the Study of High Net-Worth
Philanthropy’s factors revealed high alpha levels: “expectations” (α=.64) and “doing
good” (α=.74).
Results
Differences in giving: Those with and without charities in a will
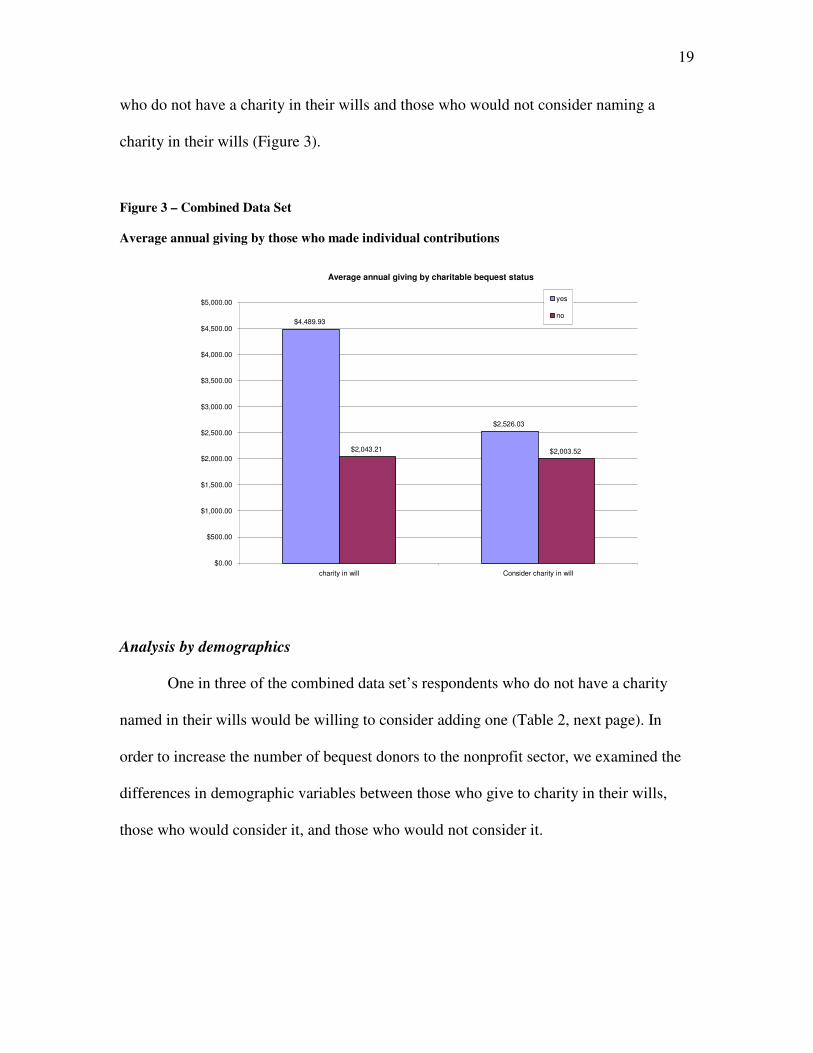
Respondents in the combined data set were 40% male and 60% female. One
hundred and fifty of the respondents report having a charity named in their wills (7.5%).
Individuals with a charity in their will gave significantly more in any given year ($4,490)
than those who do not have a charity in their wills ($2,043). This difference is statistically
significant with p < 0.001. The gap is less, but still significant (p = 0.003), between those
who consider naming a charity in their wills ($2,526) and those who would not consider
it ($2,004). It is also important to note the near equivalence ($2,043 vs. $2,004) of those
19
who do not have a charity in their wills and those who would not consider naming a
charity in their wills (Figure 3).
Figure 3 – Combined Data Set
Average annual giving by those who made individual contributions
Average annual giving by charitable bequest status
$4,489.93
$2,526.03
$2,043.21 $2,003.52
$0.00
$500.00
$1,000.00
$1,500.00
$2,000.00
$2,500.00
$3,000.00
$3,500.00
$4,000.00
$4,500.00
$5,000.00
charity in will Consider charity in will
yes
no
Analysis by demographics
One in three of the combined data set’s respondents who do not have a charity
named in their wills would be willing to consider adding one (Table 2, next page). In
order to increase the number of bequest donors to the nonprofit sector, we examined the
differences in demographic variables between those who give to charity in their wills,
those who would consider it, and those who would not consider it.
20
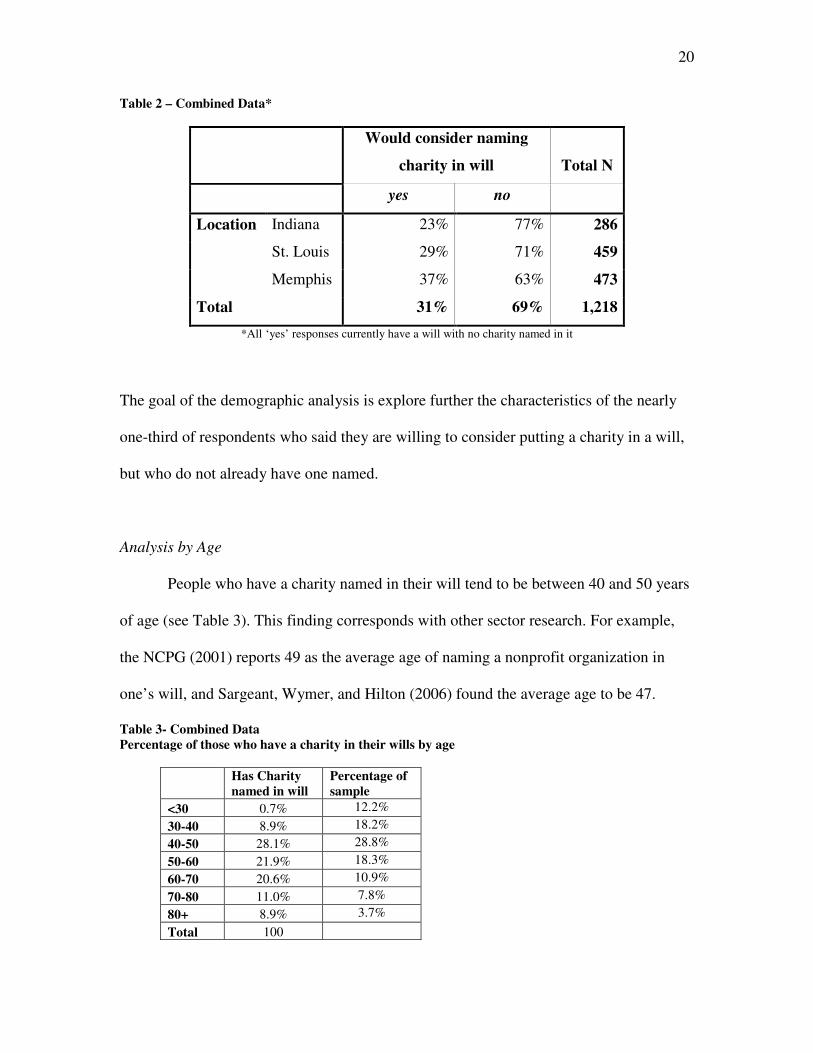
Table 2 – Combined Data*
Would consider naming
charity in will Total N
yes no
Location Indiana 23% 77% 286
St. Louis 29% 71% 459
Memphis 37% 63% 473
Total 31% 69% 1,218
*All ‘yes’ responses currently have a will with no charity named in it
The goal of the demographic analysis is explore further the characteristics of the nearly
one-third of respondents who said they are willing to consider putting a charity in a will,
but who do not already have one named.
Analysis by Age
People who have a charity named in their will tend to be between 40 and 50 years
of age (see Table 3). This finding corresponds with other sector research. For example,
the NCPG (2001) reports 49 as the average age of naming a nonprofit organization in
one’s will, and Sargeant, Wymer, and Hilton (2006) found the average age to be 47.
Table 3- Combined Data Percentage of those who have a charity in their wills by age
Has Charity named in will
Percentage of sample
<30 0.7% 12.2%
30-40 8.9% 18.2%
40-50 28.1% 28.8%
50-60 21.9% 18.3%
60-70 20.6% 10.9%
70-80 11.0% 7.8%
80+ 8.9% 3.7%
Total 100
21
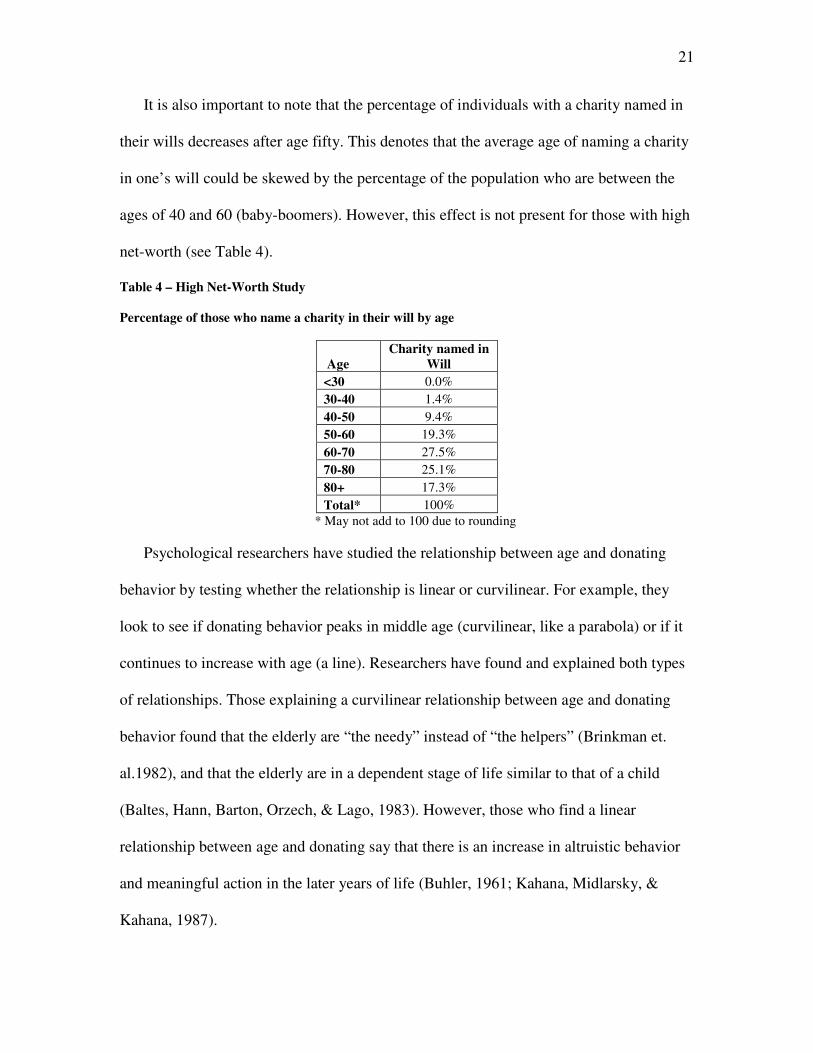
It is also important to note that the percentage of individuals with a charity named in
their wills decreases after age fifty. This denotes that the average age of naming a charity
in one’s will could be skewed by the percentage of the population who are between the
ages of 40 and 60 (baby-boomers). However, this effect is not present for those with high
net-worth (see Table 4).
Table 4 – High Net-Worth Study
Percentage of those who name a charity in their will by age
Age Charity named in
Will
<30 0.0%
30-40 1.4%
40-50 9.4%
50-60 19.3%
60-70 27.5%
70-80 25.1%
80+ 17.3%
Total* 100%
* May not add to 100 due to rounding
Psychological researchers have studied the relationship between age and donating
behavior by testing whether the relationship is linear or curvilinear. For example, they
look to see if donating behavior peaks in middle age (curvilinear, like a parabola) or if it
continues to increase with age (a line). Researchers have found and explained both types
of relationships. Those explaining a curvilinear relationship between age and donating
behavior found that the elderly are “the needy” instead of “the helpers” (Brinkman et.
al.1982), and that the elderly are in a dependent stage of life similar to that of a child
(Baltes, Hann, Barton, Orzech, & Lago, 1983). However, those who find a linear
relationship between age and donating say that there is an increase in altruistic behavior
and meaningful action in the later years of life (Buhler, 1961; Kahana, Midlarsky, &
Kahana, 1987).

22
Naming a charity in one’s will is a specific type of helping, or donating, behavior.
Bequests can include both monetary and physical donations. Similar to our study’s
findings that the percentage of individuals who have a charity in their wills peaks
between the ages of 40 and 60, a 1989 study by Midlarsky and Hannah found a
curvilinear relationship between age and monetary donations. The study also found a
linear relationship between age and non-monetary donations, suggesting that the elderly
are more likely to give, but do not always have the liquid resources to do so.
In the High Net-Worth Study, where those who are older have the means to make
a charitable bequest, individuals reporting a bequest intent are likely to be older than
those in the combined file, which uses responses from a random sample of households
across income ranges. The average age of the high net-worth study exceeded that of the
combined file. Fund raisers should note that individuals in the general population who
have a charity in their will are likely between 40 and 50 years of age while those in high
net-worth households are likely to be older than 50, at least in part because people with
high net-worth tend to have had more time to accumulate their wealth.
23
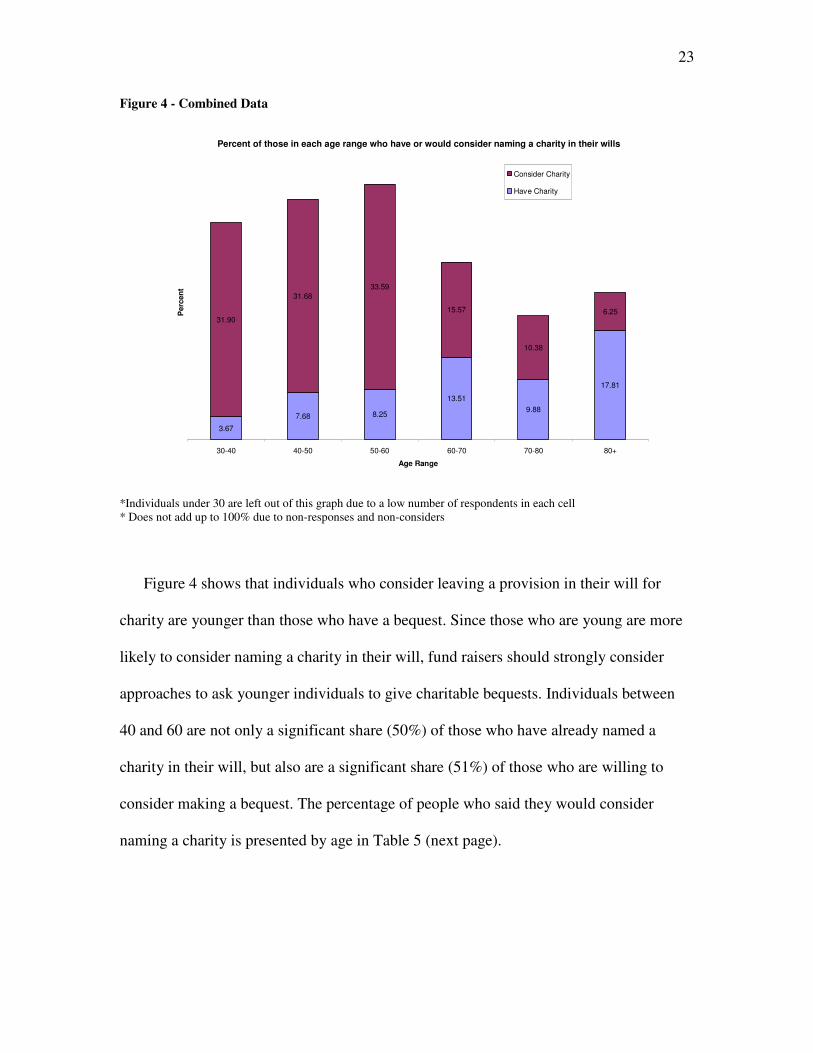
Figure 4 - Combined Data
Percent of those in each age range who have or would consider naming a charity in their wills
3.67
7.68 8.25
13.51
9.88
17.81
31.90
31.68
33.59
15.57
10.38
6.25
30-40 40-50 50-60 60-70 70-80 80+
Age Range
Perc
en
tConsider Charity
Have Charity
*Individuals under 30 are left out of this graph due to a low number of respondents in each cell * Does not add up to 100% due to non-responses and non-considers
Figure 4 shows that individuals who consider leaving a provision in their will for
charity are younger than those who have a bequest. Since those who are young are more
likely to consider naming a charity in their will, fund raisers should strongly consider
approaches to ask younger individuals to give charitable bequests. Individuals between
40 and 60 are not only a significant share (50%) of those who have already named a
charity in their will, but also are a significant share (51%) of those who are willing to
consider making a bequest. The percentage of people who said they would consider
naming a charity is presented by age in Table 5 (next page).
24
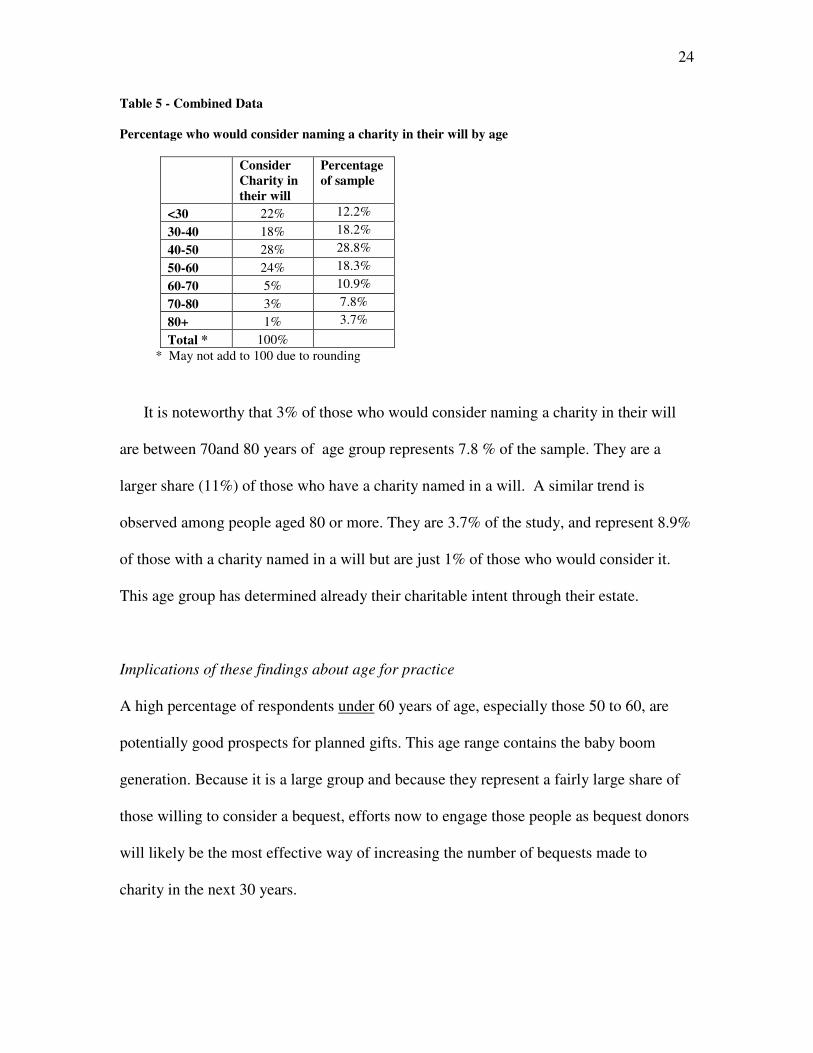
Table 5 - Combined Data
Percentage who would consider naming a charity in their will by age
Consider Charity in their will
Percentage of sample
<30 22% 12.2%
30-40 18% 18.2%
40-50 28% 28.8%
50-60 24% 18.3%
60-70 5% 10.9%
70-80 3% 7.8%
80+ 1% 3.7%
Total * 100%
* May not add to 100 due to rounding
It is noteworthy that 3% of those who would consider naming a charity in their will
are between 70and 80 years of age group represents 7.8 % of the sample. They are a
larger share (11%) of those who have a charity named in a will. A similar trend is
observed among people aged 80 or more. They are 3.7% of the study, and represent 8.9%
of those with a charity named in a will but are just 1% of those who would consider it.
This age group has determined already their charitable intent through their estate.
Implications of these findings about age for practice
A high percentage of respondents under 60 years of age, especially those 50 to 60, are
potentially good prospects for planned gifts. This age range contains the baby boom
generation. Because it is a large group and because they represent a fairly large share of
those willing to consider a bequest, efforts now to engage those people as bequest donors
will likely be the most effective way of increasing the number of bequests made to
charity in the next 30 years.

25
Analysis by Education
People with a graduate level education make up the largest percentage of
individuals with charities in their will (35%, Table 6 on page 19). Nevertheless, only 17%
of individuals with graduate level degrees have a charity named in their will (Figure 5 on
page 21). Thirty-nine percent of people with a bachelor’s degree say they would consider
naming a charity in their wills (Figure 5). Table 6 shows that this group of individuals
does to give to charity in their wills; in fact they constitute 27% of those who do.
Therefore, the best pool of prospective bequest donors is people with a bachelor’s degree.
These findings are further explained in this section.
Percentages in Tables 6 and 7 are calculated using the same method, whereas
Figure 5 is calculated differently. Table 6 is calculated based on those who have a charity
named in their wills, and Table 7 is based on those who would consider naming a charity
in their wills. Both show the group of interest by educational attainment. For example,
Table 6 shows the percentage of individuals who have a charity named in their will who
have a bachelor’s degree. Tables 6 and 7 are best compared to the survey respondents. On
the other hand, Figure 5 bases its percentages on those at each level of educational
attainment; it compares the two types of bequest intent. The percentage of those with
bachelor’s degrees who report naming a charity in their wills is shown in Figure 5.
26
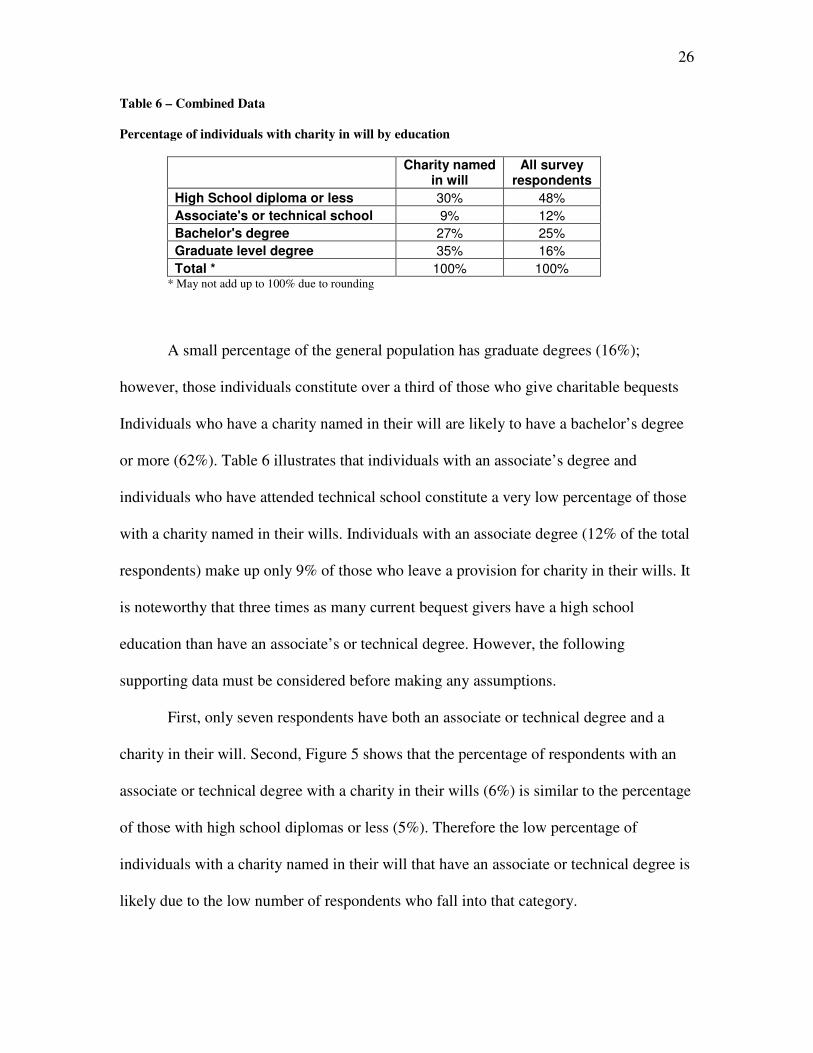
Table 6 – Combined Data
Percentage of individuals with charity in will by education
Charity named
in will All survey
respondents
High School diploma or less 30% 48%
Associate's or technical school 9% 12%
Bachelor's degree 27% 25%
Graduate level degree 35% 16%
Total * 100% 100% * May not add up to 100% due to rounding
A small percentage of the general population has graduate degrees (16%);
however, those individuals constitute over a third of those who give charitable bequests
Individuals who have a charity named in their will are likely to have a bachelor’s degree
or more (62%). Table 6 illustrates that individuals with an associate’s degree and
individuals who have attended technical school constitute a very low percentage of those
with a charity named in their wills. Individuals with an associate degree (12% of the total
respondents) make up only 9% of those who leave a provision for charity in their wills. It
is noteworthy that three times as many current bequest givers have a high school
education than have an associate’s or technical degree. However, the following
supporting data must be considered before making any assumptions.
First, only seven respondents have both an associate or technical degree and a
charity in their will. Second, Figure 5 shows that the percentage of respondents with an
associate or technical degree with a charity in their wills (6%) is similar to the percentage
of those with high school diplomas or less (5%). Therefore the low percentage of
individuals with a charity named in their will that have an associate or technical degree is
likely due to the low number of respondents who fall into that category.
27
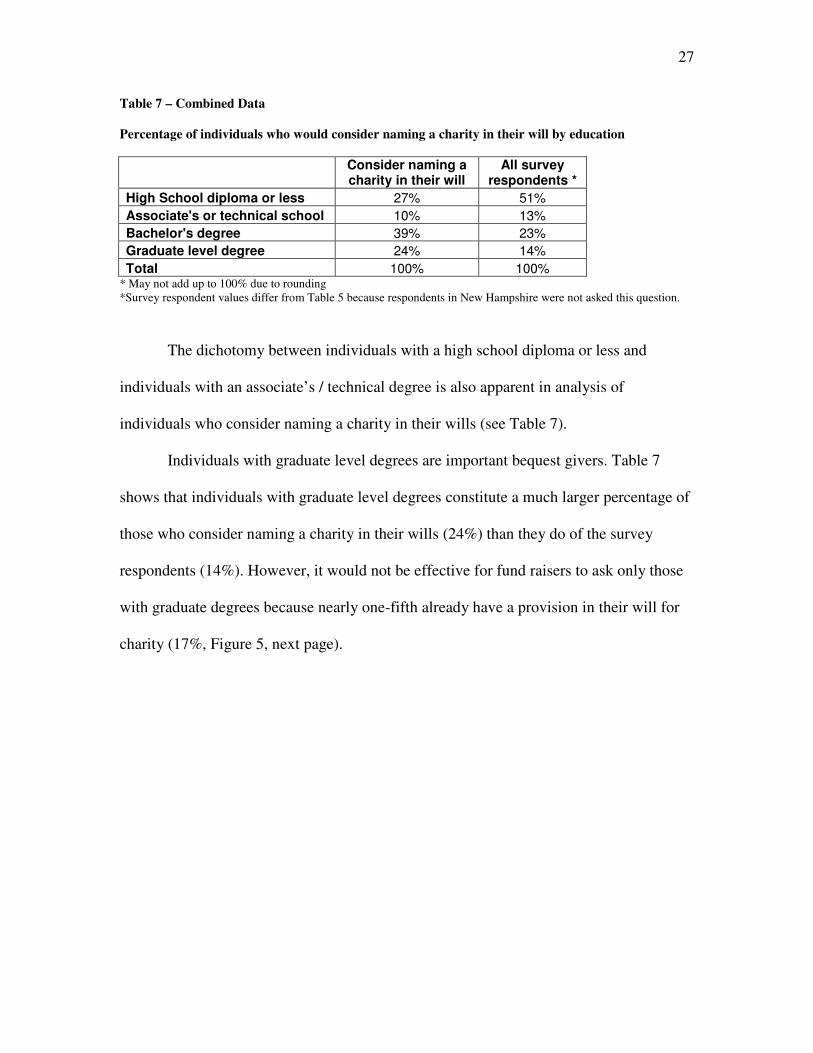
Table 7 – Combined Data
Percentage of individuals who would consider naming a charity in their will by education
Consider naming a charity in their will
All survey respondents *
High School diploma or less 27% 51%
Associate's or technical school 10% 13%
Bachelor's degree 39% 23%
Graduate level degree 24% 14%
Total 100% 100% * May not add up to 100% due to rounding *Survey respondent values differ from Table 5 because respondents in New Hampshire were not asked this question.
The dichotomy between individuals with a high school diploma or less and
individuals with an associate’s / technical degree is also apparent in analysis of
individuals who consider naming a charity in their wills (see Table 7).
Individuals with graduate level degrees are important bequest givers. Table 7
shows that individuals with graduate level degrees constitute a much larger percentage of
those who consider naming a charity in their wills (24%) than they do of the survey
respondents (14%). However, it would not be effective for fund raisers to ask only those
with graduate degrees because nearly one-fifth already have a provision in their will for
charity (17%, Figure 5, next page).

28
Figure 5 – Combined Data
Percent of individuals in each education level by bequest intent
5 6
9
17
13
18
39
36
High School diploma or less Associate's or technical school Bachelor's degree Graduate level degree
Percent
Ed
ucati
on
Charity named in will
Considers naming a charity in will
Implications of these findings about education for practice
One effective approach may be to expand the focus to include more individuals
with bachelor’s degrees. Only 9% of the individuals with bachelor’s degrees have a
charity in their wills (see Figure 5). Thus 91% of individuals with bachelor’s degrees
either have no will or have no charity named in their wills. Because the occurrence of
having a charity named in their wills for this group is low, it is surprising that the group
has the highest percentage of respondents who would consider naming a charity in their
will (39%, Figure 5) and makes up the majority of those who would consider it (39%,
Table 7). Therefore individuals with bachelor’s degrees would be a good group to ask to
add a provision in their wills for charity. Twice as many people with bachelor’s degrees
would have to include a charity in their will in order to raise the percentage of individuals
with bachelor’s degrees with a charity named in their wills to the same level as those with
29
graduate degrees (17%). This group could provide an opportunity to double the
percentage of individuals with bachelor’s degrees having a charity named in their wills
by raising the number of those who do by only 20%of those willing to consider adding a
charity to their will.
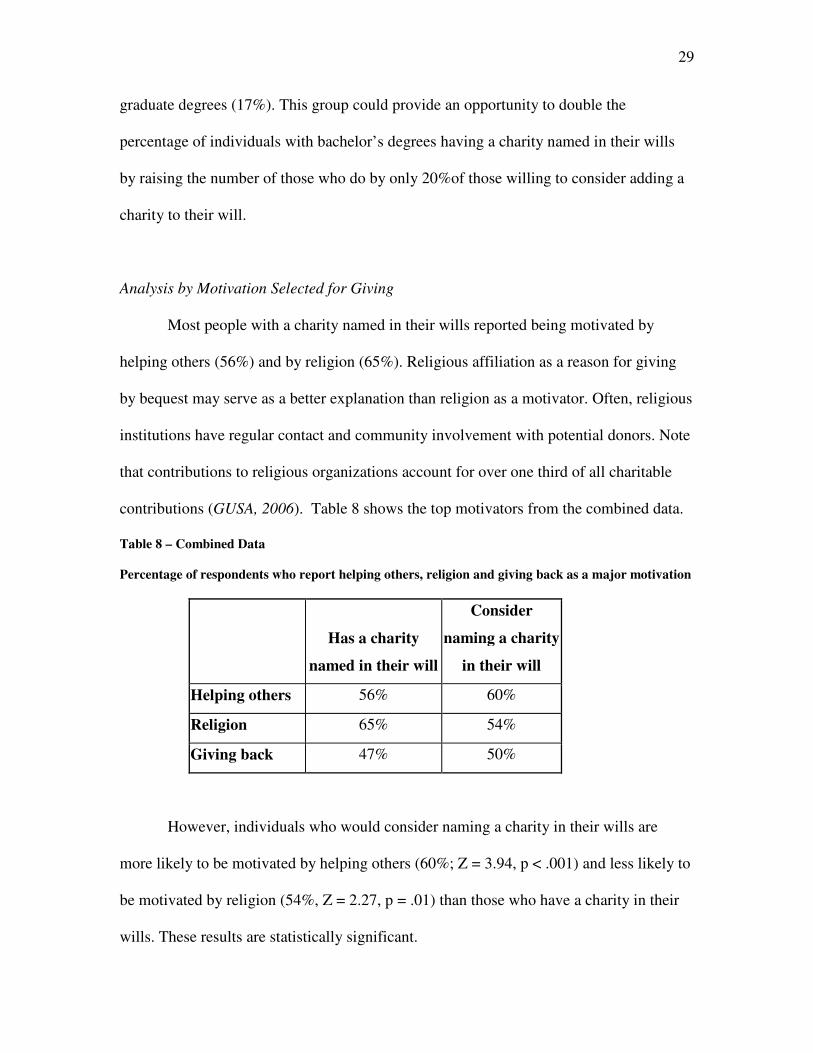
Analysis by Motivation Selected for Giving
Most people with a charity named in their wills reported being motivated by
helping others (56%) and by religion (65%). Religious affiliation as a reason for giving
by bequest may serve as a better explanation than religion as a motivator. Often, religious
institutions have regular contact and community involvement with potential donors. Note
that contributions to religious organizations account for over one third of all charitable
contributions (GUSA, 2006). Table 8 shows the top motivators from the combined data.
Table 8 – Combined Data
Percentage of respondents who report helping others, religion and giving back as a major motivation
However, individuals who would consider naming a charity in their wills are
more likely to be motivated by helping others (60%; Z = 3.94, p < .001) and less likely to
be motivated by religion (54%, Z = 2.27, p = .01) than those who have a charity in their
wills. These results are statistically significant.
Has a charity
named in their will
Consider
naming a charity
in their will
Helping others 56% 60%
Religion 65% 54%
Giving back 47% 50%
30
Giving back was also a major motivation for individuals who have a charity in
their wills and who would consider having a charity in their wills. However, individuals
who neither had a charity in a will nor considered naming a charity in their wills were
less likely to report having a major motivation of helping others (41%), religion (48%), or
giving back (30%).
Grouping donors by motivation
A 2006 study by Adrian Sargeant used qualitative data from focus groups in large
nonprofit organizations to identify three categories of motivations for giving to charities.
The following three motivation categories were found:
• Organizational - professionalism and quality communications;
• Individual - personal ties to organizations; and
• Legacy-specific - lack of family need, tax considerations, being remembered.
While Sargeant’s study used a qualitative analysis, the Center on Philanthropy’s
research team used a quantitative method. This method, called factor analysis, identifies
groups of motivation questions that respondents answered similarly. Analysis of data
from the High Net-Worth Study provided evidence toward two underlying motivation
constructs: those who are motivated by “other’s expectations” and those who are
motivated by “doing good.” A table of items that are included in each factor can be
found in Appendix 1.
31
Next, groupings of motivations similar to those in the High Net-Worth Study
were used in the combined data set to evaluate bequest donors. Similar to the High Net-
Worth Study, results from the combined data set showed two factors that account for
43% percent of the variance in motivation responses. A strong factor must account for
30% or more of the variance. Alpha levels on the factors from the combined data set were
α = .68 for “doing good” and α =.51 for ‘”expected.” The reason the alpha level for
expected is less than the .6 cutoff mentioned above is that an important motivation
question from the High Net-Worth Study was not asked in the combined data set: is
giving to charity expected within the respondent’s social network? If this question had
been asked in the combined data set, alpha levels on the ‘expected’ factor may have been
higher.
There is a distinct difference in motivations between those who consider naming a
charity in their wills and those who would not. Those who would not consider naming a
charity in their will are 10% less likely to be motivated by doing good or expectations.
However, they are 7% more likely to be motivated by religion.
The research team found that only 6.2% of respondents are only motivated by
‘doing good,’ not by outside expectations (n=2,279). This percentage was consistent
across groups: those with a charity in their will (5.7%, n=150), and those who would
consider a charity in their will (6.6%, n=376). Forty-seven percent of all respondents
reported being motivated by a combination of ‘doing good’ and ‘expectations’ and 19%
did not report being motivated by either. It is important to note that the motivation to
give does not only come from within but is most often a combination of the desire to do
good and to fulfill other’s expectations.
32
Implications for practice of the findings about motivation
The archetype section later in this report considers further the motivations for giving and
how those interact with age, income, and education.
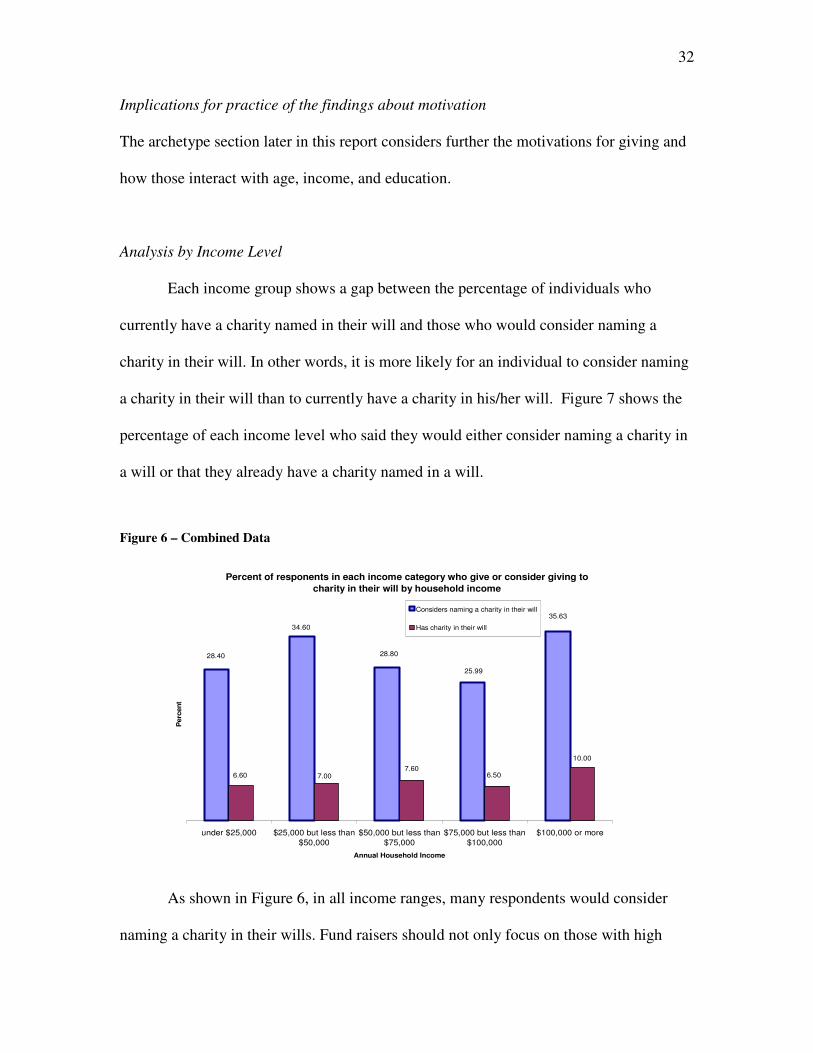
Analysis by Income Level
Each income group shows a gap between the percentage of individuals who
currently have a charity named in their will and those who would consider naming a
charity in their will. In other words, it is more likely for an individual to consider naming
a charity in their will than to currently have a charity in his/her will. Figure 7 shows the
percentage of each income level who said they would either consider naming a charity in
a will or that they already have a charity named in a will.
Figure 6 – Combined Data
Percent of responents in each income category who give or consider giving to
charity in their will by household income
28.40
35.63
25.99
34.60
28.80
6.60 7.007.60
6.50
10.00
under $25,000 $25,000 but less than
$50,000
$50,000 but less than
$75,000
$75,000 but less than
$100,000
$100,000 or more
Annual Household Income
Perc
en
t
Considers naming a charity in their will
Has charity in their will
As shown in Figure 6, in all income ranges, many respondents would consider
naming a charity in their wills. Fund raisers should not only focus on those with high
33
incomes. No matter the donor’s income level, fund raisers have between a one-in-three
chance and a one-in-four chance of approaching one of the individuals who would
consider giving to a charity in their will.
There is a slight drop in the likelihood of considering naming a charity in one’s
will for households with an annual income between $50,000 and $75,000. However, for
households with an annual income between $75,000 and $100,000, the likelihood of both
giving by bequest and of considering it drops. The archetype section attempts to explain
this trend.
34
Archetypes
Relationships between socioeconomic status, motivation, and bequest intention
may be better described by archetypes, or models, of those in different income and age
ranges. We have identified three archetypes: community core, climber, and the retiree.
Each is discussed further below.
Community Core
The research team looked at a community core of individuals between 40 and 60
years of age who are employed and have a household income between $50,000 and
$75,000. People in this group are among the most likely prospects for planned gift
opportunities. This group’s age range has the highest likelihood of considering naming a
charity in their wills, and this income range is highest in the percentage of those with a
charity in their will. The majority of respondents in this group are motivated to give by a
combination of “doing good” (85%) and “expectations,” (83%). These percentages are
both about 5 percentage points higher than average.
Respondents in the community core group were more likely to be religious (major
motivation or donor to religion) than average for the total sample and are likely to have a
higher education level than average (each by about 7 percentage points).

35
Table 8 – Combined Data
Percentage by education status, community core compared with sample
Sample
Overall
Income
$50,000-
$75,000
HS or less 41% 34%
Associate or tech
school 12% 16%
Bachelor's degree 27% 29%
Graduate level degree 21% 21%
Climber
Those in the “climber” group are young (30-45), have an annual household
income between $75,000 and $100,000, and have at least a bachelor’s degree. These
people are more likely to be married (85%) or separated (6.5%) than the general
population (59%, 5% respectively). Climbers likely do not have a charity named in their
wills (89%) nor do they consider it. Their motivations for giving are helping others and
giving back - not reciprocation or being asked.
Table 9 – Combined Data
Percentage by marital status, overall sample and “climber” group
Sample
overall Climbers
Married 59% 85%
Separated 5% 6.5%
36
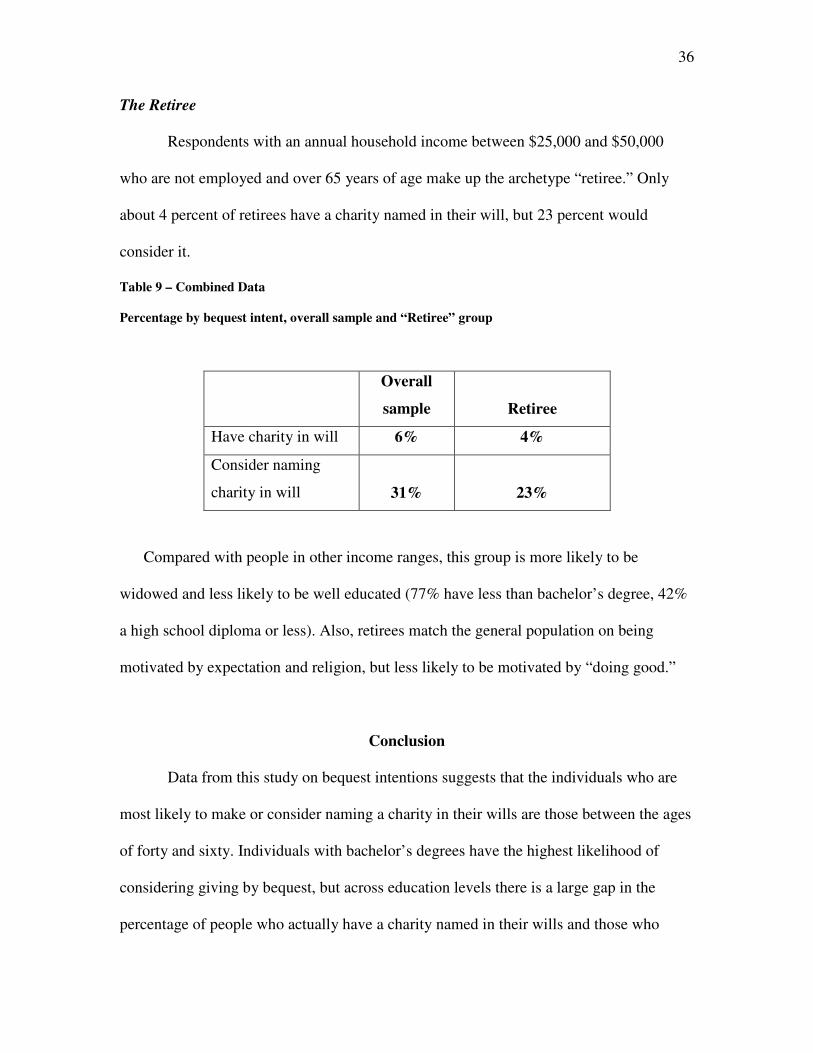
The Retiree
Respondents with an annual household income between $25,000 and $50,000
who are not employed and over 65 years of age make up the archetype “retiree.” Only
about 4 percent of retirees have a charity named in their will, but 23 percent would
consider it.
Table 9 – Combined Data
Percentage by bequest intent, overall sample and “Retiree” group
Overall
sample Retiree
Have charity in will 6% 4%
Consider naming
charity in will 31% 23%
Compared with people in other income ranges, this group is more likely to be
widowed and less likely to be well educated (77% have less than bachelor’s degree, 42%
a high school diploma or less). Also, retirees match the general population on being
motivated by expectation and religion, but less likely to be motivated by “doing good.”
Conclusion
Data from this study on bequest intentions suggests that the individuals who are
most likely to make or consider naming a charity in their wills are those between the ages
of forty and sixty. Individuals with bachelor’s degrees have the highest likelihood of
considering giving by bequest, but across education levels there is a large gap in the
percentage of people who actually have a charity named in their wills and those who

37
would consider it. A combination of the desire to do good and the desire to fulfill other’s
expectations motivates individuals who consider giving to charity in their wills.
Therefore an individual will not add a charity to his/her will only because of the desire to
“do good”, but he/she must also understand the social “expectation” to give in this way.
The potential donor’s household income is not a strong predictor of whether he/she will
consider naming a charity in his/her will. Individuals in every income group are more or
less equally willing to consider naming a charity in their wills.
A practical application of these findings is for fund raisers to focus on individuals
who are most likely to be potential bequest donors. Individuals with bachelor’s degrees
and those who are young may be populations who have been omitted from prior
strategies to gain bequest donors. A new strategy would entail asking individuals who
have given donations to your organization for two or three years to consider putting your
charity in their wills. It may be prudent to inform potential bequest donors of this
charitable option before they turn sixty. Make sure that younger individuals know how
they can provide all that’s needed for their loved ones. Talk through provisions that could
be written into the will to fulfill the needs of heirs and spouses before designating the
remainder for your charity. Only then will younger people who are willing to give to
charity in their wills, but do not do so currently, actually donate part of their estate to a
charity.
In sum, to increase the occurrence of charities being named in people’s wills, the
nonprofit sector must make an effort to cultivate younger donors (ages 40 – 60). The
originally named charity in a donor’s will may change with age, but it is up to fund
raisers from all types of nonprofits to turn that donor’s consideration into action. Because
38
of the labor-intensive nature of fund raiser’s activities, asking the correct people for
planned gifts is important. The research team’s data shows that there is great opportunity
for fund raisers to procure planned gifts for their organizations, no matter the donor base.
One in every three people (31%) a fund raiser approaches, across education and income
levels, would be willing to consider giving a planned gift.
Discussion
Younger individuals, between the ages of 40 and 60, are likely to consider, but
not to have a charity named in their wills. One explanation for this discrepancy is that
younger individuals may not be directly asked to make planned gifts. Few charities
outside higher education target their bequest marketing by age, so younger persons are as
likely to receive messages as older donors. However, it is not enough for younger donors
to merely receive information about giving by bequest. They must be directly asked to
take immediate action as part of their overall financial planning, not for a future intent.
In order to receive a bequest, a charity must be included in a person’s final will.
Robert F. Sharpe, president of the Sharpe Group, points out that people who include
bequests to charities typically make the final will that actually distributes funds to charity
in their early seventies to early nineties (2006). The average age of death for bequest
donors is eighty four and does not vary much by the type of organization to which they
give. Therefore, according to Sharpe, fundraisers would do best to focus consistent
information on charitable bequests to persons in the 70 and over age range if they wish to
influence bequest income within the next ten to fifteen years.
39
On the other hand, the Center on Philanthropy’s research team focused on
increasing the number of bequests overall, which may take 20 or 30 years. This study
found that individuals over the age of eighty are less likely to consider naming a charity
in their wills than those between forty and sixty years of age. In short, people over eighty
years old have already decided whether or not to name a charity in their will.
While people are most likely to make their final will in their eighties, the decision
to include a charity at all appears to be made much earlier. In order to help assure that a
charity is likely to be included in the final will, it is important to make sure that younger
persons are invited to include a charity in their wills now. Sharpe agrees that it is
important to make sure that younger persons making what may be their first of many
wills periodically receive information that encourages them to take steps to include
charities; this information should also make your organization’s case for support.
Bequests ensure future funds for a charity. These gifts also may lead the donor to
be more committed to inter-vivos gifts to that charity. Adrian Sargeant argues that
commitment is a mediating factor between trust and giving patterns (2001). Thus, if a
donor is more committed to a trusted organization, he/she is more likely to give to that
organization. “Small increases in donor loyalty can have a dramatic impact on an
organization’s future revenue streams” (Reichheld & Sasser, 1990). For a fund raiser,
being named in a donor’s will is a great way to build lifetime commitment to an
organization. Increasing the number of individuals with a charity named in their wills not
only will increase the future dollar amount given by bequest, but may also increase donor
loyalty and inter-vivos giving.
40
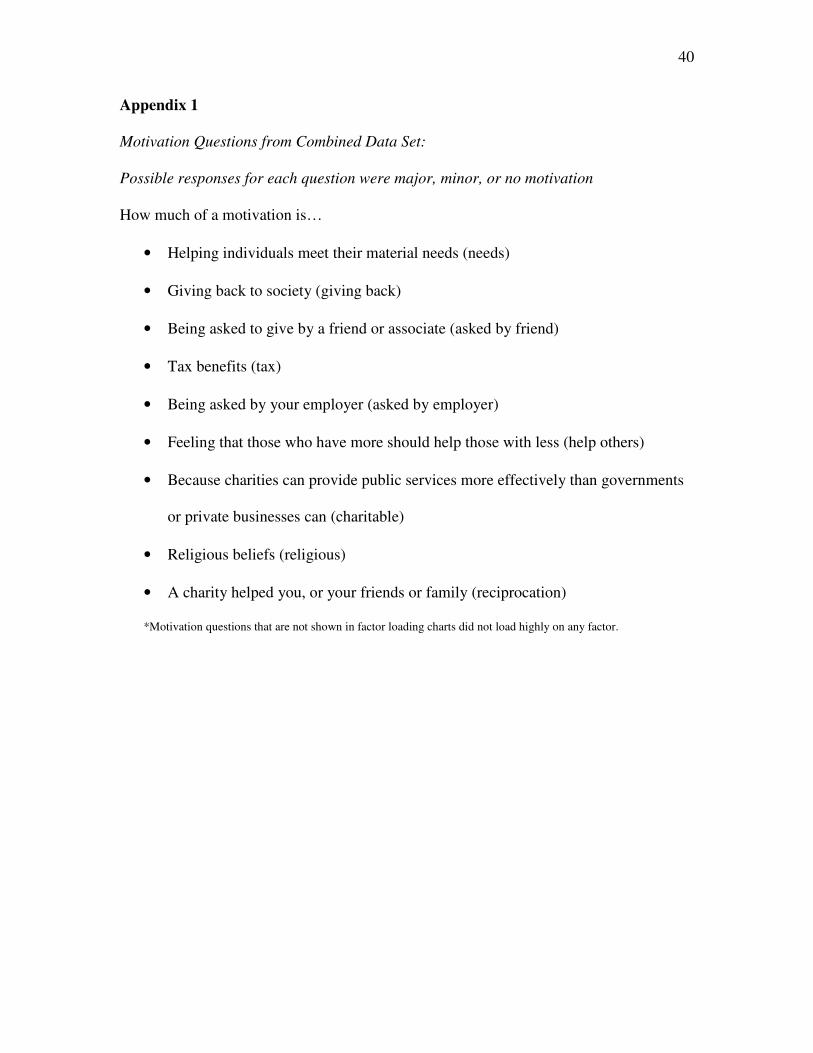
Appendix 1
Motivation Questions from Combined Data Set:
Possible responses for each question were major, minor, or no motivation
How much of a motivation is…
• Helping individuals meet their material needs (needs)
• Giving back to society (giving back)
• Being asked to give by a friend or associate (asked by friend)
• Tax benefits (tax)
• Being asked by your employer (asked by employer)
• Feeling that those who have more should help those with less (help others)
• Because charities can provide public services more effectively than governments
or private businesses can (charitable)
• Religious beliefs (religious)
• A charity helped you, or your friends or family (reciprocation)
*Motivation questions that are not shown in factor loading charts did not load highly on any factor.
41
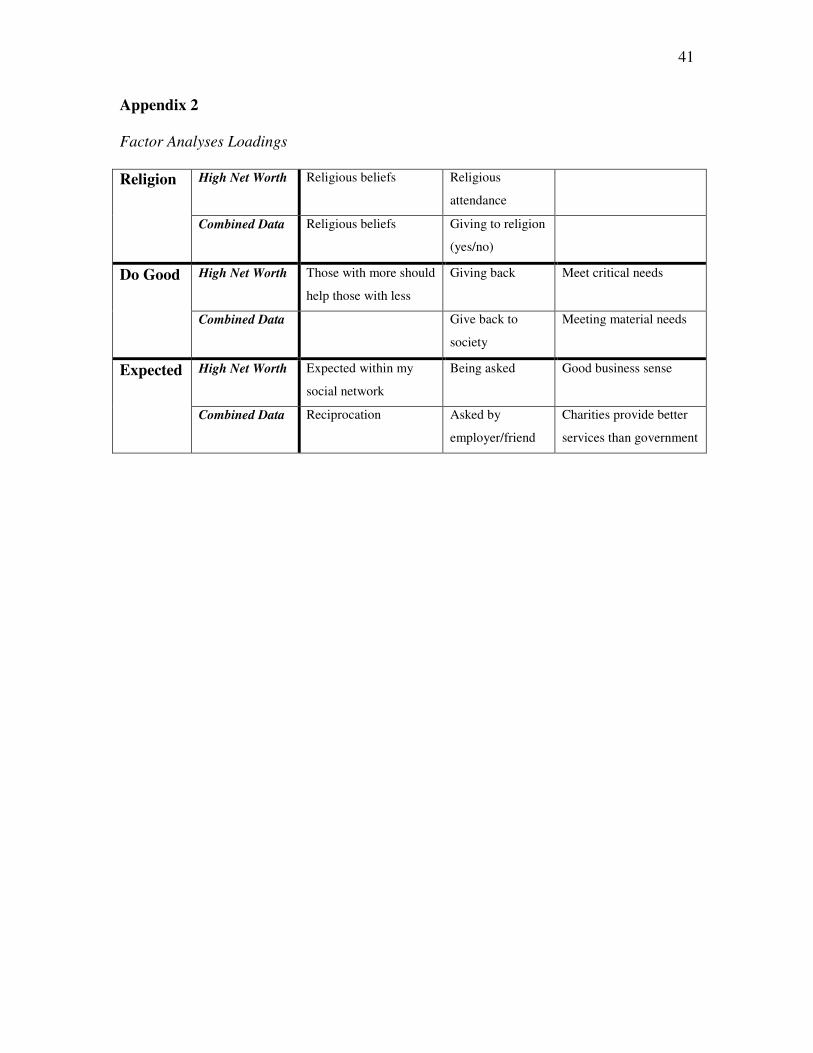
Appendix 2
Factor Analyses Loadings
High Net Worth Religious beliefs Religious
attendance
Religion
Combined Data Religious beliefs Giving to religion
(yes/no)
High Net Worth Those with more should
help those with less
Giving back Meet critical needs Do Good
Combined Data Give back to
society
Meeting material needs
High Net Worth Expected within my
social network
Being asked Good business sense Expected
Combined Data Reciprocation Asked by
employer/friend
Charities provide better
services than government
42
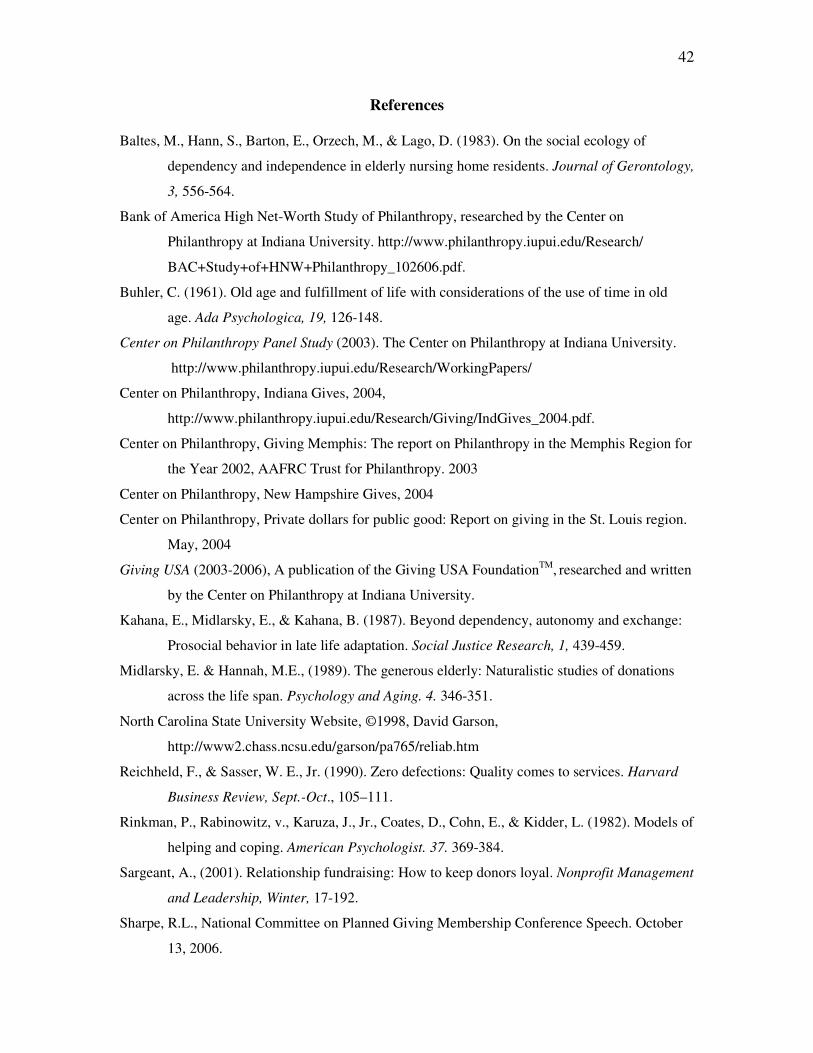
References
Baltes, M., Hann, S., Barton, E., Orzech, M., & Lago, D. (1983). On the social ecology of
dependency and independence in elderly nursing home residents. Journal of Gerontology,
3, 556-564.
Bank of America High Net-Worth Study of Philanthropy, researched by the Center on
Philanthropy at Indiana University. http://www.philanthropy.iupui.edu/Research/
BAC+Study+of+HNW+Philanthropy_102606.pdf.
Buhler, C. (1961). Old age and fulfillment of life with considerations of the use of time in old
age. Ada Psychologica, 19, 126-148.
Center on Philanthropy Panel Study (2003). The Center on Philanthropy at Indiana University.
http://www.philanthropy.iupui.edu/Research/WorkingPapers/
Center on Philanthropy, Indiana Gives, 2004,
http://www.philanthropy.iupui.edu/Research/Giving/IndGives_2004.pdf.
Center on Philanthropy, Giving Memphis: The report on Philanthropy in the Memphis Region for
the Year 2002, AAFRC Trust for Philanthropy. 2003
Center on Philanthropy, New Hampshire Gives, 2004
Center on Philanthropy, Private dollars for public good: Report on giving in the St. Louis region.
May, 2004
Giving USA (2003-2006), A publication of the Giving USA FoundationTM, researched and written
by the Center on Philanthropy at Indiana University.
Kahana, E., Midlarsky, E., & Kahana, B. (1987). Beyond dependency, autonomy and exchange:
Prosocial behavior in late life adaptation. Social Justice Research, 1, 439-459.
Midlarsky, E. & Hannah, M.E., (1989). The generous elderly: Naturalistic studies of donations
across the life span. Psychology and Aging. 4. 346-351.
North Carolina State University Website, ©1998, David Garson,
http://www2.chass.ncsu.edu/garson/pa765/reliab.htm
Reichheld, F., & Sasser, W. E., Jr. (1990). Zero defections: Quality comes to services. Harvard
Business Review, Sept.-Oct., 105–111.
Rinkman, P., Rabinowitz, v., Karuza, J., Jr., Coates, D., Cohn, E., & Kidder, L. (1982). Models of
helping and coping. American Psychologist. 37. 369-384.
Sargeant, A., (2001). Relationship fundraising: How to keep donors loyal. Nonprofit Management
and Leadership, Winter, 17-192.
Sharpe, R.L., National Committee on Planned Giving Membership Conference Speech. October
13, 2006.