Embed Size (px)
Citation preview
Demographics and Dynamics of Mechanical Turk WorkersDjellel Difallah
New York UniversityNew York, NY, [email protected]
Elena FilatovaCity University of New York
Brooklyn, NY, [email protected]
Panos IpeirotisNew York UniversityNew York, NY, [email protected]
ABSTRACTWe present an analysis of the population dynamics and demograph-ics of Amazon Mechanical Turk workers based on the results of thesurvey that we conducted over a period of 28 months, with morethan 85K responses from 40K unique participants. The demograph-ics survey is ongoing (as of November 2017) and the results areavailable at http://demographics.mturk-tracker.com: we provide anAPI for researchers to download the survey data.
We use techniques from the field of ecology, in particular, thecapture-recapture technique, to understand the size and dynamicsof the underlying population. We also demonstrate how to modeland account for the inherent selection biases in such surveys. Ourresults indicate that there are more than 100K workers available inAmazon’s crowdsourcing platform, the participation of the workersin the platform follows a heavy-tailed distribution, and at any giventime there are more than 2K active workers. We also show thatthe half-life of a worker on the platform is around 12-18 monthsand that the rate of arrival of new workers balances the rate ofdepartures, keeping the overall worker population relatively stable.Finally, we demonstrate how we can estimate the biases of differentdemographics to participate in the survey tasks, and show howto correct such biases. Our methodology is generic and can beapplied to any platform where we are interested in understandingthe dynamics and demographics of the underlying user population.
CCS CONCEPTS• Human-centered computing → Collaborative and socialcomputing;
KEYWORDScrowdsourcing; demographics; dynamics; surveys; selection bias;Amazon Mechanical Turk; capture-recapture
ACM Reference Format:Djellel Difallah, Elena Filatova, and Panos Ipeirotis. 2018. Demographicsand Dynamics of Mechanical Turk Workers. In Proceedings of WSDM 2018:The Eleventh ACM International Conference on Web Search and Data Mining, Marina Del Rey, CA, USA, February 5–9, 2018 (WSDM 2018), 9 pages.https://doi.org/10.1145/3159652.3159661
Permission to make digital or hard copies of all or part of this work for personal orclassroom use is granted without fee provided that copies are not made or distributedfor profit or commercial advantage and that copies bear this notice and the full citationon the first page. Copyrights for components of this work owned by others than ACMmust be honored. Abstracting with credit is permitted. To copy otherwise, or republish,to post on servers or to redistribute to lists, requires prior specific permission and/or afee. Request permissions from [email protected] 2018, February 5–9, 2018, Marina Del Rey, CA, USA© 2018 Association for Computing Machinery.ACM ISBN 978-1-4503-5581-0/18/02. . . $15.00https://doi.org/10.1145/3159652.3159661
1 INTRODUCTIONCrowdsourcing, in general, and Amazon Mechanical Turk in partic-ular, have been extensively used over the years for a wide varietyof applications that require access to a large number of humans.Many of these tasks, especially tasks around social sciences (e.g.,psychology, marketing, political science, and others) are sensitiveto the demographics of the underlying population. Other tasks,e.g., surveys, require access to a large number of people to ensurethat the results are representative and can be generalized from thecrowdsourcing platform population to the general population.
Amazon does not provide any information about the evolving de-mographics of the workers population. While there exist multipledemographics studies1 of the Mechanical Turk workers popula-tion [17, 26], these studies provide only a snapshot-in-time analysisof the MTurk workers population and, thus, do not contribute to theunderstanding of the evolution and dynamics of the MTurk workerspopulation. In our work, we present a comprehensive, longitudinalstudy of Mechanical Turk. We present data of the demographicssurvey that was conducted over 28 months, with more than 85Kresponses, and approximately 40K unique participants. We presentthe evolution of the MTurk demographics over time and illustratethe composition of the MTurk workers population across demo-graphics variables such as country, gender, age, income, maritalstatus, and household size. We contrast and compare these resultsagainst the demographics of the general population.
The second question that we address is the size of the MTurkworkers population. Amazon claims that there are hundreds ofthousands of workers on MTurk.2 However, studies claim thatthe real number of workers available to participate in academicexperiments is much smaller [34], and is closer to 7300 workers.Such conflictingmessages can lead to confusion, especially for thosewho want to leverage Mechanical Turk for conducting studies. Forexample, an experimenter would like to run a survey that requiresan access to 10K distinct participants. Is MTurk population sizesufficient for this experiment? We answer this question by buildingon top of the techniques from the field of ecology, specificallythe capture-recapture techniques. Capture-recapture techniquesoperate by taking sample sets of the population individuals overtime, and examining the overlap among these sample sets to providethe estimate of the overall population size. Prior studies [34] usecapture-recapture models for estimating the size of MechanicalTurk but rely on the assumption that all workers are equally likelyto participate in the posted tasks. However, when workers havedifferent propensities to participate in tasks this assumption leads tosignificant underestimation of the true size of the MTurk workers
1See http://www.mturkgrind.com/threads/demographics-of-mechanical-turk.26341/for a comprehensive list of demographic surveys of Mechanical Turk workers.2According to https://requester.mturk.com/tour, MTurk provides “Access more than500,000 Workers from 190 countries”, as of August 2017.
population. In fact, we demonstrate that the number of availableworkers onMechanical Turk is at least 100K, with approximately 2Kworkers being active at any givenmoment.We show that theMTurkworkers’ half-life is 12-18 months, indicating that the populationrefreshes significantly over time. This is good news for anyonewilling to conduct wide-reaching studies using this platform.
Finally, we address a common problem with surveys: When re-searchers present results from surveys, a common concern is thatthese results are biased as they are obtained from users who chooseto participate in this particular survey. We address this issue bymodeling, for each worker, the propensity to complete a particulartask. Then, we examine how demographics are correlated withpropensities to participate, and we infer the hidden selection bi-ases. Our results indicate that most demographics variables arenot affected by selection biases; the notable exception being Indianworkers, that demonstrate a significantly higher propensity to par-ticipate in our survey, and are, therefore, over-represented in theraw results. However, with our presented methods, we can nowadjust the over-estimates to their true values.
In summary, the contributions of the paper are:(1) A longitudinal analysis of various demographics indicators
of Mechanical Turk workers (country, gender, age, income,marital status, and household size), showing which demo-graphics variables remain stable over time, which ones change,and comparing these to the demographics indicators of thegeneral US population (Section 3).
(2) A capture-recapture analysis to estimate the size of the over-all MTurk workers population. Our capture-recapture analy-sis models the expected lifetime of the workers in the market-place and also takes into consideration the different propen-sities to participate in a given task. We provide theoreticaland experimental proofs indicating that models that assumeequal propensities of participation generate population esti-mates can be off by orders of magnitude (Section 4).
(3) An analysis that correlates demographics variables with par-ticipation propensities and lifetime of workers. This tech-nique removes the selection biases from surveys and allowsus to generate unbiased estimates of the demographic pro-files of Mechanical Turk workers (Section 5).
For reproducibility, our code is available at https://github.com/ipeirotis/mturk_demographics and the data can be downloadedthrough an API at http://demographics.mturk-tracker.com.
We believe that the results reported in this paper are not onlyinteresting as a description of the MTurk population and its dynam-ics, but they also provide an insight into the MTurk demographicsto those who hire their study participants via MTurk. Furthermore,the techniques presented in this paper on estimating unbiased pop-ulation characteristics through biased surveys can be used to studya wide variety of systems that can only be sampled through conve-nience samples.
2 RELATEDWORKMTurk labor marketplace is widely used by researchers in a varietyof fields to recruit participants for experiments on data collection,data annotation, survey completion. Sociology, psychology, behav-ioral, economics, political science researchers actively recruit study
participants on various crowdsourcing platforms [2, 3, 5, 23, 32,33, 35]. Many studies show that the data collected using MTurkworkers is comparable in quality to the data collected using un-dergraduate students or professional/commercial panels [19]. Highcorrelation between the data collected using MTurk workers andparticipants recruited using other methods (e.g., college students)occurs despite the MTurk workers being significantly more socio-economically and ethnically diverse than test participants recruitedusing other methods [6].
The validity of the experiments that use human subjects dependson the understanding of participants demographics. Chandler andShapiro [8] evaluate the validity of experiments usingMTurk in clin-ical psychological research from the point of view of sample com-position and collected data quality. Other researchers are interestedin getting access to experiment participants from a particular loca-tion [12], or, on the contrary, from around the world [13]. Arecharet al. [3] investigate the use of MTurk for interactive experimentsin the field of economics. On the one hand, they demonstrate thatMTurk can be used to replicate the results obtained in the physicallaboratory, but on the other hand, they emphasize the importanceof knowing the MTurk participants demographic profile.
Given that while running experiments using MTurk participants,researchers haveminimal control overwho volunteers to participatein the study, concerns regarding the quality of the data submittedby MTurk workers have been discussed [7, 30, 32]. According tothis discussion, several methods exist that allow to filter out mostof the low-quality results from MTurk workers.
Several researchers raise the concern regarding the ethics ofusing MTurk workers for research experiments [15, 16]. One ofthese concerns is considered particularly problematic, namely thelow wages that MTurk workers get for their participation in theexperiments. Often this issue is associated with particular locationsof MTurk workers.
One work that attempts to estimate the number of MTurk work-ers who are ready for work at a particular moment is describedin [34]. However, as mentioned in the introduction (Section 1),we believe that the presented number underestimates the MTurkworkers population size. There are two reasons for this underesti-mation: 1) the experiment set-up where MTurk workers participatein a variety of unrelated tasks with different pay rates, that ranin irregular time intervals, and 2) insufficient calibration of thecapture-recapture model. Both of these issues rely on the assump-tion that different MTurk workers have the same probability orpropensity to participate in every experiment. This bias is a typi-cal issue for the ecology capture-recapture models that ignore thepopulation heterogeneity [1, 28] resulting in population size un-derestimation. We build on the findings from the work in the fieldof ecology [4, 9, 24, 25] regarding the population heterogeneityand how it affects the probability to be caught during the capture-recapture experiment.
Within the context of web-related research, Trushkowsky etal. [36] use capture-recapture models while trying to measure thecardinality of relations extracted from the web. Lu and Li [21]incorporate the heterogeneity issue into their application of thecapture-recapture model for the deep web size estimation: differ-ent documents have different probabilities to be retrieved given arandom query.
US IN CA
GB
PH VE DE FR IT ZZ BR MX ES AE AU RO TR GR
RU
MK
Country
0.1%0.2%0.4%0.8%1.6%3.2%6.4%
12.5%25.0%50.0%
100.0%
Perc
enta
ge o
f Wor
kers
(log
-sca
le)
Top-20 Countries of Mechanical Turk Workers
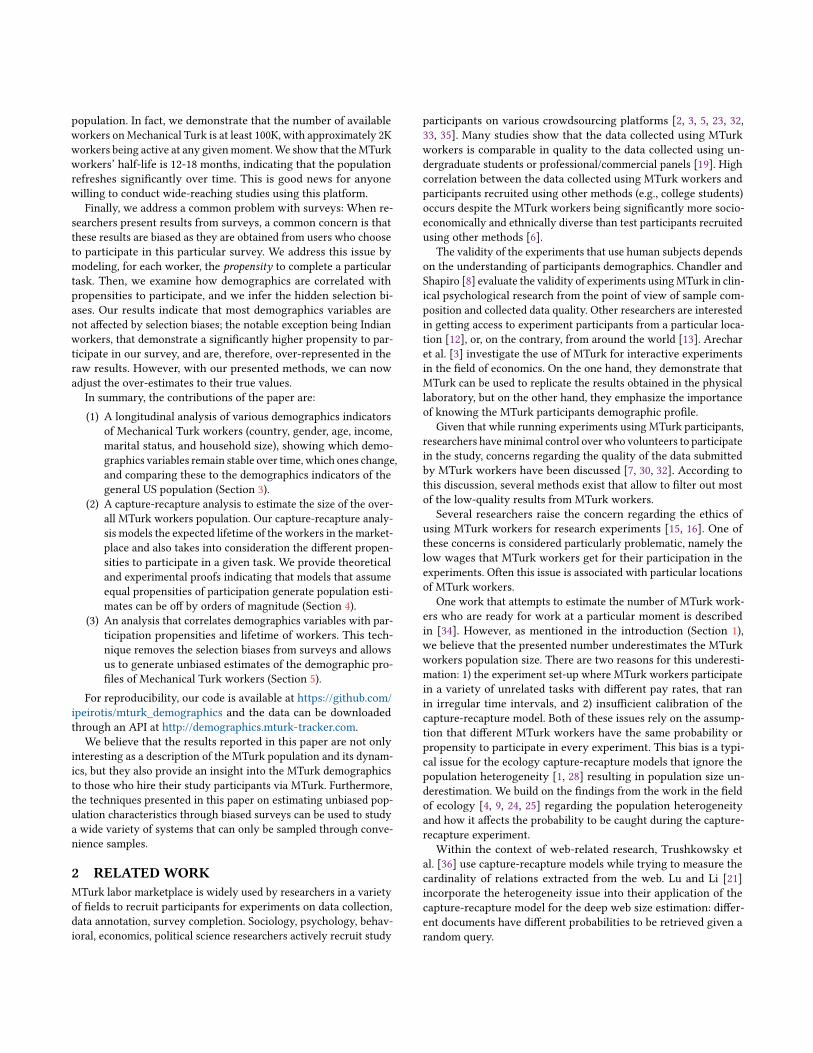
Figure 1: The top-20 countries of origin for Mechanical Turk work-ers. Most of the workers are from the USA (75%), with India (16%)being second, followed byCanada (1.1%), Great Britain (0.7%), Philip-pines (0.35%), and Germany (0.27%).
In our previous work [14], we focus on understanding the dy-namics of MTurk from a market perspective, where we analyze thedemand and supply on the marketplace, and examine the featuresthat drive the speed of completion of a batch of tasks. In this work,we are interested in modeling the size and the demographics of theMTurk worker population by accounting for the workers’ propen-sity to participate in a survey that we regularly post on the platform.We show that failing to account for the task’s specific propensityleads to the underestimation of the MTurk workers population sizewhen applying classical capture-recapture models.
3 DEMOGRAPHICS OF MTURKWORKERSIn this section, we describe our survey data collection methodology,and present the basic results for the demographics of theMechanicalTurk workers.
3.1 Data CollectionWe collect basic demographics information about Mechanical Turkworkers, by periodically posting a survey task asking workers tosubmit the following information: (a) Gender, (b) Year of Birth,(c) Marital Status, (d) Household Size, (e) Household Income, and(f) Location (City, Country). 3
We post one survey task every 15 minutes. The survey can becompleted by a single MTurk worker and takes on average 30 sec-onds. For every submitted survey response, we pay 5 US cents.Each worker on the platform can participate in our survey onceevery 30 days. As of now (August 12, 2018), the survey is contin-uously posted every 15 minutes, starting on March 26, 2015. Forthe purpose of this paper, we report the results obtained from allthe surveys posted between March 26, 2015 and July 31, 2017 (859days). In this time frame, we collected a total of 84,511 responses,submitted by 39,461 unique workers.
3.2 Survey Results AnalysisWe now present the analysis of the survey results.
3.2.1 Country: Figure 1 shows the top-20 countries from whichMTurk workers completed our survey. Most of the workers arefrom the US (75%), with India (16%) being second, followed by3We also use geolocation tools to verify the location of each participating worker.
00:00:00 04:00:00 08:00:00 12:00:00 16:00:00 20:00:00Time
0%
10%
20%
30%
40%
50%
60%
70%
80%
90%
100%
Perc
enta
ge o
f Tot
al W
orke
rs
Percentage of US and Indian Workers During the Day (UTC Time)
USIN
Figure 2: Percentage of US and Indian workers throughout the day.
US IN CA
GB
PH DE
Country
0%
10%
20%
30%
40%
50%
60%
70%
Perc
enta
ge o
f Wor
kers
Gender of Mechanical Turk Workers by Countrygender
femalemale
Figure 3: Gender breakdown across countries.
Canada (1.1%), Great Britain (0.7%), Philippines (0.35%), and Ger-many (0.27%).4 The dominance of US and India among the workerpopulation is well-documented in prior studies [17, 22, 26]. As ex-pected, due to the time difference, the activity levels of US andIndian workers are different. Figure 2 shows the percentage of theUS and Indian workers during the day on MTurk platform, illustrat-ing that at 10am UTC the percentage of workers from the US is ata minimum at around 45%, while midnight UTC is at a maximumat around 90%. Our analysis did not detect any other significantperiodicities in the data (e.g., day of the week, etc.)
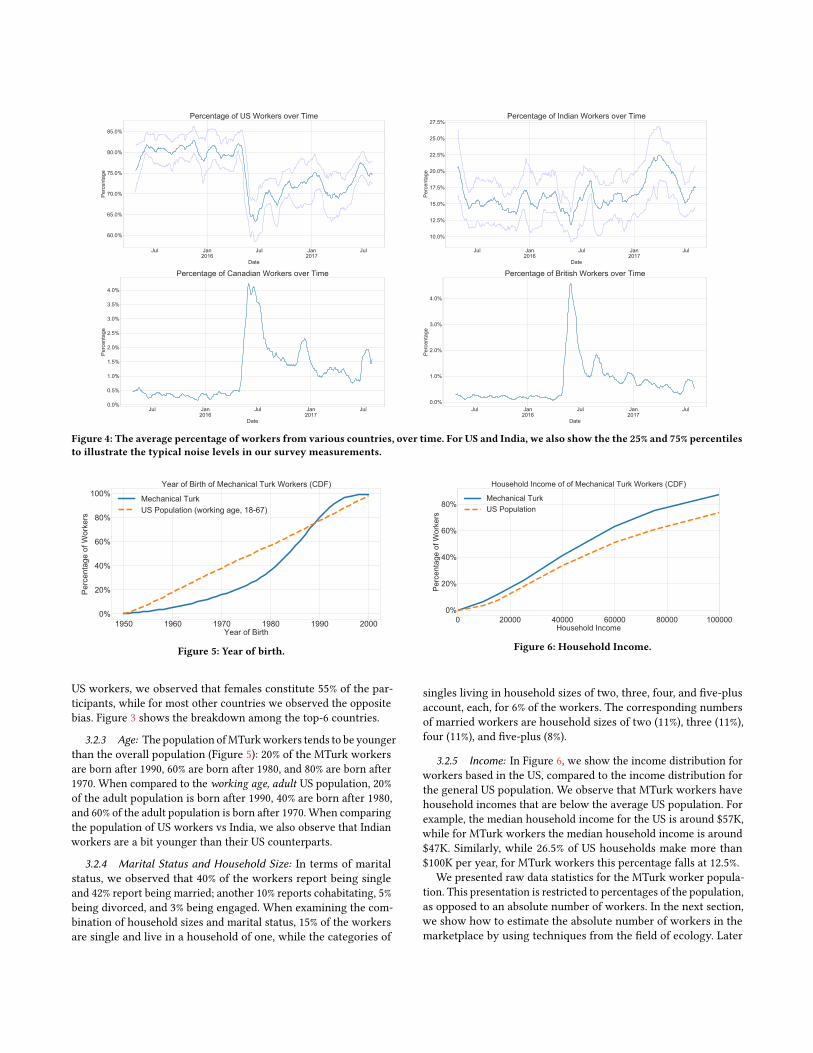
A notable effect that we noticed in our surveys is the increaseof international workers, happening around May 2016. Figure 4shows the percentage of the MTurk workers from US, India, Canada,and Great Britain over time. Note that around May 2016 there is asharp drop in the percentage of US workers on MTurk, and a corre-sponding increase in the percentage of workers from Canada, GreatBritain, and other countries. We believe, this is due to the reverseof the Amazon policy from 2012, which restricted the enrollmentof international workers. However, as we can see in the data, afterthe initial spikes in participation, the percentage of internationalworkers has been steadily falling and is slowly converging towardsApril 2016 levels.
3.2.2 Gender: Our results indicate a generally balanced work-force, with 51% female workers and 49%male. However, we detectedsignificant deviations from the average across countries. Among
4India is over-represented in the raw results presented here due to participation bias.We discuss this in detail in Section 5.
Jan2016
Jan2017
Jul Jul Jul
Date
60.0%
65.0%
70.0%
75.0%
80.0%
85.0%
Perc
enta
ge
Percentage of US Workers over Time
Jan2016
Jan2017
Jul Jul Jul
Date
10.0%
12.5%
15.0%
17.5%
20.0%
22.5%
25.0%
27.5%
Perc
enta
ge
Percentage of Indian Workers over Time
Jan2016
Jan2017
Jul Jul Jul
Date
0.0%
0.5%
1.0%
1.5%
2.0%
2.5%
3.0%
3.5%
4.0%
Perc
enta
ge
Percentage of Canadian Workers over Time
Jan2016
Jan2017
Jul Jul Jul
Date
0.0%
1.0%
2.0%
3.0%
4.0%
Perc
enta
ge
Percentage of British Workers over Time
Figure 4: The average percentage of workers from various countries, over time. For US and India, we also show the the 25% and 75% percentilesto illustrate the typical noise levels in our survey measurements.
1950 1960 1970 1980 1990 2000Year of Birth
0%
20%
40%
60%
80%
100%
Perc
enta
ge o
f Wor
kers
Year of Birth of Mechanical Turk Workers (CDF)
Mechanical TurkUS Population (working age, 18-67)
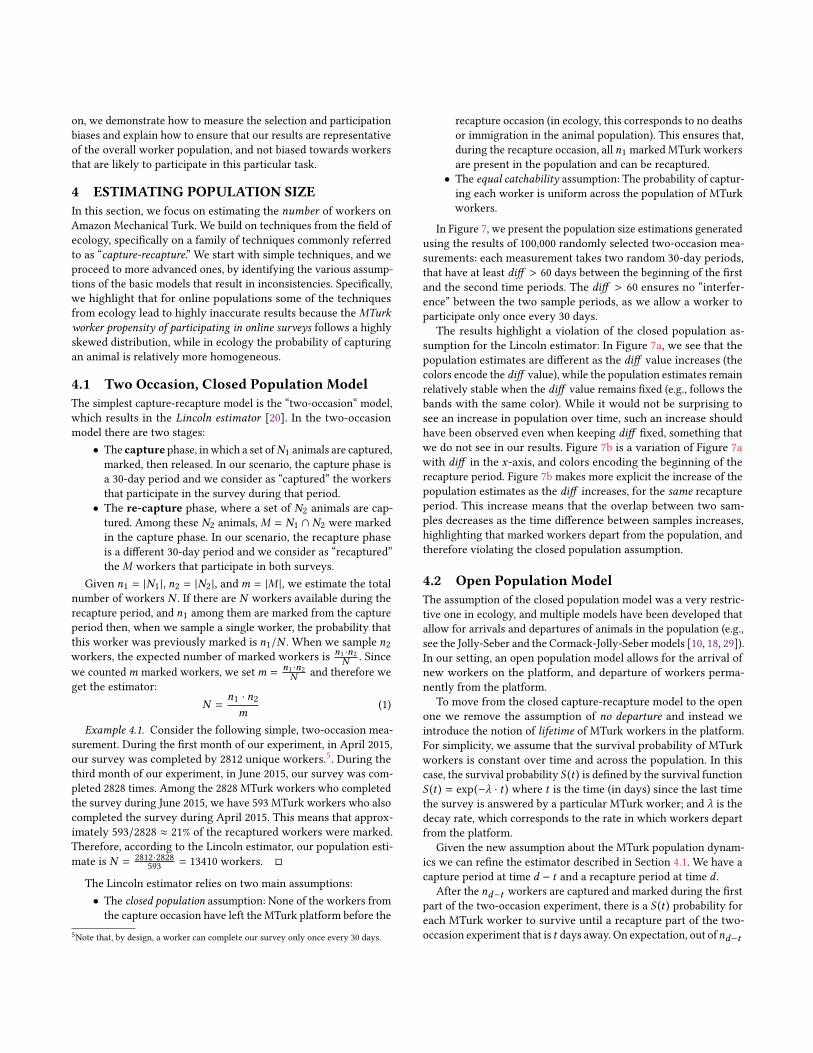
Figure 5: Year of birth.
US workers, we observed that females constitute 55% of the par-ticipants, while for most other countries we observed the oppositebias. Figure 3 shows the breakdown among the top-6 countries.
3.2.3 Age: The population ofMTurkworkers tends to be youngerthan the overall population (Figure 5): 20% of the MTurk workersare born after 1990, 60% are born after 1980, and 80% are born after1970. When compared to the working age, adult US population, 20%of the adult population is born after 1990, 40% are born after 1980,and 60% of the adult population is born after 1970. When comparingthe population of US workers vs India, we also observe that Indianworkers are a bit younger than their US counterparts.
3.2.4 Marital Status and Household Size: In terms of maritalstatus, we observed that 40% of the workers report being singleand 42% report being married; another 10% reports cohabitating, 5%being divorced, and 3% being engaged. When examining the com-bination of household sizes and marital status, 15% of the workersare single and live in a household of one, while the categories of
0 20000 40000 60000 80000 100000Household Income
0%
20%
40%
60%
80%
Perc
enta
ge o
f Wor
kers
Household Income of of Mechanical Turk Workers (CDF)
Mechanical TurkUS Population
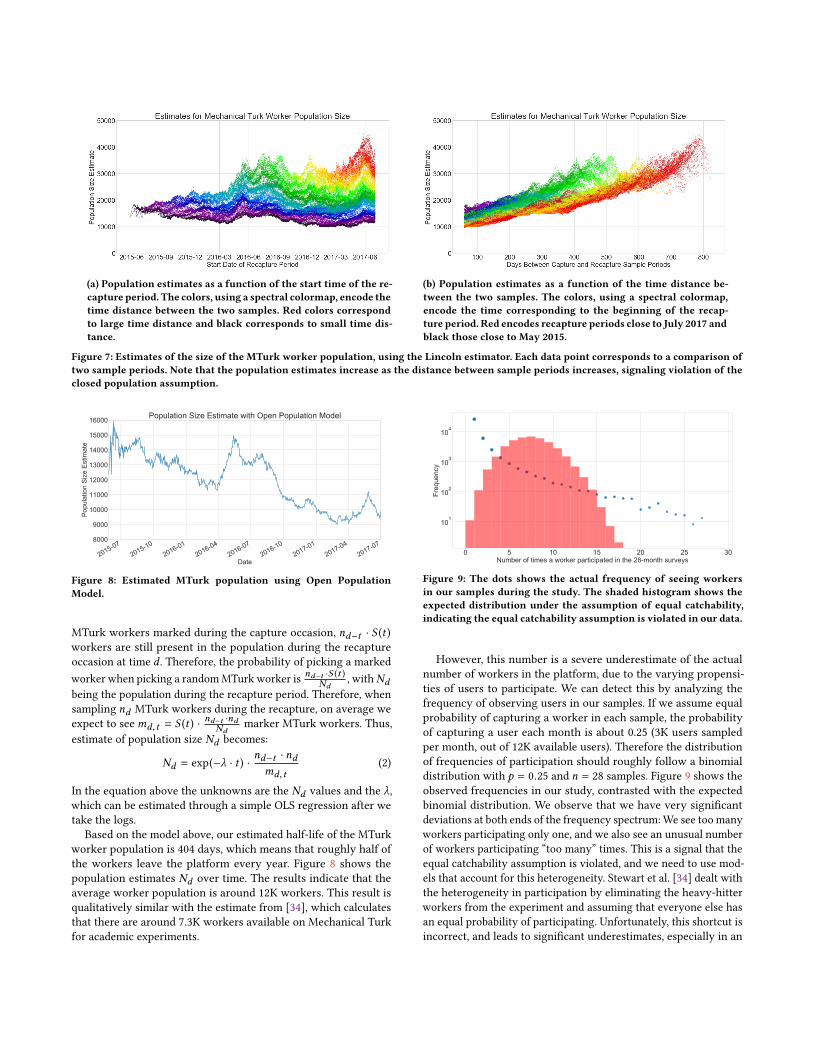
Figure 6: Household Income.
singles living in household sizes of two, three, four, and five-plusaccount, each, for 6% of the workers. The corresponding numbersof married workers are household sizes of two (11%), three (11%),four (11%), and five-plus (8%).
3.2.5 Income: In Figure 6, we show the income distribution forworkers based in the US, compared to the income distribution forthe general US population. We observe that MTurk workers havehousehold incomes that are below the average US population. Forexample, the median household income for the US is around $57K,while for MTurk workers the median household income is around$47K. Similarly, while 26.5% of US households make more than$100K per year, for MTurk workers this percentage falls at 12.5%.
We presented raw data statistics for the MTurk worker popula-tion. This presentation is restricted to percentages of the population,as opposed to an absolute number of workers. In the next section,we show how to estimate the absolute number of workers in themarketplace by using techniques from the field of ecology. Later
on, we demonstrate how to measure the selection and participationbiases and explain how to ensure that our results are representativeof the overall worker population, and not biased towards workersthat are likely to participate in this particular task.
4 ESTIMATING POPULATION SIZEIn this section, we focus on estimating the number of workers onAmazon Mechanical Turk. We build on techniques from the field ofecology, specifically on a family of techniques commonly referredto as “capture-recapture.” We start with simple techniques, and weproceed to more advanced ones, by identifying the various assump-tions of the basic models that result in inconsistencies. Specifically,we highlight that for online populations some of the techniquesfrom ecology lead to highly inaccurate results because the MTurkworker propensity of participating in online surveys follows a highlyskewed distribution, while in ecology the probability of capturingan animal is relatively more homogeneous.
4.1 Two Occasion, Closed Population ModelThe simplest capture-recapture model is the “two-occasion“ model,which results in the Lincoln estimator [20]. In the two-occasionmodel there are two stages:• The capture phase, inwhich a set ofN1 animals are captured,marked, then released. In our scenario, the capture phase isa 30-day period and we consider as “captured” the workersthat participate in the survey during that period.• The re-capture phase, where a set of N2 animals are cap-tured. Among these N2 animals,M = N1 ∩ N2 were markedin the capture phase. In our scenario, the recapture phaseis a different 30-day period and we consider as “recaptured”theM workers that participate in both surveys.
Given n1 = |N1 |, n2 = |N2 |, andm = |M |, we estimate the totalnumber of workers N . If there are N workers available during therecapture period, and n1 among them are marked from the captureperiod then, when we sample a single worker, the probability thatthis worker was previously marked is n1/N . When we sample n2workers, the expected number of marked workers is n1 ·n2
N . Sincewe countedm marked workers, we setm = n1 ·n2
N and therefore weget the estimator:
N =n1 · n2m
(1)
Example 4.1. Consider the following simple, two-occasion mea-surement. During the first month of our experiment, in April 2015,our survey was completed by 2812 unique workers.5. During thethird month of our experiment, in June 2015, our survey was com-pleted 2828 times. Among the 2828 MTurk workers who completedthe survey during June 2015, we have 593 MTurk workers who alsocompleted the survey during April 2015. This means that approx-imately 593/2828 ≈ 21% of the recaptured workers were marked.Therefore, according to the Lincoln estimator, our population esti-mate is N = 2812·2828
593 = 13410 workers. □
The Lincoln estimator relies on two main assumptions:• The closed population assumption: None of the workers fromthe capture occasion have left the MTurk platform before the
5Note that, by design, a worker can complete our survey only once every 30 days.
recapture occasion (in ecology, this corresponds to no deathsor immigration in the animal population). This ensures that,during the recapture occasion, all n1 marked MTurk workersare present in the population and can be recaptured.• The equal catchability assumption: The probability of captur-ing each worker is uniform across the population of MTurkworkers.
In Figure 7, we present the population size estimations generatedusing the results of 100,000 randomly selected two-occasion mea-surements: each measurement takes two random 30-day periods,that have at least diff > 60 days between the beginning of the firstand the second time periods. The diff > 60 ensures no “interfer-ence” between the two sample periods, as we allow a worker toparticipate only once every 30 days.
The results highlight a violation of the closed population as-sumption for the Lincoln estimator: In Figure 7a, we see that thepopulation estimates are different as the diff value increases (thecolors encode the diff value), while the population estimates remainrelatively stable when the diff value remains fixed (e.g., follows thebands with the same color). While it would not be surprising tosee an increase in population over time, such an increase shouldhave been observed even when keeping diff fixed, something thatwe do not see in our results. Figure 7b is a variation of Figure 7awith diff in the x-axis, and colors encoding the beginning of therecapture period. Figure 7b makes more explicit the increase of thepopulation estimates as the diff increases, for the same recaptureperiod. This increase means that the overlap between two sam-ples decreases as the time difference between samples increases,highlighting that marked workers depart from the population, andtherefore violating the closed population assumption.
4.2 Open Population ModelThe assumption of the closed population model was a very restric-tive one in ecology, and multiple models have been developed thatallow for arrivals and departures of animals in the population (e.g.,see the Jolly-Seber and the Cormack-Jolly-Seber models [10, 18, 29]).In our setting, an open population model allows for the arrival ofnew workers on the platform, and departure of workers perma-nently from the platform.
To move from the closed capture-recapture model to the openone we remove the assumption of no departure and instead weintroduce the notion of lifetime of MTurk workers in the platform.For simplicity, we assume that the survival probability of MTurkworkers is constant over time and across the population. In thiscase, the survival probability S (t ) is defined by the survival functionS (t ) = exp(−λ · t ) where t is the time (in days) since the last timethe survey is answered by a particular MTurk worker; and λ is thedecay rate, which corresponds to the rate in which workers departfrom the platform.
Given the new assumption about the MTurk population dynam-ics we can refine the estimator described in Section 4.1. We have acapture period at time d − t and a recapture period at time d .
After the nd−t workers are captured and marked during the firstpart of the two-occasion experiment, there is a S (t ) probability foreach MTurk worker to survive until a recapture part of the two-occasion experiment that is t days away. On expectation, out ofnd−t
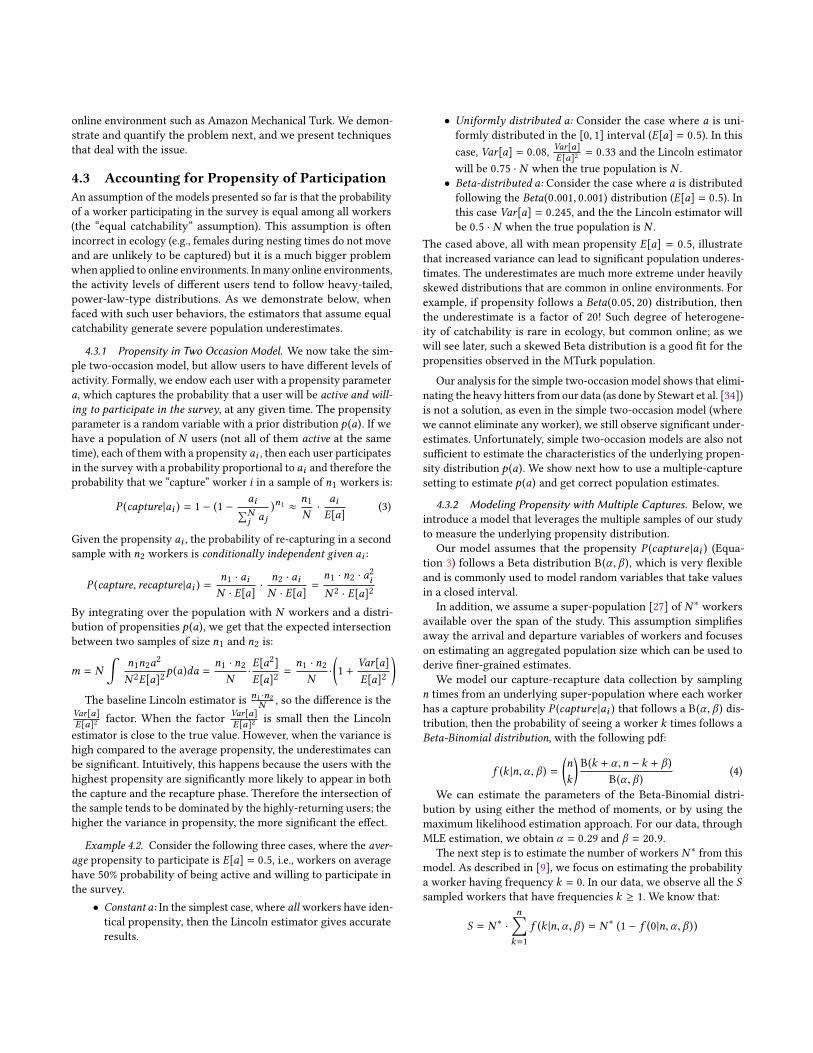
(a) Population estimates as a function of the start time of the re-capture period. The colors, using a spectral colormap, encode thetime distance between the two samples. Red colors correspondto large time distance and black corresponds to small time dis-tance.
(b) Population estimates as a function of the time distance be-tween the two samples. The colors, using a spectral colormap,encode the time corresponding to the beginning of the recap-ture period. Red encodes recapture periods close to July 2017 andblack those close to May 2015.
Figure 7: Estimates of the size of the MTurk worker population, using the Lincoln estimator. Each data point corresponds to a comparison oftwo sample periods. Note that the population estimates increase as the distance between sample periods increases, signaling violation of theclosed population assumption.
2015-072015-10
2016-012016-04
2016-072016-10
2017-012017-04
2017-07
Date
8000
9000
10000
11000
12000
13000
14000
15000
16000
Popu
latio
n Si
ze E
stim
ate
Population Size Estimate with Open Population Model
Figure 8: Estimated MTurk population using Open PopulationModel.
MTurk workers marked during the capture occasion, nd−t · S (t )workers are still present in the population during the recaptureoccasion at time d . Therefore, the probability of picking a markedworker when picking a randomMTurk worker is nd−t ·S (t )
Nd, withNd
being the population during the recapture period. Therefore, whensampling nd MTurk workers during the recapture, on average weexpect to seemd,t = S (t ) · nd−t ·ndNd
marker MTurk workers. Thus,estimate of population size Nd becomes:
Nd = exp(−λ · t ) ·nd−t · ndmd,t
(2)
In the equation above the unknowns are the Nd values and the λ,which can be estimated through a simple OLS regression after wetake the logs.
Based on the model above, our estimated half-life of the MTurkworker population is 404 days, which means that roughly half ofthe workers leave the platform every year. Figure 8 shows thepopulation estimates Nd over time. The results indicate that theaverage worker population is around 12K workers. This result isqualitatively similar with the estimate from [34], which calculatesthat there are around 7.3K workers available on Mechanical Turkfor academic experiments.
0 5 10 15 20 25 30Number of times a worker participated in the 28-month surveys
101
102
103
104
Freq
uenc
y
Figure 9: The dots shows the actual frequency of seeing workersin our samples during the study. The shaded histogram shows theexpected distribution under the assumption of equal catchability,indicating the equal catchability assumption is violated in our data.
However, this number is a severe underestimate of the actualnumber of workers in the platform, due to the varying propensi-ties of users to participate. We can detect this by analyzing thefrequency of observing users in our samples. If we assume equalprobability of capturing a worker in each sample, the probabilityof capturing a user each month is about 0.25 (3K users sampledper month, out of 12K available users). Therefore the distributionof frequencies of participation should roughly follow a binomialdistribution with p = 0.25 and n = 28 samples. Figure 9 shows theobserved frequencies in our study, contrasted with the expectedbinomial distribution. We observe that we have very significantdeviations at both ends of the frequency spectrum:We see too manyworkers participating only one, and we also see an unusual numberof workers participating “too many” times. This is a signal that theequal catchability assumption is violated, and we need to use mod-els that account for this heterogeneity. Stewart et al. [34] dealt withthe heterogeneity in participation by eliminating the heavy-hitterworkers from the experiment and assuming that everyone else hasan equal probability of participating. Unfortunately, this shortcut isincorrect, and leads to significant underestimates, especially in an
online environment such as Amazon Mechanical Turk. We demon-strate and quantify the problem next, and we present techniquesthat deal with the issue.
4.3 Accounting for Propensity of ParticipationAn assumption of the models presented so far is that the probabilityof a worker participating in the survey is equal among all workers(the “equal catchability” assumption). This assumption is oftenincorrect in ecology (e.g., females during nesting times do not moveand are unlikely to be captured) but it is a much bigger problemwhen applied to online environments. Inmany online environments,the activity levels of different users tend to follow heavy-tailed,power-law-type distributions. As we demonstrate below, whenfaced with such user behaviors, the estimators that assume equalcatchability generate severe population underestimates.
4.3.1 Propensity in Two Occasion Model. We now take the sim-ple two-occasion model, but allow users to have different levels ofactivity. Formally, we endow each user with a propensity parametera, which captures the probability that a user will be active and will-ing to participate in the survey, at any given time. The propensityparameter is a random variable with a prior distribution p (a). If wehave a population of N users (not all of them active at the sametime), each of themwith a propensity ai , then each user participatesin the survey with a probability proportional to ai and therefore theprobability that we “capture” worker i in a sample of n1 workers is:
P (capture |ai ) = 1 − (1 −ai∑Nj aj
)n1 ≈n1N·
aiE[a]
(3)
Given the propensity ai , the probability of re-capturing in a secondsample with n2 workers is conditionally independent given ai :
P (capture, recapture |ai ) =n1 · aiN · E[a]
·n2 · aiN · E[a]
=n1 · n2 · a2iN 2 · E[a]2
By integrating over the population with N workers and a distri-bution of propensities p (a), we get that the expected intersectionbetween two samples of size n1 and n2 is:
m = N
∫n1n2a2
N 2E[a]2p (a)da =
n1 · n2N·E[a2]E[a]2
=n1 · n2N·
(1 +
Var[a]E[a]2
)The baseline Lincoln estimator is n1 ·n2
N , so the difference is theVar[a]E[a]2 factor. When the factor Var[a]
E[a]2 is small then the Lincolnestimator is close to the true value. However, when the variance ishigh compared to the average propensity, the underestimates canbe significant. Intuitively, this happens because the users with thehighest propensity are significantly more likely to appear in boththe capture and the recapture phase. Therefore the intersection ofthe sample tends to be dominated by the highly-returning users; thehigher the variance in propensity, the more significant the effect.
Example 4.2. Consider the following three cases, where the aver-age propensity to participate is E[a] = 0.5, i.e., workers on averagehave 50% probability of being active and willing to participate inthe survey.• Constant a: In the simplest case, where all workers have iden-tical propensity, then the Lincoln estimator gives accurateresults.
• Uniformly distributed a: Consider the case where a is uni-formly distributed in the [0, 1] interval (E[a] = 0.5). In thiscase, Var[a] = 0.08, Var[a]E[a]2 = 0.33 and the Lincoln estimatorwill be 0.75 · N when the true population is N .• Beta-distributed a: Consider the case where a is distributedfollowing the Beta(0.001, 0.001) distribution (E[a] = 0.5). Inthis case Var[a] = 0.245, and the the Lincoln estimator willbe 0.5 · N when the true population is N .
The cased above, all with mean propensity E[a] = 0.5, illustratethat increased variance can lead to significant population underes-timates. The underestimates are much more extreme under heavilyskewed distributions that are common in online environments. Forexample, if propensity follows a Beta(0.05, 20) distribution, thenthe underestimate is a factor of 20! Such degree of heterogene-ity of catchability is rare in ecology, but common online; as wewill see later, such a skewed Beta distribution is a good fit for thepropensities observed in the MTurk population.
Our analysis for the simple two-occasion model shows that elimi-nating the heavy hitters from our data (as done by Stewart et al. [34])is not a solution, as even in the simple two-occasion model (wherewe cannot eliminate any worker), we still observe significant under-estimates. Unfortunately, simple two-occasion models are also notsufficient to estimate the characteristics of the underlying propen-sity distribution p (a). We show next how to use a multiple-capturesetting to estimate p (a) and get correct population estimates.
4.3.2 Modeling Propensity with Multiple Captures. Below, weintroduce a model that leverages the multiple samples of our studyto measure the underlying propensity distribution.
Our model assumes that the propensity P (capture |ai ) (Equa-tion 3) follows a Beta distribution B(α , β ), which is very flexibleand is commonly used to model random variables that take valuesin a closed interval.
In addition, we assume a super-population [27] of N ∗ workersavailable over the span of the study. This assumption simplifiesaway the arrival and departure variables of workers and focuseson estimating an aggregated population size which can be used toderive finer-grained estimates.
We model our capture-recapture data collection by samplingn times from an underlying super-population where each workerhas a capture probability P (capture |ai ) that follows a B(α , β ) dis-tribution, then the probability of seeing a worker k times follows aBeta-Binomial distribution, with the following pdf:
f (k |n,α , β ) =
(n
k
)B(k + α ,n − k + β )
B(α , β )(4)
We can estimate the parameters of the Beta-Binomial distri-bution by using either the method of moments, or by using themaximum likelihood estimation approach. For our data, throughMLE estimation, we obtain α = 0.29 and β = 20.9.
The next step is to estimate the number of workers N ∗ from thismodel. As described in [9], we focus on estimating the probabilitya worker having frequency k = 0. In our data, we observe all the Ssampled workers that have frequencies k ≥ 1. We know that:
S = N ∗ ·n∑
k=1f (k |n,α , β ) = N ∗ (1 − f (0|n,α , β ))
In our experiments, we sampled a total of S = 39, 461 distinctworkers with frequencies k ≥ 1. For n = 28, α = 0.29 and β = 20.9,we have that f (0|n,α , β ) = 0.7793, and therefore the estimate forthe super-population of workers N ∗ is:
N ∗ =S
1 − f (0|n,α , β )=
39, 4611 − 0.7793
≈ 178, 800 workers
Similarly, we can get additional estimates by examining the numberof workers that appeared once (N ∗1 ), twice (N
∗2 ), thrice, and so on:
N ∗ =N ∗1
f (1|n,α , β ), N ∗ =
N ∗2f (2|n,α , β )
, N ∗ =N ∗3
f (3|n,α , β ), . . .
Our technique relies on the assumption of a Beta distributionfor the probabilities of capture. To check whether our techniqueproduces population estimates that are reasonable, we also usedthe technique of Chao [9, Eq. 10], which yields a lower bound forthe size of the population. By using our data, the Chao approachgives a lower bound of 97,579 workers, which is compatible withour results.
Similarly, we also experimented with a technique from Pledger etal. [25] that uses finite mixtures to model heterogeneity in an openpopulation. The technique operates with the assumption that thepopulation is split into a predefined set of underlying clusters, eachhaving unique survival and capture characteristics. Our numericalestimates were sensitive to the choice of the number of clusters(the technique did not converge when we used larger number ofclusters) nonetheless, it estimated the size of the super-populationto 125K-130K using 3 clusters with highly heterogeneous captureprobabilities across the three groups, and with a survival probabilitysimilar to the one we estimated in Section 4.2.
Having estimated the distribution of propensities, we now moveto our final question: Are the demographics estimates, reported inSection 3, affected by selection bias? We address the issue next.
5 DEMOGRAPHICS AND SELECTION BIASESA natural concern when reporting the results of a survey is that thesurvey answers may be biased due to the type of people that arewilling to participate in the survey. Our setting, where we surveyworkers multiple times over a long period of time, allows us to inferthe propensity of participation for the workers. This, in turn, allowsus to examine whether the demographic variables that we measureare correlated with the propensity to participate, and therefore needto be adjusted.
In our model, the propensities, and hence the probability ofcapture, are distributed according to a Beta distribution. Therefore,to examine if there is a correlation of the propensities with thedemographic variables, we use a Beta regression [11, 31], whichis explicitly designed to handle dependent variables that are Betadistributed and exhibit heteroskedasticity and skewness.
We examined the correlation of the six demographic variables,described in Section 3.1, with the observed propensity dependentvariable computed from the frequency of participation over thecourse of the study periods. Since the computed propensity includesvalues of 1.0, indicating workers who participate every month sincethe beginning of the study, we perform an additional transforma-tion [31] to shift the distribution into the open interval (0,1) using(propensity · (n − 1) + 0.5)/n, where n = 28 is the sample size. By
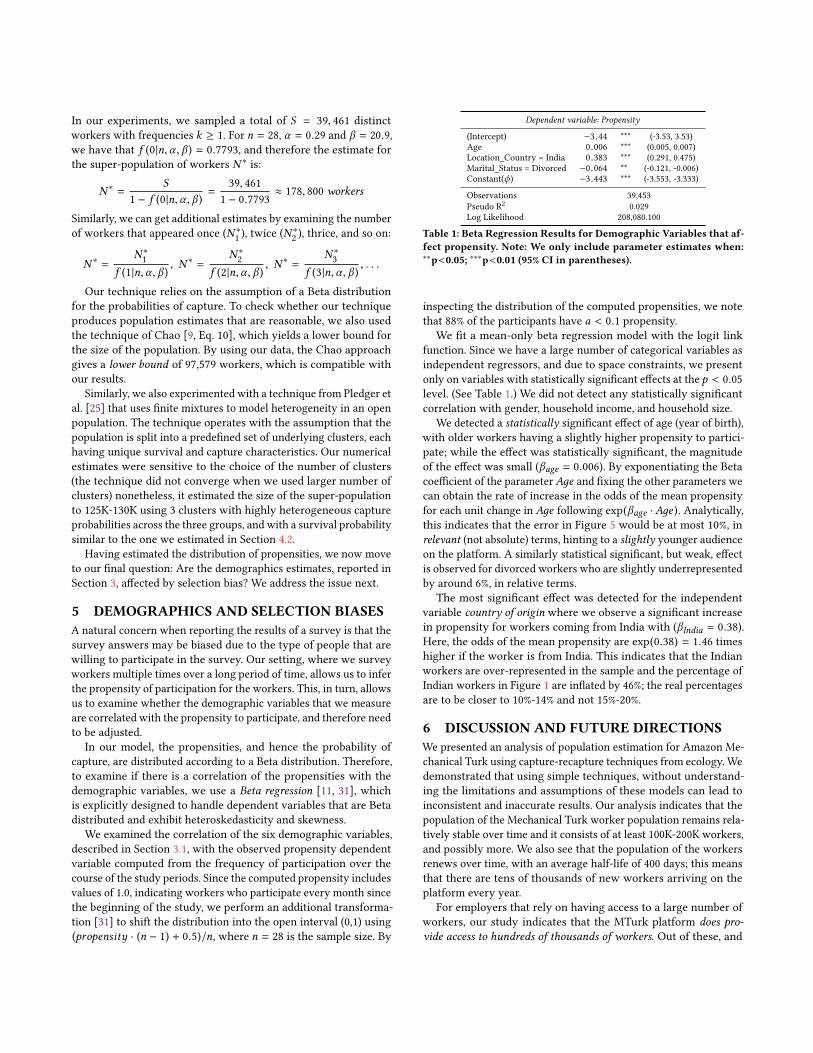
Dependent variable: Propensity
(Intercept) −3.44 *** (-3.53, 3.53)Age 0.006 *** (0.005, 0.007)Location_Country = India 0.383 *** (0.291, 0.475)Marital_Status = Divorced −0.064 ** (-0.121, -0.006)Constant(ϕ) −3.443 *** (-3.553, -3.333)
Observations 39,453Pseudo R2 0.029Log Likelihood 208,080.100
Table 1: Beta Regression Results for Demographic Variables that af-fect propensity. Note: We only include parameter estimates when:∗∗p<0.05; ∗∗∗p<0.01 (95% CI in parentheses).
inspecting the distribution of the computed propensities, we notethat 88% of the participants have a < 0.1 propensity.
We fit a mean-only beta regression model with the logit linkfunction. Since we have a large number of categorical variables asindependent regressors, and due to space constraints, we presentonly on variables with statistically significant effects at the p < 0.05level. (See Table 1.) We did not detect any statistically significantcorrelation with gender, household income, and household size.
We detected a statistically significant effect of age (year of birth),with older workers having a slightly higher propensity to partici-pate; while the effect was statistically significant, the magnitudeof the effect was small (βage = 0.006). By exponentiating the Betacoefficient of the parameterAдe and fixing the other parameters wecan obtain the rate of increase in the odds of the mean propensityfor each unit change in Aдe following exp(βage ·Aдe ). Analytically,this indicates that the error in Figure 5 would be at most 10%, inrelevant (not absolute) terms, hinting to a slightly younger audienceon the platform. A similarly statistical significant, but weak, effectis observed for divorced workers who are slightly underrepresentedby around 6%, in relative terms.
The most significant effect was detected for the independentvariable country of origin where we observe a significant increasein propensity for workers coming from India with (βIndia = 0.38).Here, the odds of the mean propensity are exp(0.38) = 1.46 timeshigher if the worker is from India. This indicates that the Indianworkers are over-represented in the sample and the percentage ofIndian workers in Figure 1 are inflated by 46%; the real percentagesare to be closer to 10%-14% and not 15%-20%.
6 DISCUSSION AND FUTURE DIRECTIONSWe presented an analysis of population estimation for Amazon Me-chanical Turk using capture-recapture techniques from ecology. Wedemonstrated that using simple techniques, without understand-ing the limitations and assumptions of these models can lead toinconsistent and inaccurate results. Our analysis indicates that thepopulation of the Mechanical Turk worker population remains rela-tively stable over time and it consists of at least 100K-200K workers,and possibly more. We also see that the population of the workersrenews over time, with an average half-life of 400 days; this meansthat there are tens of thousands of new workers arriving on theplatform every year.
For employers that rely on having access to a large number ofworkers, our study indicates that the MTurk platform does pro-vide access to hundreds of thousands of workers. Out of these, and
based on our empirically estimated propensity distribution, wecan compute the number of available workers at any given time,which we interpret from calculating the expected propensity timesthe super-population size as follows: E[a] · N ∗ = α
α+β · N∗ =
0.290.29+20.9 · 178, 800 ≈ 2, 450 workers. This is in sharp contrast tothe conclusions of [34], which estimated that there are only 7,500workers available to experimenters for social science research. Thatincorrect estimate was due to the incorrect assumption that allworkers have the same degree of activity in the platform, and thesame propensity to participate in a certain type of task.
In the future, we plan to consider models that allow time-varyingsurvival and propensities. Our current models consider both to bestable over time, and our attempts to allow time-varying parametersdid not indicate significant variations over time for our data. Itwould be also interesting to collect participation data for other long-running tasks, and examine cross-task propensities: this will allowus to understand whether propensity to participate is a global traitacross tasks, or whether workers have task-specific propensities.
We would also like to use our technique to study other onlineenvironments: By monitoring user activity on various platforms(e.g., comments in threads) we can infer the total number of usersin these communities, or even identify the potential number ofusers by estimating the number of users that have made no visiblecontribution so far. As Trushkowsky et al. [36] have shown, it ispossible to use such models also in fields like information extractionand online databases, where population sizes do not necessarilycorrespond to humans but are important to estimate for a variety ofapplications. By learning the state-of-the-art from the techniquesin ecology, we can adapt these models for application in domainswhere the behavior is different than the behavior of animals, butthe fundamental ideas behind the models remain useful.
REFERENCES[1] Steven C. Amstrup, Trent L. McDonald, and Bryan F. J. Manly. 2010. Handbook
of Capture-Recapture Analysis. Princeton University Press, Princeton, NJ.[2] Joanna J. Arch and Alaina L. Carr. 2016. Using Mechanical Turk for research on
cancer survivors. Psycho-Oncology Forthcoming (2016), –. PON-15-0731.R1.[3] Antonio A. Arechar, Simon Gächter, and Lucas Molleman. 2017. Conducting
interactive experiments online. Experimental Economics Forthcoming (09 May2017), 1–33.
[4] K. P. Burnham and W. S. Overton. 1978. Estimation of the Size of a ClosedPopulation when Capture Probabilities vary Among Animals. Biometrika 65, 3(1978), 625–633.
[5] Chris Callison-Burch and Mark Dredze. 2010. Creating Speech and LanguageData with Amazon’s Mechanical Turk. In Proceedings of the NAACL HLT 2010Workshop on Creating Speech and Language Data with Amazon’s Mechanical Turk(CSLDAMT ’10). Association for Computational Linguistics, Stroudsburg, PA,USA, 1–12.
[6] Krista Casler, Lydia Bickel, and Elizabeth Hackett. 2013. Separate but Equal?A Comparison of Participants and Data Gathered via Amazon’s MTurk, SocialMedia, and Face-to-Face Behavioral Testing. Computers in Human Behavior 29(2013), 2156–2160.
[7] Jesse Chandler, Gabriele Paolacci, and Pam Mueller. 2013. Risks and Rewards ofCrowdsourcing Marketplaces. In Handbook of Human Computation. Springer,New York, 377–392.
[8] Jesse Chandler and Danielle Shapiro. 2016. Conducting Clinical Research UsingCrowdsourced Convenience Samples. Annual Review of Clinical Psychology 12(2016), 35–81.
[9] Anne Chao. 1987. Estimating the population size for capture-recapture data withunequal catchability. Biometrics 43, 4 (Dec. 1987), 783–791.
[10] R. M. Cormack. 1964. Estimates of Survival From the Sighting of Marked Animals.Biometrics 51 (1964), 429–438.
[11] Francisco Cribari-Neto and Achim Zeileis. 2010. Beta Regression in R. Journal ofStatistical Software, Articles 34, 2 (2010), 1–24.
[12] Damien L. Crone and Lisa A. Williams. 2017. Crowdsourcing participants for psy-chological research in Australia: A test of Microworkers. Australian PsychologicalSociety 69 (2017), 39–47. Issue 1.
[13] Joost de Winter, Miltos Kyriakidis, Dimitra Dodou, and Riender Happee. 2015.Using CrowdFlower to Study the Relationship between Self-reported Violationsand Traffic Accidents. Procedia Manufacturing 3 (2015), 2518–2525.
[14] Djellel Eddine Difallah, Michele Catasta, Gianluca Demartini, Panagiotis G Ipeiro-tis, and Philippe Cudré-Mauroux. 2015. The Dynamics of Micro-Task Crowd-sourcing: The Case of Amazon MTurk. In Proceedings of the 24th InternationalConference on World Wide Web. International World Wide Web ConferencesSteering Committee, ACM, New York, NY, USA, 238–247.
[15] Karën Fort, Gilles Adda, and K. Bretonnel Cohen. 2011. Amazon MechanicalTurk: Gold Mine or Coal Mine? Computational Linguistics 37 (2011), 413 – 420.Issue 2.
[16] Ilka H. Gleibs. 2017. Are all research fields equal? Rethinking practice for theuse of data from crowd-sourcing market places. Behavior Research Methods 49(August 2017), 1333–1342. Issue 4.
[17] Panagiotis Ipeirotis. 2010. Demographics of Mechanical Turk. Technical ReportCeDER-10-01. New York University.
[18] G. M. Jolly. 1965. Explicit Estimates from Capture-Recapture Data With BothDeath and Immigration- Stochastic Model. Biometrika 52 (1965), 225–247.
[19] Jeremy Kees, Christopher Berry, Scot Burton, and Kim Sheehan. 2017. An Analy-sis of Data Quality: Professional Panels, Student Subject Pools, and Amazon’sMechanical Turk. Journal of Advertising 46, 1 (2017), 141–155.
[20] Frederick Charles Lincoln. 1930. Calculating waterfowl abundance on the basis ofbanding returns. US Dept. of Agriculture, Washington, DC.
[21] Jianguo Lu and Dingding Li. 2010. Estimating deep web data source size bycapture-recapture method. Information Retrieval 13, 1 (February 2010), 70–95.
[22] Winter Mason and Duncan J. Watts. 2009. Financial Incentives and the "Per-formance of Crowds". In Proceedings of the ACM SIGKDD Workshop on HumanComputation (HCOMP ’09). ACM, New York, NY, USA, 77–85.
[23] Joshua D. Miller, Michael Crowe, Brandon Weiss, Jessica L. Maples-Keller, andDonald R. Lynam. 2017. Using online, crowdsourcing platforms for data collectionin personality disorder research: The example of Amazon’s Mechanical Turk.Personality Disorders: Theory, Research, and Treatment 8, 1 (2017), 26–34.
[24] Shirley Pledger, Kenneth H. Pollock, and James L. Norris. 2003. Open Capture-Recapture Models with Heterogeneity: I. Cormack-Jolly-Seber Model. Biometrics59, 4 (Dec. 2003), 786–794.
[25] Shirley Pledger, Kenneth H. Pollock, and James L. Norris. 2010. Open Capture-Recapture Models with Heterogeneity: II. Jolly-Seber Model. Biometrics 66, 3(September 2010), 883–890.
[26] Joel Ross, Lilly Irani, M. Six Silberman, Andrew Zaldivar, and Bill Tomlinson.2010. Who Are the Crowdworkers?: Shifting Demographics in Mechanical Turk.In CHI ’10 Extended Abstracts on Human Factors in Computing Systems (CHI EA’10). ACM, New York, NY, USA, 2863–2872.
[27] Carl James Schwarz and A. Neil Arnason. 1996. A General Methodology for theAnalysis of Capture-Recapture Experiments in Open Populations. Biometrics 52,3 (1996), 860–873.
[28] George Seber. 1982. The Estimation of Animal Abundance and Related Parameters.Charles Griffin, London, UK.
[29] G. A. F. Seber. 1964. A Note on the Multiple Recapture Census. Biometrika 52(1964), 249–259.
[30] Victor S. Sheng, Foster Provost, and Panagiotis G. Ipeirotis. 2008. Get AnotherLabel? Improving Data Quality and Data Mining Using Multiple, Noisy Labelers.In Proceedings of the 14th ACM SIGKDD International Conference on KnowledgeDiscovery and Data Mining (KDD ’08). ACM, New York, NY, USA, 614–622.
[31] Michael Smithson and Jay Verkuilen. 2006. A better lemon squeezer? Maximum-likelihood regression with beta-distributed dependent variables. Psychologicalmethods 11 (2006), 54–71. Issue 1.
[32] Rion Snow, Brendan O’Connor, Daniel Jurafsky, and Andrew Y. Ng. 2008. Cheapand Fast—but is It Good?: Evaluating Non-expert Annotations for Natural Lan-guage Tasks. In Proceedings of the Conference on Empirical Methods in NaturalLanguage Processing (EMNLP ’08). Association for Computational Linguistics,Stroudsburg, PA, USA, 254–263.
[33] Vanessa V. Sochat, Ian W. Eisenberg, A. Zeynep Enkavi, Jamie Li, Patrick G.Bissett, and Russell A. Poldrack. 2016. The Experiment Factory: StandardizingBehavioral Experiments. Frontiers in Psychology 7 (2016), 610.
[34] Neil Stewart, Christoph Ungemach, Adam J. L. Harris, Daniel M. Bartels, Ben R.Newell, Gabriele Paolaccik, and Jesse Chandler. 2015. The average laboratorysamples a population of 7,300 Amazon Mechanical Turk workers. Judgment andDecision Making 10, 5 (2015), 479–491.
[35] Keela S. Thomson and Daniel M. Oppenheimer. 2016. Investigating an alternateform of the cognitive reflection test. Judgment and Decision Making 11, 1 (2016),99–113.
[36] Beth Trushkowsky, Tim Kraska, Michael J. Franklin, and Purnamrita Sarkar. 2016.Answering Enumeration Queries with the Crowd. Commun. ACM 59, 1 (2016),118–127.


![[XLS] · Web viewSheet3 Sheet2 Sheet1 1300-011X 8036 TURK J BIOCHEM 0250-4685 8037 TURK J BIOL 1300-0152 8038 TURK J BOT 1300-008X 8039 TURK J CHEM 1300-0527 8040 TURK J EARTH SCI](https://img.pdfslide.us/doc/110x75/5af81b2d7f8b9aac248cac78/xls-viewsheet3-sheet2-sheet1-1300-011x-8036-turk-j-biochem-0250-4685-8037-turk.jpg)