Embed Size (px)
Citation preview
Demographic Trends in Texas: Wimberley Texas
Wimberley Chamber of Commerce
January 21, 2015Wimberley, Texas
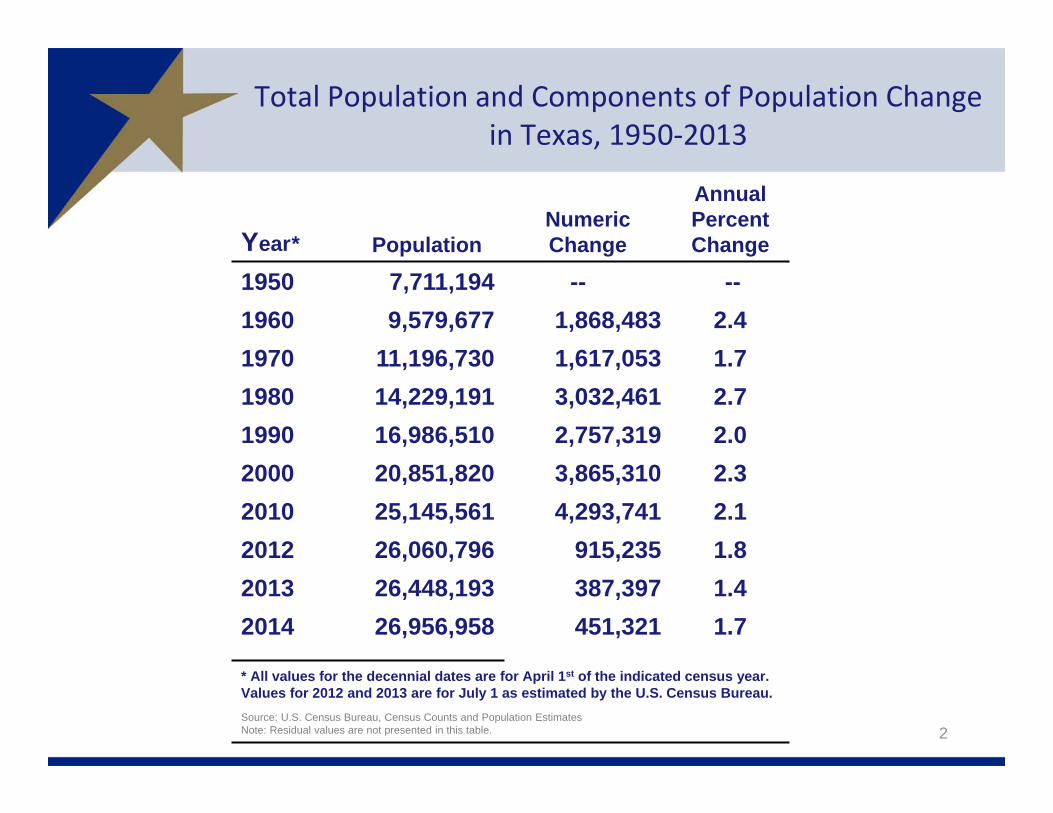
Year* PopulationNumericChange
AnnualPercentChange
1950 7,711,194 -- --1960 9,579,677 1,868,483 2.41970 11,196,730 1,617,053 1.71980 14,229,191 3,032,461 2.71990 16,986,510 2,757,319 2.02000 20,851,820 3,865,310 2.32010 25,145,561 4,293,741 2.12012 26,060,796 915,235 1.82013 26,448,193 387,397 1.42014 26,956,958 451,321 1.7
* All values for the decennial dates are for April 1st of the indicated census year. Values for 2012 and 2013 are for July 1 as estimated by the U.S. Census Bureau. Source: U.S. Census Bureau, Census Counts and Population EstimatesNote: Residual values are not presented in this table.
Total Population and Components of Population Change in Texas, 1950‐2013
2
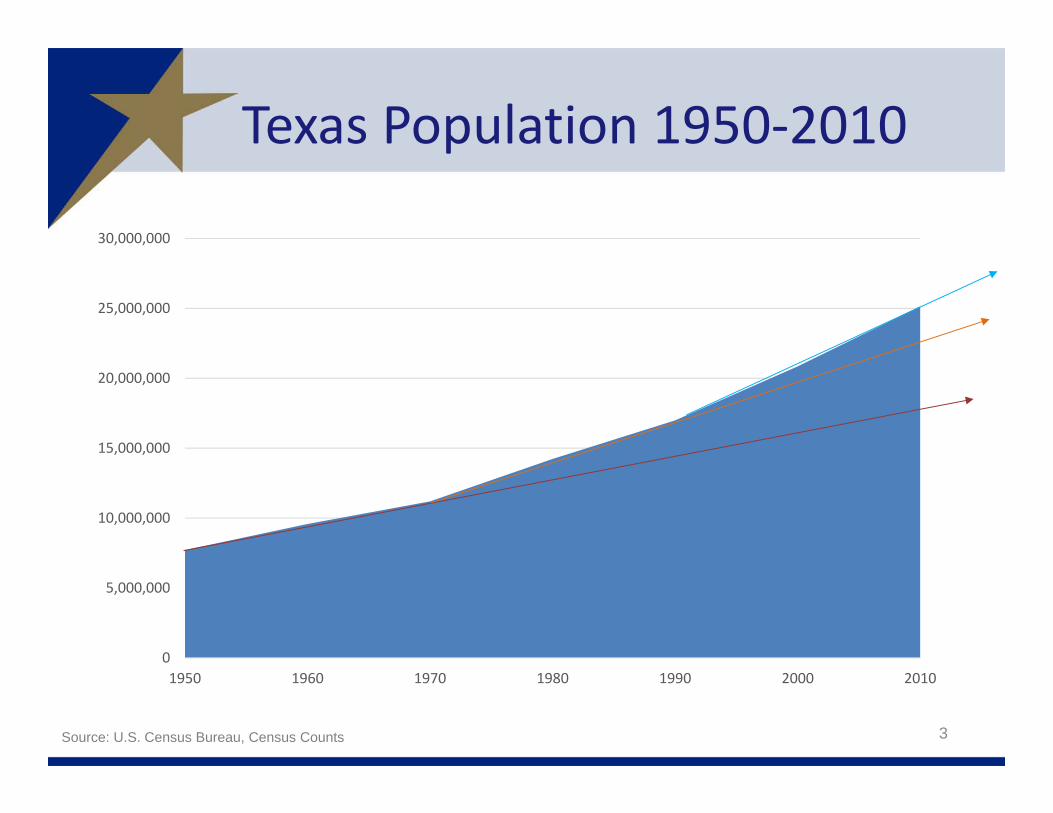
Texas Population 1950‐2010
0
5,000,000
10,000,000
15,000,000
20,000,000
25,000,000
30,000,000
1950 1960 1970 1980 1990 2000 2010
3Source: U.S. Census Bureau, Census Counts
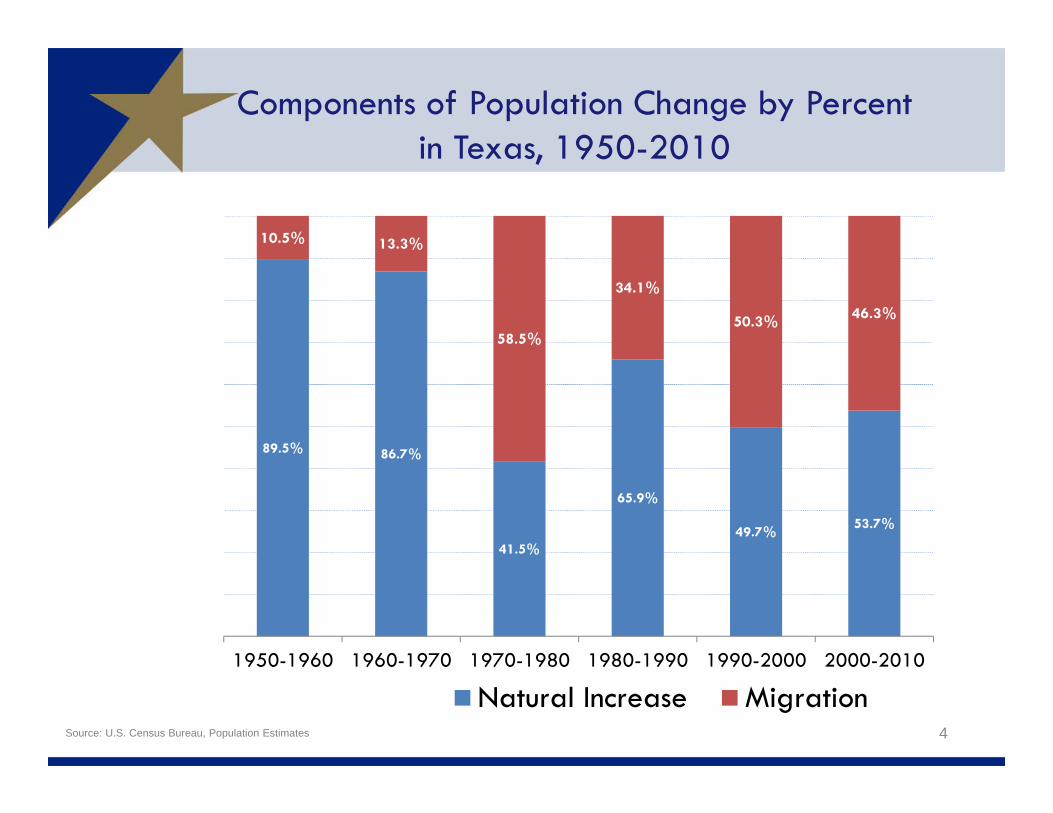
Components of Population Change by Percent in Texas, 1950-2010
4
89.5% 86.7%
41.5%
65.9%
49.7% 53.7%
10.5% 13.3%
58.5%
34.1%
50.3% 46.3%
1950-1960 1960-1970 1970-1980 1980-1990 1990-2000 2000-2010
Natural Increase MigrationSource: U.S. Census Bureau, Population Estimates
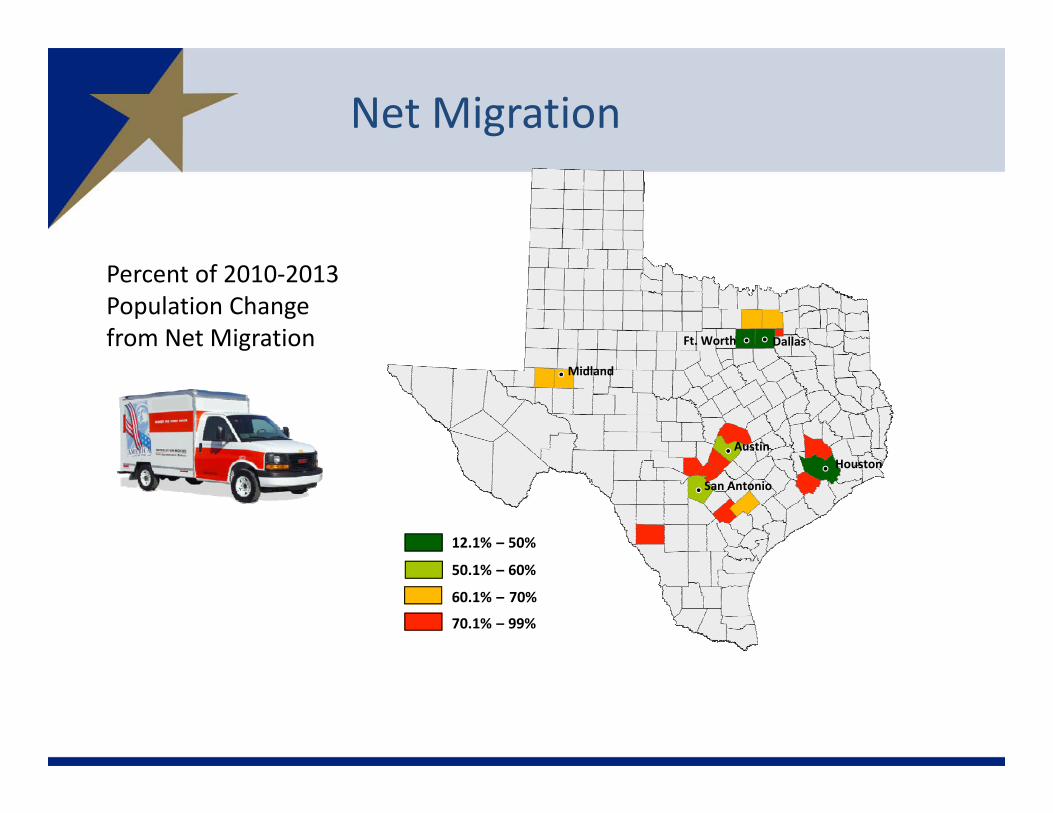
Net Migration
12.1% – 50%
50.1% – 60%
60.1% – 70%
70.1% – 99%
Percent of 2010‐2013 Population Change from Net Migration Dallas
HoustonAustin
San Antonio
Ft. Worth
Midland
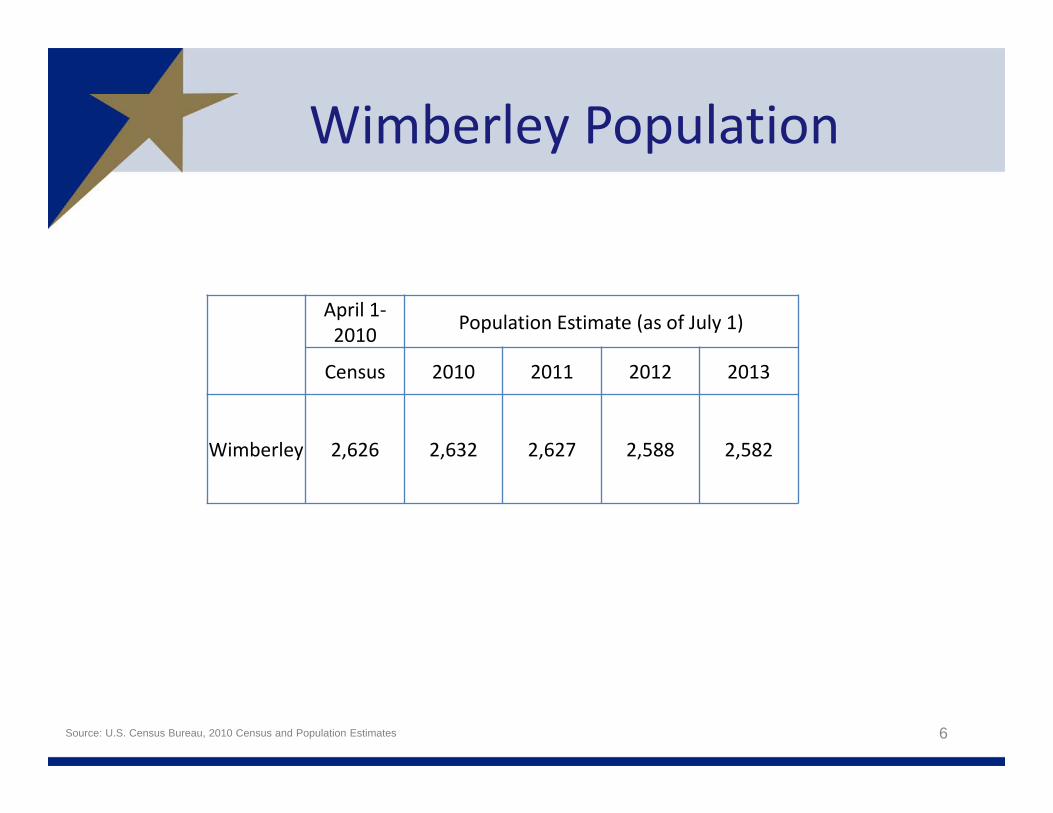
Wimberley Population
6
April 1‐2010 Population Estimate (as of July 1)
Census 2010 2011 2012 2013
Wimberley 2,626 2,632 2,627 2,588 2,582
Source: U.S. Census Bureau, 2010 Census and Population Estimates
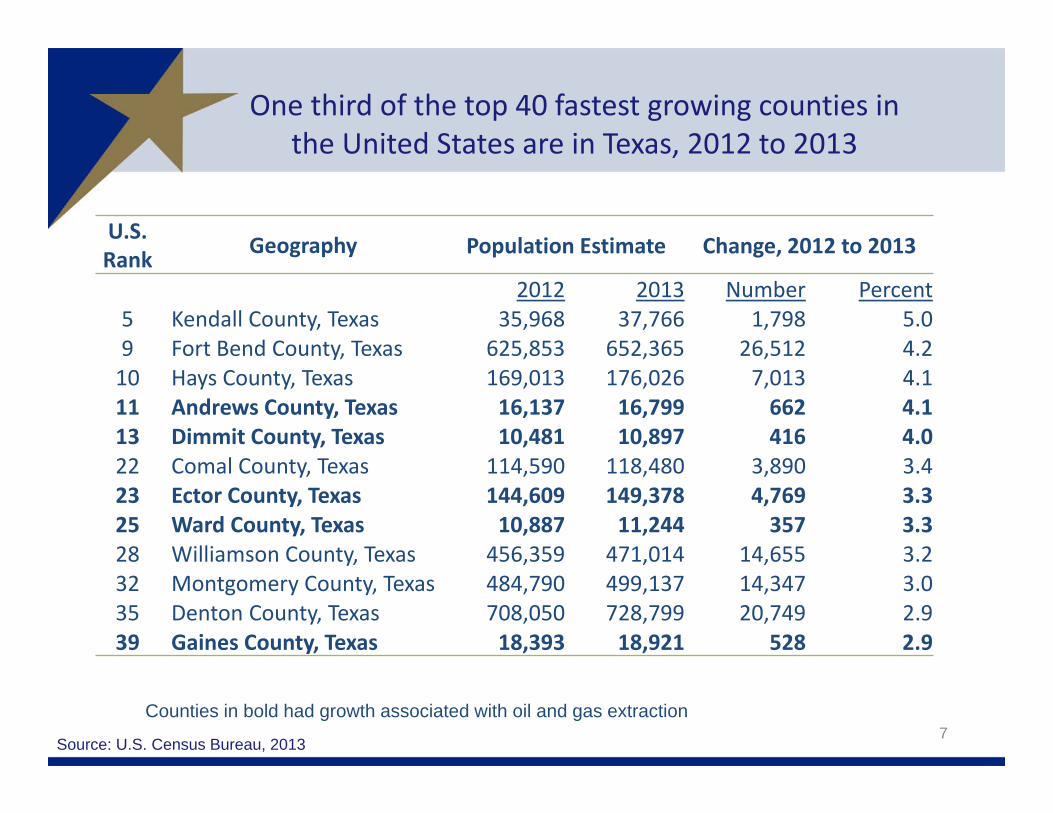
One third of the top 40 fastest growing counties in the United States are in Texas, 2012 to 2013
7Source: U.S. Census Bureau, 2013
U.S.Rank Geography Population Estimate Change, 2012 to 2013
2012 2013 Number Percent5 Kendall County, Texas 35,968 37,766 1,798 5.09 Fort Bend County, Texas 625,853 652,365 26,512 4.210 Hays County, Texas 169,013 176,026 7,013 4.111 Andrews County, Texas 16,137 16,799 662 4.113 Dimmit County, Texas 10,481 10,897 416 4.022 Comal County, Texas 114,590 118,480 3,890 3.423 Ector County, Texas 144,609 149,378 4,769 3.325 Ward County, Texas 10,887 11,244 357 3.328 Williamson County, Texas 456,359 471,014 14,655 3.232 Montgomery County, Texas 484,790 499,137 14,347 3.035 Denton County, Texas 708,050 728,799 20,749 2.939 Gaines County, Texas 18,393 18,921 528 2.9
Counties in bold had growth associated with oil and gas extraction
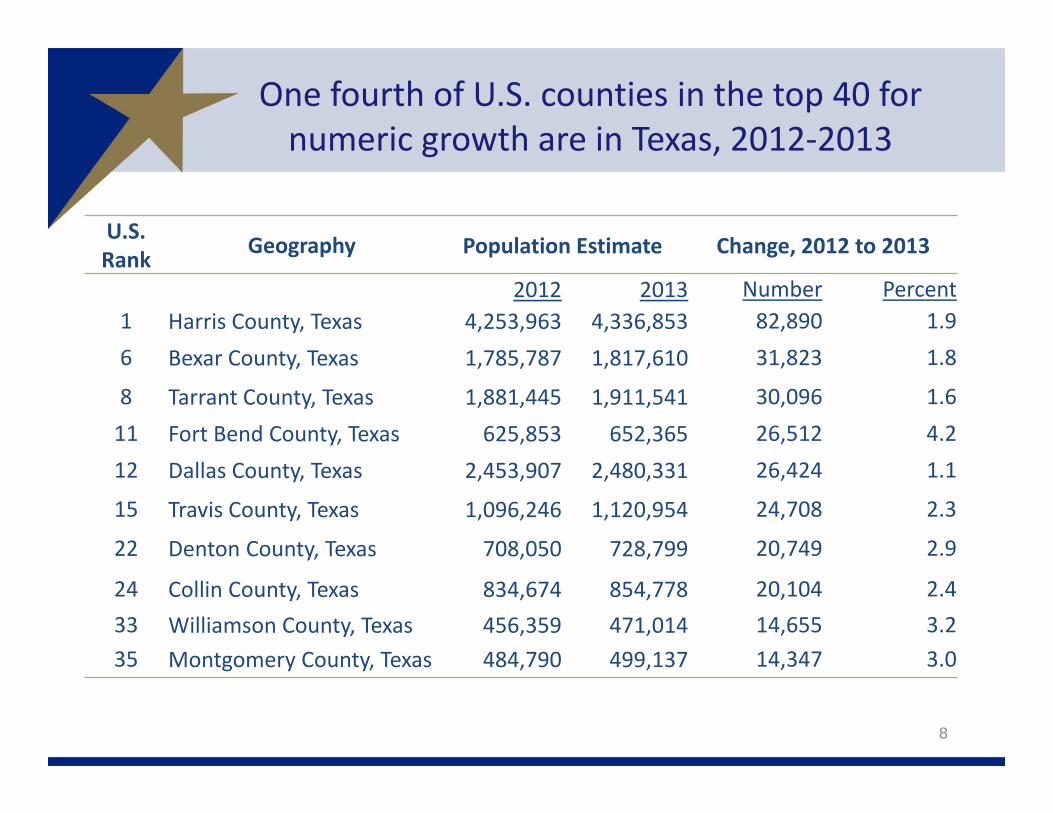
One fourth of U.S. counties in the top 40 for numeric growth are in Texas, 2012‐2013
8
U.S.Rank Geography Population Estimate Change, 2012 to 2013
2012 2013 Number Percent1 Harris County, Texas 4,253,963 4,336,853 82,890 1.96 Bexar County, Texas 1,785,787 1,817,610 31,823 1.8
8 Tarrant County, Texas 1,881,445 1,911,541 30,096 1.611 Fort Bend County, Texas 625,853 652,365 26,512 4.212 Dallas County, Texas 2,453,907 2,480,331 26,424 1.1
15 Travis County, Texas 1,096,246 1,120,954 24,708 2.3
22 Denton County, Texas 708,050 728,799 20,749 2.9
24 Collin County, Texas 834,674 854,778 20,104 2.433 Williamson County, Texas 456,359 471,014 14,655 3.235 Montgomery County, Texas 484,790 499,137 14,347 3.0
Dallas
Howard
FoardFloyd
Brewster
FranklinHunt
Newton
Starr
Kinney
Collingsworth
TomGreen
Coleman
Brazoria
Leon
Duval
Lamb
Morris
Smith
Jackson
Medina
Wheeler
Dallam
Callahan
Lamar
Coryell
Gaines
Kendall
Nacogdoches
Milam
Hays
Willacy
Johnson
Reagan
Webb
Shackelford
Bowie
Scurry
Kenedy
Somervell
Oldham
Taylor
King
Borden
Walker
Stephens
DeafSmith
Roberts
Tyler
ValVerde
Brown
Parker
Harris
Zapata
RedRiver
Karnes
PaloPinto
GlasscockShelby
Wood
Crosby
Refugio
Burnet
Sterling
Montgomery
SanAugustine
Rains
Nueces
Jack
Swisher
Camp
Brazos
Orange
Colorado
Pecos
Cochran
Parmer
FreestoneWinkler
Wichita
Gray
Schleicher
Hardeman
TravisGillespie
Yoakum
Fayette
Uvalde
Grimes
VanZandt
Throckmorton
Falls
Grayson
Ellis
Hall
Dickens
Trinity
Reeves
Marion
Terrell
Lynn
La Salle
Jasper
Jones
Castro
Victoria
Kleberg
Briscoe
Clay
Matagorda
Brooks
Runnels
Carson
Liberty
Lee
Hale
Bexar
Garza
Montague
Upton
Hamilton
FisherDawson
Dimmit
Limestone
Hutchinson
Llano
Presidio
Eastland
Sabine
Wharton
Rusk
Tarrant
Lavaca
Childress
Hidalgo
Kaufman
Moore
Menard
Edwards
SanPatricio
Terry
Crockett
Houston
Waller
Coke
Ward
Titus
Lampasas
Haskell
Martin
Atascosa
HemphillHartley
Young
BurlesonHardin
Gonzales
McMullen
Erath
Galveston
McLennan
Madison
McCulloch
Donley
Kent
Real
Sutton
Midland
Hudspeth
Zavala
Harrison
ComancheMitchell Navarro
Crane
Lubbock
Wise
Washington
JeffDavis
El Paso
Gregg
Williamson
Lipscomb
Mason
Henderson
Hansford
Chambers
Hill
Potter
JimWells
DeltaStonewall
Ector
Cameron
Maverick
Collin
Baylor
Panola
Guadalupe
Bastrop
Austin
Andrews
Anderson
Blanco
DeWitt
Bandera
Bell
Aransas
Archer
Armstrong
Bee
Bailey
Jefferson
Frio
Fannin
Goliad
Loving
Cass
FortBend
Bosque
Hockley
SanSaba
Kerr
Mills
Cooke
Wilbarger
Irion
Caldwell
JimHogg
Culberson
Upshur
Cherokee
Denton
Concho
Randall
Kimble
Knox
Polk
Hood
SanJacinto
Robertson
Wilson
Nolan
Cottle
Calhoun
Rockwall
LiveOak
Motley
Sherman Ochiltree
Comal
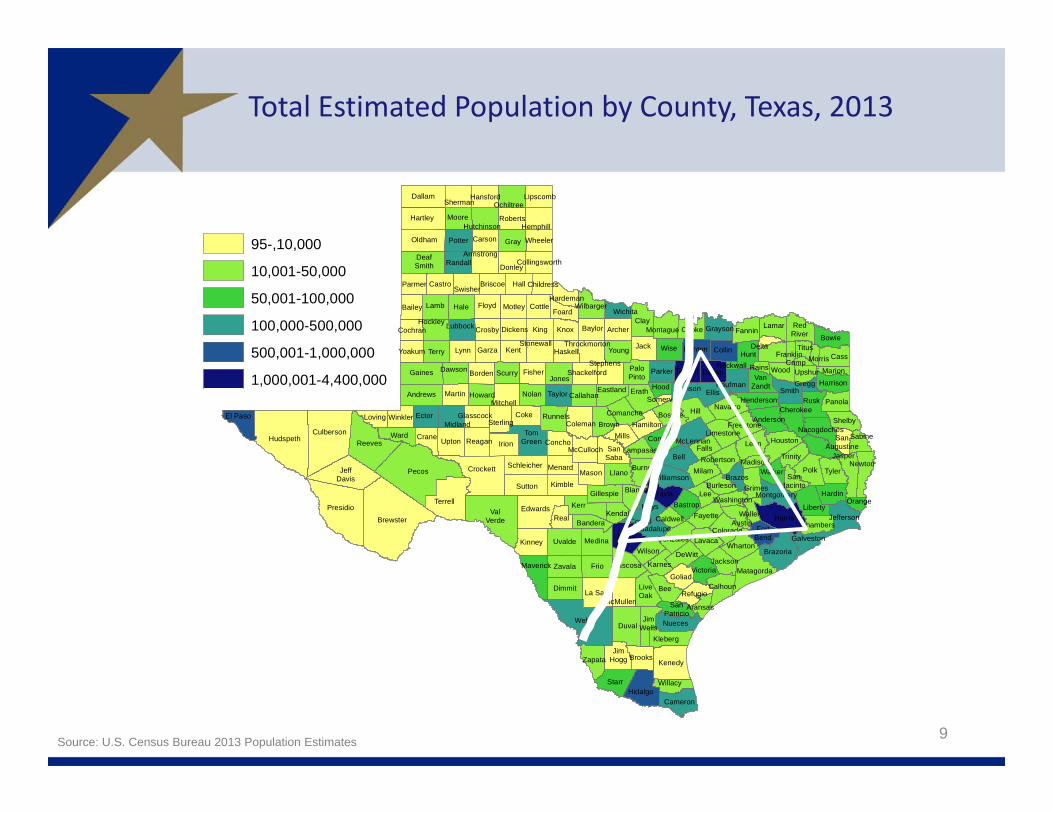
Total Estimated Population by County, Texas, 2013
9Source: U.S. Census Bureau 2013 Population Estimates
95-,10,000
10,001-50,000
50,001-100,000
100,000-500,000
500,001-1,000,000
1,000,001-4,400,000
Dallas
Howard
FoardFloyd
Brewster
FranklinHunt
Newton
Starr
Kinney
Collingsworth
TomGreen
Coleman
Brazoria
Leon
Duval
Lamb
Morris
Smith
Jackson
Medina
Wheeler
Dallam
Callahan
Lamar
Coryell
Gaines
Kendall
Nacogdoches
Milam
Hays
Willacy
Johnson
Reagan
Webb
Shackelford
Bowie
Scurry
Kenedy
Somervell
Oldham
Taylor
King
Borden
Walker
Stephens
DeafSmith
Roberts
Tyler
ValVerde
Brown
Parker
Harris
Zapata
RedRiver
Karnes
PaloPinto
GlasscockShelby
Wood
Crosby
Refugio
Burnet
Sterling
Montgomery
SanAugustine
Rains
Nueces
Jack
Swisher
Camp
Brazos
Orange
Colorado
Pecos
Cochran
Parmer
FreestoneWinkler
Wichita
Gray
Schleicher
Hardeman
TravisGillespie
Yoakum
Fayette
Uvalde
Grimes
VanZandt
Throckmorton
Falls
Grayson
Ellis
Hall
Dickens
Trinity
Reeves
Marion
Terrell
Lynn
La Salle
Jasper
Jones
Castro
Victoria
Kleberg
Briscoe
Clay
Matagorda
Brooks
Runnels
Carson
Liberty
Lee
Hale
Bexar
Garza
Montague
Upton
Hamilton
FisherDawson
Dimmit
Limestone
Hutchinson
Llano
Presidio
Eastland
Sabine
Wharton
Rusk
Tarrant
Lavaca
Childress
Hidalgo
Kaufman
Moore
Menard
Edwards
SanPatricio
Terry
Crockett
Houston
Waller
Coke
Ward
Titus
Lampasas
Haskell
Martin
Atascosa
HemphillHartley
Young
BurlesonHardin
Gonzales
McMullen
Erath
Galveston
McLennan
Madison
McCulloch
Donley
Kent
Real
Sutton
Midland
Hudspeth
Zavala
Harrison
ComancheMitchell Navarro
Crane
Lubbock
Wise
Washington
JeffDavis
El Paso
Gregg
Williamson
Lipscomb
Mason
Henderson
Hansford
Chambers
Hill
Potter
JimWells
DeltaStonewall
Ector
Cameron
Maverick
Collin
Baylor
Panola
Guadalupe
Bastrop
Austin
Andrews
Anderson
Blanco
DeWitt
Bandera
Bell
Aransas
Archer
Armstrong
Bee
Bailey
Jefferson
Frio
Fannin
Goliad
Loving
Cass
FortBend
Bosque
Hockley
SanSaba
Kerr
Mills
Cooke
Wilbarger
Irion
Caldwell
JimHogg
Culberson
Upshur
Cherokee
Denton
Concho
Randall
Kimble
Knox
Polk
Hood
SanJacinto
Robertson
Wilson
Nolan
Cottle
Calhoun
Rockwall
LiveOak
Motley
Sherman Ochiltree
Comal
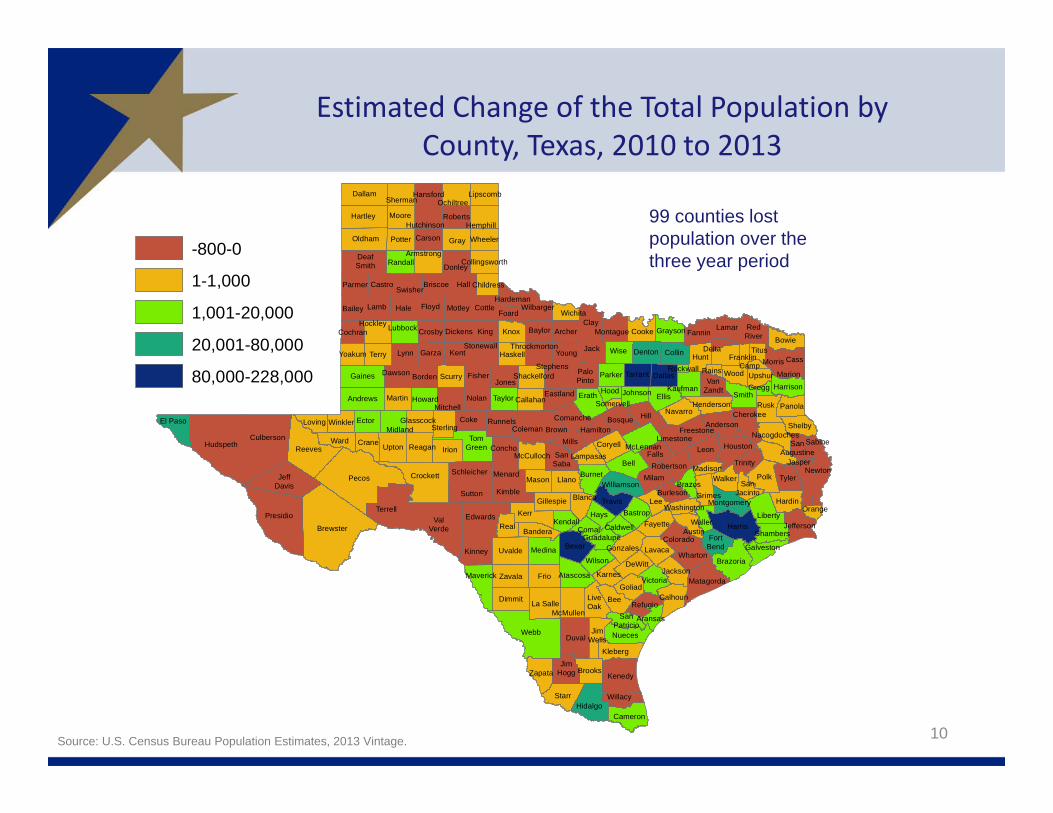
Estimated Change of the Total Population by County, Texas, 2010 to 2013
10Source: U.S. Census Bureau Population Estimates, 2013 Vintage.
99 counties lost population over the three year period-800-0
1-1,000
1,001-20,000
20,001-80,000
80,000-228,000
Dallas
Howard
FoardFloyd
Brewster
FranklinHunt
Newton
Starr
Kinney
Collingsworth
TomGreen
Coleman
Brazoria
Leon
Duval
Lamb
Morris
Smith
Jackson
Medina
Wheeler
Dallam
Callahan
Lamar
Coryell
Gaines
Kendall
Nacogdoches
Milam
Hays
Willacy
Johnson
Reagan
Webb
Shackelford
Bowie
Scurry
Kenedy
Somervell
Oldham
Taylor
King
Borden
Walker
Stephens
DeafSmith
Roberts
Tyler
ValVerde
Brown
Parker
Harris
Zapata
RedRiver
Karnes
PaloPinto
GlasscockShelby
Wood
Crosby
Refugio
Burnet
Sterling
Montgomery
SanAugustine
Rains
Nueces
Jack
Swisher
Camp
Brazos
Orange
Colorado
Pecos
Cochran
Parmer
FreestoneWinkler
Wichita
Gray
Schleicher
Hardeman
TravisGillespie
Yoakum
Fayette
Uvalde
Grimes
VanZandt
Throckmorton
Falls
Grayson
Ellis
Hall
Dickens
Trinity
Reeves
Marion
Terrell
Lynn
La Salle
Jasper
Jones
Castro
Victoria
Kleberg
Briscoe
Clay
Matagorda
Brooks
Runnels
Carson
Liberty
Lee
Hale
Bexar
Garza
Montague
Upton
Hamilton
FisherDawson
Dimmit
Limestone
Hutchinson
Llano
Presidio
Eastland
Sabine
Wharton
Rusk
Tarrant
Lavaca
Childress
Hidalgo
Kaufman
Moore
Menard
Edwards
SanPatricio
Terry
Crockett
Houston
Waller
Coke
Ward
Titus
Lampasas
Haskell
Martin
Atascosa
HemphillHartley
Young
BurlesonHardin
Gonzales
McMullen
Erath
Galveston
McLennan
Madison
McCulloch
Donley
Kent
Real
Sutton
Midland
Hudspeth
Zavala
Harrison
ComancheMitchell Navarro
Crane
Lubbock
Wise
Washington
JeffDavis
El Paso
Gregg
Williamson
Lipscomb
Mason
Henderson
Hansford
Chambers
Hill
Potter
JimWells
DeltaStonewall
Ector
Cameron
Maverick
Collin
Baylor
Panola
Guadalupe
Bastrop
Austin
Andrews
Anderson
Blanco
DeWitt
Bandera
Bell
Aransas
Archer
Armstrong
Bee
Bailey
Jefferson
Frio
Fannin
Goliad
Loving
Cass
FortBend
Bosque
Hockley
SanSaba
Kerr
Mills
Cooke
Wilbarger
Irion
Caldwell
JimHogg
Culberson
Upshur
Cherokee
Denton
Concho
Randall
Kimble
Knox
Polk
Hood
SanJacinto
Robertson
Wilson
Nolan
Cottle
Calhoun
Rockwall
LiveOak
Motley
Sherman Ochiltree
Comal
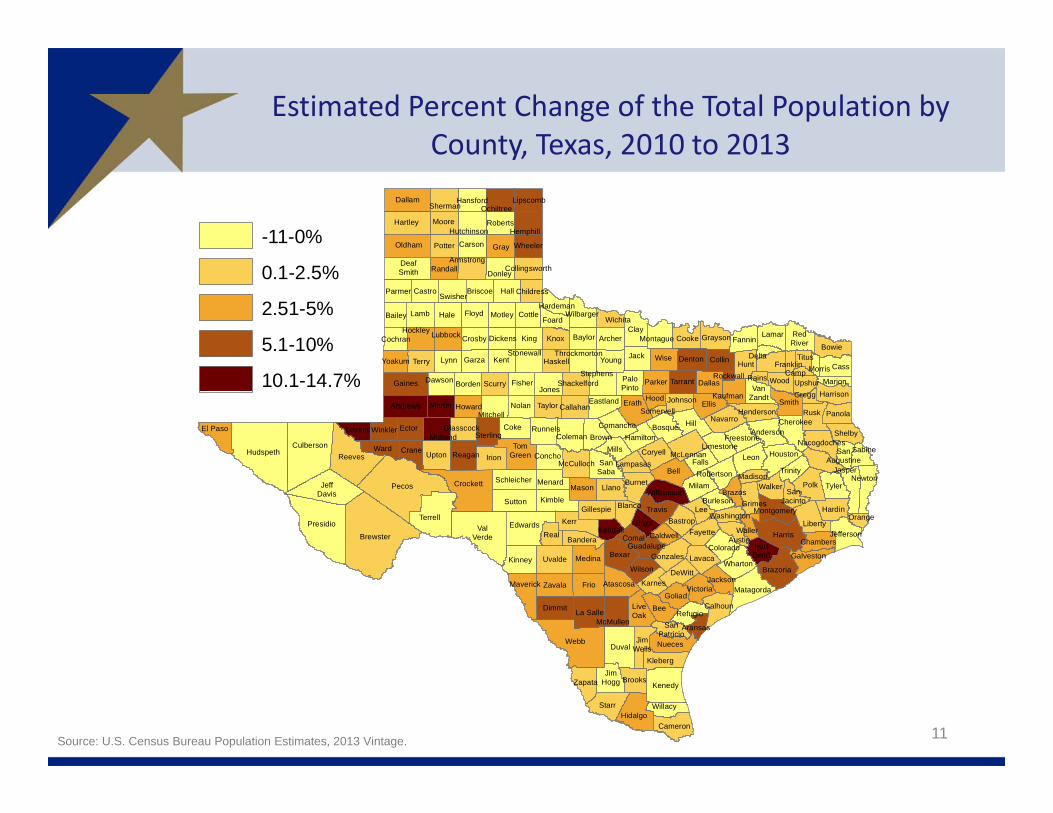
Estimated Percent Change of the Total Population by County, Texas, 2010 to 2013
11Source: U.S. Census Bureau Population Estimates, 2013 Vintage.
-11-0%
0.1-2.5%
2.51-5%
5.1-10%
10.1-14.7%
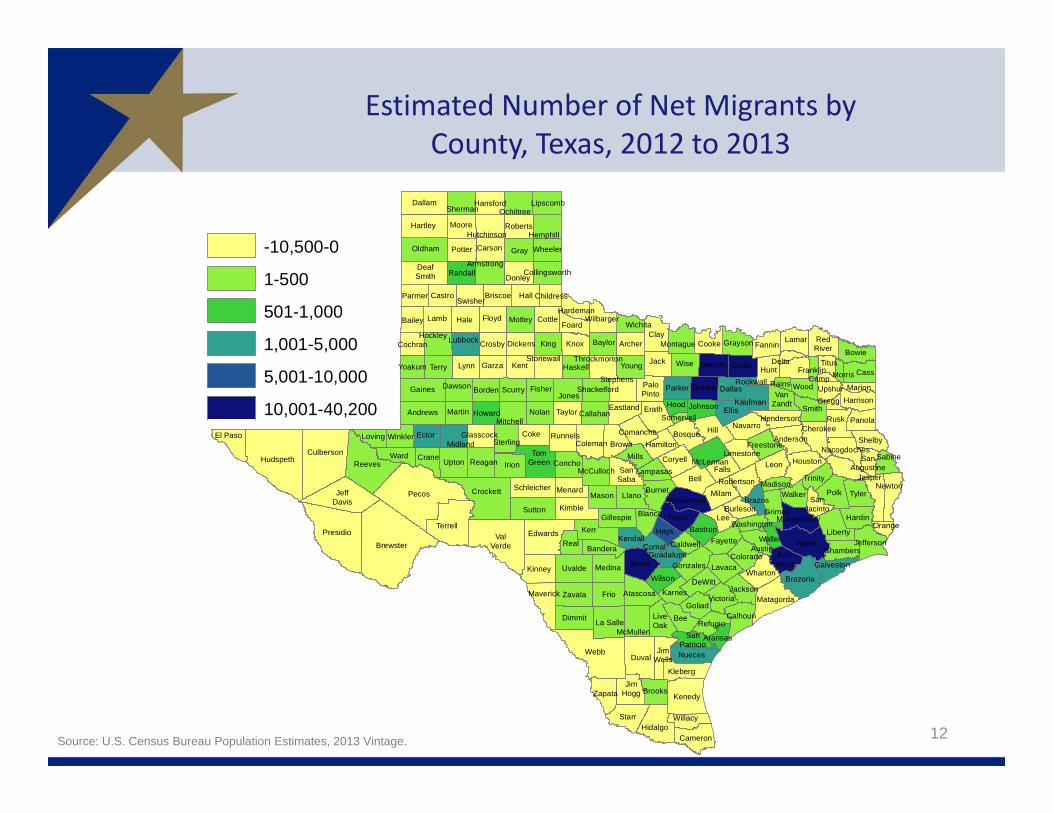
Estimated Number of Net Migrants by County, Texas, 2012 to 2013
12Source: U.S. Census Bureau Population Estimates, 2013 Vintage.
Dallas
Howard
FoardFloyd
Brewster
FranklinHunt
Newton
Starr
Kinney
Collingsworth
TomGreen
Coleman
Brazoria
Leon
Duval
Lamb
Morris
Smith
Jackson
Medina
Wheeler
Dallam
Callahan
Lamar
Coryell
Gaines
Kendall
Nacogdoches
Milam
Hays
Willacy
Johnson
Reagan
Webb
Shackelford
Bowie
Scurry
Kenedy
Somervell
Oldham
Taylor
King
Borden
Walker
Stephens
DeafSmith
Roberts
Tyler
ValVerde
Brown
Parker
Harris
Zapata
RedRiver
Karnes
PaloPinto
GlasscockShelby
Wood
Crosby
Refugio
Burnet
Sterling
Montgomery
SanAugustine
Rains
Nueces
Jack
Swisher
Camp
Brazos
Orange
Colorado
Pecos
Cochran
Parmer
FreestoneWinkler
Wichita
Gray
Schleicher
Hardeman
TravisGillespie
Yoakum
Fayette
Uvalde
Grimes
VanZandt
Throckmorton
Falls
Grayson
Ellis
Hall
Dickens
Trinity
Reeves
Marion
Terrell
Lynn
La Salle
Jasper
Jones
Castro
Victoria
Kleberg
Briscoe
Clay
Matagorda
Brooks
Runnels
Carson
Liberty
Lee
Hale
Bexar
Garza
Montague
Upton
Hamilton
FisherDawson
Dimmit
Limestone
Hutchinson
Llano
Presidio
Eastland
Sabine
Wharton
Rusk
Tarrant
Lavaca
Childress
Hidalgo
Kaufman
Moore
Menard
Edwards
SanPatricio
Terry
Crockett
Houston
Waller
Coke
Ward
Titus
Lampasas
Haskell
Martin
Atascosa
HemphillHartley
Young
BurlesonHardin
Gonzales
McMullen
Erath
Galveston
McLennan
Madison
McCulloch
Donley
Kent
Real
Sutton
Midland
Hudspeth
Zavala
Harrison
ComancheMitchell Navarro
Crane
Lubbock
Wise
Washington
JeffDavis
El Paso
Gregg
Williamson
Lipscomb
Mason
Henderson
Hansford
Chambers
Hill
Potter
JimWells
DeltaStonewall
Ector
Cameron
Maverick
Collin
Baylor
Panola
Guadalupe
Bastrop
Austin
Andrews
Anderson
Blanco
DeWitt
Bandera
Bell
Aransas
Archer
Armstrong
Bee
Bailey
Jefferson
Frio
Fannin
Goliad
Loving
Cass
FortBend
Bosque
Hockley
SanSaba
Kerr
Mills
Cooke
Wilbarger
Irion
Caldwell
JimHogg
Culberson
Upshur
Cherokee
Denton
Concho
Randall
Kimble
Knox
Polk
Hood
SanJacinto
Robertson
Wilson
Nolan
Cottle
Calhoun
Rockwall
LiveOak
Motley
Sherman Ochiltree
Comal
-10,500-0
1-500
501-1,000
1,001-5,000
5,001-10,000
10,001-40,200
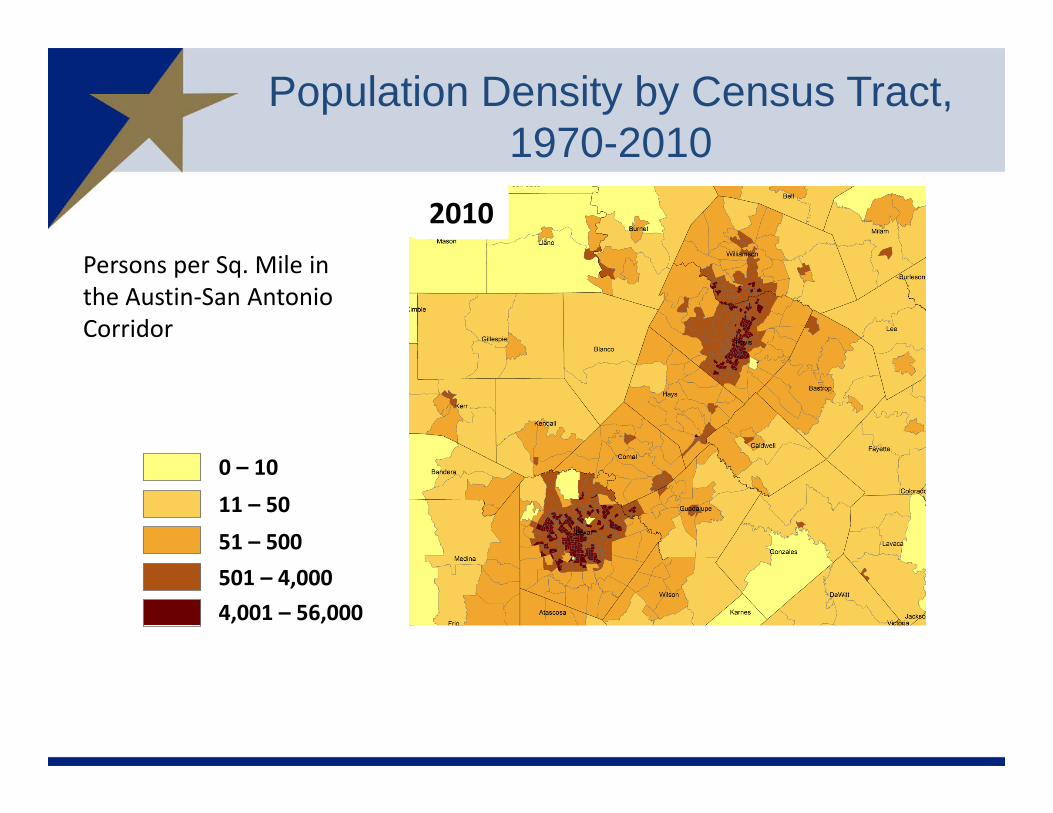
Persons per Sq. Mile in the Austin‐San Antonio Corridor
0 – 1011 – 5051 – 500 501 – 4,0004,001 – 56,000
19701980199020002010
Population Density by Census Tract, 1970-2010
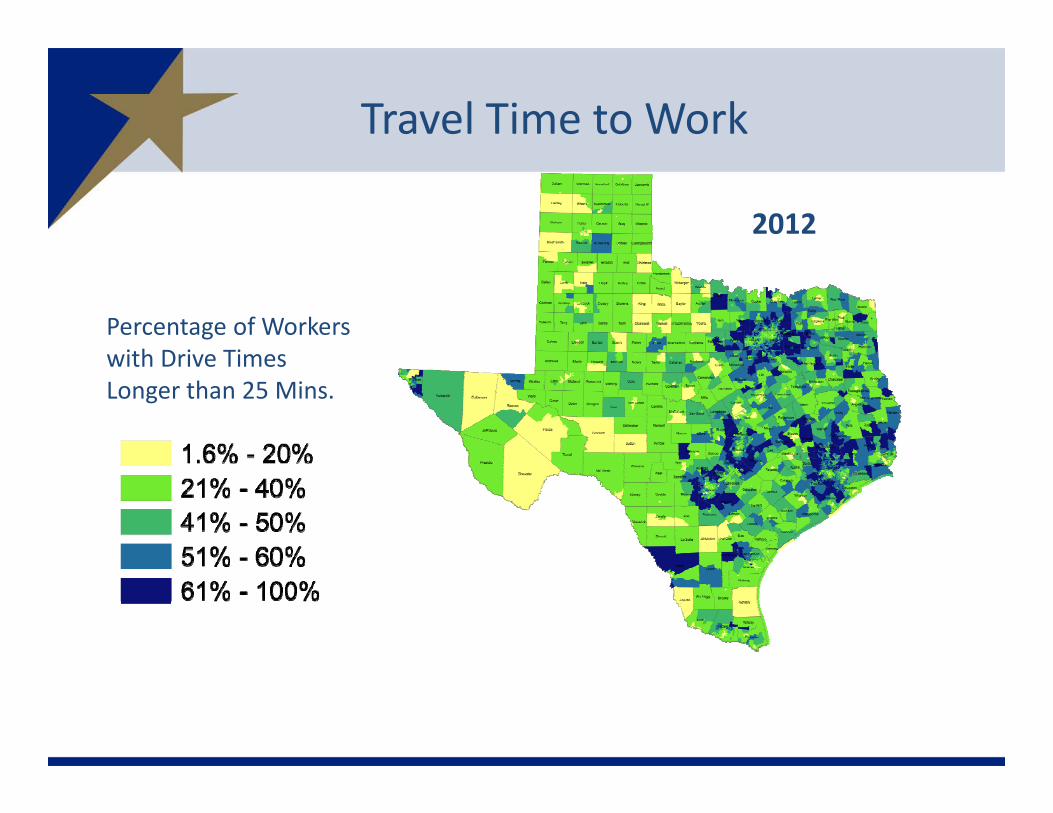
Travel Time to Work
Percentage of Workers with Drive TimesLonger than 25 Mins.
19902012
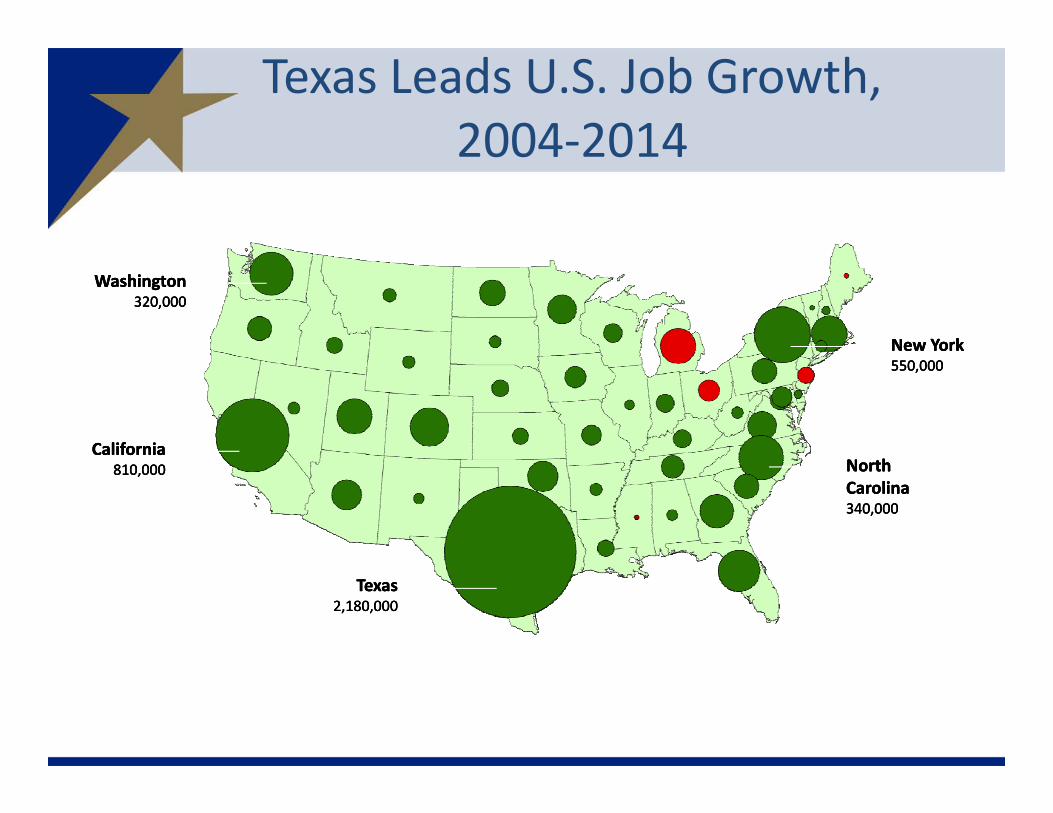
Texas Leads U.S. Job Growth, 2004‐2014
Texas2,180,000
Texas2,180,000
California810,000
California810,000 North
Carolina340,000
North Carolina340,000
New York550,000New York550,000
Washington320,000
Washington320,000
Texas2,180,000
California810,000 North
Carolina340,000
New York550,000
Washington320,000
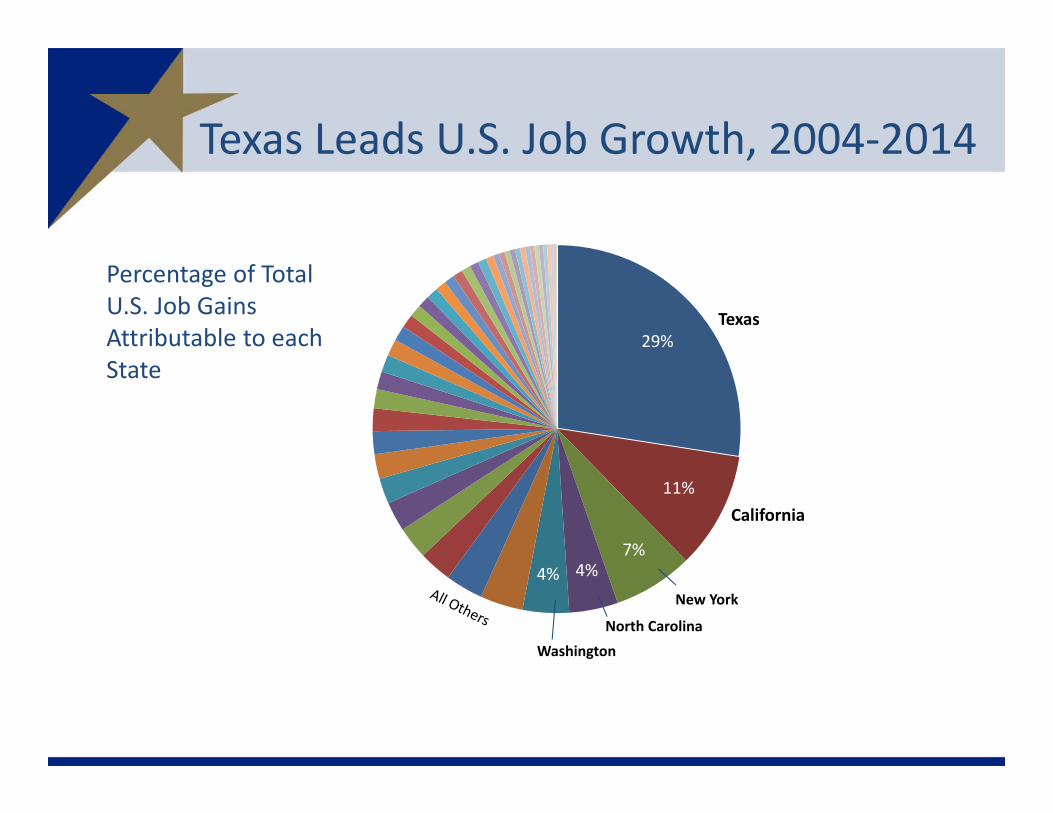
Texas Leads U.S. Job Growth, 2004‐2014
29%
11%
7%4%
Texas
California
New York
North CarolinaWashington
4%
Percentage of Total U.S. Job Gains Attributable to each State
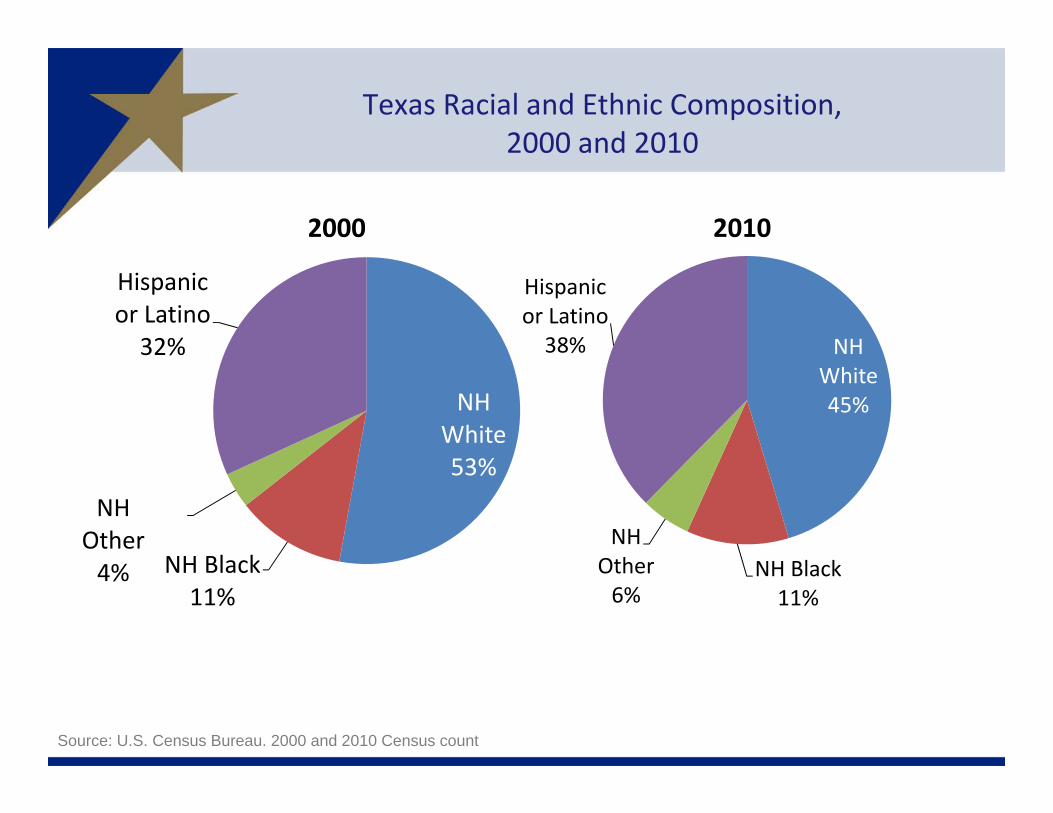
Texas Racial and Ethnic Composition, 2000 and 2010
NH White53%
NH Black11%
NH Other4%
Hispanic or Latino32%
2000
NH White45%
NH Black11%
NH Other6%
Hispanic or Latino38%
2010
Source: U.S. Census Bureau. 2000 and 2010 Census count
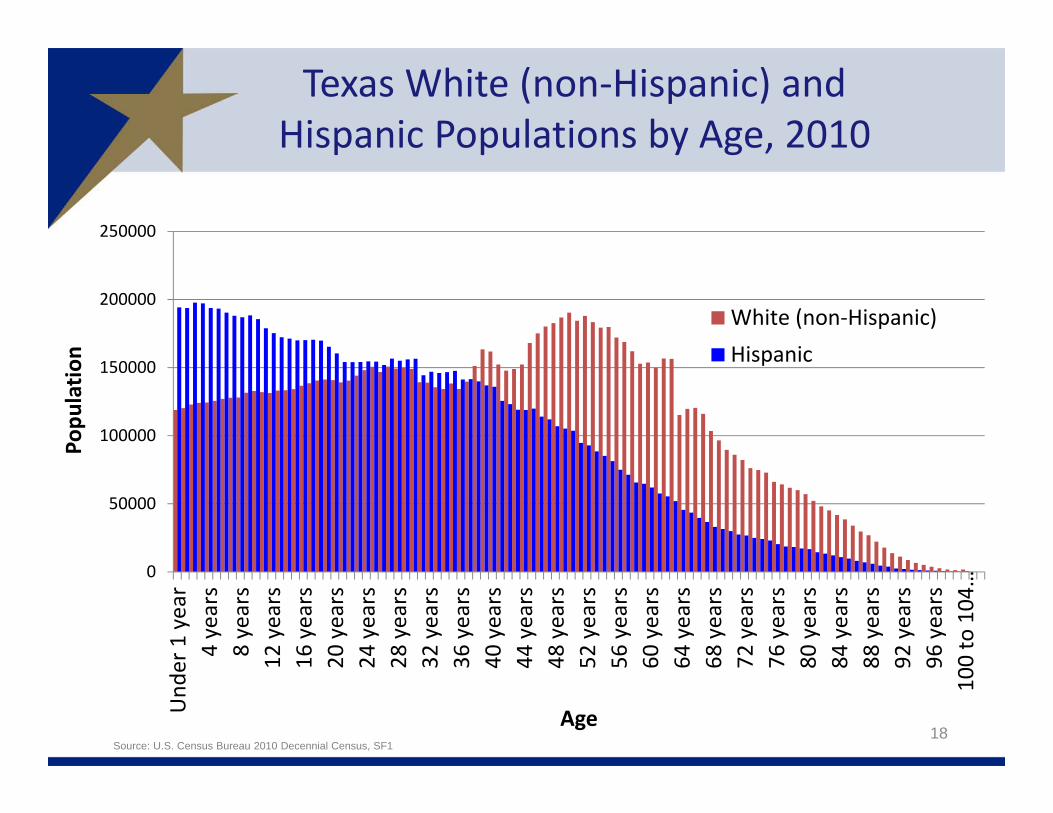
Texas White (non‐Hispanic) and Hispanic Populations by Age, 2010
0
50000
100000
150000
200000
250000
Und
er 1 year
4 years
8 years
12 years
16 years
20 years
24 years
28 years
32 years
36 years
40 years
44 years
48 years
52 years
56 years
60 years
64 years
68 years
72 years
76 years
80 years
84 years
88 years
92 years
96 years
100 to 104…
Popu
latio
n
Age
White (non‐Hispanic)Hispanic
18Source: U.S. Census Bureau 2010 Decennial Census, SF1
200,000 150,000 100,000 50,000 0 50,000 100,000 150,000 200,000Under 1 year
5 years
10 years
15 years
20 years
25 years
30 years
35 years
40 years
45 years
50 years
55 years
60 years
65 years
70 years
75 years
80 years
85 years
90 years
95 years
100 to 104 years
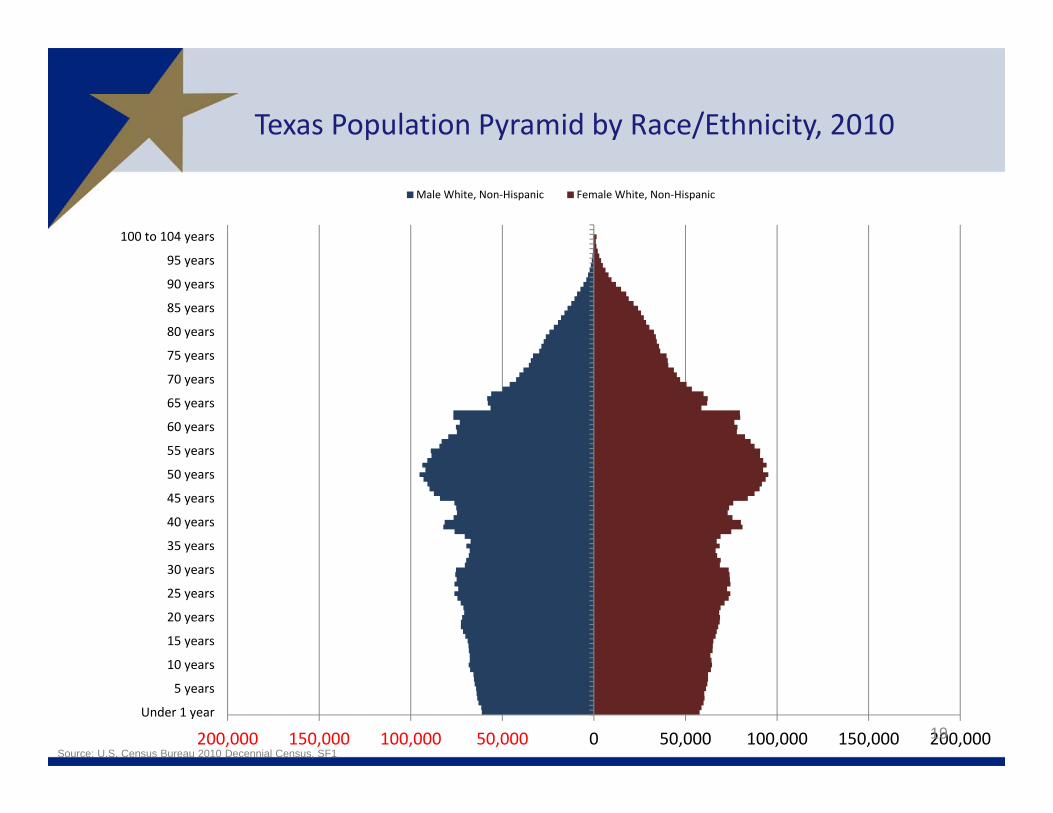
Male White, Non‐Hispanic Female White, Non‐Hispanic
19
Texas Population Pyramid by Race/Ethnicity, 2010
Source: U.S. Census Bureau 2010 Decennial Census, SF1
200,000 150,000 100,000 50,000 0 50,000 100,000 150,000 200,000Under 1 year
5 years
10 years
15 years
20 years
25 years
30 years
35 years
40 years
45 years
50 years
55 years
60 years
65 years
70 years
75 years
80 years
85 years
90 years
95 years
100 to 104 years
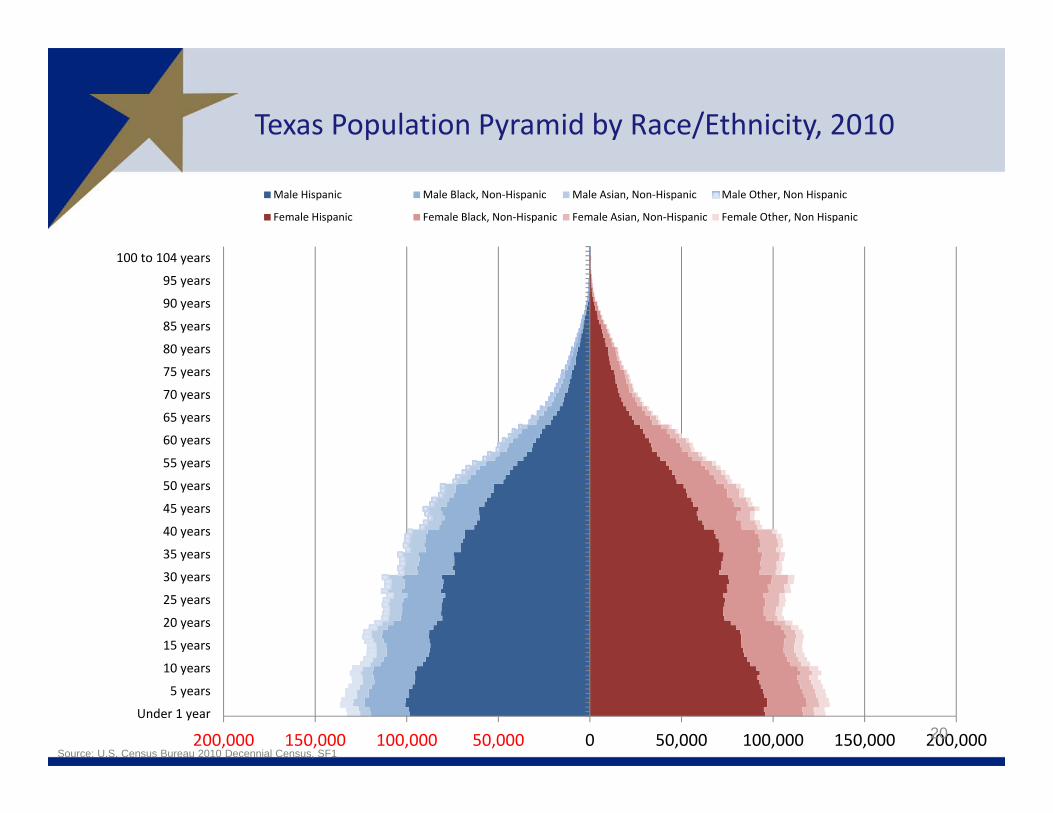
Male Hispanic Male Black, Non‐Hispanic Male Asian, Non‐Hispanic Male Other, Non Hispanic
Female Hispanic Female Black, Non‐Hispanic Female Asian, Non‐Hispanic Female Other, Non Hispanic
20
Texas Population Pyramid by Race/Ethnicity, 2010
Source: U.S. Census Bureau 2010 Decennial Census, SF1
200,000 150,000 100,000 50,000 0 50,000 100,000 150,000 200,000Under 1 year
5 years
10 years
15 years
20 years
25 years
30 years
35 years
40 years
45 years
50 years
55 years
60 years
65 years
70 years
75 years
80 years
85 years
90 years
95 years
100 to 104 years
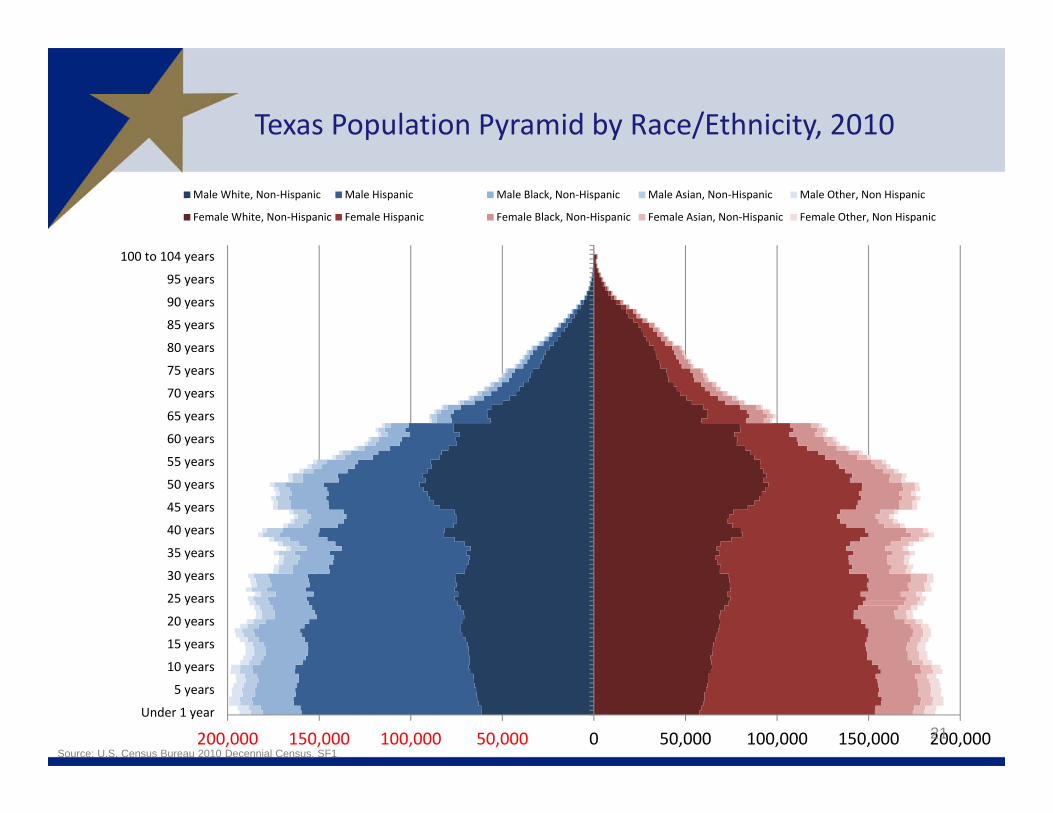
Male White, Non‐Hispanic Male Hispanic Male Black, Non‐Hispanic Male Asian, Non‐Hispanic Male Other, Non Hispanic
Female White, Non‐Hispanic Female Hispanic Female Black, Non‐Hispanic Female Asian, Non‐Hispanic Female Other, Non Hispanic
21
Texas Population Pyramid by Race/Ethnicity, 2010
Source: U.S. Census Bureau 2010 Decennial Census, SF1
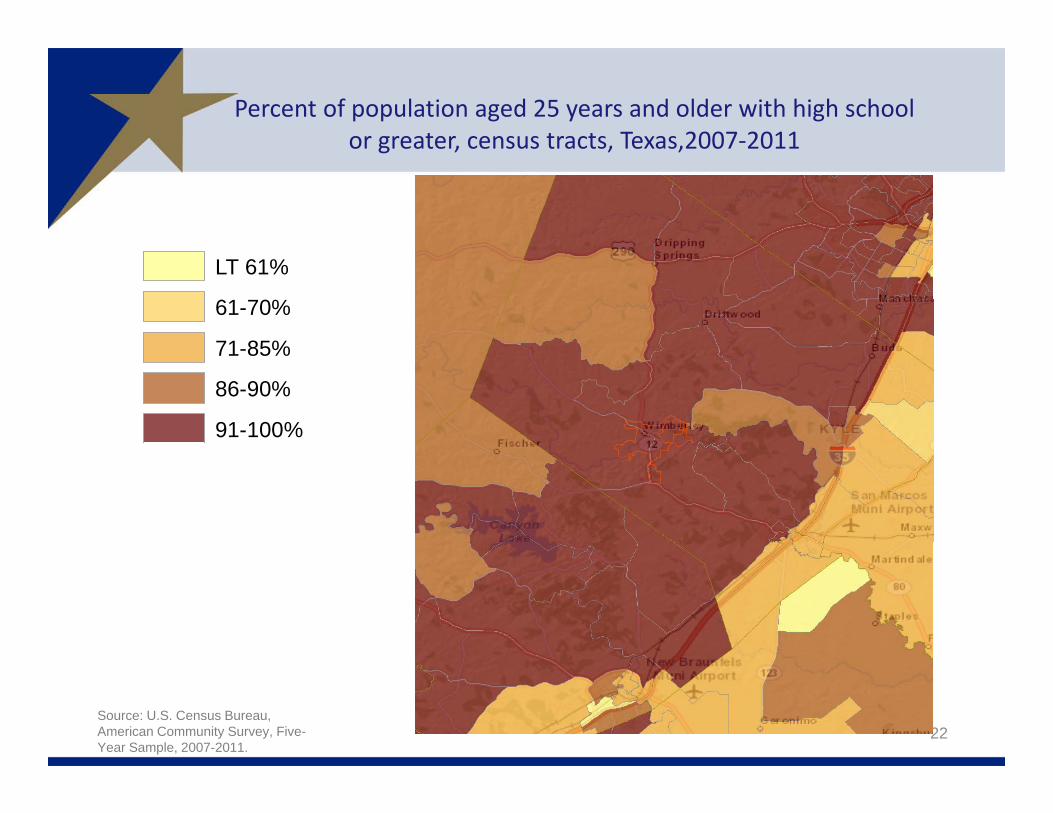
Percent of population aged 25 years and older with high school or greater, census tracts, Texas,2007‐2011
22
LT 61%
61-70%
71-85%
86-90%
91-100%
Source: U.S. Census Bureau, American Community Survey, Five-Year Sample, 2007-2011.
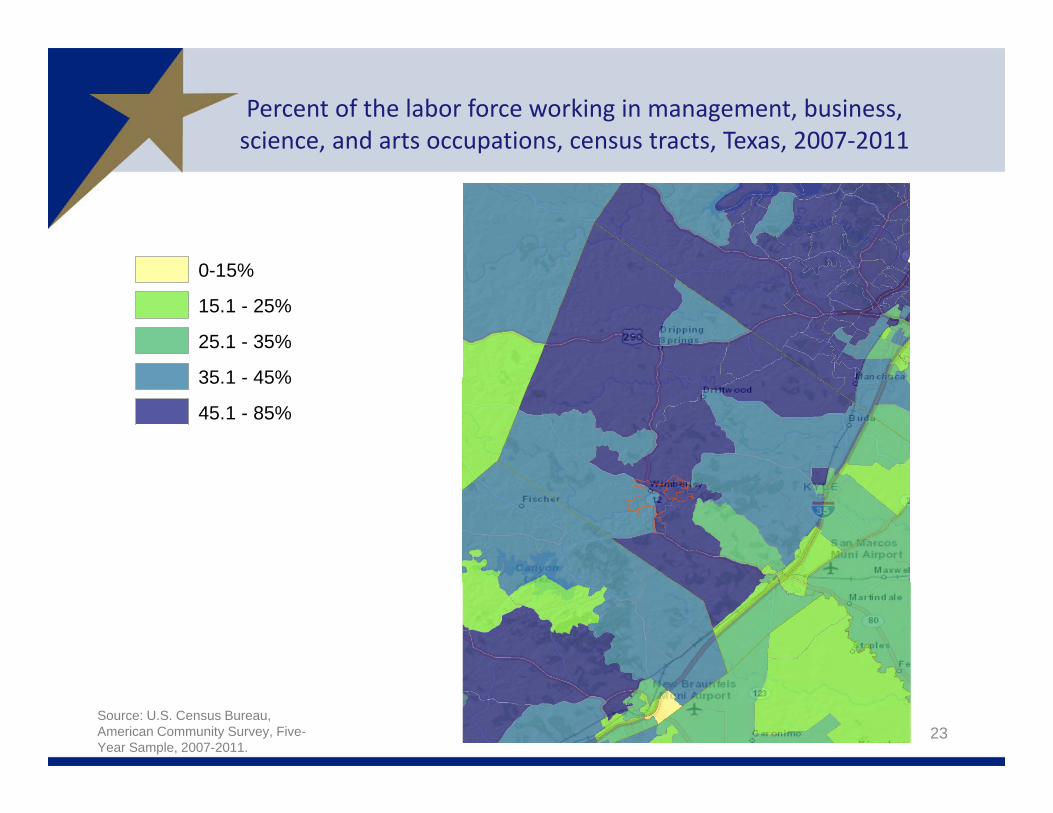
Percent of the labor force working in management, business, science, and arts occupations, census tracts, Texas, 2007‐2011
23
0-15%
15.1 - 25%
25.1 - 35%
35.1 - 45%
45.1 - 85%
Source: U.S. Census Bureau, American Community Survey, Five-Year Sample, 2007-2011.
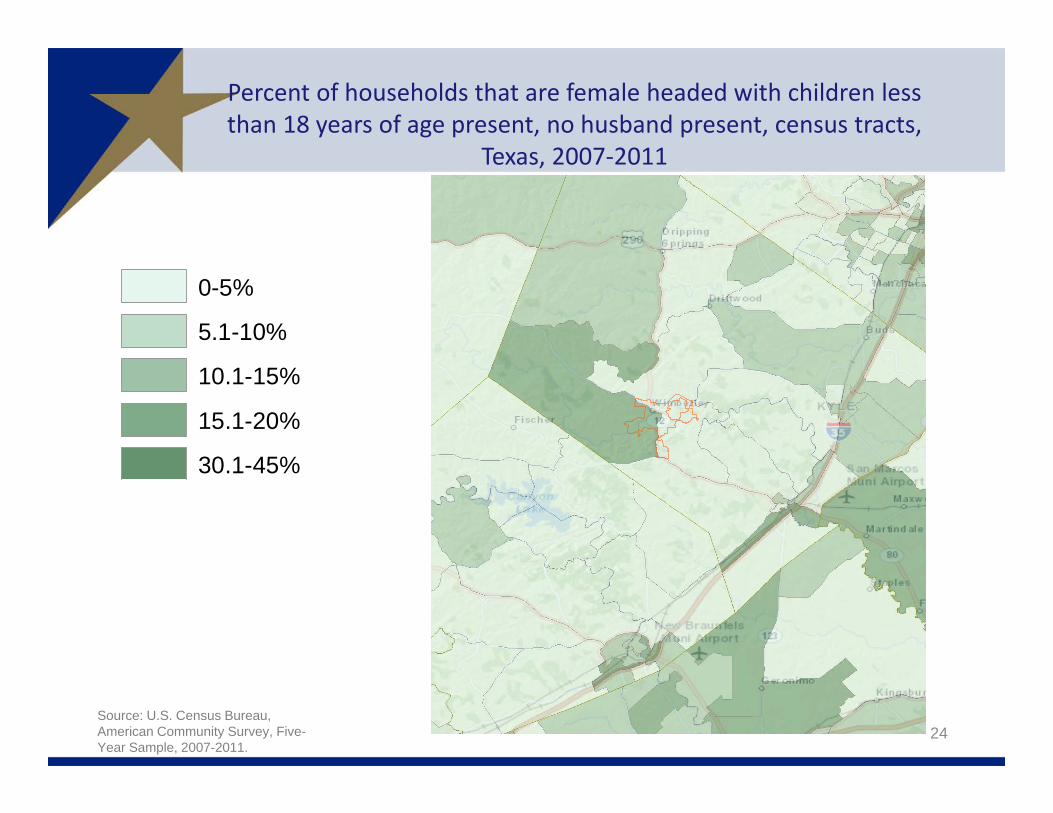
Percent of households that are female headed with children less than 18 years of age present, no husband present, census tracts,
Texas, 2007‐2011
24Source: U.S. Census Bureau, American Community Survey, Five-Year Sample, 2007-2011.
0-5%
5.1-10%
10.1-15%
15.1-20%
30.1-45%
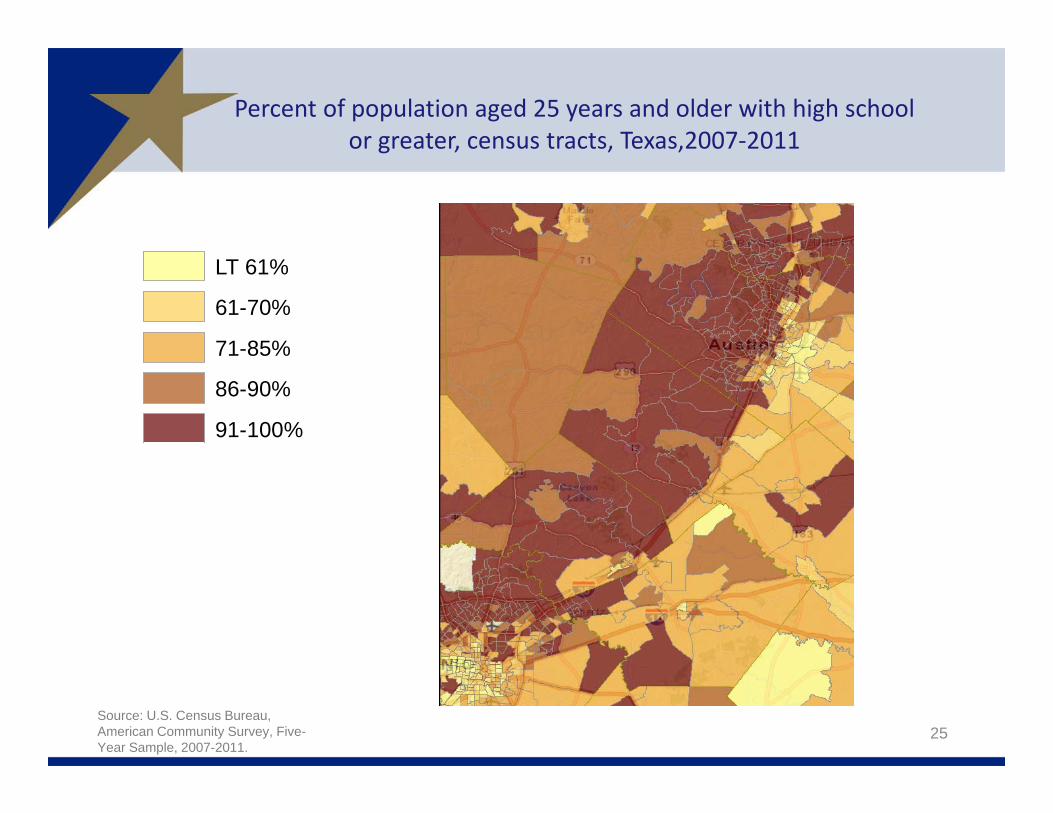
Percent of population aged 25 years and older with high school or greater, census tracts, Texas,2007‐2011
25
LT 61%
61-70%
71-85%
86-90%
91-100%
Source: U.S. Census Bureau, American Community Survey, Five-Year Sample, 2007-2011.
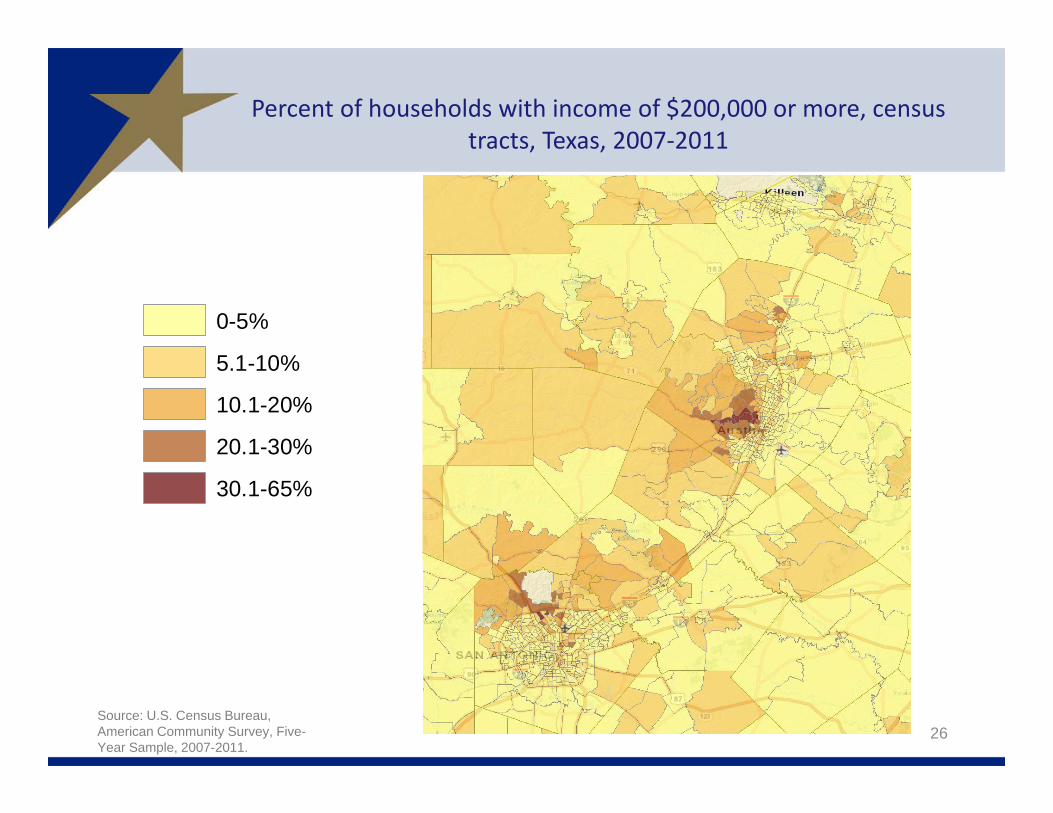
Percent of households with income of $200,000 or more, census tracts, Texas, 2007‐2011
26Source: U.S. Census Bureau, American Community Survey, Five-Year Sample, 2007-2011.
0-5%
5.1-10%
10.1-20%
20.1-30%
30.1-65%
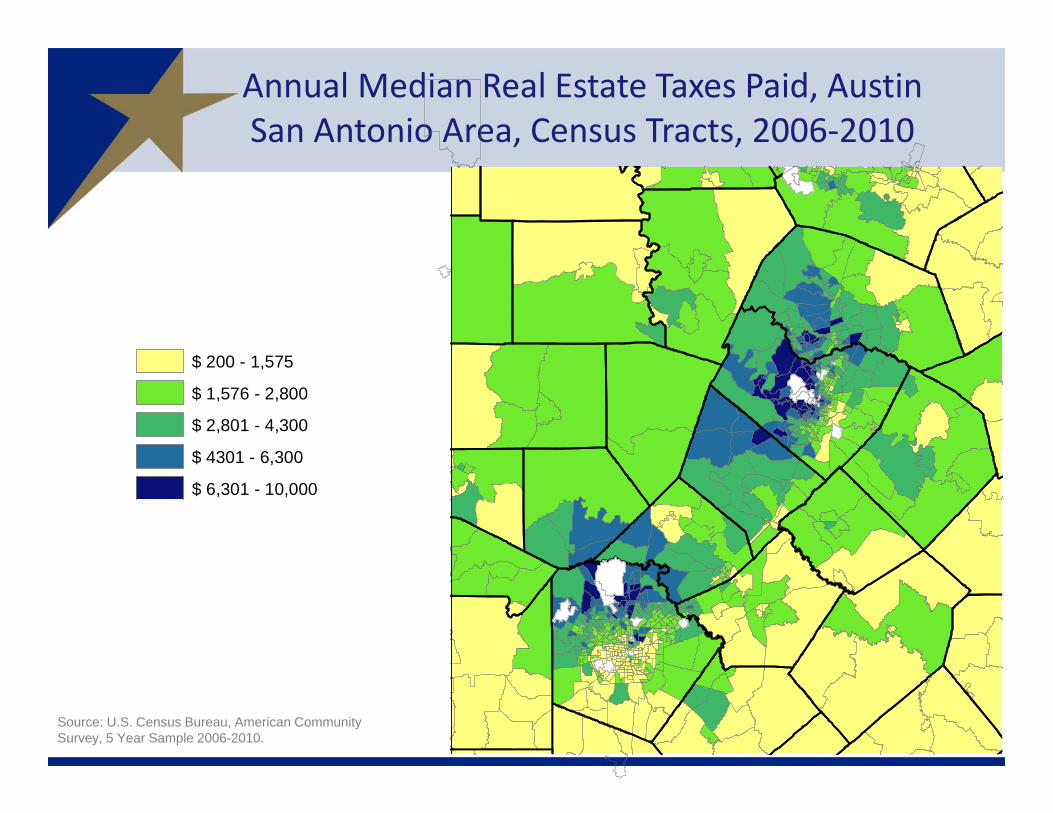
Annual Median Real Estate Taxes Paid, Austin San Antonio Area, Census Tracts, 2006‐2010
27Source: U.S. Census Bureau, American Community Survey, 5 Year Sample 2006-2010.
$ 200 - 1,575
$ 1,576 - 2,800
$ 2,801 - 4,300
$ 4301 - 6,300
$ 6,301 - 10,000
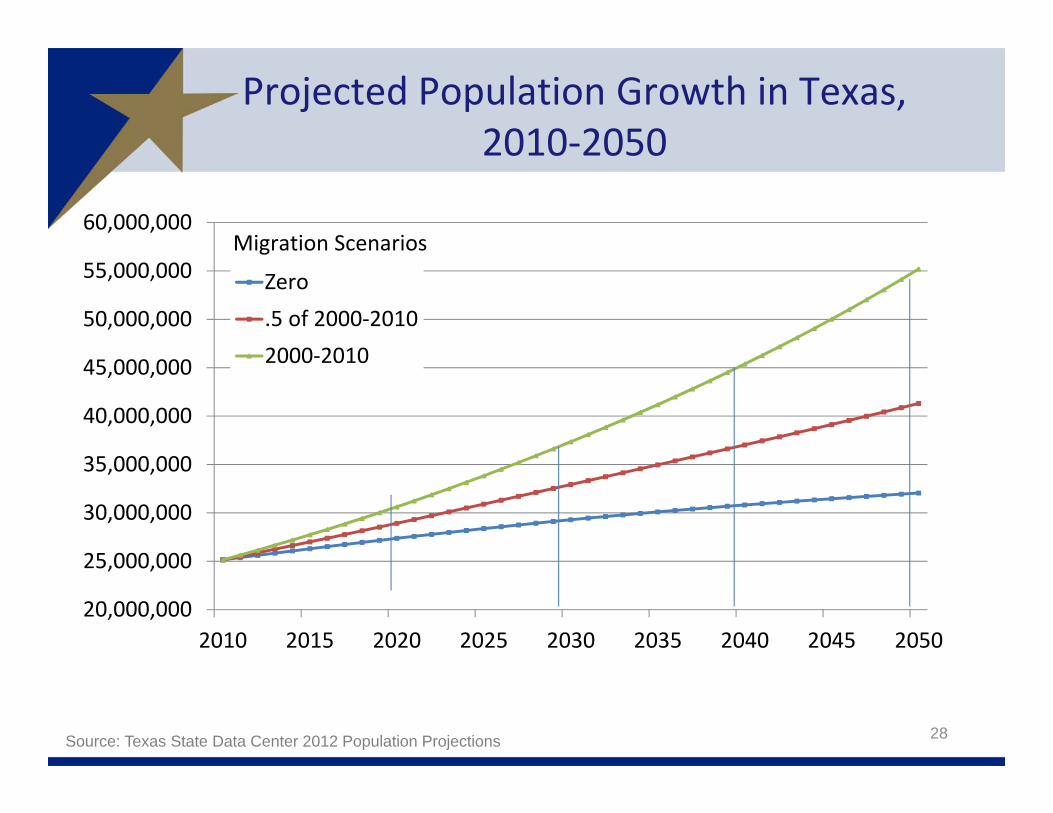
Projected Population Growth in Texas, 2010‐2050
20,000,000
25,000,000
30,000,000
35,000,000
40,000,000
45,000,000
50,000,000
55,000,000
60,000,000
2010 2015 2020 2025 2030 2035 2040 2045 2050
Zero.5 of 2000‐20102000‐2010
Migration Scenarios
28Source: Texas State Data Center 2012 Population Projections
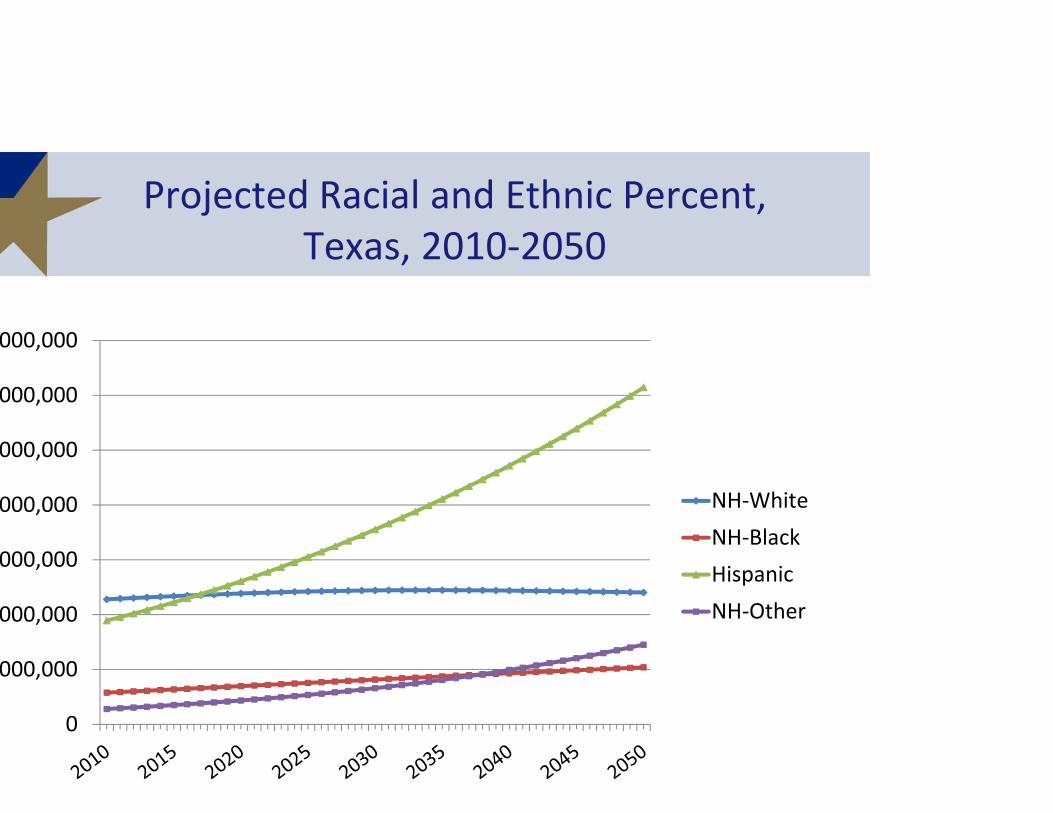
Projected Racial and Ethnic Percent, Texas, 2010‐2050
0
000,000
000,000
000,000
000,000
000,000
000,000
000,000
NH‐WhiteNH‐BlackHispanicNH‐Other
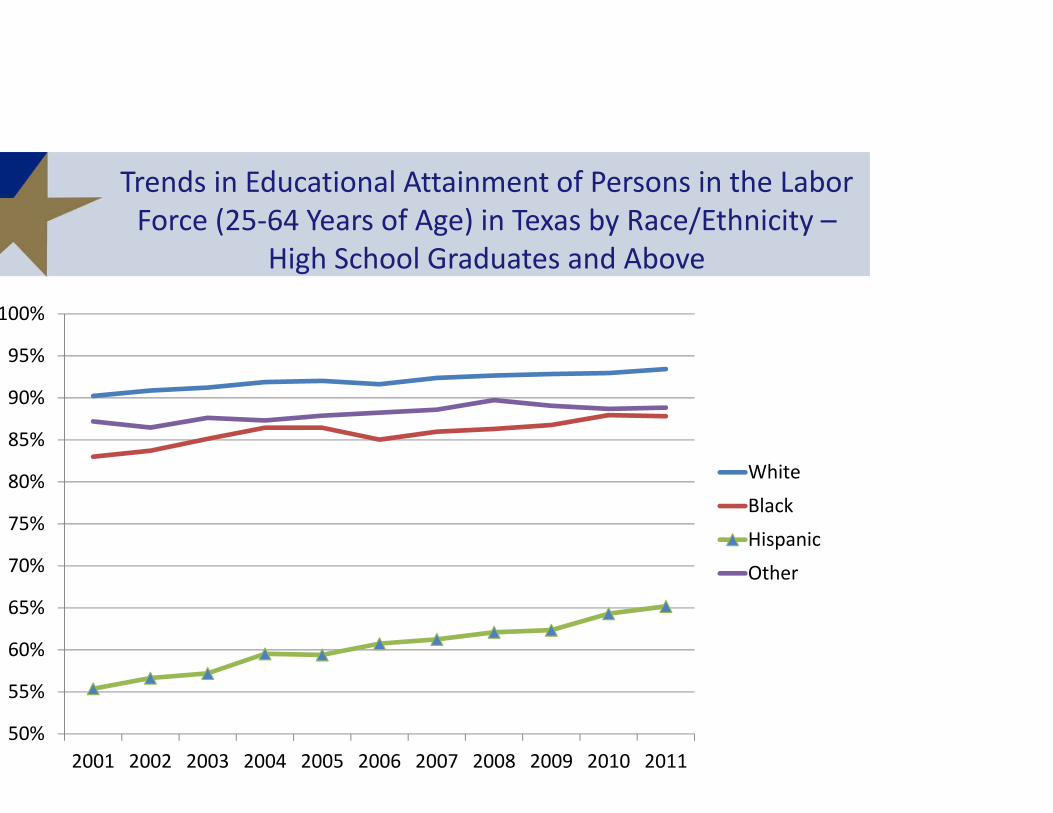
Trends in Educational Attainment of Persons in the Labor Force (25‐64 Years of Age) in Texas by Race/Ethnicity –
High School Graduates and Above
50%
55%
60%
65%
70%
75%
80%
85%
90%
95%
100%
2001 2002 2003 2004 2005 2006 2007 2008 2009 2010 2011
White
Black
Hispanic
Other
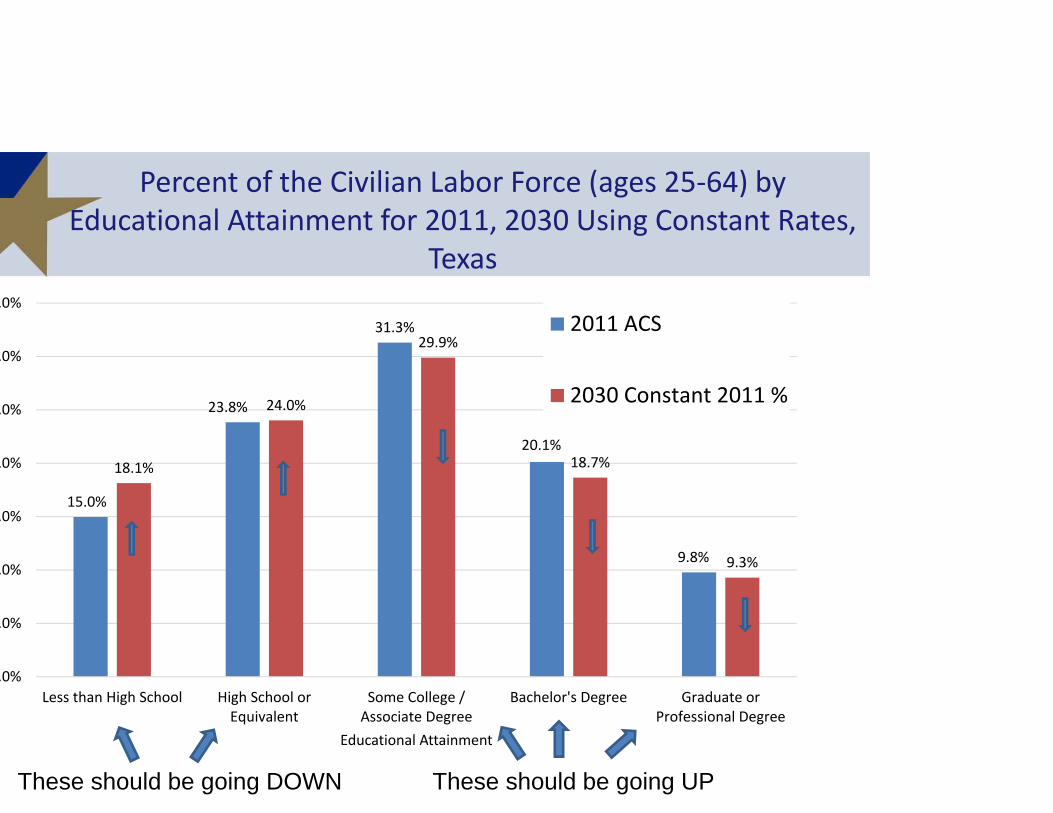
Percent of the Civilian Labor Force (ages 25‐64) by Educational Attainment for 2011, 2030 Using Constant Rates,
Texas
15.0%
23.8%
31.3%
20.1%
9.8%
18.1%
24.0%
29.9%
18.7%
9.3%
.0%
.0%
.0%
.0%
.0%
.0%
.0%
.0%
Less than High School High School orEquivalent
Some College /Associate Degree
Bachelor's Degree Graduate orProfessional Degree
Educational Attainment
2011 ACS
2030 Constant 2011 %
These should be going DOWN These should be going UP
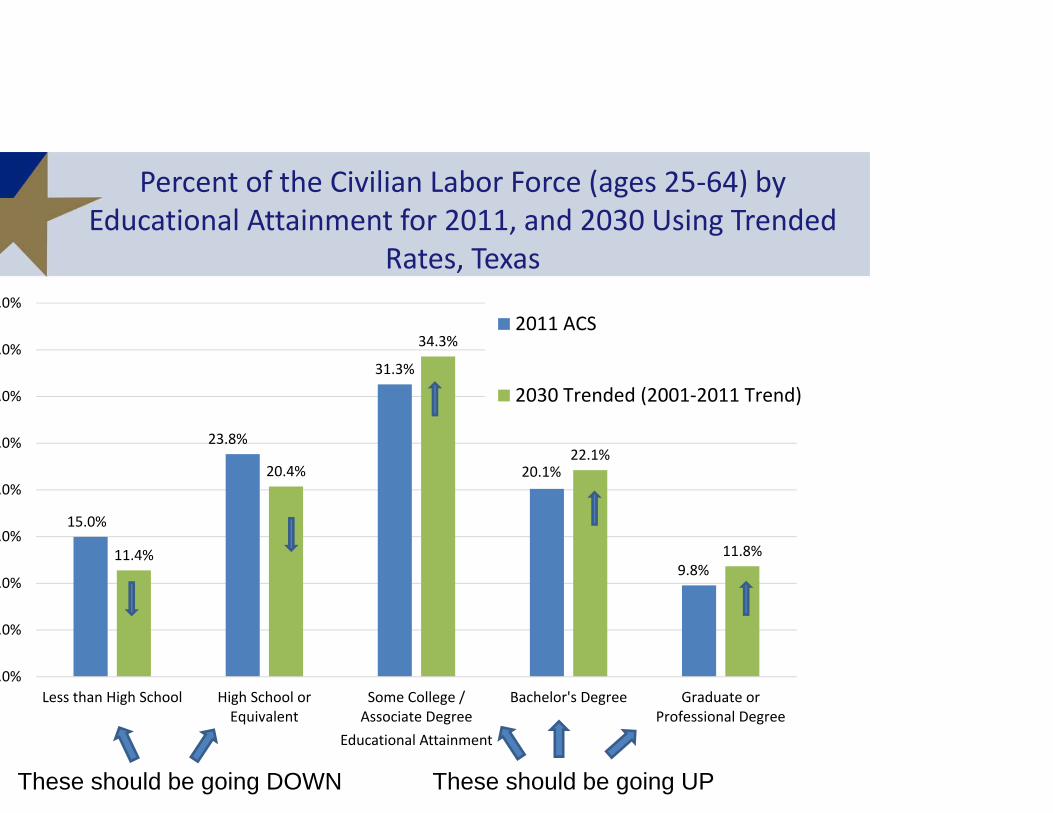
Percent of the Civilian Labor Force (ages 25‐64) by Educational Attainment for 2011, and 2030 Using Trended
Rates, Texas
15.0%
23.8%
31.3%
20.1%
9.8%11.4%
20.4%
34.3%
22.1%
11.8%
.0%
.0%
.0%
.0%
.0%
.0%
.0%
.0%
.0%
Less than High School High School orEquivalent
Some College /Associate Degree
Bachelor's Degree Graduate orProfessional Degree
Educational Attainment
2011 ACS
2030 Trended (2001‐2011 Trend)
These should be going DOWN These should be going UP
Demographics and Destiny

Contact
Office: (512) 463‐8390 or (210) 458‐6530Email: [email protected]: http://osd.state.tx.us
Lloyd Potter, Ph.D., M.P.H.