Embed Size (px)
Citation preview
Demographic Trends and Demand for Long-Term Care Services
NAIC Public Hearing on Long-Term Care Insurance November 28, 2012 Andrew Melnyk, Ph.D. Vice President, Research American Council of Life Insurers
© AMERICAN COUNCIL OF LIFE INSURERS 101 Constitution Ave., NW, Washington, DC 20001-2133
Overview
How does an aging population fit into the ‘big
picture’? What are the key demographic trends and how
will they impact the demand for long-term care? What evolving consumer perspectives and
revised expectations could mean for the life insurance industry (with a special focus on LTC insurance).
The ‘Big Picture’ – Past, Present, and Future
• Mid-2000’s: Relatively strong economy.
Though interest rates were low by historical standards, yields were reasonable.
The oldest baby boomers were on the verge of retirement.
© AMERICAN COUNCIL OF LIFE INSURERS 101 Constitution Ave., NW, Washington, DC 20001-2133
3
The ‘Big Picture’ – Past, Present, and Future (continued)
• 2007 to 2011: Financial collapse
Housing bubble burst
Great Recession
Regulatory change
Low interest rate environment
Etc.
© AMERICAN COUNCIL OF LIFE INSURERS 101 Constitution Ave., NW, Washington, DC 20001-2133
4
The ‘Big Picture’ – Past, Present, and Future (continued)
• Today: The economic recovery is sluggish.
The housing market is slowly recovering.
Government debt is high. Concern about public programs (Social Security, Medicare,
Medicaid) and state pensions.
Private sector (not just life insurers) still faces some regulatory uncertainty.
Interest rates are at record lows, and will likely remain so for several more years.
Possibility of inflation at some point in the future.
© AMERICAN COUNCIL OF LIFE INSURERS 101 Constitution Ave., NW, Washington, DC 20001-2133
5
The ‘Big Picture’ – Past, Present, and Future (continued)
• Today (continued): The oldest baby boomers have reached ‘retirement
age’.
• 2030: The youngest baby boomers will have reached
‘retirement age’.
• Despite fluctuations in the economy, demographic transition continues and will ultimately drive demand for retirement products, including LTC insurance.
© AMERICAN COUNCIL OF LIFE INSURERS 101 Constitution Ave., NW, Washington, DC 20001-2133
6
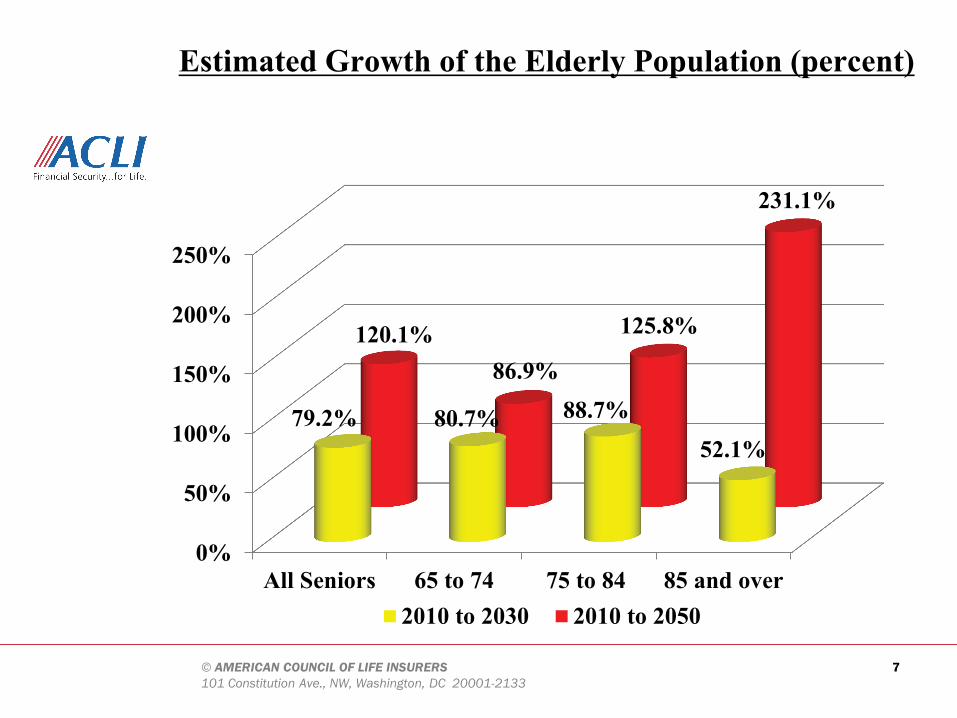
Estimated Growth of the Elderly Population (percent)
© AMERICAN COUNCIL OF LIFE INSURERS 101 Constitution Ave., NW, Washington, DC 20001-2133
7
0%
50%
100%
150%
200%
250%
All Seniors 65 to 74 75 to 84 85 and over
79.2% 80.7% 88.7% 52.1%
120.1% 86.9%
125.8%
231.1%
2010 to 2030 2010 to 2050
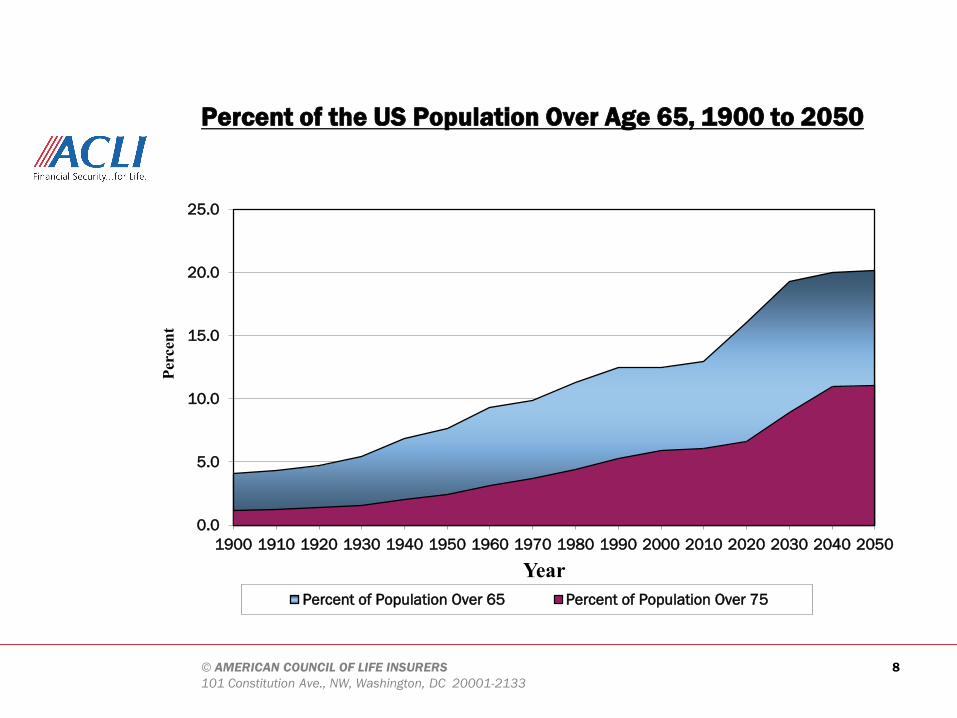
Percent of the US Population Over Age 65, 1900 to 2050
© AMERICAN COUNCIL OF LIFE INSURERS 101 Constitution Ave., NW, Washington, DC 20001-2133
8
0.0
5.0
10.0
15.0
20.0
25.0
1900 1910 1920 1930 1940 1950 1960 1970 1980 1990 2000 2010 2020 2030 2040 2050
Perc
ent
Year Percent of Population Over 65 Percent of Population Over 75
Key Demographic Trends:
An increase in the number of seniors is a direct result of the ‘baby boom’ and will impact the demand for long-term care.
But, two related demographic changes may indirectly impact demand for long-term care:
1. Lower fertility 2. Greater longevity
© AMERICAN COUNCIL OF LIFE INSURERS 101 Constitution Ave., NW, Washington, DC 20001-2133
9
© AMERICAN COUNCIL OF LIFE INSURERS 101 Constitution Ave., NW, Washington, DC 20001-2133
• Baby boomers tended to have smaller families. • In 1960, the average woman had 3.6 children. • In 2010, the average woman had 2.1 children.
• Low fertility eventually results in fewer working-age people per retiree. • In 1930, there were 10.3 working-age people per retiree. • In 1960 there were 5.6 working-age people per retiree. • In 2010 there were 4.6 working-age people per retiree. • In 2030 there will be 2.8 working-age people per retiree.
Long-Term Demographic Trends: Lower Fertility
10
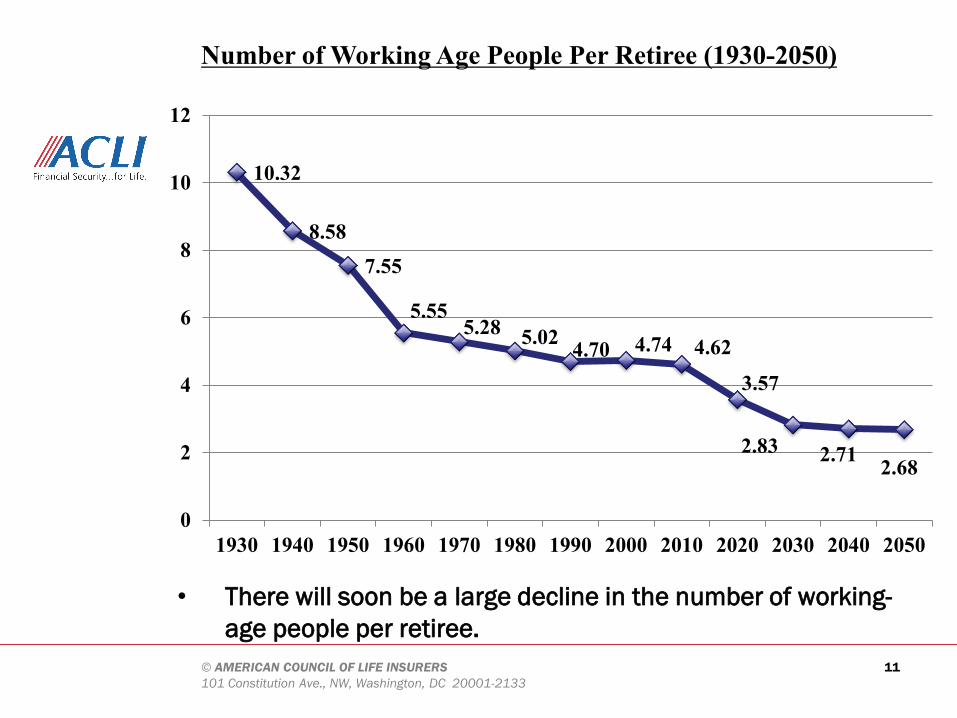
Number of Working Age People Per Retiree (1930-2050)
• There will soon be a large decline in the number of working-age people per retiree.
© AMERICAN COUNCIL OF LIFE INSURERS 101 Constitution Ave., NW, Washington, DC 20001-2133
11
10.32
8.58 7.55
5.55 5.28 5.02 4.70 4.74 4.62
3.57
2.83 2.71 2.68
0
2
4
6
8
10
12
1930 1940 1950 1960 1970 1980 1990 2000 2010 2020 2030 2040 2050
© AMERICAN COUNCIL OF LIFE INSURERS 101 Constitution Ave., NW, Washington, DC 20001-2133
• Why is this a problem?
• Working-age people provide most of the tax revenue to fund Social Security, Medicare, Medicaid, etc.
• This will have implications for retirement income and long-term care: • Medicaid pays for 32.4% of LTC expenditures. • Medicare pays for 31.2% of LTC expenditures.
Long-Term Demographic Trends: Lower Fertility (cont.)
12
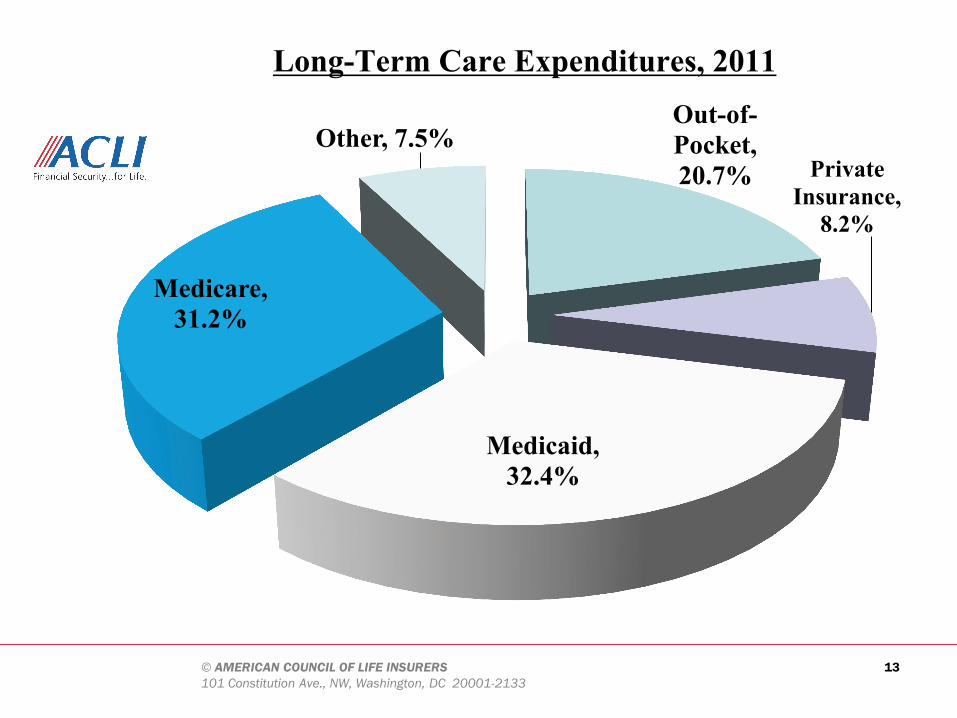
Long-Term Care Expenditures, 2011
© AMERICAN COUNCIL OF LIFE INSURERS 101 Constitution Ave., NW, Washington, DC 20001-2133
Out-of-Pocket, 20.7% Private
Insurance, 8.2%
Medicaid, 32.4%
Medicare, 31.2%
Other, 7.5%
13
© AMERICAN COUNCIL OF LIFE INSURERS 101 Constitution Ave., NW, Washington, DC 20001-2133
• Why is this a problem (cont.)?
• If there are relatively fewer caregivers the cost of LTC and medical care may increase more than anticipated. • Formal LTC – growing demand for caregivers will drive up
cost. • ‘Informal’ LTC – unpaid care provided by family and
friends.
Long-Term Demographic Trends: Lower Fertility (cont.)
14
© AMERICAN COUNCIL OF LIFE INSURERS 101 Constitution Ave., NW, Washington, DC 20001-2133
Long-Term Demographic Trends: Lower Fertility (cont.)
• ‘Informal’ LTC – unpaid care provided by family, friends, and neighbors. Facts: • Societal and demographic changes have made informal
care an increasingly less viable alternative.
• ‘Informal’ LTC is usually not a good substitute for ‘formal’ LTC.
• 15 million Americans provide unpaid care for a person with Alzheimer’s or dementia.
• There is a very significant ‘hidden cost’. • 6% of caregivers quit work. • 10% cut back on work schedules. • 17% take a leave of absence. • 4% turn down promotions.
15
© AMERICAN COUNCIL OF LIFE INSURERS 101 Constitution Ave., NW, Washington, DC 20001-2133
Long-Term Demographic Trends: Lower Fertility (cont.)
• Informal care (continued)
•Women usually bear the greatest cost.
•2 out of 3 unpaid caregivers for elderly adults are women, usually adult daughters.
• “women who help their parents over a two year period cut back their work hours by 367 hours per year, or 41% on average” (Johnson and Lo Sasso (2006)).
16
Long-Term Demographic Trends: Increased Longevity
• Longevity -- Boomers are living longer. • Since the 1960s, life expectancy among 65 year-olds
increased by more than one year per decade • Rapid advances in medicine, more and better
treatments. • Healthier living conditions, less smoking, more early
screening, etc. • Most governments assume that the rate at which
longevity increases will diminish…..but….
© AMERICAN COUNCIL OF LIFE INSURERS 101 Constitution Ave., NW, Washington, DC 20001-2133
17
But…
• According to a recent study: “…progressive increases in … life expectancy have generated a dramatic demographic transition in the U.S. Official government estimates may have inadvertently underestimated life expectancy…[T]his would have major policy implications.”
Olshansky, Goldman, Zheng, and Rowe (2009)
• “…the first 150 year-old may already have been born….” Aubrey de Grey (Gerontologist)
© AMERICAN COUNCIL OF LIFE INSURERS 101 Constitution Ave., NW, Washington, DC 20001-2133
18
But…
• “Members of the cohort born between 1980 and 1990 have a 50-50 chance of living to age 100.”
Robert Fogel (Nobel Laureate in Economics) • “Few governments … adequately recognize longevity risk. Where
they do, they find it is large. [I]f individuals live three years longer than expected – in line with underestimations in the past – the already large costs of aging could increase by another 50 percent…”
International Monetary Fund (2012)
© AMERICAN COUNCIL OF LIFE INSURERS 101 Constitution Ave., NW, Washington, DC 20001-2133
19
Long-Term Demographic Trends: Increased Longevity (cont.)
• Greater longevity may mean more years spent outside the labor force (i.e. longer retirement). • The length of retirement is determined both by
longevity and the age at which seniors permanently leave the labor force.
• Increased burden on public programs.
© AMERICAN COUNCIL OF LIFE INSURERS 101 Constitution Ave., NW, Washington, DC 20001-2133
20
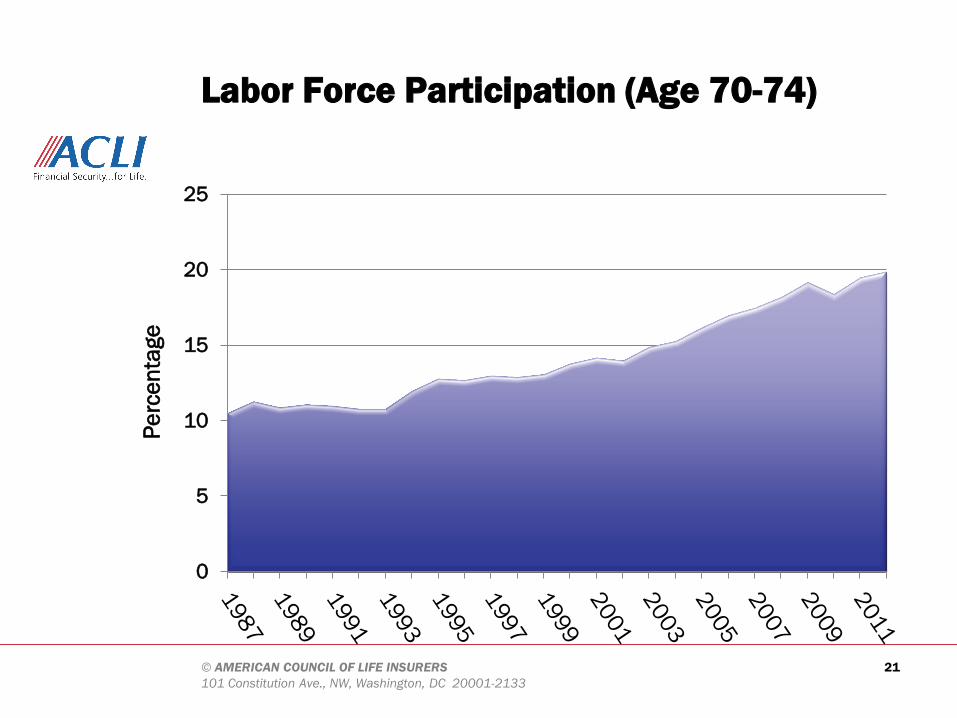
Labor Force Participation (Age 70-74)
© AMERICAN COUNCIL OF LIFE INSURERS 101 Constitution Ave., NW, Washington, DC 20001-2133
21
0
5
10
15
20
25
Perc
enta
ge
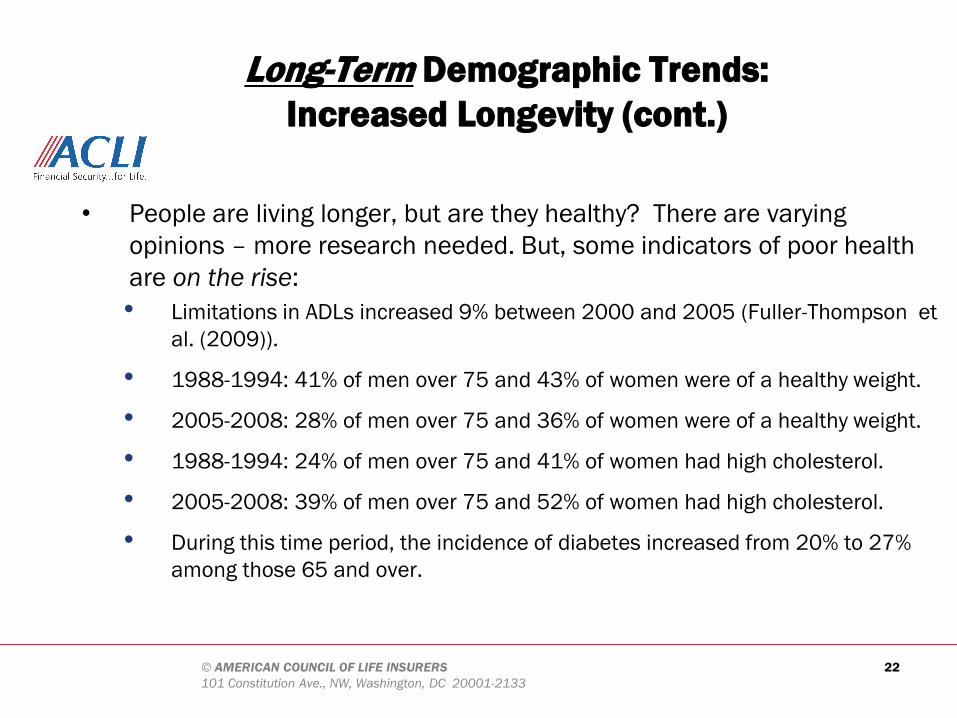
Long-Term Demographic Trends: Increased Longevity (cont.)
• People are living longer, but are they healthy? There are varying opinions – more research needed. But, some indicators of poor health are on the rise: • Limitations in ADLs increased 9% between 2000 and 2005 (Fuller-Thompson et
al. (2009)).
• 1988-1994: 41% of men over 75 and 43% of women were of a healthy weight.
• 2005-2008: 28% of men over 75 and 36% of women were of a healthy weight.
• 1988-1994: 24% of men over 75 and 41% of women had high cholesterol.
• 2005-2008: 39% of men over 75 and 52% of women had high cholesterol.
• During this time period, the incidence of diabetes increased from 20% to 27% among those 65 and over.
© AMERICAN COUNCIL OF LIFE INSURERS
101 Constitution Ave., NW, Washington, DC 20001-2133 22
Long-Term Demographic Trends: Increased Longevity (cont.)
• If morbidity and disability increase along with
longevity, then: • A larger percentage of seniors will need LTC. • The length of time receiving LTC may increase. • Cost of retirement may further increase. • Medicaid and Medicare may be further
strained.
© AMERICAN COUNCIL OF LIFE INSURERS 101 Constitution Ave., NW, Washington, DC 20001-2133
23
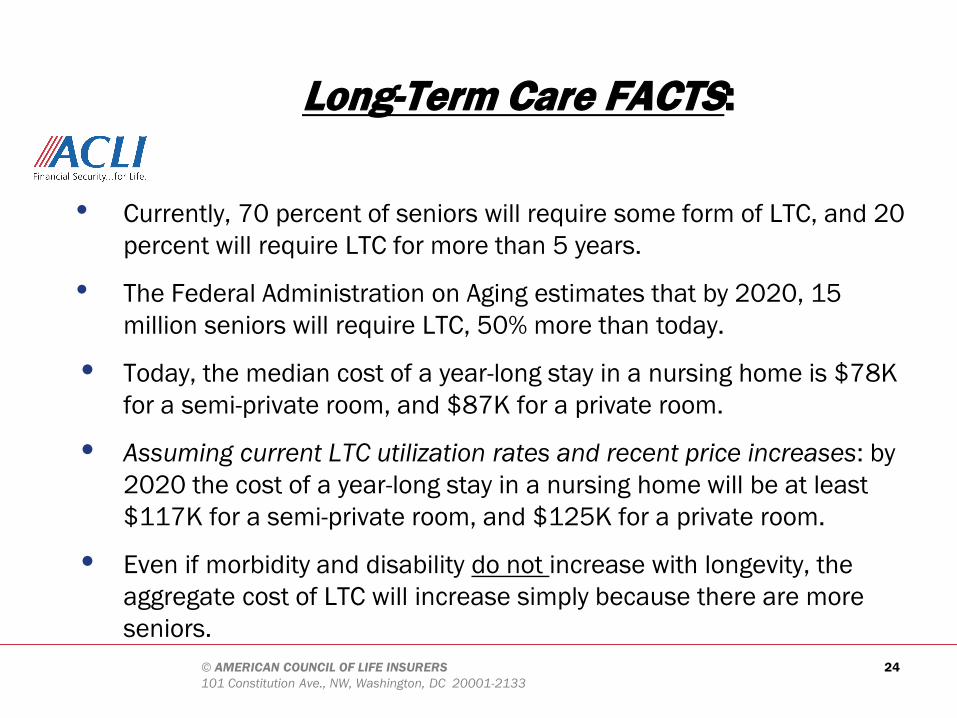
Long-Term Care FACTS:
• Currently, 70 percent of seniors will require some form of LTC, and 20 percent will require LTC for more than 5 years.
• The Federal Administration on Aging estimates that by 2020, 15 million seniors will require LTC, 50% more than today.
• Today, the median cost of a year-long stay in a nursing home is $78K for a semi-private room, and $87K for a private room.
• Assuming current LTC utilization rates and recent price increases: by 2020 the cost of a year-long stay in a nursing home will be at least $117K for a semi-private room, and $125K for a private room.
• Even if morbidity and disability do not increase with longevity, the aggregate cost of LTC will increase simply because there are more seniors.
© AMERICAN COUNCIL OF LIFE INSURERS 101 Constitution Ave., NW, Washington, DC 20001-2133
24
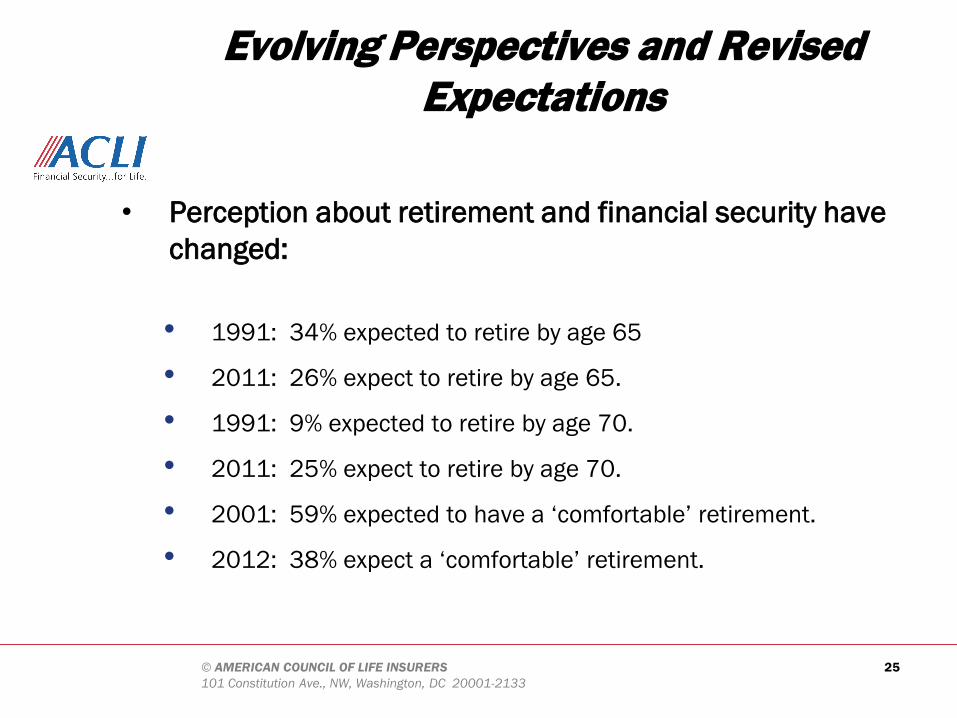
Evolving Perspectives and Revised Expectations
• Perception about retirement and financial security have changed: • 1991: 34% expected to retire by age 65
• 2011: 26% expect to retire by age 65.
• 1991: 9% expected to retire by age 70.
• 2011: 25% expect to retire by age 70.
• 2001: 59% expected to have a ‘comfortable’ retirement.
• 2012: 38% expect a ‘comfortable’ retirement.
© AMERICAN COUNCIL OF LIFE INSURERS 101 Constitution Ave., NW, Washington, DC 20001-2133
25
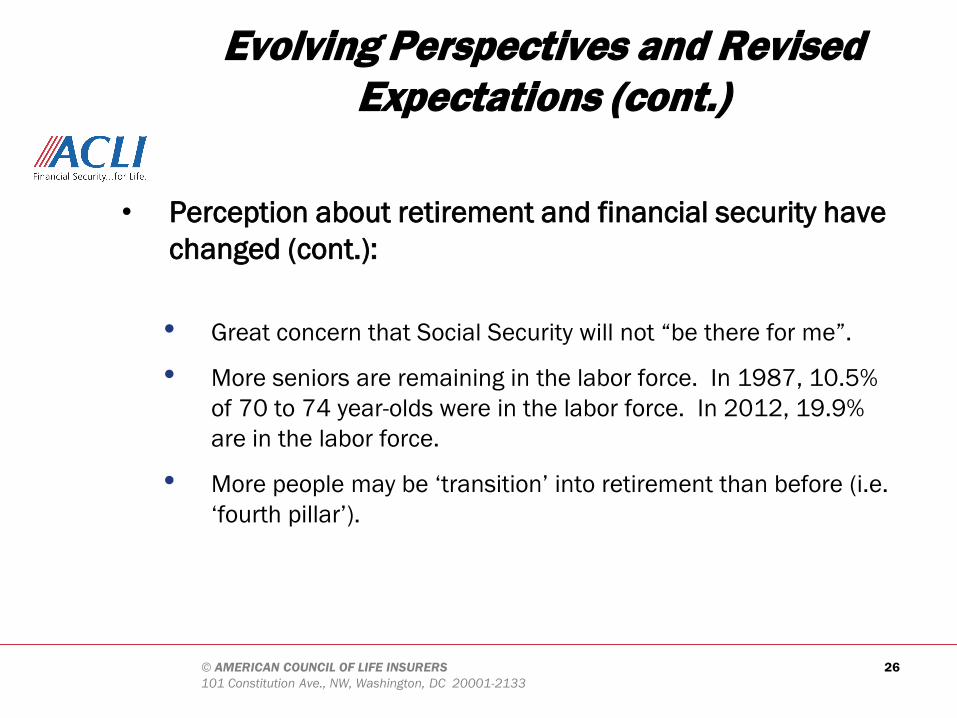
Evolving Perspectives and Revised Expectations (cont.)
• Perception about retirement and financial security have changed (cont.): • Great concern that Social Security will not “be there for me”.
• More seniors are remaining in the labor force. In 1987, 10.5% of 70 to 74 year-olds were in the labor force. In 2012, 19.9% are in the labor force.
• More people may be ‘transition’ into retirement than before (i.e. ‘fourth pillar’).
© AMERICAN COUNCIL OF LIFE INSURERS 101 Constitution Ave., NW, Washington, DC 20001-2133
26
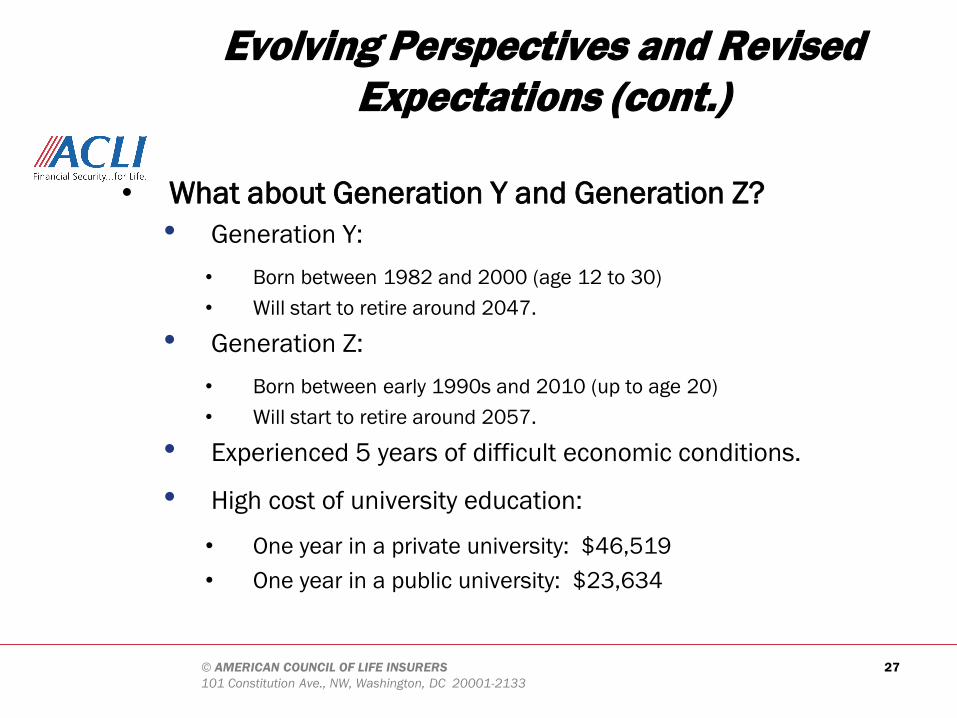
Evolving Perspectives and Revised Expectations (cont.)
• What about Generation Y and Generation Z?
• Generation Y: • Born between 1982 and 2000 (age 12 to 30) • Will start to retire around 2047.
• Generation Z: • Born between early 1990s and 2010 (up to age 20) • Will start to retire around 2057.
• Experienced 5 years of difficult economic conditions.
• High cost of university education:
• One year in a private university: $46,519 • One year in a public university: $23,634
© AMERICAN COUNCIL OF LIFE INSURERS 101 Constitution Ave., NW, Washington, DC 20001-2133
27
Evolving Perspectives and Revised Expectations (cont.)
• What about Generation Y and Generation Z (cont.)?
• Bad job market
• Collapse of real estate market
• Witnessed retirement and LTC challenges faced by their parents/grandparents
• Will Generation Y and Generation Z be: • more ‘risk averse’ than their parents?
• ‘savers’?
• more likely to prepare for their own retirement?
• more like the ‘Silent Generation’ and/or the ‘Greatest Generation’?
• more inclined to purchase insurance products?
© AMERICAN COUNCIL OF LIFE INSURERS 101 Constitution Ave., NW, Washington, DC 20001-2133
28
Conclusions
• Economic conditions may dictate short-term product trends, but demographics will dictate long-term product trends.
• An aging population, a declining number of working-age people per retiree, increasing longevity, and concern about public programs will drive demand for long-term care insurance over the long run.
• Perceptions and expectations have evolved and have become more realistic.
• Younger generations may be more aware of the need to plan for LTC needs and may be more risk averse.
© AMERICAN COUNCIL OF LIFE INSURERS 101 Constitution Ave., NW, Washington, DC 20001-2133
29
© AMERICAN COUNCIL OF LIFE INSURERS 101 Constitution Ave., NW, Washington, DC 20001-2133
THANK YOU! Contact: Andrew Melnyk, Ph.D.* Vice President, Research (202) 624-2182 [email protected]
“If I had my way, I would write the word ‘Insure’ upon the door of every cottage and upon the blotting book of every public man…”
Winston Churchill, 1909 (in a speech advocating for
public and private insurance)
*The views and opinions expressed in this presentation are those of the author/presenter and are not necessarily those of the American Council of Life insurers or it’s member companies.
30