Embed Size (px)
Citation preview
NATIONAL COUNCIL FOR SOVIET AND EAST EUROPEAN RESEARC H
DEMOGRAPHIC SOURCES OF THE CHANGING ETHNI CCOMPOSITION OF THE SOVIET UNION
Barbara A . AndersonUniversity of Michigan
Brian D . SilverUniversity of Michigan
NOTE
This is an incidental paper volunteered to the Council by the
authors who are separately under contract for research on
other topics, reports from which will be distributed later .
f- v
-if
v
DEMOGRAPHIC SOURCES OF THE CHANGING ETHNIC COMPOSITIO NOF THE SOVIET UNIO N
BARBARA A. ANDERSO NPopulation Studies Center
an dDepartment of SociologyUniversity of Michiga n
BRIAN D. SILVERDepartment of Political Scienc e
Michigan State Universit yan d
Population Studies Cente rUniversity of Michiga n
Prepared for Presentation at the Annual Meeting of th eAmerican Association for the Advancement of Slavic Studies
2-5 November 198 9Chicago
ACKNOWLEDGMENTS : The authors share equal responsibility for the work. This stud ywas supported by NICHD Grant Nos . RO1 HD-19915 and P30 HD-10003 . The authors ar egrateful to Douglas Johnson for research assistance .


Among the most dramatic events in the Soviet Union since the beginning of the polic yof perestroika in 1985 has been the increase in the assertion of rights of ethnic minorities .Among non-Russian ethnic groups, claims of cultural autonomy and the establishment of loca llanguages as official languages have been related to concerns about loss of their distinctiv eethnic heritages and patrimonies, the despoiling of the environment, and the lack of economi cand political autonomy . Many of these claims have focussed on the policies of the centra lParty and government in Moscow as well as on the Russianization of the non-Russian regions.1 .Some of the most dramatic and violent instances of intergroup conflict have occurred betwee nnon-Russian ethnic groups, such as Uzbeks vs . Meskhetian Turks in Uzbekistan, Armenians vs .Azerbaidzhanis in Nagorno-Karabakh and elsewhere in Transcaucasia . and Abkhazians vs .Georgians in Soviet Georgia.
These events remind us that the Soviet Union is a multi-ethnic country and that ethni cloyalties are an enduring aspect of Soviet society . More than 90 distinct nationalities ("ethnicgroups," in common English usage) have their historic homelands within its boundaries .Twenty-two nationalities have populations of 1 million or more . Table 1 provides som einformation about the ethnic composition of the Soviet Union according to recent censuses .
This paper discusses the changing ethnic composition of the Soviet population as awhole and by region . It examines the sources of change for different regions of the country ,with special emphasis on fertility and migration . It shows that differences in growth rates arelikely to lead to a marked change in the ethnic composition of the USSR in the near future .The analysis focuses on the population of the USSR as a whole as well as of the fifteen unionrepublics that comprise the federal state structure . The titular nationalities of these republic s-- the nationalities for which the republics are named -- comprise more than 90% of th epopulation of the Soviet Union . 2
Preliminary data on the ethnic composition of the Soviet population from the 198 9census (conducted in January) have recently become available . 3 They show that Russianscomprised 50.8% of the Soviet population . Before these data appeared, many people ha dspeculated that the 1989 census would show that Russians had become a numerical minorit yof the Soviet population. In fact, Russians exceeded non-Russians by 4 .45 million. Thi scompares to a difference of 12.7 million in 1979 4, 16.3 million in 1970, and 19 .4 million i n
1 Following Aspaturian (1968), we use the term "Russianization" to refer to the spread o fRussian people and Russian language in an area . It is distinguished from "Russification, "which is change in the ethnic attachment or self-identification of non-Russians to Russian .Soviet scholars have eschewed use of the term "Russification" as well as of "assimilation" asimplying an explicit official policy . In using terms such as assimilation, Russification, an dreidentification, we do not imply anything about official policy. Instead, we use the term sto describe important aspects of change in ethnic self-identification .
2 The remaining population consists of persons who belong to an ethnic group that lack san official homeland (titular area) in the Soviet federation, or who belong to a nationalit ywhose titular area is of lower status than union republic .
3 The first data for more than one nationality appeared in the Estonian newspaper RahvaHääl (19 September 1989), p. 2 . These data were apparently "leaked" to the press by an official .The State Committee on Statistics (Goskomstat) has not formally released for publication an y1989 census data on nationalities . Such data are scheduled to be published at the end of thi syear . Our analysis draws on some unpublished data from the 1989 Soviet census (as well a ssome previously unpublished data from 1979) to which we have had access .
4 Figures for 1979 and 1989 refer to the "permanent" (postoiannoe) population. Figures fo r1959 and 1970 refer to the "present" (nalichnoe) population. For discussion of this distinction ,see Anderson and Silver (1985c) .
1
1959. Russians could have fallen to a numerical minority in 1989 had there been a sudde nand sharp reversal of assimilation of non-Russians by Russians. About 2.3 million people wh omight normally have been expected to call themselves Russians in the census would have ha dto have indicated a different ethnic affiliation to the census takers in 1989 . This is less tha n2% of the Russian population in 1989 . We think that it is likely that some of this reversal di doccur, but that it was not large enough to reduce the Russians to a numerical minority in 1989 .
Even if no basic change in the structure of the Soviet federation were to occur, theethnic composition of the Soviet population is likely to change dramatically in the future . I fgrowth rates between recent censuses were to continue indefinitely into the future, Russian swould become a numerical minority of the population of the USSR by the year 1994, an dSlavic ethnic groups would become less than a majority by the year 2051 . Moslems woul dexceed the number of Slays by the year 2057 and would become a majority of the populatio nof the USSR by the year 2066 . These are projections, not predictions . But they indicate th eimpact of recent rates of growth in different segments of the Soviet population .
Components of Demographic Chang e
Four components of demographic change affect the composition of the population :migration, assimilation, mortality, and fertility . Of these, fertility and migration are th emost important factors accounting for the changing ethnic composition of the Sovie tpopulation . In principle, one can examine each of these components not only to show thei rrelation to the changing ethnic composition of the population but also to understand the mai ntrends in underlying demographic processes .
A major limitation to studying the components of change in the ethnic composition o fthe Soviet population is that extremely little data have been published on fertility, mortality ,and migration by ethnic group. 5 Almost all of the published data on these demographic proces-ses refer either to the USSR as a whole or to regional units of the Soviet federation. For thi sreason, as well as the lack of age data by nationality for 1979, use of standard cohort com-ponent methods to project the changing ethnic composition of the Soviet population i sdifficult .
Migration . For the USSR as a whole, international migration has had only a negligibl eeffect on the composition of the population in recent decades, although it has had a larg eeffect on the population size of the migrating groups. Emigration has mainly involved thre egroups: Jews, Germans, and Armenians . 6 The level of emigration is determined both b ypolitical factors and by the attitudes and desires of populations from which emigrants come .Similarly, immigration has had little effect on the composition of the Soviet population as awhole, though it has had a substantial effect for some groups ; for example, several thousan dArmenians repatriated to Soviet Armenia after World War II, mostly from countries in th eMiddle East and the Mediterranean (Anderson and Silver, 1983) .
-
Internal migration, on the other hand, has had a large effect on the ethnic compositio nof particular regions . It is at once a source of intergroup friction and of debate overpopulation policy, particularly among people within the non-Russian regions that hav eexperienced a large amount of in-migration from other republics . Unfortunately, Sovietofficial statistics do not include data on the ethnic affiliation of migrants . But available dat a
5 A recent exception is the age-specific fertility data published by Bondarskaia and Darski i(1988) . Similar data were published earlier by Karakhanov (1983) . We have also estimate dtotal fertility rates and infant mortality rates of the titular nationalities of the six Sovie tMoslem republics (Anderson, Silver, and Liu, 1989) .
6 Kingkade (1986) reports that between 1970 and 1985, the number of emigrants from th eUSSR in the three nationalities were : Jews -- 264,451 ; Germans -- 70,777; Armenians -- 17,846 .
2

permit us to estimate indirectly the impact of in-migration of Russians on the ethnic composi -tion of the non-Russian regions .
Assimilation . Assimilation is another component of the changing ethnic compositio nof the population . No official data or estimates of assimilation have been published in th eUSSR. Soviet censuses gather information on the self-identified nationality of the populatio non the census date but do not ask whether individuals previously identified with a differen tnationality or whether their parents belonged to another nationality . We are aware of onlyone serious attempt to measure the extent of assimilation of non-Russian ethnic group s(Anderson and Silver, 1983) . Between 1959 and 1970, Russians were estimated to have gaine d600 thousand people aged 11-49 in 1970 due to assimilation -- changing ethnic self-identifica -tion of non-Russians -- since 1959 . This amounts to about 1% of the number of 11-49 year -old Russians enumerated in the 1970 census .
Because age data have not been published by nationality from the 1979 and 198 9censuses, the estimation procedure used earlier cannot be replicated for more recent dates.Thus, it is difficult to take assimilation systematically into account as a factor affecting theethnic composition of the Soviet Union in recent decades . But it is important to be aware o fthis source of change, especially for many of the smaller and middle-sized nationalities, som eof which have suffered declines in absolute population size between censuses (not due t oemigration, excess mortality, or low fertility) . Some of the larger nationalities, especiall yUkrainians and Belorussians, also appear to have suffered moderate losses due to assimilation ,though not as large as some people have supposed .
Another aspect of assimilation, which does not strictly affect the ethnic composition o fthe population, is language . "Native language" is an important ethnic marker, closely tied t oan individual's ethnic self-concept, yet also distinct from it . For most people, a change i nnative language is a fundamental, though not definitive, indication of change in ethnic self -concept, fairly easily followed by ethnic reidentification . "Second language," on the otherhand, appears in general to be not as fully imbued with the emotional component of ethni cidentity. Whether non-Russians learn Russian as a second language depends heavily on mor epragmatic considerations: the availability of schools in Russian and the non-Russian language ,and the extent of contact between Russians and non-Russians both in the residential, work ,and day-to-day activities settings and during military service . Thus, both for Russians an dnon-Russians living in non-Russian areas, the extent of bilingualism indicates the degree o fmutual accommodation of groups . The extent of accommodation is not only due to attitude sand values; it also reflects practical incentives and opportunities to learn the other language .But in contrast to change in native language, learning a second language does not necessaril yconnote a serious change in ethnic self-concept . 8
Mortality . Differential mortality also affects the ethnic composition of the population ,although in the case of Soviet nationalities and the composition of Soviet regions, the effec tis much less than that of differential fertility and migration . As noted above, the Sovie tgovernment has published virtually no data on mortality by ethnic group . Data for region sare an imperfect substitute and probably understate ethnic differences in general, becaus eregions are not ethnically homogeneous . Also, Soviet mortality data are subject to substantia lerror (Anderson and Silver, 1986b, 1989 ; Dmitrieva and Andreev, 1987 ; Sinel'nikov, 1988) .Although regional comparisons of indicators such as infant mortality rates and life expectanc yat birth can show large differences in the overall health conditions of the population, use o fSoviet regional mortality schedules to measure or to project the mortality component o f
7 The closest approximation to such estimates is an unusual recent article by the directo rof the demography department of the Scientific Research Institute of the USSR State Commit -tee on Statistics (Volkov, 1989), which examines the dynamics of ethnic intermarriage base don census data from 1959, 1970, and 1979 .
8 For elaboration of the arguments in this paragraph, see Silver (1974a, 1976, 1978b) andAnderson and Silver (1983, 1985b) .
3
population change would be extremely problematic even if the data were meant to represen tethnic groups rather than regions . Indirect estimation of mortality rates from age distribution sin successive Soviet censuses is also risky, because a major source of the error in mortality dat aappears to be age overstatement in the censuses (Garson, 1987) . In any case, age distributionsby nationality have not been published since 1970, and even in 1970 the age data b ynationality were not published by sex .
Fertility. Fertility differences are a major source of the changing ethnic compositio nof the Soviet population as a whole and by region . Some data on fertility by ethnic groupshave been published for selected years (Bondarskaia and Darskii, 1988) . Soviet fertility dataarc also subject to considerable error, due to underregistration of births (Coale, Anderson ,Harm, 1979; Anderson and Silver, 1985a, 1986b, 1988 ; Anderson. Silver, Liu, 1989) . The mos tsevere underregistration occurs in Soviet Central Asia (Coale, Anderson, and Harm, 1979) . Fo rsome purposes, it is safer to infer birth rates from census counts than from vital registratio nfigures. Census counts of young children are also subject to error, however . In the 1959, 1970 ,and 1979 Soviet censuses, approximately 3 to 4% of preschool children were not counte d(Anderson and Silver, 1985a ; Kingkade, 1985) .
The foregoing discussion of the components of population change indicates some of th edata limitations on the study of the ethnic demography of the Soviet Union. The increasin gopenness of Soviet official statistics since 1986 has helped to alleviate the limitations . To date ,however, very little new data on ethnic groups have appeared, and we even lack somefundamental indicators from earlier years, such as age distributions by nationality and by se xfrom the 1970 and 1979 Soviet censuses . Perhaps the publication of results of the 1989 Sovie tcensus will improve the situation .
Available data do allow us to study many aspects of change in the ethnic compositio nof the Soviet population, including the two most important ones . Fertility is the componen tthat contributes most strongly to the changing ethnic composition of the Soviet population a sa whole . Fertility and migration together account for most of the change in the ethni ccomposition of the population by region . Fertility is the most important factor in the Asiati cparts of the Soviet Union ; migration is the most important in the European parts .
Data and Definitions
The main sources of data for this study are the Soviet censuses of 1959, 1970, 1979, an d1989 . Additional data come from vital statistics, particularly on births and deaths . None ofthese sources is infallible . We have shown systematic patterns of error Soviet census and vita lstatistics data, almost all of which are the result of administrative difficulties in assurin gaccurate and complete counts of the population and of vital events, not of deliberat emanipulation of the data (Anderson and Silver, 1985a, 1986b, 1988, 1989 ; Silver, 1986) .
The data that we use from the 1959 and 1970 Soviet censuses are for the "present "(nalichnoe) population; the data for 1979 and 1989 are for the "permanent" (postoiannoe)population, which is slightly smaller for the USSR as a whole . The Soviet central statistica loffice has changed its method of reporting on population between censuses . 9
9 For further discussion of the differences between the present and the permanen tpopulation, see Anderson and Silver (1985c) . There are some implications of these differencesfor our analysis . The urban permanent population is always smaller than the urban presen tpopulation, and the permanent population of Russians and members of other non-indigenou snationalities in non-Russian areas is always smaller than the present population of thes egroups. The change from a present population basis to a permanent population basis thus wil ltend to depress the urban population in 1979 and will depress the Russian population in 1979 ,compared to 1970, in the non-Russian republics. We think that this is not a major source o festimated changes in the proportion of the non-Russian republic populations who are Russians ,but this should be kept in mind .
4

Our discussion of regional patterns will focus on the fifteen union republics, and o nthe titular nationality of the republic . 10 We shall sometimes group the republics by region ,using conventional categories : (I) Baltic (Estonia, Latvia, Lithuania), (2) West (Belorussia ,Moldavia, Ukraine), (3) Russia (RSFSR), (4) Transcaucasia (Armenia, Azerbaidzhan, Georgia).and (5) Central Asia (Kirgizia, Tadzhikistan, Turkmenistan, Uzbekistan) and Kazakhstan .We shall refer to the Baltic, West, and RSFSR together as "European," and to Transcaucasia ,Central Asia, and Kazakhstan as " non-European. "1 2
Soviet censuses ask people to name their nationality (in Russian, natsional'nost') . 13 Theanswers are supposed to reflect the individual's subjective ethnic identity or affiliation . Al lpeople in the census have a "nationality" -- which is meant as an ethnic designation, not on eof citizenship) ' It is possible for a person to name any nationality that he or she chooses a sa census nationality, and therefore it is also possible to change self-designated nationalit ybetween census dates. We refer to such a change as "ethnic reidentification . "
It is important to keep in mind also that the Soviet statistical office sometimes changesits procedures for identifying and labelling ethnic groups, and for this reason that th epopulation totals by nationality can sometimes be volatile from one census to the next . As anillustration, no separate number of "Crimean Tatars " was listed in the 1959, 1970, or 197 9Soviet census reports. Instead, Crimean Tatars appear to have been lumped with the mor egeneral category "Tatars ." Preliminary data from the 1989 census, however, report the numbe rof "Crimean Tatars" for both 1979 (132,272) and 1989 (268,739), while the reported number o f"Tatars" in 1979 is reduced from the previously reported figure by the exact number o freported "Crimean Tatars" in 1979 . Two things that are important to note about the newfigures are that they mark the first time since the 1926 census that an official count of theCrimean Tatars has been reported in the Soviet Union and that the doubling of the reporte dnumber of Crimean Tatars between 1979 and 1989 probably reflects a substantial gain throug h"ethnic reidentification" -- not simply through natural increase of Crimean Tatars . 1 5
10 Other administrative-territorial units below the level of union republic are als onationality territories that are the traditional homelands and titular areas of particular ethni cgroups. These include autonomous republics, autonomous provinces, and autonomous districts .In this paper we shall deal primarily with the fifteen "union republic" nationalities .
11 Some scholars think that Kazakhstan should not be considered part of Central Asia, sinc eit lies primarily in the Steppe zone . The Kazakhs, however, have close historical and cultura llinks to the titular nationalities of Central Asia, and the Kirgiz language is very similar to th eKazakh language.
12 This, too, is more a matter of verbal convention than good geography, since much of_ th eRSFSR (beyond the Urals) lies in Asia . Also note that the distinction between European an dnon-European union republics is not identical to a distinction between those republics in whic hthe traditional religion of the titular nationality in not Moslem and those in which th etraditional religion of the titular nationality is Moslem ; Armenia and Georgia are non -European union republics, but Armenians and Georgians are traditionally Christian .
13 Natsional'nost' was the term used in the Soviet censuses of 1939, 1959, 1970, 1979, an d1989. In the 1926 census, the term narodnost' ("people") was used, purportedly in the interes tof obtaining a more complete and accurate picture of the range of ethnic affiliations. Forfurther discussion, see Silver (1986) .
14 Unlike the censuses in Yugoslavia, which allow designation of a category "Yugoslav,"Soviet censuses do not provide for a "Soviet" nationality .
15 This does not mean that non-Crimean Tatars changed their ethnic self-identification t oCrimean Tatar . More likely, it means that people with Crimean Tatar ethnic background wer e
(continued . . . )
5
Most Soviet citizens (age 16 or over) have an internal passport that also lists thei rnationality. Also, other identity papers and official records, such as school records, militar yrecords, and work records, list the individual's nationality . Unlike the "subjective" nationalit ythat the census is supposed to record, this is an "official" nationality, presumably based on th eindividual's ethnic heritage. The rules state that an individual may choose as his or he rnationality for the internal passport the nationality of either one of the parents, and that onc enationality has been determined in this way, it cannot be changed (for further discussion, se eSilver, 1986) . In principle, it is possible for an individual's subjective nationality (such as o nthe census) to differ from his or her official nationality . Census enumerators are not suppose dto check identity papers to establish the nationality of respondents . We are aware of no studie spublished in the USSR that examine the empirical relation between these two aspects o fnationality group membership . 1 6
All Soviet censuses have also ascertained the individual's "native language" (in Russian ,rodnoi iazyk) . This phenomenon, too, is subjective . Census respondents are not given a test o flanguage ability at the doorstep . Although "native language" is supposed to register thelanguage that people know best, survey research conducted in the USSR shows that sometime san individual does not know how to speak his or her "native language ." For this reason ,"native language" may be more a marker of ethnic background than of language use o rlanguage preference .
The Soviet censuses of 1970, 1979, and 1989, also asked people what "other language o fthe peoples of the USSR" they could "freely command ." Although the term "freely command "is supposed to be equivalent to "freely converse , " no test of language competence is given . Thequestion was added to the censuses primarily as a way to find out how many non-Russian sknew the Russian language as a second language, that is, were bilingual (Silver, 1975 ; 1986) .
Perhaps as a result of this special purpose of the second language question, the answer sappear to be unstable. Between 1970 and 1979, the percentage of Estonians who claime dRussian as a second language declined from 29 to 24 . 17 This improbable result apparentl yreflected a popular referendum of attitudes toward the political leadership of the republic.A similar improbable shift occurred for Lithuanians between 1979 and 1989: the percentagewho claimed to freely command Russian as a second language dropped from 52 .1 to 37 .9 (it hadbeen 35.9% in 1970). In the 1970-1979 intercensal period, the percentage of Uzbeks wh oclaimed Russian as a second language rose sharply from 14 to 49 . This rise, too, is improbable ,and could reflect the fact that in 1979 census enumerators were encouraged to be ver y
15 ( . . .continued)more likely to call themselves Crimean Tatars in the 1989 census than in the 1979 census . Thi swould reflect the more favorable climate for claiming such an affiliation in 1989 than in 1979 .A similar trend is apparent for the Vepps (who increased by 65 percent between 1979 an d1989), Mountain Jews (who more than doubled), Georgian Jews (up by 91 percent), and Turk s(who more than doubled) . The "Turks" were most likely Meskhetian Turks, who have reside dprimarily in Uzbekistan and Kazakhstan after being deported there during World War II. Thenewly published figures for the Turks may represent the first official tally of Meskhetia nTurks in any Soviet census .
16 Kozlov (1969, 1982) has proposed that the existence of an official nationality on th einternal passport and other documents constrains the shifting of self-identified nationality .
17 It increased to 34 percent in 1989 .
18 The interpretation that we have heard in Estonia is that the 1979 census occurred shortl yafter a new First Secretary of the Communist Party of the Estonian SSR was installed . ThisFirst Secretary was regarded by many Estonians as too Russified ; their responses to the censu squestion on second language thus represented a covert political protest .
6
generous in listing knowledge of Russian as a second language . 19 This percentage dropped toa more probable figure of 23 .8 in 1989 .
Analysi s
The Soviet Union as a Whol e
Table 1 lists the population sizes of more than 100 nationalities, grouped by the officia lstatus of the nationality in the Soviet federal system . To simplify the presentation, we als oclassify the nationalities into four subgroups -- Russians, non-Russian Slays, other non -Moslems, and Moslems . Table 1 also shows how each group was classified .
Figure 1 shows the population in each of the four subgroups as of the Soviet censuse sof 1959, . 1970, 1979, and 1989 . Each subgroup has grown in every intercensal interval .Nationalities within each of the groups differ in their rates of growth . A few nationalitie shave experienced negative growth -- due to emigration (the primary explanation for the Jews)or assimilation (the primary explanation for the Mordvinians and Karelians and also perhap sthe Poles) as well as to low fertility .
Figure 2 shows the proportion of the total Soviet population that each of the fou rsubgroups comprised at each of the census dates . Although all four subgroups increased i nabsolute size over time, all except Moslems declined as a proportion of the Soviet population .
Figure 3 shows the average annual growth rates of each of the four subgroups for eac hof the three intercensal periods. 20 The growth rate of each subgroup was lower in late rintercensal intervals than in earlier ones . The decline in the growth rate of Russians in th ethree intercensal periods is consistent with an increase in their population doubling time fro m62 years, to 99 years, to 128 years ; the decline in the growth rate of Moslems is consistent wit han increase in their population doubling time from 22 years, to 28 years, to 29 years . Clearly,however, the growth rate of Moslems far exceeded that of the other three groups during al lthree intercensal periods .
Figure 4 shows a projection of the size of the Soviet population as a whole and each o fthe four subgroups if each group maintained its 1979-89 annual growth rate indefinitely int othe future. The population given in 1979 and 1989 is as reported in the censuses . Th epopulations in future years are projections. Although the growth rates of each group willcertainly change, this type of exercise is useful for examining the implications of existin gdifferentials . 2 Under the assumption of the maintenance of the 1979-89 growth rates, th enumber of Moslems would exceed the number of Russians by the year 2066 . Clearly, thi s
19 This is, of course, speculative . The absence of age-specific data on native and secon dlanguage from the 1979 census precludes the exploration of alternative explanations of th epatterns of change in language between 1970 and 1979 .
20 An average annual growth rate assumes exponential growth between two dates ,calculated according the formula P2 = ert·P1 , where P 2 is the population at Time 2, e is the i se is base of the natural logarithm, r is the average annual rate of growth, t is the number o fyears between Time 1 and Time 2, and P 1 is the population at Time 1 . A population growin gat a rate of 1% per year would double in 69 years, a population growing at 2% would doubl ein 35 years ; and a population growing at 3% would double in 23 years .
21 The growth rates are a product of each of the components of change mentioned earlier
as well as of the age structure of the population. We are not attempting to capture the effect sof all of these factors, nor to predict the course of demographic change, but only to highligh tthe implications of the recent overall growth rates for the changing composition of the Sovie t
population .
7

implies a very different future ethnic composition of the Soviet population than has been tru euntil now .
The projected changes in the ethnic composition of the Soviet Union as a whole ar eclearer in Figure 5, which shows the projected proportion of the total Soviet populatio ncomprised of Russians, all Slays, and Moslems, assuming continuation of the 1979-89 growt hrates of each group . In that situation, Russians would cease to be a majority of the Sovie tpopulation by the year 1994, the Soviet Union would cease to be a predominantly Slavi ccountry by 2051, Moslems would outnumber Slays in the USSR by 2057, and Moslems woul dbe a majority of the Soviet population by 2066 .
As noted, these are extrapolations from the 1979-89 rates of growth of the differentpopulation segments . They are not meant as predictions . If we had reliable nationality -specific data on fertility, mortality, assimilation, and age distributions for recent dates, w ecould make cohort component projections . By estimating fertility, mortality, and ag edistributions for nationalities, Kingkade (1986, 1989) has made cohort component projectionsunder a variety of assumptions . Under the set of assumptions that Kingkade considers th emost likely (his median variant), Russians would lose their majority status very early in th e1990s .
There are three main differences between our approach and Kingkade's approach t oprojecting the population of Soviet subgroups . The first is data availability . Kingkade di dnot have data from the 1989 Soviet census to work with when he made his estimates . Th esecond reason is methodological . Kingkade's method takes into account information about theage structure of separate nationalities, as well as assumptions about age-specific fertility an dmortality for these nationalities, and how they will change over time. Our method extrapolate sfrom recent population growth rates (by groups of nationalities), not from the demographi ccomponents . In principle, especially for longer-term predictions of population growth, use o finformation on age structure is important. Given the current limited information about theage structure of Soviet nationalities, projection from demographic components is difficult andrequires additional assumptions .
A third difference between Kingkade's and our approaches is the assumption mad eabout assimilation. Kingkade makes no assumption about the growth in the number o fRussians due to assimilation . We take assimilation into account implicitly, because the growt hrate of Russians between 1979 and 1989 reflects the consequences of all four component sdescribed earlier : fertility, mortality, emigration, and assimilation (ethnic reidentification) .
In an earlier paper, based on the 1959 and 1970 Soviet censuses, we projected tha t. . . if Russians were not gaining through reidentification, they would declineto only half of the Soviet population in 1994; because they are gaining throug hreidentification, they will not decline to half of the Soviet population unti l2003 -- nine years later (Anderson and Silver, 1983 : 480) .
This projection did not take into account changes in population growth rates between 1959 -70 and later censuses . But we think the effect of assimilation must be taken into account i nprojections of the ethnic composition of the Soviet Union .
The recent rise in ethnic awareness and assertiveness among the non-Russia nnationalities could affect assimilation rates in two ways . Both involve the changing relativ eattractiveness of different ethnic self-designations . First, the propensity of members of somenon-Russian groups to reidentify as Russians could have slowed down or stopped. In therecent past, the groups that were changing most rapidly to Russians were non-Russians wh owere of Orthodox traditional religion and whose titular areas in the Soviet federation wer eat a lower status than that of union republic . 22 Also, non-Russian Slays, though not showin g
22 See Anderson (1979) and Anderson and Silver (1983) . Other historical factors help t oaccount for this (Anderson and Silver, 1985b) .
8
an especially high rate of reidentification to Russian . contributed more than half of th eestimated total number of ethnic reidentifiers between 1959 and 1970 (Anderson and Silver ,1983) . In addition, the children of non-Russians who married Russians living outside of th etitular area of nationality of the non-Russian spouse were quite likely to choose Russian a stheir nationality on their internal passport -- and presumably also, in the census . 2 3
A second way that the rise of ethnic self-awareness of non-Russians could affectassimilation rates is that many individuals who in the 1979 census called themselves Russian scould have identified with a different nationality in 1989. A large pool of people were goo dcandidates for such a step. Persons who had previously switched from a non-Russian self -label to Russian (between 1959 or 1970 and 1979) could have switched back -- especially i fthey retained knowledge of the language of their former nationality .
In the context of the census conducted in January 1989, it is possible that Russian swould experience some net population loss as a result of a reversal of historical tendencie stoward assimilation . Had the latest census been scheduled for January 1990 rather than 1989 ,it is even more likely that increased ethnic self-awareness among such groups as th eUkrainians -- which found expression in large public demonstrations early in 1989 but afterthe mid-January census date -- could have cut further into the size of the Russian majority .
The shifting future ethnic balance of the Soviet population has implications for manyaspects of social welfare policy, regional development strategies, manpower policy, an dlanguage and cultural policy . 24 The reduction of Russians to a numerical minority of th epopulation of the USSR would also be especially important as a political event, since the USS Rwould then become a country of minorities . Based on their shared history and culture, th eother major Slavic nationalities (Belorussians and Ukrainians) are often perceived as a par tof the "Slavic majority " of the USSR, and they often comprise a significant part of the"Russian-speaking" population in non-Russian parts of the Soviet Union . But the greaterethnic assertiveness of non-Russian Slays, accompanied by the reduction of Russians to les sthan half of the Soviet population, could sharpen perceptions of the differences in thebackgrounds and orientations of the Slavic groups.
The Union Republic s
Overall Population Growth Rates . Although the changes in the ethnic composition o fthe Soviet population as a whole are interesting, changes in particular regions are probabl ymore salient to most Soviet citizens . Figure 6 shows the population of each of the fifteenSoviet union republics at each of the four most recent Soviet census dates . Every republic ha sgrown in size in each intercensal period . The republics differ greatly in size, with the RSFS Rbeing over twice as large as the Ukrainian SSR, the second largest union republic . In 1989, th ethree Baltic republics -- Estonia, Latvia, and Lithuania -- together comprised less than 3% o fthe total Soviet population .
Differences in Growth by Nationality within Republics . None of the republics i sethnically homogeneous . Figure 7 shows the proportion of each republic 's populationcomprised of that republic's titular nationality in 1959, 1970, 1979, and 1989 . In 1989, thisproportion ranged from a low of .40 for Kazakhs in Kazakhstan to a high of .93 forArmenians in Armenia. In all of the non-European republics, the proportion of the populatio nfrom the titular nationality has increased in each successive census . In all of the Europea n
23 See Gantskaia and Terent'eva (1965) and Terent'eva (1969). In contrast, in a majorityof cases when a Russian and a non-Russian married inside the titular area of ethnic group o fthe non-Russian spouse, the children were likely to choose the nationality of the non-Russia nparent as their passport nationality (Ievstigneev, 1971, 1972) .
24 For commentary on the manpower and regional development issues, see especiall yFeshbach and Rapawy (1973, 1976) and Rapawy and Baldwin (1982) .
9

republics except Lithuania, the proportion of the population from the titular nationalit ydeclined in each intercensal period . The proportion of Lithuania comprised of Lithuanian sincreased between 1959 and 1970 and then declined slightly over the 1970-1979 and 1979-8 9intercensal periods . Estonia and Latvia show especially rapid declines in the proportion o ftheir populations comprised of the titular nationality .
In most cases, the bulk of the population of a republic that is not from the titula rnationality is comprised of Russians . In 1989, the titular nationality and Russians togethe rconstituted 94.8% of the population of Armenia (the highest percentage among unio nrepublics), 94.7% of the population of the Ukraine, and 69 .8% of the population of Tadzhikis -tan (the lowest percentage among union republics) . A full analysis of ethnic diversity an dchange would examine all of the Soviet nationality subgroups in various Soviet regions . Forsimplicity, this paper concentrates on the behavior of the titular nationality of that republi cand of Russians in that republic .
Figure 8 shows the proportion of the population of each republic comprised of Russian sin 1959, 1970, 1979, and 1989. Among the non-Russian republics in 1989, this proportio nranged from a low of .02 in Armenia to a high of .38 in Kazakhstan . In Kazakhstan at th efirst three census dates, Russians outnumbered Kazakhs. In 1989, however, the number ofKazakhs (6,531,921) overtook the number of Russians (6,226,400) . Russians have notoutnumbered the titular nationality in any other non-Russian union republic at any of th efour census dates .
Figure 9 shows the average annual growth rates of the total population of each republi cfor the three recent intercensal periods. In every republic, the growth rates declined fro m1959-70 to 1970-79 . In all republics except the Russian Republic and Georgia, growth rate salso declined from 1970-79 to 1979-89 .
Republic growth rates are the result of a combination of often very different growthrates for the nationalities in the republic . Figure 10 shows the average annual intercensa lgrowth rate for the titular nationality in its own republic in 1959-70, 1970-79, and 1979-89 .Figure 11 shows comparable information for Russians within union republics .
The titular nationalities of the union republics experienced positive growth in ever yrepublic in all three intercensal periods. However, the annual intercensal growth rate of th etitular nationalities in 1979-89 ranged from a low of .00162 for Estonians in Estoni a(consistent with a population doubling time of 426 years), to a high of .03480 for Tadzhiks i nTadzhikistan (consistent with a population doubling time of 20 years) .
In the first two intercensal periods, the Russian population of every republic excep tGeorgia and Azerbaidzhan experienced a positive growth rate . In the latest intercensal period-- 1979-89 -- the Russian growth rate was negative in six republics : the three Transcaucasia nrepublics, as well as Uzbekistan, Tadzhikistan, and Turkmenistan . Moreover, in every non -Russian republic, the growth rate of Russians declined between 1979-89 compared with th eprevious intercensal period . As will be seen, the negative growth rates of Russians in Trans-caucasia and parts of Central Asia in the most recent intercensal period were caused by out -migration of Russians .
In 1979-89, the growth rate of Russians ranged from a high of .01676 in Belorussi a(consistent with a population doubling time of 41 years) to a low of - .03101 in Armeni a(consistent with the population being reduced by 50% in 22 years) . This is an astonishingl yhigh out-migration of Russians from Armenia .
Some implications of the differential growth rates by nationality for the future ethni cmix of Soviet republics are suggested in Figure 12. Figure 12 shows the growth rate of th etitular nationality minus the growth rate of Russians in the given republic . A positive numbermeans that the population of the titular nationality is increasing more rapidly than that ofRussians in the republic ; a negative number means that the number of Russians is increasin gmore rapidly than the titular nationality in the given republic .
10
In every non-European republic, the titular nationality has grown more rapidly tha nRussians in all three intercensal periods . The situation is very different in the Europea nrepublics . In 1959-70, Russians grew more rapidly than the titular nationality in ever yEuropean republic except Lithuania and Moldavia ; in 1970-79, and 1979-89, the Russia npopulation grew more rapidly than the titular nationality in every European republic . Thus.the non-European republics have become less Russianized over time, while the European one shave become more Russianized .
Table 2 shows the proportion of the population of each republic in 1989 comprised o fthe titular nationality and of Russians (columns 1 and 2) . Since all of the European republic shad a larger proportion of their population from the titular nationality than Russians in 1989 .while they had a higher growth rate of Russians than the titular nationality in 1979-89, acontinuation of the 1979-89 growth rates would eventually lead to Russians outnumbering th etitular nationality in every European republic . Table 2 shows how many years after 1989would be needed for this to happen, as well as the projected year in which the number ofRussians in a given republic would equal the number of members of the titular nationality .
Note also that although in 1979 Russians outnumbered Kazakhs in Kazakhstan, th enumber of Kazakhs overtook the number of Russians before the 1989 census .
Again it is important to keep in mind that these figures are projections from pas ttrends, not predictions about the future . In several non-Russian republics in the last tw oyears, local political leaders have initiated steps that may slow and perhaps reverse the proces sof in-migration of Russians and members of other non-titular nationalities . In addition, as w eshall see, there is evidence that well before Mikhail Gorbachev became General Secretary o fthe Communist Party, the pace of in-migration of Russians to non-Russian areas had slowe ddown.
The Effects of Natural Increase . The changing ethnic composition of Soviet republic sresults primarily from a combination of differential fertility and differential net in-migration. We examine fertility first . Figure 13 shows the total fertility rate (TFR) of th eSoviet Union as a whole and of Soviet republics in 1958-59, 1969-70, 1978-79, and 1986-87 . 2 5
In Central Asia, the TFR has declined since 1969-70 . In the European republics, the TFR ha sbeen lower than in the non-European republics, but the TFR increased in all the Europea nrepublics except Belorussia between 1978-79 and 1986-87 .
As with the growth rate, the TFR in a republic is a result of the different fertilit ylevels of the various nationalities in the republic . Figure 14 shows the TFR of the titula rnationality of each republic in 1958-59, 1969-70, and 1978-79 as reported by Bondarskaia an dDarskii (1988) . 26
We do not have direct information on the TFR of Russians within Soviet republics . Wewanted an indication of the size of the gap between the fertility level of the titula rnationality of a given republic and the fertility level of Russians in that republic . A napproximation is shown in Figure 15, which depicts the TFR of the titular nationality in agiven republic minus the TFR of Russians in the RSFSR, as reported by Bondarskaia an dDarskii (1988). According to the estimates in Figure 15, in 1969-70 and in 1978-79 in ever yrepublic the TFR of the titular nationality exceeded that of Russians, although in ever yrepublic except Latvia, the size of the differential decreased between 1969-70 and 1978-79 .
25 The total fertility rate (TFR) is the number of children that a woman would have in he rreproductive life if she followed a given age-specific fertility schedule, such as that of al lwomen in a given year .
26 A reading of the age-specific fertility schedules that Bondarskaia and Darskii (1988 )report strongly suggests that the authors transposed age-specific mortality figures above ag e30 for the Kirgiz and Tadzhiks in 1978-79. The data in Figure 14 correct this apparent error .
1 1
The fertility of the titular nationality in Estonia, Latvia, the Ukraine, and Georgia wa slower than that of Russians in the RSFSR in 1958-59 . That situation had reversed by 1969 -70, and remained the same in 1978-79 . Hence, it is not likely that fertility difference scontributed to the increasing Russianization of Estonia and Latvia over time ; in fact, highe rfertility of the titular nationality probably slowed that trend .
The Effects of Migration. We next examine the effects of migration on the ethni ccomposition of republics . Since do not have any direct information on migration by ethni cgroups, we use an indirect approach .
We use a variation on the residual approach to the estimation of net migration . I nthe residual approach, the growth of a group within a geographic area between two dates i scalculated. Then the growth that would have occurred due to natural increase alone i scalculated . The difference between the actual increase in the group and the predicted increas edue to natural increase alone is an estimate of the net migration of the group into the are abetween the two dates .
We cannot fully implement the residual approach, however, because we do not have in -formation on the natural increase (crude birth rate minus crude death rate) of nationalitie sin the Soviet Union as a whole or within particular geographic areas . Therefore, we mus testimate the contribution of natural increase to the growth of ethnic groups within geographi careas .
As mentioned earlier, with few exceptions Soviet ethnic groups experienced very littl einternational migration since 1959 . Hence, in the Soviet Union as a whole, the change in thesize of Soviet ethnic groups was mainly the result of natural increase . 27 We use this fact t oestimate the growth that would have occurred to an ethnic group within a republic due t onatural increase alone .
We divide the number of members of an ethnic group in the Soviet Union as a whol eat the second census date (such as 1970) by the number of members of the same ethnic grou pin the Soviet Union as a whole at the first census date (such as 1959) . We then multiply thisratio by the size of the same ethnic group in a given republic at the first census date to obtainthe predicted size of that ethnic group in that republic at the second date due to the effect sof natural increase . We subtract the predicted size of the group at the second date fro mreported size of the ethnic group at the second date to obtain an estimate of net migration o fthe group into the republic between the two dates . 2 8
Figure 16 shows the estimated effects of net migration of the titular nationality o frepublics between 1959 and 1970, 1970 and 1979, and 1979 and 1989 . The estimated amountof net migration between two census dates is divided by the size of the titular nationality i nits own republic at the first date . Therefore, what is graphed in Figure 16 is the proportio n
27 There are two other sources of the difference in the number of people of a give nnationality reported in successive censuses : differential undercount and assimilation. Wecannot make corrections for either of these factors . We have no evidence on which to bas eestimates of differential census undercount by nationality . On the other hand, in principl eit would be possible to take assimilation into account, at least between 1959 and 1970, fo rwhich we have made estimates (Anderson and Silver, 1983) . But these estimates could be mad eonly for the population of the nationality in the Soviet Union as a whole, whereas we woul dlike to know the amount of assimilation within a given republic .
28 This is similar to the approach used in Silver (1983) . These estimates will attribute to omuch of the growth in a republic to natural increase and too little to net migration if th enatural increase of the group in the republic is less than that of the nationality elsewhere i nthe Soviet Union. This will generally be true for Russians, since the fertility of Russian soutside of the Russian Republic will generally be lower than that of Russians in the Russia nRepublic .
1 2

by which the titular nationality would have increased or decreased between censuses in it sown republic due to its own migration into and out of that republic .
The most striking result in Figure 16 is the large extent of migration of Armenians int oArmenia in the first two intercensal periods . We estimate that the number of Armenians i nArmenia would have increased by 15% between 1959 and 1970 due to in-migration o fArmenians . In 1959-70, part of the in-migration could have involved the continuation o frepatriation of Armenians from abroad. But it is likely that the bulk of the Armenian in -migrants to Armenia in both intercensal periods came from other parts of the Soviet Union ,probably mainly from Georgia and Azerbaidzhan, which experienced extremely low growt hin the number of Armenian inhabitants between 1959 and 1970 and absolute declines in th enumber of Armenian inhabitants between 1970 and 1979 as well as between 1979 and 1989 . 29
Other nationalities also migrated into their titular republics, although at a less dramati clevel than for Armenians . There was considerable net migration of Estonians into Estonia ,especially between 1959 and 1970 . This was largely due to return of Estonians from Siberia .Members of various Central Asian nationalities also tended to move back to their hom erepublics, especially between 1959 and 1970 . But this tendency reversed in many republic sbetween 1979 and 1989 . For example, whereas in the 1959-70 and 1970-79 intercensal period sTadzhiks tended to resettle into Tadzhikistan, between 1979 and 1989 more Tadzhiks appea rto have migrated out of Tadzhikistan than into it .30
Figure 17 shows similar information for the net migration of Russians into republic sbetween censuses . Migration of Russians out of the Russian Republic has decreased in eac hsuccessive census interval . Between 1979 and 1989, the net migration of Russians from th eRSFSR was close to zero. But there was still considerable movement of Russians into and outof other republics during all three intercensal intervals .
There was substantial net out-migration of Russians from Azerbaidzhan and Georgi ain all three intercensal periods, and from all three Transcaucasian republics in the las tintercensal period . In addition, although more Russians migrated into than out of Kazakhsta nand the Central Asian republics in both the 1959-70 and 1970-79 periods, their net migratio ninto Central Asia was much smaller in the second period and then turned negative in the lastten years .
Russians experienced net in-migration to all of the non-Russian European republics i nthe 1959-70 and 1970-79 intercensal periods . However, in every European republic excep tLithuania, the level of Russian in-migration decreased between the two periods, and in 1979 -89, it further decreased in each of those republics . Moldavia experienced net out-migratio nof Russians in the latest intercensal period . Lithuania was the only non-Russian republic t oexperience a larger net in-migration of Russians between 1979 and 1989 than in the previou sintercensal period. In contrast, in Estonia and Latvia, the in-migration of Russians slowed i neach of the last two intercensal periods . While in 1970-79, the level of Russian in-migratio nwas higher to Estonia than to any other non-Russian republic, in 1979-89 it was highest t oBelorussia (Estonia was second) .
29 For further discussion, see Silver (1983) .
30 Our use of the residual method of estimating net migration is subject to error . It ispossible that some of the results in Figure 16 are artifacts of data improvement. For example ,if Tadzhiks living in the Tadzhik SSR were undercounted in the 1959 census but counted mor eor less completely in 1970, they could appear to have been migrating into Tadzhikistan whe nthey were not in fact doing so . In addition, if there is a large difference between the rat eof natural increase of a given nationality within its titular area and the rate of natura lincrease outside the area (and if a substantial number of persons of the given nationality liv eoutside the titular area), the residual method might lead to an over- or underestimate of th enet migration of that nationality into its own republic .
1 3
The Relative Contribution of Natural Increase and Migration . Figure 18 shows th eestimated number of people added to the population of each republic between census dates du eto four factors : (1) natural increase of the titular nationality, (2) net in-migration of th etitular nationality, (3) natural increase of Russians, and (4) net in-migration of Russians .Panel A shows the results for 1959-70, Panel B for 1970-79, and Panel C for 1979-89 . It isstriking that in Kazakhstan, the number of Russian net in-migrants decreased from 1,028,73 3in 1959-70 to 110,534 in 1970-79 .
Figure 18 clearly reveals the relative importance of the four sources of change in th enumber of members of the titular nationality and Russians for large republics such as th eUkraine and Uzbekistan . In both cases, the largest absolute contribution to the population o fthe republic is the natural increase of the titular nationality. The same is true of most othe rnon-Russian republics. However, for small republics, such as Estonia or Moldavia, the impac tof these various sources of population change can be assessed more clearly if considere drelative to the size of the republic .
Accordingly, Figure 19 shows the information from Figure 18, but in each case th eestimated contribution of each factor to the change in the republic's population is divided b ythe total population of the republic at the first census date . Thus, although there were onl yan estimated 63,024 Russian net in-migrants to Estonia between 1959 and 1970, Russian in -migration in that period by itself would have resulted in an increase in the total populatio nof Estonia by 5% .
It is clear from Figure 19 that in all three intercensal periods the major source o fpopulation increase in every republic except Estonia and Latvia was natural increase of thetitular nationality. In Estonia and Latvia, in contrast, the largest source of populatio nincrease was net in-migration of Russians (except for 1979-89 in Latvia, when the larges tsource was the natural increase of Russians) .
We have seen that the extent of Russianization of the population of various republic sis very different, with Estonia and Latvia gaining in the proportion of the population that i sRussian, the Transcaucasian republics becoming less Russian mainly due to out-migration o fRussians, and the Central Asian republics and Kazakhstan becoming less Russian mainly du eto higher fertility of the titular nationality than Russians, but partly due to decreases i nRussian in-migration .
Interethnic Contact and Language Pattern s
It is relevant in this context to examine briefly the extent to which members of th etitular nationality and Russians live in similar settings and are able to effectively interac twith each other. There are many aspects of this question . We will examine two in this paper :(1) the tendency of members of the titular nationality and Russians to reside in urban areas ,and (2) the extent to which members of the titular nationality and Russians report that the yknow each other's languages .
Urban Residence . Figure 20 shows for the Soviet Union as a whole and for each unio nrepublic the proportion of the population that lived in urban areas at each of the four recen tcensus dates . Every republic except Turkmenistan became more urban between 1959 and 1979 .All the Central Asian republics became less urban between 1979 and 1989 . This probabl yreflects the combined effect of the much higher fertility in rural areas than in urban areas ,the slow pace of migration of the titular nationality from the countryside to cities, and th eout-migration of Russians from the cities of Central Asia to other republics .
1 4

Figure 21 shows the proportion of the titular nationality that lived in urban areas fo reach republic in 1959, 1970, and 1979 (the data are not yet available for 1989) . 31 Figure 22shows comparable information for Russians in each republic . In every republic, Russians ar emore likely to live in urban places than members of the titular nationality . This in itself i snot surprising, since many Russians are recent migrants to the non-Russian republics, and ne wmigrants tend to settle in urban places to take jobs in industry or trade . However, in Centra lAsia and Kazakhstan, the difference between Russians and the titular nationality in th etendency to live in urban places is truly striking . In 1970, Russians were a majority of th epopulation of urban areas in Kirgizia and Kazakhstan .
Language Knowledge . Figure 23 shows the proportion of the members of the titula rnationality who reported Russian as their native language in 1959, 1970, 1979, and 1989 . 32 I nmost republics, the proportions are very low . In the Ukraine and Belorussia, however, th eproportions are substantial, especially in 1979 and 1989 . We know that adoption of Russia nas native language by a non-Russian is often a first step to that non-Russian changing his o rher self-reported nationality to Russian (Anderson, 1979 ; Anderson and Silver, 1985b) . Figur e23 thus indicates a substantial potential for ethnic reidentification of Ukrainians an dBelorussians as Russians .
Figure 24 shows the proportion of' the members of the titular nationality of a republi cthat reported Russian as either their native language or their second language in 1970, 1979 ,and 1989 . 33 This generally can be interpreted as the proportion of the members of the titula rnationality who know the Russian language reasonably well . 34 As mentioned earlier, however ,some of the intercensal changes in this proportion, such as those in Uzbekistan, Estonia, andLithuania, are implausible .
31 For 1979, the nationality distribution in rural and urban areas of union republi cpopulations has not been published . However, the distribution of ethnically homogeneou sfamilies, by size of family, has been published for urban and rural populations of each unio nrepublic . Similar information on the rural-urban distribution of ethnically homogeneou sfamilies has been published for 1970 . For 1959 and 1970, we have reported information o n
the urban-rural distribution of nationalities within republics . To estimate the proportion o fmembers of the titular nationality and the proportion of Russians in each republic who live din urban areas in 1979, we first took the proportion of members of ethnically homogeneou sfamilies of that nationality in the republic who lived in urban areas . We also calculated thi sproportion for the given nationality and republic for 1970 . In 1970 we divided the reporte dproportion urban for that nationality in that republic by the proportion from the family data .We multiplied this ratio from 1970 by the proportion of members of that nationality in tha trepublic in urban places in 1979 calculated from the data on families to obtain an estimate o fthe proportion of a given nationality in a given republic who lived in urban areas in 1979 .
32 The data on the percentage who claimed Russian as their native language in 1989 ar ean approximation. We know the percentage of the population of each nationality that claime dtheir own nationality 's language as native, but not the percentage of the members of a non -Russian nationality that claimed Russian as native language . We approximate the latter figur eby using information from the 1979 census . We assume that of those who did not claim thei rown nationality 's language as native, the same percentage claimed Russian as their nativ elanguage in 1989 as in 1979 . Similarly, we do not know what proportion of Russians in a give nnon-Russian republic claimed the language of the republic's titular nationality as nativ elanguage. We use a similar approach to estimate this proportion .
33 Since this is the sum of those who claimed Russian as their native language and thos ewho claimed Russian as a second language, for 1989 we again rely on an approximation of th efirst value.
34 We are aware that some non-Russians who claim the language of their nationality a stheir native language may not actually speak it well, if at all . It seems less likely, however ,that a non-Russian who claims Russian as their native language will not speak it .
1 5
Nonetheless, it is clear that members of the European nationalities were more likely t oreport knowledge of Russian than members of the non-European nationalities . Among thetitular nationalities of the union republics, knowledge of Russian was most common in th eUkraine and Belorussia, and most rare in Central Asia . Kazakhs in Kazakhstan were also ver ylikely to know the Russian language . This is probably because Kazakhs in Kazakhstan needto interact with Russians . In 1970, over half of the population of rural areas of Kazakhsta nwas comprised of Russians and Ukrainians .
Figure 25 shows the proportion of Russians in each republic who reported the languag eof the titular nationality as their native language or a second language in 1970, 1979, and1989. Russians in Central Asia and Kazakhstan rarely knew the language of the titula rnationality. Russians in Transcaucasia and in the European republics were much more likel yto know the language of the titular nationality . This was especially true in the Ukraine an dBelorussia . However, some of those "Russians" in the Ukraine and Belorussia who reporte dUkrainian or Belorussian as second language probably had formerly identified themselves a sUkrainians or Belorussians .
That Russians in several of the non-Russian republics appear to have become mor elikely to claim knowledge of the titular language in successive censuses might also be a resul tof other factors. First, especially in recent years, it could be a result of increased pressur eto use the local language . Second, it could be a result of selective migration : since many o fthese republics have experienced reduced Russian net in-migration, and some have ex-perienced net Russian out-migration, it is possible that Russians who come to a non-Russia narea, or who are most likely to remain there, are those who have adapted to the local cultur eor learned the local language .
Inspection of Figure 25 suggests that although the policies proposed in some republic sof requiring knowledge of the language of the titular nationality as a prerequisite for ful lcivil rights might be difficult to implement in the European republics, they would be virtuall yimpossible to implement in Central Asia and Kazakhstan .
Summary and Conclusion s
Soviet Union as a Whol e
The impending decline of ethnic Russians to a minority within the Soviet Union wil lhave greater political and symbolic significance than demographic significance . However, th e
fact that the Soviet Union could become a predominantly Moslem country shortly after the middleof the next century would have larger consequences .
Certainly, fertility and mortality of Soviet nationalities will change over time, and th eprojection of 1979-89 growth rates is not a prediction of the future . However, the exactpattern of fertility change, especially among traditionally Moslem groups, along with change sin the relative accommodation or isolation among nationalities, will be important in the Sovie tfuture.
Regions
The patterns of change in the ethnic composition of Soviet regions are very diverse .While the non-European republics are becoming more homogeneous, the European republic sare becoming more Russianized, though the pace of Russianization seems to have slackene din recent years . Briefly, the patterns within particular regions are as follows .
Central Asia and Kazakhstan . This region is becoming more indigenized over time .This mainly because of higher fertility of the indigenous nationalities compared to Russians ,and partly a result of decreasing levels of net in-migration by Russians . Russians and th e
16

indigenous nationalities live in very different settings, and compared to other regions of theUSSR. each group has very little knowledge of the other group's language .
Kazakhstan has become more indigenized, due to a combination of higher fertility o fKazakhs than Russians and large declines in the net in-migration of Russians . By 1989, thi sled to the Kazakhs outnumbering Russians in the republic .
Transcaucasia . This region is also becoming more indigenized over time. This is partl ydue to higher fertility among the indigenous population than among Russians as well as to a nacceleration of Russian out-migration . In Armenia, net in-migration of Armenians, especiall yfrom Georgia and Azerbaidzhan, is also a significant factor .
Baltic . Estonia and Latvia are becoming increasingly Russianized over time . as a resul tof net in-migration of Russians . This is countered to some extent by fertility differentials bynationality -- higher fertility among the indigenous population than among Russians .Moreover, the level of in-migration of Russians to Estonia and Latvia has declined in the las ttwo intercensal periods .
Lithuania has had almost no change in the proportion titular between 1959 and 1979 ,due to higher fertility of Lithuanians than Russians, which is offsetting in-migration o fRussians. In contrast to Estonia and Latvia, however, the level of in-migration of Russian sincreased in each of the last two intercensal periods .
The level of knowledge by Russians and the titular nationalities of each other' slanguages in the Baltic is generally higher than in Central Asia and somewhat higher than i nTranscaucasia .
West. In the Ukraine and Belorussia, there has been only a small decline over time inthe proportion titular. This steady state is a result of natural increase of the titula rnationality and the continued high proportion of the population of the republics that i stitular. It is perhaps offset somewhat, however, by the tendency of the indigenous nationali-ties to reidentify as Russians or to migrate from the republics . In both republics, there is asubstantial potential for change to Russian ethnic self-identification by members of th eindigenous nationality . Also, there are higher levels of knowledge by titular nationalities ofRussian and of the titular language by Russians than elsewhere in the USSR .
Moldavia also has had very little change in the proportion titular between 1959 an d1979. This has been due to substantially higher fertility of Moldavians than Russians, whic hcounters the in-migration of Russians and others .
Analysis of Demographic Change in a Social and Political Contex t
In a book review published in the journal Sotsiologicheskie issledovaniia in Januar y1988, Ia . I . Rubin criticized Brian Silver for his explanation of the trends in migration i nTranscaucasia between 1970 and 1979. Silver had concluded :
In the absence of a primary investigation of the motives of migrants, we ca nonly speculate about the motives for the cross-migration of Armenians an dAzeris. One plausible explanation is that the historic antipathy betweenmembers of the two groups has crystallized in recent years to encourage mutua lavoidance and resettlement . Despite cultural policies in the Transcaucasianrepublics that have been aimed at reducing ethnic tension . . . an unfavorabl ecultural, administrative, or work environment for Armenians in Azerbaijan an dfor Azeris in Armenia may have encouraged resettlement to their officialhomelands .
Alternatively, perhaps the cross-migration in Transcaucasia has another, les snationalistically tinged explanation . Namely, the very rapid rate of urbaniza-tion of Armenia in recent years, which has advanced that republic ' s level o f
17
urbanization ahead of the USSR as a whole, may have created significan topportunities for urban Armenians in Georgia and Azerbaijan to move out o fthose republics to Armenia . .. . (Silver, 1983 : 377-378) .
Rubin commented on Silver's argument as follows :
B. Silver sees the causes of [the resettlement of Armenians and Azerbaidzhani sfrom neighboring republics to their own republics] in "historically forme dantipathies," in the still existing mutual hostility of Caucasian peoples, whic h"became aggravated to such a degree that they sought to flee from one another . "The farfetchedness and tendentiousness of such an explanation is partl yrevealed by the sovietologist himself . It is possible, he confesses, that the causeis the rapid urbanization of Armenia, in the desire of people to take on a nurban way of life (Rubin, 1988 : 132) .
Silver's article was published in 1983, Rubin's comment was published in January 1988 ,and the massive outbreak of violence between Azerbaidzhanis and Armenians in Nagorno -Karabakh, Sumgait, and elsewhere occurred in February 1988 . Relations between the tw onationalities in Transcaucasia have remained very tense since that time .
Many scholars would agree that examination of long-term demographic trends is usefu lfor understanding and interpreting the past. However, this example illustrates the value o fexamining underlying demographic processes for anticipating likely future events andproblems . ' 5
Reference s
Anderson, Barbara A . 1979 . "Some Factors Related to Ethnic Reidentification in the RussianRepublic," in Jeremy R . Azrael, Ed ., Soviet Nationality Policies and Practices (Ne wYork: Praeger) : 309-333 .
Anderson, Barbara A ., and Brian D . Silver . 1983. "Estimating Russification of Ethnic Identit yAmong Non-Russians in the USSR," Demography 20 (November): 461-489 .
. 1984. "Equality, Efficiency, and Politics in Soviet Bilingual Education Policy :1934-1980," American Political Science Review 78 (December): 1019-1039 .
. 1985a . "Estimating Census Undercount from School-Enrollment Data: An Applicationto the Soviet Censuses of 1959 and 1970," Demography 22 (May): 289-308 .
. 1985b . "Demographic Consequences of World War II on the Non-Russian Nationalitie sof the USSR," in Susan J . Linz, Ed ., The Impact of World War II on the Soviet Unio n(Totowa, NJ : Rowman & Allanheld) : 207-242 .
. 1985c . "'Permanent' and 'Present' Populations in Soviet Statistics," Soviet Studies 3 7(July): 386-402 .
. 1986a . "Sex Differentials in Mortality in the Soviet Union : Regional Differences i nLength of Working Life in Comparative Perspective," Population Studies 40 (July) :191-214 .
. 1986b . "Infant Mortality in the Soviet Union : Regional Differences and Measuremen tIssues," Population and Development Review 12 (December) : 705-738 .
35 For a similar point, see Goble (1987) .
18

. 1988 . "The Effects of the Registration System on the Seasonality of Births : The Cas eof the Soviet Union," Population Studies 42 (July) : 303-320 .
. 1989a . The Changing Shape of Soviet Mortality, 1958-1985 : An Evaluation of Old andNew Evidence," Population Studies 43 (July) : 243-265 .
. 1989b. "Patterns of Cohort Mortality in the Soviet Population , " Population andDevelopment Review 15 (September) .
Anderson, Barbara A ., Brian D. Silver, and Jinyun Liu . 1989 . "Mortality of Ethnic Groups i nSoviet Central Asia and Northern China," University of Michigan, Population Studie sCenter, Research Reports, No. 89-158 (September) .
Armstrong, John A. 1968 . "The Ethnic Scene in the Soviet Union," in Erich Goldhagen, Ed . ,Ethnic Minorities in the Soviet Union (New York : Praeger) : 3-49.
Aspaturian, Vernon V . 1968 . "The Non-Russian Nationalities," in Allen Kassof, Ed ., Prospect sfor Soviet Society (New York: Praeger) : 143-198 .
Bondarskaia, G., and L. Darskii . 1988. "Etnicheskaia differentsiatsiia rozhdaemosti v SSSR" ,Vestnik statistiki, No. 12 (December) : 16-21 .
Coale, Ansley J ., Barbara A . Anderson, and Erna Harm. 1979 . Human Fertility in Russia Sinc ethe Nineteenth Century (Princeton: Princeton University Press) .
Dmitrieva, R ., and Ie . Andreev . 1987 . "0 srednei prodolzhitel'nosti zhizni naselenii aSSSR" Vestnik statistiki, No. 12 (December): 31-39.
Feshbach, Murray, and Stephen Rapawy . 1973 . "Labor Constraints in the Five-Year Plan," i nSoviet Economic Prospects for the Seventies, U.S . Congress, Joint Economic Committe e(Washington, D .C.: Government Printing Office) : 485-563 .
. 1976 . "Soviet Population and Manpower Trends and Policies," in Soviet Economy in aNew Perspective, U.S . Congress, Joint Economic Committee (Washington, D .C . :Government Printing Office) : 113-154 .
Gantskaia, O. A., and L. N. Terent'eva . 1965 . "Etnograficheskie issledovaniia natsional'nyk hprotsessov v Pribaltike" Sovetskaia etnografiia, No. 5: 3-19.
Garson, Lea Keil . 1986 . The Centenarian Question : Old Age Mortality in the Soviet Unio n1897-1970 . Unpublished Ph.D. dissertation, Princeton University .
Goble, Paul A . 1987. "Gorbachev and the Soviet Nationality Problem," in Maurice Friedber gand Heyward Isham, Eds ., Soviet Society under Gorbachev (Armonk: Sharpe) : 76-100 .
Ievstigneev, lu . A. 1971 . "Natsional'no-smeshannye braki v Makhachkale" Sovetskaia etnografiia ,No . 4: 80-85 .
. 1972 . "Mezhetnicheskie braki v nekotorykh gorodakh severnogo Kazakhstana" VestnikMoskovskogo universiteta. Seriia istorii, No. 6: 73-82 .
Karakhanov, M. K. 1983 . Nekapitalisticheskiy put' razvitiia i problemy narodonaseleniia .Tashkent : FAN .
Kingkade, W. Ward . 1985 . "An Evaluation of Selected Soviet Population Statistics," U .S. Burea uof the Census, Center for International Research, Staff Paper No. 9 (November) .
. 1986. "The Population Momentum of Soviet Nationalities," Paper Presented at th eAnnual Meeting of the American Association for the Advancement of Slavic Studies ,New Orleans (November) .
19
. 1989. "The Future Population of the Soviet Union," Manuscript, U .S. Bureau of th eCensus, Center for International Research (September) .
Kozlov, V . I . 1969 . Dinamika chislennosti narodov (,Metodologiia issledovaniia i osnovnye faktory )Moscow : Nauka.
. 1982 . Natsional'nosti SSSR : Etnodemograficheskii obzor, Second Edition .Moscow: Finansy i statistika .
Rapawy, Stephen, and Godfrey Baldwin . 1982. "Demographic Trends in the Soviet Union :1950-2000," in Soviet Economy in the 1980's : Problems and Prospects, Vol . II, U.S .Congress, Joint Economic Committee (Washington, D .C . : Government Printing Office) :265-322 .
Rubin, Ia. I . 1988. Book review published in Sotsiologicheskie issledovaniia, No . 1(January-February) : 131-133 .
Silver, Brian D. 1974a. "Social Mobilization and the Russification of Soviet Nationalities, "American Political Science Review 68 (March) : 45-66 .
. 1974b . "Levels of Sociocultural Development Among Soviet Nationalities : APartial Test of the Equalization Hypothesis," American Political Science Review 6 8(December): 1618-1637 .
. 1975 . "Methods of Deriving Data on Bilingualism from the 1970 Soviet Census , " Sovie tStudies 27 (October) : 574-597 .
. 1976. "Bilingualism and Maintenance of the Mother Tongue in Soviet Central Asia, "Slavic Review 35 (September) : 406-424 .
. 1978a. "Ethnic Intermarriage and Ethnic Consciousness Among Soviet Nationalities, "Soviet Studies 30 (January) : 107-116 .
. 1978b. "Language Policy and the Linguistic Russification of Soviet Nationalities," i nJeremy R. Azrael, Ed., Soviet Nationality Policies and Practices (New York: Praeger) :250-306 .
. 1983 . "Population Redistribution and the Ethnic Balance in Transcaucasia," in Ronal dG. Suny, Ed ., Nationalism and Social Change in Transcaucasia (Ann Arbor: Universityof Michigan Press): 373-396 .
. 1986. "The Ethnic and Language Dimensions in Russian and Soviet Censuses," i nRalph S. Clem, Ed ., Research Guide to the Russian and Soviet Censuses (Ithaca: Cornel lUniversity Press): 70-97 .
Sinel'nikov, A . B. 1988. "Dinamika urovnia smertnosti v SSSR," in L . L. Rybakovskiy, Ed . ,Naselenie SSSR za 70 let (Moscow: Nauka) : 115-133 .
USSR, Tsentra l 'noe Statisticheskoe Upravlenie . 1962-63 . Itogi vsesoiuznoi perepisi naselenii a1959 goda . Moscow: Gosstatizdat .
. 1972-73 . Itogi vsesoiuznoi perepisi naseleniia 1970 goda . Moscow: Statistika .
. 1980 . Naselenie SSSR (Po dannym vsesoiuznoi perepisi naseleniia 1979 goda) . Moscow :Politizdat .
USSR, Goskomstat . 1988a . Naselenie SSSR 1987: Statisticheskii sbornik . Moscow: Finansy istatistika .
20
. 1988 . Slovari natsional'nostei i iazykov (dlia kodirovaniia otvetov na 8 i 9 vopros yperepisnykh listov (o natsionalnosti rodnom iazyke i drugom iazyke narodov SSSR )
Vsesoiuznoi perepisi naseleniia 1989 g . Moscow: Goskomstat .
Volkov, A . 1989. "Etnicheski smeshannye braki v SSSR : dinamika i sostav, " Vestnik statistiki .No. 7: 12-22 .
21
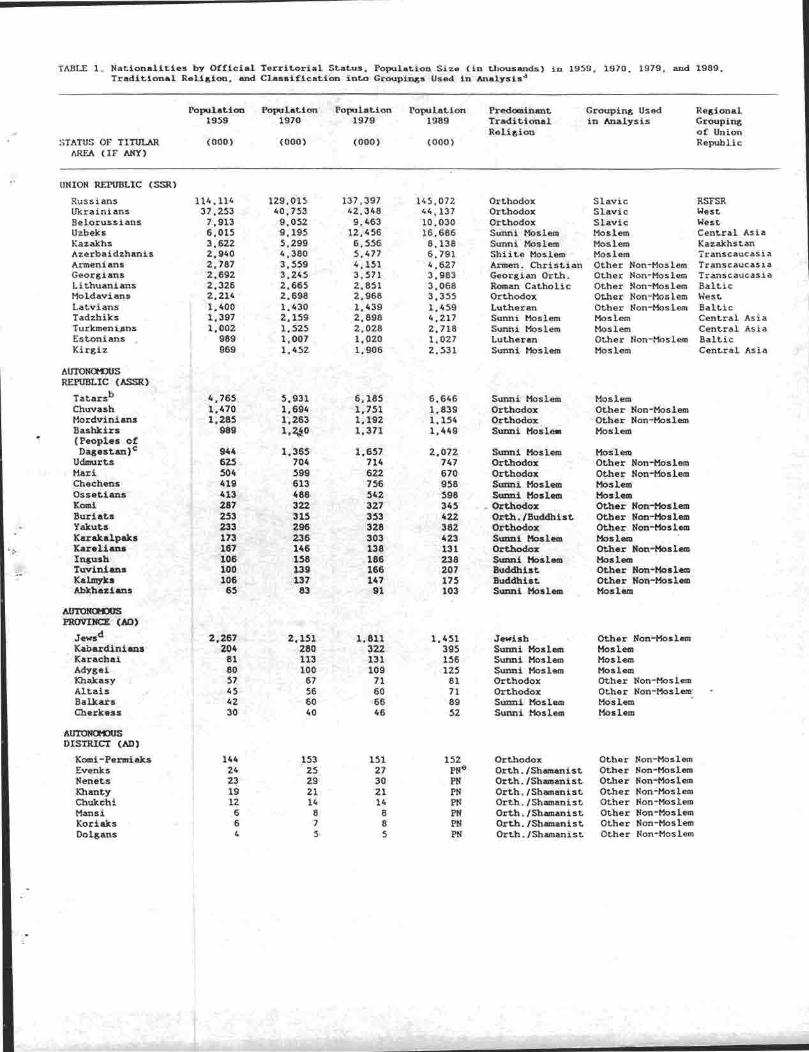
TABLE 1 . Nationalities by Official Territorial Status, Population Size (in thousands) in 1959, 1970, 1979, and 1989 ,Traditional Religion, and Classification into Groupings Used in Analysis a
Grouping Usedin Analysis
STATUS OF TITULARAREA (IF ANY)
Population Population Population Population
Predominant1959
1970
1979
1989
Traditiona lReligion
(000)
(000)
(000)
(000)
RegionalGroupingof UnionRepublic
UNION REPUBLIC (SSR )
Russians 114,114 129,015 137,397 145,072 Orthodox Slavic RSFSRUkrainians 37,253 40,753 42,348 44,137 Orthodox Slavic Wes tBelorussians 7,913 9,052 9,463 10,030 Orthodox Slavic Wes tUzbeks 6,015 9,195 12,456 16,686 Sunni Moslem Moslem Central Asi aKazakhs 3,622 5,299 6,556 8,138 Sunni Moslem Moslem KazakhstanAzerbaidzhanis 2,940 4,380 5,477 6,791 Shiite Moslem Moslem TranscaucasiaArmenians 2,787 3,559 4,151 4,627 Armen. Christian Other Non-Moslem TranscaucasiaGeorgians 2,692 3,245 3,571 3,983 Georgian Orth . Other Non-Moslem TranscaucasiaLithuanians 2,326 2,665 2,851 3,068 Roman Catholic Other Non-Moslem Balti cMoldavians 2,214 2,698 2,968 3,355 Orthodox Other Non-Moslem Wes tLatvians 1,400 1,430 1,439 1,459 Lutheran Other Non-Moslem Balti cTadzhiks 1,397 2,159 2,898 4,217 Sunni Moslem Moslem Central Asi aTurkmenians 1,002 1,525 2,028 2,718 Sunni Moslem Moslem Central Asi aEstonians
989 1,007 1,020 1,027 Lutheran Other Non-Moslem Balti cKirgiz 969 1,452 1,906 2,531 Sunni Moslem Moslem Central Asi a
AUTONOMOUS
4,765 5,931 6,185 6,646 Sunni Moslem Moslem
REPUBLIC (ASSR )
TatarsbChuvash 1,470 1,694 1,751 1,839 Orthodox Other Non-Mosle mMordvinians 1,285 1,263 1,192 1,154 Orthodox Other Non-Mosle mBashkirs 989 1,240 1,371 1,449 Sunni Moslem Moslem(Peoples ofDagestan}c 944 1,365 1,657 2,072 Sunni Moslem MoslemUdmurts 625 704 714 747 Orthodox Other Non-MoslemMari 504 599 622 670 Orthodox Other Non-MoslemChechens 419 613 756 958 Sunni Moslem MoslemOssetians 413 488 542 598 Sunni Moslem MoslemKomi 287 322 327 345 Orthodox Other Non-MoslemBuriats 253 315 353 422 Orth ./Buddhist Other Non-MoslemYakuts 233 296 328 382 Orthodox Other Non-MoslemKarakalpaks 173 236 303 423 Sunni Moslem MoslemKarelians 167 146 138 131 Orthodox Other Non-Mosle mIngush 106 158 186 238 Sunni Moslem MoslemTuvinians 100 139 166 207 Buddhist Other Non-MoslemKalmyks 106 137 147 175 Buddhist Other Non-MoslemAbkhazians 65 83 91 103 Sunni Moslem Moslem
AUTONOMOUSPROVINCE (AO )
Jewsd 2,267 2,151 1,811 1,451 Jewish Other Non-MoslemKabardinians 204 280 322 395 Sunni Moslem MoslemKarachai 81 113 131 156 Sunni Moslem MoslemAdygei 80 100 109 125 Sunni Moslem MoslemKhakasy 57 67 71 81 Orthodox Other Non-MoslemAltais 45 56 60 71 Orthodox Other Non-MoslemBalkars 42 60 66 89 Sunni Moslem MoslemCherkess 30 40 46 52 Sunni Moslem Moslem
AUTONOMOUSDISTRICT (AD)
144 153 151 152 Orthodox Other Non-Mosle mKomi-PermiaksEvenks 24 25 27 PNe Orth./Shamanist Other Non-MoslemNenets 23 29 30 PN Orth./Shamanist Other Non-MoslemKhanty 19 21 21 PN Orth ./Shamanist Other Non-MoslemChukchi 12 14 14 PN Orth ./Shamanist Other Non-MoslemMansi 6 8 8 PN Orth ./Shamanist Other Non-MoslemKoriaks 6 7 8 PN Orth ./Shamanist Other Non-MoslemDolgans 4 5 5 PN Orth ./Shamanist Other Non-Moslem
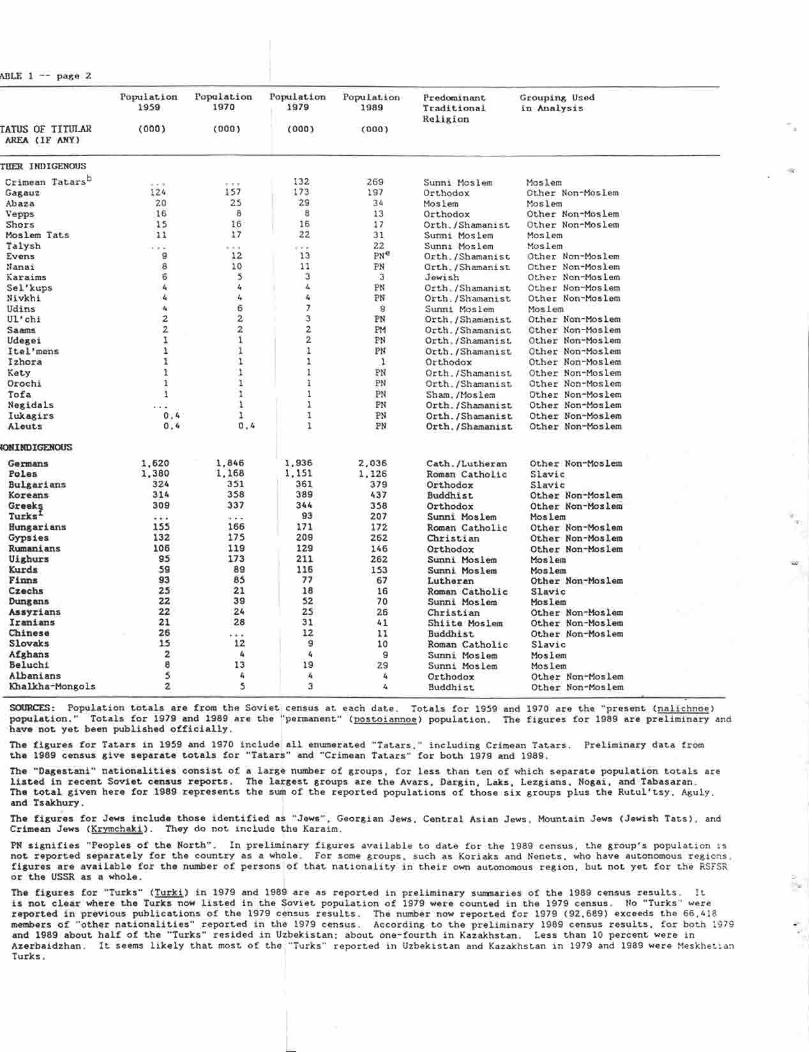
ABLE 1 -- page 2
Population1959
Population1970
Population1979
Population1989
Predominan tTraditional
Grouping Usedin Analysi s
STATUS OF TITULAR (000) (000) (000) (000)Religion
AREA (IF ANY )
TILER INDIGENOUS
Crimean Tatarsb 132 269 Sunni Moslem MoslemGagauz 124 157 173 197 Orthodox Other Non-MoslemAbaza 20 25 29 34 Moslem MoslemVepps 16 8 8 13 Orthodox Other Non-Mosle mShors 15 16 16 17 Orth ./Shamanist Other Non-Mosle mMoslem Tats 11 17 22 31 Sunni Moslem MoslemTalysh . . 22 Sunni Moslem MoslemEvens 9 12 13 PNe Orth ./Shamanist Other Non-Mosle mNanai 8 10 11 PN Orth ./Shamanist Other Non-Mosle mKaraims 6 5 3 3 Jewish Other Non-MoslemSel'kups 4 4 4 PN Orth ./Shamanist Other Non-MoslemNivkhi 4 4 4 PN Orth ./Shamanist Other Non-MoslemUdins 4 6 7 9 Sunni Moslem MoslemUl'chi 2 2 3 PN Orth ./Shamanist Other Non-Mosle mSaams 2 2 2 PM Orth ./Shamanist Other Non-Mosle mUdegei 1 1 2 PN Orth./Shamanist Other Non-Mosle mItel'mens 1 1 1 PN Orth./Shamanist Other Non-Mosle mIzhora 1 1 1 1 Orthodox Other Non-MoslemKety 1 1 1 PN Orth ./Shamanist Other Non-MoslemOrochi 1 1 1 PN Orth ./Shamanist Other Non-MoslemTofa 1 1 1 PN Sham ./Moslem Other Non-MoslemNegidals 1 1 PN Orth ./Shamanist Other Non-MoslemIukagirs 0 .4 1 1 PN Orth ./Shamanist Other Non-MoslemAleuts 0 .4 0 .4 1 PN Orth ./Shamanist Other Non-Moslem
NONINDIGENOUS
Germans 1,620 1,846 1,936 2,036 Cath./Lutheran Other Non-Mosle mPoles 1,380 1,168 1,151 1,126 Roman Catholic Slavi cBulgarians 324 351 361 379 Orthodox Slavi cKoreans 314 358 389 437 Buddhist Other Non-Mosle mGreek! 309 337 344 358 Orthodox Other Non-Mosle mTurks 93 207 Sunni Moslem MoslemHungarians 155 166 171 172 Roman Catholic Other Non-MoslemGypsies 132 175 209 262 Christian Other Non-MoslemRumanians 106 119 129 146 Orthodox Other Non-MoslemUighurs 95 173 211 262 Sunni Moslem MoslemKurds 59 89 116 153 Sunni Moslem MoslemFinns 93 85 77 67 Lutheran Other Non-MoslemCzechs 25 21 18 16 Roman Catholic Slavi cDungans 22 39 52 70 Sunni Moslem MoslemAssyrians 22 24 25 26 Christian Other Non-MoslemIranians 21 28 31 41 Shiite Moslem Other Non-Mosle mChinese 26 12 11 Buddhist Other Non-Mosle mSlovaks 15 12 9 10 Roman Catholic SlavicAfghans 2 4 4 9 Sunni Moslem MoslemBeluchi 8 13 19 29 Sunni Moslem MoslemAlbanians 5 4 4 4 Orthodox Other Non-Mosle mKhalkha-Mongols 2 5 3 4 Buddhist Other Non-Moslem
SOURCES : Population totals are from the Soviet census at each date . Totals for 1959 and 1970 are the "present (nalichnoe )population ." Totals for 1979 and 1989 are the "permanent" (postoiannoe) population. The figures for 1989 are preliminary an dhave not yet been published officially .
The figures for Tatars in 1959 and 1970 include all enumerated "Tatars," including Crimean Tatars . Preliminary data fro mthe 1989 census give separate totals for "Tatars" and "Crimean Tatars" for both 1979 and 1989 .
The "Dagestani" nationalities consist of a large number of groups, for less than ten of which separate population totals ar elisted in recent Soviet census reports . The largest groups are the Avars, Dargin, Laks, Lezgians, Nogai, and Tabasaran .The total given here for 1989 represents the sum of the reported populations of those six groups plus the Rutul'tsy, Aguly ,and Tsakhury .
The figures for Jews include those identified as "Jews", Georgian Jews, Central Asian Jews, Mountain Jews (Jewish Tats), an dCrimean Jews (Krymchaki) . They do not include the Karaim .
PN signifies "Peoples of the North" . In preliminary figures available to date for the 1989 census, the group's population isnot reported separately for the country as a whole . For some groups, such as Koriaks and Nenets, who have autonomous regions .figures are available for the number of persons of that nationality in their own autonomous region, but not yet for the RSFS Ror the USSR as a whole .
The figures for "Turks" (Turki) in 1979 and 1989 are as reported in preliminary summaries of the 1989 census results . I tis not clear where the Turks now listed in the Soviet population of 1979 were counted in the 1979 census . No "Turks" wer ereported in previous publications of the 1979 census results . The number now reported for 1979 (92,689) exceeds the 66,41 8members of "other nationalities" reported in the 1979 census . According to the preliminary 1989 census results, for both 197 9and 1989 about half of the "Turks" resided in Uzbekistan ; about one-fourth in Kazakhstan . Less than 10 percent were i nAzerbaidzhan . It seems likely that most of the "Turks" reported in Uzbekistan and Kazakhstan in 1979 and 1989 wer e MeskhetianTurks .
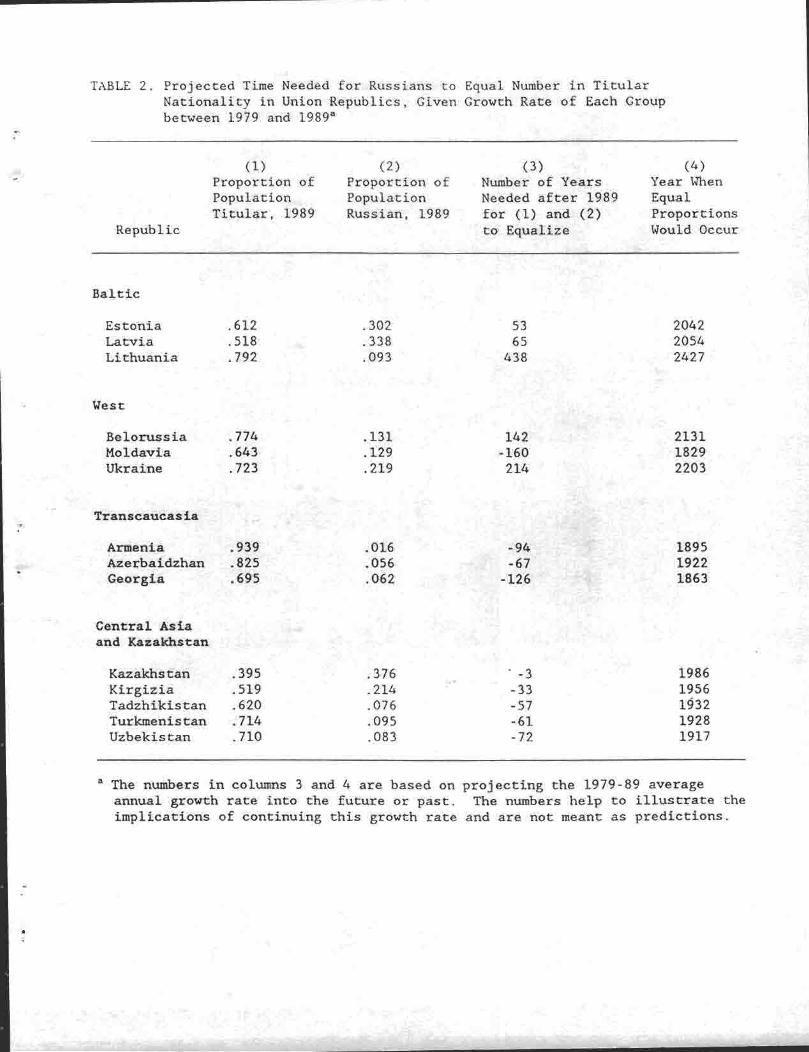
TABLE 2 . Projected Time Needed for Russians to Equal Number in Titula rNationality in Union Republics, Given Growth Rate of Each Groupbetween 1979 and 1989 '
(1)
(2)
(3)
( 4 )Proportion of
Proportion of
Number of Years
Year WhenPopulation
Population
Needed after 1989
EqualTitular, 1989
Russian, 1989
for (1) and (2)
ProportionsRepublic
to Equalize
Would Occu r
Balti c
Estonia .612 .302 53 2042Latvia .518 .338 65 205 4Lithuania .792 .093 438 242 7
Wes t
Belorussia .774 .131 142 213 1Moldavia .643 .129 -160 1829Ukraine .723 .219 214 220 3
Transcaucasi a
Armenia .939 .016 -94 189 5Azerbaidzhan .825 .056 -67 192 2Georgia .695 .062 -126 186 3
Central Asi aand Kazakhstan
.395 .376 '-3 1986KazakhstanKirgizia .519 .214 -33 1956Tadzhikistan .620 .076 -57 1932Turkmenistan .714 .095 -61 192 8Uzbekistan .710 .083 -72 1917
a The numbers in columns 3 and 4 are based on projecting the 1979-89 averag eannual growth rate into the future or past . The numbers help to illustrate th eimplications of continuing this growth rate and are not meant as predictions .
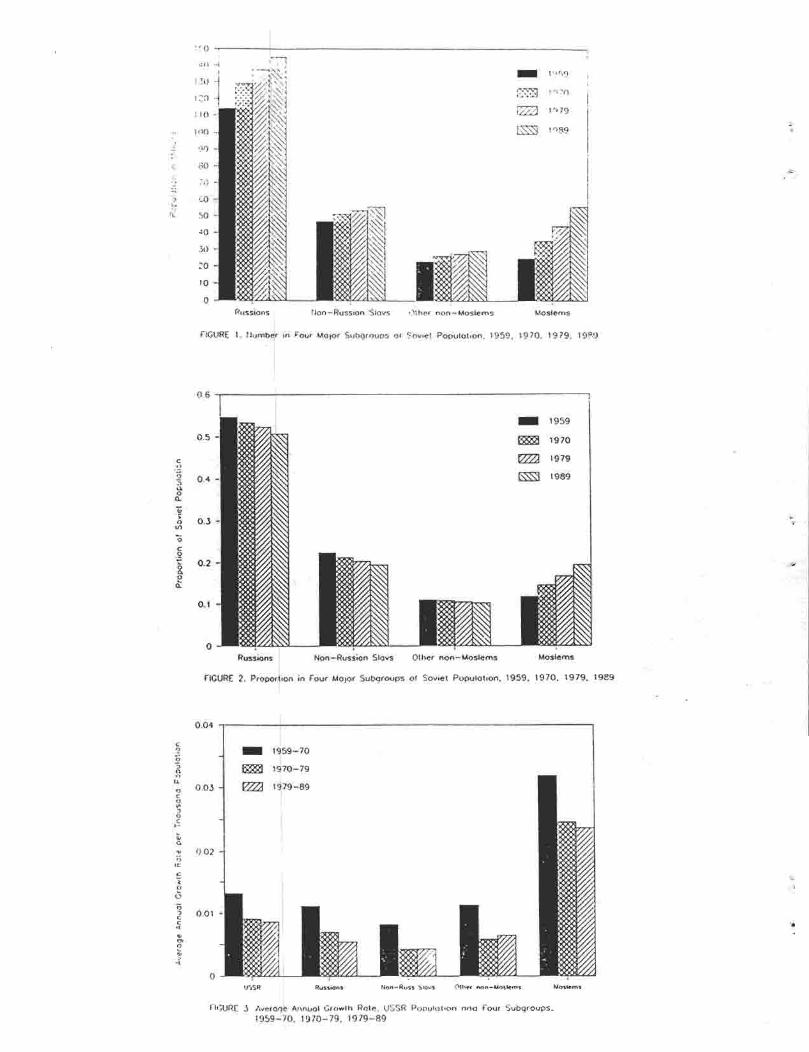
FIGURE 1 Number In Four Major Subgroups of Soviet Population , 1959 . 1970, 1979 . 1989
FIGURE 2 . Proportion in Four Major Subgroups of Soviet Population . 1959, 1970, 1979 . 198 9
FIGURE 3 Average Annual Growth Rate . USSR Population and four Subgroups .
1959—10 . 1970—79 . 1979—89
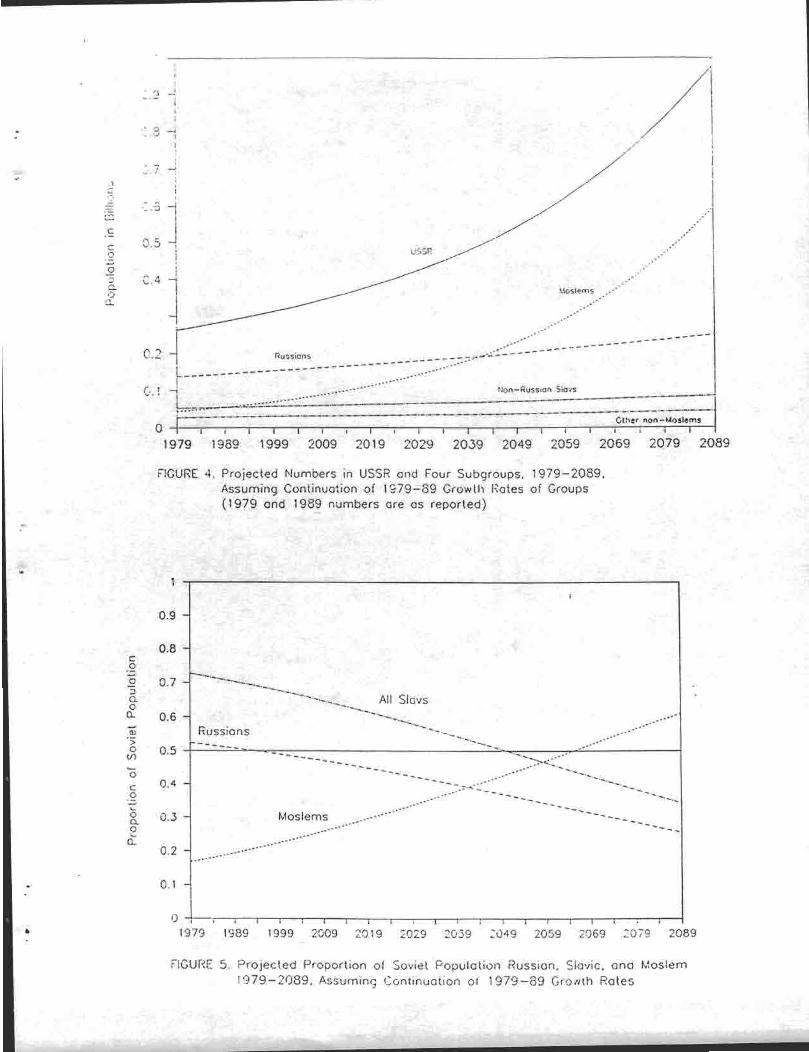
FIGURE 4 . Projected Numbers in USSR and Four Subgroups, 1979—2089 ,Assuming Continuation of 1979—89 Growth Rates of Group s(1979 and 1989 numbers ore as reported )
FIGURE 5 . Projected Proportion of Soviet Population Russian, Slavic, and Mosle m1979-2089, Assuming Continuation of 1979—89 Growth Rate s

FIGURE 6 . Total Population of Union Republics, 1959, 1970, 1979, 1989
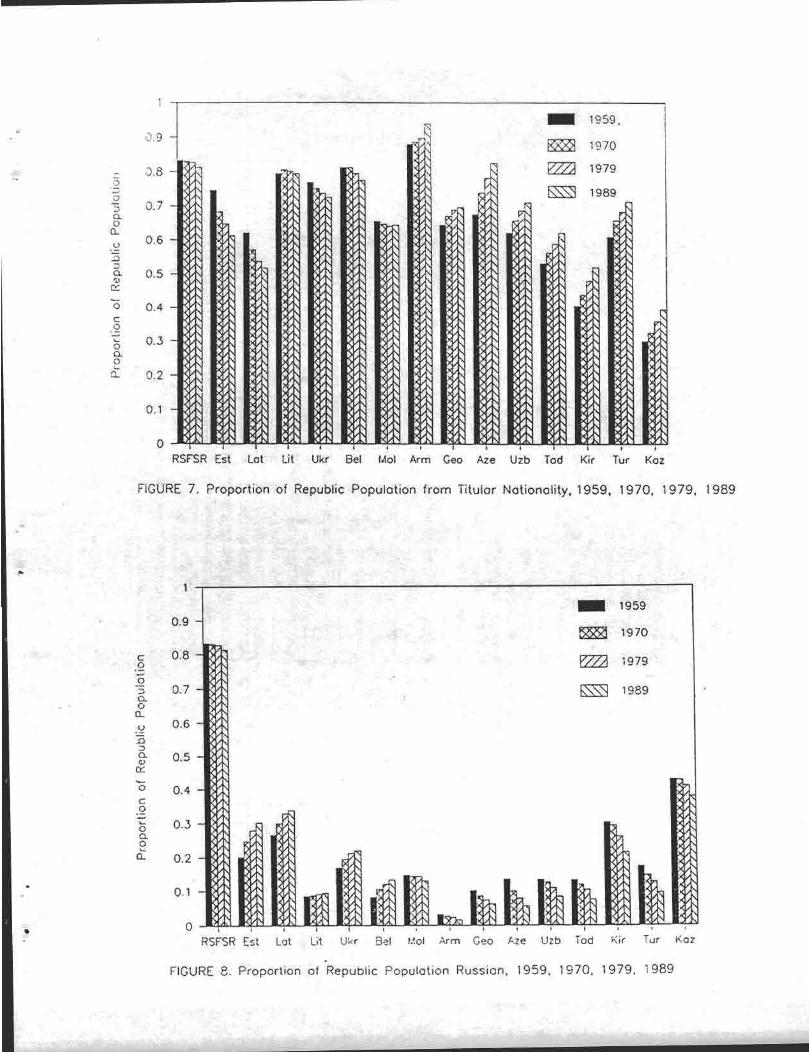
FIGURE 7 . Proportion of Republic Population from Titular Nationality, 1959, 1970, 1979 , 1989
FIGURE 8 . Proportion of Republic Population Russian, 1959, 1970, 1979, 1989

FIGURE 9. Average Annual Growth Rate, USSR Population and Union Republics ,1959—70, 1970—79, 1979—89
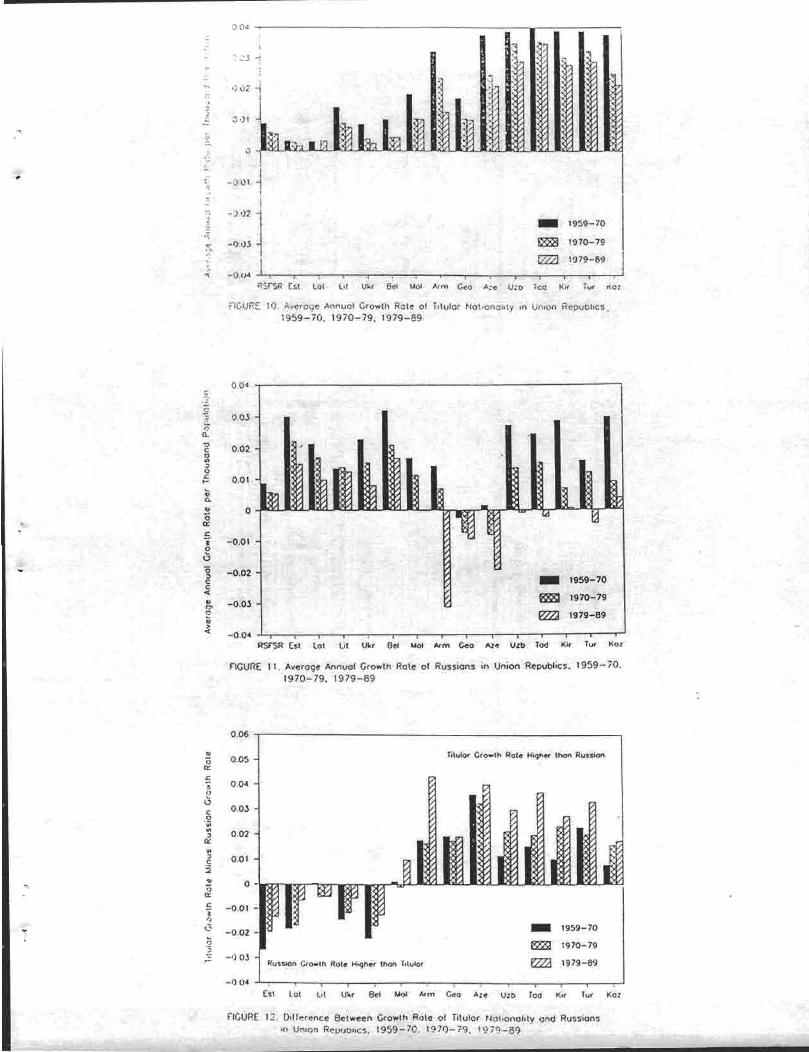
FIGURE 10 Average Annual Growth Rate of Titular Nationality in UnionRepublics.1959—70 . 1970—79 . 1979—8 9
FIGURE 11 . Average Annual Growth Rate of Russians in Union Republics . 1959—701970-79, 1979-89
FIGURE 12 . Difference Between Growth Rote of Titular Nationality and Russian sin Union Republics . 1959—70 . 1970—79, 1979—89

FIGURE 13 . Total Fertility Rate (TFR) . USSR Population and Union Republics .
1958—59 . 1969—70. 1978—79, 1986—8 7
FIGURE 14 . Total Fertility Rote of Titular Nationality in Union Republics . 1958—59 .1969—70 . 1978—7 9
NOTE: Estimated by Bondorskaia and Dorskii (1988) (corrected by authors) .
FIGURE 15 . Difference Between TFR of Titular Nationality in Republic and TFR o fRussians in RSFSR . 1958-59, 1969 — 70 . 1978—79

FIGURE 16 . Estimated Net Migration of Titular Nationality into Own Republic ,1959—70, 1970—79, 1979—8 9
FIGURE 17 . Estimated Net Migration of Russians into Union Republic, 1959—70 ,
1970—79, 1979—89

FIGURE 18 . Contribution of Natural Increase and Net Migration of Titular Nationality and o f
Russians to Growth in Republic Population . 1959—70 . 1970—79 . 1979—89

FIGURE 19 . Contribution of Natural Increase and Net Migration ofTitular Nationality and o f
Russians to Growth in Republic Population . 1959-70 . 1970-79, 1979-89 .
Divided by Republic Population at First Dote
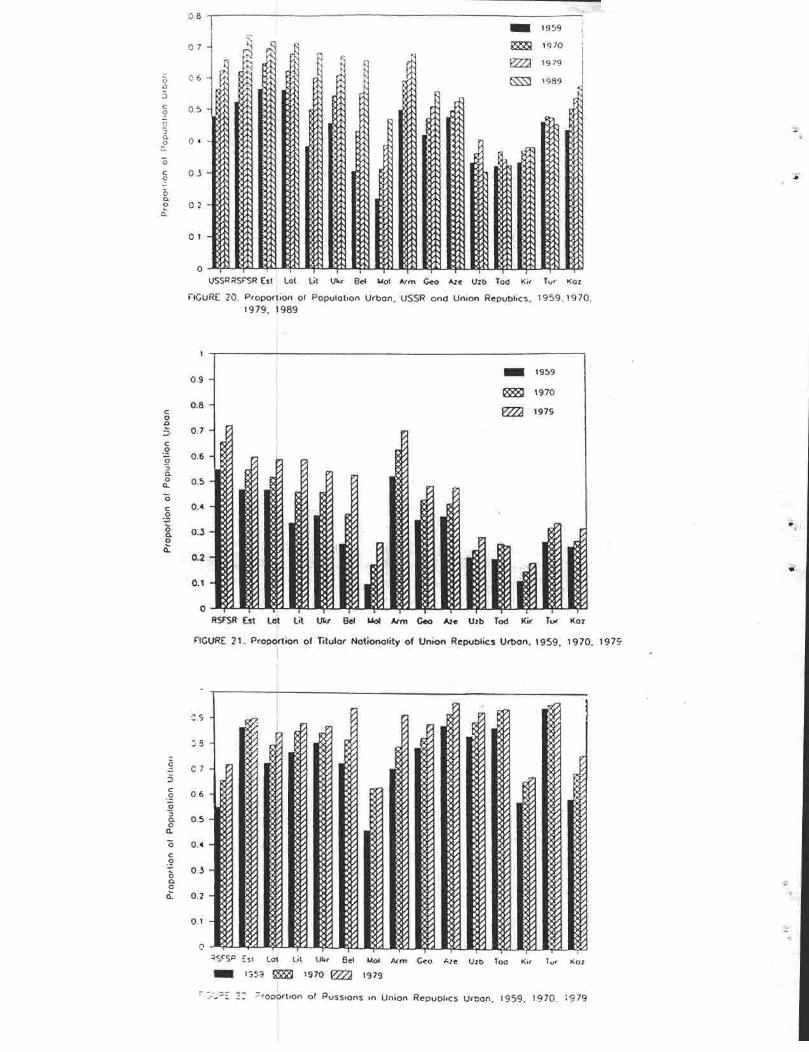
FIGURE 20 . Proportion of Population Urban . USSR and Union Republics . 1959, 1970 .1979 . 1989
FIGURE 21 . Proportion of Titular Nationality of Union Republics Urban . 1959 . 1970. 1979.
FIGURE 22. Proportion of Russians in Union Republics Urban, 1959 . 1970 . 1979
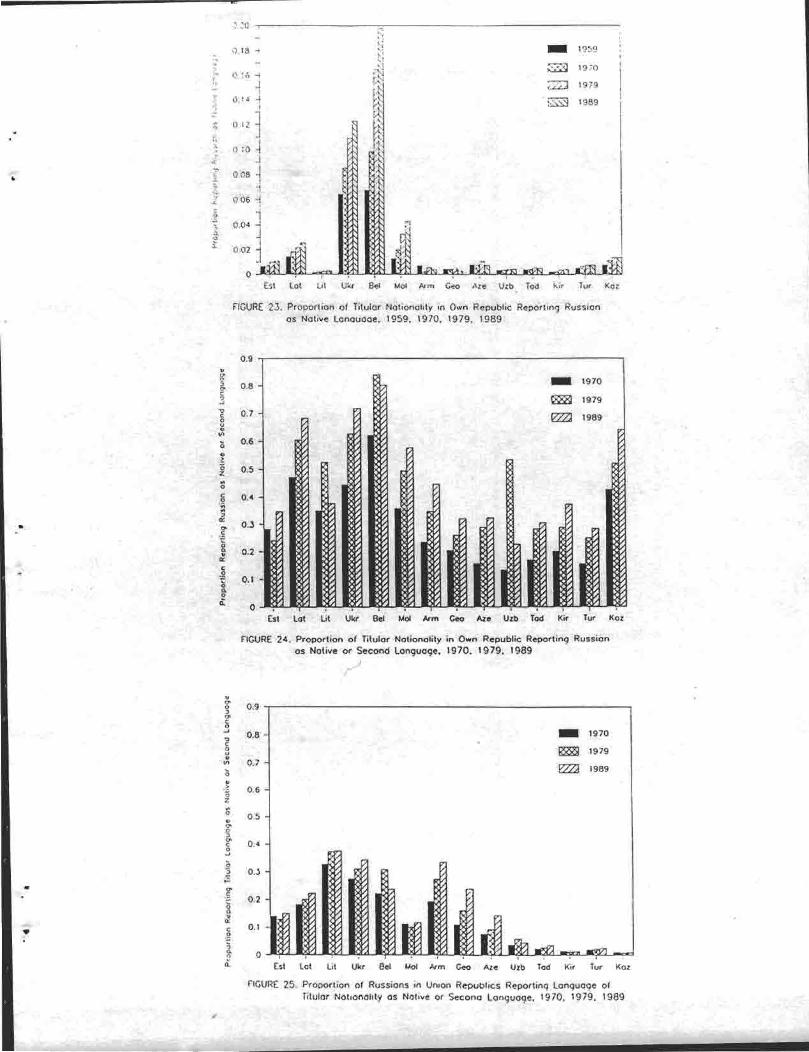
FIGURE 23 . Proportion of Titular Nationality in Own Republic Reporting Russia nas Notive Lanauaae . 1959 . 1970 . 1979 . 198 9
FIGURE 24 . Proportion of Titular Nationality in Own Republic Reporting Russia nas Native or Second Language . 1970 . 1979 . 1989

a