Embed Size (px)
Citation preview

Demographic Characteristics, Trends, and Projections for Texas
and the Rio Grande Valley
UTRGV Legislative Internship ProgramFebruary 22, 2019
@TexasDemography
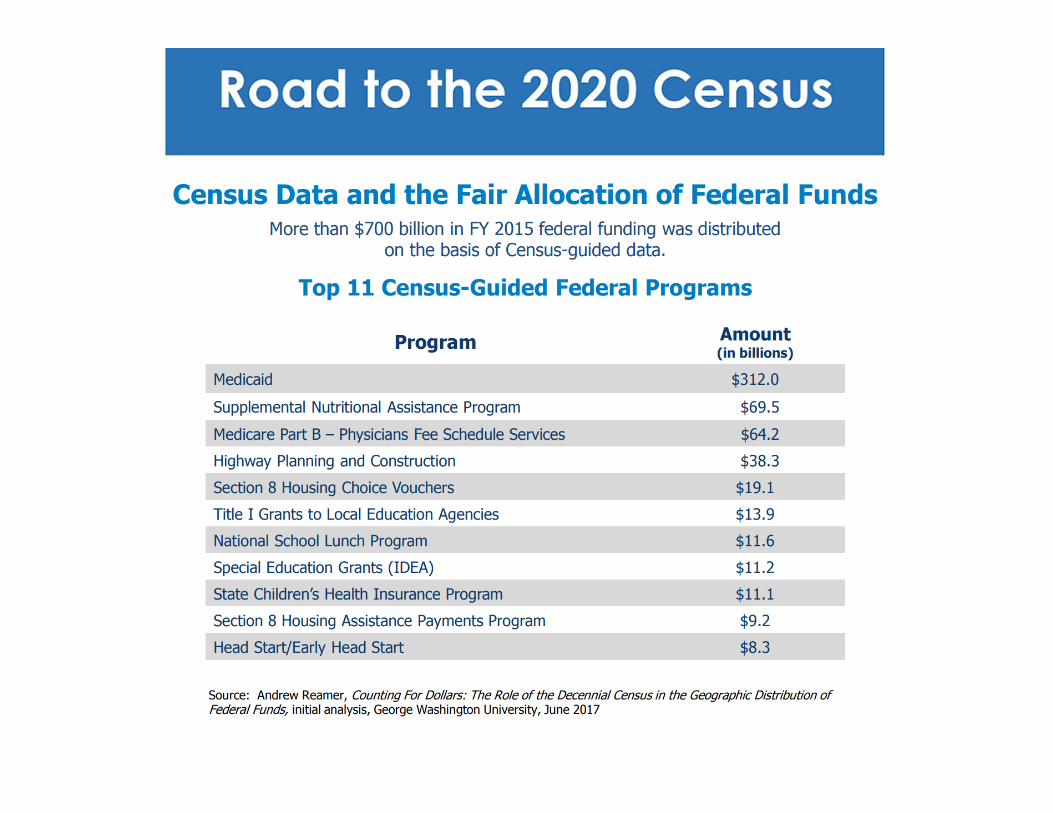
Produce, interpret, and disseminate demographic information to facilitate data
driven decision making for the benefit of Texans.

3
Pecos
Brewster
Webb
Hudspeth
PresidioTerrell
CulbersonReeves
Val Verde
Crockett
Hill
Duval
Harris
Frio
Bell
Kerr
Kenedy
Starr
Polk
Clay
Edwards
Irion
Hall
Ellis
Jeff Davis
Sutton
Uvalde
Bee
Hale
Dallam
Leon
Bexar
Gaines
Hidalgo
Upton
Hartley
King
Erath
Jack
Kinney
Kent
Zavala
Brazoria
Tyler
GrayOldham
Dimmit
CassLynn HuntWise
Kimble
Lamb
Medina
Floyd
Terry
Coke
Llano
Ector
Andrews
Milam
Travis
Knox
FallsWard
Collin
Jones
Nolan
Potter
Nueces
Taylor
Real
Bowie
Young
Lamar
Martin
Garza
DallasFisher
Moore
Kleberg
Cameron
Cooke
Hardin
Schleicher
Gillespie
Foard
Wood
Menard
La Salle
Rusk
LibertyLee
Mills
Smith
Burnet
Cottle
Zapata
Coryell
Matagorda
Brown
Motley
Reagan Houston
Maverick
Jasper
Coleman
BaylorArcher
Scurry
Tom Green
Mason
Parker
Castro
Navarro
Brooks
Bailey
Deaf Smith
DeWitt
Lavaca
Donley
Hays
GoliadAtascosa
Denton
BosqueEl Paso
Fannin
Tarrant
Wharton
CraneConcho
Carson
Runnels
Fayette
Crosby
Borden
Haskell
Calhoun
Newton
Live Oak
Randall
ShelbySterling
Jefferson
Briscoe
McMullen
Parmer
Jim Hogg
Mitchell
Wilson
Victoria
Trinity
Roberts
PanolaHoward
Walker
Bastrop
Grayson
San Saba
Midland
HockleyDickens
Swisher
Gonzales
Winkler Anderson
Dawson
Willacy
Grimes
Wheeler
Cherokee
Harrison
Colorado
Eastland
Lubbock
Karnes
Red River
Refugio
Austin
Hemphill
Williamson
Jackson
Blanco
Ochiltree
McCulloch
Loving
Sherman
Wilbarger
Hansford
Callahan
McLennan
Yoakum
Angelina
Hopkins
Lipscomb
StephensPalo Pinto
Stonewall
Hamilton
Montague
Bandera
Cochran
Jim Wells
Limestone
Kaufman
Fort Bend
Titus
Comal
Armstrong
Kendall
FreestoneComanche
Glasscock
Johnson
Galveston
Henderson
Montgomery
Wichita
Brazos
Van Zandt
Chambers
Robertson
Waller
Sabine
Upshur
Hood
Hutchinson
Shackelford
Childress
Burleson
Nacogdoches
Lampasas
Collingsworth
Hardeman
Throckmorton
GuadalupeCaldwell
Aransas
Marion
San Patricio
Madison
San Jacinto
Delta
Washington Orange
Rains
Gregg
Morris
San Augustine
Franklin
Somervell
Rockwall
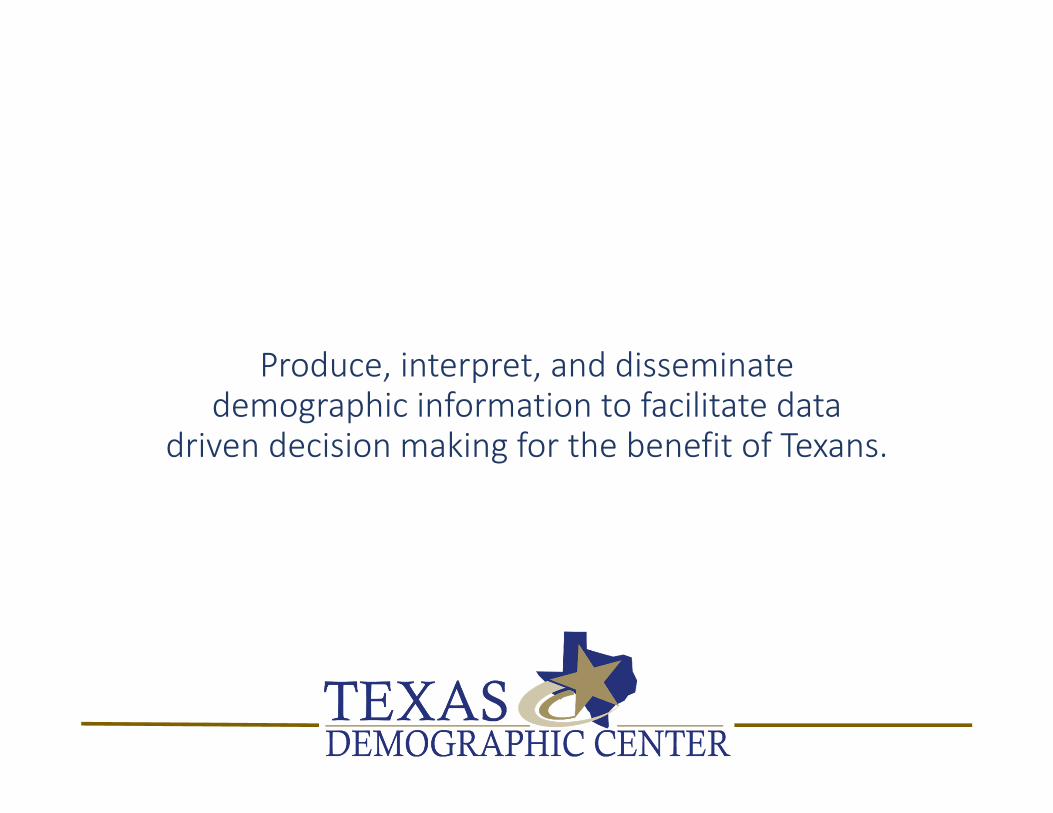
Total Estimated Population by County, Texas, 2017
Source: U.S. Census Bureau, 2017 Vintage Population Estimates
134 - 10,00010,001 - 50,00050,001 - 100,000100,001 - 500,000500,001 - 4,652,980
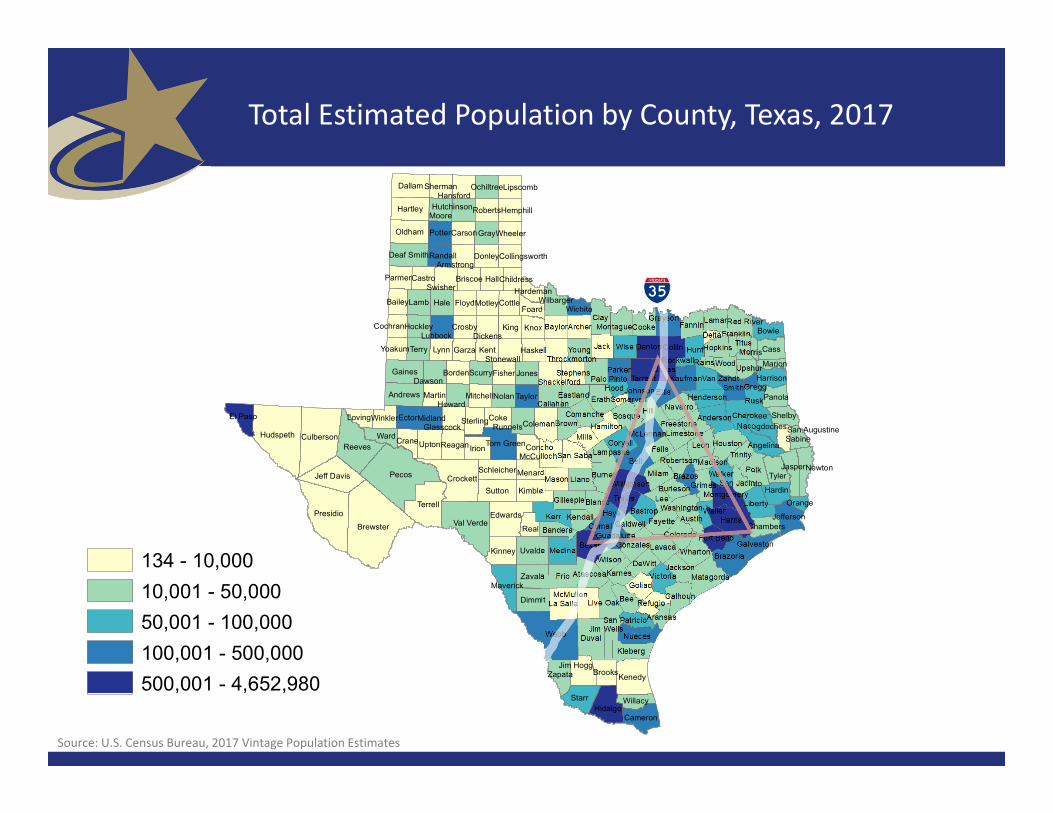
Estimated Population Change, Texas Counties, 2010 to 2017
5Source: U.S. Census Bureau, 2016 Vintage Population Estimates
91 counties lost population over the 7 year period.
Pecos
Brewster
Webb
Hudspeth
PresidioTerrell
CulbersonReeves
Val Verde
Crockett
Hill
Duval
Harris
Frio
Bell
Kerr
Kenedy
Starr
Polk
Clay
Edwards
Irion
Hall
Ellis
Jeff Davis
Sutton
Uvalde
Bee
Hale
Dallam
Leon
Bexar
Gaines
Hidalgo
Upton
Hartley
King
Erath
Jack
Kinney
Kent
Zavala
Brazoria
Tyler
GrayOldham
Dimmit
CassLynn HuntWise
Kimble
Lamb
Medina
Floyd
Terry
Coke
Llano
Ector
Andrews
Milam
Travis
Knox
FallsWard
Collin
Jones
Nolan
Potter
Nueces
Taylor
Real
Bowie
Young
Lamar
Martin
Garza
DallasFisher
Moore
Kleberg
Cameron
Cooke
Hardin
Schleicher
Gillespie
Foard
Wood
Menard
La Salle
Rusk
LibertyLee
Mills
Smith
Burnet
Cottle
Zapata
Coryell
Matagorda
Brown
Motley
Reagan Houston
Maverick
Jasper
Coleman
BaylorArcher
Scurry
Tom Green
Mason
Parker
Castro
Navarro
Brooks
Bailey
Deaf Smith
DeWitt
Lavaca
Donley
Hays
GoliadAtascosa
Denton
BosqueEl Paso
Fannin
Tarrant
Wharton
CraneConcho
Carson
Runnels
Fayette
Crosby
Borden
Haskell
Calhoun
Newton
Live Oak
Randall
ShelbySterling
Jefferson
Briscoe
McMullen
Parmer
Jim Hogg
Mitchell
Wilson
Victoria
Trinity
Roberts
PanolaHoward
Walker
Bastrop
Grayson
San Saba
Midland
HockleyDickens
Swisher
Gonzales
Winkler Anderson
Dawson
Willacy
Grimes
Wheeler
Cherokee
Harrison
Colorado
Eastland
Lubbock
Karnes
Red River
Refugio
Austin
Hemphill
Williamson
Jackson
Blanco
Ochiltree
McCulloch
Loving
Sherman
Wilbarger
Hansford
Callahan
McLennan
Yoakum
Angelina
Hopkins
Lipscomb
StephensPalo Pinto
Stonewall
Hamilton
Montague
Bandera
Cochran
Jim Wells
Limestone
Kaufman
Fort Bend
Titus
Comal
Armstrong
Kendall
FreestoneComanche
Glasscock
Johnson
Galveston
Henderson
Montgomery
Wichita
Brazos
Van Zandt
Chambers
Robertson
Waller
Sabine
Upshur
Hood
Hutchinson
Shackelford
Childress
Burleson
Nacogdoches
Lampasas
Collingsworth
Hardeman
Throckmorton
GuadalupeCaldwell
Aransas
Marion
San Patricio
Madison
San Jacinto
Delta
Washington Orange
Rains
Gregg
Morris
San Augustine
Franklin
Somervell
Rockwall
-2,139 - 01 - 1,0001,001 - 20,00020,001 - 100,000100,001 - 560,521

Estimated Percent Change of the Total Population by County, Texas, 2010 to 2017
6Source: U.S. Census Bureau, 2017 Vintage Population Estimates
Pecos
Brewster
Webb
Hudspeth
PresidioTerrell
CulbersonReeves
Val Verde
Crockett
Hill
Duval
Harris
Frio
Bell
Kerr
Kenedy
Starr
Polk
Clay
Edwards
Irion
Hall
Ellis
Jeff Davis
Sutton
Uvalde
Bee
Hale
Dallam
Leon
Bexar
Gaines
Hidalgo
Upton
Hartley
King
Erath
Jack
Kinney
Kent
Zavala
Brazoria
Tyler
GrayOldham
Dimmit
CassLynn HuntWise
La Salle
Rusk
Kimble
Lamb
Medina
Floyd
Terry
Coke
Llano
Liberty
Ector
Andrews
Milam
Travis Lee
Knox
Mills
Smith
Falls
Ward
Collin
Jones
Nolan
Potter
Burnet
Cottle
Nueces
Taylor
Real
Coryell
Bowie
Motley
Young
Lamar
Martin
Garza
DallasFisher
Moore
Baylor
Kleberg
Archer
Scurry
Cameron
Cooke
Mason
Parker
Castro
Navarro
Hardin
Deaf Smith Donley
Goliad
Denton
Fannin
Schleicher
Gillespie
Shelby
Foard
Wood
Menard
Panola
Harrison
Zapata
Matagorda
Brown
Reagan Houston
Maverick
Jasper
Coleman
Tom Green
Brooks
Bailey
DeWitt
Lavaca
Hays
Atascosa
BosqueEl Paso
Tarrant
Wharton
CraneConcho
Carson
Runnels
Fayette
Crosby
Borden
Haskell
Calhoun
Newton
Live Oak
Randall
Sterling
Jefferson
Briscoe
McMullen
Parmer
Jim Hogg
Mitchell
Wilson
Victoria
Trinity
Roberts
Howard
Walker
Bastrop
Grayson
San Saba
Midland
Hockley Dickens
Swisher
Gonzales
Winkler Anderson
Dawson
Willacy
Grimes
Wheeler
Cherokee
Colorado
Eastland
Lubbock
Karnes
Red River
Refugio
Austin
Hemphill
Williamson
Jackson
Blanco
Ochiltree
McCulloch
Loving
Sherman
Wilbarger
Hansford
Callahan
McLennan
Yoakum
Angelina
Hopkins
Lipscomb
StephensPalo Pinto
Stonewall
Hamilton
Montague
Bandera
Cochran
Jim Wells
Limestone
Kaufman
Fort Bend
Titus
Comal
Armstrong
Kendall
FreestoneComancheGlasscock
Johnson
Galveston
Henderson
Montgomery
Wichita
Brazos
Van Zandt
Chambers
Robertson
Waller
Sabine
Upshur
Hood
Hutchinson
Shackelford
Childress
Burleson
Nacogdoches
Lampasas
Collingsworth
Hardeman
Throckmorton
GuadalupeCaldwell
Aransas
Marion
San Patricio
Madison
San Jacinto
Delta
Orange
Rains
Gregg
Morris
San Augustine
Franklin
Camp
Somervell
Rockwall
-33.5% - 0%0.1% - 6%6.1% - 12%12.1% - 24%24.1% - 63.4%

Largest U.S. Cities, 2017
Rank Place Census 2010 2011 2012 2013 2014 2015 2016 2017
1 New York, NY 8,175,133 8,292,688 8,383,504 8,458,642 8,521,135 8,582,459 8,615,426 8,622,698
2 Los Angeles, CA 3,792,621 3,824,592 3,859,267 3,891,783 3,922,668 3,953,459 3,981,116 3,999,759
3 Chicago, IL 2,695,598 2,706,670 2,717,989 2,724,482 2,726,533 2,725,154 2,720,275 2,716,450
4 Houston, TX 2,099,451 2,125,450 2,159,824 2,198,244 2,238,795 2,282,235 2,304,482 2,312,717
5 Phoenix, AZ 1,445,632 1,467,519 1,495,880 1,521,182 1,547,729 1,575,039 1,602,042 1,626,078
6 Philadelphia, PA 1,526,006 1,539,649 1,551,944 1,558,109 1,564,042 1,570,507 1,574,765 1,580,863
7 San Antonio, TX 1,327,407 1,357,900 1,383,505 1,408,910 1,435,554 1,464,147 1,487,738 1,511,946
8 San Diego, CA 1,307,402 1,320,638 1,338,975 1,358,207 1,379,123 1,391,040 1,406,682 1,419,516
9 Dallas, TX 1,197,816 1,218,631 1,242,035 1,258,932 1,278,504 1,299,793 1,322,140 1,341,075
10 San Jose, CA 945,942 971,352 985,722 1,003,735 1,016,708 1,027,560 1,031,942 1,035,317
11 Austin, TX 790,390 828,700 854,350 874,910 900,621 919,974 938,200 950,715
Source: U.S. Census Bureau, 2017 Vintage Population Estimates

15 Fastest‐Growing Large Cities and Towns between 2016 and 2017 (Populations of 50,000 or more in 2016)
Rank City StatePercent increase 2017 total population
1 Frisco TX 8.2 177,286
2 New Braunfels TX 8.0 79,152
3 Pflugerville TX 6.5 63,359
4 Ankeny IA 6.4 62,416
5 Buckeye AZ 5.9 68,453
6 Georgetown TX 5.4 70,685
7 Castle Rock town CO 5.1 62,276
8 Franklin TN 4.9 78,321
9 McKinney TX 4.8 181,330
10 Meridian ID 4.7 99,926
11 Flower Mound town TX 4.3 76,681
12 Bend OR 4.3 94,520
13 Cedar Park TX 4.2 75,704
14 Doral FL 4.2 61,130
15 Fort Myers FL 4.2 79,94
8Source: U.S. Census Bureau, 2017 Vintage Population Estimates
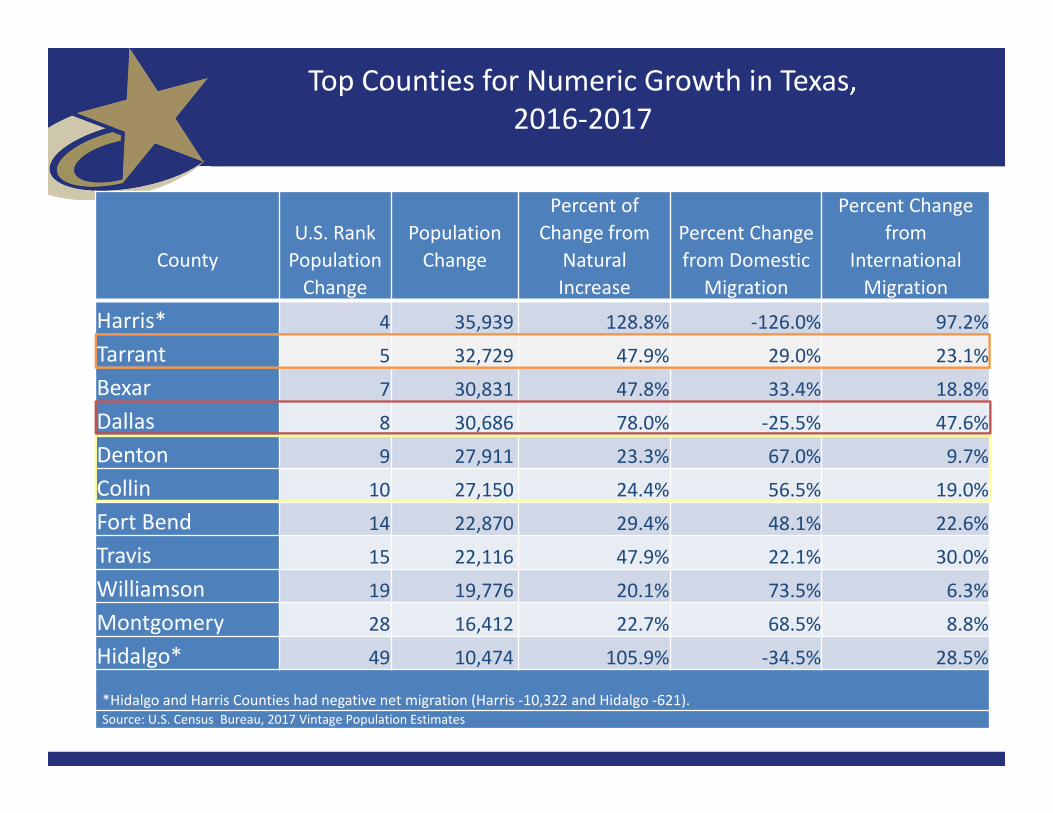
CountyU.S. Rank Population Change
Population Change
Percent of Change from
Natural Increase
Percent Changefrom Domestic
Migration
Percent Change from
International Migration
Harris* 4 35,939 128.8% ‐126.0% 97.2%Tarrant 5 32,729 47.9% 29.0% 23.1%Bexar 7 30,831 47.8% 33.4% 18.8%Dallas 8 30,686 78.0% ‐25.5% 47.6%Denton 9 27,911 23.3% 67.0% 9.7%Collin 10 27,150 24.4% 56.5% 19.0%Fort Bend 14 22,870 29.4% 48.1% 22.6%Travis 15 22,116 47.9% 22.1% 30.0%Williamson 19 19,776 20.1% 73.5% 6.3%Montgomery 28 16,412 22.7% 68.5% 8.8%Hidalgo* 49 10,474 105.9% ‐34.5% 28.5%
*Hidalgo and Harris Counties had negative net migration (Harris ‐10,322 and Hidalgo ‐621).Source: U.S. Census Bureau, 2017 Vintage Population Estimates
Top Counties for Numeric Growth in Texas, 2016‐2017

Racial/Ethnic, Age, and Gender Diversity in Texas

Texas Racial and Ethnic Composition, 2000, 2010, and 2017
Source: U.S. Census Bureau. 2000, 2010 Decennial Census and 2017 Population Estimates 11
NH White, 53%
NH Black, 11%
NH Asian, 3%
NH Other, 1%
Hispanic, 32%
2000
NH White, 45%
NH Black, 12%
NH Asian, 4%
NH Other, 2%
Hispanic, 38%
2010
White, NH42%
Black, NH12%
Asian, NH5%
Two or More Races,
NH1%
Hispanic39%
2017
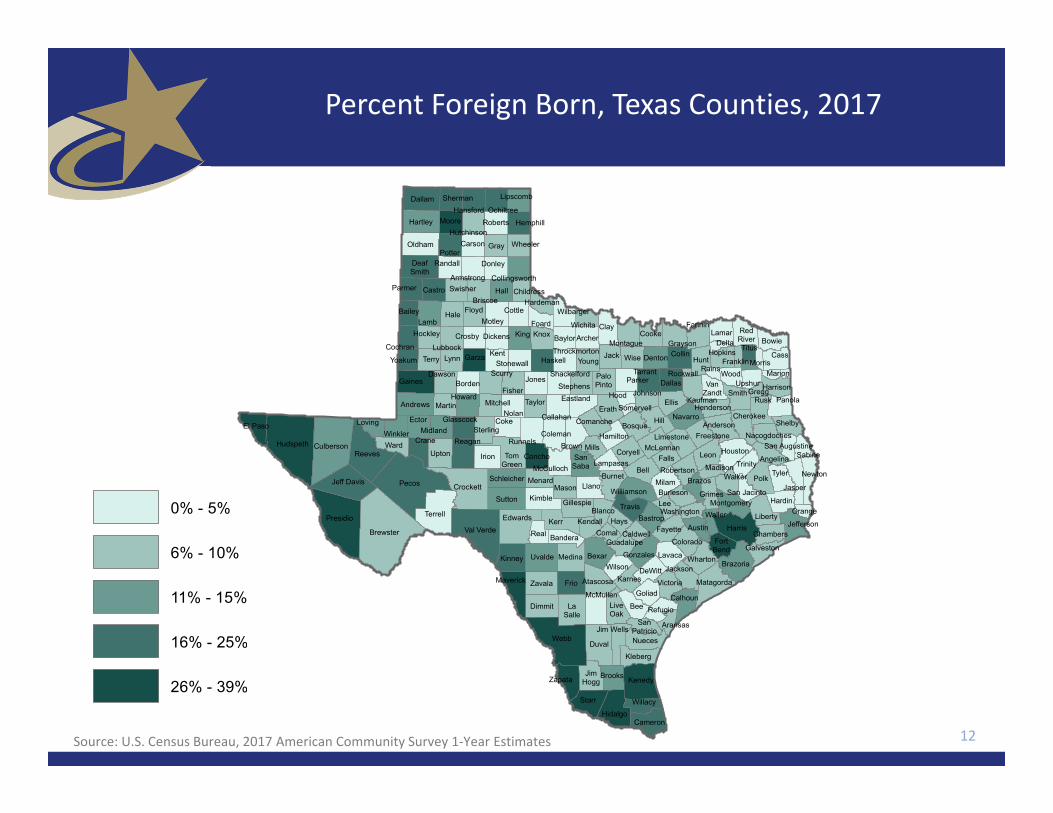
Percent Foreign Born, Texas Counties, 2017
12
Menard
Hale
Armstrong
Calhoun
Clay
Orange
Gonzales
Fannin
Kerr
Refugio
JimHogg
Dimmit
Nolan
Brazos
Jefferson
Bell
Bandera
Hidalgo
Schleicher
GraysonCrosby
Delta
Zavala
Rockwall
Eastland
DeWitt
AngelinaMcLennan
Lamar
Leon
Stonewall
McMullen
Sutton
FortBend
Parker
Kinney
Fayette
Briscoe
Harrison
ReaganColeman
Ochiltree
Crane
Washington
Lynn
Mills
Oldham
Sabine
Hopkins
Houston
Bexar
Upton
Erath
Randall
Rusk
Coryell
Comal
Aransas
Jack
Hemphill
Shackelford
San Jacinto
Kendall
Wharton
Floyd
Karnes
Kaufman
Duval
Johnson
Franklin
Edwards Waller
Maverick
Kleberg
Gaines
Martin
Bowie
Andrews
Potter
Garza
Caldwell
Parmer
TitusTerry
Foard
Real
Carson
Knox
Hays
Medina
Motley Wichita
Midland
Victoria
Tyler
Falls
Presidio
Willacy
Lubbock
Henderson
Walker
Galveston
Harris
Dawson
Pecos
Nacogdoches
Guadalupe
Tarrant
Jackson
Swisher
SterlingWinkler
Frio
Lipscomb
Collingsworth
Colorado
Wise
Glasscock ShelbyComanche
Burnet
Gray
Hudspeth
Cass
Ellis
Cooke
Williamson
Cochran
VanZandt
Donley
Jones
Grimes
Irion
Navarro
Brooks
Dallam
Hunt
Mitchell
Wood
Childress
Jeff Davis
Montague
Brown
Haskell
Fisher
Concho
Coke
Polk
Cottle
Young
Lee
Cherokee
Hall
Hood
ArcherBaylor
San Augustine
Madison
Milam
Reeves
Nueces
FreestoneRunnels
Terrell
DeafSmith
Marion
Liberty
Jasper
Hansford
Chambers
Hardin
Collin
Brazoria
Throckmorton
Bastrop
Scurry
Ector
Limestone
Denton
RedRiver
Matagorda
Hardeman
PaloPinto
LiveOak
Sherman
Uvalde
Bailey
Culberson
Atascosa
Wilson
Starr
Dallas
Kimble
McCulloch
Crockett
Hill
Kent
El Paso Loving
Dickens
LaSalle
Lamb
Austin
Hutchinson
Val Verde
Smith
Robertson
Gillespie
King
TomGreen
Yoakum
Somervell
Kenedy
Borden
SanSaba
Burleson
Bee
Trinity
Castro
Brewster
Gregg
Ward
Wilbarger
Hamilton
Stephens
Lavaca
Bosque
Goliad
Roberts
Callahan
RainsMorris
Lampasas
Upshur
Wheeler
SanPatricio
Moore
Webb
Blanco
Newton
Hockley
Panola
Anderson
Cameron
Montgomery
LlanoMason
Taylor
Hartley
Jim Wells
Zapata
Travis
Howard
0% - 5%
6% - 10%
11% - 15%
16% - 25%
26% - 39%
Source: U.S. Census Bureau, 2017 American Community Survey 1‐Year Estimates

Percent Hispanic Population, Texas Counties, 2017
13
4% - 15%
16% - 30%
31% - 50%
51% - 70%
71% - 99%
Menard
Hale
Armstrong
Calhoun
Clay
Orange
Gonzales
Fannin
Kerr
Refugio
JimHogg
Dimmit
Nolan
Brazos
Jefferson
Bell
Bandera
Hidalgo
Schleicher
GraysonCrosby
Delta
Zavala
Rockwall
Eastland
DeWitt
AngelinaMcLennan
Lamar
Leon
Stonewall
McMullen
Sutton
FortBend
Parker
Kinney
Fayette
Briscoe
Harrison
ReaganColeman
Ochiltree
Crane
Washington
Lynn
Mills
Oldham
Sabine
Hopkins
Houston
Bexar
Upton
Erath
Randall
Rusk
Coryell
Comal
Aransas
Jack
Hemphill
Shackelford
San Jacinto
Kendall
Wharton
Floyd
Karnes
Kaufman
Duval
Johnson
Franklin
Edwards Waller
Maverick
Kleberg
Gaines
Martin
Bowie
Andrews
Potter
Garza
Caldwell
Parmer
TitusTerry
Foard
Real
Carson
Knox
Hays
Medina
Motley Wichita
Midland
Victoria
Tyler
Falls
Presidio
Willacy
Lubbock
Henderson
Walker
Galveston
Harris
Dawson
Pecos
Nacogdoches
Guadalupe
Tarrant
Jackson
Swisher
SterlingWinkler
Frio
Lipscomb
Collingsworth
Colorado
Wise
Glasscock ShelbyComanche
Burnet
Gray
Hudspeth
Cass
Ellis
Cooke
Williamson
Cochran
VanZandt
Donley
Jones
Grimes
Irion
Navarro
Brooks
Dallam
Hunt
Mitchell
Wood
Childress
Jeff Davis
Montague
Brown
Haskell
Fisher
Concho
Coke
Polk
Cottle
Young
Lee
Cherokee
Hall
Hood
ArcherBaylor
San Augustine
Madison
Milam
Reeves
Nueces
FreestoneRunnels
Terrell
DeafSmith
Marion
Liberty
Jasper
Hansford
Chambers
Hardin
Collin
Brazoria
Throckmorton
Bastrop
Scurry
Ector
Limestone
Denton
RedRiver
Matagorda
Hardeman
PaloPinto
LiveOak
Sherman
Uvalde
Bailey
Culberson
Atascosa
Wilson
Starr
Dallas
Kimble
McCulloch
Crockett
Hill
Kent
El Paso Loving
Dickens
LaSalle
Lamb
Austin
Hutchinson
Val Verde
Smith
Robertson
Gillespie
King
TomGreen
Yoakum
Somervell
Kenedy
Borden
SanSaba
Burleson
Bee
Trinity
Castro
Brewster
Gregg
Ward
Wilbarger
Hamilton
Stephens
Lavaca
Bosque
Goliad
Roberts
Callahan
RainsMorris
Lampasas
Upshur
Wheeler
SanPatricio
Moore
Webb
Blanco
Newton
Hockley
Panola
Anderson
Cameron
Montgomery
LlanoMason
Taylor
Hartley
Jim Wells
Zapata
Travis
Howard
Source: U.S. Census Bureau, 2017 American Community Survey 1‐Year Estimates
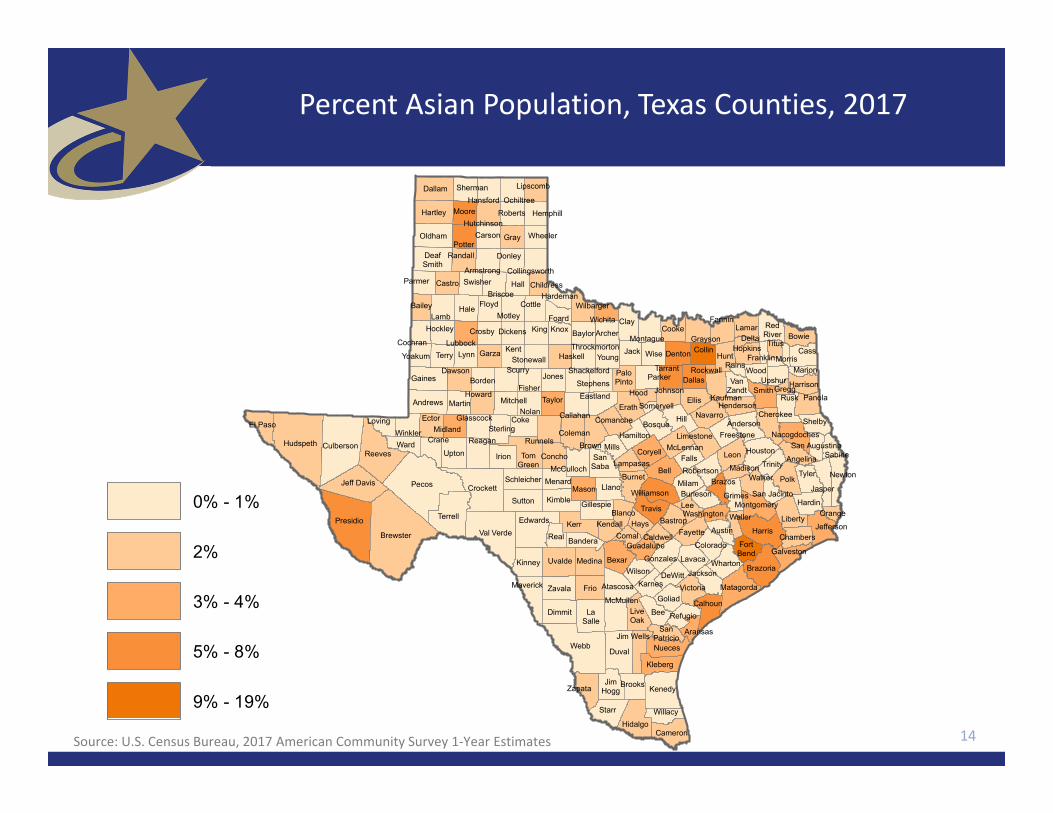
Percent Asian Population, Texas Counties, 2017
14
Menard
Hale
Armstrong
Calhoun
Clay
Orange
Gonzales
Fannin
Kerr
Refugio
JimHogg
Dimmit
Nolan
Brazos
Jefferson
Bell
Bandera
Hidalgo
Schleicher
GraysonCrosby
Delta
Zavala
Rockwall
Eastland
DeWitt
AngelinaMcLennan
Lamar
Leon
Stonewall
McMullen
Sutton
FortBend
Parker
Kinney
Fayette
Briscoe
Harrison
ReaganColeman
Ochiltree
Crane
Washington
Lynn
Mills
Oldham
Sabine
Hopkins
Houston
Bexar
Upton
Erath
Randall
Rusk
Coryell
Comal
Aransas
Jack
Hemphill
Shackelford
San Jacinto
Kendall
Wharton
Floyd
Karnes
Kaufman
Duval
Johnson
Franklin
Edwards Waller
Maverick
Kleberg
Gaines
Martin
Bowie
Andrews
Potter
Garza
Caldwell
Parmer
TitusTerry
Foard
Real
Carson
Knox
Hays
Medina
Motley Wichita
Midland
Victoria
Tyler
Falls
Presidio
Willacy
Lubbock
Henderson
Walker
Galveston
Harris
Dawson
Pecos
Nacogdoches
Guadalupe
Tarrant
Jackson
Swisher
SterlingWinkler
Frio
Lipscomb
Collingsworth
Colorado
Wise
Glasscock ShelbyComanche
Burnet
Gray
Hudspeth
Cass
Ellis
Cooke
Williamson
Cochran
VanZandt
Donley
Jones
Grimes
Irion
Navarro
Brooks
Dallam
Hunt
Mitchell
Wood
Childress
Jeff Davis
Montague
Brown
Haskell
Fisher
Concho
Coke
Polk
Cottle
Young
Lee
Cherokee
Hall
Hood
ArcherBaylor
San Augustine
Madison
Milam
Reeves
Nueces
FreestoneRunnels
Terrell
DeafSmith
Marion
Liberty
Jasper
Hansford
Chambers
Hardin
Collin
Brazoria
Throckmorton
Bastrop
Scurry
Ector
Limestone
Denton
RedRiver
Matagorda
Hardeman
PaloPinto
LiveOak
Sherman
Uvalde
Bailey
Culberson
Atascosa
Wilson
Starr
Dallas
Kimble
McCulloch
Crockett
Hill
Kent
El Paso Loving
Dickens
LaSalle
Lamb
Austin
Hutchinson
Val Verde
Smith
Robertson
Gillespie
King
TomGreen
Yoakum
Somervell
Kenedy
Borden
SanSaba
Burleson
Bee
Trinity
Castro
Brewster
Gregg
Ward
Wilbarger
Hamilton
Stephens
Lavaca
Bosque
Goliad
Roberts
Callahan
RainsMorris
Lampasas
Upshur
Wheeler
SanPatricio
Moore
Webb
Blanco
Newton
Hockley
Panola
Anderson
Cameron
Montgomery
LlanoMason
Taylor
Hartley
Jim Wells
Zapata
Travis
Howard
0% - 1%
2%
3% - 4%
5% - 8%
9% - 19%
Source: U.S. Census Bureau, 2017 American Community Survey 1‐Year Estimates
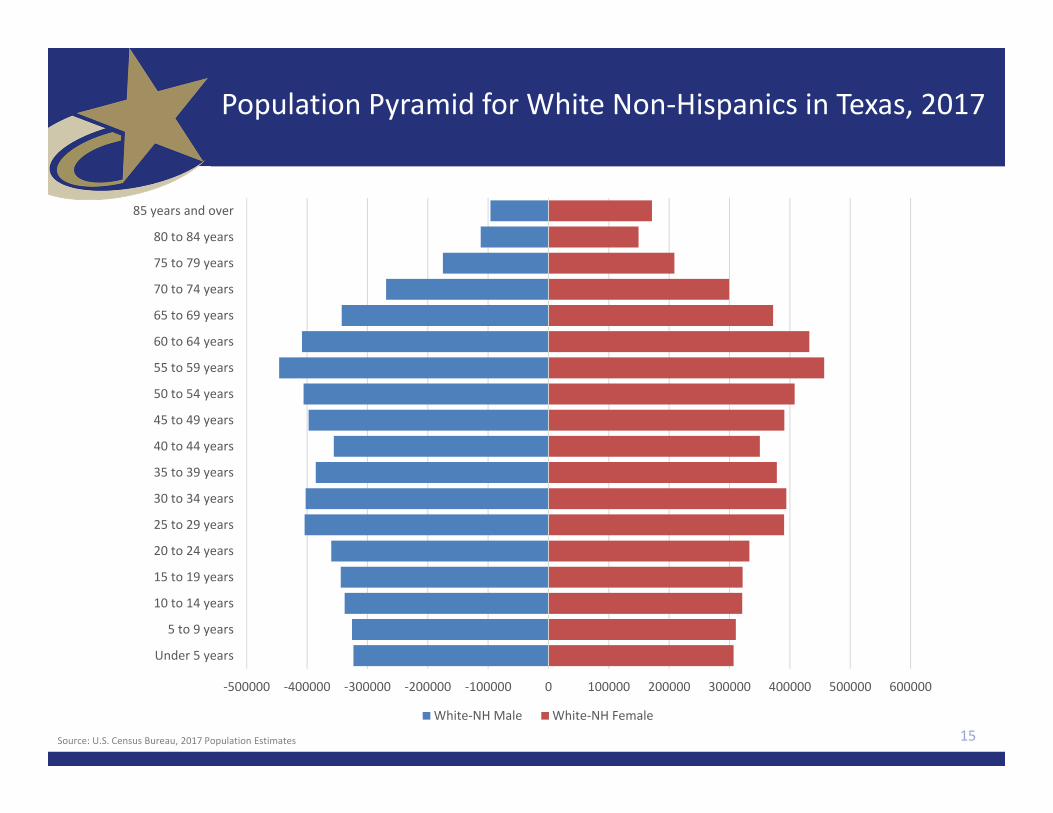
Population Pyramid for White Non‐Hispanics in Texas, 2017
15
‐500000 ‐400000 ‐300000 ‐200000 ‐100000 0 100000 200000 300000 400000 500000 600000
Under 5 years
5 to 9 years
10 to 14 years
15 to 19 years
20 to 24 years
25 to 29 years
30 to 34 years
35 to 39 years
40 to 44 years
45 to 49 years
50 to 54 years
55 to 59 years
60 to 64 years
65 to 69 years
70 to 74 years
75 to 79 years
80 to 84 years
85 years and over
White‐NH Male White‐NH Female
Source: U.S. Census Bureau, 2017 Population Estimates

Population Pyramid for Hispanics in Texas, 2017
16
‐600000 ‐400000 ‐200000 0 200000 400000 600000
Under 5 years
5 to 9 years
10 to 14 years
15 to 19 years
20 to 24 years
25 to 29 years
30 to 34 years
35 to 39 years
40 to 44 years
45 to 49 years
50 to 54 years
55 to 59 years
60 to 64 years
65 to 69 years
70 to 74 years
75 to 79 years
80 to 84 years
85 years and over
Hispanic Male Hispanic Female
Source: U.S. Census Bureau, 2017 Population Estimates

Texas Population Pyramid by Race/Ethnicity, 2017
17Source: U.S. Census Bureau, 2017 Population Estimates
‐1500000 ‐1000000 ‐500000 0 500000 1000000 1500000
Under 5 years
5 to 9 years
10 to 14 years
15 to 19 years
20 to 24 years
25 to 29 years
30 to 34 years
35 to 39 years
40 to 44 years
45 to 49 years
50 to 54 years
55 to 59 years
60 to 64 years
65 to 69 years
70 to 74 years
75 to 79 years
80 to 84 years
85 years and over
Asian‐NH Male Black‐NH Male White‐NH Male Hispanic Male
Asian‐NH Female Black‐NH Female White‐NH Female Hispanic Female
18
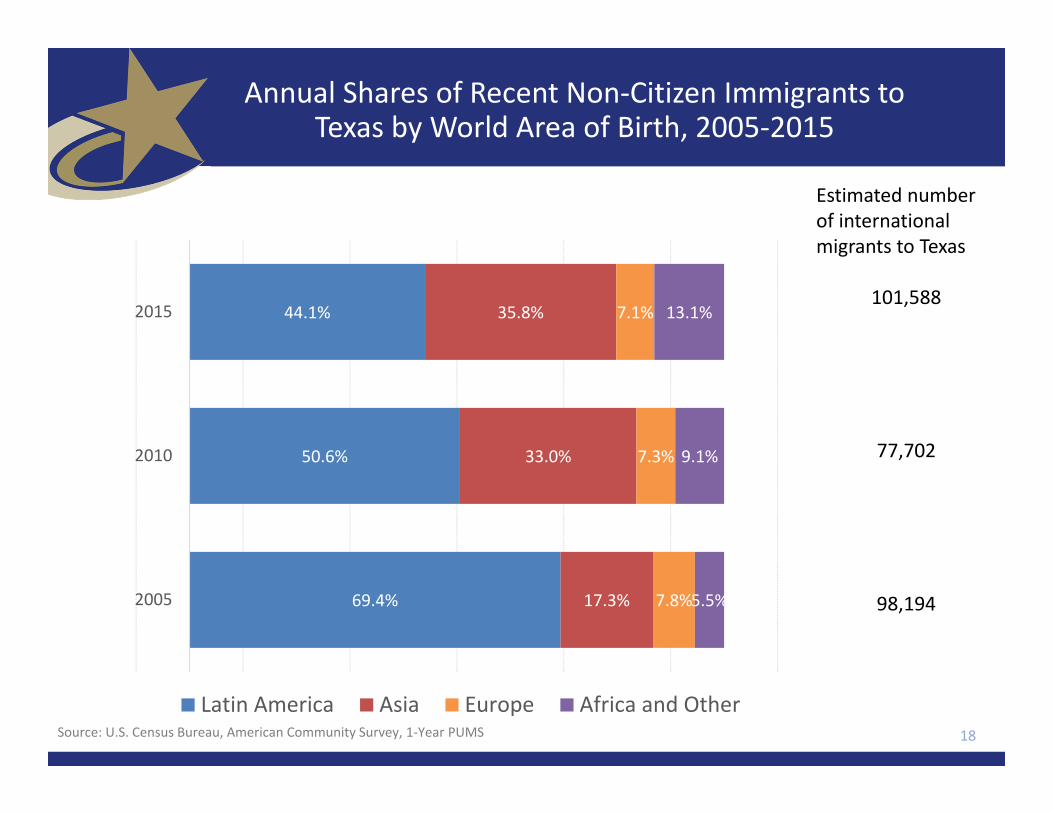
Annual Shares of Recent Non‐Citizen Immigrants to Texas by World Area of Birth, 2005‐2015
Source: U.S. Census Bureau, American Community Survey, 1‐Year PUMS
44.1%
50.6%
69.4%
35.8%
33.0%
17.3%
7.1%
7.3%
7.8%
13.1%
9.1%
5.5%
2015
2010
2005
Latin America Asia Europe Africa and Other
Estimated number of international migrants to Texas
101,588
77,702
98,194

19
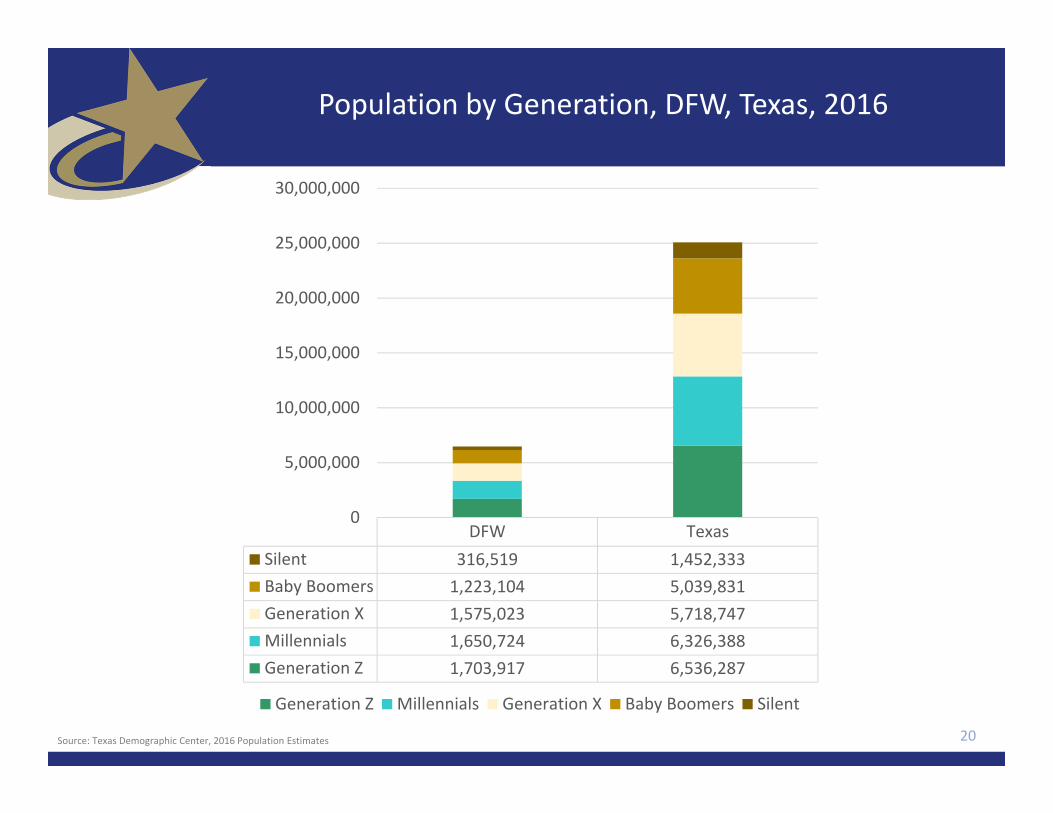
Population by Generation, DFW, Texas, 2016
20
DFW TexasSilent 316,519 1,452,333Baby Boomers 1,223,104 5,039,831Generation X 1,575,023 5,718,747Millennials 1,650,724 6,326,388Generation Z 1,703,917 6,536,287
0
5,000,000
10,000,000
15,000,000
20,000,000
25,000,000
30,000,000
Generation Z Millennials Generation X Baby Boomers Silent
Source: Texas Demographic Center, 2016 Population Estimates

21

Educational Attainment by Race/Ethnicity, Texas and Big Four Metro Areas, 2017
22Source: U.S. Census Bureau, 2017 American Community Survey 1‐Year Estimates
High School Degree and above
Bachelor’s Degree and above
83.6%
94.0%
66.2%
89.5% 88.4%
29.6%
38.6%
14.5%
24.2%
59.2%
0%
10%
20%
30%
40%
50%
60%
70%
80%
90%
100%
Total NHWhite
Hispanic Black Asian Total NHWhite
Hispanic Black Asian
Austin Dallas Houston San Antonio Texas
Educational attainment in the Dallas metro is higher or similar to that of the state with the exception of Hispanic educational attainment, where it is lower.
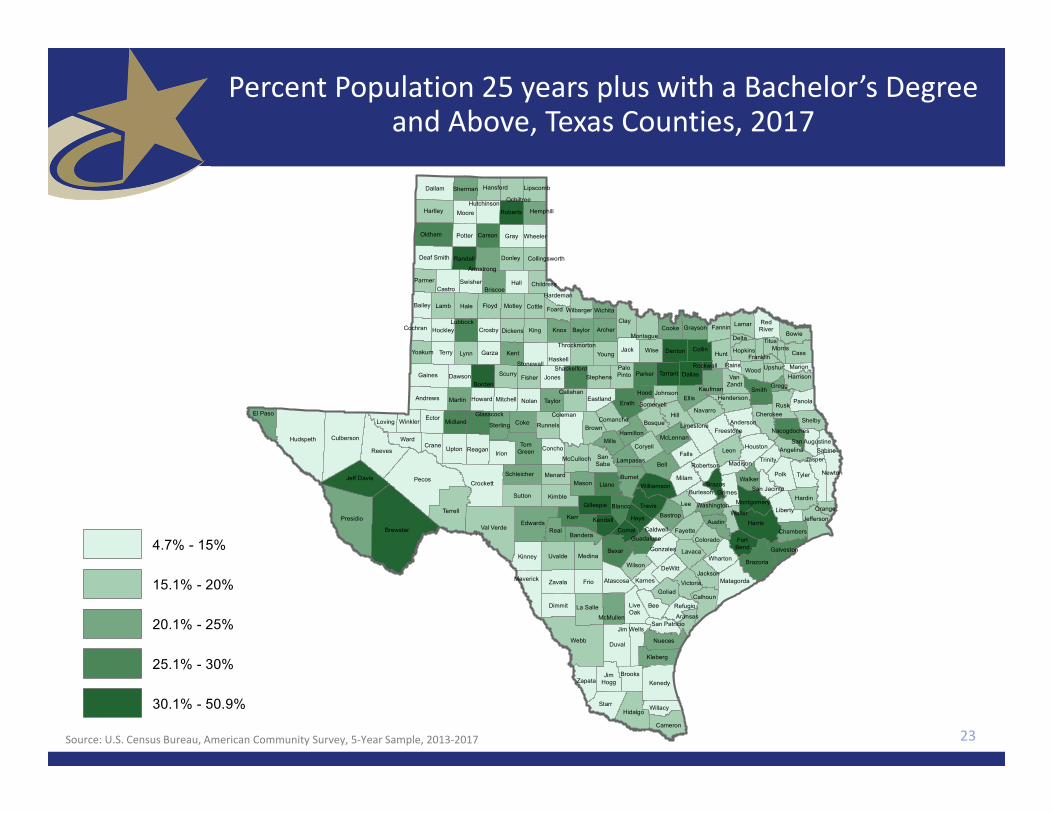
Percent Population 25 years plus with a Bachelor’s Degree and Above, Texas Counties, 2017
23
Menard
Hale
Armstrong
Calhoun
Clay
Orange
Gonzales
Fannin
Kerr
Refugio
JimHogg
Dimmit
Nolan
Brazos
Jefferson
Bell
Bandera
Hidalgo
Schleicher
GraysonCrosbyDelta
Zavala
Rockwall
Eastland
DeWitt
Angelina
McLennan
Lamar
Leon
Stonewall
McMullen
Sutton
FortBend
Parker
Kinney
Fayette
Briscoe
Harrison
Reagan
Coleman
Ochiltree
Crane
Washington
Lynn
Mills
Oldham
Sabine
Hopkins
Houston
Bexar
Upton
Erath
Randall
Rusk
Coryell
Comal
Aransas
Jack
Hemphill
Shackelford
San Jacinto
Kendall
Wharton
Floyd
Karnes
Kaufman
Duval
Johnson
Franklin
EdwardsWaller
Maverick
Kleberg
Gaines
Martin
Bowie
Andrews
Potter
Garza
Caldwell
Parmer
Titus
Terry
Foard
Real
Carson
Knox
Hays
Medina
MotleyWichita
Midland
Victoria
Tyler
Falls
Presidio
Willacy
Lubbock
Henderson
Walker
Galveston
Harris
Dawson
Pecos
Nacogdoches
Guadalupe
Tarrant
Jackson
Swisher
SterlingWinkler
Frio
Lipscomb
Collingsworth
Colorado
Wise
GlasscockShelbyComanche
Burnet
Gray
Hudspeth
Cass
Ellis
Cooke
Williamson
Cochran
VanZandt
Donley
Jones
Grimes
Irion
Navarro
Brooks
Dallam
Hunt
Mitchell
Wood
Childress
Jeff Davis
Montague
Brown
Haskell
Fisher
Concho
Coke
Polk
Cottle
Young
Lee
Cherokee
Hall
Hood
ArcherBaylor
San Augustine
Madison
Milam
Reeves
Nueces
FreestoneRunnels
Terrell
Deaf Smith
Marion
Liberty
Jasper
Hansford
Chambers
Hardin
Collin
Brazoria
Throckmorton
Bastrop
Scurry
EctorLimestone
Denton
RedRiver
Matagorda
Hardeman
PaloPinto
LiveOak
Sherman
Uvalde
Bailey
Culberson
Atascosa
Wilson
Starr
Dallas
Kimble
McCulloch
Crockett
Hill
Kent
El PasoLoving
Dickens
La Salle
Lamb
Austin
Hutchinson
Val Verde
Smith
Robertson
Gillespie
King
TomGreen
Yoakum
Somervell
Kenedy
Borden
SanSaba
Burleson
Bee
Trinity
Castro
Brewster
Gregg
Ward
Wilbarger
Hamilton
Stephens
Lavaca
Bosque
Goliad
Roberts
Callahan
Rains
Morris
Lampasas
Upshur
Wheeler
San Patricio
Moore
Webb
Blanco
Newton
Hockley
Panola
Anderson
Cameron
Montgomery
LlanoMason
Taylor
Hartley
Jim Wells
Zapata
Travis
Howard
4.7% - 15%
15.1% - 20%
20.1% - 25%
25.1% - 30%
30.1% - 50.9%
Source: U.S. Census Bureau, American Community Survey, 5‐Year Sample, 2013‐2017
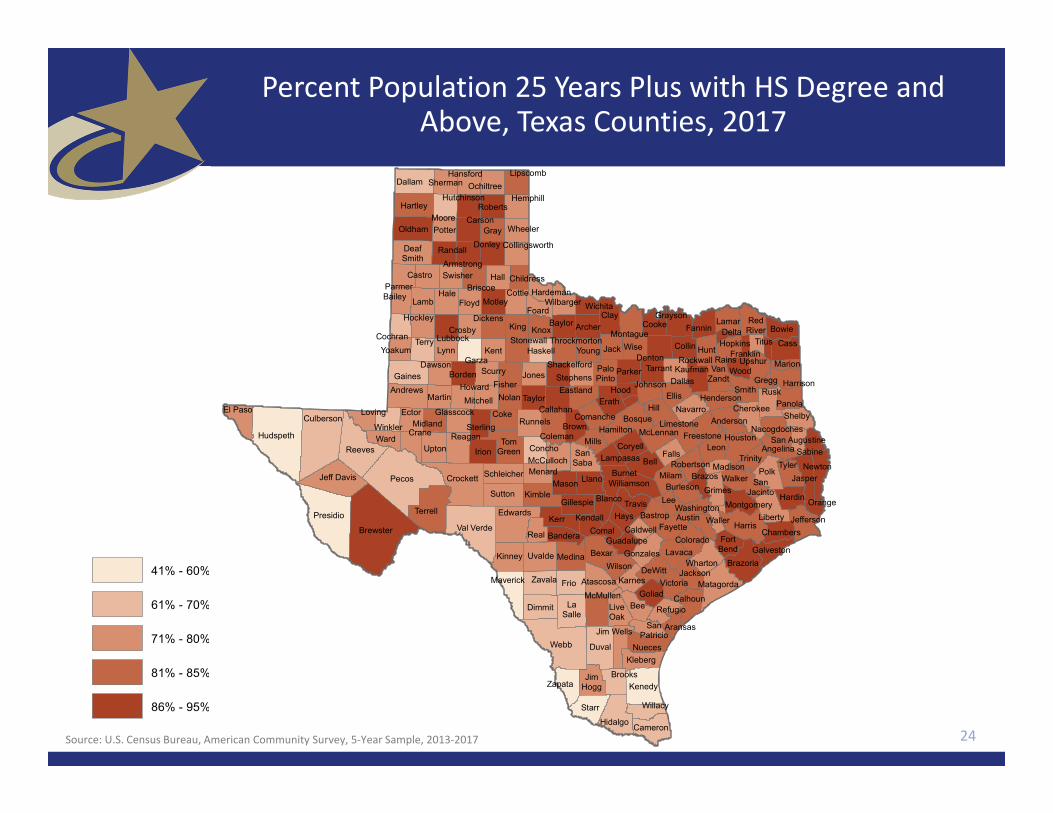
Percent Population 25 Years Plus with HS Degree and Above, Texas Counties, 2017
24
Menard
Hale
Armstrong
Calhoun
Clay
Orange
Gonzales
Fannin
Kerr
Refugio
JimHogg
Dimmit
Nolan
Brazos
Jefferson
Bell
Bandera
Hidalgo
Schleicher
Grayson
Crosby Delta
Zavala
Rockwall
Eastland
DeWitt
Angelina
McLennan
Lamar
Leon
Stonewall
McMullen
Sutton
FortBend
Parker
Kinney
Fayette
Briscoe
Harrison
Reagan Coleman
Ochiltree
Crane
Washington
Lynn
Mills
Oldham
Sabine
Hopkins
Houston
Bexar
Upton
Erath
Randall
Rusk
Coryell
Comal
Aransas
Jack
Hemphill
Shackelford
SanJacinto
Kendall
Wharton
Floyd
Karnes
Kaufman
Duval
Johnson
Franklin
EdwardsWaller
Maverick
Kleberg
Gaines
Martin
Bowie
Andrews
Potter
Garza
Caldwell
Parmer
TitusTerry
Foard
Real
Carson
Knox
Hays
Medina
Motley Wichita
Midland
Victoria
TylerFalls
Presidio
Willacy
Lubbock
Henderson
Walker
Galveston
Harris
Dawson
Pecos
Nacogdoches
Guadalupe
Tarrant
Jackson
Swisher
SterlingWinkler
Frio
Lipscomb
Collingsworth
Colorado
Wise
Glasscock ShelbyComanche
Burnet
Gray
Hudspeth
Cass
Ellis
Cooke
Williamson
Cochran
VanZandt
Donley
Jones
Grimes
Irion
Navarro
Brooks
Dallam
Hunt
Mitchell
Wood
Childress
Jeff Davis
Montague
Brown
Haskell
Fisher
Concho
Coke
Polk
Cottle
Young
Lee
Cherokee
Hall
Hood
ArcherBaylor
San Augustine
MadisonMilam
Reeves
Nueces
FreestoneRunnels
Terrell
DeafSmith
Marion
Liberty
Jasper
Hansford
Chambers
Hardin
Collin
Brazoria
Throckmorton
Bastrop
Scurry
EctorLimestone
Denton
RedRiver
Matagorda
Hardeman
PaloPinto
LiveOak
Sherman
Uvalde
Bailey
Culberson
Atascosa
Wilson
Starr
Dallas
Kimble
McCulloch
Crockett
Hill
Kent
El Paso Loving
Dickens
LaSalle
Lamb
Austin
Hutchinson
Val Verde
Smith
Robertson
Gillespie
King
TomGreen
Yoakum
Kenedy
Borden
SanSaba
Burleson
Bee
Trinity
Castro
Brewster
Gregg
Ward
Wilbarger
Hamilton
Stephens
Lavaca
Bosque
Goliad
Roberts
Callahan
Rains
Lampasas
Upshur
Wheeler
SanPatricio
Moore
Webb
Blanco
Newton
Hockley
Panola
Anderson
Cameron
Montgomery
LlanoMason
Taylor
Hartley
Jim Wells
Zapata
Travis
Howard
41% - 60%
61% - 70%
71% - 80%
81% - 85%
86% - 95%
Source: U.S. Census Bureau, American Community Survey, 5‐Year Sample, 2013‐2017

$59,206
$72,361
$46,855 $45,092
$84,100
$0
$10,000
$20,000
$30,000
$40,000
$50,000
$60,000
$70,000
$80,000
$90,000
$100,000
Total NH White Hispanic Black Asian
Austin Dallas Houston San Antonio Texas
Median Household Income by Race/Ethnicity, Texas and Big Four Metro Areas, 2017
25
Median household incomes in the Dallas metro tend to be higher than the state for all race/ethnic groups, but especially for Asians.
Source: U.S. Census Bureau, 2017 American Community Survey 1‐Year Estimates

Median Household Income, Texas Counties, 2017
26Source: U.S. Census Bureau, American Community Survey 2017 5-Year Estimates
Less than $25k
$25,000.00 - $34,999.99
$35,000.00 - $49,999.99
$50,000.00 - $74,999.99
$75k or greater
Menard
Hale
Armstrong
Calhoun
Clay
Orange
Gonzales
Fannin
Kerr
Refugio
JimHogg
Dimmit
Nolan
Brazos
Jefferson
Bell
Bandera
Hidalgo
Schleicher
GraysonCrosbyDelta
Zavala
Rockwall
Eastland
DeWitt
Angelina
McLennan
Lamar
Leon
Stonewall
McMullen
Sutton
FortBend
Parker
Kinney
Fayette
Briscoe
Harrison
Reagan
Coleman
Ochiltree
Crane
Washington
Lynn
Mills
Oldham
Sabine
Hopkins
Houston
Bexar
Upton
Erath
Randall
Rusk
Coryell
Comal
Aransas
Jack
Hemphill
Shackelford
San Jacinto
Kendall
Wharton
Floyd
Karnes
Kaufman
Duval
Johnson
Franklin
EdwardsWaller
Maverick
Kleberg
Gaines
Martin
Bowie
Andrews
Potter
Garza
Caldwell
Parmer
Titus
Terry
Foard
Real
Carson
Knox
Hays
Medina
MotleyWichita
Midland
Victoria
Tyler
Falls
Presidio
Willacy
Lubbock
Henderson
Walker
Galveston
Harris
Dawson
Pecos
Nacogdoches
Guadalupe
Tarrant
Jackson
Swisher
SterlingWinkler
Frio
Lipscomb
Collingsworth
Colorado
Wise
GlasscockShelbyComanche
Burnet
Gray
Hudspeth
Cass
Ellis
Cooke
Williamson
Cochran
VanZandt
Donley
Jones
Grimes
Irion
Navarro
Brooks
Dallam
Hunt
Mitchell
Wood
Childress
Jeff Davis
Montague
Brown
Haskell
Fisher
Concho
Coke
Polk
Cottle
Young
Lee
Cherokee
Hall
Hood
ArcherBaylor
San Augustine
Madison
Milam
Reeves
Nueces
FreestoneRunnels
Terrell
Deaf Smith
Marion
Liberty
Jasper
Hansford
Chambers
Hardin
Collin
Brazoria
Throckmorton
Bastrop
Scurry
EctorLimestone
Denton
RedRiver
Matagorda
Hardeman
PaloPinto
LiveOak
Sherman
Uvalde
Bailey
Culberson
Atascosa
Wilson
Starr
Dallas
Kimble
McCulloch
Crockett
Hill
Kent
El PasoLoving
Dickens
La Salle
Lamb
Austin
Hutchinson
Val Verde
Smith
Robertson
Gillespie
King
TomGreen
Yoakum
Somervell
Kenedy
Borden
SanSaba
Burleson
Bee
Trinity
Castro
Brewster
Gregg
Ward
Wilbarger
Hamilton
Stephens
Lavaca
Bosque
Goliad
Roberts
Callahan
Rains
Morris
Lampasas
Upshur
Wheeler
San Patricio
Moore
Webb
Blanco
Newton
Hockley
Panola
Anderson
Cameron
Montgomery
LlanoMason
Taylor
Hartley
Jim Wells
Zapata
Travis
Howard
5.1%4.3%
5.3%8.2%
4.0%
14.7%
8.5%
20.7%19.0%
9.8%
0.0%
5.0%
10.0%
15.0%
20.0%
25.0%
Total NHWhite
Hispanic Black Asian Total NHWhite
Hispanic Black Asian
Austin Dallas Houston San Antonio Texas
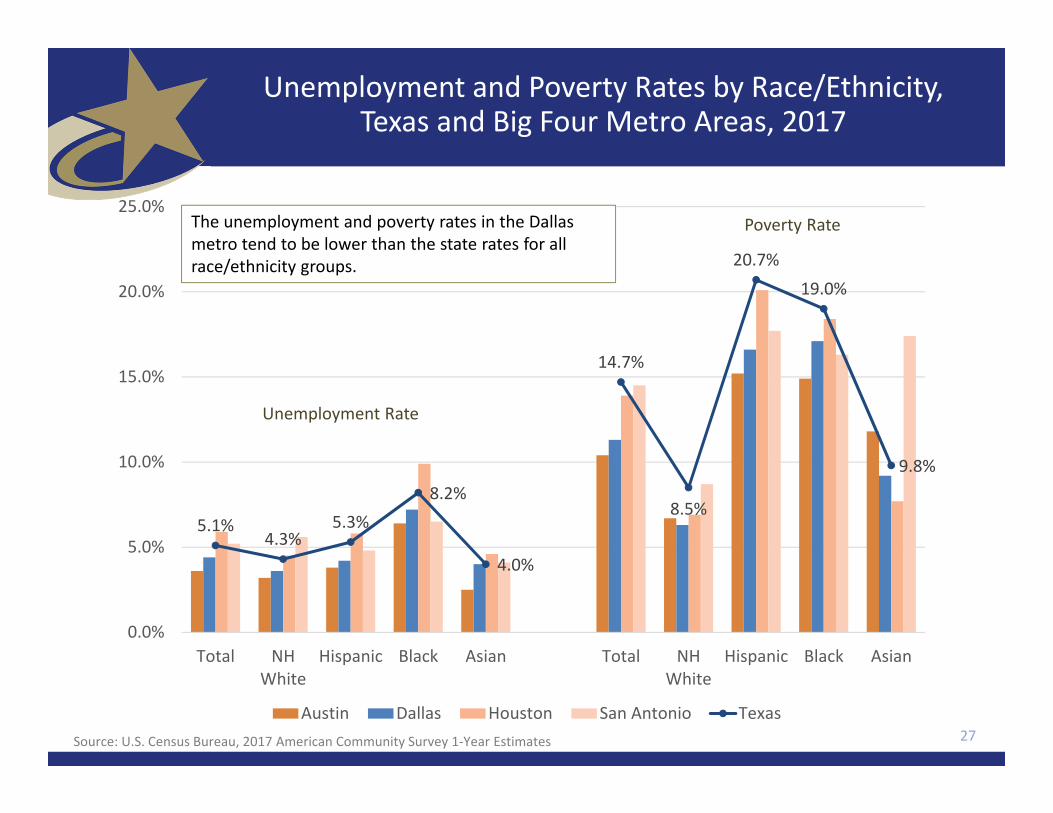
Unemployment and Poverty Rates by Race/Ethnicity, Texas and Big Four Metro Areas, 2017
27
The unemployment and poverty rates in the Dallas metro tend to be lower than the state rates for all race/ethnicity groups.
Source: U.S. Census Bureau, 2017 American Community Survey 1‐Year Estimates
Poverty Rate
Unemployment Rate

Median Earnings for Full‐Time, Year‐Round Employees by Sex, Texas, 2017
Total Median Earnings $44,803
Male Median Earnings $49,414
Female Median Earnings $40,236
Pay Gap $0.81 to the dollar
NH White Women $0.76 to the dollar
Hispanic Women $0.47 to the dollar
Black Women $0.62 to the dollar
Asian Women $0.81 to the dollar
28Source: U.S. Census Bureau, 2017 American Community Survey 1‐Year Estimates
*pay gap derived using NH White male pay as reference group.

Gender Pay Gap, Texas and Big Four Metros, 2017
Pay Gap for Hispanic Women
Texas .60
Austin Metro .64
DFWMetro .59
Houston Metro .56
San Antonio Metro .74
29
Median Earnings, Male
MedianEarnings, Female
Pay Gap
Texas $49,414 $40,236 .81Austin Metro $55,162 $47,075 .85DFWMetro $51,498 $44,207 .86
Houston Metro $51,634 $42,274 .82San Antonio Metro $43,515 $37,535 .86
Source: U.S. Census Bureau, 2017 American Community Survey 1‐Year Estimates

Texas Legislature Demographics, 2019
• Nearly 2 of every 3 Texas lawmakers are white.
• Less than ¼ of them are women.
30Source: Texas Tribune, https://apps.texastribune.org/features/2019/texas‐lawmakers‐legislature‐demographics/

Texas Children
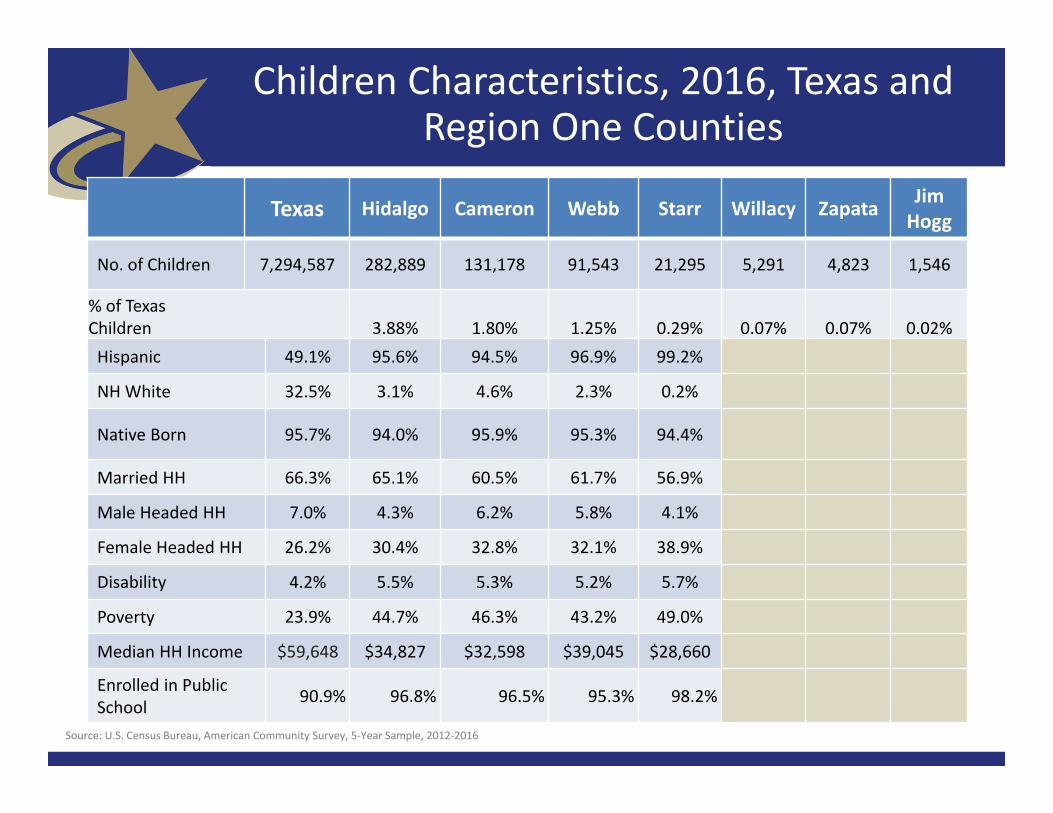
Children Characteristics, 2016, Texas and Region One Counties
Texas Hidalgo Cameron Webb Starr Willacy Zapata Jim Hogg
No. of Children 7,294,587 282,889 131,178 91,543 21,295 5,291 4,823 1,546
% of Texas Children 3.88% 1.80% 1.25% 0.29% 0.07% 0.07% 0.02%Hispanic 49.1% 95.6% 94.5% 96.9% 99.2%
NH White 32.5% 3.1% 4.6% 2.3% 0.2%
Native Born 95.7% 94.0% 95.9% 95.3% 94.4%
Married HH 66.3% 65.1% 60.5% 61.7% 56.9%
Male Headed HH 7.0% 4.3% 6.2% 5.8% 4.1%
Female Headed HH 26.2% 30.4% 32.8% 32.1% 38.9%
Disability 4.2% 5.5% 5.3% 5.2% 5.7%
Poverty 23.9% 44.7% 46.3% 43.2% 49.0%
Median HH Income $59,648 $34,827 $32,598 $39,045 $28,660
Enrolled in Public School 90.9% 96.8% 96.5% 95.3% 98.2%
Source: U.S. Census Bureau, American Community Survey, 5‐Year Sample, 2012‐2016

Percent under 18 Years, Living below Poverty, Texas Counties, 2017
33Source: U.S. Census Bureau, American Community Survey, 5‐Year Sample, 2013‐2017
0% - 15%
16% - 20%
21% - 30%
31% - 35%
36% - 62%
Menard
Hale
Armstrong
Calhoun
Clay
Orange
Gonzales
Fannin
Kerr
Refugio
JimHogg
Dimmit
Nolan
Brazos
Jefferson
Bell
Bandera
Hidalgo
Schleicher
Grayson
Crosby
Zavala
Rockwall
Eastland
DeWitt
Angelina
McLennan
Lamar
Leon
Stonewall
McMullen
Sutton
Fort Bend
Parker
Kinney
Fayette
Briscoe
Harrison
ReaganColeman
Ochiltree
Crane
Washington
Lynn
Mills
Oldham
Sabine
Hopkins
Houston
Bexar
Upton
Erath
Randall
Rusk
Coryell
Comal
Aransas
Jack
Hemphill
Shackelford
SanJacinto
Kendall
Wharton
Floyd
Karnes
Kaufman
Duval
Johnson
Franklin
Edwards Waller
Maverick
Kleberg
Gaines
Martin
Bowie
Andrews
Potter
Garza
Caldwell
Parmer
TitusTerry
Foard
Real
Carson
Knox
Hays
Medina
Motley Wichita
Midland
Victoria
TylerFalls
Presidio
Willacy
Lubbock
Henderson
Walker
Galveston
Harris
Dawson
Pecos
Nacogdoches
Guadalupe
Tarrant
Jackson
Swisher
SterlingWinkler
Frio
Lipscomb
Collingsworth
Colorado
Wise
Glasscock ShelbyComanche
Burnet
Gray
Hudspeth
Cass
Ellis
Cooke
Williamson
Cochran
VanZandt
Donley
Jones
Grimes
Irion
Navarro
Brooks
Dallam
Hunt
Mitchell
Wood
Childress
Jeff Davis
Montague
Brown
Haskell
Fisher
Concho
Coke
Polk
Cottle
Young
Cherokee
Hall
Hood
ArcherBaylor
San Augustine
MadisonMilam
Reeves
Nueces
Camp
FreestoneRunnels
Terrell
DeafSmith
Marion
Liberty
Jasper
Hansford
Chambers
Hardin
Collin
Brazoria
Throckmorton
Bastrop
Scurry
Ector
Limestone
Denton
RedRiver
Matagorda
Hardeman
PaloPinto
LiveOak
Sherman
Uvalde
Bailey
Culberson
AtascosaWilson
Starr
Dallas
Kimble
McCulloch
Crockett
Hill
Kent
El Paso Loving
Dickens
LaSalle
Lamb
Austin
Hutchinson
Val Verde
Smith
Robertson
Gillespie
King
TomGreen
Yoakum
Kenedy
Borden
SanSaba
Burleson
Bee
Trinity
Castro
Brewster
Gregg
Ward
Wilbarger
Hamilton
Stephens
Lavaca
Bosque
Goliad
Roberts
Callahan
Rains
Lampasas
Upshur
Wheeler
San Patricio
Moore
Webb
Blanco
Newton
Hockley
Panola
Anderson
Cameron
Montgomery
LlanoMason
Taylor
Hartley
Jim Wells
Zapata
Travis
Howard
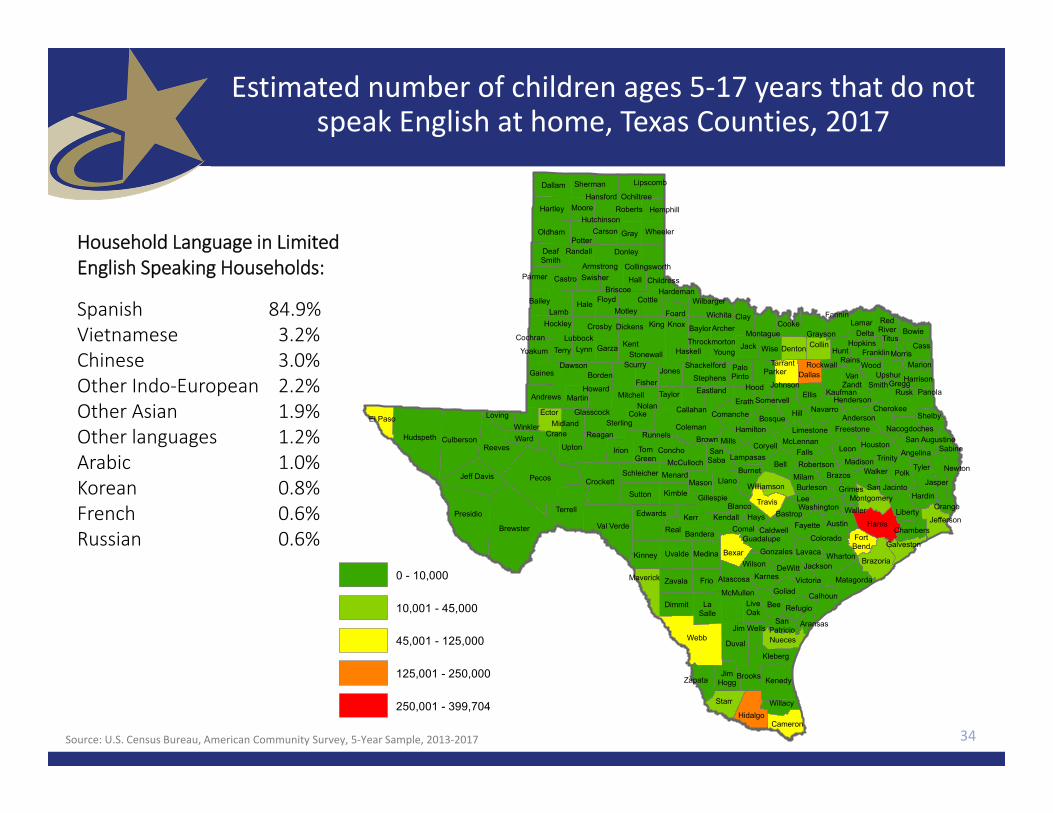
Estimated number of children ages 5‐17 years that do not speak English at home, Texas Counties, 2017
34Source: U.S. Census Bureau, American Community Survey, 5‐Year Sample, 2013‐2017
Household Language in Limited English Speaking Households:
Spanish 84.9%Vietnamese 3.2%Chinese 3.0%Other Indo‐European 2.2%Other Asian 1.9%Other languages 1.2%Arabic 1.0%Korean 0.8%French 0.6%Russian 0.6%
Menard
Hale
Armstrong
Calhoun
Clay
Orange
Gonzales
Fannin
Kerr
Refugio
JimHogg
Dimmit
Nolan
Brazos
Jefferson
Bell
Bandera
Hidalgo
Schleicher
GraysonCrosby
Delta
Zavala
Rockwall
Eastland
DeWitt
AngelinaMcLennan
Lamar
Leon
Stonewall
McMullen
Sutton
FortBend
Parker
Kinney
Fayette
Briscoe
Harrison
ReaganColeman
Ochiltree
Crane
Washington
Lynn
Mills
Oldham
Sabine
Hopkins
Houston
Bexar
Upton
Erath
Randall
Rusk
Coryell
Comal
Aransas
Jack
Hemphill
Shackelford
San Jacinto
Kendall
Wharton
Floyd
Karnes
Kaufman
Duval
Johnson
Franklin
Edwards Waller
Maverick
Kleberg
Gaines
Martin
Bowie
Andrews
Potter
Garza
Caldwell
Parmer
TitusTerry
Foard
Real
Carson
Knox
Hays
Medina
Motley Wichita
Midland
Victoria
Tyler
Falls
Presidio
Willacy
Lubbock
Henderson
Walker
Galveston
Harris
Dawson
Pecos
Nacogdoches
Guadalupe
Tarrant
Jackson
Swisher
SterlingWinkler
Frio
Lipscomb
Collingsworth
Colorado
Wise
Glasscock ShelbyComanche
Burnet
Gray
Hudspeth
Cass
Ellis
Cooke
Williamson
Cochran
VanZandt
Donley
Jones
Grimes
Irion
Navarro
Brooks
Dallam
Hunt
Mitchell
Wood
Childress
Jeff Davis
Montague
Brown
Haskell
Fisher
Concho
Coke
Polk
Cottle
Young
Lee
Cherokee
Hall
Hood
ArcherBaylor
San Augustine
Madison
Milam
Reeves
Nueces
FreestoneRunnels
Terrell
DeafSmith
Marion
Liberty
Jasper
Hansford
Chambers
Hardin
Collin
Brazoria
Throckmorton
Bastrop
Scurry
Ector
Limestone
Denton
RedRiver
Matagorda
Hardeman
PaloPinto
LiveOak
Sherman
Uvalde
Bailey
Culberson
Atascosa
Wilson
Starr
Dallas
Kimble
McCulloch
Crockett
Hill
Kent
El Paso Loving
Dickens
LaSalle
Lamb
Austin
Hutchinson
Val Verde
Smith
Robertson
Gillespie
King
TomGreen
Yoakum
Somervell
Kenedy
Borden
SanSaba
Burleson
Bee
Trinity
Castro
Brewster
Gregg
Ward
Wilbarger
Hamilton
Stephens
Lavaca
Bosque
Goliad
Roberts
Callahan
RainsMorris
Lampasas
Upshur
Wheeler
SanPatricio
Moore
Webb
Blanco
Newton
Hockley
Panola
Anderson
Cameron
Montgomery
LlanoMason
Taylor
Hartley
Jim Wells
Zapata
Travis
Howard
0 - 10,000
10,001 - 45,000
45,001 - 125,000
125,001 - 250,000
250,001 - 399,704

35
Education in Texas

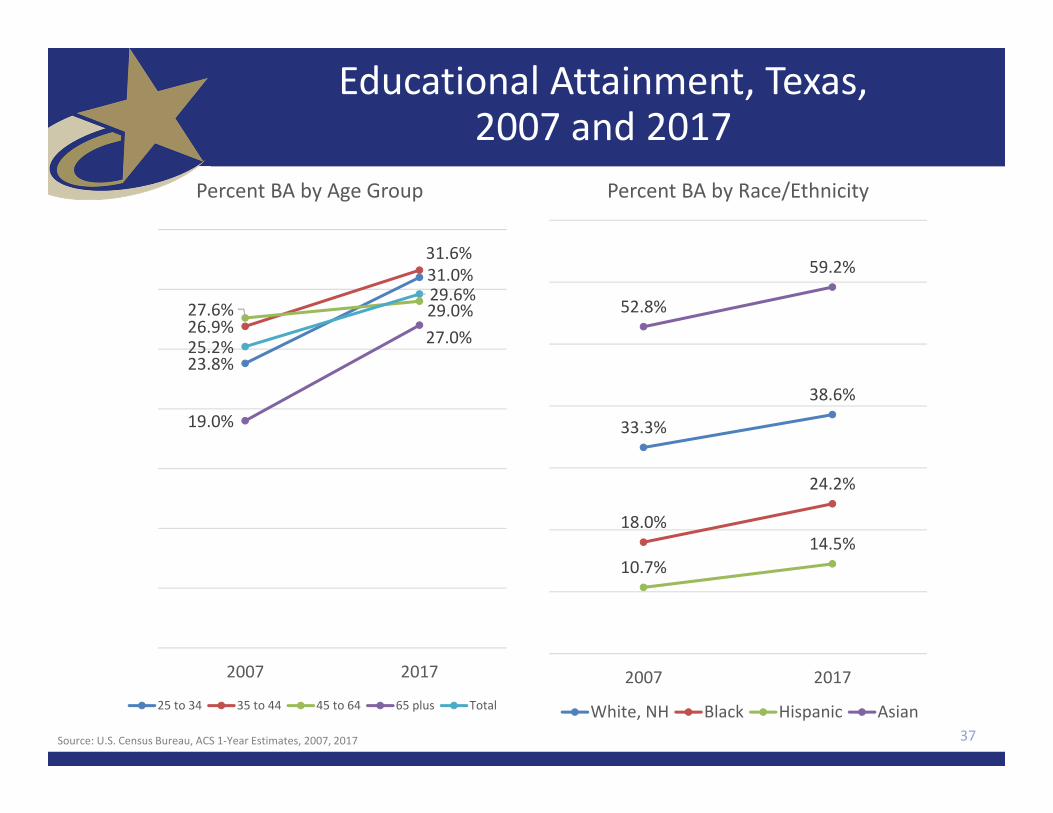
Percent Distribution of Educational Attainment of Persons Aged 25 Years and Older, Texas, 2007 and 2017
36Source: U.S. Census Bureau, American Community Survey, 1‐Year Samples, 2007‐2017. * Years significantly different p<.05
2007 2017Percent high school graduate or higher 79.1% 83.6% *
Percent bachelor's degree or higher 25.2% 29.6% *
15.5%
12.0%
30.1%
27.1%26.9%
28.9%
17.4%
19.7%
10.1%
12.3%
2007 2017
Less than High School
High School orEquivalent
Some College orAssociate's Degree
Bachelor's Degree
Graduate or ProfessionalDegree
Educational Attainment, Texas, 2007 and 2017
37
23.8%
31.0%
26.9%
31.6%
27.6% 29.0%
19.0%
27.0%25.2%
29.6%
2007 2017
Percent BA by Age Group
25 to 34 35 to 44 45 to 64 65 plus Total
33.3%
38.6%
18.0%
24.2%
10.7%14.5%
52.8%
59.2%
2007 2017
Percent BA by Race/Ethnicity
White, NH Black Hispanic AsianSource: U.S. Census Bureau, ACS 1‐Year Estimates, 2007, 2017
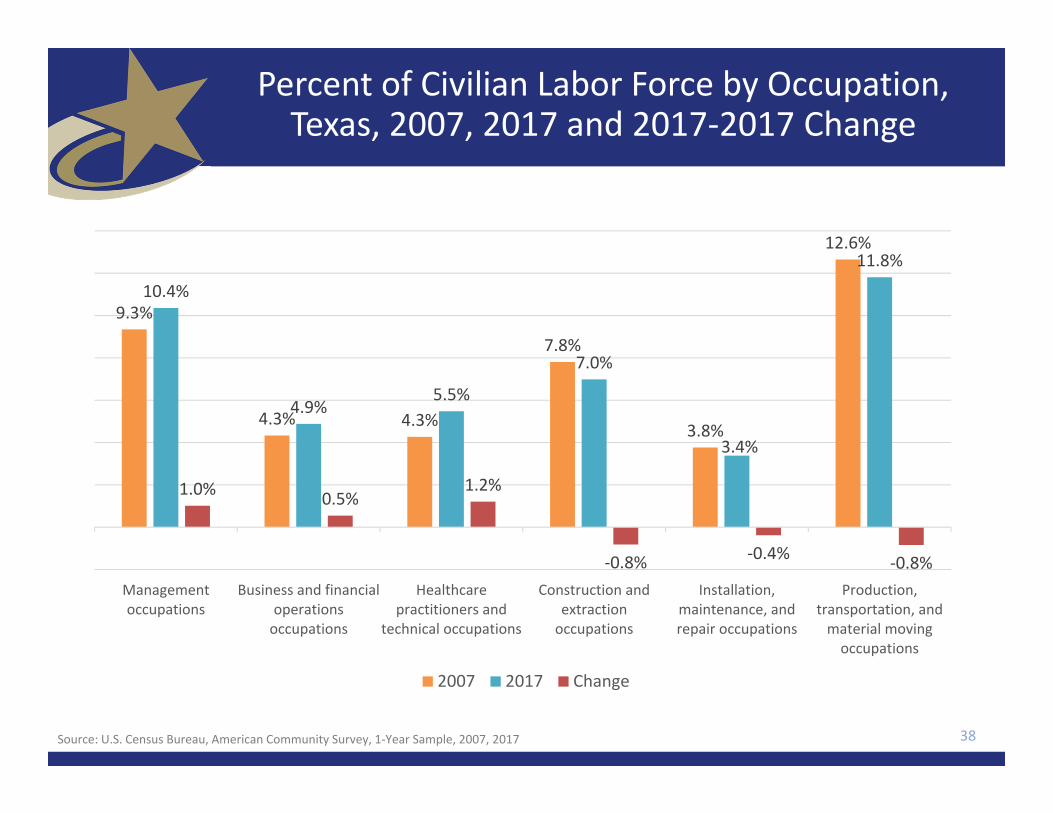
Percent of Civilian Labor Force by Occupation, Texas, 2007, 2017 and 2017‐2017 Change
38Source: U.S. Census Bureau, American Community Survey, 1‐Year Sample, 2007, 2017
9.3%
4.3% 4.3%
7.8%
3.8%
12.6%
10.4%
4.9%5.5%
7.0%
3.4%
11.8%
1.0% 0.5%1.2%
‐0.8% ‐0.4% ‐0.8%Managementoccupations
Business and financialoperationsoccupations
Healthcarepractitioners and
technical occupations
Construction andextractionoccupations
Installation,maintenance, andrepair occupations
Production,transportation, andmaterial movingoccupations
2007 2017 Change
Population Projections
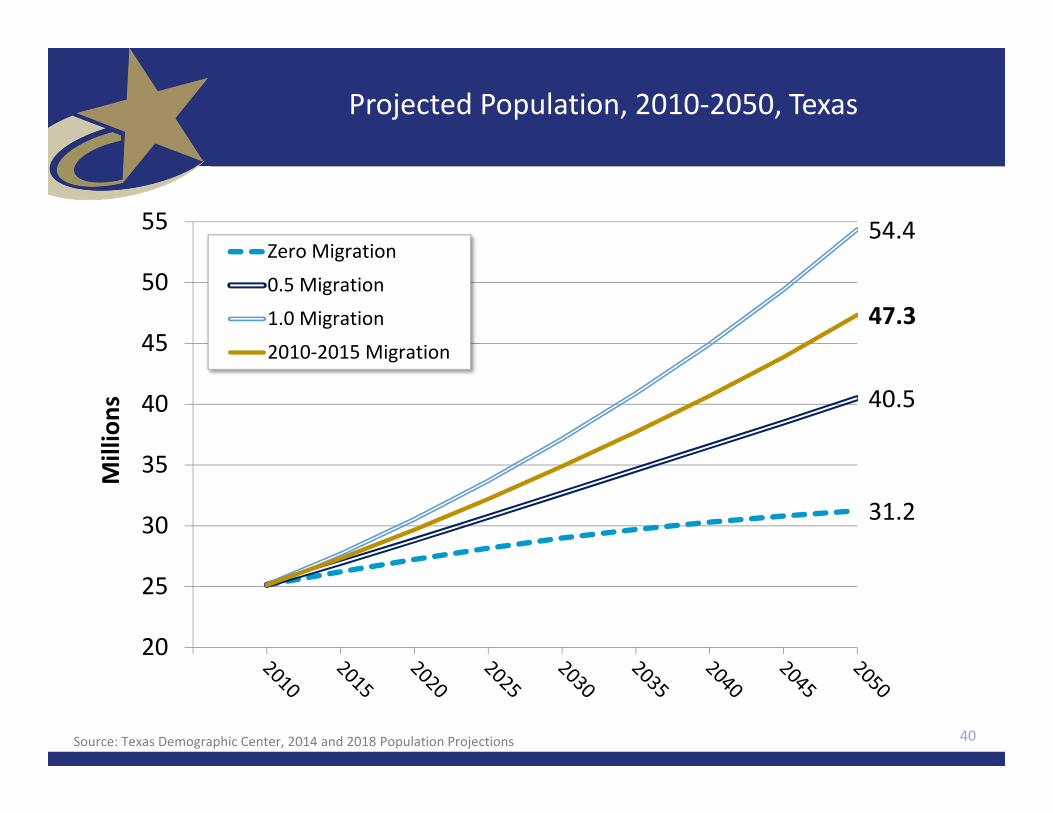
Projected Population, 2010‐2050, Texas
40
31.2
40.5
54.4
47.3
20
25
30
35
40
45
50
55
Millions
Zero Migration
0.5 Migration
1.0 Migration
2010‐2015 Migration
Source: Texas Demographic Center, 2014 and 2018 Population Projections
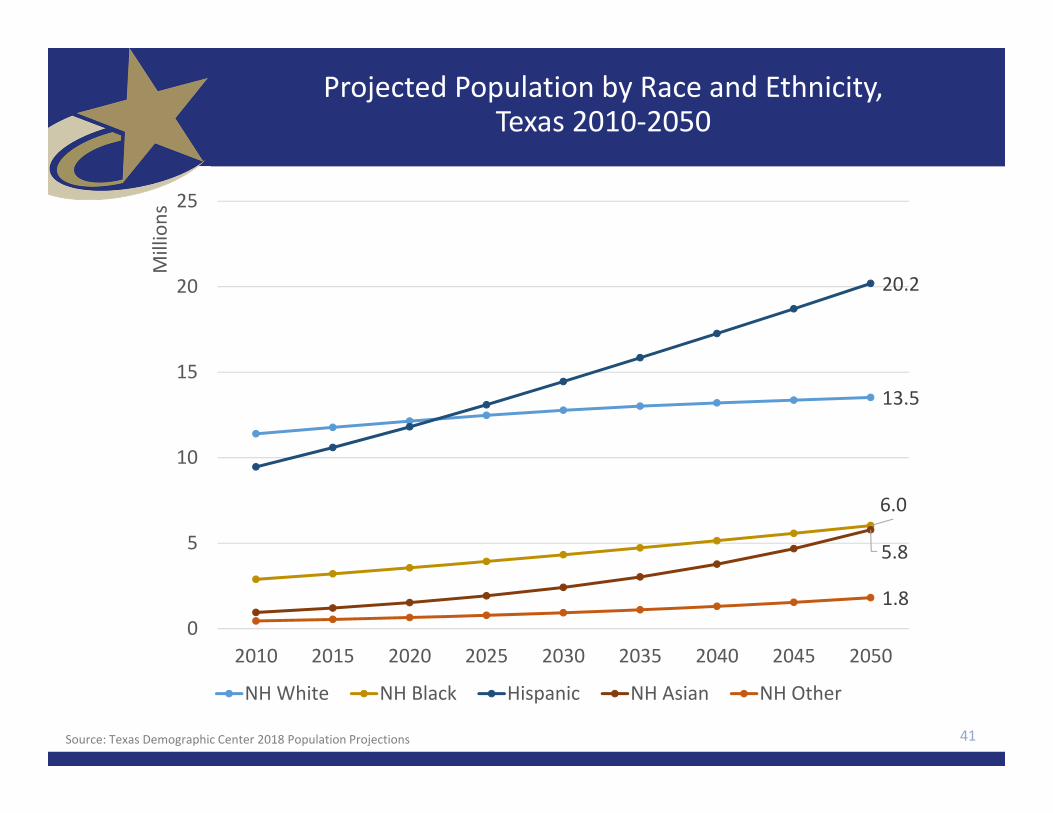
Projected Population by Race and Ethnicity, Texas 2010‐2050
41Source: Texas Demographic Center 2018 Population Projections
13.5
6.0
20.2
5.8
1.80
5
10
15
20
25
2010 2015 2020 2025 2030 2035 2040 2045 2050
Millions
NH White NH Black Hispanic NH Asian NH Other

Population Projections, Rio Grande Valley Counties, 2010‐2050
42Source: Texas Demographic Center, 2018 Population Projections
406,220 438,124 413,004
774,769
956,0001,032,453
60,968 66,246 62,849
22,134 19,2260
200,000
400,000
600,000
800,000
1,000,000
1,200,000
2010 2015 2020 2025 2030 2035 2040 2045 2050
Cameron Hidalgo Starr Willacy
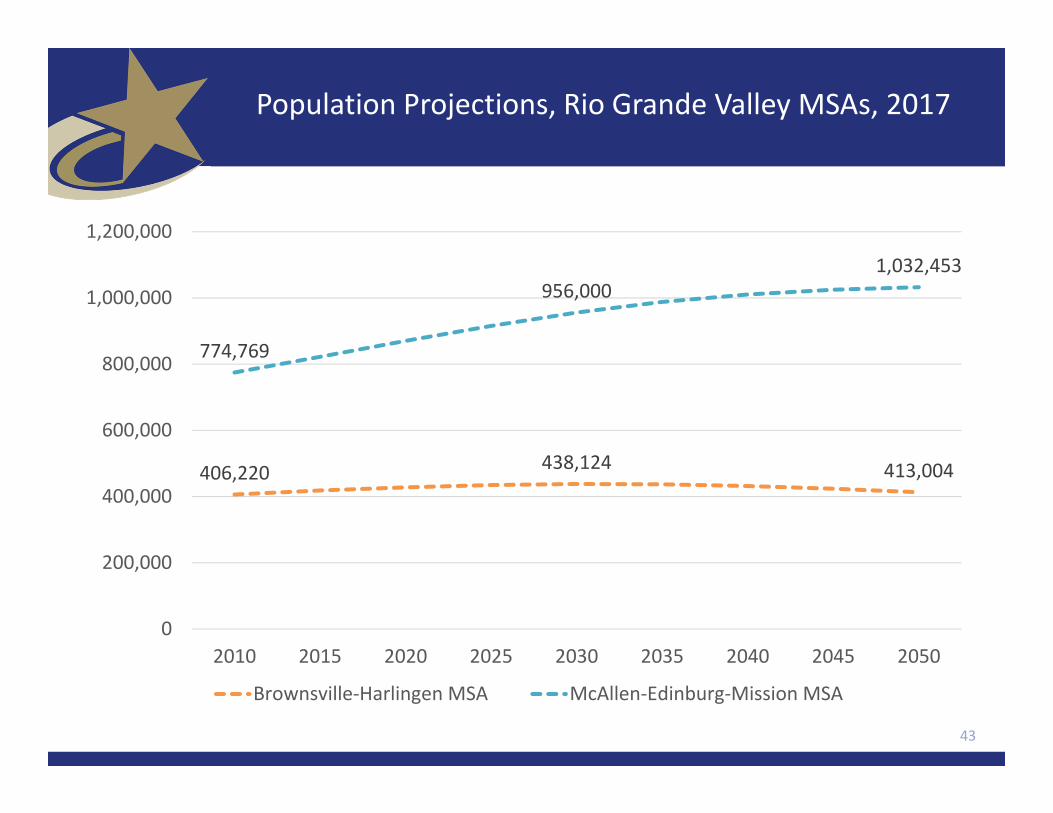
Population Projections, Rio Grande Valley MSAs, 2017
43
406,220 438,124 413,004
774,769
956,0001,032,453
0
200,000
400,000
600,000
800,000
1,000,000
1,200,000
2010 2015 2020 2025 2030 2035 2040 2045 2050
Brownsville‐Harlingen MSA McAllen‐Edinburg‐Mission MSA


47
48