Embed Size (px)
Citation preview
1
Democratic Republic of Congo (DRC) m-Kengela no 7: October 2016
Food price monitoring bulletin
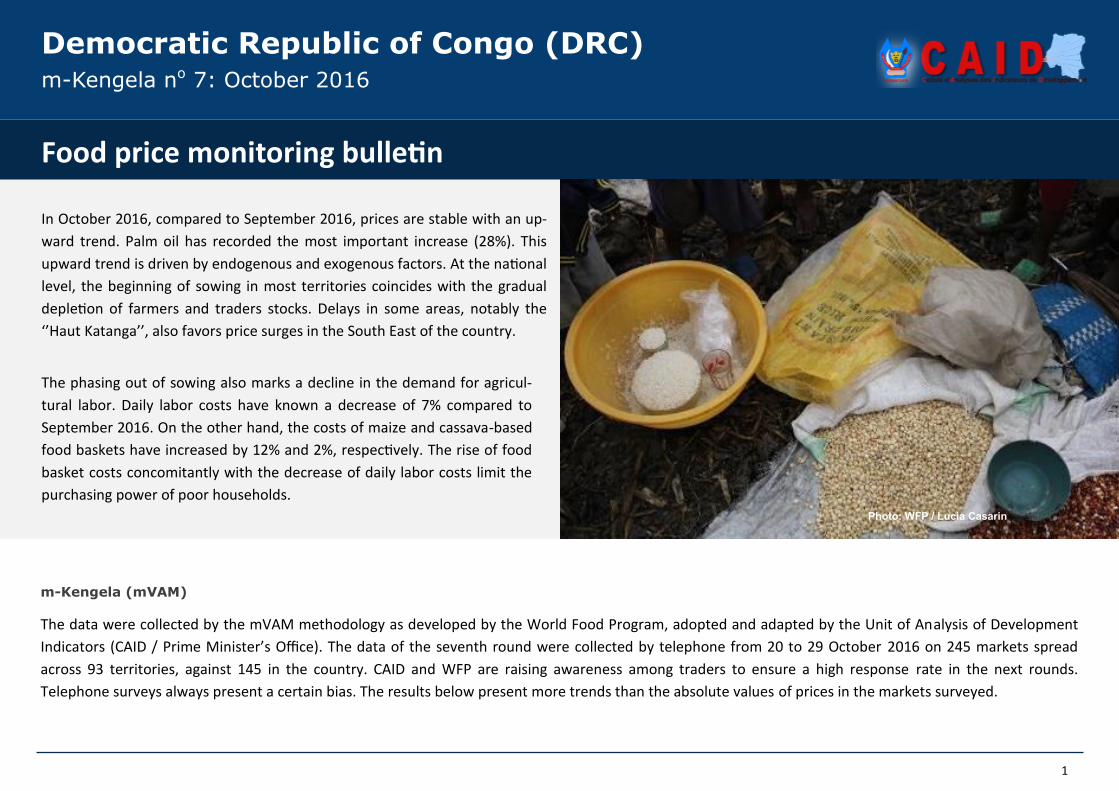
In October 2016, compared to September 2016, prices are stable with an up-
ward trend. Palm oil has recorded the most important increase (28%). This
upward trend is driven by endogenous and exogenous factors. At the national
level, the beginning of sowing in most territories coincides with the gradual
depletion of farmers and traders stocks. Delays in some areas, notably the
‘’Haut Katanga’’, also favors price surges in the South East of the country.
Photo: WFP / Lucia Casarin
The data were collected by the mVAM methodology as developed by the World Food Program, adopted and adapted by the Unit of Analysis of Development
Indicators (CAID / Prime Minister’s Office). The data of the seventh round were collected by telephone from 20 to 29 October 2016 on 245 markets spread
across 93 territories, against 145 in the country. CAID and WFP are raising awareness among traders to ensure a high response rate in the next rounds.
Telephone surveys always present a certain bias. The results below present more trends than the absolute values of prices in the markets surveyed.
m-Kengela (mVAM)
The phasing out of sowing also marks a decline in the demand for agricul-
tural labor. Daily labor costs have known a decrease of 7% compared to
September 2016. On the other hand, the costs of maize and cassava-based
food baskets have increased by 12% and 2%, respectively. The rise of food
basket costs concomitantly with the decrease of daily labor costs limit the
purchasing power of poor households.

2
m-Kengela no 7 : October 2016
Source: m-Kengela, CAID/PAM
Maize flour and cassava flour
WFP/Photographer
On October 31, the average price per kilo of maize flour is 947 CDF. It is 13% higher
than in September 2016. The territories of Aru (2,951 CDF), Mahagi (2,941 CDF) and
Kasangulu (2,353 CDF) have the highest prices. While the lowest prices are recorded in
Isangi (250 CDF), Lusambo (353 C) and Moba (355 CDF). Also in the center of the
country (Sankuru provinces, Central Kasaï and Lomami) prices are relatively low,
oscillating between 250 and 740 CDF.
The average price per kilo of cassava flour is 567 CDF, that is, a decrease of 7%
compared to September 2016. The territories of Lubefu (142 CDF), Lusambo (150 FC)
and Sandoa (192 CDF) have recorded the lowest prices. Whereas the highest prices are
observed in Mahagi (2250 CDF), Beni (1.500 CDF) and Nyirangongo (1.301CDF). In most
territories of the center, the south and the west of the country the prices of cassava
flour vary between 142 and 550 CDF. Mahagi is the territory that has recorded the
highest prices per kilo of maize and cassava flour. While Lusambo is the territory where
the prices of cassava and maize flour are the lowest.
The average price per kilo of local rice is 896 CDF, a decrease of 13% compared to
September. The highest prices have been noted in Kaniama (2,500 CDF), Boende
(2,140 CDF) and Lukolela (1,946 CDF). While the territories of Oshwe, Moba, Pangi,
Kasongo and Kalemie (389 CDF) have the lowest prices.
At the end of October 2016, the average price per kilo of imported rice is 1,490 CDF,
i.e., an increase of 6% compared to September 2016. The highest prices are observed
in Luiza (4.195 CDF), Mahagi (4,000 CDF) and Lukolela (3,600 CDF). The territories of
Mutshatsha (125 CDF), Kalemie and Dibemlenge (600 CDF) have recorded the lowest
prices.
In general, the majority of the territories of the south-east of the country have
recorded the lowest prices of imported rice, prices which vary between 125 and
1,500 CDF.
Lukolela is the area where the prices of local rice and imported rice are the highest.
DRC
Local rice and imported rice
Figure 1: average price of cassava flour
(Congolese Franc)
Source: m-Kengela,CAID/PAM
Figure 2: Average price of maize flour
(Congolese Franc)
Figure 3: Local rice price (Congolese
Franc)
Source: m-Kengela,CAID/PAM
Figure 4: Imported rice price (Congolese
Franc)
Source: m-Kengela,CAID/PAM
3
WFP/Photographer
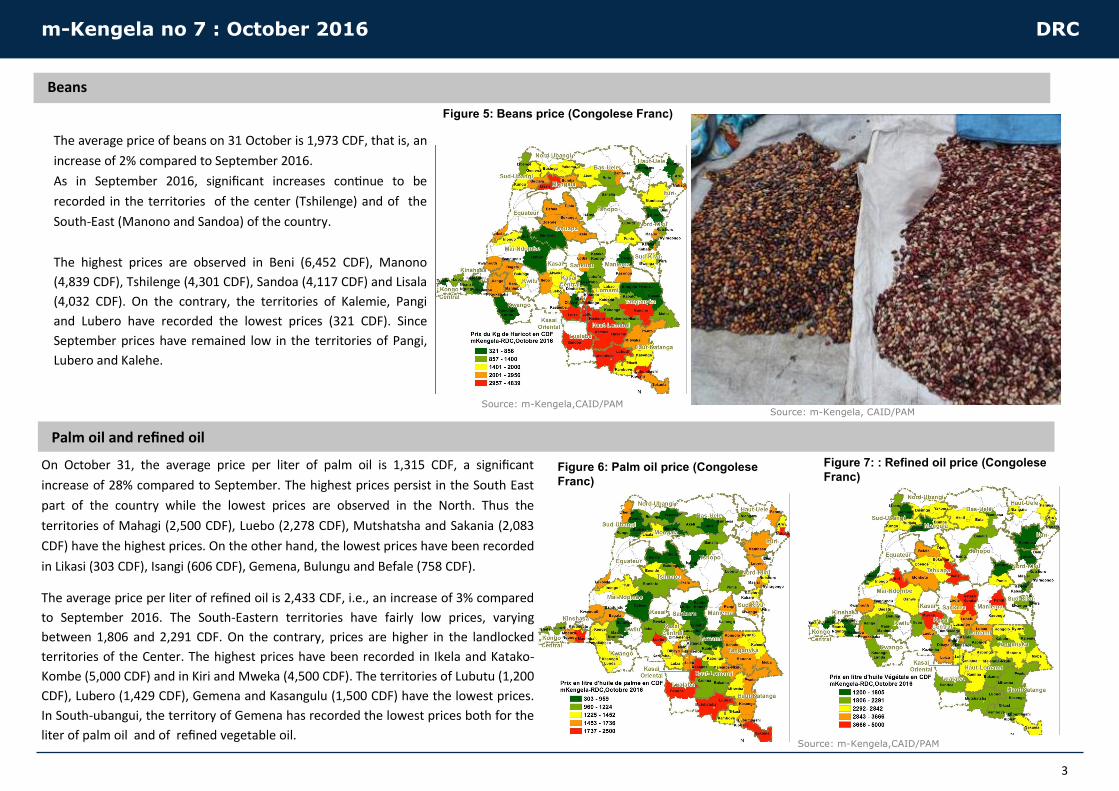
The average price of beans on 31 October is 1,973 CDF, that is, an
increase of 2% compared to September 2016.
As in September 2016, significant increases continue to be
recorded in the territories of the center (Tshilenge) and of the
South-East (Manono and Sandoa) of the country.
The highest prices are observed in Beni (6,452 CDF), Manono
(4,839 CDF), Tshilenge (4,301 CDF), Sandoa (4,117 CDF) and Lisala
(4,032 CDF). On the contrary, the territories of Kalemie, Pangi
and Lubero have recorded the lowest prices (321 CDF). Since
September prices have remained low in the territories of Pangi,
Lubero and Kalehe.
On October 31, the average price per liter of palm oil is 1,315 CDF, a significant
increase of 28% compared to September. The highest prices persist in the South East
part of the country while the lowest prices are observed in the North. Thus the
territories of Mahagi (2,500 CDF), Luebo (2,278 CDF), Mutshatsha and Sakania (2,083
CDF) have the highest prices. On the other hand, the lowest prices have been recorded
in Likasi (303 CDF), Isangi (606 CDF), Gemena, Bulungu and Befale (758 CDF).
The average price per liter of refined oil is 2,433 CDF, i.e., an increase of 3% compared
to September 2016. The South-Eastern territories have fairly low prices, varying
between 1,806 and 2,291 CDF. On the contrary, prices are higher in the landlocked
territories of the Center. The highest prices have been recorded in Ikela and Katako-
Kombe (5,000 CDF) and in Kiri and Mweka (4,500 CDF). The territories of Lubutu (1,200
CDF), Lubero (1,429 CDF), Gemena and Kasangulu (1,500 CDF) have the lowest prices.
In South-ubangui, the territory of Gemena has recorded the lowest prices both for the
liter of palm oil and of refined vegetable oil.
Source: m-Kengela, CAID/PAM Source: m-Kengela,CAID/PAM
Palm oil and refined oil
Beans
m-Kengela no 7 : October 2016 DRC
Figure 5: Beans price (Congolese Franc)
Figure 6: Palm oil price (Congolese
Franc)
Figure 7: : Refined oil price (Congolese
Franc)
Source: m-Kengela,CAID/PAM
4
Source: m-Kengela. CAID/PAM
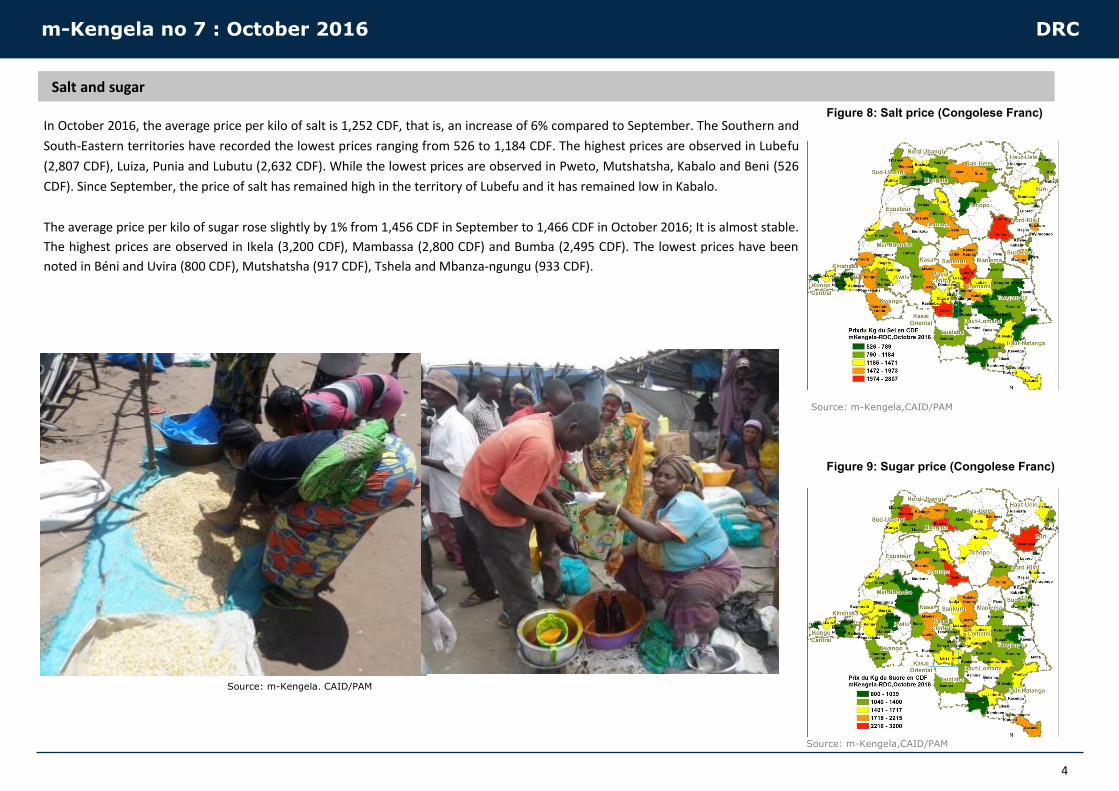
In October 2016, the average price per kilo of salt is 1,252 CDF, that is, an increase of 6% compared to September. The Southern and
South-Eastern territories have recorded the lowest prices ranging from 526 to 1,184 CDF. The highest prices are observed in Lubefu
(2,807 CDF), Luiza, Punia and Lubutu (2,632 CDF). While the lowest prices are observed in Pweto, Mutshatsha, Kabalo and Beni (526
CDF). Since September, the price of salt has remained high in the territory of Lubefu and it has remained low in Kabalo.
The average price per kilo of sugar rose slightly by 1% from 1,456 CDF in September to 1,466 CDF in October 2016; It is almost stable.
The highest prices are observed in Ikela (3,200 CDF), Mambassa (2,800 CDF) and Bumba (2,495 CDF). The lowest prices have been
noted in Béni and Uvira (800 CDF), Mutshatsha (917 CDF), Tshela and Mbanza-ngungu (933 CDF).
Source: m-Kengela,CAID/PAM
Salt and sugar
m-Kengela no 7 : October 2016 DRC
Figure 8: Salt price (Congolese Franc)
Figure 9: Sugar price (Congolese Franc)
Source: m-Kengela,CAID/PAM
5
Wage of casual labor
The average wage of casual labor has decreased by 7% going from 2,508 CDF in September to 2,330 CDF in October 2016. The work day is better paid in Kasangulu (5,500 CDF), Beni and Gemena
(5,000 CDF). On the other hand it is very low in Pangi, Katanda and Yakoma (1,000 CDF). Despite this, in 71% of the territories (i.e., 66 out of 93 territories) where the work day is paid over CDF
1,951, agricultural workers can purchase a cassava based food basket.
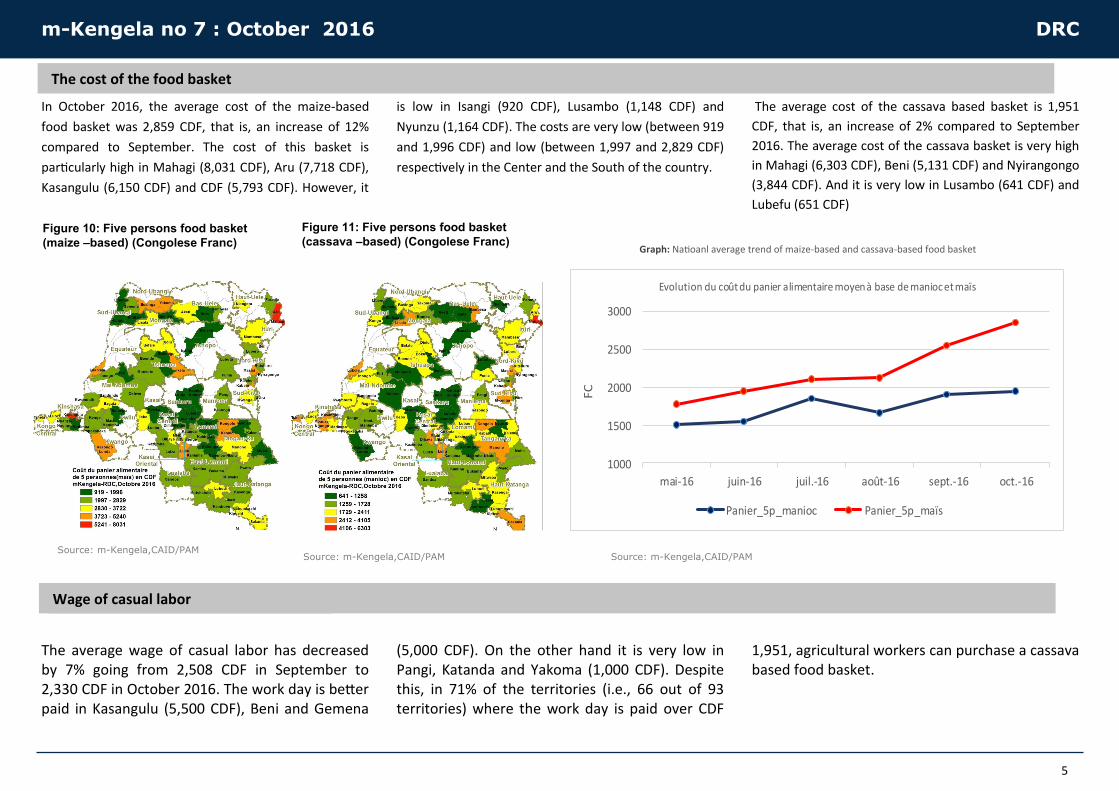
Graph: Natioanl average trend of maize-based and cassava-based food basket
In October 2016, the average cost of the maize-based
food basket was 2,859 CDF, that is, an increase of 12%
compared to September. The cost of this basket is
particularly high in Mahagi (8,031 CDF), Aru (7,718 CDF),
Kasangulu (6,150 CDF) and CDF (5,793 CDF). However, it
is low in Isangi (920 CDF), Lusambo (1,148 CDF) and
Nyunzu (1,164 CDF). The costs are very low (between 919
and 1,996 CDF) and low (between 1,997 and 2,829 CDF)
respectively in the Center and the South of the country.
The average cost of the cassava based basket is 1,951
CDF, that is, an increase of 2% compared to September
2016. The average cost of the cassava basket is very high
in Mahagi (6,303 CDF), Beni (5,131 CDF) and Nyirangongo
(3,844 CDF). And it is very low in Lusambo (641 CDF) and
Lubefu (651 CDF)
Source: m-Kengela,CAID/PAM
The cost of the food basket
m-Kengela no 7 : October 2016 DRC
Figure 10: Five persons food basket
(maize –based) (Congolese Franc)
Figure 11: Five persons food basket
(cassava –based) (Congolese Franc)
Source: m-Kengela,CAID/PAM Source: m-Kengela,CAID/PAM
1000
1500
2000
2500
3000
mai-16 juin-16 juil.-16 août-16 sept.-16 oct.-16
FC
Evolution du coût du panier alimentaire moyen à base de manioc et maïs
Panier_5p_manioc Panier_5p_maïs
6
The exchange rate
WFP/Photographer
The purchasing power
m-Kengela no 7 : October 2016 DRC
Figure 12: Purchasing power for maize-
based food basket
Figure 13: Purchasing power for cassava-based food
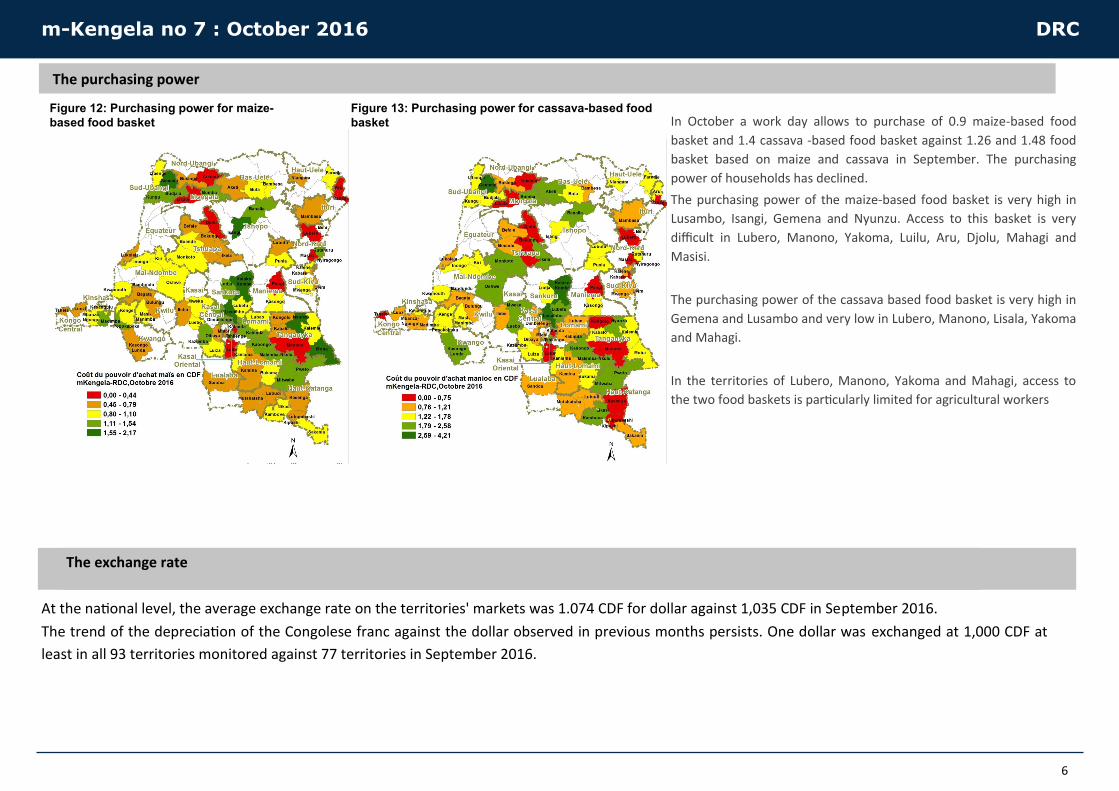
basket In October a work day allows to purchase of 0.9 maize-based food
basket and 1.4 cassava -based food basket against 1.26 and 1.48 food
basket based on maize and cassava in September. The purchasing
power of households has declined.
The purchasing power of the maize-based food basket is very high in
Lusambo, Isangi, Gemena and Nyunzu. Access to this basket is very
difficult in Lubero, Manono, Yakoma, Luilu, Aru, Djolu, Mahagi and
Masisi.
The purchasing power of the cassava based food basket is very high in
Gemena and Lusambo and very low in Lubero, Manono, Lisala, Yakoma
and Mahagi.
In the territories of Lubero, Manono, Yakoma and Mahagi, access to
the two food baskets is particularly limited for agricultural workers
At the national level, the average exchange rate on the territories' markets was 1.074 CDF for dollar against 1,035 CDF in September 2016.
The trend of the depreciation of the Congolese franc against the dollar observed in previous months persists. One dollar was exchanged at 1,000 CDF at
least in all 93 territories monitored against 77 territories in September 2016.
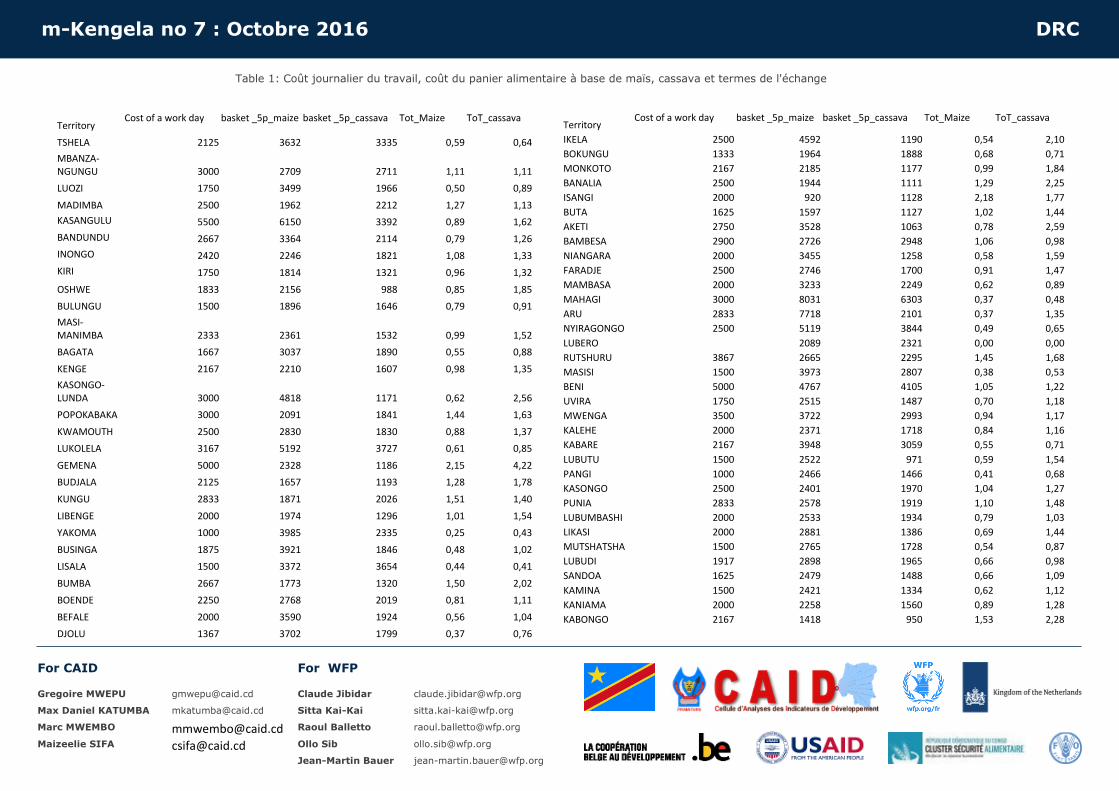
Table 1: Coût journalier du travail, coût du panier alimentaire à base de maïs, cassava et termes de l'échange
m-Kengela no 7 : Octobre 2016 DRC
For CAID For WFP
Gregoire MWEPU [email protected] Claude Jibidar [email protected]
Max Daniel KATUMBA [email protected] Sitta Kai-Kai [email protected]
Marc MWEMBO
[email protected] Raoul Balletto [email protected]
Maizeelie SIFA [email protected] Ollo Sib [email protected]
Jean-Martin Bauer [email protected]
Territory Cost of a work day basket _5p_maize basket _5p_cassava Tot_Maize ToT_cassava
TSHELA 2125 3632 3335 0,59 0,64
MBANZA-NGUNGU 3000 2709 2711 1,11 1,11
LUOZI 1750 3499 1966 0,50 0,89
MADIMBA 2500 1962 2212 1,27 1,13
KASANGULU 5500 6150 3392 0,89 1,62
BANDUNDU 2667 3364 2114 0,79 1,26
INONGO 2420 2246 1821 1,08 1,33
KIRI 1750 1814 1321 0,96 1,32
OSHWE 1833 2156 988 0,85 1,85
BULUNGU 1500 1896 1646 0,79 0,91
MASI-MANIMBA 2333 2361 1532 0,99 1,52
BAGATA 1667 3037 1890 0,55 0,88
KENGE 2167 2210 1607 0,98 1,35
KASONGO-LUNDA 3000 4818 1171 0,62 2,56
POPOKABAKA 3000 2091 1841 1,44 1,63
KWAMOUTH 2500 2830 1830 0,88 1,37
LUKOLELA 3167 5192 3727 0,61 0,85
GEMENA 5000 2328 1186 2,15 4,22
BUDJALA 2125 1657 1193 1,28 1,78
KUNGU 2833 1871 2026 1,51 1,40
LIBENGE 2000 1974 1296 1,01 1,54
YAKOMA 1000 3985 2335 0,25 0,43
BUSINGA 1875 3921 1846 0,48 1,02
LISALA 1500 3372 3654 0,44 0,41
BUMBA 2667 1773 1320 1,50 2,02
BOENDE 2250 2768 2019 0,81 1,11
BEFALE 2000 3590 1924 0,56 1,04
DJOLU 1367 3702 1799 0,37 0,76
Territory Cost of a work day basket _5p_maize basket _5p_cassava Tot_Maize ToT_cassava
IKELA 2500 4592 1190 0,54 2,10
BOKUNGU 1333 1964 1888 0,68 0,71
MONKOTO 2167 2185 1177 0,99 1,84
BANALIA 2500 1944 1111 1,29 2,25
ISANGI 2000 920 1128 2,18 1,77
BUTA 1625 1597 1127 1,02 1,44
AKETI 2750 3528 1063 0,78 2,59
BAMBESA 2900 2726 2948 1,06 0,98
NIANGARA 2000 3455 1258 0,58 1,59
FARADJE 2500 2746 1700 0,91 1,47
MAMBASA 2000 3233 2249 0,62 0,89
MAHAGI 3000 8031 6303 0,37 0,48
ARU 2833 7718 2101 0,37 1,35
NYIRAGONGO 2500 5119 3844 0,49 0,65
LUBERO 2089 2321 0,00 0,00
RUTSHURU 3867 2665 2295 1,45 1,68
MASISI 1500 3973 2807 0,38 0,53
BENI 5000 4767 4105 1,05 1,22
UVIRA 1750 2515 1487 0,70 1,18
MWENGA 3500 3722 2993 0,94 1,17
KALEHE 2000 2371 1718 0,84 1,16
KABARE 2167 3948 3059 0,55 0,71
LUBUTU 1500 2522 971 0,59 1,54
PANGI 1000 2466 1466 0,41 0,68
KASONGO 2500 2401 1970 1,04 1,27
PUNIA 2833 2578 1919 1,10 1,48
LUBUMBASHI 2000 2533 1934 0,79 1,03
LIKASI 2000 2881 1386 0,69 1,44
MUTSHATSHA 1500 2765 1728 0,54 0,87
LUBUDI 1917 2898 1965 0,66 0,98
SANDOA 1625 2479 1488 0,66 1,09
KAMINA 1500 2421 1334 0,62 1,12
KANIAMA 2000 2258 1560 0,89 1,28
KABONGO 2167 1418 950 1,53 2,28