Embed Size (px)
Citation preview
DEMOCRACY AND ECONOMIC GROWTH: A SOCIAL LEVEL MEASUREMENT OF GROWTH
by Lina Valeria Garcia
A capstone project submitted to Johns Hopkins University in conformity with the requirements for the degree of Master of Science in Government Analytics
Baltimore, Maryland August, 2019
© 2019 Lina Valeria Garcia All Rights Reserved
ii
Abstract
There are contradictory findings in the literature about the effect democracy has
on economic growth. In the current literature, the research indicates that democracy
positively influences economic growth directly as it ensures property rights and improves
business environment through advanced technological innovation. Yet, there is
substantial research that states that there is no evidence that democracy has a
considerable effect on economic growth. This article examines individual/ country
specific indicators such as Human Rights Protection Score, Political Regime Score, Child
Mortality Rates, and Years of Schooling and the effects this has on economic growth,
measured by GDP per capita. This article utilizes a pooled time series cross sectional
analysis to analyze the said variables from 1985-2014 in 145 countries. The existing
literature analyzes hard indicators such as property rights and technological innovation to
measure economic growth. This article takes a different approach as it aims to research a
more social aspect of countries and how this effects GDP per capita. This study finds that
years of schooling is the most significant variable affecting GDP per capita.

iii
Table of Contents Abstract ............................................................................................................................... ii
Introduction ......................................................................................................................... 1
Literature Review & Theoretical Framework ..................................................................... 2
Data and Methods ............................................................................................................... 8
Results ............................................................................................................................... 11
Conclusion ........................................................................................................................ 16
References ......................................................................................................................... 19
Curriculum Vita ................................................................................................................ 21

1
Introduction
The current literature surrounding the effect democracy has on economic growth
has been of great debate. There have been several theories regarding how these two
variables influence each other. The research states that the effects of democracy on
growth is asymmetrical, thus it is of great value to add to the existing literature with the
end goal to help educate and guide new countries to be economically stable. The popular
belief is that democratic countries are more likely to experience economic growth as
financial markets are liberalized and ensures property rights and improves business
environment.1 This research aims to examine individualistic factors such as Human
Rights Protection Score, Political Regime Score, Child Mortality Rate, and Years of
Schooling on economic growth measured as GDP per capita. Previous research has used
business indicators such as physical capital, technological innovation, investments,
property rights, and other business indicators to measure growth. To address these softer
indicators and how they impact growth, the dataset consists of 145 countries from 1985
to 2014 with the variables mentioned across these years. The results were gathered using
a pooled time series cross-section analysis to measure these variables over time. The
results do not support the notion that democracy aids economic growth. Democracy in
this study is coded as Political Regime Score, this variable ranges -10 (autocracy) to +10
(full democracy). This study shows that Years of Schooling is the most significant
variable, followed by Human Rights Protection Score, Child Mortality Rate, and Political
Regime Score. This study finds Schooling to be the most significant indicator of
1. Muhammad Ishtiaq, Muhammad Tariq Majeed, and Muhammad Sohail, Financial Sector, Democracy and Economic Growth: A Panel Data Analysis, (Pakistan Development Review, 2016), 449.

2
economic growth as a one-year increase in schooling is associated with a $3,914 increase
in GDP per capita. While other factors, such as human rights and child mortality rates,
play a part in a nation’s GDP, it is of note that on average a one-point increase in Political
Regime Score, the variable used to measure democracy, is associated with a decrease of
$236 in a country’s GDP per capita. This result contradicts the notion that democracy has
a positive influence on economic growth. These findings are important as it can be of
great use to countries who are seeking independence or are newly independent countries,
that are striving for economic growth to have information regarding kinds of regimes
should be in place for the country to succeed financially. From these results, we can
gather that perhaps public education or making education affordable and accessible will
improve the country’s total economic output, thus making the country more prosperous.
Literature Review & Theoretical Framework
Democracy indirectly impacts economic growth
The article, Financial Sector, Democracy and Economic Growth: A Panel Data Analysis, infers
that democracy influences economic growth indirectly through channels of human capital,
physical capital, lack of corruption, technological innovations, investment, education,
governance, and state strength.2 The authors indicated that critics of democracy argue that
democratic governments remain under huge pressure from the public to increase current
consumption. However, democracy protects property rights and hence increases economic
growth. Democracies are more adaptive to technological innovations because of high education
and human capital.3 The interaction of the financial sector and democracy insert a negative
2. Muhammad Ishtiaq, Muhammad Tariq Majeed, and Muhammad Sohail, Financial Sector, Democracy and Economic Growth: A Panel Data Analysis, (Pakistan Development Review, 2016), 438.
3. Ibid., 438.
3
impact on democracy. It may be that it is not necessary that financial markets are liberalized
under democracy to gain maximum benefits in terms of growth.4 In conclusion, democracies
positively influence economic growth directly as it ensures property rights and improves business
environment through advanced technological innovation and improved human capital. However
its indirect impact through channels of money supply, market capitalism and credit availability to
private sector is negative.5
Authors Hristos Doucouliagos and Mehmet Ali Ulubaşoğlu challenge the research that
states there is an inconclusive relationship of the impact of democratic versus authoritarian
regimes on growth. The authors found that there is, on average, no evidence that democracy has a
detrimental effect on economic growth.6 Moreover, there is no accumulated evidence of
democracy being detrimental to economic growth. While the direct effect is found to be zero,
democracy has significant indirect effects on growth through various channels. Democracy has a
favorable impact on human capital formation, and on the level of economic freedom, inflation,
and political instability. Additionally, while there is no evidence of a democracy-growth effect for
all countries pooled together, there are clear regional effects.7 Overall, democracy’s net effect on
the economy does not seem to be detrimental.8
In another article titled The Political Economy of Growth the authors predicted the effect
of democracy is largely indirect through increased life expectancy in poor countries and increased
secondary education in poor countries.9 The authors find that democracy does not have a
statistically significant direct effect on growth. Instead, the effect of democracy is largely indirect
4. Ibid., 449. 5. Ibid., 449. 6. Ibid., 67.
7. Ibid., 78. 8. Ibid., 78. 9. Matthew A., Baum and David A. Lake, The Political Economy of Growth: Democracy and Human Capital, (American Journal of Political Science, 2003), 333.

4
through increased life expectancy in poor countries and increased secondary education in nonpoor
countries (countries with per capita GDP lesser than $2,500.)10 Among poorer countries,
democracy exerts a significant positive effect on life expectancy, thus on growth.11 However, in
nonpoor countries increases in democracy have no statistically significant effect on economic
growth, even indirectly. As predicted, life expectancy is likely to matter more to newly
enfranchised voters in developing than in developed countries.12 Where it is significant, the
indirect effect of democracy through life expectancy or secondary education is positive,
indicating that as countries become more democratic, growth increases.13
Most studies of democracy test its direct impact on economic growth and find no result.
Authors A. Cooper Drury, Jonathan Kreickhaus, and Michael Lusztig argue that the negative
effect of corruption is mediated by the political process in which corruption occurs and that
democracy will mitigate or reduce that negative effect.14 Using time-series cross-sectional data
for over 100 countries from 1982 – 1997, the authors conclude that corruption does not have a
significant effect on economic growth in democracies, while non-democracies suffer significant
economic harm from corruption.15 These results show that corruption has a negative effect in
authoritarian regimes but not democratic regimes.16
Author Jonathan Krieckhaus argues that the answer to whether political democracy
inhibits or facilitates economic growth depends on the regional political context within with
10. Ibid., 333. 11. Ibid., 343. 12. Ibid., 343. 13. Ibid., 344. 14. A. Cooper Drury, Jonathan Krieckhaus, and Michael Lusztig, Corruption, Democracy and Economic Growth, (International Political Science Review, 2006), 133.
15. Ibid., 122. 16 Ibid., 131.

5
democracy functions.17 However, democracy has had diametrically opposed effects in Latin
America and Asia in comparison to Africa. In Latin America and Asia, democracy has a
significant negative effect.18 However, in Africa evidence shows that democracy has a positive
effect on economic growth. The author concluded that democracy does have an influence in
Africa, but that the effect is weaker than in Latin America and Asia.19 Thus, regime type has an
influence on economic effects. Democracy can constrain growth in countries where societal
groups demand extensive redistribution or democracy can facilitate growth where there is a need
to evict corrupt public officials.20
In another study between democracy and economic growth, the author concludes that
countries starting with lower levels of per capita income have higher initial growth rates which
tend to slow down as income levels converge with those of richer countries.21 One possible
component of this is that countries adopt democratic forms of government during the
development process.22 However it is less clear how or why certain features of democratic
government might help of affect subsequent growth.23
Mancur Olson, author of Rise and Decline of Nations, predicts that the best growth
prospects should present where there is recent social upheaval but that long-term stability is
expected to follow.24 Olson’s concept of “institutional sclerosis” hypothesizes that special interest
groups will accumulate over time in stable societies and eventually reduce the economic
17. Jonathan Krieckhaus, Democracy and Economic Growth: How Regional Context Influences Regime
Effects, (British Journal of Political Science, 2006), 317.
18. Ibid., 339. 19. Ibid., 339. 20. Ibid., 339. 21. John F. Helliwell, Empirical Linkages between Democracy and Economic Growth, (British Journal of Political Science, 1994) 244.
22. Ibid., 244. 23. Ibid., 245. 24. Ibid., 21.
6
efficiency of the economy in which they operate.25 These effects are due to the formation of
special interest groups. If the interest groups or their means of influencing policy are destroyed,
growth prospects would be enhanced. Instability, such as revolutions, is expected to destroy the
influence of these groups and their avenues for controlling social resources.26 Constant instability,
however, will also open new avenues for rent seeking. Following a review of over 50 separate
works, reveal that this theory of is not universally supported as there has not been systematic bias
in favor of or opposition to this theory.27
Democracy produces higher economic growth
In another school of thought, economists consider technological change the central
determinant of long-term growth and if democracy spurs technological change it likely also
fosters prosperity in the long run.28 Additionally, technology diffusion is slowed down because
dictators manipulate civil liberties and promote policies that inhibit idea exchanges. Dictators are
unable separate politically dangerous from economic efficiency-enhancing information.29 The
effect of regime type on growth is likely contingent on factors such as the leaders' personal
characteristics of the regime’s core supporters. Nevertheless, results reported indicated that
democracies produce higher economic growth than autocracies.30
Post-socialist countries during the period 1990-2008 showed that political freedom did
not influence economic growth. However, the results suggest that economic growth was a cause
25. Jac C. Heckelman, The Rise and Decline of Nations after 25 Years, (Southern Economic Journal, 2007) 18.
26. Ibid., 20. 27. Ibid, 18. 28. Carl Knutsen, Why Democracies Outgrow Autocracies in the Long Run: Civil Liberties, Information Flows and Technological Change, (Kyklos, 2015), 358.
29. Ibid., 380. 30. Ibid., 380.

7
of political freedom.31 The results did not give any basis to conclude that political freedom was a
cause of economic growth in the period analyzed (1990-2008).32 Political freedom appeared to be
neutral for economic growth in transition countries. Transition countries refer to countries’
economies as they change from central planning to free markets. However, economic growth
could have influenced the level of political freedom.33 Economic freedom, which has an impact
on economic growth in developed countries, has the same impact in transition countries; on
average, for the whole period since the beginning of the transition, the introduction of
liberalization and a market economy has had a positive impact on the pace of economic growth.34
How long a country has been democratic matters
The effect of democracy on growth exhibits an asymmetrical pattern that is dependent on a
country’s accumulated stock of democracy.35 The study in Democracy and Growth: A
Perspective from Democratic Experience, shows that there is a democratic experience threshold
that limits the ability of developing countries to benefit from democratization. For countries
whose democratic experiences cannot exceed a threshold level, democracy has a limited effect in
terms of changing economic activity and its enforcement is neither harmful nor helpful in terms
of economic growth.36 Countries whose accumulated democratic experience has passed the
threshold level, the effect of the political regime on growth still has to depend on the current
status of the political regime.37 The authors indicate that if democracy really matters for growth,
then this effect is best evaluated from a country’s regime history (stock) rather than from the
31. Dawid Piatek, Katarzyna Szarzec, and Michal Pilc, Economic Freedom, Democracy and Economic Growth: A Causal Investigation in Transition Countries, (Post-Communist Economies, 2013), 283. 32. Ibid., 283.
33. Ibid., 283. 34. Ibid., 283. 35. Ma Tay-Cheng and Lishu Ouyang, Democracy and Growth: A Perspective from Democratic Experience, (Economic Inquiry, 2016), 1790. 36. Ibid., 1790.
37. Ibid., 1790.
8
current status of the level of democracy (flow)38.Only in democratic countries with prolonged
experiences of democratic rule can political democracy promote economic growth39.
Data and Methods
The results of this data set are from aa pooled time series cross-section analysis
(TSCS), this kind of pooled analysis combines time series for several cross-sections.
Pooled TSCS data consists of “repeated observations on fixed units.” Thus, the total
number of observations equals the number of cross sections (I) multiplied by the number
of time points (T).40 An Ordinary Least Squares (OLS) regression is not appropriate for
this type of data because time-series observations are clustered within countries, inducing
correlation among observations. This violates the assumption of independence of
observations, which is required for unbiased estimation of variances and standard errors
in OLS regression.41 The fixed-effects model was used instead of the random effects
model as the fixed effects Hausman test shows the fixed effects model to be a better fit.
This paper presents an analysis of the kind of effect that Human Rights Protection
Score, Political Regime Score, Child Mortality Rate, and Total Years of Schooling in
adults has on economic growth, measured in GDP per capita. The independent variable
GDP per capita is valuable in assessing economic growth as this measures the total
economic output of a country over a long period of time. This dataset includes 145
38. Ibid., 1792.
39. Ibid., 1790.
40. Lawrence Raffalovich and Chung Rakkoo, Models for Pooled Time-Series Cross Section Data, (International Journal of Conflict and Violence, 2014), 210.
41. Ibid., 210.
9
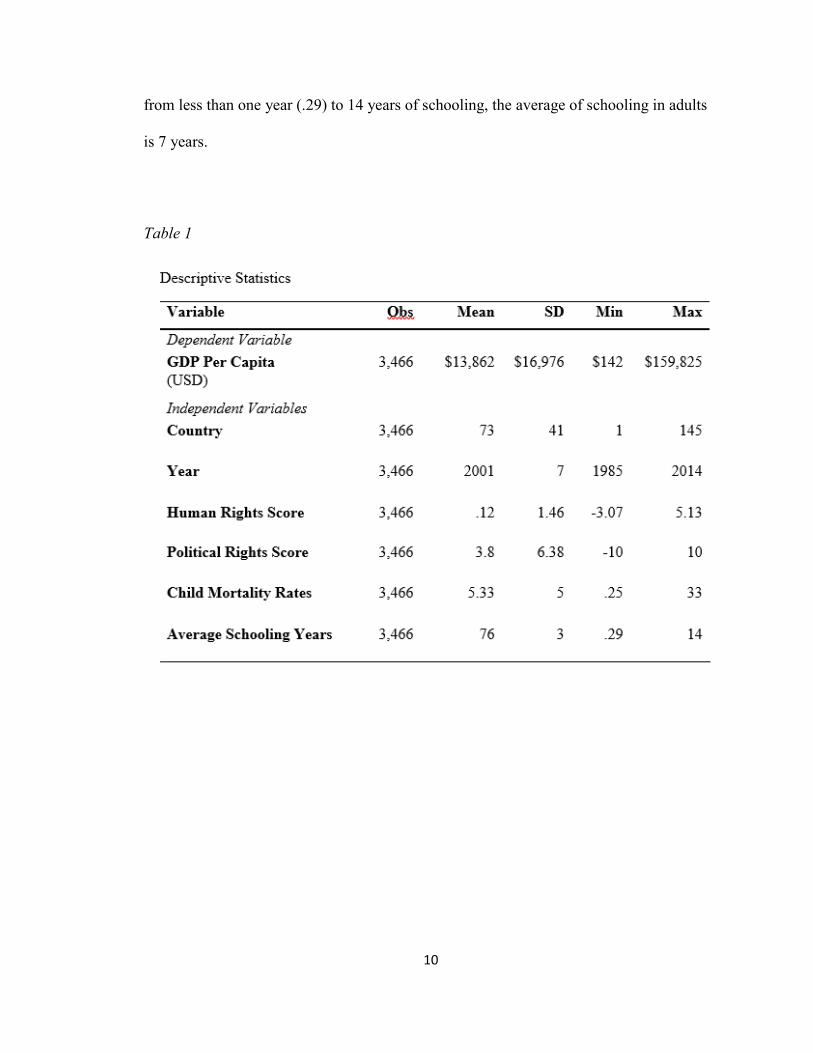
countries and 3,466 observations from 1985 to 2014 (Table 1). The variables in the
dataset were published in Our World in Data, an open access and open source website.
The dataset uses the Human Rights Protection Score, first developed by Schnakenberg
and Fariss in 2014 and updated in 2019. This variable varies from -3.07 to 5.13 (the
higher the better). The Human Rights Protection Score focuses on the protection of the
physical integrity of citizen. This accounts for torture, government killing, political
imprisonment, extrajudicial executions, mass killings and disappearances.42 The variable
political regime score measures democracy from -10 (autocracy) to +10 (democracy).
Thirdly, the variable Child Mortality Rate is the probability per 1,000 that a child will die
before reaching the age of 5. Lastly, the variable Years of Schooling is the average years
of total schooling across all education levels. The table below shows the summary
statistics of the variables. The GDP per capita ranges from $142 to $159,825 and the
average GDP per capita for the data set is $13,862. Similarly, the average Human Rights
Protection Score is .13, this variable ranges from -3.07 to 5.13. Countries whose Human
Rights Protection Score exceeds 0.5 is considered a democracy, therefore the average
countries in the dataset are democracies. Political regime score ranges -10 to 10, the
average political regime score is 3.8 indicating the average regime type of countries are
anocracies. The variable child mortality rate ranges from .25 to 33 and the average is
mortality rate is 5, indicating that on average there is a 5% probability per 1,000 that a
child will die before the age of 5. Lastly, the variable average years schooling which
measures the average total years of schooling for the adult population. This value ranges
42. Max Roser, “Democracy” University of Oxford Global Change Data Lab, 2019
10
from less than one year (.29) to 14 years of schooling, the average of schooling in adults
is 7 years.
Table 1
11
Results
Table 2
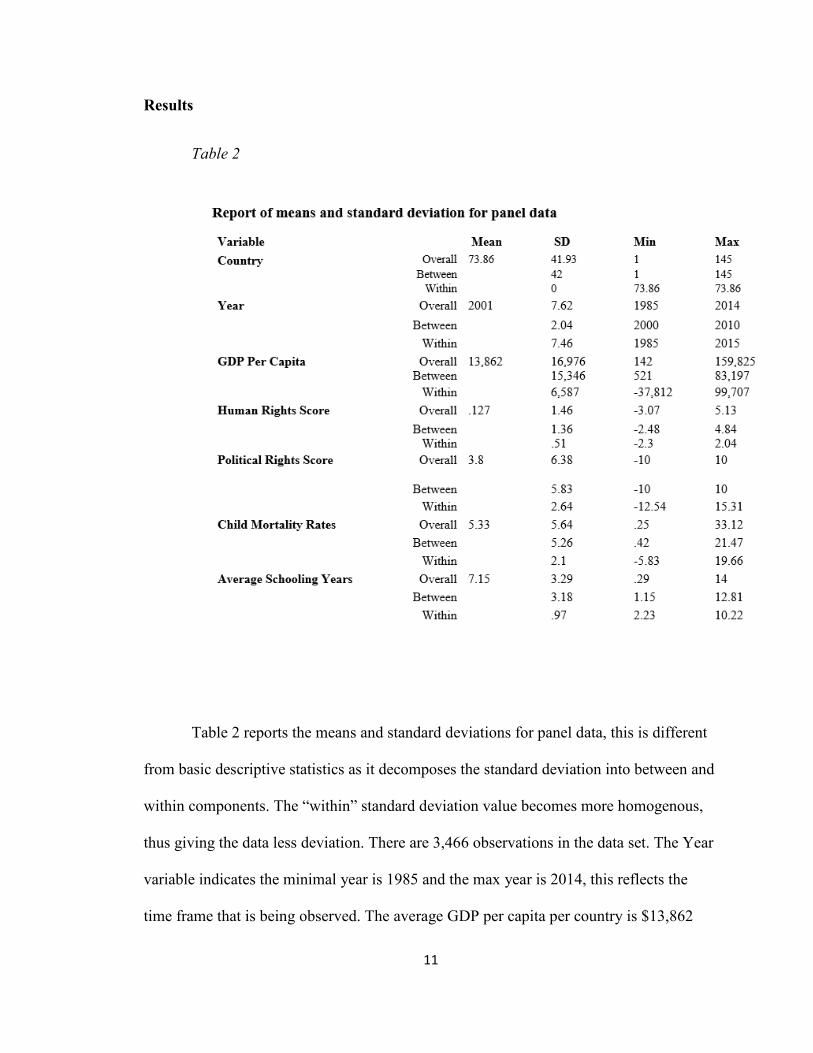
Table 2 reports the means and standard deviations for panel data, this is different
from basic descriptive statistics as it decomposes the standard deviation into between and
within components. The “within” standard deviation value becomes more homogenous,
thus giving the data less deviation. There are 3,466 observations in the data set. The Year
variable indicates the minimal year is 1985 and the max year is 2014, this reflects the
time frame that is being observed. The average GDP per capita per country is $13,862

12
and the standard deviation for all the cases is $16,976. In respect to GDP per capita
between countries, this values at $15,346. However, the standard deviation for GDP per
capita between countries is $15,346 compared to the standard deviation within countries
is $6,587.
Similarly, the Human Rights Protection Score ranges from -3.07 to 5.13 (the
higher the better). The summary of this data indicates the overall Human Rights
Protection Score standard deviation is 1.45, compared to the standard deviation between
countries that values at 1.36 and the standard deviation of Human Rights Protection Score
within countries that values at .51. What’s important to note is the minimum and
maximum between countries of this variable that ranges from -2.3 to 2.04, this range
suggests that as time has progressed countries have had higher levels of Human Rights
Protection Score.
As previously stated, Political Regime Score ranges from -10 (autocracy) to +10
(full democracy). The overall political regime score is 3.8 indicating the average regime
type of countries are anocracies. The overall standard deviation for Political Regime
Score is 6.38. Also, the standard deviation of Political Regime Score between countries is
5.83, within countries is 2.64. The standard deviation within countries, 2.64, tells us that
there isn’t a lot of variation of political regime change within countries.
Child Mortality Rate measures the probability per 1,000 that a newborn baby will
die before the age of 5. The mean of this variable indicates that the average mortality rate
is 5%. In comparison to the min .25% and the max, 33%, this average is toward the lower
13
end of the this range, indicating that on average there is a 5% probability per 1,000 that a
child will die before the age 5, or 50 out of 1000 children will die before the age of 5.
Lastly, the variable Average Years of Schooling measures the average total years
of schooling for the adult population. The minimum value is less than one year (.29
years) and the max is 14 years. The overall average of schooling in adults is 7 years, the
standard deviation in the overall dataset is 3 years. Comparatively, within countries the
standard deviation is .97, indicating there is not a large fluctuation in years of schooling
within countries.
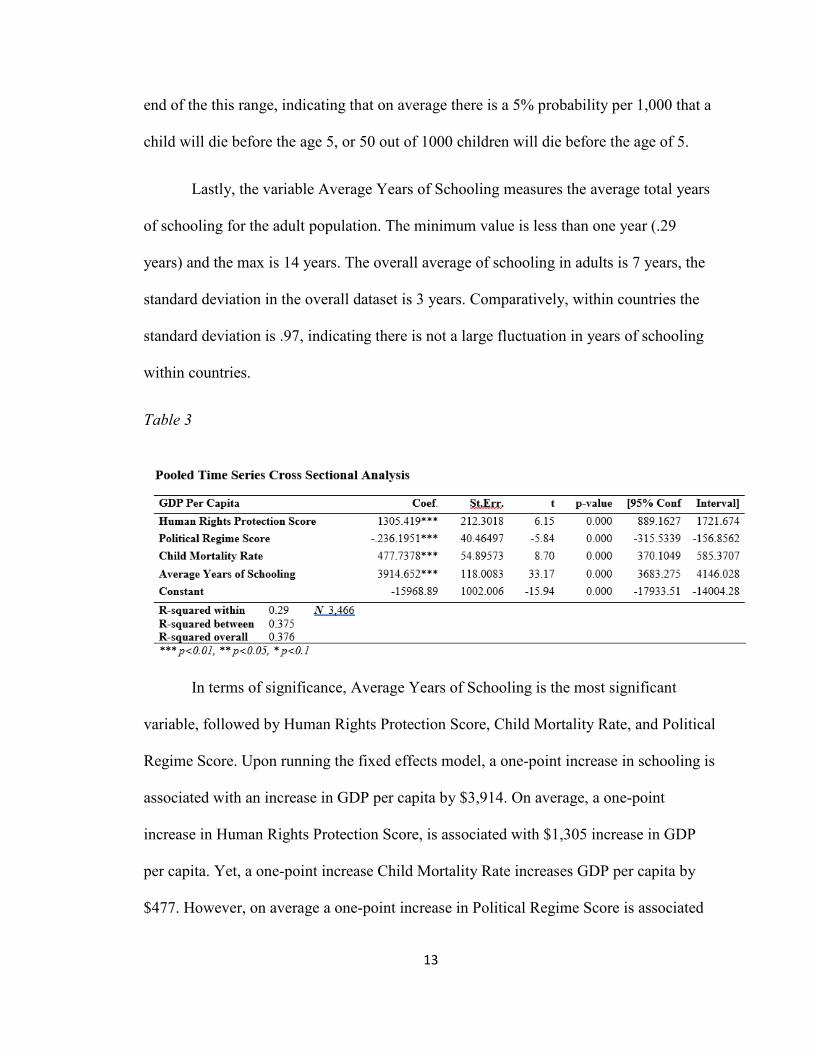
Table 3
In terms of significance, Average Years of Schooling is the most significant
variable, followed by Human Rights Protection Score, Child Mortality Rate, and Political
Regime Score. Upon running the fixed effects model, a one-point increase in schooling is
associated with an increase in GDP per capita by $3,914. On average, a one-point
increase in Human Rights Protection Score, is associated with $1,305 increase in GDP
per capita. Yet, a one-point increase Child Mortality Rate increases GDP per capita by
$477. However, on average a one-point increase in Political Regime Score is associated

14
with a decrease of $236 in a country’s GDP per capita. This study contradicts the
preconceived notion that democracy is positively associated with a higher GDP per
capita. The p-values less than 0.05 show that a significant difference does exist.
Additionally, Rho indicates the proportion of the variation that is being explained by the
country’s individual attributes. This model indicates that individual countries internal
consistency explains a large proportion of the variation, specifically 82%. R2 indicates
that the fixed effects model explains 29% of the variation within a given country over
time and 38% of the cross-sectional variation across countries within a time period and
38% of the pooled time series cross-sectional variation overall. This study finds that years
of schooling is much more significant in increasing GDP per capita than a countries
Political Regime Score. However, not only does political regime not have a positive
association with GDP per capita, rather a one-point increase in Political Regime Score
(the higher the score, the more democratic) this results in $236 less in GDP per capita.
Not only do the results of this study signify that democracy is not a large indicator
of a country’s economic growth, rather countries with democratic regimes are associated
with a $236 decrease in GDP per capita holding other variables constant. This finding
carries profound implications as there is a large consensus indicating democracy
improves economic growth as a result of liberalization and a free market system.
However, this is worth delving further into as the results of this study using social
variables indicate otherwise. The second significant indicator of increase in economic
growth was the human rights protections score. Countries that are less likely to execute,
regulate religion, or censor the press are positively associated with an increase in GDP
per capita. In 2014, the countries with the lowest levels of child mortality rates include

15
16
Chart 1 shows the top 10 richest countries in 2014; Qatar, Luxembourg,
Singapore, United Arab Emirates, Norway, Kuwait, Switzerland, United States, Ireland,
and Saudi Arabia. This chart also includes the political regime score and the average
years of schooling. According to this chart, of these top ten countries, Qatar, UAE,
Kuwait, and Saudi Arabia are oil producing countries whose political regime score ranks
autocratic. Chart 2 excludes these four oil producing countries and the chart indicates that
countries with the highest GDP per capita have high political regime scores, implying
democratic regimes, and higher average years of schooling. It is possible oil rich
countries can stay autocratic by “buying” off their citizens, therefore in future studies, it
would be meaningful to exclude such countries when measuring the effect democracy has
on economic growth.
Conclusion
This study aimed to research social indicators affecting citizens of the country by
measuring Human Rights Protection Score, Political Regime Score, Child Mortality Rate,
and Years of Schooling and the effects this has on economic growth, measured by GDP
per capita. This study finds schooling to be the most significant indicator of economic
growth as a one-year increase in schooling is associated with a $3,914 increase in GDP
per capita. A one-point increase in Human Rights Protection Score, is associated with
$1,305 increase in GDP per capita. Yet, a one-point increase Child Mortality Rate
increases GDP per capita by $477. However, on average a one-point increase in Political
Regime Score, the variable used to measure democracy, is associated with a decrease of
$236 in a country’s GDP per capita. This result contradicts the notion that democracy has

17
a positive influence on economic growth. The social indicators applied in the study
indicate that democracy decreases a country’s GDP per capita. These results contradict
the consensus that democracy is positively associated with economic growth. The
variables used in this study are central elements of society and are worth further
researching to educate and change the verbiage that is associated when promoting
democracy. Democratic countries may open the way for citizens to participate in
elections and voting for representatives but not necessarily to improve economic growth.
These findings are important because it can be of great use to countries who are seeking
independence or are newly independent countries that are striving for economic stability.
From these results, it can be gathered that public education or making education
affordable will improve the country’s total economic output, thus making the country
more prosperous. The second significant indicator of increase in economic growth was
the Human Rights Protection Score. Countries that are less likely to execute, regulation
religion, or censor the press are positively associated with an increase in GDP per capita.
In future studies, the research should include how many years a country has been
democratic as it is plausible that countries that have been democratic for over 100 years,
for example, have a higher GDP per capita than countries who have been democratic for
20 years. Additionally, there is much debate whether countries that have an abundance of
natural resources such as fossil fuels have more or less economic growth as a result of
these resources. This study merits further investigation into researching the indicators that
contribute to resource rich countries and what makes these country’s economies
overperform or underperform. A limitation this study faced was the dichotomy of
identifying regimes as autocracy or democratic, this limits the study from researching

18
other “in-between” regimes that can influence economic growth, such as oligarchies,
liberal democracies or closed autocracies. Additionally, this study found that democracy
is not positively associated with economic growth, as it decreases GDP per capita. Future
research on this topic should study the government’s ability and timeliness to develop
and pass policies designed to distribute economic wealth to its citizens and in return
improve their overall economic growth. This proposed research will further attempt to
explain the indicators that are associated with improving economic growth in countries.

19
References
Baum, Matthew A., and David A. Lake. "The Political Economy of Growth: Democracy and Human Capital." American Journal of Political Science 47, no. 2 (2003): 333-47. doi:10.2307/3186142.
Doucouliagos, Hristos, and Mehmet Ali Ulubaşoğlu. 2008. “Democracy and Economic Growth: A Meta-Analysis.” American Journal of Political Science (Wiley-Blackwell) 52 (1): 61–83. doi:10.1111/j.1540-5907.2007.00299.x.
Drury, A. Cooper, Jonathan Krieckhaus, and Michael Lusztig. "Corruption, Democracy, and Economic Growth." International Political Science Review / Revue Internationale De Science Politique 27, no. 2 (2006): 121-36. http://www.jstor.org/stable/20445044.
Heckelman, Jac C. "Explaining the Rain: "The Rise and Decline of Nations" after 25 Years." Southern Economic Journal 74, no. 1 (2007): 18-33. http://www.jstor.org/stable/20111950.
Helliwell, John F. "Empirical Linkages between Democracy and Economic Growth." British Journal of Political Science 24, no. 2 (1994): 225-48. http://www.jstor.org/stable/194169.
Krieckhaus, Jonathan. 2006. "Democracy and Economic Growth: How Regional Context Influences Regime Effects." British Journal of Political Science 36, no. 2: 317-40. http://www.jstor.org/stable/4092232.
Ishtiaq, Muhammad, Muhammad Tariq Majeed, and Muhammad Sohail. 2016. “Financial Sector, Democracy and Economic Growth: A Panel Data Analysis.” Pakistan Development Review 55 (4): 437–53. doi:http://pide.org.pk/.
Knutsen, Carl Henrik. 2015. “Why Democracies Outgrow Autocracies in the Long Run: Civil Liberties, Information Flows and Technological Change.” Kyklos 68 (3): 357–84. doi:http://onlinelibrary.wiley.com.proxy1.library.jhu.edu/journal/10.1111/%28ISSN%291467-6435/issues.
Ma, Tay‐Cheng and Lishu Ouyang. 2016. "Democracy and Growth: A Perspective from Democratic Experience." Economic Inquiry 54 (4): 1790-1804. doi:10.1111/ecin.12337. https://onlinelibrary.wiley.com/doi/abs/10.1111/ecin.12337.

20
Piatek, Dawid, Katarzyna Szarzec, and Michal Pilc. 2013. “Economic Freedom, Democracy and Economic Growth: A Causal Investigation in Transition Countries.” Post-Communist Economies 25 (3): 267–88. doi:http://www.tandfonline.com.proxy1.library.jhu.edu/loi/cpce20.
Raffalovich, Lawrence, and Chung Rakkoo. 2014. "Models for Pooled Time-Series Cross Section Data" International Journal of Conflict and Violence 8 (1) https://pdfs.semanticscholar.org/a3b0/56fac186bb4030951def1bf1fa99d9205ce2.pdf.
Roser, Max. 2019. "Democracy". Our World In Data. University of Oxford Global Change Data Lab https://ourworldindata.org/democracy.
21
Curriculum Vita Lina Garcia was born in Bogota, Colombia on May 31, 1995. Upon taking a
Research/Methods course as part of the curriculum for her Bachelors degree in
Government and International Politics, she was introduced to quantitative methods and
empirical methods via statistical techniques. This what drove Lina to pursue a Master’s
degree in Government Analytics. Upon graduating from Johns Hopkins University, Lina
is eager to take what she learned at the Advanced Academic Programs and aspires to
apply it in a Data Scientist position.