Embed Size (px)
Citation preview

Trinity College Trinity College
Trinity College Digital Repository Trinity College Digital Repository
Senior Theses and Projects Student Scholarship
Spring 2021
DEMOCRACY AND ECONOMIC DEVELOPMENT: A HISTORICAL DEMOCRACY AND ECONOMIC DEVELOPMENT: A HISTORICAL
PROCESS TRACING OF BOTSWANA AND ZIMBABWE FROM PROCESS TRACING OF BOTSWANA AND ZIMBABWE FROM
1981-2008 1981-2008
James Kaynor [email protected]
Follow this and additional works at: https://digitalrepository.trincoll.edu/theses
Part of the Comparative Politics Commons
Recommended Citation Recommended Citation Kaynor, James, "DEMOCRACY AND ECONOMIC DEVELOPMENT: A HISTORICAL PROCESS TRACING OF BOTSWANA AND ZIMBABWE FROM 1981-2008". Senior Theses, Trinity College, Hartford, CT 2021. Trinity College Digital Repository, https://digitalrepository.trincoll.edu/theses/871
1
DEMOCRACY AND ECONOMIC DEVELOPMENT: A HISTORICAL PROCESS TRACING
OF BOTSWANA AND ZIMBABWE FROM 1981-2008
A thesis presented
by
James Granville Kaynor
to
The Political Science Department
in partial fulfillment of the requirements
for Honors in Political Science
Trinity College
Hartford, CT
April 19, 2021
_______________________ Stefanie Chambers
Thesis Advisor Department Chair

2
Table of Contents
Introduction …………………………………………………………………… 3
Chapter 1: Review of the Literature…………………………………………..
Chapter 2: Research Design and Methodology………………………………. 18
Chapter 3: The Cases of Botswana and Zimbabwe………………………….. 24
Table 1.1 on page 35
Chapter 4: Analysis of the Data……………………………………………….. 39
Tables 1.1-2.5 on pages 39-51
Chapter 5: Conclusion………………………………………………………….. 52
References ………………………………………………………………………. 55

3
Introduction
Much of the narrative surrounding the African continent has been prescribed with
adjectives such as dark, impoverished and uncivilized. This misguided and often racist image of
Africa has been propagated by mainstream media outlets such as The Economist and novels like
Joseph Conrad’s The Heart of Darkness, the story of a quest to rescue a doctor from the depths
of the Congo during colonialism. Such literature initially resurrected a neo-colonial perception of
the continent that is governed by ineffective and inhumane leaders. However, in the 21st century,
this narrative was reversed. From 2000-2008, a movement called “Africa Rising” swept the
continent, with many countries experiencing unprecedented economic growth and development,
particularly in the Sub-Saharan region. Although this marked an immediate shift of the African
image from one of economic incompetency to tall-tales of prosperity and democratic shifts, gross
misconceptions still persisted. In a 2013 survey, Slattery (2013) indicates in the “widely
documented” evidence that rates of GDP growth, foreign direct investment (FDI) and
urbanization are significantly higher than first-world economies, but 10 out of 15 of those
countries are among the Failed States Index.
The disparity in economic development during Africa Rising thus begs the following
questions: Why did some countries grow faster than others during this period? Conversely, why
did some countries actually decline despite regional economic tailwinds? In order to examine
these questions, this thesis compares two cases that are emblematic of the extreme end of this
“Africa Rising” story. On one side is the positive outcome in Botswana, Africa’s development
state, and on the other is Zimbabwe, which is often considered a failed state or at the very least a
highly dysfunctional state. A juxtaposition of these two countries reveals multiple similarities in
economic resources and status at the time of independence, but a major difference in
4
comparative political and institutional evolution with one transitioning to a stable democracy and
the other falling into authoritarianism. In addition to a stark difference in government, these two
cases display one of the most disproportionate examples of economic development in Sub-
Saharan Africa since their independence, but particularly in 2000-2008. Therefore, this thesis
identifies how the different development of governmental institutions and regime type
contributed to this imbalance. In doing so, it reveals that a history of stable democracy in
Botswana created durable institutions that mobilized key natural resources while preventing
severe inflation, a lack of investment in public sectors and overall crisis. Zimbabwe’s path of
authoritarianism, unchecked by competitive elections, allowed a ruthless dictator to pursue
policies that neglected their natural resource endowment, resulting in a perennial decline in
economic development. To be clear, I am not arguing these states are exactly the same, but
despite some key differences, the overarching reason for their different outcomes is that one
evolved inclusive stable democratic institutions while the other did not.
Research Question
In order to explain the development trajectory among Sub-Saharan African countries
today as a function of democracy, this thesis examines the cases of Botswana and Zimbabwe.
Botswana and Zimbabwe are comparable in three aspects- they have similar natural resources
(minerals, diamonds, agricultural products), geographically landlocked and arid and were among
the top ten least developed countries (LDC) list at the time of independence. Despite the
similarities, the countries’ past economic development, particularly from 2000-2008, differ.
Generally speaking, Botswana’s spike in various growth indicators (GDP, GDP per capita, etc.)
was much more dramatic during Africa Rising than Zimbabwe’s. While the natural resources,
geographical attributes and levels of development were relatively similar at independence,

5
Botswana was a democracy and Zimbabwe was an authoritarian regime. In this thesis, the
various economic variables will be the dependent variables, which will be measured as a result of
the type of government, the independent variable. This comparison it will make it possible to
measure the correlation of democracy and the rate of economic development, and determine
which form of government was more effective. In doing so, I will answer the following question:
How does democracy impact economic development in Botswana and Zimbabwe since
independence? Specifically, what are the mechanisms democracy produces that make it so much
better at creating economic growth in in southern Africa?
My research questions are important and interesting for several reasons. First, it asks for
in depth explanations for two very different paths of development in the region, emphasizing the
stable presence of democracy and durable institutions over time. Second, as shown by
Zimbabwe, it helps illustrate why, despite regional growth in prosperity, one country with what
seemed to be many resource advantages, fell into what Collier (2008) identifies as numerous
“traps” especially the “bad governance” trap that begets many other problems. Moreover, this
analysis has implications for other countries in the region, and could shed light on the
comparative political development problems in the Democratic Republic of the Congo, which is
also a pseudo-failed state among others.
It is also not automatic that democracy would lead to higher levels of economic growth.
Some scholarship has suggested that certain forms of incomplete democracy (anocracy) can be
worse for stability and economic growth that authoritarianism (Fein 1995; Alon, Wu, and Li
2016). Relatedly, some argue that in some context authoritarianism can be propped up by
outside foreign investment because they are seen as more reliable partners for MNCs than
democracies (Oneal 1994). Still the preponderance of the literature does suggest that stable

6
democracy should produce more economic growth than authoritarianism and it is the goal of this
study to help identify the causal mechanisms over time that do that in the Sub-Saharan African
context during “Africa Rising.” What follows is a survey of this literature that is largely made up
of large-N studies that examine many countries and do identify robust correlations between
democracy and growth. Of these studies only Robert Bates (2012) focuses on sub-Saharan
Africa, describing a moderate correlation between democracy and growth. A comparative case
study of Botswana and Zimbabwe will aim to magnify these unique contexts and help answer my
hypotheses on whether it was democracy that increased economic development or economic
development that increased democracy and also since Botswana is the democracy with higher
growth what mechanisms led to that outcome, by providing a closer, and more precise estimate
of this positive relationship compared to past work.
The thesis is structured as follows: section two contains a review of the current literature
regarding the relationship between democracy and economic development, including the causal
mechanisms and my hypotheses. Section three discusses my research design and methodology,
in which I employ the Mill’s method of difference and identify the independent and dependent
variables. Section four presents the cases of Botswana and Zimbabwe in more detail. It will
contain an in-depth description regarding the political evolution of each country including a
history of government structure and presence of the dependent variables mentioned in the
methods section from independence to the Africa Rising. Section four provides the results of the
data as shown by the dependent variables of the study and identifies the variables that
demonstrate the largest disparities between two countries. Furthermore, it isolates the most
important variables of economic growth and summarizes the key ways in which democracy
serves as a gateway for development. Finally, the concluding chapter will reiterate the argument
7
of the thesis by emphasizing the results of the study and posing questions for further research
about Botswana’s growth paradigm as a model for future success in the region.
8
Chapter 1: Review of the Literature
Grouping the Theories
The literature presented in this chapter serves two purposes. The first group of studies
described reflect the most recent theories regarding the positive effect of democracy on
economic growth. Specifically, it explains how the free and fair elections in democracy transfer
political power from the elite to the citizens. Furthermore, they demonstrate the causal
mechanisms through which democracy enhances growth including private property rights,
increased political stability, FDI and several other economic variables. Contrary to the first, the
second body of literature represents studies dedicated to showing a negative or inconclusive
effect of democracy on economic development. The main findings of this literature suggests that
political freedom and free and fair elections do not necessarily correspond to the establishment of
inclusive institutions and increase economic output. In some cases, it provides evidence that
democracy is linked to increased government spending, which causes weaker per capita growth.
In this paper, I attempt to provide evidence that supports pre-existing literature in support of the
positive effect of democracy on growth. In doing so, it answers my original research question:
How does democracy impact economic and social development in Botswana and Zimbabwe?
Positive Effect of Democracy on Growth
The first body of literature supports the idea that democracy fosters economic growth and
development. Acemoglu and Robinson (2005) outline their basic theory of democratization in
which the citizens have the political power to elect policy makers they trust to represent their
economic preferences (Acemoglu and Robinson 2005, 173). Generally, a society is divided
between the minority elite who are typically rich and the citizenry, the majority. However, the
interests of these two groups are fundamentally in conflict with one another and a dictatorship

9
places no limitations on the ruling elite’s ability to implement policies that benefit them
exclusively (Acemoglu and Robinson 2005, 170). In a democracy, they argue, the citizens have
political power to make decisions today and tomorrow and more political equality through
institutions like free and fair elections, free entry into politics and individual voting power.
Acemoglu and Robinson (2005) think of democracy as a kind of game. Individuals have
preferences such as more income, peace, private property rights, education or healthcare, and
democracy can transfer the power from the elite to the citizenry by locking in these preferences
(Acemoglu and Robinson 2005, 174). This transfer of power is essential for political equality
because the elite and the citizenry have inherently conflicting socio-economic preferences and
the elite have defacto political power. According to Acemoglu and Robinson (2005), defacto
political power is having absolute power over another and this power can be regulated or
transferred via dejure political power, which is power delegated through institutions (Acemoglu
and Robinson 2005, 21). Key to their model of democratization is the “durable” and
“committed” political institution, which locks in future economic policies that benefit the
majority or citizenry (Acemoglu and Robinson 2005, 174). Whereas the elites have defacto
political power over the citizens in an autocracy, democracy increases overall economic growth
via institutions, which give the majority the dejure political power to vote on policies that are
beneficial to them. The mechanisms by which democracy positively impacts economic
development are further elaborated on by Bates et al. (2012), Acemoglu et al. (2019),
Doucouliaglos and Ulubasoglu (2008) and North and Weingast (1989).
Bates et al. (2012) and Acemoglu et al. (2019) center their analyses on the positive causal
relationship between democracies and increases in GDP per capita, but Bates et al. (2012) focus
on Sub-Saharan Africa. In the 20 years 1989, Bates et al. records that the region experienced a
10
wave of democracy that was accompanied by growth “not witnessed since independence” (Bates
2012, 3). However, they find that the democratization of the 42 countries in question only slowly
covered their per capita income in the long run, and several experienced unjust elections
suggesting that their level of democracy may have been too high (Bates et al. 2012, 2). For the
countries that did exhibit a long-run increase in GDP per capita, Bates et al. (2012) credits the
political institution of democracy and competitive elections for establishing effective policies
that benefited the majority agricultural population. Specifically, their data detects that democracy
allowed these economies to “express greater fiscal/monetary restraint”, invest in education and
infrastructure, and increase earnings for farmers (Bates et al. 2012, 12).
While Bates et al. (2012) claims that democracy had a positive, but slow impact on per
capita income, Acemoglu et al. (2019) claim that the correlation is more significant. Contrary to
Bates, these authors argue that this trend, a 20% hike in GDP per capita in 25 years, does not
vary across different levels of economic development or democratization (Acemoglu et al. 2019,
50). Moreover, this increase in per capita income is driven by a democracy’s tendency to change
ineffective economic policies, increase capital attraction, education, healthcare and
infrastructure, as well as reduce civil conflict (Acemoglu et al. 2019, 51). Dictatorships, ranking
lowest according to the Freedom House and Polity indices, are less likely experience the above
improvements. Therefore, my first my hypothesis emerges:
1a. Increased levels of spending on education, health and infrastructure are higher in
a democracy than an authoritarian regime and thus increase economic
growth/development in the sub-Saharan context.
Doucouliaglos and Ulubasoglu’s (2008) meta-analysis of 483 estimates and 84 studies on
the relationship of democracy on economic growth claims that these mechanisms do not

11
represent direct correlation, but indirect (Doucouliaglos and Ulubasoglu 2008, 61). Similar to
Acemoglu and Robinson (2005), they conclude that durable institution of democracy usually
limits a state’s ability to infiltrate the economy, thus being more receptive to public incentives
such as education, justice, health and stability. Doucouliaglos and Uluasoglu (2008), largely,
echo Bates et al. (2012) as well, in that the “liberty, free-flowing information and secured control
of property” ensured through democracy enfranchises citizens to work hard and invest, and
provides them with “profit maximizing activity” (Doucouliaglos and Uluasoglu 2008, 61).
Finally, they find democracy to be indirectly correlated with higher levels of economic freedom,
human capital, political stability and a lower degree of inflation (Doucouliaglos and Uluasoglu
2008, 75).
In measuring the impact of democracy on growth, North and Weingast (1989) condense
their theory to the linkage between strong political institutions, the preservation of property
rights and the “elimination of confiscatory government” during 17th century England (North and
Weingast 1989, 803). To some extent, their discussion of the significance of committed political
institutions mimics the earlier arguments in this first body of literature, Acemoglu and Robinson
(2005) in particular. North and Weingast argue that enduring institutions such as the constitution
places limitations on the sovereign to set rules and regulations which benefit the ruling majority
rather than the elite (North and Weingast 1989, 806). In addition, these institutions allow
necessary fiscal restraint, as mentioned by Bates (2012) and Doucouliaglos and Uluasoglu
(2008), private market protection and a limitation on a “state’s ability to manipulate economic
rules for itself (North and Weingast 1989, 808). In short, democracy is a robust, committed
institution that constrains the ability of the elite to protect its interests, whereas an autocracy has

12
none, typically leading to an elimination/confiscation of private property rights for the majority
and thus, overall economic decline.
Additional studies have more closely examined the relationship between certain
institutions and economic growth. One such study is conducted by Nathan Jensen, which consists
of various price data from political risk agencies to evaluate how various political institutions
influence the insurance premiums that multination corporations pay when investing abroad
(Jensen 2007, 1040). Using data collected from private firms such as Chubb, AIG and the United
States’ Overseas Private Investment Corporation (OPIC), Jensen (2007) indicates they measure
political risk based on the amount of war/political violence, expropriation of multinational assets,
contract breaches with government entities or private firms and transfer risk (Jensen 2007, 1043).
The study concluded that democracies decrease risk for investors by limiting the number of veto
players that can block changes in policy, increasing the availability of channels through which
private firms can change policy, political transparency and maintaining a good reputation by
abstaining from expropriation and contract disputes (Jensen 2007, 1042). Moreover, the
countries that exhibited these characteristics experienced increased foreign direct investment.
Similar to Jensen’s argument that democracies are associated with lower political, and
thus investment risk, Stephen Knack and Philip Keefer (1995) focus on the effect of institutions,
but do not elaborate on the relationship between government type and development. Using the
International Country Risk Guide (ICRG) index to measure expropriation risk, peaceful methods
of solving disputes, corruption and quality of bureaucracy, Knack and Keefer (1995) find that
less expropriation, more rule of law, less corruption and an effective judiciary corresponded to a
higher allocation of public goods, physical and human capital stock and higher maintenance of
property rights (Knack and Keefer 1995, 6). Conversely, the resulting “distortions in investment

13
and trade” from incompetent bureaucracy led to inefficient capital investment and new foreign
technology (Knack and Keefer 1995, 7). Although they do not name regime type, they refer to
the fact that governments with unilateral power tend to be unconstrained and investors are likely
to be skeptical of these environments (Knack and Keefer 1995, 6). The unconstrained power is
more consistent in a dictatorship and the above components are more present in a democracy, as
Jensen (2007) explains. Building off the work of Knack and Keefer (1995) and Jensen (2007), a
second hypothesis emerges:
2a. Democracies experience lower political risk and corruption than authoritarian
regimes in the sub-Saharan Africa context, which attracts more foreign capital and
leads to higher levels of economic growth.
Negative or Inconclusive Effect of Democracy on Growth
Contrary to the first body of literature, the second informs that democracy and growth are
weakly, negatively or non-linearly relate according to a number of variables. Robert Barro’s
(1996) study of 100 countries from 1960-1990 finds that the real per capita GDP level is more
closely linked to “higher initial schooling, life expectancy, lower government consumption and
better maintenance of law” than it is to lower levels of “political freedom” (Barro 1996, 1). In
fact, political freedom, which he interchangeably uses with democracy, has a weak or non-linear
effect on per capita income and GDP. The only slight growth Barro records is among countries
with initial levels of low political rights, but those with “moderate” democracy tend to decline
when they develop more freedom (Barro 1996, 1). Moreover, he explains that nothing in theory
prevents dictatorships from establishing a the “better maintenance of law” variable because they
do not have to engage in central planning, or allow their personal objectives to conflict with
growth (Barro 1996, 3). However, Barrow cites that in Africa, for example, several autocracies
14
contain corruption and human rights abuses, suggesting that there is also nothing that obviates
unfavorable policies (Barro 1996, 33).
Like Barro (1996), Przeworski and Limongi (1993) note a non-linear relationship
between democracy and growth, but believe that it is more helpful to focus on durable
institutions rather than regime (Przeworksi and Limongi 1993, 51). This is because there is
already much debate regarding whether a democracy or autocracy is more effective in providing
these institutions, and evidence indicates an inconclusive link for both. Still, they write that
democracies can hinder growth by applying to much pressure on “immediate consumption”,
which “reduces investment” (Przeworksi and Limongi 1993, 51). Expanding upon this idea,
democracies do not necessarily provide institutions that protect against this pressure. The
provision of political and economic freedom, Przeworksi and Limongi argue, equalize the
citizenry’s right to “influence the allocation of resources” in the market (Przeworksi and
Limongi 1993, 51). Contrary to North and Weingast (1989), they posit that the inclusion of
private property rights poses a direct threat to land owners. In their view, private property rights
can create a “divergence”- capitalist land owners are threatened by organized workers and
peasants because democracy gives them a voice (Przeworksi and Limongi 1993, 51).
Gerring et al. (2005), too, emphasize the significance of long-lasting institutions, but
conclude that there is either no effect, or a negative, direct impact of democracy on economic
growth in the long run. Treating democracy as “accumulated stock” as opposed to a “level, they
argue that democracy as an immediate cure for per capita growth is unrealistic because
institutions are developed throughout history (Gerring et al. 2005, 324). These authors compare
democracy to an investment. It acts like a stock in that it is supposed to provide a long-term
return in economic growth. However, their empirical evidence suggests that the investment of

15
democracy, while indirectly increasing stability and property rights, does not provide higher
returns in capital compared to autocracies (Gerring et al. 2005, 323). Rather, Gerring et al. find
countries with historical democracies are associated with higher inequality, including physical,
human and social capital distribution (Gerring et al. 2005, 326).
In a new methodology, Tavares and Wacziarg (2001) also center their analysis on the
aggregate effect of democracy and growth, demonstrating a “moderately negative” correlation
(Tavares and Wacziarg 2001, 1341). However, unlike Gerring et al. (2005), they concentrate
primarily on democracy’s tendency to decrease physical capital by increasing government
spending, resulting in an overall decrease of per capita income (Tavares and Wacziarg 2001,
1343). Building off Barro’s (1996) work, Tavares and Wacziarg (2001) declare that a distinction
between the transfer of political power in democracy and the resulting economic outcomes needs
to be made because the two are not causal. There is no direct effect of democracy on economic
growth. In a democracy, they claim, the cost of financing public services through taxation
eventually overcomes the benefit of public goods such as infrastructure, health and education
(Tavares and Wacziarg 2001, 1343). Likewise, the increase in government consumption in
democracy “reduces the rate of physical capital” and causes on “overall negative effect on
growth” (Tavares and Wacziarg 2001, 1343). Similar to Gerring et al. (2005), Tavares and
Wacziarg (2001) find that democracy can have a positive effect of the accumulation of human,
social capital and inequality, but increased government consumption reduces the aggregate
growth when accounting for all variables.
The above literature contains theories concluding that democracy has either direct or
indirect, positive, negative or null correlation with economic growth. Proponents of the
“democracy increases economic growth” narrative found that the free and fair elections in
16
democracy have generally led to the maintenance of durable institutions and good economic
policies that led to higher economic growth. In addition, Acemoglu et al. (2019) discovered that
countries that democratize at different times do not experience lower rates of growth than
historical democracies. Finally, the first body of literature did not only detect higher levels of per
capita income, but higher levels of education, health and infrastructure, signifying an overall rise
in development.
In opposition to the first, the second group of documents cites a negative or unrelated
relationship between democracy and economic growth, arguing that a democracy does not ensure
development, but institutions do. It states that there is nothing, in principal, that a democracy can
provide that leads to development compared to a dictatorship. However, there is more evidence
of corruption and civil conflict present in autocracies, particularly in Sub-Saharan Africa,
suggesting that nothing to prevent dictators from enforcing policies that hinder economic growth.
Therefore, the literature provided in this thesis will seek to expand on the current work that
democracy impacts economic development positively by serving as a check on the elite and
representing the interests of citizens. Moreover, it will apply the above theories to Botswana and
Zimbabwe in the section four and show that competitive elections are able to more effectively
transfer political power to the citizens. In addition, it will show that Botswana’s democracy
elected strong leaders who uphold good economic policies such as regulated open-trade, private
property rights and capital investment in public sectors. Instead of trying to prove a direct
correlation between democracy and economic growth, my study will attempt to gather evidence
that, compared to Zimbabwe, Botswana’s democracy provided an environment that is more
conducive to development as shown by its exponential progress since independence.
Furthermore, as part of my analysis, I emphasize that a stable history of democracy in Botswana
17
played an integral role in its future growth, similar to the way a history of dictatorship in
Zimbabwe influenced its relative decline. This interactive effect suggests a qualifier that the
longer a democracy persists or a dictatorship persists the more they experience positive or
negative economic developmental outcomes. Therefore, a third set of subordinate hypotheses
emerges:
3a. The greater the duration of a stable democratic regime the more inclusive
reliable economic institutions will expand increasing growth.
3b. The greater the duration of an authoritarian regime, the more inclusive reliable
institutions will deteriorate or fail to emerge, hampering growth.
Using the above literature, I formulate three hypotheses. The studies suggest a positive
relationship between democracy and growth, emphasizing that free and fair elections develop
institutions that increase growth for the majority. Additionally, part of the literature provides
evidence that this occurs in the Sub-Saharan context, as reflected in hypothesis one. A positive
correlation between democracy, lower political risk and higher FDI is also present in this
literature, leading to hypothesis two. By studying the history of democracy in Botswana and
autocracy in Zimbabwe, the final hypothesis poses that the longer a democracy persists, inclusive
institutions will strengthen, thus increasing growth. Conversely, the longer the continuation of
autocracy, the more inclusive institutions will erode, thus decreasing growth. In order to test
these hypotheses, Chapter two outlines my research design including a brief description of the
cases and the independent/dependent variables.
18
Chapter 2: Research Design/Methodology
In order to fulfill my research question about the relationship between democracy and
economic development, I conduct a comparative analysis of Zimbabwe and Botswana,
examining development data since independence. Though this era has a narrative of economic
prosperity across the region, this was not the case for all countries, and I argue that the
government structure is what dictated the rise or fall of these countries. Specifically, a history of
stable democracy in Botswana provided an environment in which key natural resources were
activated, leading to economic prosperity without ignoring investment in health, infrastructure,
education or severe income inequality. Zimbabwe’s maintenance of a predatory regime permitted
a dictator to not only poorly manage his country’s geographic wealth, but disenfranchise the
majority of his constituency.
These cases were chosen because they are comparable in several aspects. Firstly,
Botswana and Zimbabwe are rich in natural resources. Botswana’s main natural resources and
industries include minerals (gold, copper and diamonds), livestock and agriculture. Similarly,
Zimbabwe boasts an abundance of diamonds and platinum-group metals (PGMs) and farming.
Geographically, they both have similar disadvantages because they are landlocked and arid.
Secondly, both countries were colonized by the British Empire and were among the top ten least
developed countries (LDC’s) at the time of independence (Lewin 2005).
Still, some differences exist. Botswana is larger in terms of total area and smaller in terms
of population. Botswana has an area of 581, 730 sq km whereas Zimbabwe’s is 390,757 sq km
and a population of 2,317,233 compared to Botswana’s 14,546,314. Both nations were colonized
by the British Empire, but gained their independence at different times, Botswana’s coming 14
years later in 1966. As I explain later, there is debate regarding the impact of colonialism on
19
Botswana and Zimbabwe’s democratic and economic progress. A close comparison of their
colonial and pre-colonial histories reveals that certain democratic and capitalist structures in
Botswana were already present prior to colonization. Therefore, it is argued that Britain did not
uproot pre-colonial culture and hinder Botswana’s trajectory as much as Zimbabwe’s. While this
difference is present, I hold the British colonial legacy of Botswana and Zimbabwe constant for
the purposes of this paper, which is primarily concerned with how democracy impacts economic
development. In addition to this factor, the differences in size and population will be held
constant in order to emphasize the similarities in natural resource wealth, geographical
disadvantages and economic status at the time of independence. Overall, this study argues that
the drastic divergence in government structure and positive impact of democracy on Botswana’s
development overcomes these differences. Once certain aspects of the countries are controlled, I
propose that the competitive elections and transition of political power to the citizens in a
democracy represents a political environment in which natural resource capacity materializes
without causing excessive economic or social harm. Therefore, the primary independent variable
of the study is regime type: democracy or dictatorship.
The degree of democracy is measured by the Polity IV index. For the Polity IV Index, -10
to -6 would be considered an autocracy and 6 to 10 would be a democracy. President Robert
Mugabe served nine years of his 37-year rule under a one-party system (Krieger 2003). His
regime included some socialist but mostly clientelist policies such as an increase in social
services, food subsidies, higher wages, but only among entrenched white farmers. A large
portion of land was then expropriated by the government, and opposition to his rule was met
with massive human rights violations. Botswana, on the other hand, was led by Seretse Khama,
Quett Masire and Festus Mogae, a trained economist who employed democratic and liberal
20
policies such as free trade, speech, globalization, private property rights and investment in
capital. As a result of these policies, this thesis measures the growth trajectory of these two
countries using the following dependent variables to indicate development: GDP growth, GDP
per capita growth, inflation, current account balance, unemployment, education, health and
infrastructure. political risk (as measured by ICRG variables corruption, military involvement in
politics and bureaucracy quality) and FDI, A description of these variables are located below.
Dependent Variables
GDP and GDP per Capita
To compare their economic development, I first illustrate Botswana and Zimbabwe’s
macro-economic performance using GDP and GDP per capita growth. GDP reflects the total sum
of goods and services by the entire resident population in a country’s economy. Accounting for
the entire domestic population, this includes income generated by households, government and
all operating industries. According to the United Nations System of National Accounts (SNA),
GDP is one of three primary indicators of macro-economic growth. GDP per capita is calculated
by dividing a country’s GDP by its midyear population, reflecting the average output/income per
individual. Therefore, the growth rates for GDP and GDP per capita compares Botswana and
Zimbabwe’s overall growth in addition to the income growth of the individual as a result of
democracy. Based off hypothesis one, democracies are expected to record higher rates of growth
in both GDP and GDP per capita than autocracies, with an even larger disparity from 2000-2008.
Using the cases of Botswana and Zimbabwe, hypothesis three predicts that a stable history of
democracy strengthens institutions and leads to higher growth rates of GDP and GDP per capita
growth.

21
Inflation and Current Account Balance
The inflation and current account balance variables depict Botswana and Zimbabwe’s
ability to employ prudent monetary and trade policies given their shared natural resources wealth
in mining. Specifically, inflation data is measured by the annual growth rate of the GDP implicit
deflator and demonstrates the rate at which prices change in the entire economy. The current
account balance data is presented as a % of GDP and is the “total sum of net exports of goods
and services, net primary income and secondary primary income”. It is expected that inflation
rates will be lower in democracies than dictatorships because democracy produces leaders who
can manage growing inflation even with a plethora of natural resources. Furthermore, the current
account balance of democracies as a percentage of GDP is anticipated to be higher than in
dictatorships by maintaining a current account surplus and trading natural resources efficiently.
Unemployment
In order to measure unemployment, this study records Botswana and Zimbabwe’s
unemployment as a percentage of the total available labor force. This variable can be misleading,
especially because high levels of unemployment are often present in high-growth countries in
which its habitants can afford to wait longer to find jobs. Low-growth countries, on the other
hand, can hide their developmental issues with low unemployment rates. However, their
production output may not be that high. I expect that democracies correspond with low
unemployment whereas autocracies result in higher unemployment. Moreover, as hypothesis 3a
and 3b propose, I expect a stable history of democracy to correspond with lower inflation and
higher current account balance overtime.

22
Education, Health and Infrastructure
In this study, education is measured by tertiary school enrollment as a percentage of
Botswana and Zimbabwe’s total gross population. Enrollment in tertiary school requires the
completion of a secondary degree at the minimum, or graduate/post-graduation school.
Healthcare is indicated by the average life expectancy at birth, or the average life span, taking
into account the death pattern across all age groups. Finally, infrastructure is represented by
electric power consumption (kWh per capita). In general, increased electric power consumption
is a common indicator of economic development, industrialization and urbanization. As
discussed in the literature, democracies are associated with higher investment in education,
healthcare and infrastructure. Therefore, it is predicted that democracy demonstrates higher rates
of tertiary school enrollment, a higher average life-span and more electric power consumption
overtime than dictatorships.
Political Risk and FDI
The corruption, military in politics and bureaucracy quality variables from the
International Country Risk Guide (ICRG) and foreign direct investment (FDI) are also measured
in this study to gage Botswana and Zimbabwe’s level of political risk. Corruption is the first sub-
variable of political risk. Using a zero (completely corrupt) to six (least corrupt) scale, this
variable represents the extent to which a company exhibits financial corruption through bribery,
special payments, etc., excessive patronage and overall political instability. Similarly, the
military in politics variable is presented using the same scale. Rather than corruption, however, it
reflects how much the military is involved in the political process. If a country scores low on this
scale, it has less democratic accountability as well. Bureaucracy quality is scored the same as the

23
previous two variables, but on a zero to four scale. This quantifies the strength and competency
of a country’s government to handle changes in policy without excessive political instability.
If a country’s overall political risk is low, it is expected that foreign entities are more
hesitant to invest. Foreign investment in this study is measured as FDI inflows as a percentage of
GDP. FDI represents investments made by a foreign company that acquires an interest of more
than 10%. Based on hypothesis two, I pose that democracies are associated with lower political
risk and higher FDI than dictatorships, which leads to higher economic growth in the Sub-Sahara
Africa context. By using this data for Botswana and Zimbabwe in context with their Polity IV
scores, hypothesis 3a predicts that the longer a democracy persists, the less political risk it will
pose, attracting more FDI and increasing economic growth overtime. Conversely, 3b proposes
that the longer an autocracy persists, the more political risk it poses, attacking less FDI and
hindering growth overtime.
Methodology
To represent the data, I use Jonathan Stuart Mills’s method of difference and concomitant
variation (Lijphart 1971, 687). The Mills method of difference compares instances in which a
phenomenon does occur, with instances in other respects similar in which it does not. In this
thesis, the phenomenon in question is democracy, as measured by the Polity IV index. In
Botswana, democracy does occur and in Zimbabwe it does not. However, rather than simply
observe the presence or absence in democracy in these countries, the results of the thesis will
quantitatively measure the variations of the opposite variables and explain their relationship to
the dependent variable. In doing so, I underline that a historical process tracing of the political
evolution of these countries reveals how the stability of democracy served as a pre-requisite for
growth.
24
Chapter 3: The Cases of Botswana and Zimbabwe
Historical Process Tracing and Economic Development
My overall objective is to demonstrate a strong, positive relationship between democracy
and economic development as represented by the various dependent variables. A secondary goal
of this thesis shows that a stable history of democracy in Botswana lead to a steady, upward
trajectory of economic development. In order to test hypothesis 4a, section four traces the
political evolution of Botswana from its pre-colonial roots to Africa Rising. Using the same time
frame, it additionally illustrates Zimbabwe’s political path as a dictatorship in order to test
hypothesis 4b and compare their opposite economic outcomes.
Phase I: Colonial Legacy of Botswana
Even though Botswana and Zimbabwe were both colonized by England, it has been
argued that their colonial legacies have differing effects on the maintenance of democracy and
economic development. However, Jonas Hjort (2010) outlines that Botswana’s current
democratic status and economic progress is influenced by its culture dating back to pre-colonial
culture. He explains that Botswana’s economic outcomes are “transmission mechanisms from
historical to current institutions” (Hjort 2010, 689). According to Hjort (2010), Botswana’s
reputation as Africa’s example of a non-corrupt, free, stable, long lasting multi-party democracy,
economically prosperous country is due to the pre-existing practices of its majority ethnic group,
the Tswana (Hjort 2010, 690). In other words, Botswana’s perceived legitimacy today derives
from the previous legitimacy of Tswana culture and institutions such as democracy and good
governance (Hjort 2010, 692). In the 19th century, Tswana settlements were very centralized.
State capitals resembled hierarchies consisting of lower-level communities called tribes,
occasionally with five different levels of authority (Hjort 2010, 694). At the top of this socio-

25
economic structure was the Tribal chief, who served as the political and spiritual leader of the
rest of the four classes: royalty, commoners, settlers and serfs (Hjort 2010, 694). The Tswana
lawmaking process represented a collaborative process that occured in a chief’s kgolta, a meeting
place in which the chiefs from other polities met to discuss new laws (Hjort 2010, 694). During
these meetings, the chiefs contributed to debates and collectively reached decisions.
Furthermore, these chiefs were elected meritocratically by the people and public opinion greatly
influenced leadership selection and decisions (Hjort 2010, 698). Even though the kgotla did not
serve as a real parliament, Hjort (2010) indicates that the collaborative culture of the Tswana
provided an easy transition to the first official democratic party in 1961, the Botswana
Democratic Party led by former chief Seretse Khama.
In addition to this democratic culture, private property rights in Botswana were rooted in
Tswana culture in the 19th and 20th centuries, based on a agriculturally driven economy. As Hjort
(2010) explains, the married members of the Tswana tribe were entitled to the land of their
homes and law prohibited the government from seizing land once it was granted (Hjort 2010,
698). Moreover, men and women had separate ownership over family lands and they could trade
or rent land to other individuals, encouraging a culture of commerce (Hjort 2010, 698). The same
law applied to cattle. Men and women had separate ownership of and could trade their livestock,
and the chief had no ownership of individual property (Hjort 2010, 698).
Besides serving as an easy transition to the formation of the BDP, the democratic and
commercial culture of the Tswana facilitated the goal of the British to make Botswana a self-
sufficient state. When Botswana was colonized, England had not yet discovered the wealth of
diamonds and purposefully ignored their protectorate (Hjort 2010, 691). The highly centralized
hierarchy of Tswana polities eliminated the need for indirect rule. Rather than having to assign
26
chiefs to carry out the British agenda, the Tswana voted to cooperate with British colonial
authorities (Hjort 2010, 694). This structure proved useful for the British and the pre-existing
democratic and commercial culture of Botswana was not uprooted, which was not the case with
other colonies (Hjort 2010, 694).
Phase I: Colonial Legacy of Zimbabwe
Contrary to Botswana’s centralized pre-colonial state, Zimbabwe’s state culture operated
by a dramatically different political theory. The pre-colonial state in Zimbabwe of the Shona
majority ethnic group revolved around religious authority which made it impossible for the state
to possess social or economic power (Maundeni 2002, 111). Whereas Tswana culture was
predicated on a five part hierarchy, democratic values and private property rights, social and
economic power in Zimbabwe was primarily invested by an elite class of priests and a religious
king (Maudeni 2002, 112). Furthermore, the appointment and succession of the king was not
determined democratically. Instead, it was determined arbitrailly and only open to the king’s
family. As Zibani Maundeni (2002) indicates, the priests and religious king in Shona political
system directed several opposing armed groups that created indigenous feuds and violence
(Maundeni 2002, 112). There was no opportunity to challenge religious authority and the Shona
state did not represent a united people.
In addition to the lack of a centralized state, Shona religious authority did not value
material possessions such as land or cattle. Rather, the ruling priest class viewed economic
power in terms of their “magical economic powers” or God-given ability to summon rainfall or
avoid natural disaster (Maundeni 2002, 112). In other words, the priest class and king did not
care about owning land and left ownership in the hands of individual families. However,
religious authorities determined how the land and cattle were used rather than the state. In Shona
27
culture, this property was not traded or rented to other individuals, but used for purely for
consumption in ceremonies as a symbol for religious purity (Maundeni 2002, 118).
Accoridng to Maundeni (2002), the absence of a centralized state also represented the
lack of an “indigenous initiator state culture”, which facilitated the colonial eradication of
Zimbabwe’s pre-colonial traditions and exploitation of the indigenous population (Maundeni
2002, 122). Therefore, Great Britian’s goal during the colonization of Zimbabwe (Rhodesia prior
to independence) was much clearer. When Rhodesia was declared a “self-governing colony” in
1924, the 840,000 native majority was ruled by the 35,900 European white minority (Streater
2018, 125). Although colonial law dictated that Rhodesian natives could own and dispose of land
the same way that a European settler could, discriminatory land policies were nonetheless
enforced on Black Rhodesians (Streater 2018, 125). The private British South Africa Company
discovered a loophole around colonial law and decided not to sell land to Black Rhodesians, thus
creating de facto segregation (Streater 2018, 125). European settlers seized political power,
demanded segregated land and maintained ownership of 1,925 out of the 1939 crops available
(Streater 2018, 126). Though Britain intended to diversify the Rhodesian economy for the
“expressed purpose of farming”, their efforts excluded Rhodesians from competitive
participation in the land market (Steater 2018, 126). In 1930, the Land Appointment Act declared
that black natives and white settlers could not buy or sell from each other, separating land into
inferior “Tribal Trust lands” and “rich lands” (Streater 2018, 127). This and the Native Land
Husbandry act of 1951, which forced Black Africans to move to urban areas, caused Rhodesian
natives to “grow low-value vs cash crops” and work in low-paying industries (Streater 2018,
128).

28
Under the leadership of white Zimbawean-born Ian Smith, Zimbabwe declared its
independence from Great Britain in 1965 in the Unilateral Declaration of Independence (UDI).
However, Prime Minister Smith was a strong opponent of black-majority rule and his UDI
government was met with violent student protests and a civil war that lasted from 1969-1979
(Streater 2018, 129). Even though they refused to recognize Zimbabwe’s independence, the civil
war proved costly and the British eventually hosted the Lancaster House Conference (LHC) to
“broker peace”, grant independence and “create a constitution that would govern a new state”
(Streater 2018, 129). At the meeting, delegates from Zimbabwe’s Patriotic Front including future
Prime Minister Robert Mugabe advocated for the complete political enfranchisement of blacks
while members of Smith’s UDI government wanted to continue the status quo (Streater 2018,
129). Eventually, the LHC ruled in favor of Mugabe’s Patriotic Front, which was under high
pressure to deliver on its key promises.
Comparing the Impact of Colonization on Democracy and Growth
Prior to is colonization, Tswana polities in Botswana were highly centralized, elected
chiefs meritocratically and demonstrated private property rights. When Britain colonized in the
late 19th century, Tswana chiefs, influenced by public opinion, voted to cooperate with the
British to make Botswana a self-sufficient colony. The pre-existing hierarchy headed by tribal
chiefs eliminated the need to establish indirect rule, and therefore Britain did not need to
eradicate Tswana pre-colonial culture. Thus, many argue that the post-independence transition to
democracy and economic growth was relatively smooth.
In contrast, the Shona in Zimbabwe did not exhibit a centralized state before its
colonization. There was a clear absence of democracy. Furthermore, political and economic
power was invested in the ruling priest class rather than the state. Unlike the Tswana who
29
experienced unity among the five classes, the Shona in Zimbabwe were a divided people.
Resistance to religious authority was quelled by priests and kings who were in control of several
armed groups. Pre-colonial Zimbabwe, in turn, clarified Britain’s objective of exploitation and
economic apartheid. Compared to Botswana, Zimbabwe’s road to independence was not as
smooth due to an increased reluctance to grant independence and a decade-long civil war.
Therefore, it is argued that a pre-colonial lack of democracy and economic competence,
discriminatory land policies during colonization and civil war hindered Zimbabwe’s democratic
development and economic progress.
While it is important to acknowledge that the pre-colonial culture and colonization of
Botswana and Zimbabwe may have impacted their future development, this paper holds them
constant in order to the accentuate effect of the salient variable of democracy vs dictatorship. I
emphasize that despite the different legacies, Botswana and Zimbabwe were in similar economic
positions at the time of independence. Phase II presents an overview the countries’ political
evolution since independence and highlights the connection with stable democracy and economic
development vs autocracy and decline.
Phase II: Democracy in Botswana Since Independence
Today, Botswana stands as Sub-Saharan Africa’s development state and has the
reputation of the “shining example of liberal democracy, oasis of tolerance and voice of
moderation in regional politics” (Tsie 1996, 599). Despite its poor economic status as an LDC in
1966, the average Batswana citizen has access to an array of social services such as health
facilities, education, clean water, etc. (Tsie 1996, 600). Since the first pre-independence election
of 1965 of the BDP and President Seretse Khama, a history of political stability and regular free
30
and fair elections led to the formation of a competent government that was effective in executing
development policy (Tsie 1996, 601).
In 1965, Botswana created its first constitution based on the British unicameral
parliamentary structure and single-member district of the first past the post (FPTP) voting system
(Maundeni 2005, 30). Under the FPTP voting system, voters casts their vote for their desired
candidate, and the one with the most votes was elected. However, the president is not directly
elected. The Botswana parliamentary system entails a predominant party system which primarily
resides over the executive and legislative branch (Maundeni 2005, 36). In other words, the
president is indirectly elected as the candidate for his majority party in parliament. Furthermore,
Article 34 of the constitution grants the President certain executive powers:
“He/she is the principal spokesperson of the party on national and international affairs;
convenes and presides over Central Committee meetings; gives instruction on any matter
to any official of the party and empowers any member of the party to exercise any powers
or specific function for and on behalf of the party or Central Committee as may be valid
and lawful. He or she has the power in exceptional circumstances, as specified in the
disciplinary rules of the party, to suspend any member of the party for a stipulated
number of days for unacceptable behavior pending action by the Disciplinary
Committee.”
Although Botswana is recognized as the epitome of liberal democracy in Sub-Saharan
Africa, it is argued that Botswana’s multi-party electoral system is not as politically competitive
as its reputation suggests. For example, the fact that the BDP has won each of the nine elections
since 1965 suggests that Botswana’s democracy is imperfect (Maundeni 2005, 33). This is also
evidenced by the disparity in parliament seats and popular vote poll results between the BDP and
opposition parties such as the Botswana National Front (BNF). Figures 2.1 and 2.2 taken from
Maundeni’s (2005) analysis of Botswana’s democracy demonstrates the gap in both parliament
seats and popular vote under the FPTP system (Maundeni 2005, 40). However, as Maundeni
(2005) mentions, the opposition’s share of the popular vote and parliament has steadily increased

31
since 1994 due to constitutional amendments such as the addition of 17 seats in 2001. (Maundeni
2005, 33). The number of seats increased from 31-57 in parliament from 1965 to 2004
(Maundeni 2005, 33). Moreover, the incumbent BDP’s share of the popular vote decreased from
80% to 51% while the opposition’s share increased from 19% to 49% over the same time period
(Maundeni 2005, 33).
Additionally, other elements of Botswana’s constitution protect the institution of
democracy and free and fair elections. In 1997, the Independent Electoral Commission (IEC),
established in 1997 by the Constitutional Amendment Act. The members of the IEC are selected
by a body of the judicial branch called the Judicial Service Commission (JSC) (Maundeni 2005,
53). According to law, the IEC is responsible for the:
“conduct and supervision of elections of the Elected Members of the National Assembly
and members of a local authority, and conduct of a referendum and ensuring that
elections are conducted efficiently, properly, freely and fairly”- Sec. 65A
The leader of the IEC also serves as the judge of the High Court, the other five members of
which are appointed the JSC, as recommended by a conference between all political parties
(Maundeni 2005, 53). As explained by part X, section 69 of the Electoral Act of 1968, the High
Court of the judicial branch has the authority to “hear and determine any question whether (a)
any person has been validly elected as an elected member of the National Assembly”. Political
corruption is further avoided by the police. According to the Public Order Act of 1967, the police
are required to “suppress activity that disturbs elections or party meetings” (Maundeni 2005, 57).
Story of Democracy and Economic Development in Botswana
From the structure and evolution of its constitution over time, I outline that Botswana’s
democracy, while imperfect, demonstrates a lengthy history of free and fair elections and a
system of checks and balances. Moreover, I argue that democracy in Botswana facilitated the
32
emergence of competent, educated rulers who then developed economic policies that benefited
the majority of Botswana’s population. Several have alluded to democracy’s role in the
emergence of effective political leadership in Botswana. As Cathy Skidmore-Hess (2002)
indicates, all three presidents (Seretse Khama, Quett Masire and Festus Mogae) from 1965-2008
have prepared each other for office through “an extensive tutelage in cabinet level government
service as vice president and/or finance minister” (Skidmore-Hess 2002, 190).
The skillful leadership filtered through regular elections in Botswana accelerated
economic development in two primary ways: the activation of diamonds as a revenue stream and
brilliant fiscal policy. First, the prudent use of diamonds served as the driver of Botswana’s
exponential growth. When diamonds were discovered and initially mined in the early 1970’s,
Botswana’s formerly agrarian and meat-based economy was replaced with diamond exports.
According to Skidmore-Hess (2002), mineral revenues as a percent of GDP increased from 2%
to 40% and farming decreased from 41% to 5% (Skidmore-Hess 2002, 195). The revenue from
the mining sector was then used to finance public services such as healthcare, education and
infrastructure.
Second, the fiscal policies of Presidents Massire and Mogae prudently avoided a pattern
called the “Dutch Disease” that mineral-based economies face. This includes policies echoed by
Doucouliaglos and Ulubasoglu (2008) that prevent severe inflation and invest in public goods
such as “fiscal saving”, maintaining a current account surplus and “heavy government
investment in infrastructure and human capital” (Lewin 2011, 85). Botswana’s government
spending, “net lending” and capital investment in its rapidly growing income functioned as a
“shock-absorber” that prevented high inflation and uncontrollable rates of inequality (Leith 2005,
11). Botswana’s sturdy democracy, as Leith (2005) argues, (Leith 2005, 35) deserves credit for

33
its continued development. Its Constitution, furthermore, has ensured competitive elections,
establishing effective policy makers to uphold good economic policies while also appointing a
strong opposition in Parliament that “controls several important government councils including
the capital” (Leith 2005, 36).
Phase II: Autocracy in Zimbabwe- Political Chaos
In comparison with Botswana, Zimbabwe’s history of free and fair elections from its
independence to the end of Africa Rising is ephemeral. After the discriminatory land policies
enforced during colonization, Robert Mugabe’s ZANU-PF government promised to re-
enfranchise black farmers. In the 1980 election, his party won by a landslide against his former
ally Joshua Nkomo, the leader of the Zimbabwe African People’s Union (PF-ZAPU) (Arbab
2006, 148). Shortly after the election, a civil war broke out between the majority Shona and
Nkomo’s minority Ndebele tribe over slow progress on land reform and ethnic tensions (Arbab
2006, 149). The violence later ended in a truce between Mugabe’s ZANU and Nkomo’s PF-
ZAPU, resulting in Mugabe’s rise to power under the ZANU-PF government (Arbab 2006, 149).
To solidify his rule, Mugabe proceeded to alter the 1980 constitution determined by the
Lancaster House Agreement and created a de jure one-party state with a unicameral legislature
(Arbab 2006, 150). At this point, Mugabe faced no political threat under the structure of
Zimbabwe's one-party system.
Running without a strong opposition, Zimbabwe’s authoritarian government allowed
Mugabe to enact counterproductive policies that scared and fragmented the civilian population.
However, his response to political protestors resulted in mass exodus 25% of Zimbabwe’s
population (Masunungure 2011, 51). In one survey, 58% of participants indicated that they left
for reasons of “political persecution, intimidation and torture” and 82% listed “economic crisis
34
and unemployment” (Masunungure 2011, 51). According to Masunungure (2011), 84% of the
migrants were secondary-school educates males and 22% had earned their university or post-
graduate degree (Masunungure 2011, 52). Therefore, Mugabe had successfully removed an
educated class of citizens, leaving a “risk-averse, politically withdrawn” and weak middle-class
in order to consolidate his rule (Masunungure 2011, 53).
With the absence of civilian pressure, Mugabe continued to easily block regime change
through the use of systemic violence and human rights violations. Having won the hotly
contested 2000, 2002 and 2005 elections against the emerging Movement for Democratic
Change party (MDC), Mugabe began to feel political pressure. The ZANU-PF government
responded by creating a new, military wing called the Zimbabwe African National Liberation
Army (ZANLA) in anticipation of a defeat in the 2008 election. This branch consisted of
Mugabe’s Joint Operations Command including his security chiefs from the army, air force,
intelligence and police force (Masunungure 2011, 56). Refusing to concede defeat, Mugabe’s
ZANU-PF government proceeded to leave a “tail of destruction”, orphaning children and
displacing thousands of civilians (Masunungure 2011, 56). Outraged by international
intervention and political rivalry, Mugabe banned human aid organizations and the MDC party
from state-media access (Masunungure 2011, 57).
Autocracy in Zimbabwe- Economic Chaos
With political power entirely invested in the executive, Prime Minister Mugabe attempted
to control every element of civil society. In an effort to boost economic growth and appease his
political supporters, Mugabe implemented a large government spending program even while
private investment plummeted (Arbab 2006, 151). Continuing to strain the government budget,
he purchased private companies that lacked managerial competence (Arbab 2006, 151). This led
35
to massive bail outs, which resulted in a decrease in revenue and the need to borrow money from
outside lenders. When interested rates skyrocketed in 1997, Zimbabwe was in the midst of an
economic crisis with uncontrolled inflation, mass unemployment and decreased consumer
spending (Arbab 2006, 152). Mugabe was losing popularity quickly, even from his minority
white-settler supporters. As an act of desperation, Mugabe enforced the Land Aquisiton Act of
1992 leading to the expropriation of over 2000 primarily black farmlands and the eradication of a
wealthy black class (Arbab 2006, 153).
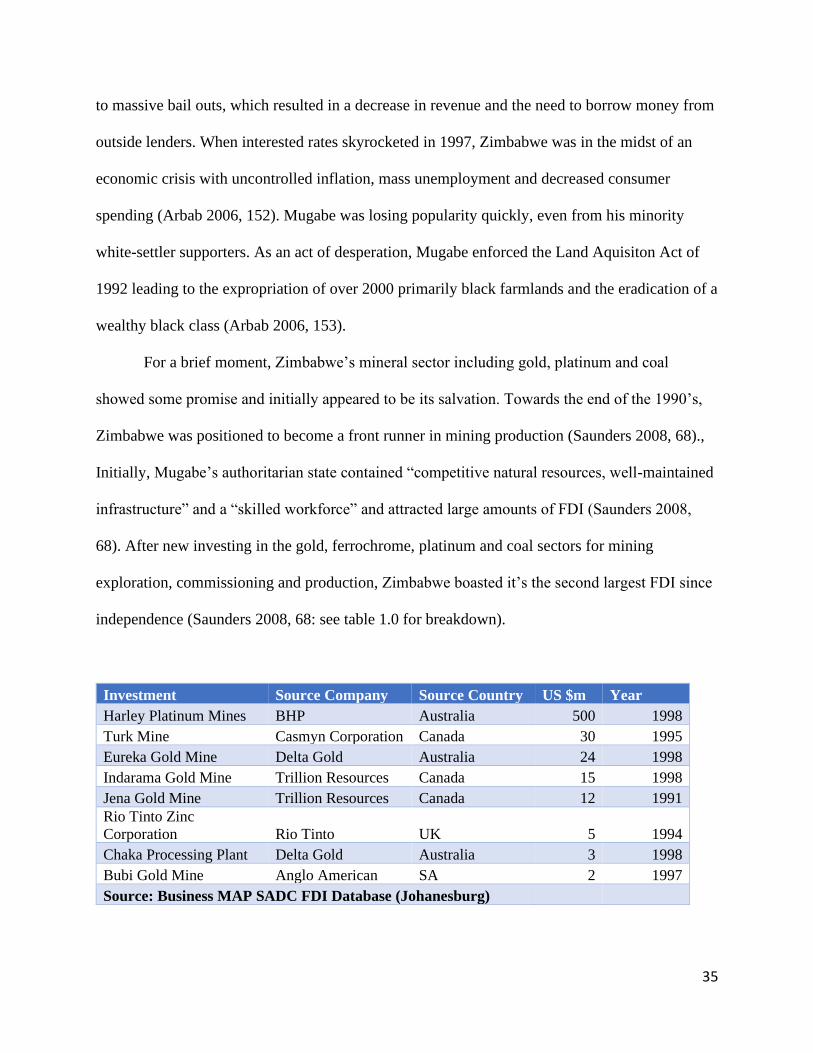
For a brief moment, Zimbabwe’s mineral sector including gold, platinum and coal
showed some promise and initially appeared to be its salvation. Towards the end of the 1990’s,
Zimbabwe was positioned to become a front runner in mining production (Saunders 2008, 68).,
Initially, Mugabe’s authoritarian state contained “competitive natural resources, well-maintained
infrastructure” and a “skilled workforce” and attracted large amounts of FDI (Saunders 2008,
68). After new investing in the gold, ferrochrome, platinum and coal sectors for mining
exploration, commissioning and production, Zimbabwe boasted it’s the second largest FDI since
independence (Saunders 2008, 68: see table 1.0 for breakdown).
Investment Source Company Source Country US $m Year
Harley Platinum Mines BHP Australia 500 1998
Turk Mine Casmyn Corporation Canada 30 1995
Eureka Gold Mine Delta Gold Australia 24 1998
Indarama Gold Mine Trillion Resources Canada 15 1998
Jena Gold Mine Trillion Resources Canada 12 1991
Rio Tinto Zinc
Corporation Rio Tinto UK 5 1994
Chaka Processing Plant Delta Gold Australia 3 1998
Bubi Gold Mine Anglo American SA 2 1997
Source: Business MAP SADC FDI Database (Johanesburg)

36
However, the gains that Zimbabwe accrued from its mineral sector were quickly
overshadowed by the political and economic crisis that would soon follow. This crisis caused
foreign entities to view Zimbabwe as an investment risk. Furthermore, Zimabwe’s failure to
mobilize its natural resource wealth in minerals efficiently is typical of low-capacity
authoritarian regimes. As Michael Ross (2015) indicates, there is a correlation between higher
oil resource income as a share of GDP and the maintenance of low-capacity autocracy (Ross
2015, 244). Other studies, such as work spawned by Collier and Hoeffler (1998) on so-called
“primary commodity exports” (PCEs) which, can include everything from rare earth minerals
like diamonds and gold to cash crops, shows how an over-reliance on these resources or the hope
of these resources can trap countries in cycles of bad institutions, authoritarianism, and internal
conflict. Additionally, linked to Zimbabwe’s dictatorship are its weak institutions that represent
more corruption, less rule of law and overall ability to avoid the natural “resource curse” (Ross
2015, 248).
There is a large amount of debate around the precise way resources can undermine a
country’s economy and transition to democracy. The timing, type and amount of resource, and
geopolitical location all matter (Ross 2015). One potential explanation is that these captured
primary commodity exports in the form of a variety of minerals make it difficult to fight
corruption and build higher quality institutions. The story of Zimbabwe’s development seems to
lend support for the idea that the promise of these resources would be a quick salvation to the
Mugabe regime and its clients. This hope caused persistent underinvestment in dynamic
economic growth and locked in corrupt, low-capacity institutions an economic problem
identified by numerous scholars (Ross 2015). According to Robinson et al (2006), autocracy in
Zimbabwe exhibited “excessive public employment and patronage”, lacked competent

37
institutions and political leadership which promoted economic growth and wasted its foreign
capital and natural resource potential (Robinson et al. 2006, 456). Due to Mugabe’s oppressive
political strategy via the ZANLA, the business climate in Zimbabwe switched as income was
directed towards the business elite rather than the working class (Saunders 2008, 69). In
summary, Zimbabwe experienced the two-pronged negative feedback loop observed by so many
of just enough natural resources to undermine democracy via corruption and underinvestment
while not enough to enrich the country. When juxtaposed against the experience in Botswana
this complex causal relationship seems even stronger which helps shed light on how resource
wealth can lead to these poor outcomes.
A Tale of Two Paths
Since their independence from Great Britain, Botswana and Zimbabwe demonstrate
opposing structures of government. From the first election of the BDP and Seretse Khama in
1965, Botswana has held nine free and fair elections without concrete evidence of interference or
corruption. The electoral results, although lopsided at times, has represented an increasingly
strong presence of opposition and competition. Moreover, Batswana presidents from 1965-2008
have prepared each other for office and demonstrated competence in fiscal and social policy.
Therefore, I argue that democracy facilitated the transmission of responsible leadership including
the prudent use of natural resources and a lack of militarized resistance to political opposition.
On the other hand, Zimbabwe’s government since 1980 presents no evidence of
democracy. By design, its one-party electoral system eliminated the possibility of competition.
Mugabe’s executive powers according the constitution permitted him to enact counter-productive
economic policies that led to the migration of politically informed voters. When Mugabe’s ruling
ZANU-PF was challenged by the MDC and civilian protests, it responded with the creation of a
38
militarized wing and extreme political oppression, which did not occur in Botswana. Therefore,
Zimbabwe’s authoritarian regime did not allow for the peaceful transfer of a new party that could
have ignited a positive economic trajectory. Despite Botswana and Zimbawe’s relatively similar
economic beginnings since independence, abundance of minerals and geographical
disadvantages, I emphasize that the history of government structure emerges as the most
influential factor in the process of their economic development. The following data supports the
resulting economic growth and development.

39
Chapter 4: Analysis of the Data
Components of the Data
The data presented in this study first measures the score of democracy of Botswana and
Zimbabwe according to the Polity IV index. The degree of democracy serves as the dependent
variable. The independent variables are broken in three categories: economic development,
economic development, political risk and FDI. Furthermore, they contain multiple indicators
(economic performance/development data/FDI taken from WBI and political risk taken from
ICRG). Finally, average figures for growth and performance are listed. The data is also shown
visually through charts for close comparison.
Democracy Score
Table 1.1 shows Botswana and Zimbabwe’s democracy score according to the Polity IV
index. Botswana’s average score was 7.3 from 1981-2008, beginning at six since 1981 and eight
towards the end of Africa Rising in 2008. Zimbabwe’s rating, which has an average of -3.5.
Source: WB Indicators
Economic Performance 1981-2008
0
1
2
3
4
5
6
19
81
19
82
19
83
19
84
19
85
19
86
19
87
19
88
19
89
19
90
19
91
19
92
19
93
19
94
19
95
19
96
19
97
19
98
19
99
20
00
20
01
20
02
20
03
20
04
20
05
20
06
20
07
20
08
Table 1.1: Polity IV Score 1981-2008
Botswana Zimbabwe

40
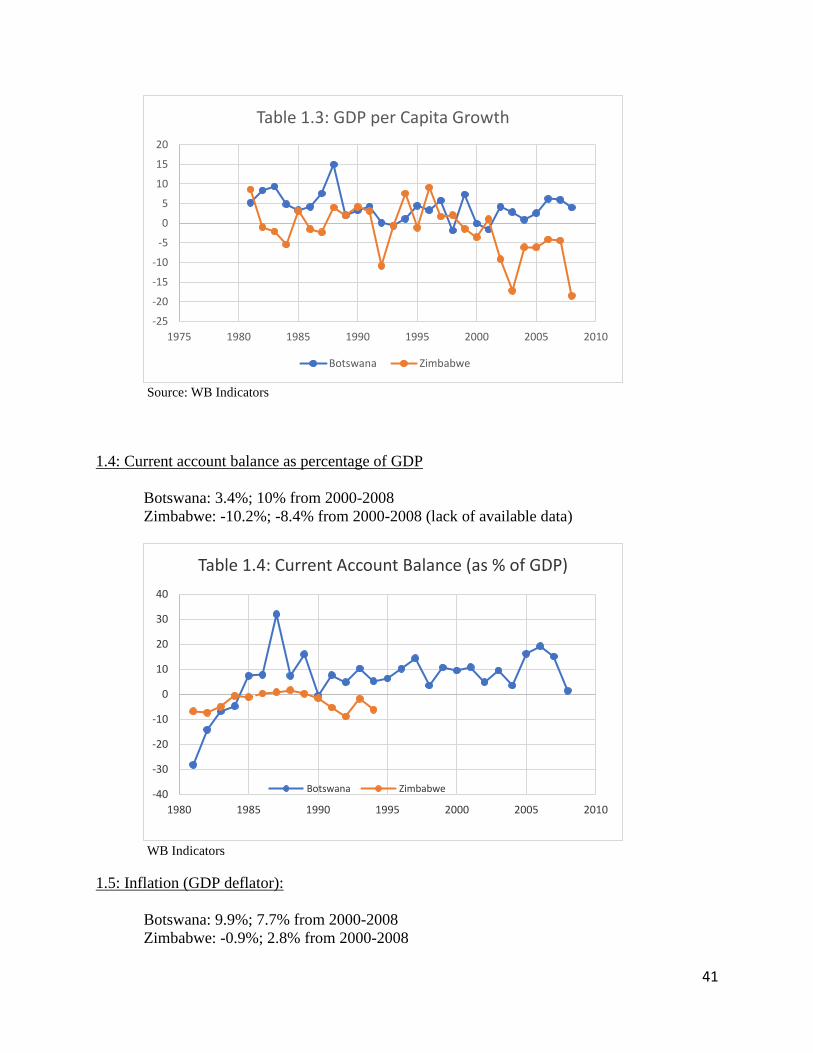
Tables 1.2-1.5 measure Botswana and Zimbabwe’s growth rates in total dollar amount of
goods and services (GDP growth), GDP per capita (GDP/population), current account balance
inflation and unemployment, respectively. Their growth rate averages are indicated below:
1.2: GDP growth
Botswana: 7.1%; 4.8% from 2000-2008.
Zimbabwe: 0.1%; -7.1% from 2000-2008
Source: WB Indicators
1.3: GDP per capita
Botswana: 4.3% ; 2.7% from 2000-2008
Zimbabwe: -1.7%; -7.6% from 2000-2008
-20
-15
-10
-5
0
5
10
15
20
25
1975 1980 1985 1990 1995 2000 2005 2010
Table 1.2: GDP Growth
Botswana Zimbabwe
41
Source: WB Indicators
1.4: Current account balance as percentage of GDP
Botswana: 3.4%; 10% from 2000-2008
Zimbabwe: -10.2%; -8.4% from 2000-2008 (lack of available data)
WB Indicators
1.5: Inflation (GDP deflator):
Botswana: 9.9%; 7.7% from 2000-2008
Zimbabwe: -0.9%; 2.8% from 2000-2008
-25
-20
-15
-10
-5
0
5
10
15
20
1975 1980 1985 1990 1995 2000 2005 2010
Table 1.3: GDP per Capita Growth
Botswana Zimbabwe
-40
-30
-20
-10
0
10
20
30
40
1980 1985 1990 1995 2000 2005 2010
Table 1.4: Current Account Balance (as % of GDP)
Botswana Zimbabwe

42
Source: WB Indicators
Table 1.6 measures Botswana and Zimbabwe’s unemployment as a % of total labor force
from unemployment from 1982-2009.
Botswana: 19.5%; 18.4% from 2000-2009
Zimbabwe: 6.7%; 4.4% from 2000-2009
Source: WB Indicators
Development: Education, Healthcare and Infrastructure
-30
-20
-10
0
10
20
30
1975 1980 1985 1990 1995 2000 2005 2010
Table 1.5: Inflation
Botswana Zimbabwe
0
0.05
0.1
0.15
0.2
0.25
0.3
19
82
19
83
19
84
19
85
19
86
19
87
19
88
19
89
19
90
19
91
19
92
19
93
19
94
19
95
19
96
19
97
19
98
19
99
20
00
20
01
20
02
20
03
20
04
20
05
20
06
20
07
20
08
20
09
Table 1.6: Unemployment as % of Total Labor Force
Botswana Zimbabwe

43
Tables 1.7-1.9 portray World Development indicators of Education, Healthcare and
infrastructure, respectively. Table 1.8 represents Botswana and Zimbabwe’s performance in
education according to tertiary school enrollment as a % of total population.
1.7: Tertiary school enrollment as % of population.
Botswana: 6.2%; 10.1% from 2000-2008
Zimbabwe: 3.2%; data unavailable from 2000-2008
Source: WB Indicators
1.8: Healthcare (Life Expectancy from birth)
Table 1.8 measures Botswana and Zimbabwe’s health performance using life expectancy
from birth. The average ages of death are located below for each country.
Botswana: 55.9; 52.2 from 2000-2008
Zimbabwe: 52.1; 44.1 from 2000-2008
0
2
4
6
8
10
12
14
16
18
1975 1980 1985 1990 1995 2000 2005 2010
Table 1.7: Tertiary School Enrollment
BOTSWANA Zimbabwe

44
Source: WB Indicators
Table 1.9: Infrastructure (Electric power consumption)
Table 1.9 records Botswana’s infrastructure using electric power consumption (kWh per
capita) 1981-2008. The average annual growth rates are indicated below.
Botswana: 3.5%; 3.3% from 2000-2008
Zimbabwe: -1.5%; -3.9% from 2000-2008
Source: WB Indicators
0
10
20
30
40
50
60
70
1975 1980 1985 1990 1995 2000 2005 2010
Table 1.8: Life Expectancy
Series1 Series2
0
200
400
600
800
1000
1200
1400
1600
1800
1975 1980 1985 1990 1995 2000 2005 2010
Table 1.9: Electric Power Consumption (kWh per Capita)
Botswana Zimbabwe
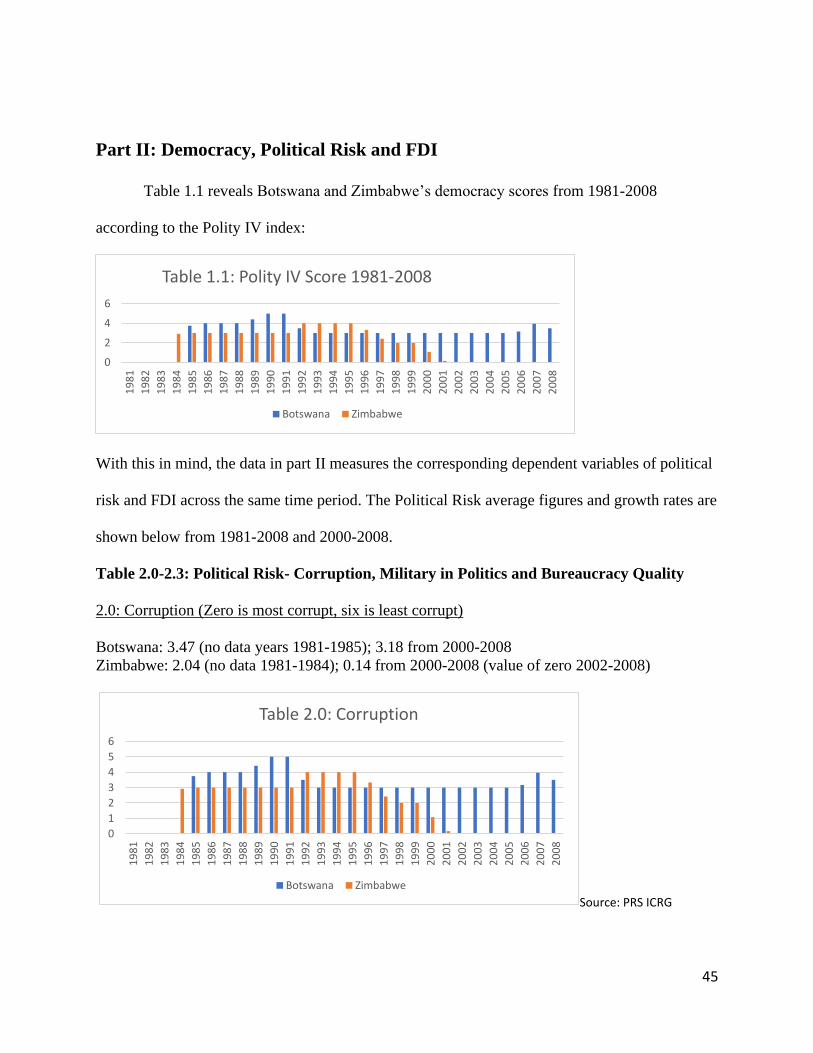
45
Part II: Democracy, Political Risk and FDI
Table 1.1 reveals Botswana and Zimbabwe’s democracy scores from 1981-2008
according to the Polity IV index:
With this in mind, the data in part II measures the corresponding dependent variables of political
risk and FDI across the same time period. The Political Risk average figures and growth rates are
shown below from 1981-2008 and 2000-2008.
Table 2.0-2.3: Political Risk- Corruption, Military in Politics and Bureaucracy Quality
2.0: Corruption (Zero is most corrupt, six is least corrupt)
Botswana: 3.47 (no data years 1981-1985); 3.18 from 2000-2008
Zimbabwe: 2.04 (no data 1981-1984); 0.14 from 2000-2008 (value of zero 2002-2008)
Source: PRS ICRG
0
2
4
6
19
81
19
82
19
83
19
84
19
85
19
86
19
87
19
88
19
89
19
90
19
91
19
92
19
93
19
94
19
95
19
96
19
97
19
98
19
99
20
00
20
01
20
02
20
03
20
04
20
05
20
06
20
07
20
08
Table 1.1: Polity IV Score 1981-2008
Botswana Zimbabwe
0
1
2
3
4
5
6
19
81
19
82
19
83
19
84
19
85
19
86
19
87
19
88
19
89
19
90
19
91
19
92
19
93
19
94
19
95
19
96
19
97
19
98
19
99
20
00
20
01
20
02
20
03
20
04
20
05
20
06
20
07
20
08
Table 2.0: Corruption
Botswana Zimbabwe

46
2.1: Military in Politics (zero means high presence of military in politics, six is absent presence
Botswana: 5.8 (no data 1981-1984); 6 from 2000-2008
Zimbabwe: 3.5 (no data 1981-1984); 2.98 from 2000-2008
Source: PRS ICRG
2.2 Bureaucracy Quality (zero is lowest quality, 4 is highest)
Botswana: 2.3 (no data from 1981-1982); 2 from 2000-2008
Zimbabwe: 2.28 (no data 1981-1984); 1.78 from 2000-2008
Source: PRS ICRG
2.3: Foreign direct investment net inflows as % of total GDP
Botswana: 2.7%; 4.1% from 2000-2008
Zimbabwe: 0.66%; 0.67% from 2000-2008
0
1
2
3
4
5
6
19
81
19
82
19
83
19
84
19
85
19
86
19
87
19
88
19
89
19
90
19
91
19
92
19
93
19
94
19
95
19
96
19
97
19
98
19
99
20
00
20
01
20
02
20
03
20
04
20
05
20
06
20
07
20
08
Table 2.1: Military Involvement in Politics
Botswana Zimbabwe
0
0.5
1
1.5
2
2.5
3
3.5
4
19
81
19
82
19
83
19
84
19
85
19
86
19
87
19
88
19
89
19
90
19
91
19
92
19
93
19
94
19
95
19
96
19
97
19
98
19
99
20
00
20
01
20
02
20
03
20
04
20
05
20
06
20
07
20
08
Table 2.2: Bureaucracy Quality
Botswana Zimbabwe

47
Source: WD Indicators
Part III: Discussion and Key Findings
A. Government Structure in Botswana vs Zimbabwe- Dependent Variable
According to the Polity IV index, the data reveals a stark difference democracy between
Botswana and Zimbabwe in their degrees of democracy. Table 1.1 shows a small pattern of
improvement in Botswana’s democracy, which makes sense considering the opposition’s share
in parliament and the popular vote gradually became more competitive. Zimbabwe’s history of
democracy, as measured by table 1.1 points to the opposite. Since its independence, Zimbabwe’s
spent a majority of the examined time period in negative territory and nearly half as an official
dictatorship (negative six). Therefore, its history signifies a steady presence of autocracy whereas
Botswana’s represents a history of free and fair elections.
B. Relationship between Democracy, Economic Performance and Development
The cases provide strong evidence that democracy increases economic growth more so than
autocracy in several ways. However, Botswana and Zimbabwe’s performance reflect significant
-8
-6
-4
-2
0
2
4
6
8
10
1975 1980 1985 1990 1995 2000 2005 2010
Table 2.3: FDI Inflows as % of GDP
botswana Zimbabwe
48
divergence in GDP and GDP per capita growth rates. Botswana’s democracy corresponded with
positive growth rates in both indicators. On the other hand, Zimbabwe’s dictatorship reveals a
negative relationship with GDP and rates that are close to or below zero. Thus, the data confirms
hypothesis one that democracy leads to higher rates of economic performance than autocracy.
However, it does not necessarily mean that it increased economic performance across the board,
as demonstrated by lower unemployment in Zimbabwe.
As explained by Acemoglu et al. (2006), Zimbabwe’s high unemployment does not mean
that it efficiently dispersed employment across the public in private sectors. In fact, the results of
their study indicate that Zimbabwe’s autocracy represented a high concentration in the public
sector, but not private. Therefore, the lack of employment in the private sector corresponds with
its overall weak economic output and signifies its weak institutions established by a dictatorship.
Additionally, the disparity in current account balance is striking. Botswana’s positive average
current account balance speaks to its strong institutions and ability to avoid the natural resource
curse whereas Zimbabwe’s negative figure highlights its weak institutions and erosion of natural
resource wealth.
Botswana and Zimbabwe’s improvement in education, health and infrastructure overall
represent divergent paths. Botswana’s democracy shows evidence of higher rates of
university/post grad enrollment and a longer life span. Although tables 1.8-2.0 indicate that
democracy in Botswana leads to better overall performance in these three variables, table 2.1
clearly suggests that it makes the most impact on infrastructure as measured by electric power
consumption. Therefore, this data confirms hypothesis 1, emphasizing that democracy cultivates
higher growth than dictatorship, most notably in infrastructure via electric power consumption.
C. Relationship between Democracy, Political Risk and FDI
49
Part II of the data reflects increased political risk and decreased FDI in Botswana’s
democracy vs. Zimbabwe’s dictatorship. According to the comparison of the two cases,
democracy in Botswana corresponded with lower levels of corruption, less military interference
in elections and political opposition and higher bureaucracy quality. Bureaucracy quality
indicates that low scoring countries tend to experience traumatic changes in government while
high scoring countries experiences smoother transitions. Although this category was slightly
lower on average in authoritarian Zimbabwe, the difference between the two countries is
surprisingly insignificant. Corruption and military involvement in politics, on the other hand,
illustrate that democracy decreases political risk much more than autocracy in the case of
Botswana and Zimbabwe. Furthermore, as explained by Knack and Keefer (1995) and
strengthened by the data, there is a positive link between less political risk and FDI. In other
words, increased political risk affects investor perception and likelihood to invest because there
is a greater chance to lose money. FDI, as argued by Jensen (2007), is closely correlated with
positive growth. Botswana’s higher rates of FDI than Zimbabwe represent a positive relationship
between democracy and FDI. Therefore, using the work of Knack and Keefer (1995) and Jensen
(2007), the data supports hypothesis 2. However, democracy indirectly influences growth most
notably through military involvement in politics, corruption and FDI inflows.
D. Isolated Variables and Africa Rising
In summary, the data supports the idea that democracy in Botswana leads to higher growth
compared to dictatorship in Zimbabwe most profoundly through the following variables: GDP
growth, GDP per capita growth, infrastructure as measured by electric power consumption and
current account balance. The data, moreover, strongly suggests that Botswana’s democracy led
to decreased military involvement and a less corruption, which in turn caused increased inflows
50
in FDI, which has been linked to economic growth as explained by the literature review. The
disparities of these variables are particularly glaring during the Africa Rising period, when
widespread growth is assumed. As indicated by the averages of GDP and GDP per capita
growth, both countries declined in 2000-2008 compared to mean from 1981-2008. Botswana,
unlike Zimbabwe, declined at a slower rate. The same is true for the consumption of electric
power and current account balance.
However, from 2000-2008, the data reveals that Zimbabwe’s political risk score and FDI
plummeted a similar rates while Botswana’s increased. This switch emphasizes Zimbabwe’s
political crisis of 1997 shortly before the beginning of Africa Rising. Consequently, it suggests
that Zimbabwe’s autocracy impeded its growth during Africa Rising in particular. If Zimbabwe
had demonstrated a history of democracy like Botswana, it could have filtered out Mugabe and
made a regime change. However, Botswana’s history of steady democracy supported the
peaceful transition of the each ruling party, which engrained successful institutions in its
successors. In addition, Botswana’s much larger current account balance as a % of GDP clearly
demonstrates its democratically- born, superior institutions and ability to prevent the common
pattern of natural resource rich countries. This statistic suggests that the longer a democracy
persists, the more robust its institutions such as trade policy become. In other words,
democracies are more likely to prevent the natural resource curse than autocracies overtime. The
disparities of GDP, GDP per capita, infrastructure, current account balance, corruption, military
and politics and FDI are especially striking from 2000-2008, therefore supporting hypotheses 3a
and 3b.

51
52
Chapter 5: Conclusion
The primary purpose of this thesis is to examine the ways in which democracy in
Botswana led to economic prosperity and to compare the data with Zimbabwe’s decline as a
dictatorship. In order to emphasize the relative, positive effect of Botswana’s democracy, I focus
on three ways in which the cases are strikingly similar. First, Botswana and Zimbabwe were
among the top ten poorest and least developed countries in the world when they gained
independence from Great Britain. Second, they were both rich in natural resources and
discovered their mining potential. Finally, the cases have dry farmlands and are landlocked,
which harms trade and access to fresh water.
How did two countries with similar geographies and climate, natural resource wealth and
starting points result in such different outcomes? I propose that Botswana’s history of democracy
and Botswana’s maintenance of a violently oppressive dictatorship explains this puzzle. In doing
so, data in this study suggests that democracy leads to higher figures in four, specific economic
variables: GDP growth, GDP per capita growth, infrastructure measured by electric power usage
per capita and current account balance as a % of GDP. The findings of this portion of the study
builds off the previous studies. Building further off Knack and Keefer (1995) and Jensen (2007),
the data regarding decreased political risk and increased FDI as a result of democracy links these
to increased economic growth.
Though much of the data in this study amplifies previous conclusions, it has a particular
emphasis on the political evolution of Botswana and Zimbabwe, which reveals that democracy
has the ability to cement economic policies that benefit the future. Alternatively, it can be a
useful tool in preventing catastrophic political crises and human rights violations such as
Mugabe’s “battle of the bullet” from 2000-2008. By providing data during this nine-year time

53
span, this study additionally accentuates that democracy acted as a historical shock absorber for
Botswana. The historical and contextual factors described in the case studies above that gave rise
to Botswana’s inclusive institutions helped it navigate many potential pitfalls and become a
model for democracy in the region. This fits with a the explanations offered by numerous
existent studies but helps but crucially this work identifies the often complex and messy process
based on culture, history, and timing that conspires to create these good or bad conditions.
Furthermore, a significant portion of this study analyzes the management of natural
resources, and how they were used to promote economic growth prudently evade the “Dutch
Disease” in Botswana. The root of Botswana’s mineral success is related to the strength of
economic institutions and competent leadership that resulted from regular free and fair elections.
Revenue from diamonds in Botswana not only increased substantially more than in Zimbabwe’s
dictatorship, but it was used responsibly. As evidenced by the lack of corruption, Botswana’s
revenue and current account surplus was invested in education, healthcare, infrastructure and
capital markets. Zimbabwe’s lengthy history of autocracy, on the other hand, erected weak
economic institutions which produced a classic example of the natural resource curse. These
findings help shed light on a still unsettled question in the literature on how and why some
countries do not experience the resources curse while others do. The qualitative analysis suggests
timing and historical context matter a lot to when and how potential resources wealth is
squandered and becomes counter-productive.
Largely absent from the scope of this study are the supposed pitfalls of Botswana’s
democracy. In Sub-Saharan Africa, Botswana is seen as a model of economic development.
However, Botswana’s quality of democracy and economic performance is typically compared
with countries in the same region. If it were juxtaposed with a country similar in government

54
structure, but different in economic outcome, it is possible that the evaluation of its democracy
could change. Furthermore, when comparing Botswana’s Polity IV score to a country with a
higher score, its democratic issues may become more visible by isolating certain variables.
Ultimately, the implications of this work suggest that we need to continue to search for
clues about how the inclusive democratic institutions that make Botswana such a success story
can be replicated elsewhere. That said, perhaps this key takeaway of this qualitative historical
analysis is that there is no “one size fits all” solution. The precise solutions will be highly
dependent on the unique, historically situated situation a country finds itself in and policy-makes
at both the domestic and international level should take that to heart. Doing so could help to
avoid the damage caused by searching for quick fixes or missing key barriers that need to be
overcome before reforms can be put in place. Overall the comparison of Botswana and
Zimbabwe offers important lessons for democratic transitions and economic development in the
post-colonial context and more work should be done to understand this process.
55
References
Acemoglu, D., & Robinson, J. (2005). “Economic Origins of Dictatorship and Democracy:
Economic and Political Origins”. Cambridge: Cambridge University Press
Acemoglu, D., Robinson, J., Naidu, S., & Restrepo, P. (2019). “Does Democracy
Cause Growth.” Journal of Political Economy, 127(1), 47-100.
Arbab, F. (2006). “IMPACT OF MUGABE'S POLICIES ON THE PROSPECTS FOR
DEMOCRACY IN ZIMBABWE.” Strategic Studies, 26(1), 147-179. Retrieved April 12, 2021,
from http://www.jstor.org/stable/45242338
Alon, Ilan, Jun Wu, and Shaomin Li. 2016. “Corruption, Regime Type, and Economic
Growth.” Public Finance and Management 16(4): 332-361
Bates, R., & Fayad, G. (2012). “The State of Democracy in Sub-Saharan Africa. International
Area Studies Review”, 322-338.
Barro, R. J. (1996). “Determinants of Economic Growth: A Cross Country Empirical Study.”
Cambridge, MA: National Bureau of Economic Research”
Collier, P. (2008). The bottom billion: Why the poorest countries are failing and what can be
done about it. New York: Oxford University Press.
Doucouliagos, H., & Ulubaşoğlu, M. (2008). “Democracy and Economic Growth: A Meta-
Analysis.” American Journal of Political Science, 52(1), 61-83. Retrieved November 17, 2020,
from http://www.jstor.org/stable/25193797
Fein, Helen. 1995. “More Murder in the Middle: Life-Integrity Violations and Democracy in the
World, 1987.” Human Rights Quarterly 17(1): 170-191.
HJORT, J. (2010). “Pre-colonial culture, post-colonial economic success? The Tswana and the
African economic miracle.” The Economic History Review, 63(3), new series, 688-709.
Retrieved April 12, 2021, from http://www.jstor.org/stable/40929822
Hoeffler, Anke, and Paul Collier. “Greed and Grievance in Civil War.” Policy Research Working
Papers, 1998, pp. 1–50., doi:10.1596/1813-9450-2355.

56
Gerring, J., Bond, P., Barndt, W., & Moreno, C. (2005). “Democracy and Economic Growth: A
Historical Perspective.” World Politics, 57(3), 323-364.
Jensen, Nathan. “Political Risk, Democratic Institutions, and Foreign Direct Investment.” The
Journal of Politics, vol. 70, no. 4, 2008, pp. 1040–1052. JSTOR,
www.jstor.org/stable/10.1017/s0022381608081048. Accessed 10 Mar. 2021.
Kriger, N. (2003). “Robert Mugabe, Another Too-Long-Serving African Ruler: A Review
Essay.” Political Science Quarterly, 118(2), 307-313. Retrieved October 28, 2020, from
http://www.jstor.org/stable/30035743
Leith, J. Clark (2005). Why Botswana Prospered. McGill-Queen's University Press,., London,
UK. 1-40.
Lewin, Michael (2011) “BOTSWANA’S SUCCESS: GOOD GOVERNANCE, GOOD
POLICIES, AND GOOD LUCK.” World Bank. 80-85.
Lijphart, A. (1971). “Comparative Politics and the Comparative Method.” The American
Political Science Review, 65(3), 682-693. doi:10.2307/1955513
Masunungure, E. (2011). “ZIMBABWE'S MILITARIZED, ELECTORAL
AUTHORITARIANISM.” Journal of International Affairs, 65(1), 47-64. Retrieved April 12,
2021, from http://www.jstor.org/stable/24388181
Maundeni, Z. (2002). “State Culture and Development in Botswana and Zimbabwe.” The Journal
of Modern African Studies, 40(1), 105-132. Retrieved April 12, 2021, from
http://www.jstor.org/stable/3876083
Maundeni, Z. (2005). 40 years of democracy in Botswana: 1965-2005. Gaborone: Mmegi
Publishing House.
Mauro, Paolo. “Corruption and Growth.” The Quarterly Journal of Economics, vol. 110, no. 3,
1995, pp. 681–712. JSTOR, www.jstor.org/stable/2946696. Accessed 10 Mar. 2021.
North, D. C., & Weingast, B. R. (1989). “Constitutions and Commitment: The Evolution of
Institutions Governing Public Choice in Seventeenth-Century England.” The Journal of
Economic History, 49(4), 803-832. doi:10.1017/s0022050700009451
Oneal, John R. “The Affinity of Foreign Investors for Authoritarian Regimes.” Political
Research Quarterly 47(3): 565-588
Onslow, S., & Redding, S. (2009). “Wasted Riches: Robert Mugabe and the Desolation of
Zimbabwe.” Georgetown Journal of International Affairs, 10(1), 63-72. Retrieved October 28,
2020, from http://www.jstor.org/stable/43134191
57
Przeworski, Adam, and Fernando Limongi. “Political Regimes and Economic Growth.” Journal
of Economic Perspectives, vol. 7, no. 3, 1993, pp. 51–69., doi:10.1257/jep.7.3.51.
Robinson, J. A., Torvik, R., & Verdier, T. (2006). “Political foundations of the resource curse.”
Journal of Development Economics, 79(2), 447-468. doi:10.1016/j.jdeveco.2006.01.008
Ross, M. L. (2015). “What have we learned about the resource curse?” Annual Review of
Political Science, 18(1), 239-259. doi:10.1146/annurev-polisci-052213-040359
Saunders, R. (2008). “Crisis, Capital, Compromise: Mining and Empowerment in
Zimbabwe.” African Sociological Review / Revue Africaine De Sociologie, 12(1), 67-89.
Retrieved April 12, 2021, from http://www.jstor.org/stable/24487552
Slattery, M., & Stanton, L. (2013). THE FP SURVEY: “Africa Rising?” Foreign Policy, (201),
88 89. Retrieved November 17, 2020, from http://www.jstor.org/stable/24575976
Skidmore-Hess, C. (2002). “BOTSWANA: "BOIPELEGO" AND DEPENDENT
DEVELOPMENT.” Journal of Third World Studies, 19(2), 189-203. Retrieved April 12, 2021,
from http://www.jstor.org/stable/45194062
Tsie, B. (1996). “The Political Context of Botswana's Development Performance.” Journal of
Southern African Studies, 22(4), 599-616. Retrieved April 12, 2021, from
http://www.jstor.org/stable/2637159

58